11
Title of each class | Trading symbol(s) | Name of each exchange on which registered |
New York Stock Exchange(i) | ||
þ | Accelerated Filer | ☐ | Non-Accelerated Filer | ☐ | Emerging growth company |
† | The term “new or revised financial accounting standard” refers to any update issued by the Financial Accounting Standards Board to its Accounting Standards Codification after April 5, 2012. |
U.S. GAAP ¨ | Other ¨ | |||
as issued by the International Accounting Standards Board | ☑ |
5 | Cross reference to Form 20-F | |
7 | Introduction | |
10 | Strategic report | |
10 | Financial performance | |
13 | Our business today | |
15 | Market overview and investment case | |
17 | Chair's statement | |
20 | Chief Executive's statement | |
23 | Business model | |
25 | Our Growth ambition | |
26 | Our strategic enablers | |
38 | Key performance indicators | |
43 | Group financial review | |
43 | Chief Finance Officer introduction | |
44 | Operating results 2024 compared with 2023 | |
68 | Liquidity and capital resources | |
74 | Operating results 2023 compared with 2022 | |
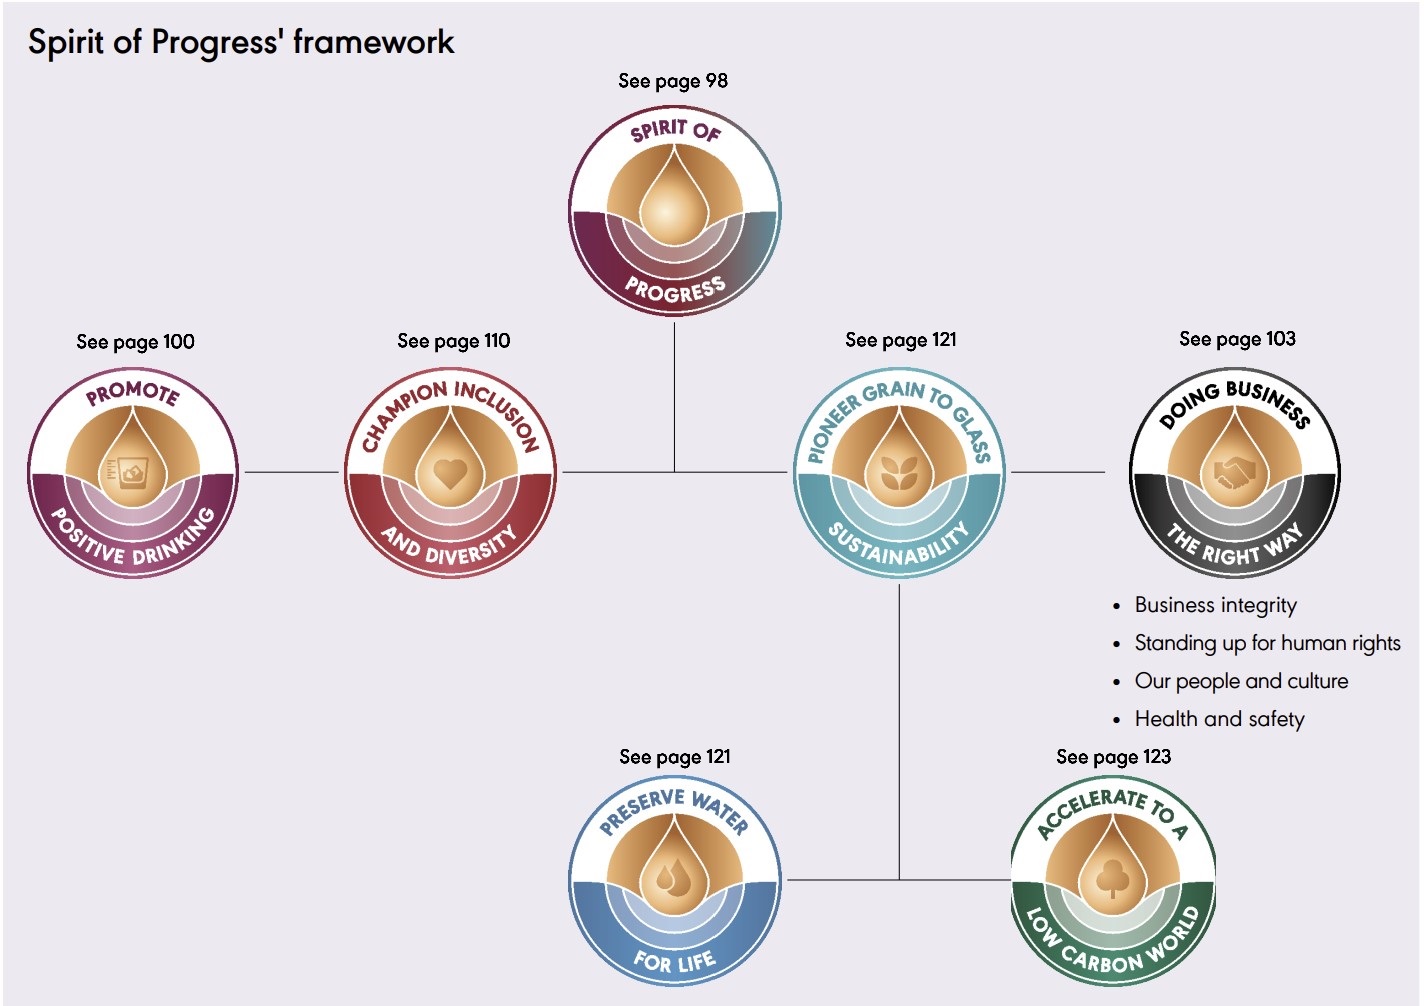
97 | 'Spirit of progress' | |
132 | Cautionary statement concerning forward-looking statement | |
134 | Risk factors | |
145 | Non-financial and sustainability information statement | |
148 | Governance | |
148 | Letter from the Chairman | |
153 | Corporate Governance Structure | |
154 | Board of Directors | |
156 | Executive Committee | |
178 | Audit Committee report | |
188 | Nomination Committee report | |
192 | Directors’ remuneration report | |
225 | Directors’ report | |
230 | Financial statements | |
230 | Report of Independent Registered Public Accounting Firm - PCAOB ID | |
233 | Consolidated income statement | |
234 | Consolidated statement of comprehensive income | |
235 | Consolidated balance sheet | |
236 | Consolidated statement of changes in equity | |
237 | Consolidated statement of cash flows | |
238 | Notes to the consolidated financial statements | |
238 | Accounting information and policies | |
241 | Results for the year | |
260 | Operating assets and liabilities | |
284 | Risk management and capital structure | |
303 | Other financial statements disclosure | |
311 | Unaudited financial information | |
322 | Reporting boundaries and methodology | |
344 | Additional disclosures | |
351 | Additional information for shareholders | |
353 | Exhibits | |
355 | Signature | |
356 | Glossary of terms and US equivalents | |
Item | Required item in Form 20-F | Page(s) |
Part I | ||
1. | Identity of directors, senior management and advisers | Not applicable |
2. | Offer statistics and expected timetable | Not applicable |
3. | Key information | |
A. [Reserved] | — | |
B. Capitalisation and indebtedness | Not applicable | |
C. Reason for the offer and use of proceeds | Not applicable | |
D. Risk factors | 134-144 | |
4. | Information on the company | |
A. History and development of the company | 7-8, 17, 64-65, 93-94, 158-159, 225, 260-264, 344-345, 351 | |
B. Business overview | 7-8, 17, 20-24, 48-59, 61-62, 75-76, 80-89, 91-92, 102-103, 114-119, 135-139, 144, 158-159, 241-245, 264-271, 344-346 | |
C. Organisational structure | 309 | |
D. Property, plant and equipment | 49, 76, 269-272, 344-345 | |
4A. | Unresolved staff comments | Not applicable |
5. | Operating and financial review and prospects | |
A. Operating results | 17, 20-22, 38-40, 43-96, 132-135, 137-138, 141-142, 238-250, 252-253, 311-312 | |
B. Liquidity and capital resources | 38-40, 46-47, 68-73, 79, 281-294, 316-317 | |
C. Research and development, patents and licenses, etc. | 250, 345 | |
D. Trend information | 17, 20-24, 43, 48-65, 74-76, 80-94, 132-133 | |
E. Critical Accounting Estimates | 186, 238-239 | |
6. | Directors, senior management and employees | |
A. Directors and senior management | 153-160 | |
B. Compensation | 96, 192-221, 274-280, 309 | |
C. Board practices | 18, 148-162, 176-179, 184-185, 192-194 | |
D. Employees | 48, 75, 105-107, 251, 346 | |
E. Share ownership | 192-223, 301-302 | |
F. Disclosure of a registrant’s action to recover erroneously awarded compensation | Not applicable | |
7. | Major shareholders and related party transactions | |
A. Major shareholders | 226 | |
B. Related party transactions | 308-309 | |
C. Interests of experts and counsel | Not applicable | |
8. | Financial information | |
A. Consolidated statements and other financial information | 233-310 | |
B. Significant changes | 10, 186, 238-239, 316, 318 | |
9. | The offer and listing | |
A. Offer and listing details | 158, 226-227, 347-348 | |
B. Plan of distribution | Not applicable | |
C. Markets | 158, 226-227 | |
D. Selling shareholders | Not applicable | |
E. Dilution | Not applicable | |
F. Expenses of the issue | Not applicable |
Item | Required item in Form 20-F | Page(s) |
10. | Additional information | |
A. Share capital | Not applicable | |
B. Memorandum and articles of association | 158-159, 225-229 | |
C. Material contracts | 72, 225, 345 | |
D. Exchange controls | 351 | |
E. Taxation | 255-259, 346-350 | |
F. Dividends and paying agents | Not applicable | |
G. Statement by experts | Not applicable | |
H. Documents on display | 351 | |
I. Subsidiary information | Not applicable | |
11. | Quantitative and qualitative disclosures about market risk | 284-294 |
12. | Description of securities other than equity securities | |
A. Debt securities | Not applicable | |
B. Warrants and rights | Not applicable | |
C. Other securities | Not applicable | |
D. American depositary shares | 226-227, 347-350 | |
Part II | ||
13. | Defaults, dividend arrearages and delinquencies | Not applicable |
14. | Material modifications to the rights of security holders and use of proceeds | Not applicable |
15. | Controls and procedures | |
A. Disclosure controls and procedures | 177 | |
B. Management’s report on internal control over financial reporting | 185 | |
C. Attestation report of the registered public accounting firm | 230-232 | |
D. Changes in internal control over financial reporting | 185 | |
16A. | Audit committee financial expert | 183 |
16B. | Code of ethics | 159, 183 |
16C. | Principal accountant fees and services | 180-182, 251 |
16D. | Exemptions from the listing standards for audit committees | Not applicable |
16E. | Purchases of equity securities by the issuer and affiliated purchasers | 236, 297-302 |
16F. | Change in registrant’s certifying accountant | Not applicable |
16G. | Corporate governance | 158-164, 173-190 |
16H. | Mine safety disclosure | Not applicable |
16I. | Disclosure Regarding Foreign Jurisdictions that Prevent Inspections | Not applicable |
16J. | Insider trading policies | 183 |
16K. | Cybersecurity | 187 |
Part III | ||
17. | Financial statements | Not applicable |
18. | Financial statements | 230-310 |
19. | Exhibits | 353-354 |
Additional information | ||
Glossary of terms and US equivalents | 356-357 | |
Volume (equivalent units) | Net sales(2) | Operating profit | ||||||||
EU230.5m | $20,269m | $6,001m | ||||||||
(2023: EU243.4m) | (2023: $20,555m) | (2023: $5,547m) | ||||||||
Reported movement | (5)% | Reported movement | (1)% | Reported movement | 8% | |||||
Organic movement(1) | (4)% | Organic movement(1) | (1)% | Organic movement(1) | (5)% | |||||
Net cash from operating activities | Earnings per share (eps) | Total recommended dividend per share(3) | ||||||||
$4,105m | 173.2c | 103.48c | ||||||||
(2023: $3,636m) | (2023: 196.3c) | (2023: 98.55c) | ||||||||
2024 free cash flow(1) | $2,609m | Reported movement | (12)% | Increase | 5% | |||||
2023 free cash flow(1) | $2,235m | Eps before exceptional items movement(1) | (9)% | |||||||
Positive drinking | Inclusion and diversity | Water efficiency - across the company | Greenhouse gas emissions | |||||||||||
2.2m | 44% | (15.6)% | (23.8)% | |||||||||||
(2023: 1.9m) | (2023: 44%) | (2023: (12.3)%) | (2023: (14.7)%) | |||||||||||
Number of people educated on the dangers of underage drinking through a Diageo supported education programme | Percentage of female leaders globally | Percentage change in water efficiency compared to fiscal 20 baseline | Percentage change in total direct and indirect greenhouse gas emissions (market/net based) compared to fiscal 20 baseline | |||||||||||
46% | ||||||||||||||
(2023: 43%) | ||||||||||||||
Percentage of ethnically diverse leaders globally | ||||||||||||||

Advantaged portfolio: reach and scale | Diageo reported net sales | |
(by category, fiscal 24) |
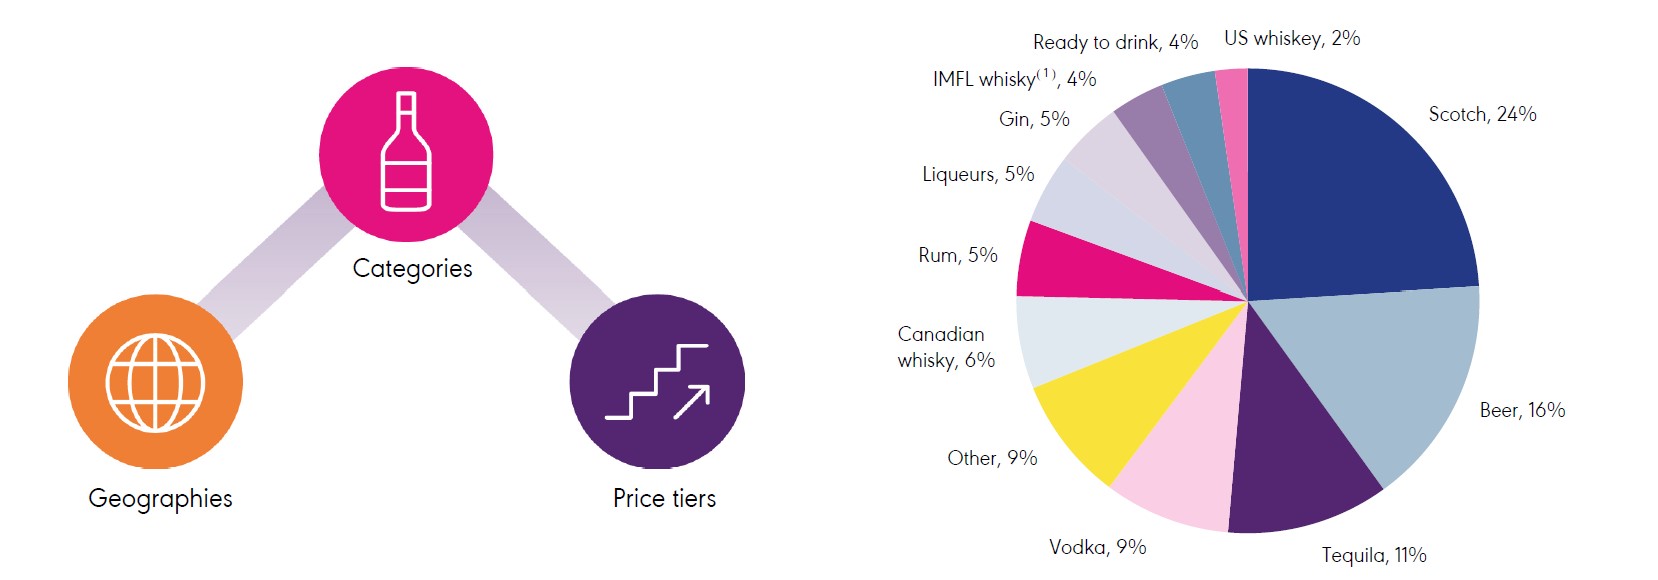
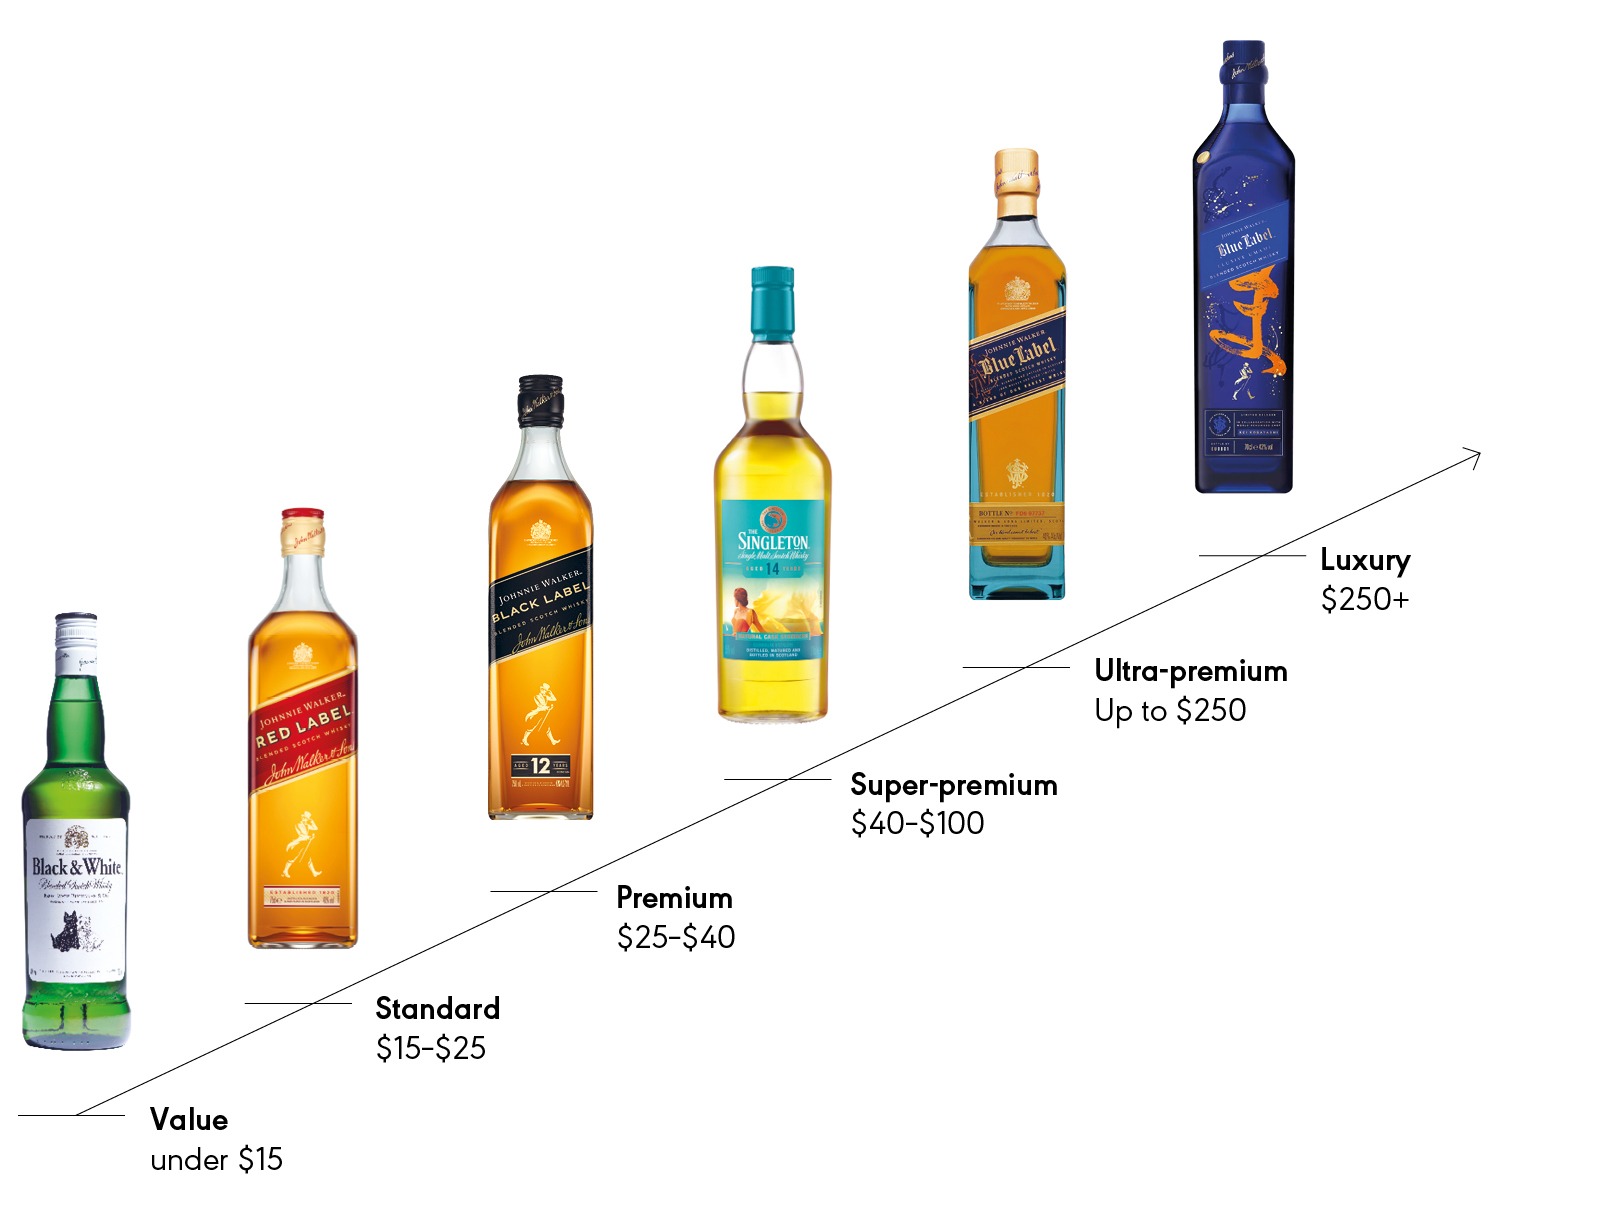
Diageo reported net sales | Our scotch portfolio price ladder provides consumer choice within our largest category(2) | |
(by price tier, fiscal 24) | ($) |
Luxury |
Ultra- premium |
Super- premium |
Premium |
Standard |
Value |

4% |
5% |
16% |
37% |
30% |
8% |
Strong and resilient market dynamics… | |
Total Beverage Alcohol (TBA) is a highly attractive and exciting consumer category. TBA is resilient and growing; and the spirits category is growing even faster. TBA has grown at 4.4% CAGR in the 10 years through to 2023, and international spirits has grown at 5.1% over the same period.(1) | |
1 | Consumers are choosing spirits |
Diageo sees a long-term trend of consumers choosing to switch to spirits from beer and wine. Spirits growth is supported by favourable population demographics, the increasing size of the middle class in key markets globally and strong premiumisation trends. These are expected to continue into the future. | |
2 | People are drinking better, not more |
Spirits' long-term value growth is also driven by premiumisation as consumers want to drink better, not more. In the last 10 years, premium and above spirits grew from 26% of category value to almost 35%. The super-premium plus price-tier has grown in value more than two times faster than other price tiers in the category. This price tier gained 700 basis points of share of international spirits retail sales value (RSV) since 2013.(1) | |
3 | Long runway for growth |
In 2021, we set out our ambition to grow TBA share by 50% from 4% to 6% by 2030. With 4.5% value share of TBA(1) currently, we have significant headroom for sustainable long-term growth. | |
aligned to our competitive advantages: | |
Leading world-class brands | |
•We have a proven track record in developing powerful global brands. For example, Johnnie Walker’s RSV has increased over 400% since 2002.(2) •Diageo brands have driven around 17% of total absolute dollar growth in the international spirits category since 2018.(1) •Our strategic M&A activities and reputation for active portfolio management position Diageo for sustainable long-term growth. | |
Advantaged geographic footprint | |
•Our geographic footprint gives us access to consumers in the world’s largest markets, such as the United States, as well as the vibrant markets of India and China. •Diageo’s geographic diversification supports resilient performance through global volatility. | |
Broad portfolio across price points | |
•Our advantaged portfolio enables trading up and down our extensive price ladder; whether our consumers are looking for a Smirnoff and soda or a Don Julio 1942 on the rocks, Diageo's portfolio offers consumer choice. •Our diverse and balanced portfolio enables us to respond quickly to emerging and growing category trends. | |
Diverse and talented workforce | |
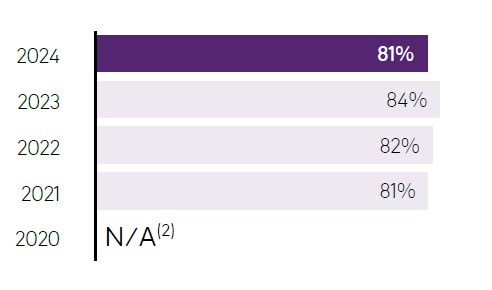
•Our Executive Committee combines home-grown talent with externally recruited leaders who bring invaluable market experience, a wealth of functional expertise and fresh perspectives. •Our talented management team and broader workforce enable us to respond flexibly and quickly to current and future challenges. •Our global employee survey, Your Voice, remains above external benchmarks with 81% engagement levels and 89% expressing pride in working for Diageo. | |
...positioning us to drive: | |
Continued discipline of growth algorithm | |
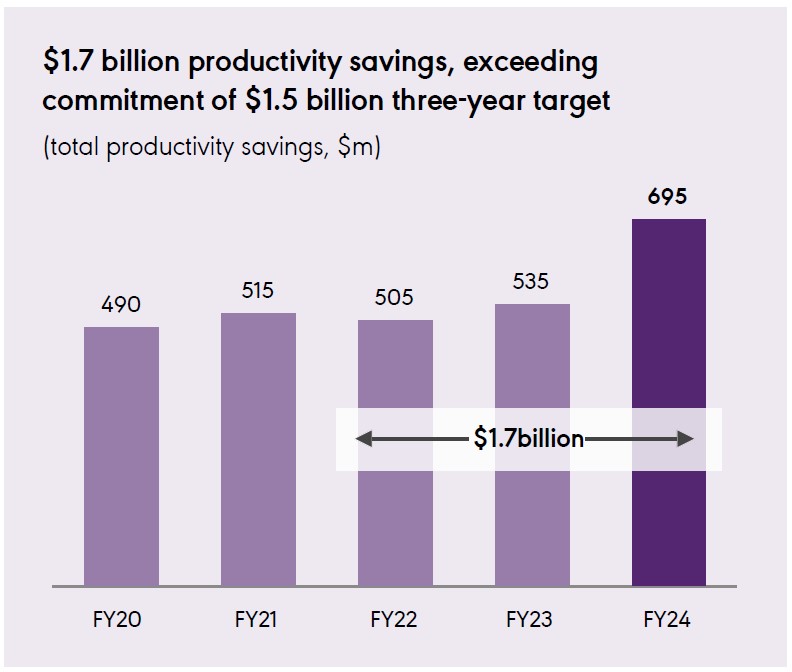
•Driving long-term sustainable growth is our priority, and we believe our growth algorithm continues to support this, through winning quality market share. •Price and mix, driven by long-term premiumisation and enabled by Revenue Growth Management, remain a consistent and core part of our top-line growth. •Since fiscal 18, we have generated annual savings of approximately $500 million through productivity savings, efficiencies and disciplined cost control and utilising our scale to fuel our investments. •We take the benefits of growth, productivity and operating leverage to reinvest smartly in brand building to drive quality market share – firmly balancing short-term share gains, while building for long-term sustainable growth. | |
A disciplined approach to capital allocation | |
•We prioritise organic investment for long-term growth: maturing stock (increased from $5.3 billion in fiscal 18 to $7.8 billion in fiscal 24) and capex (increased from $0.8-0.9 billion per annum fiscal 18-21 to $1.4-1.5 billion per annum fiscal 22-24, driven by capacity increases). •Active and disciplined portfolio management ($2.8 billion invested in acquisitions and $1.6 billion generated from disposals since fiscal 18). •We have grown our dividend year on year for 25 years (dating back to fiscal 2000). •Through fiscal 23, circa £25 billion has been returned to shareholders in dividends and share buybacks over the preceding 10 years. •We also returned $1 billion of excess capital, via share buybacks, during fiscal 24. | |
A robust strategy and clear ambition that will.... | |
Build towards the next phase of our ambition to achieve TBA share of 6% by 2030. Our strategy to unleash the power of our brands and portfolio includes: •Sustaining the momentum in our global brands of Guinness, Johnnie Walker and Don Julio while driving regional growth opportunities like Crown Royal in North America and accelerating malt whiskey in Asia Pacific. •Leading and shaping key consumer trends, including tapping into the convenience, moderation and with food occasions to recruit new consumers into new occasions at scale. •Continuing to focus on operational excellence, including strengthening our route-to-market and evolving our approach to A&P efficiency, while driving accelerated productivity and allocating resources with discipline. | |
Recommended final dividend per share | Total dividend per share(1) | ||
62.98c | 5% to 103.48c | ||
2023: 59.98c | 2023: 98.55c | ||
Total shareholder return (1 year) | Total shareholder return (10 year) | ||
(24)% | 6% | ||
2023: (2)% | 2023: 9% | ||

Statement on Section 172 of the Companies Act 2006 | ||||||
Section 172 of the Companies Act 2006 requires the Directors to promote the success of the company for the benefit of the members as a whole, having regard to the interests of stakeholders in their decision- making. In making decisions, the | Directors consider what is most likely to promote the success of the company for its shareholders in the long-term, as well as the interests of the group’s stakeholders. The Directors understand the importance of taking into account the views of stakeholders | and the impact of the company’s activities on local communities, the environment, including climate change, and the group’s reputation. Read more about how stakeholders were taken into account in decision-making on pages 165-171. | ||||
Reported volume movement | Organic net sales movement | |||
(5)% |  | (1)% |  | |
2023: (7)% | 2023: 7% | |||
Organic volume movement | Reported operating profit movement | |||
(4)% | | 8% | | |
2023: (1)% | 2023: (6)% | |||
Reported net sales movement | Organic operating profit movement | |||
(1)% | | (5)% | | |
2023: 0% | 2023: 7% | |||

What we do | 1. We source | 2. We innovate | 3. We make | ||
From smallholder farmers in Africa and Mexico, to multinational companies, we work with our suppliers to procure high-quality raw materials and services, with environmental sustainability in mind. Where it is right for our business, we grow and source locally. | Using our deep understanding of consumer trends and socialising occasions, we focus on driving sustainable innovation that provides new products and experiences for consumers; be that a non- alcoholic option or an offering that suits convenience or the on-trade. | We distil, brew and bottle our spirits and beer brands through a globally co- ordinated supply operation, working to the highest quality and manufacturing standards. We prioritise using local production where it is right for our business. |
Working in the interest of our stakeholders | People | |||||||
We want our people to be the best they can be. We offer a diverse and inclusive workplace with opportunities for development and progression. | ||||||||
Consumers | Customers | Suppliers | ||||||
We are passionate about the role our brands play in celebrations globally. We are committed to promoting moderation and reducing alcohol misuse. | We work closely with customers to build sustainable ways of working that help grow their businesses through great insight and execution. | We partner with suppliers to ensure long-term, mutually beneficial relationships. Respect for human rights is embedded throughout our global value chain. | ||||||
Communities | Investors | Governments and regulators | ||||||
We help build thriving communities by making lasting contributions where we live, work, source and sell. | We aim to maximise long- term investor returns through consistent, sustainable growth and a disciplined approach to capital allocation. | We advocate for laws or regulatory change where we think there is a positive impact on our business and a benefit for our key stakeholders. | ||||||
4. We transport | 5. We sell to customers | 6. We market to consumers | 7. We help consumers celebrate | |||
We move our products to where they need to be in the world; be that from a local distillery in market or, for example, shipping scotch. | We grow by working closely with our customers. Our global and local sales teams use our data, digital tools and insights to extend our sales reach, improve our execution and help generate value for us and for our customers. When our customers grow, we grow too. | We invest in world-class marketing to build vibrant brands that resonate with our consumers. To do this responsibly, we have our rigorous Diageo Marketing Code which guides everything we do. | We continually evolve our data tools to understand consumers’ attitudes and motivations. We convert this information into insights which enable us to respond with agility to our consumers’ interests and preferences. |
Creating value | |
Our business model allows us to create value across four main areas: | |
Financial – for our investors | |
Human – for our people, suppliers, customers and consumers | |
Social – for our communities | |
Natural – for our environment | |
PURPOSE | Celebrating life, every day, everywhere | ||||
AMBITION | To create one of the best performing, most trusted and respected, consumer products companies in the world | ||||
STRATEGY | Unleash the power of our brands and portfolio to lead and shape consumer trends executed with operational excellence | ||||
BRANDS AND PORTFOLIO | CONSUMER TRENDS | OPERATIONAL EXCELLENCE | |||
Whisk(e)y and tequila Winning local portfolio Guinness growth | Premiumisation Recruitment New occasions | Evolve brand building muscle Commercial excellence Everyday efficiency | |||
ENABLERS | Building a more Digital Diageo | Diverse and engaged talent with a focus on culture | ’Spirit of Progress’ and doing business the right way from grain-to-glass | ||
OUTCOMES | Achieve quality TBA share of 6% by 2030 | ||||
Efficient growth | Consistent value creation | Credibility and trust | Engaged people | |
Consistently grow organic net sales, grow operating profit, deliver strong free cash flow | Top-tier total shareholder returns, increase return on invested capital | Trusted by stakeholders for doing business the right way, from grain-to- glass | High-performing and engaged teams, continuous learning, inclusive culture |
STRATEGY | ||||||||
 |  |  | ||||||
Unleash the power of our brands and portfolio… •To become the global leader in whisk(e)y and tequila. •To win with local portfolios rooted in local culture. •To ensure we continue to drive growth in Guinness, including 0.0. | to lead and shape consumer trends… •Premiumise the industry. •Recruit new consumers from across TBA. •Enter into new occasions. | executed with operational excellence •Evolving our brand building muscle through smarter A&P. •Delivering commercial excellence across all our channels. •Accelerating productivity via Revenue Growth Management and supply agility. | ||||||
Read more on page 28. | Read more on page 31. | Read more on page 33-34. | ||||||
ENABLERS | ||||||||
 |  |  | ||||||
Building a more Digital Diageo We are upweighting investment to fund a holistic, prioritised programme of digitisation, underpinned by transformation of data, analytics and systems. | Diverse and engaged talent with a focus on culture We continue to develop our talent, ensuring they embody our evolved values and behaviours. | ’Spirit of Progress’ and doing business the right way from grain-to- glass This continues to underpin everything that we do. We have refreshed our flagship ’Spirit of Progress‘ programme to maximise the impact of its next phase of delivery. | ||||||
Read more on page 36. | Read more on page 37. | Read more on page 37. | ||||||


 | 1 | Building a more Digital Diageo |
'What's Your Cocktail?' An AI platform pairing cocktails with food In May, we launched 'What’s Your Cocktail?', a generative AI-driven digital platform to recommend cocktail pairings with individual food preferences. The platform helps consumers demystify cocktails by asking the desired atmosphere of their event and favourite food flavours to ensure the perfect serve for every occasion. Whilst the platform is consumer-first, we are also benefiting by gathering millions of first-party consumer data points, which helps give our consumers exactly what they want. Digital planning tool delivering productivity wins in supply chain This year we implemented a new Advanced Planning Tool (OMP) across our tequila asset base. It monitors our end-to- end supply chain and gives us the ability to smoothly plan for and respond to volatile changes in product demand. For example, this fiscal we have seen accelerated demand for Don Julio Reposado. The OMP tool enabled us to quickly run scenarios, look into end-to-end demand and balance our inventory and capacity, allowing us to communicate more quickly and effectively with customers and our suppliers to fulfil that demand. | ||
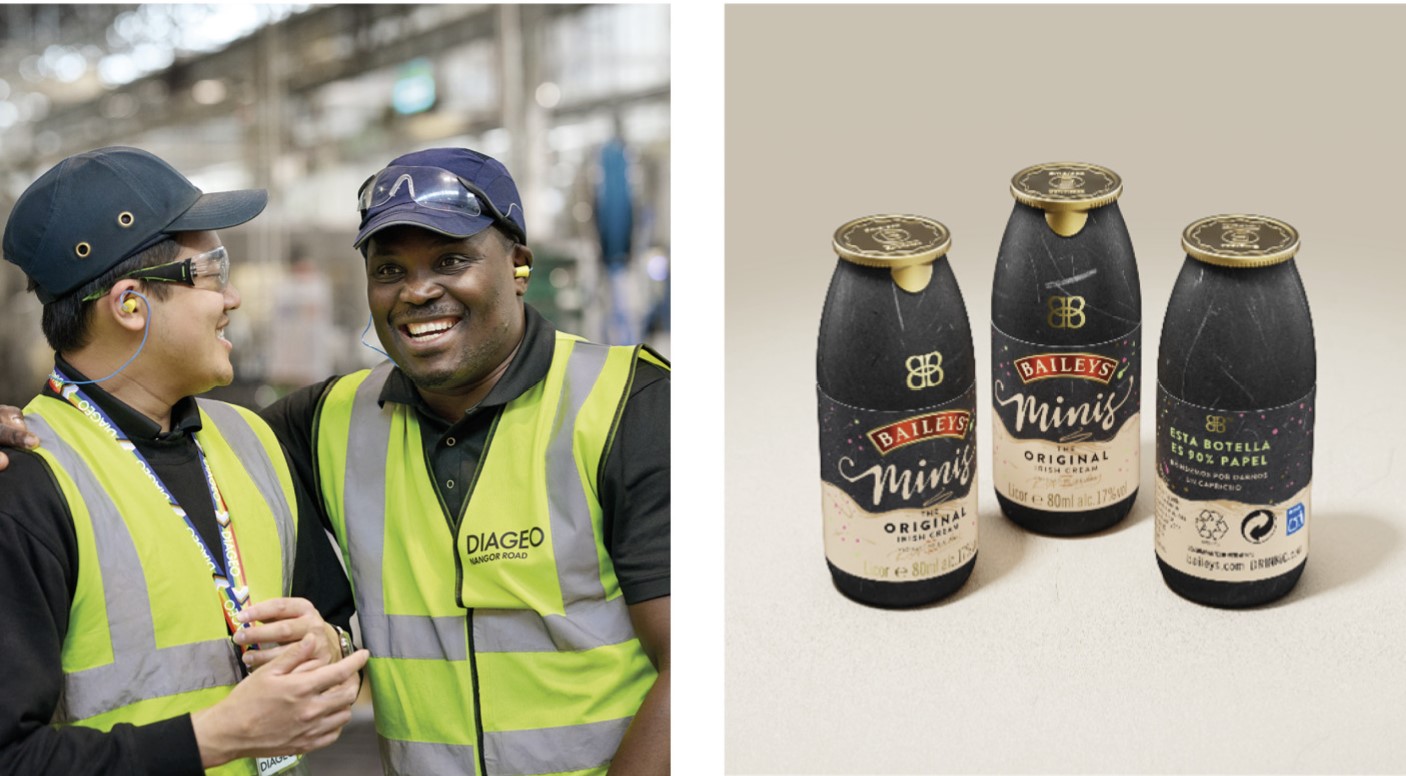
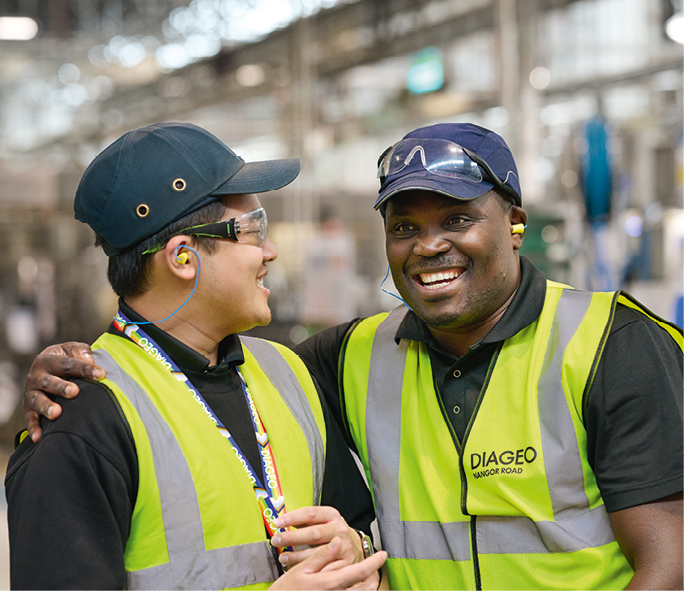
2 | Diverse and engaged talent with a focus on culture | 3 | ’Spirit of Progress’ and doing business the right way from grain-to-glass | |
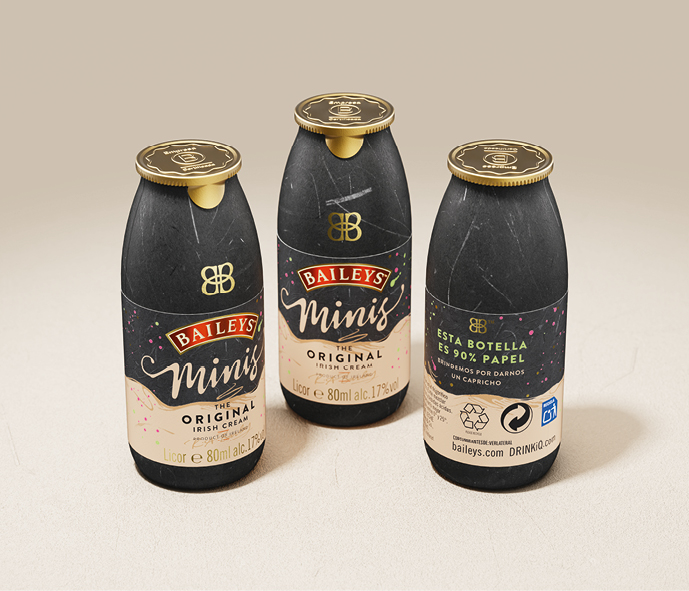
Diversity 40% of our Board and 46% of our leadership population, including our Executive Committee, are from an ethnically diverse background. We are proud to have reached our 45% ethnicity leadership representation ambition ahead of 2030. Engaged talent In the global employee survey, Your Voice, our results for the fiscal remained above external benchmarks with 81% engagement levels and 89% pride in working for Diageo. Culture To unleash greater speed and agility in our business, we are focusing strongly on culture and embedding four dial-up behaviours: external curiosity, efficient collaboration, experimentation and learning, and acting decisively. | Baileys Minis paper-based bottle trial In May, at the Time Out Festival in Barcelona, we launched a trial of a new innovation, the Baileys Minis paper-based bottle. We know our consumers are increasingly looking for sustainable packaging alternatives, whilst also expecting premium quality and design from our brands. These bottles are a step in our journey towards a more sustainable business. The Baileys Minis paper-based bottles are made with a dry moulded fibre bottle which is 90% paper, with a thin plastic liner and a foil seal. The development work behind these bottles is the result of strong collaboration across our Diageo teams worldwide, along with the help of valued external partners. This is further evidence of our dedication to progressing towards our ambition to accelerate to a low-carbon world. | |||
Reported measures |
Net sales growth (%) | Operating profit growth (%) | Basic earnings per share (cents) |
Definition | ||||
Sales growth after deducting excise duties. | Operating profit growth, including exceptional operating items. | Profit attributable to equity shareholders of the parent company, divided by the weighted average number of shares in issue. |
Non-GAAP measures |
Organic net sales growth (%)(1) | Organic operating profit growth (%)(1) | Earnings per share before exceptional items (cents)(1) | ||||||||
(0.6)% |  |  | (4.8)% | | | 179.6 | | | ||
Definition | |||||
Sales growth after deducting excise duties, excluding the impact of exchange rate movements, hyperinflation adjustment and acquisitions and disposals. | Organic operating profit growth is calculated on a constant currency basis, excluding the impact of exceptional items, certain fair value remeasurement, hyperinflation adjustment and acquisitions and disposals. | Profit before exceptional items attributable to equity shareholders of the parent company, divided by the weighted average number of shares in issue. | |||
Why we measure | |||||
This measure reflects our delivery of efficient growth and consistent value creation. Organic net sales growth is the result of the choices we make between categories and market participation, and reflects Diageo's ability to build brand equity, increase prices and grow market share. | The movement in operating profit measures our delivery of efficient growth and consistent value creation. Consistent operating profit growth is a business imperative, driven by investment choices, our focus on driving out costs across the business and improving mix. | Earnings per share reflects the profitability of the business and how effectively we finance our balance sheet. Eps measures our delivery of efficient growth in the year and consistent value creation over time. | |||
Performance | |||||
Reported net sales declined 1.4% due to an unfavourable foreign exchange impact, organic net sales decline and a negative impact from acquisitions and disposals, partially offset by hyperinflation adjustments. Organic net sales declined 0.6%. Positive price/mix of 2.9pps was more than offset by a 3.5% decline in volume, primarily driven by materially weaker performance in LAC, driven by fast- changing consumer sentiment and elevated inventory levels. A weaker consumer environment and the impact of lapping inventory replenishment in the prior year in North America also contributed to the decline. Excluding LAC, organic net sales grew 1.8%. | Reported operating profit grew 8.2%, primarily driven by the benefit from exceptional operating items, partially offset by a decrease in organic operating profit. Organic operating profit declined 4.8% as a result of the organic net sales decline, primarily due to a $302 million operating profit decline in LAC and a $142 million operating profit decline in North America. The decline was also driven by an increase in investments in strategic capabilities, including in digital and strengthening route-to- market, primarily in the US, and in marketing. | Basic eps decreased 23.1 cents, mainly driven by lower organic operating profit, higher finance charges and exceptional items, partially offset by lower tax and the impact of share buybacks. Basic eps before exceptional items decreased 16.9 cents. |
 | More detail on page 44 | | More detail on page 44 | | More detail on page 46 |
Reported measures |
Net cash from operating activities ($ million) | Return on closing invested capital (%) | | Remuneration | ||||||
| KPI: Key Performance Indicator |
Definition | ||||
Net cash from operating activities comprises the net cash flow from operating activities as disclosed on the face of the consolidated statement of cash flows. | Profit for the year divided by net assets at the end of the financial year. |
Non-GAAP measures |
Free cash flow ($ million)(1),(2) | Return on average invested capital (ROIC) (%) | Total shareholder return (TSR) (%) | ||||||||
2,609 | | | 15.8% | | (24)% | | | |||
Definition | ||||
Free cash flow comprises the net cash flow from operating activities aggregated with the net cash expenditure paid for property, plant and equipment, and computer software. Definition of free cash flow has been redefined, see more details on page 46. | Profit before finance charges and exceptional items attributable to equity shareholders divided by average invested capital. Invested capital comprises net assets excluding net post- employment benefit assets/liabilities, net borrowings and non-controlling interests. Definition of return on average capital employed has been redefined, see more details on page 47. | Percentage growth in the value of a Diageo share (assuming all dividends and capital distributions are re-invested). | ||
Why we measure | ||||
Free cash flow is a key indicator of the financial management of the business. Free cash flow reflects the delivery of efficient growth and consistent value creation as it measures the cash generated by the business to fund payments to our shareholders and future growth. | ROIC is used by management to assess the return obtained from the group’s asset base. Over time, ROIC reflects consistent value creation, as the returns Diageo generates from its asset base are both reinvested in the business and used to generate returns for investors through dividends and return of capital programmes. | Diageo’s Directors have a fiduciary responsibility to maximise long-term value for shareholders. TSR measures consistent value creation as it reflects the returns Diageo has delivered to investors in the year and over time. We also monitor our relative TSR performance against our peers. | ||
Performance | ||||
Net cash from operating activities was $4,105 million, an increase of $469 million compared to fiscal 23. Free cash flow grew by $374 million to $2,609 million. Free cash flow growth was driven by strong working capital management and the positive impact of lapping one-off cash tax payments in the prior year. These favourable factors more than offset the negative impacts of lower operating profit and increased interest payments, attributable to the current higher interest rate environment. The increase in capital expenditure (capex) demonstrates our commitment to investing in the business for long-term sustainable growth. | ROIC decreased 255bps, mainly driven by lower operating profit, increased capex, maturing stock investment and continued portfolio optimisation through acquisitions and disposals. The decline was slightly offset by lower tax. | TSR was down 24% over the past 12 months driven by the lower year-on- year share price. |
| More detail on page 46 | | More detail on page 47 |
Non-financial performance |
Positive drinking | Employee Engagement Index | Inclusion and diversity | ||||||||
| | 81% | | | | |||||
Number of people educated on the dangers of underage drinking through a Diageo supported education programme | 2.2m |
(2023: 1.9m) | |
Total to date: | |
5.9m(1) |
Percentage of female leaders globally | 44% |
(2023: 44%) | |
Percentage of ethnically diverse leaders globally | 46% |
(2023: 43%) |
Definition | ||||
Number of people educated on the dangers of underage drinking through a Diageo supported education programme. | Measured through our Your Voice survey; includes metrics for employee satisfaction, advocacy and pride.(3) | The percentage of women and the percentage of ethnically diverse individuals who are in Diageo leadership roles. | ||
Why we measure | ||||
We want to change the way the world drinks for the better by promoting moderation and addressing the harmful use of alcohol. We build credibility and trust by transparently reporting the total number of people educated on the dangers of underage drinking. This figure also demonstrates our commitment to engaging people on the dangers of harmful alcohol use. | Employee Engagement releases the full potential of our people and our business, and it’s a key enabler to our performance. The survey allows us to measure the extent to which employees believe we are living our values and is a measure of our culture. Reflecting on the results of our employee engagement level and taking action where needed each year helps us build credibility and trust with our people. | Nurturing an inclusive and diverse culture drives commercial performance and is the right thing to do. Transparently reporting the gender and ethnic diversity of our leadership cohort reflects our commitment to consistent value creation through our diverse workforce, building credibility and trust with our stakeholders and engaging with our people on inclusion and diversity. | ||
Performance | ||||
We delivered a significant increase in our reach, particularly for the LAC region. Globally, we educated 2.2m young people about the dangers of underage drinking. | This year 89% of our people completed our Your Voice survey. 81% were identified as engaged. 89% declared themselves proud to work for Diageo, 81% would recommend Diageo as a great place to work and 74% were extremely satisfied with Diageo as a place to work. | This year, 44% of our leadership roles were held by women, the same percentage as last year, and 46% of our leaders were ethnically diverse, compared with 43% last year. |
| More detail on page 100 | | More detail on page 105 | | More detail on pages 110-111 |
Non-financial performance |
Water efficiency(4) | Scope 1 and 2 greenhouse gas emissions(4) | |||||
Change vs baseline year | Change vs baseline year | |||||
(15.6)% | | | (23.8)% | | | |
Definition | ||
Percentage change in water efficiency across the company compared to fiscal 20 baseline. Refer to page 334 for how this metric is measured. | Percentage change in total direct and indirect greenhouse gas emissions (market/net based) compared to fiscal 20 baseline. | |
Why we measure | ||
Our water efficiency programme is critical to helping us to address water security, particularly in water-stressed areas. In addition to preserving our licence to operate, minimising water use within our own operations underpins our commitment to delivering long-term value by future-proofing our business against the impacts of a changing climate. It also helps to ensure this precious resource can continue to be shared with the communities we live and work amongst. | Mitigating our impact on climate change is a business imperative. Reporting in detail on our efforts to reduce Scope 1 and 2 greenhouse gas emissions, even when it is challenging to do so, demonstrates our commitment to reducing our contribution to global warming and helps build credibility and trust. This is an important area for our business and external stakeholders, supporting our commitment to consistent value creation by future-proofing our business. | |
Performance | ||
This year, our water efficiency across the company improved in total by 15.6% since our fiscal 20 baseline. The main drivers contributing to the strong performance in fiscal 24 were the continuous improvement initiatives in the water recovery plants at our East Africa sites and the optimisation of the reverse osmosis plant at our Cameronbridge site. | Our Scope 1 and 2 greenhouse gas emissions reduced in total by 23.8% from our fiscal 20 baseline. The main drivers contributing to the lower emissions are the increased use of on- site bioenergy (biomass, biogas and biofuel) across Africa, scotch and tequila markets and additional renewable electricity use, particularly in North America. |
| More detail on page 121-124 | | More detail on page 125-128 |
Reported net sales growth | Net cash from operating activities | |||
(1)% | | $4,105m | | |
Organic net sales growth(1) | Free cash flow(1) | |||
(1)% | | $2,609m | | |
Reported operating profit growth | Return on closing invested capital | |||
8% | | 34.5% | | |
Organic operating profit growth(1) | Return on average invested capital(1) | |||
(5)% | | 15.8% | | |
Basic earnings per share | Total shareholder return | |||
173.2c | | (24)% | | |
Earnings per share before exceptional items(1) | ||||
179.6c | | |||

Fiscal 24 | North America | Europe | Asia Pacific | Latin America and Caribbean | Africa |
Volume (EU million ) | 50.1 | 51.3 | 74.9 | 22.1 | 32.1 |
Reported net sales(1) ($ million) | 7,908 | 4,804 | 3,817 | 1,839 | 1,778 |
Reported operating profit(2) ($ million) | 3,039 | 1,257 | 1,438 | 502 | 131 |
Operating profit before exceptional items(3) ($ million) | 3,236 | 1,379 | 1,063 | 502 | 131 |
Water efficiency, percentage change compared to fiscal 20 baseline | 2% | (12)% | (38)% | 4% | (25)% |
Percentage change in total direct and indirect greenhouse gas emissions (market/net based) compared to fiscal 20 baseline | (32)% | 18% | (75)% | (59)% | (43)% |
Average number of employees(4) | 3,144 | 10,524 | 8,763 | 4,437 | 3,499 |
Location | Principal activities | Products | |
United Kingdom | distilling, bottling, warehousing, coopering | beer, scotch, gin, vodka, rum, ready to drink, non- alcoholic | |
Ireland | distilling, brewing, bottling, warehousing | beer, liqueur, Irish whiskey, non-alcoholic | |
Italy | distilling, bottling, warehousing | vodka, rum, ready to drink, non-alcoholic | |
Türkiye | distilling, bottling, warehousing | raki, vodka, gin, liqueur, wine | |
North America | distilling, bottling, warehousing | vodka, gin, rum, Canadian whisky, US whiskey, ready to drink | |
Brazil | distilling, bottling, warehousing | cachaça, vodka, ready to drink | |
Mexico | distilling, bottling, warehousing | tequila | |
East Africa | distilling, brewing, bottling, warehousing | beer, rum, vodka, gin, whisky, brandy, liqueur, ready to drink, bottled in East Africa (scotch) | |
Nigeria | distilling, brewing, bottling, warehousing | beer, rum, vodka, gin, ready to drink | |
South Africa | distilling, bottling, warehousing | rum, vodka, gin | |
ARM | distilling, brewing, bottling, warehousing | beer, vodka, gin, ready to drink | |
India | distilling, bottling, warehousing | rum, vodka, Indian whisky, gin, brandy, bottled in India (scotch) | |
Australia | distilling, bottling, warehousing | rum, vodka, gin, ready to drink | |
Greater China | distilling, warehousing | Chinese whisky, Chinese white spirits |
2023 re-presented(1) | Exchange | Acquisitions and disposals | Organic movement | Other(2) | 2024 | Reported movement % | ||
Net sales | 8,109 | 3 | 2 | (206) | — | 7,908 | (2) | |
Marketing | 1,631 | 1 | 5 | (10) | — | 1,627 | — | |
Operating profit before exceptional items | 3,222 | 160 | (10) | (142) | 6 | 3,236 | — | |
Exceptional operating items(3) | (118) | (197) | ||||||
Operating profit | 3,104 | 3,039 | (2) |
Organic volume movement | Reported volume movement | Organic net sales movement | Reported net sales movement | |
Markets and categories: | % | % | % | % |
North America(4) | (4) | (4) | (3) | (2) |
US Spirits(4) | (5) | (4) | (3) | (3) |
DBC USA(5) | 1 | 1 | 3 | 3 |
Canada | (5) | (4) | (2) | (3) |
Spirits(4) | (5) | (5) | (4) | (4) |
Beer | 3 | 3 | 5 | 5 |
Ready to drink | (8) | (8) | (3) | (3) |
Key brands(6): | ||||
Organic volume movement(7) | Organic net sales movement | Reported net sales movement | ||
% | % | % | ||
Crown Royal | — | (1) | (1) | |
Don Julio | 19 | 11 | 11 | |
Casamigos(8) | (16) | (21) | (22) | |
Smirnoff | (5) | (2) | (2) | |
Johnnie Walker | (7) | (10) | (10) | |
Captain Morgan | (10) | (6) | (6) | |
Guinness | 3 | 6 | 6 | |
Ketel One(9) | (4) | (5) | (5) | |
Baileys | (2) | — | — | |
Bulleit whiskey(10) | 6 | 12 | 12 | |
Buchanan's | 8 | 3 | 3 |
North America contributed | North America organic net sales declined | |
39% of Diageo reported net sales in fiscal 24 | 3% in fiscal 24 |
Reported net sales by market (%) |
Reported net sales by category (%) |
2023 re-presented(2) | Exchange | Reclassification | Acquisitions and disposals | Organic movement | Other(3) | Hyperinflation(1) | 2024 | Reported movement % | |
Net sales | 4,303 | (3) | 62 | 26 | 124 | — | 292 | 4,804 | 12 |
Marketing | 765 | 18 | 1 | 22 | 34 | — | 33 | 873 | 14 |
Operating profit before exceptional items | 1,312 | 24 | 47 | 3 | (15) | (3) | 11 | 1,379 | 5 |
Exceptional operating items(4) | (12) | (122) | |||||||
Operating profit | 1,300 | 1,257 | (6) |
Markets and categories: | Organic volume movement % | Reported volume movement % | Organic net sales movement % | Reported net sales movement % |
Europe(1) | (1) | — | 3 | 12 |
Great Britain(1) | (1) | — | 5 | 10 |
Southern Europe(1) | (2) | (8) | (2) | — |
Northern Europe(1) | (3) | (2) | (4) | — |
Ireland(1) | (2) | (1) | 7 | 11 |
Türkiye(1) | 4 | 4 | 31 | 59 |
Eastern Europe(1) | (6) | (5) | (7) | (3) |
Spirits(1) | (2) | (1) | (1) | 9 |
Beer | 8 | 8 | 18 | 23 |
Ready to drink(1) | (9) | (9) | (5) | (3) |
Key brands(2): | ||||
Organic volume movement(3) % | Organic net sales movement % | Reported net sales movement % | ||
Guinness | 11 | 22 | 27 | |
Johnnie Walker | 5 | 3 | 21 | |
Baileys | 5 | 6 | 10 | |
Smirnoff | (2) | — | 5 | |
Captain Morgan | (5) | (5) | — | |
Gordon's | (9) | (8) | (1) | |
Tanqueray | (8) | (9) | (4) | |
JεB | (3) | (6) | 3 | |
Europe contributed | Europe organic net sales grew | |
24% of Diageo reported net sales in fiscal 24 | 3% in fiscal 24 |
Reported net sales by market (%) |
Reported net sales by category (%) |
2023 re-presented(1) | Exchange | Reclassification | Acquisitions and disposals | Organic movement | 2024 | Reported movement % | |
Net sales | 3,841 | (30) | (62) | (96) | 164 | 3,817 | (1) |
Marketing | 655 | (11) | (1) | (8) | 16 | 651 | (1) |
Operating profit before exceptional items | 1,104 | (29) | (47) | (25) | 60 | 1,063 | (4) |
Exceptional operating items(2) | (581) | 375 | |||||
Operating profit | 523 | 1,438 | 175 |
Markets and categories: | Organic volume movement % | Reported volume movement % | Organic net sales movement % | Reported net sales movement % |
Asia Pacific(1) | 1 | (7) | 4 | (1) |
India(1) | 2 | (7) | 8 | 3 |
Greater China | 14 | 15 | 12 | 8 |
Australia | (7) | (6) | (8) | (9) |
South East Asia(1) | (9) | (8) | (8) | (4) |
Travel Retail Asia and Middle East | — | (28) | 10 | (3) |
North Asia | (12) | (13) | 3 | (17) |
Spirits(1) | 1 | (7) | 6 | 1 |
Beer | (2) | (3) | 4 | 2 |
Ready to drink | (16) | (16) | (14) | (16) |
Key brands(2): | ||||
Organic volume movement(3) | Organic net sales movement | Reported net sales movement | ||
% | % | % | ||
Johnnie Walker | (4) | 1 | — | |
Shui Jing Fang(4) | 32 | 27 | 23 | |
McDowell's | (2) | 4 | 2 | |
The Singleton | 14 | 12 | 10 | |
Royal Challenge | 11 | 16 | 14 | |
Guinness | (2) | 4 | 2 | |
Black & White | 20 | 24 | 21 | |
Smirnoff | 1 | (1) | (6) | |
Asia Pacific contributed | Asia Pacific organic net sales grew | |
19% of Diageo reported net sales of fiscal 24 | 4% in fiscal 24 |
Reported net sales by market (%) |
Reported net sales by category (%) |
2023 re-presented⁽¹⁾ | Exchange | Organic movement | Other (2) | 2024 | Reported movement % | |
Net sales | 2,159 | 118 | (459) | — | 1,839 | (15) |
Marketing | 355 | 21 | (70) | — | 306 | (14) |
Operating profit | 783 | 37 | (302) | (17) | 502 | (36) |
Markets and categories: | Organic volume movement % | Reported volume movement % | Organic net sales movement % | Reported net sales movement % |
Latin America and Caribbean | (16) | (16) | (21) | (15) |
Brazil | (10) | (10) | (18) | (15) |
Mexico | (25) | (25) | (30) | (24) |
CCA | (20) | (20) | (25) | (21) |
Andean | (18) | (18) | (17) | 19 |
South LAC | (18) | (18) | (9) | (13) |
Spirits | (16) | (16) | (23) | (16) |
Beer | 3 | 3 | 29 | 33 |
Ready to drink | — | — | (3) | (1) |
Key brands(1): | ||||
Organic volume movement(4) % | Organic net sales movement % | Reported net sales movement % | ||
Johnnie Walker | (12) | (17) | (12) | |
Buchanan’s | (18) | (28) | (15) | |
Don Julio | (28) | (37) | (30) | |
Old Parr | (15) | (25) | (14) | |
Smirnoff | (15) | (15) | (18) | |
Black & White | (25) | (30) | (22) | |
Baileys | (20) | (14) | (9) | |
White Horse | (2) | (11) | (10) | |
Latin America and Caribbean contributed | Latin America and Caribbean organic net sales declined | |
9% of Diageo reported net sales in fiscal 24 | 21% in fiscal 24 |
Reported net sales by market (%) |
Reported net sales by category (%) |
2023 re- presented⁽¹⁾ | Exchange | Reclassific ation | Acquisitions and disposals | Organic movement | Hyperinfla tion(2) | 2024 | Reported movement % | |
Net sales | 2,039 | (518) | — | — | 235 | 22 | 1,778 | (13) |
Marketing | 235 | (53) | (12) | (1) | 35 | 1 | 205 | (13) |
Operating profit before exceptional items | 289 | (222) | (11) | 86 | (11) | 131 | (55) | |
Exceptional operating items(3) | (55) | — | ||||||
Operating profit | 234 | 131 | (44) |
Organic volume movement | Reported volume movement | Organic net sales movement | Reported net sales movement | |
Markets and categories: | % | % | % | % |
Africa(1) | (6) | (2) | 12 | (13) |
East Africa | 1 | 1 | 9 | — |
Africa Regional Markets(1) | (6) | (2) | 6 | (26) |
Nigeria | (18) | (18) | 31 | (41) |
South Africa | (17) | 14 | (11) | 32 |
Spirits(1) | (16) | (9) | (2) | (4) |
Beer(1) | 4 | 4 | 19 | (16) |
Ready to drink(1) | 2 | 8 | 35 | (24) |
Key brands(2): | ||||
Organic volume movement(3) | Organic net sales movement | Reported net sales movement | ||
% | % | % | ||
Guinness | (1) | 16 | (33) | |
Senator | 26 | 29 | 15 | |
Malta Guinness | (3) | 44 | (22) | |
Johnnie Walker | (19) | (11) | (19) | |
Tusker | (6) | — | (7) | |
Serengeti | (1) | 4 | (3) | |
Smirnoff | (19) | (9) | (22) | |
Africa contributed | Africa organic net sales grew | |
9% of Diageo reported net sales in fiscal 24 | 12% in fiscal 24 |
Reported net sales by market (%) |
Reported net sales by category (%) |
Key categories: | Organic volume movement(1) % | Organic net sales movement % | Reported net sales movement % | Reported net sales by category % |
Spirits(2) | (5) | (4) | (2) | 78 |
Scotch | (7) | (10) | (6) | 24 |
Tequila | (4) | (7) | (7) | 11 |
Vodka(3)(4) | (9) | (7) | (6) | 9 |
Canadian whisky(5) | (2) | (1) | (1) | 6 |
Rum(4) | (11) | (6) | (2) | 5 |
Liqueurs | (2) | 2 | 3 | 5 |
Gin(4) | (10) | (8) | 2 | 5 |
IMFL whisky(5) | 5 | 10 | 2 | 4 |
Chinese white spirits(5) | 32 | 27 | 23 | 3 |
US whiskey(5) | (3) | 3 | 3 | 2 |
Beer | 5 | 14 | 3 | 16 |
Ready to drink | (7) | (1) | (10) | 4 |
Reported volume by category | Reported net sales by category | Reported marketing spend by category |
n | Scotch | n | Vodka | n | US whiskey | n | Canadian whisky | n | Rum | n | IMFL whisky |
n | Liqueurs | n | Gin | n | Tequila | n | Beer | n | Ready to drink | n | Other |
Key brands(1): | |||
Organic volume movement(2) % | Organic net sales movement % | Reported net sales movement % | |
Johnnie Walker | (5) | (6) | (2) |
Guinness | 5 | 15 | 6 |
Don Julio | 7 | 3 | 4 |
Crown Royal | — | (1) | (1) |
Smirnoff | (7) | (3) | (3) |
Baileys | (1) | 1 | 2 |
Casamigos(3) | (15) | (20) | (20) |
Captain Morgan | (7) | (5) | (4) |
Shui Jing Fang(4) | 32 | 27 | 23 |
Scotch malts | (9) | (14) | (14) |
McDowell's | (2) | 3 | 1 |
Buchanan’s | (9) | (15) | (7) |
Gordon's | (11) | (6) | 20 |
Tanqueray | (11) | (11) | (10) |
Ketel One(5) | (5) | (5) | (5) |
Bulleit whiskey(6) | 6 | 11 | 11 |
Cîroc vodka | (23) | (26) | (26) |
Old Parr | (13) | (21) | (12) |
Yenì Raki | (4) | 19 | 53 |
Black & White | (11) | (7) | (4) |
JεB | (8) | (10) | (5) |
Bundaberg | (3) | (7) | (9) |
Reported 2023 | Exceptional operating items (c) | Exchange (a) | Acquisitions and disposals (b) | Organic movement(2) | Fair value remeasure- ment (d) | Reclassifi- cation | Hyper- inflation(2) | Reported 2024 | |
Key financials - certain line items | re-presented(1) $ million | $ million | $ million | $ million | $ million | $ million | $ million | $ million | $ million |
Sales | 28,270 | — | (654) | (381) | 168 | — | — | 488 | 27,891 |
Excise duties | (7,715) | — | 230 | 313 | (297) | — | — | (153) | (7,622) |
Net sales | 20,555 | — | (424) | (68) | (129) | — | — | 335 | 20,269 |
Cost of sales | (8,289) | 23 | 388 | 5 | 25 | (16) | — | (207) | (8,071) |
Gross profit | 12,266 | 23 | (36) | (63) | (104) | (16) | — | 128 | 12,198 |
Marketing | (3,663) | — | 19 | (18) | (7) | — | 12 | (34) | (3,691) |
Other operating items | (3,056) | 799 | 9 | 38 | (193) | 2 | (12) | (93) | (2,506) |
Operating profit | 5,547 | 822 | (8) | (43) | (304) | (14) | — | 1 | 6,001 |
Other line items: | |||||||||
Non-operating items | 364 | (70) | |||||||
Taxation (e) | (1,163) | (1,294) |
Gains/ (losses) $ million | |
Translation impact | (37) |
Transaction impact | 29 |
Operating profit before exceptional items | (8) |
Net finance charges – translation impact | 22 |
Net finance charges – transaction impact | (24) |
Net finance charges(1) | (2) |
Associates – translation impact | 15 |
Profit before exceptional items and taxation | 5 |
Year ended 30 June 2024 | Year ended 30 June 2023 | |
Exchange rates | ||
Translation $1 = | £0.80 | £0.83 |
Transaction $1 = | £0.82 | £0.77 |
Translation $1 = | €0.93 | €0.96 |
Movements in net borrowings | 2024 | 2023 |
$ million | re-presented(1) $ million | |
Net borrowings at the beginning of the year | (19,582) | (17,107) |
Free cash flow (2) | 2,609 | 2,235 |
Movements in loans and other investments | (47) | (68) |
Acquisitions (3) | (6) | (404) |
Investment in associates (3) | (133) | (112) |
Sale of businesses and brands (4) | 87 | 559 |
Share buyback programme (5) | (987) | (1,673) |
Net sale of own shares for share schemes (6) | 21 | 36 |
Purchase of treasury shares in respect of subsidiaries | (10) | — |
Dividend paid to non-controlling interests | (117) | (117) |
Net movements in bonds (7) | 558 | 887 |
Purchase of shares of non-controlling interests (8) | (223) | (178) |
Net movements in other borrowings (9) | (106) | 69 |
Equity dividend paid | (2,242) | (2,065) |
Net decrease in cash and cash equivalents | (596) | (831) |
Net increase in bonds and other borrowings | (453) | (958) |
Exchange differences (10) | (199) | (646) |
Other non-cash items | (187) | (40) |
Net borrowings at the end of the year | (21,017) | (19,582) |
Movements in equity | 2024 | 2023 |
$ million | re-presented(1) $ million | |
Equity at the beginning of the year | 11,709 | 11,511 |
Adjustment to 2023 closing equity in respect of hyperinflation in Ghana (2) | 51 | — |
Adjusted equity at the beginning of the year | 11,760 | 11,511 |
Profit for the year | 4,166 | 4,479 |
Exchange adjustments (3) | (645) | (358) |
Remeasurement of post-employment benefit plans net of taxation | (61) | (562) |
Purchase of shares of non-controlling interests (4) | (223) | (178) |
Hyperinflation adjustments net of taxation (2) | 365 | 180 |
Associates' transactions with non-controlling interests | — | (8) |
Dividend declared to non-controlling interests | (121) | (117) |
Equity dividend declared | (2,243) | (2,071) |
Share buyback programme (5) | (997) | (1,543) |
Other reserve movements | 69 | 376 |
Equity at the end of the year | 12,070 | 11,709 |
30 June 2024 | 30 June 2023 | 30 June 2022 | |
$ million | re-presented $ million | re-presented $ million | |
Expiring within one year | 625 | 125 | 960 |
Expiring between one and two years | 1,040 | 625 | 125 |
Expiring after two years | 1,585 | 2,625 | 2,290 |
3,250 | 3,375 | 3,375 |
30 June 2024 | 30 June 2023 | 30 June 2022 | |
$ million | re-presented $ million | re-presented $ million | |
Net cash inflow from operating activities | 4,105 | 3,636 | 5,213 |
Net cash outflow from investing activities | (1,595) | (1,426) | (1,792) |
Net cash outflow from financing activities | (3,106) | (3,041) | (4,373) |
Net decrease in net cash and cash equivalents | (596) | (831) | (952) |
Exchange difference | (33) | (76) | (38) |
Reclassification to asset held for sale | (30) | — | — |
Net cash and cash equivalents at beginning of period | 1,768 | 2,675 | 3,665 |
Net cash and cash equivalents at end of period | 1,109 | 1,768 | 2,675 |
30 June 2024 | 30 June 2023 | 30 June 2022 | |
$ million | re-presented $ million | re-presented $ million | |
Overdrafts | (21) | (45) | (90) |
Other borrowings due within one year | (2,864) | (2,097) | (1,752) |
Borrowings due within one year | (2,885) | (2,142) | (1,842) |
Borrowings due between one and three years | (4,873) | (4,437) | (3,408) |
Borrowings due between three and five years | (4,222) | (3,620) | (3,177) |
Borrowings due after five years | (9,521) | (10,592) | (10,958) |
Fair value of foreign currency forwards and swaps | 334 | 436 | 430 |
Fair value of interest rate hedging instruments | (376) | (476) | (342) |
Lease liabilities | (604) | (564) | (575) |
Gross borrowings | (22,147) | (21,395) | (19,872) |
Offset by: | |||
Cash and cash equivalents | 1,130 | 1,813 | 2,765 |
Net borrowings | (21,017) | (19,582) | (17,107) |
Total | US dollar % | Sterling % | Euro % | Indian Rupee % | Chinese Yuan % | South Korean won % | Other % | |
Gross borrowings | (22,147) | 43.00% | 22.00% | 26.00% | —% | 4.00% | —% | 5.00% |
Cash and cash equivalents | 1,130 | 12.00% | 3.00% | 5.00% | 15.00% | 23.00% | 4.00% | 38.00% |
30 June 2024 | 30 June 2023 | 30 June 2022 | |
$ million | re-presented $ million | re-presented $ million | |
Issued | |||
€ denominated | 535 | 548 | 1,800 |
£ denominated | — | — | 1,171 |
$ denominated | 1,690 | 1,989 | — |
Repaid | |||
€ denominated | (1,167) | — | (1,060) |
$ denominated | (500) | (1,650) | (1,000) |
558 | 887 | 911 |
Payments due by period | |||||
As at 30 June 2024 | Less than 1 year $ million | 1-3 years $ million | 3-5 years $ million | More than 5 years $ million | Total $ million |
Long-term debt obligations | 2,388 | 4,992 | 4,258 | 9,812 | 21,450 |
Interest obligations | 791 | 1,043 | 789 | 1,866 | 4,489 |
Credit support obligations | 14 | — | — | — | 14 |
Purchase obligations | 2,413 | 1,009 | 389 | 37 | 3,848 |
Commitments for short-term leases and leases of low-value assets | 16 | 6 | 1 | — | 23 |
Provisions and other non-current payables | 101 | 225 | 187 | 192 | 705 |
Lease obligations | 114 | 178 | 117 | 310 | 719 |
Capital commitments | 780 | 3 | — | — | 783 |
Other financial liabilities | 198 | — | — | — | 198 |
Total | 6,815 | 7,456 | 5,741 | 12,217 | 32,229 |
Reported net sales growth 0.2% | Net cash from operating activities $3,636m | |
Organic net sales growth(1) 6.5% | Free cash flow(1)(2) $2,235m | |
Reported operating profit growth (5.9)% | Return on closing invested capital 38.3% | |
Organic operating profit growth(1) 7.0% | Return on average invested capital(1) 18.4% | |
Basic earnings per share 196.3 cents | Total shareholder return (2)% | |
Earnings per share before exceptional items(1) 196.5 cents |
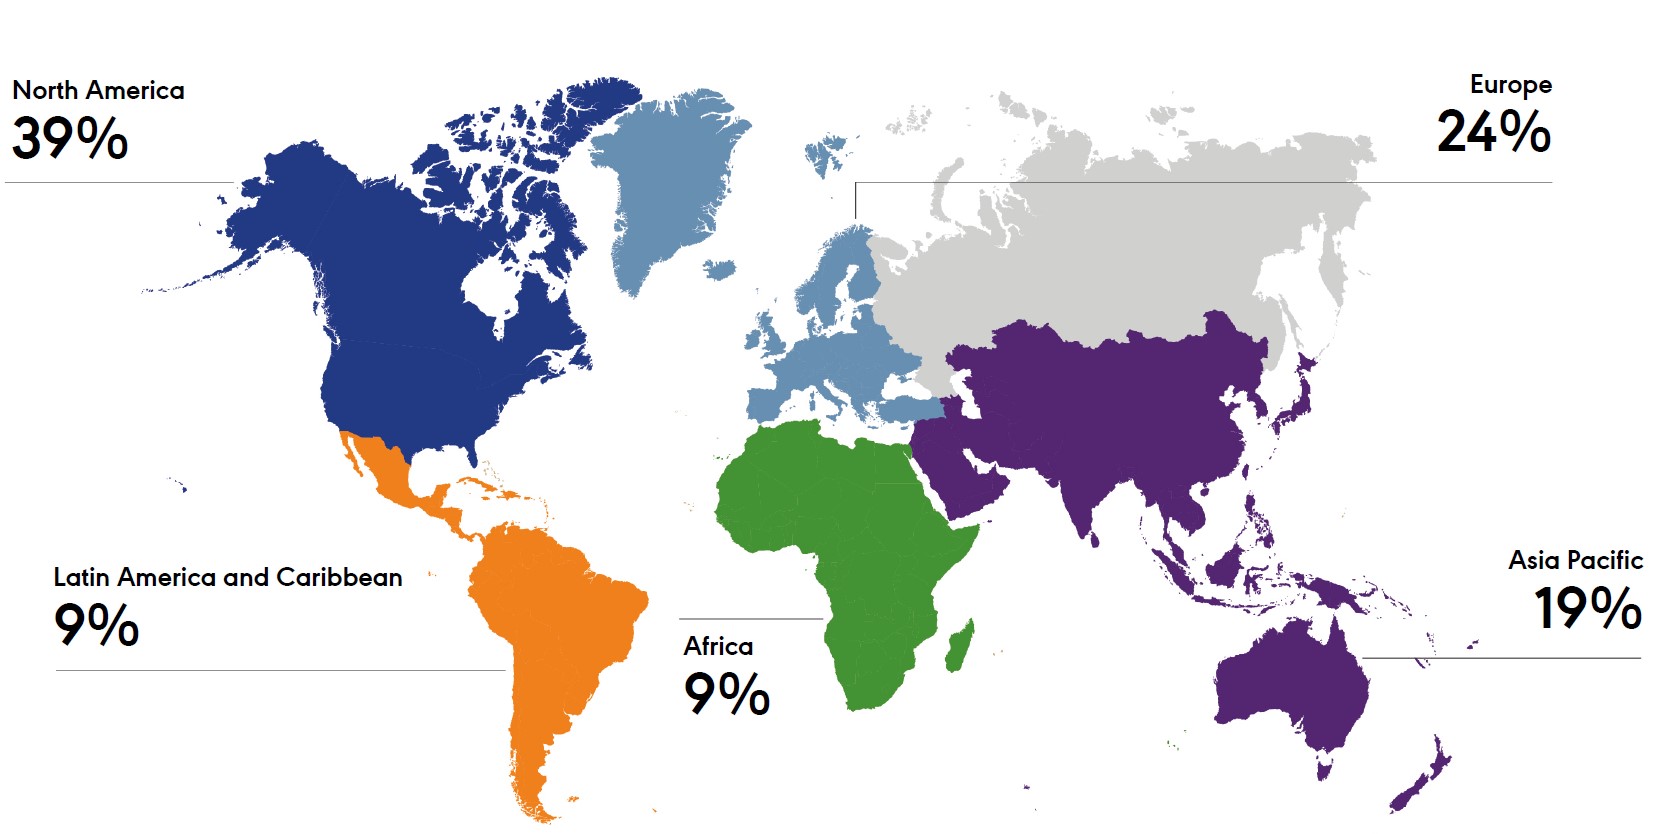
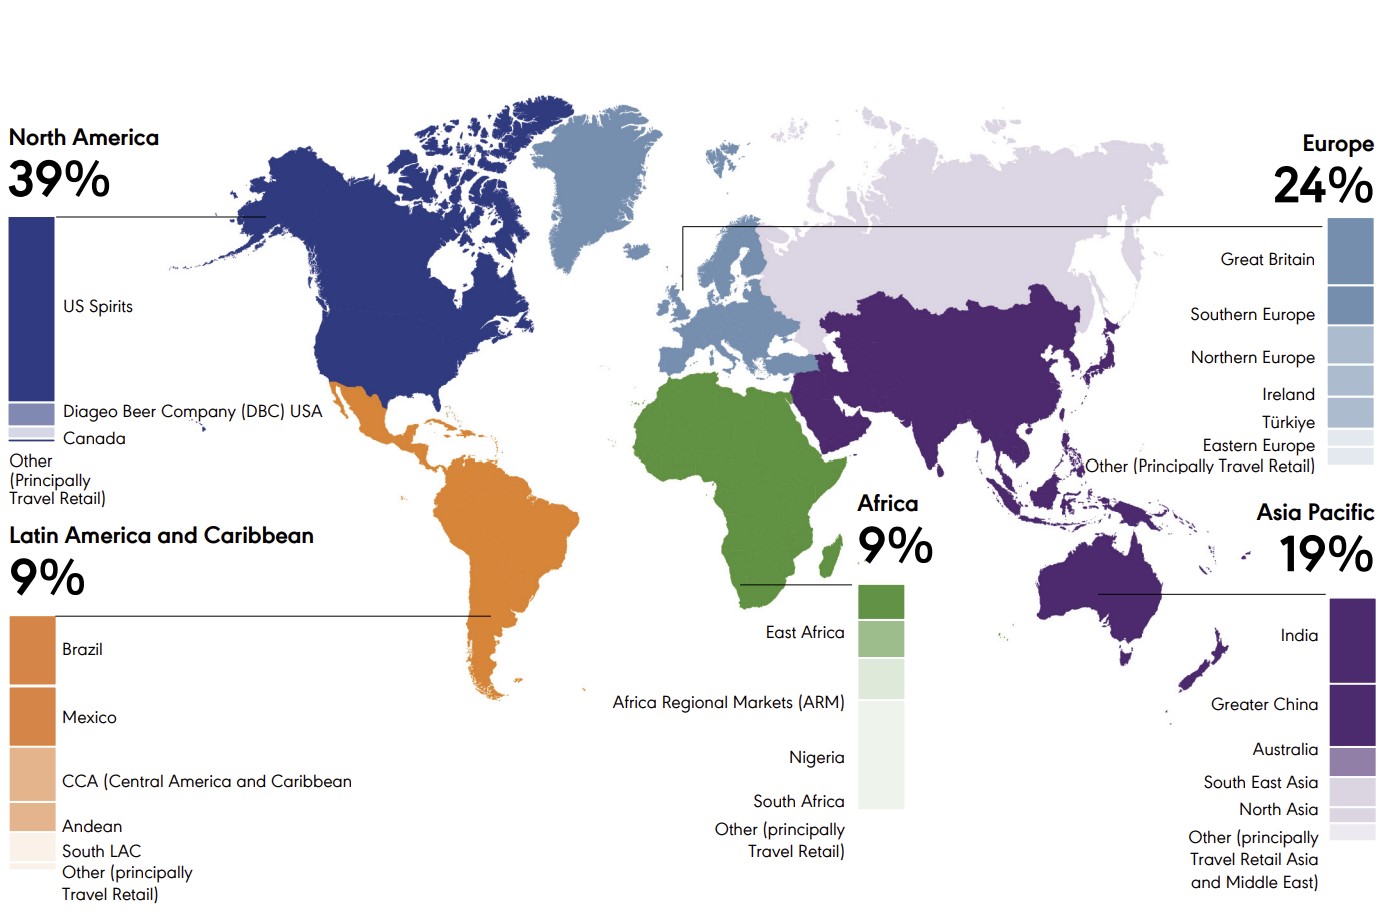
Our global reach | Our regional profile maximises the opportunity for growth in our sector. Where our products are sold each market is accountable for its own performance and driving growth. |
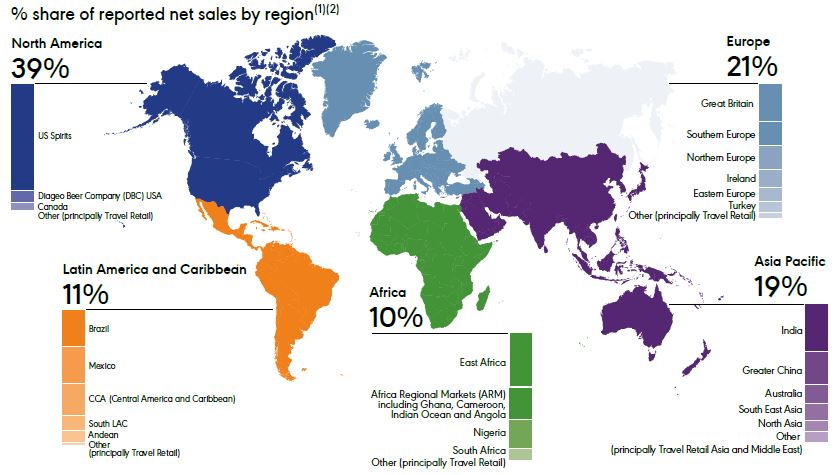
Fiscal 23 | North America | Europe | Asia Pacific | Latin America and Caribbean | Africa |
Volume (EUm) | 52.4 | 51.3 | 80.8 | 26.2 | 32.7 |
Reported net sales(1) ($ million) | 8,109 | 4,303 | 3,841 | 2,159 | 2,039 |
Reported operating profit(2) ($ million) | 3,104 | 1,300 | 523 | 783 | 234 |
Operating profit before exceptional items(3) ($ million) | 3,222 | 1,312 | 1,104 | 783 | 289 |
Water efficiency (litres per litre of product packaged) | 5.11 | 4.98 | 2.91 | 4.15 | 3.19 |
Total direct and indirect carbon emissions by weight (market/net based) (1,000 tonnes CO2e) | 83 | 194 | 9 | 26 | 89 |
Average number of employees(4) | 3,115 | 10,062 | 9,000 | 4,325 | 3,735 |
Location | Principal activities | Products | |
United Kingdom | distilling, bottling, warehousing, cooperage | beer, scotch, gin, vodka, rum, ready to drink, non- alcoholic | |
Ireland | distilling, brewing, bottling, warehousing | beer, liqueur, Irish whiskey, non-alcoholic | |
Italy | distilling, bottling, warehousing | vodka, rum, ready to drink, non-alcoholic | |
Türkiye | distilling, bottling, warehousing | raki, vodka, gin | |
North America | distilling, bottling, warehousing | vodka, gin, rum, Canadian whisky, US whiskey, ready to drink | |
Brazil | distilling, bottling, warehousing | cachaça, vodka, ready to drink | |
Mexico | distilling, bottling, warehousing | tequila | |
East Africa | distilling, brewing, bottling, packaging, warehousing | beer, rum, vodka, gin, whisky, brandy, liqueur | |
Nigeria | distilling, brewing, bottling, packaging | beer, rum, vodka, gin | |
South Africa | distilling, bottling, warehousing | rum, vodka, gin | |
ARM | distilling, brewing, bottling, warehousing | beer, vodka, gin | |
India | distilling, bottling, warehousing | rum, vodka, Indian-Made Foreign Liquor (IMFL), whisky, scotch, gin | |
Australia | distilling, bottling, warehousing | rum, vodka, gin, ready to drink |
2022 (re- presented) | Exchange | Acquisitions and disposals | Organic movement | Other(1) | 2023 (re- presented) | Reported movement (re- presented) | |
$ million | $ million | $ million | $ million | $ million | $ million | % | |
Net sales | 8,106 | (38) | 27 | 14 | — | 8,109 | — |
Marketing | 1,595 | (14) | 20 | 29 | 1 | 1,631 | 2 |
Operating profit before exceptional items | 3,268 | (34) | (15) | (76) | 79 | 3,222 | (1) |
Exceptional operating items(2) | (1) | (118) | |||||
Operating profit | 3,267 | 3,104 | (5) |
Organic volume movement | Reported volume movement | Organic net sales movement | Reported net sales movement (re-presented) | |
Markets and categories: | % | % | % | % |
North America(3) | (5) | (4) | — | — |
US Spirits(3) | (6) | (6) | (1) | — |
DBC USA(4) | (3) | (3) | 1 | 1 |
Canada | (2) | (2) | 4 | (2) |
Spirits(3) | (5) | (4) | — | — |
Beer | (2) | (2) | 2 | 1 |
Ready to drink | (11) | (11) | (16) | (18) |
Global giants, local stars and reserve(5) | Organic volume movement(6) % | Organic net sales movement % | Reported net sales movement (re-presented) % | |
Crown Royal | (12) | (10) | (10) | |
Don Julio | 8 | 13 | 13 | |
Casamigos(7) | 6 | 13 | 13 | |
Johnnie Walker | (5) | (10) | (11) | |
Smirnoff | (1) | 4 | 3 | |
Captain Morgan | (5) | (1) | (1) | |
Ketel One | (3) | — | — | |
Guinness | 4 | 9 | 8 | |
Baileys | (4) | 1 | 1 | |
Bulleit whiskey(8) | (8) | (6) | (6) | |
Buchanan's | — | 9 | 9 | |
North America contributed | North America organic net sales were flat in fiscal 23 | |
39% of Diageo reported net sales in fiscal 23 |
Reported net sales by market (%) |
Reported net sales by category (%) |
2022 (re- presented) | Exchange | Acquisitions and disposals | Organic movement | Other(2) | Hyperinfla tion(1) | 2023 (re- presented) | Reported movement | |
$ million | $ million | $ million | $ million | $ million | $ million | $ million | % | |
Net sales | 4,238 | (530) | (11) | 466 | — | 140 | 4,303 | 2 |
Marketing | 764 | (74) | 3 | 57 | — | 15 | 765 | — |
Operating profit before exceptional items | 1,345 | (144) | (43) | 138 | (14) | 30 | 1,312 | (2) |
Exceptional operating items(3) | (184) | (12) | ||||||
Operating profit | 1,161 | 1,300 | 12 |
Markets and categories | Organic volume movement % | Reported volume movement % | Organic net sales movement % | Reported net sales movement (re-presented) % |
Europe(1) | — | — | 11 | 2 |
Great Britain(1) | (8) | (8) | 7 | (4) |
Southern Europe(1) | 4 | 5 | 12 | 2 |
Northern Europe(1) | 8 | 6 | 11 | 1 |
Ireland(1) | 3 | 3 | 16 | 7 |
Eastern Europe(1) | (15) | (15) | (3) | (9) |
Türkiye(1) | 9 | 9 | 38 | 14 |
Spirits(1) | — | — | 10 | — |
Beer | 5 | 5 | 18 | 8 |
Ready to drink(1) | (2) | (2) | 10 | 1 |
Global giants and local stars(2) | Organic volume movement(3) % | Organic net sales movement % | Reported net sales movement (re-presented) % | |
Guinness | 6 | 20 | 9 | |
Johnnie Walker | 18 | 29 | 14 | |
Baileys | (3) | (1) | (9) | |
Smirnoff | (1) | 14 | 4 | |
Captain Morgan | — | 9 | (1) | |
Tanqueray | — | 6 | (3) | |
JεB | (7) | (1) | (8) | |
Yenì Raki | — | 7 | (6) |
Europe contributed | Europe organic net sales grew | |
21% of Diageo reported net sales in fiscal 23 | 11% in fiscal 23 |
Reported net sales by market (%) |
Reported net sales by category (%) |

2022 (re- presented) | Exchange | Acquisitions and disposals | Organic movement | 2023 (re- presented) | Reported movement (re- presented) | |
$ million | $ million | $ million | $ million | $ million | % | |
Net sales | 3,837 | (334) | (136) | 474 | 3,841 | — |
Marketing | 651 | (58) | — | 62 | 655 | 1 |
Operating profit before exceptional items | 947 | (83) | (28) | 268 | 1,104 | 17 |
Exceptional operating items(2) | (292) | (581) | ||||
Operating profit | 655 | 523 | (20) |
Markets and categories | Organic volume movement % | Reported volume movement % | Organic net sales movement % | Reported net sales movement (re-presented) % |
Asia Pacific(1) | 5 | (14) | 13 | — |
India(1) | 6 | (18) | 17 | 3 |
Greater China | (2) | (2) | (4) | (11) |
Australia | (10) | (10) | 2 | (5) |
South East Asia(1) | 20 | 20 | 33 | 23 |
North Asia | 6 | 6 | 15 | 2 |
Travel Retail Asia and Middle East | 38 | 38 | 67 | 49 |
Spirits(1)(2) | 6 | (15) | 14 | 1 |
Beer | 5 | 5 | 10 | 1 |
Ready to drink | (8) | (8) | 1 | (7) |
Global giants and local stars(2) | Organic volume movement(3) % | Organic net sales movement % | Reported net sales movement (re-presented) % | |
Johnnie Walker | 13 | 29 | 17 | |
Shui Jing Fang(4) | (15) | (14) | (21) | |
McDowell's | (1) | 4 | (4) | |
Guinness | 4 | 10 | 2 | |
The Singleton | 26 | 26 | 18 | |
Smirnoff | 8 | 15 | 8 | |
Windsor | 29 | 41 | 28 | |
Black & White | 28 | 36 | 25 |
Asia Pacific contributed | Asia Pacific organic net sales grew | |
19% of Diageo reported net sales in fiscal 23 | 13% in fiscal 23 |
Reported net sales by market (%) |
Reported net sales by category (%) |
2022 (re- presented) | Exchange | Acquisitions and disposals | Organic movement | Other(1) | 2023 (re- presented) | Reported movement (re- presented) | |
$ million | $ million | $ million | $ million | $ million | $ million | % | |
Net sales | 2,027 | (61) | 3 | 190 | — | 2,159 | 7 |
Marketing | 324 | (15) | 1 | 45 | — | 355 | 10 |
Operating profit | 712 | (24) | — | 83 | 12 | 783 | 10 |
Markets and categories | Organic volume movement % | Reported volume movement % | Organic net sales movement % | Reported net sales movement (re-presented) % |
Latin America and Caribbean(1) | (3) | (3) | 9 | 7 |
Brazil(2) | (1) | 3 | 8 | 16 |
Mexico(1) | (4) | (3) | 9 | 17 |
CCA | 1 | 1 | 14 | 9 |
South LAC(2) | (3) | (11) | 21 | (8) |
Andean(1) | (24) | (24) | (7) | (21) |
Spirits(1) | (3) | (3) | 11 | 8 |
Beer | 9 | 9 | 16 | 13 |
Ready to drink | (13) | (13) | (7) | (10) |
Global giants and local stars(3) | Organic volume movement(4) % | Organic net sales movement % | Reported net sales movement (re-presented) % | |
Johnnie Walker | 4 | 16 | 12 | |
Buchanan’s | (5) | 6 | — | |
Don Julio | 6 | 22 | 26 | |
Old Parr | 10 | 20 | 14 | |
Smirnoff | 3 | 18 | 12 | |
Black & White | (7) | 13 | 13 | |
Tanqueray | — | — | (5) | |
Baileys | (18) | (5) | (8) | |
Latin America and Caribbean contributed | Latin America and Caribbean organic net sales grew | |
11% of Diageo reported net sales in fiscal 23 | 9% in fiscal 23 |
Reported net sales by market (%) |
Reported net sales by category (%) |

2022 (re- presented) | Exchange | Acquisitions and disposals | Organic movement | 2023 (re- presented) | Reported movement (re- presented) | |
$ million | $ million | $ million | $ million | $ million | % | |
Net sales | 2,238 | (273) | (37) | 111 | 2,039 | (9) |
Marketing | 266 | (31) | (6) | 6 | 235 | (12) |
Operating profit before exceptional items | 419 | (192) | 13 | 49 | 289 | (31) |
Exceptional operating items(1) | — | (55) | ||||
Operating profit | 419 | 234 | (44) |
Organic volume movement | Reported volume movement | Organic net sales movement | Reported net sales movement (re-presented) | |
Markets and categories | % | % | % | % |
Africa(1) | (7) | (8) | 5 | (9) |
East Africa | (7) | (7) | (2) | (10) |
Nigeria | (4) | (4) | 11 | 1 |
Africa Regional Markets(1) | (1) | (9) | 22 | (14) |
South Africa | (18) | (18) | 1 | (13) |
Spirits(1) | (2) | (2) | 8 | (4) |
Beer(1) | (13) | (14) | 3 | (12) |
Ready to drink(1) | — | (4) | 11 | (5) |
Organic volume movement(3) | Organic net sales movement | Reported net sales movement (re-presented) | ||
Global giants and local stars(2) | % | % | % | |
Guinness | (8) | 7 | (8) | |
Johnnie Walker | 5 | 11 | (3) | |
Smirnoff | (23) | (6) | (18) | |
Other beer: | ||||
Malta Guinness | (7) | 22 | (8) | |
Senator | (17) | (4) | (14) | |
Tusker | (8) | (5) | (13) | |
Serengeti | (7) | (1) | (3) |
Africa contributed | Africa organic net sales grew | |
10% of Diageo reported net sales in fiscal 23 | 5% in fiscal 23 |
Reported net sales by market (%) |
Reported net sales by category (%) |
Key categories | Organic volume movement(1) % | Organic net sales movement % | Reported net sales movement (re-presented) % | Reported net sales by category (re-presented) % |
Spirits(2) | — | 6 | 1 | 78 |
Scotch | 2 | 12 | 5 | 25 |
Tequila | 10 | 19 | 19 | 12 |
Vodka(3)(4) | (3) | 1 | (3) | 9 |
Canadian whisky(5) | (10) | (9) | (10) | 6 |
Rum(4) | (7) | 2 | (2) | 5 |
Liqueurs | (4) | (1) | (7) | 5 |
Gin(4) | — | 5 | (2) | 5 |
IMFL whisky(5) | 8 | 15 | (10) | 4 |
Chinese white spirits(5) | (15) | (14) | (21) | 3 |
US whiskey(5) | (8) | (4) | (4) | 2 |
Beer | (7) | 9 | (2) | 15 |
Ready to drink | (6) | — | (7) | 4 |
Reported volume by category | Reported net sales by category | Reported marketing spend by category |
n | Scotch | n | Vodka | n | US whiskey | n | Canadian whisky | n | Rum | n | IMFL whisky |
n | Liqueurs | n | Gin | n | Tequila | n | Beer | n | Ready to drink | n | Other |
Global giants, local stars and reserve(1): | Organic volume movement(2) % | Organic net sales movement % | Reported net sales movement (re-presented) % |
Global giants | |||
Johnnie Walker | 9 | 15 | 7 |
Guinness | 1 | 16 | 5 |
Smirnoff | (2) | 8 | 3 |
Baileys | (5) | — | (5) |
Captain Morgan | (2) | 5 | — |
Tanqueray | (4) | 1 | (4) |
Local stars | |||
Crown Royal | (12) | (10) | (10) |
Buchanan’s | (3) | 7 | 4 |
McDowell's | (1) | 4 | (4) |
Shui Jing Fang(3) | (15) | (14) | (21) |
Old Parr | 9 | 18 | 12 |
Black & White | 2 | 20 | 16 |
JεB | (9) | (3) | (10) |
Yenì Raki | — | 8 | (6) |
Windsor | 29 | 41 | 28 |
Bundaberg | — | 18 | 9 |
Ypióca | (9) | 7 | 9 |
Reserve | |||
Don Julio | 11 | 20 | 19 |
Casamigos(4) | 7 | 15 | 15 |
Scotch malts | 3 | 16 | 7 |
Ketel One(5) | (3) | 1 | — |
Bulleit whiskey(6) | (9) | (6) | (6) |
Cîroc vodka | (23) | (23) | (25) |
Key financials - certain line items | 30 June 2022 (re- presented) $ million | Exceptional operating items (c) $ million | Exchange (a) $ million | Acquisitions and disposals (b) $ million | Organic movement(1) $ million | Fair value remeasurement (d) $ million | Hyperinflation(1) $ million | 30 June 2023 (re-presented) $ million |
Sales | 29,751 | — | (2,122) | (916) | 1,461 | — | 96 | 28,270 |
Excise duties | (9,235) | — | 876 | 762 | (162) | — | 44 | (7,715) |
Net sales | 20,516 | — | (1,246) | (154) | 1,299 | — | 140 | 20,555 |
Cost of sales | (7,923) | (80) | 378 | 113 | (699) | 7 | (85) | (8,289) |
Gross profit | 12,593 | (80) | (868) | (41) | 600 | 7 | 55 | 12,266 |
Marketing | (3,616) | — | 193 | (21) | (203) | (1) | (15) | (3,663) |
Other operating items | (3,080) | (209) | 157 | (19) | 34 | 71 | (10) | (3,056) |
Operating profit | 5,897 | (289) | (518) | (81) | 431 | 77 | 30 | 5,547 |
Other line items: | ||||||||
Non-operating items | (88) | 364 | ||||||
Taxation (e) | (1,398) | (1,163) |
Gains/ (losses) (re-presented) $ million | |
Translation impact | (395) |
Transaction impact | (123) |
Operating profit before exceptional items | (518) |
Net finance charges – translation impact | 29 |
Net finance charges – transaction impact | 8 |
Net finance charges | 37 |
Associates – translation impact | (37) |
Profit before exceptional items and taxation | (518) |
Year ended 30 June 2023 | Year ended 30 June 2022 | |
Exchange rates | ||
Translation $1 = | £0.83 | £0.75 |
Transaction $1 = | £0.77 | £0.78 |
Translation $1 = | €0.96 | €0.89 |
Movements in net borrowings | 2023 | 2022 |
re-presented $ million | re-presented $ million | |
Net borrowings at the beginning of the year | (17,107) | (16,832) |
Free cash flow (1) | 2,235 | 3,779 |
Movements in loans and other investments | (68) | (96) |
Acquisitions (2) | (404) | (278) |
Investment in associates (2) | (112) | (86) |
Sale of businesses and brands (3) | 559 | 102 |
Share buyback programme (4) | (1,673) | (2,985) |
Net sale of own shares for share schemes (5) | 36 | 24 |
Purchase of treasury shares in respect of subsidiaries | — | (20) |
Dividends paid to non-controlling interests | (117) | (108) |
Net movements in bonds (6) | 887 | 911 |
Purchase of shares of non-controlling interests (7) | (178) | — |
Net movements in other borrowings (8) | 69 | 105 |
Equity dividend paid | (2,065) | (2,300) |
Net decrease in cash and cash equivalents | (831) | (952) |
Net increase in bonds and other borrowings | (958) | (1,022) |
Exchange differences (9) | (646) | 1,967 |
Other non-cash items (10) | (40) | (268) |
Net borrowings at the end of the year | (19,582) | (17,107) |
Movements in equity | 2023 (re-presented) $ million | 2022 (re-presented) $ million |
Equity at the beginning of the year | 11,511 | 11,719 |
Adjustment to 2021 closing equity in respect of hyperinflation in Türkiye (1) | — | 349 |
Adjusted equity at the beginning of the year | 11,511 | 12,068 |
Profit for the year | 4,479 | 4,410 |
Exchange adjustments (2) | (358) | (583) |
Remeasurement of post employment benefit plans net of taxation | (562) | 661 |
Purchase of shares of non-controlling interests (3) | (178) | — |
Hyperinflation adjustments net of taxation (1) | 180 | 344 |
Associates' transactions with non-controlling interests | (8) | — |
Dividend to non-controlling interests | (117) | (95) |
Equity dividend declared | (2,071) | (2,286) |
Share buyback programme (4) | (1,543) | (3,004) |
Other reserve movements | 376 | (4) |
Equity at the end of the year | 11,709 | 11,511 |
Promote positive drinking We want to change the way people drink – for the better. This is why we promote moderate drinking and invest in education programmes to discourage the harmful use of alcohol. |
Tackling underage drinking through SMASHED | ||||
Target by 2030 Scale up our SMASHED partnership and educate 10 million young people, parents and teachers on the dangers of underage drinking | Number of people educated on the dangers of underage drinking through a Diageo- supported education programme in fiscal 24 | |||
2.2m | ||||

n | 2030 Target | 10m | ||
n | 2023 progress to date | 3.7m | ||
n | 2024 progress to date | 5.9m | ||
Changing attitudes to drink driving | ||||
Target by 2030 Extend our UNITAR partnership and promote changes in attitudes to drink driving, reaching five million people | Number of people educated about the dangers of drink driving in fiscal 24 | |||
1.0m | ||||

n | 2030 Target | 5m | ||
n | 2023 progress to date | 1.2m | ||
n | 2024 progress to date | 2.2m | ||
Incidents of non-compliance concerning marketing communications – fiscal 24(1) | |||
Country | Body | Industry complaints upheld | Complaints about Diageo brands upheld |
United States | Distilled Spirits Council of the United States | 2 | 1 |
Australia | ABAC Scheme | 33 | 0 |
United Kingdom | Advertising Standards Authority | 0 | 0 |
Portman Group | 18 | 0 | |
Republic of Ireland | Advertising Standards Authority for Ireland | 3 | 0 |
Doing business the right way We want to do business in the right way every day, everywhere. We expect all stakeholders, including our people and suppliers, to demonstrate integrity, live our values, and behave in an ethical way as set out in our Code of Business Conduct. | ||
Our people and culture: The key to winning Our talented and diverse workforce, together with our people’s passion for our brands and unique culture continues to be a competitive advantage for our business, enabling our people to perform at their best. |
Region(2) | Men | % | Women | % | Not declared(3) | % | Total |
North America | 1,844 | 59% | 1,286 | 41% | 14 | — | 3,144 |
Europe | 5,972 | 57% | 4,538 | 43% | 14 | — | 10,524 |
Asia Pacific | 5,797 | 66% | 2,965 | 34% | 1 | — | 8,763 |
Latin America and Caribbean | 2,225 | 64% | 1,272 | 36% | 2 | — | 3,499 |
Africa | 2,761 | 62% | 1,675 | 38% | 1 | — | 4,437 |
Diageo (total) | 18,599 | 61% | 11,736 | 39% | 32 | — | 30,367 |
Role | Men | % | Women | % | Not declared(3) | % | Total |
Executive(4) | 7 | 54% | 6 | 46% | 0 | — | 13 |
Senior manager(5) | 320 | 56% | 252 | 44% | 1 | — | 573 |
Line manager(6) | 2,414 | 64% | 1,330 | 35% | 7 | — | 3,751 |
Supervised employee(7) | 15,858 | 61% | 10,148 | 39% | 24 | — | 26,030 |
Diageo (total) | 18,599 | 61% | 11,736 | 39% | 32 | — | 30,367 |
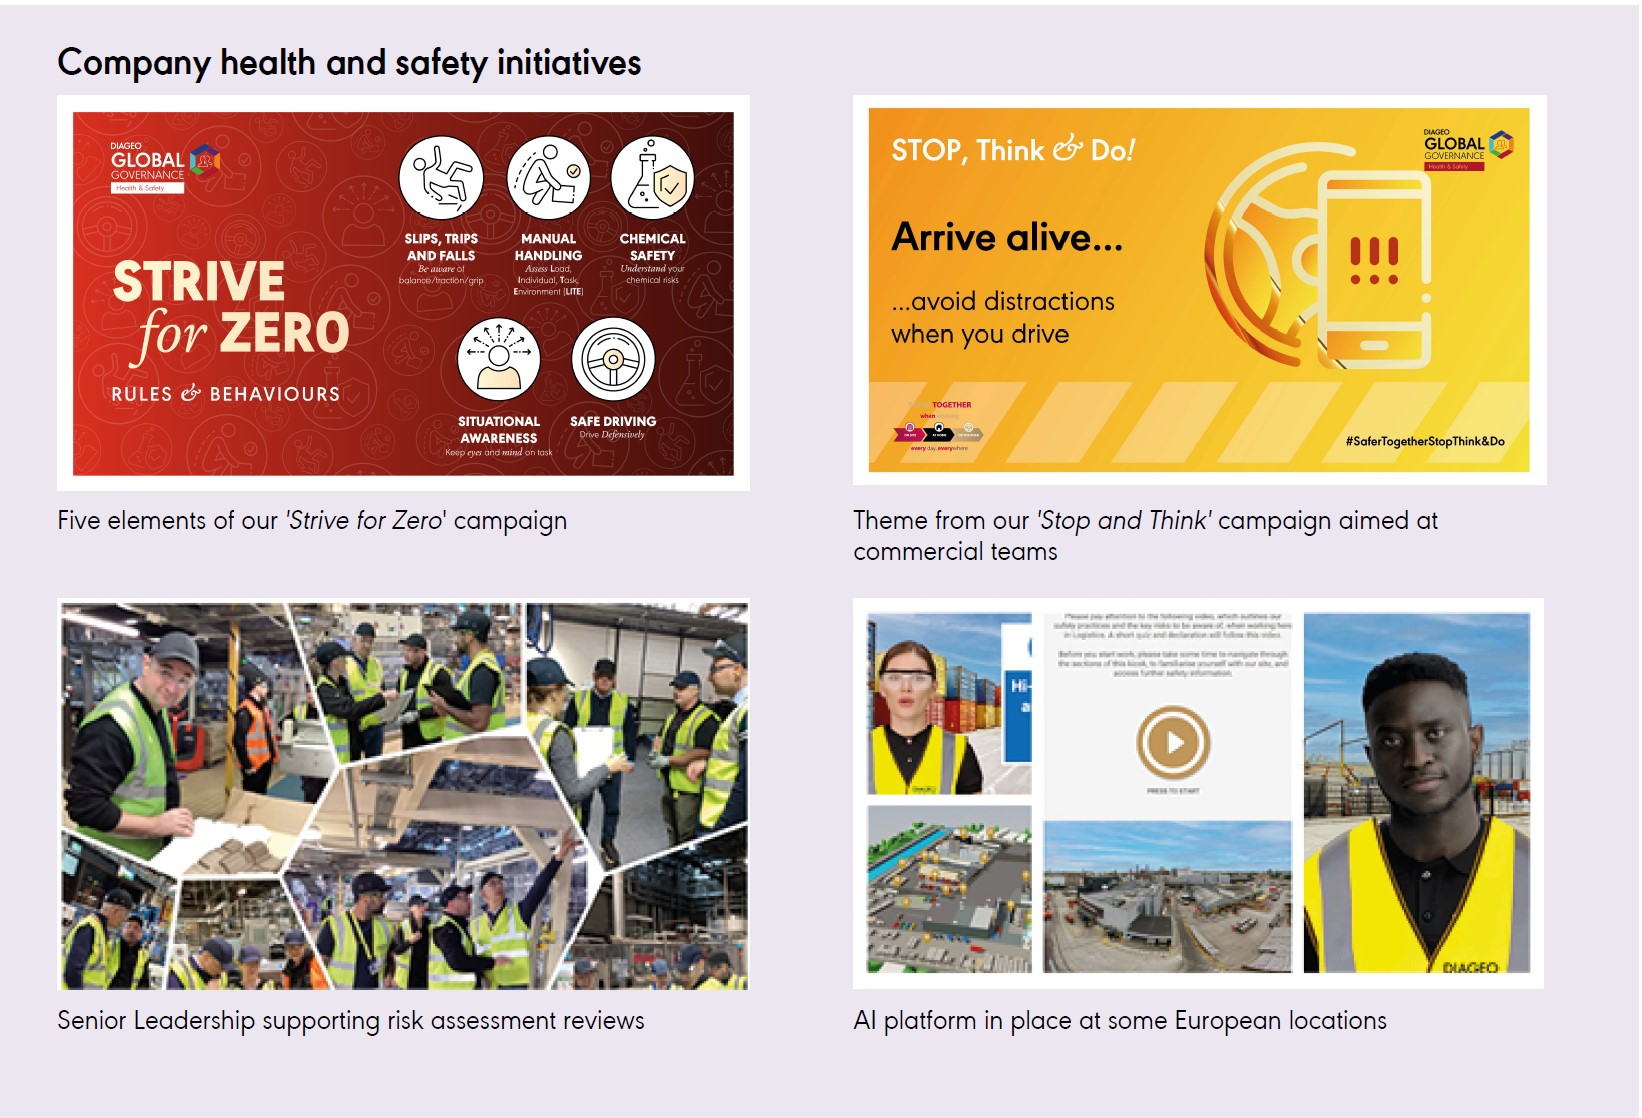
Health and safety We prioritise the health and safety of our people throughout our value chain to ensure everyone is safe when working on- site, at home, on the road, every day, everywhere. |
Champion inclusion and diversity Championing inclusion and diversity is at the heart of what we do, and is crucial to our purpose of ‘celebrating life, every day, everywhere’. | ||
Gender representation of our leadership(1), (3) | |||||
Role | Men | % | Women | % | Total |
Leadership population(2) | 327 | 56% | 258 | 44% | 585(3) |
Ethnic representation of our leadership(1), (4) | |||||||||
Role | Ethnically diverse | % | Non- ethnically diverse | % | Decline to self- identify | % | Not disclosed | % | Total |
Leadership population(2) | 259 | 46% | 270 | 47% | 19 | 3% | 20 | 4% | 568 |
Building a thriving and inclusive hospitality industry | ||||
Ambition by 2030 Provide business and hospitality skills to 200,000 people, increasing employability and improving livelihoods through Learning for Life and our other skills programmes | Number of people reached through Learning for Life and other skills programmes in fiscal 24 | |||
36k | ||||

n | 2030 Target | 200k | ||
n | 2023 progress to date | 62k | ||
n | 2024 progress to date | 98k | ||
Managing climate and nature risks and opportunities by pioneering grain-to-glass sustainability Our business depends on natural resources and we are directly affected by changes in climate and the related challenges of nature loss, particularly freshwater. We continue to address the risks and opportunities that climate change and nature pose to our business through focused programmes on our most material risks, and greatest opportunities. | ||
Board oversight | Audit Committee | |||||||
Executive Committee ownership | ||||||||
Executive sponsors | ||||||||
President, Global Supply Chain & Procurement and Chief Sustainability Officer | Global Corporate Relations Director | |||||||
Cross-functional Climate and Nature Risk Steering Group | ||||||||
Corporate relations | Supply & Procurement | Strategy | ||||||
Risk | Finance | Legal | Marketin g | |||||
Working groups assigned to address key risks and opportunities identified | ||||||||
Fiscal year | 2021 | 2022 | 2023 | 2024 |
Markets/ regions assessed for physical risks | Largest supply centres •Scotland •North America | Highest water risk •Africa •Mexico •India •Türkiye | Remaining locations •Asia Pacific •Latin America and Caribbean •Europe | Acquisitions and additions to operational footprint •Asia Pacific •North America •Europe |
IPCC scenario | Description |
RCP 4.5 | Warming of 2-3°C by 2100 |
RCP 8.5 | Warming of 4-5°C by 2100 |
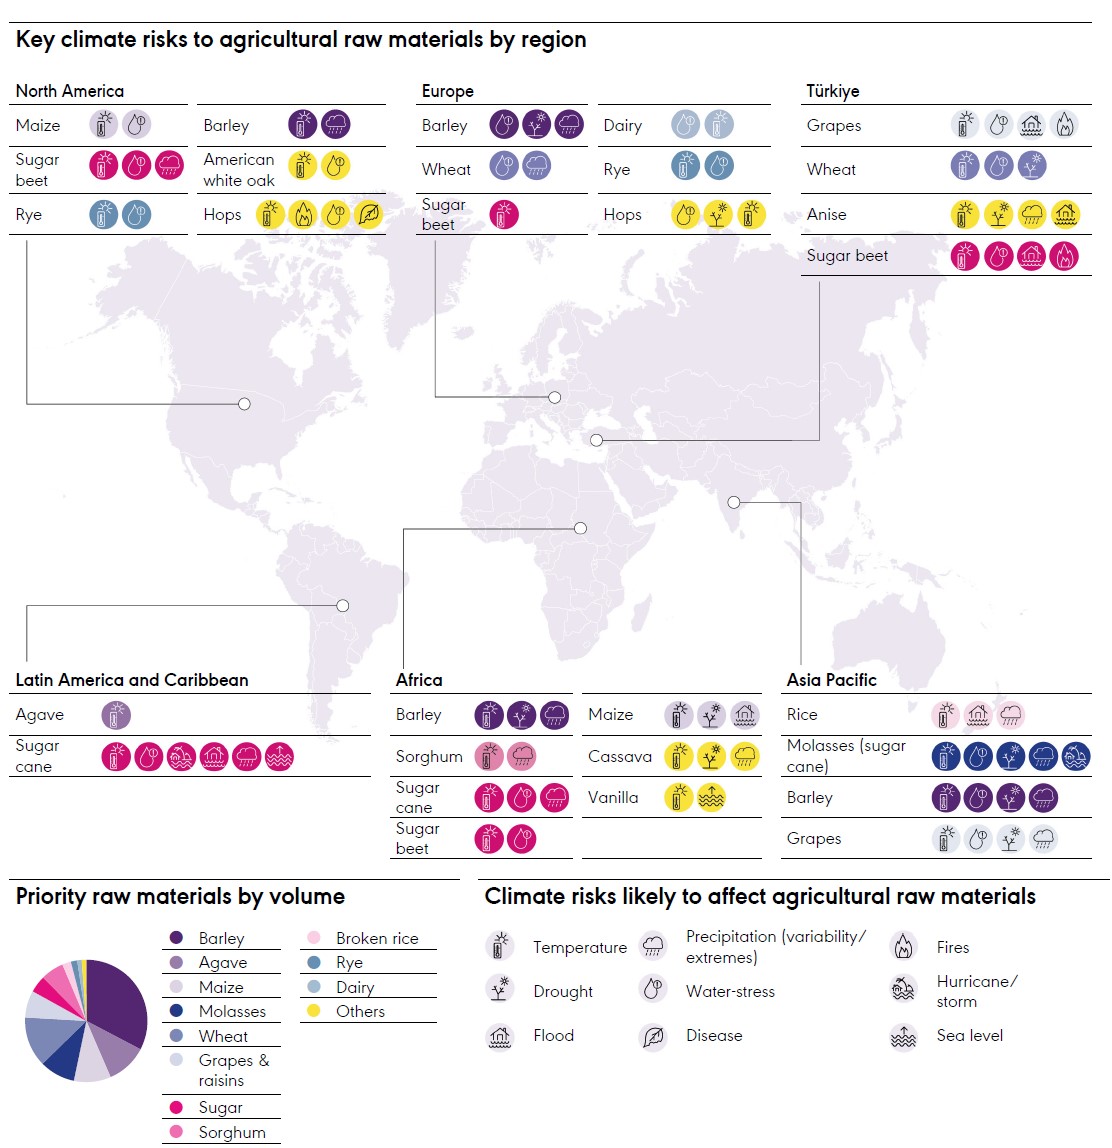
Region | Owned/key third- party sites assessed | Detailed assessments | Agricultural commodities | Supplier assets (factories, warehouses) | Ports |
North America | 14 | 4 | 8 | 86 | 6 |
Europe | 79 | 13 | 18 | 262 | 27 |
Asia Pacific | 70 | 11 | 6 | 281 | 9 |
Latin America and Caribbean | 47 | 6 | 2 | 251 | 13 |
Africa | 48 | 5 | 6 | 366 | 14 |
Total | 258 | 39 | n/a(1) | 1,246 | 69 |
 | For more details on our scenario analysis approach, see the Non-financial reporting boundaries and methodologies section on pages 322-343. |
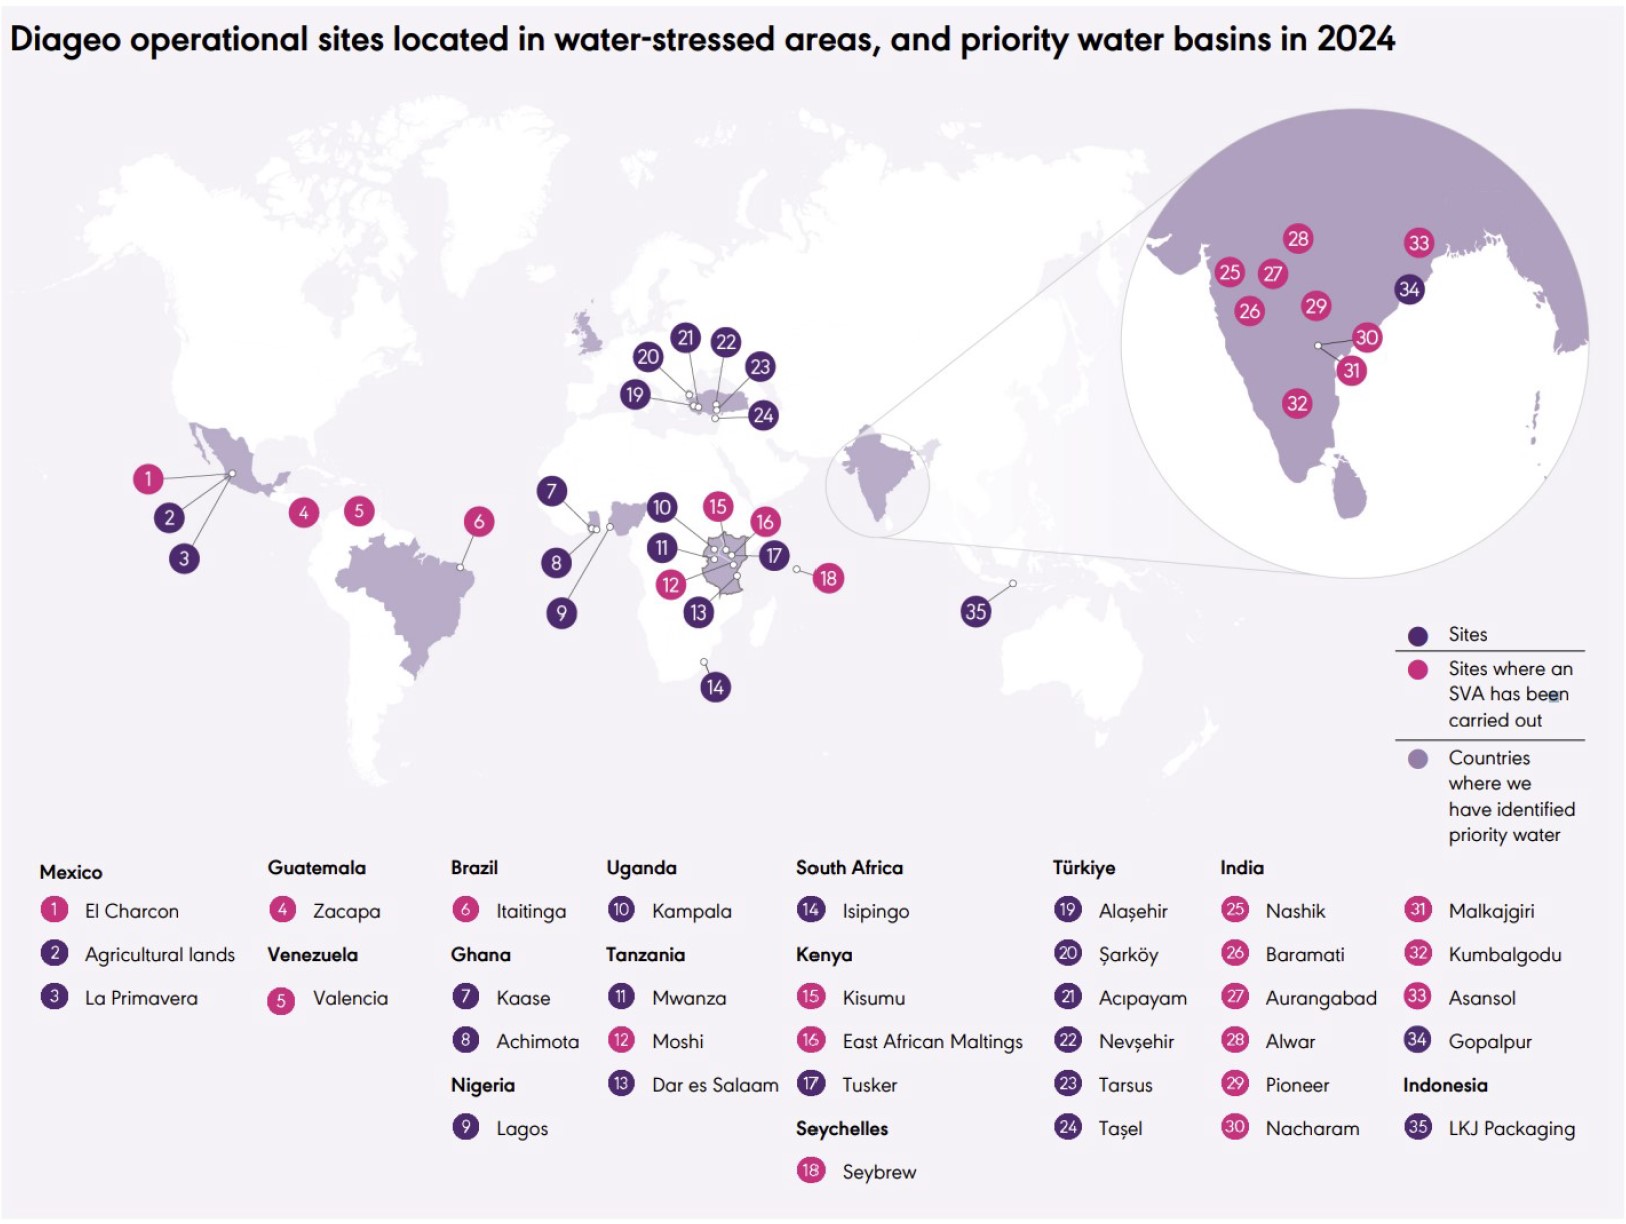
Risks | ||
Risk description | Water scarcity Increasing water scarcity and water-stress affects our ability to continue to source from and produce in water-stressed areas | Agricultural raw material availability Climate-related impacts on agricultural material availability cause scarcity or price increases |
Category | Physical – chronic | Physical – chronic |
Timeframe(1) | Short-term (one to five years), medium-term (five to 10 years) and long-term (10 to 30 years) | Medium-, long-term |
Impact (if not mitigated) | Moderate(2) | Moderate(2) |
Response examples | •Improvements in water use efficiency in our operations, with more ambitious targets at water-stressed sites •Water replenishment plans in 100% of water-stressed areas •Collective action activities to improve water security in Diageo's ‘priority water basins’ •Nature-based solutions that support climate mitigation, adaptation and water replenishment •Exploring alternative formats and ingredients with potential to reduce water use •Rainwater harvesting, Aquifer recharge, Dam de-silting | •Regenerative agriculture adaptations •Smallholder farmer support •Development of drought-resistant ingredients (e.g. sorghum, anise and barley varieties) •Alternative sourcing locations •Substitution with alternative crops •Increased use of cover cropping •Improved water management in agricultural practices |
Risk description | Input costs Policy changes (carbon taxation, shift to renewables) cause increases in input costs | Consumer behaviour Consumers prioritise purchasing more sustainable products, rejecting those perceived to have a negative environmental impact |
Category | Transition – policy/legal | Transition – market |
Timeframe(1) | Short-, medium-term | Short-, medium-, long-term |
Impact (if not mitigated) | Moderate(2) | Moderate(2) |
Response examples | Supply chain decarbonisation Engaging suppliers in low-carbon technology options for their operations Reduced packaging weight | Reduced packaging weight Increased recycled content in packaging Developing circular product offerings Purchasing more sustainably-grown raw materials Communicating these changes to consumers |
Opportunities | ||
Opportunity description | Supply chain decarbonisation Reducing our Scope 1, 2 and 3 emissions lowers our exposure to carbon taxes and related costs, and improves our reputation with customers and consumers | Innovation in sustainable products and packaging Developing more sustainable products meets consumers increasing demands |
Category | Transition – policy/legal | Transition – market |
Timeframe(1) | Short-, medium-term | Short-, medium-term |
Impact (if not realised) | Moderate(2) | Moderate(2) |
Response examples | •Decarbonisation programme and capital investment in our operations •Renewable energy investments •Regenerative agriculture programme •Collaboration, partnerships and capability building within our supply chain | •Innovation to deliver more sustainable products (e.g. refillable and reusable packaging, alternative packaging materials) •ecoSPIRITS (reusable glass packaging format), lower waste, lower carbon distribution technology |
Water efficiency | ||||
Target by 2030 Reduce water use in our operations with a 40% improvement in water use efficiency in water-stressed areas | Percentage change in water efficiency index from the prior year – in water-stressed areas | |||
(6.2)% | ||||
Target by 2030 Reduce water use in our operations with a 30% improvement across the company | Percentage change in water efficiency index from the prior year – across the company | |||
(3.7)% |
Water replenishment | ||||
Target by 2026 Replenish more water than we use for operations in water-stressed areas | Cumulative change in volumetric replenishment capacity of projects developed from fiscal 16 to fiscal 24 | |||
70% | ||||

n | 2026 Target | 100% | ||
n | 2023 progress to date | 71.5% | ||
n | 2024 progress to date | 70.0% | ||
Water collective action | ||||
Target by 2030 Engage in collective action in all priority water basins to improve water accessibility, availability and quality and contribute to net positive water impact | Percentage of priority water basins with collective action participation | |||
67% | ||||
12 |

n | 2030 Target | 12 | ||
n | 2023 progress to date | 6 | ||
n | 2024 progress to date | 8 | ||
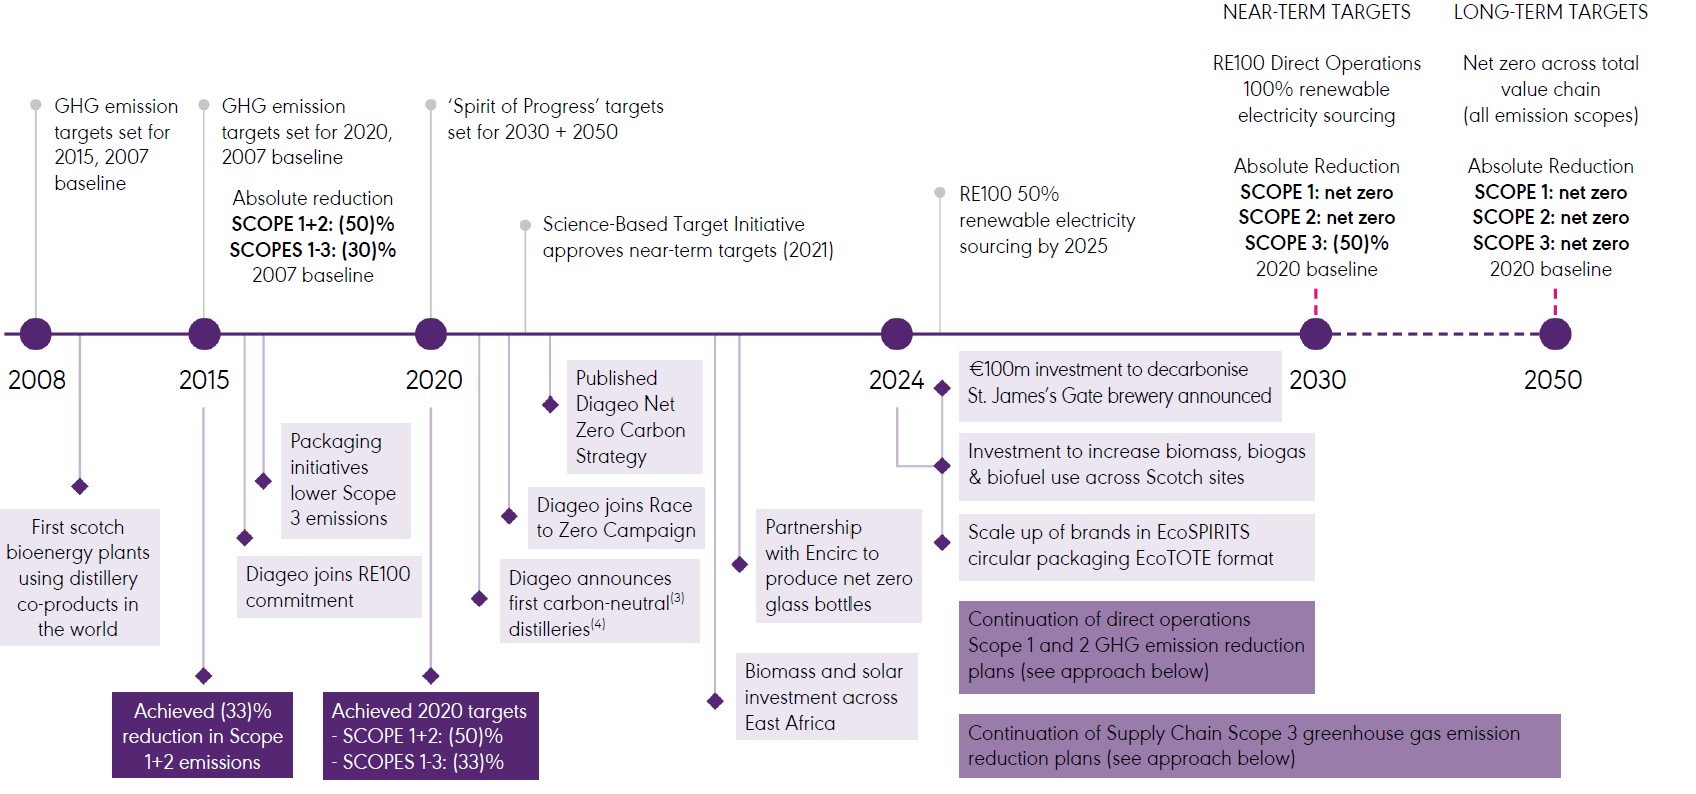
Our approach to delivery | ||||
Scope 1 (6%)(2) | Scope 2 (0.1%)(2) | Scope 3 (94%)(2) | ||
1.Embedding energy efficiency into our processes. 2.Progressing to 100% renewable electricity, fuel and heat. 3.Renewable energy certificates, innovations, partnerships and carbon removals to close the gap(1). | 1.Continue to switch to renewable electricity. 2.Create additional renewable energy capacity to power our sites, exporting surplus energy to the local grid, through on-site developments and using power purchase agreements. | For Scope 3 greenhouse gas emissions, we will shift our focus to delivering triple wins through a refreshed strategy focusing on three pillars of engagement, prioritising our level of engagement and investment to where we have the greatest level of control and in those areas that are most critical to our license to operate. These three workstreams include 1) Diageo enabled projects, 2) Strategic innovation and 3) Selective engagement (collaborative action). | ||
Enabled by scalable technology and process innovations and transformational partnerships to decarbonise the end-to-end supply chain. | ||||
Emissions from our direct operations | ||||
Target by 2030 Become net zero carbon in our direct operations (Scope 1 and 2) | Percentage change in absolute greenhouse gas emissions (direct and indirect greenhouse gas emissions by weight (market/net based)) from the prior year | |||
(10.7)% | ||||
Total direct and indirect greenhouse gas emissions by region by year | |||||
Total direct and indirect greenhouse gas emissions by weight (market/net based) (1,000 tonnes CO2e) | |||||
Region | 2020 | 2022 | 2023 | 2024 | |
North America | 127 | 100 | 83 | 86 | |
Europe | 152 | 145 | 195 | 179 | |
Asia Pacific | 32 | 10 | 9 | 7 | |
Latin America and Caribbean | 22 | 38 | 25 | 9 | |
Africa | 137 | 132 | 89 | 77 | |
Diageo (total) | 470 | 424 | 401 | 358 | |
Streamlined Energy and Carbon Reporting (SECR) | |||||
2020 | 2021 | 2022 | 2023 | 2024 | |
Total Global energy consumption (MWh) | 3,310,508 | 3,396,078 | 3,560,231 | 3,502,997 | 3,459,068 |
Market based (net) intensity ratio of GHG emissions (g CO2e per litre of packaged product) | 139 | 122 | 105 | 105 | 96 |
Total UK energy consumption (MWh) | 1,056,931 | 1,064,795 | 1,091,153 | 1,244,375 | 1,247,734 |
Direct (MWh) | 924,022 | 927,917 | 951,302 | 1,097,353 | 1,092,867 |
Indirect (MWh) | 132,910 | 136,878 | 139,851 | 147,021 | 154,867 |
Total UK direct and indirect GHG emissions (kt CO2e) | 86 | 71 | 84 | 136 | 121 |
Scope 1 | 86 | 71 | 84 | 136 | 121 |
Scope 2 | 0 | 0 | 0 | 0 | 0 |
Emissions from across our value chain | ||||
Target by 2030 Reduce our value chain (Scope 3) carbon emissions by 50% | Percentage change in absolute greenhouse gas emissions (ktCO2e) from the prior year | |||
(5.0)% | ||||
Regenerative agriculture programmes | ||||
Target by 2030 Develop regenerative agriculture programmes in five key sourcing landscapes | Number of regenerative agriculture programmes initiated | |||
3 | ||||

n | 2030 Target | 5 | ||
n | 2023 progress to date | 1 | ||
n | 2024 progress to date | 4 | ||
Reducing packaging weight and increasing recycled content | ||||
Target by 2030 Continue our work to reduce total packaging and increase recycled content in our packaging (delivering a 10% reduction in packaging weight and increasing the percentage of recycled content in our packaging to 60%) | Percentage change of total packaging (by weight) in fiscal 24 | |||
(14)% | ||||
Change in percentage of recycled content (by weight) in fiscal 24 | ||||
3% | ||||

n | 2030 Target | 60% | ||
n | 2023 progress to date | 39% | ||
n | 2024 progress to date | 42% | ||
TCFD recommendation | Consistency |
GOVERNANCE See page 113 | |
a.Describe the board’s oversight of climate-related risks and opportunities. | Yes. See page 113. |
b.Describe management’s role in assessing and managing climate-related risks and opportunities. | |
RISK MANAGEMENT See pages 114-121 | |
a.Describe the organisation’s processes for identifying and assessing climate-related risks. | Yes. See pages 114-120. Having completed comprehensive risk assessments our focus is now on ensuring appropriate adaptation plans are in place for all risks identified. |
b.Describe the organisation’s processes for managing climate- related risks. | |
c.Describe how processes for identifying, assessing and managing climate-related risks are integrated into the organisation’s overall risk management. | |
STRATEGY See pages 121-130 | |
a.Describe the climate-related risks and opportunities the organisation has identified over the short-, medium-, and long-term. | We have described risks and opportunities for our business, in all of our owned, operating locations and our most important third-party operations, as well as the impact of those risks and opportunities on our strategy. We have modelled the resilience of our strategy under three climate-related scenarios. See pages 323-325. We have co-developed a scenario analysis tool with climate experts to enable regular updates to our scenario analyses. |
b.Describe the impact of climate-related risks and opportunities on the organisation’s businesses, strategy and financial planning. | |
c.Describe the resilience of the organisation’s strategy, taking into consideration different climate-related scenarios, including a 2°C or lower scenario. | |
METRICS & TARGETS See pages 121-130 | |
a.Disclose the metrics used by the organisation to assess climate-related risks and opportunities in line with its strategy and risk management process. | Yes. See pages 121-130. |
b.Disclose Scope 1, Scope 2 and, if appropriate, Scope 3 greenhouse gas (GHG) emissions and the related risks. | Yes for Scope 1 and 2. See page 127. We are working with global GHG accounting bodies and our suppliers to get more detailed Scope 3 data. As we refine our value chain data, we can be more specific about our GHG footprint. |
c.Describe the targets used by the organisation to manage climate-related risks and opportunities and performance against targets. | Yes. See pages 121-130. |
Annual Report Where we present our most material disclosures and describe how our strategy delivers value for our business and other stakeholders. The performance of non-financial KPIs are integrated into the relevant focus area sections. The document also includes detailed non-financial reporting boundaries and methodologies. | Diageo.com Where, through the ‘Spirit of Progress‘ section, we give more details of our approach and performance, with examples of our strategy in action. | ESG Reporting Index Where we provide additional disclosures in line with the GRI (Global Reporting Initiative) Standards, UNGC advanced reporting criteria index and our response to the Sustainability Accounting Standards Board (SASB). |
Reporting requirement as per Companies Act 2006 414CA and 414CB | Focus area | Read more in Diageo's reports | Relevant policies, standards or documents | Page reference | |
Environmental matters | |||||
1(a) environmental matters (including the impact of the company’s business on the environment) | ‘Spirit of Progress‘ | •Global Environment Policy(1) •Sustainable Agriculture Guidelines(1) •Sustainable Packaging Commitments(1) •Partnering with Suppliers Standard(1) •Deforestation Guidelines(4) •Water Stewardship Strategy(4) •Net Zero Carbon Strategy(4) •Reinventing Packaging Strategy(4) •Diageo Water Collective Action Implementation Guide(4) | p.97-99 | ||
Pioneer grain-to- glass sustainability | |||||
Our people | |||||
1(b) the company’s employees | Our people and culture | •Talent and diverse workforce •Culture •Gender and ethnic diversity •Inclusive hospitality industry and communities •Progressive marketing •Diverse suppliers | •Code of Business Conduct(2) •Great Britain / Scotland and Republic of Ireland Gender Pay Gap Report 2023(4) •Global Human Rights Policy(1) •Directors' Remuneration Policy(4) | p.105-107 | |
Champion inclusion and diversity | |||||
Health and safety | •Embedding culture of health and safety | •Global Health, Safety and Wellbeing Policy(1) | p.107-109 | ||
1(c) social matters | ‘Spirit of Progress‘ | p.97-99 | |||
Promote positive drinking | •Tackling underage drinking •Changing attitude to drink driving •Make moderation aspirational •Marketing in a responsible way | •Global Marketing and Digital Marketing Policy(1) •Global Employee Alcohol Policy(1) | p.100-103 | ||
Human rights | |||||
1(d) respect for human rights | Human rights | •Standing up for human rights | •Global Human Rights Policy(1) •Modern Slavery Statement(3) •Global Brand Promoter Standard(1) •Privacy Policy(1) | p.103-105 | |
Anti-bribery and corruption | |||||
1(e) anti-corruption and anti-bribery matters | Doing business the right way | •Code of Business Conduct(1) •Privacy Policy(1) •Global Tax Policy(1) •Global Information Management and Security Policy(4) | p.103-105 | ||
Business model | |||||
2(a) a brief description of the company’s business model | Diageo's business model | •Strategic Report •Business integrity •Assessing risk •Engaging stakeholders | p.23-37 | ||
Risk management | |||||
2(d) a description of the principal risks relating to the matters mentioned in subsection | Our principal risks and risk management | •Effective risk management •Principal risks | •Global Quality Policy(1) •Business Continuity Management Standard(4) •Risk Management Standard(4) | p.134-144 p.176 | |
Viability statement | •Viability statement | ||||
Reporting requirement as per Companies Act 2006 414CA and 414CB | Focus area | Read more in Diageo's reports | Relevant policies, standards or documents | Page reference | |
Non-financial performance | |||||
2(e) a description of the non-financial key performance indicators relevant to the company’s business | Our performance: monitoring performance and progress | •Our performance •‘Spirit of Progress’ | p.41-42 | ||
Climate-related financial disclosures as required by sections 414CA and 414CB of the Companies Act 2006 | |||||
(a) description of the company’s governance arrangements in relation to assessing and managing climate-related risks and opportunities; | Pioneer grain-to- glass sustainability | •Identifying climate risks and opportunities •Governance | See above under Environmental matters | p.113 | |
(b) a description of how the company identifies, assesses, and manages climate-related risks and opportunities; | •Identifying climate risks and opportunities | p.114-121 | |||
(c) a description of how processes for identifying, assessing, and managing climate-related risks are integrated into the company’s overall risk management process; | •Our principal risk and risk management •Identifying climate risks and opportunities | p.134-144 p.114-121 | |||
(d) a description of— (i) the principal climate-related risks and opportunities arising in connection with the company’s operations, and | •Our principal risk and risk management •Identifying climate risks and opportunities | p.134-144 p.114-121 | |||
(d) a description of—(ii) the time periods by reference to which those risks and opportunities are assessed; | •Identifying climate risks and opportunities •Quantitative impact of transitions risks and opportunities •Our pathway to net zero | p.114-121 | |||
(e) a description of the actual and potential impacts of the principal climate-related risks and opportunities on the company’s business model and strategy; | •Identifying climate risks and opportunities •Identifying and assessing our transitions risks and opportunities | p.114-121 | |||
(f) an analysis of the resilience of the company’s business model and strategy, taking into consideration different climate-related scenarios; | •Climate change resilience •Viability statement •Scenario analysis of physical risks | p.114-121 and p.176 | |||
(g) a description of the targets used by the company to manage climate-related risks and to realise climate-related opportunities and of performance against those targets; and | •Our strategy for grain-to-glass sustainability | p.114-130 | |||
(h) a description of the key performance indicators used to assess progress against targets used to manage climate- related risks and realise climate-related opportunities and of the calculations on which those key performance indicators are based | •Our strategy for grain-to-glass sustainability | p.114-130 | |||
Compliance with the UK Corporate Governance Code | ||||||||
The Board considers that, for the year ended 30 June 2024, Diageo has fully applied the Principles and complied with the Provisions of the UK Corporate Governance Code 2018 (the Code). | ||||||||
The table below details where content complying with the Code's requirements can be found. | ||||||||
| Visit diageo.com for more information. | |||||||
1 | Board Leadership & Company Purpose | |||
A. | Board of Directors | Board of Directors | 154 | |
Board Chair Succession | 189 | |||
Performance Evaluation | 190 | |||
B. | Purpose, Values and Culture | Our Business Today | 13 | |
’Spirit of Progress’ | 97 | |||
C. | Resources and Control Framework | Business Model | 23 | |
Our Principal Risks and Risk Management | 134 | |||
Corporate Governance Structure and Division of Responsibilities | 153 | |||
D. | Stakeholder Engagement | Stakeholder Engagement | 165 | |
Section 172 Statement | 19 | |||
E. | Workforce Policies and Practices | Our Business Today | 13 | |
’Spirit of Progress’ | 97 | |||
Doing Business the Right Way | 103 | |||
Business Integrity Programmes | 182 | |||
2 | Division of Responsibilities | |||
F. | Role of the Chair | Letter from the Chairman of the Board of Directors | 148 | |
Corporate Governance Structure and Division of Responsibilities | 153 | |||
Performance Evaluation | 190 | |||
G. | Division of Responsibilities | Corporate Governance Structure and Division of Responsibilities | 153 | |
Composition of Board | 158 | |||
H. | Role of the Non- Executive Director | Corporate Governance Structure and Division of Responsibilities | 153 | |
Board of Directors | 154 | |||
I. | Board Policies, Process, Information, Time and Resources | How our Board monitors Culture | 175 | |
Duties of the Board | 158 | |||
Board Activities | 162 | |||
3 | Composition, Succession and Evaluation | ||
J. | Appointments to the Board | Board Chair Succession | 189 |
Champion Inclusion and Diversity | 110 | ||
Recruitment and election procedures | 188 | ||
K. | Board Skills, Experience and Knowledge | Composition of the Board | 158 |
L. | Board Evaluation | Performance evaluation | 190 |
4 | Audit, Risk and Internal Controls | ||
M. | Independence, and Effectiveness of Internal and External Auditors | Audit Committee Report | 178 |
N. | Fair, Balanced, and Understandable Assessment | Director's Confirmations | 177 |
O. | Risk and Internal Controls | Corporate Governance Structure and Division of Responsibilities | 153 |
Our Principal Risks and Risk Management | 134 | ||
5 | Remuneration | ||
P. | Alignment to Purpose, Values and Long-Term Success | Remuneration Committee Chair's letter | 192 |
Remuneration at a Glance | 195 | ||
Director's Remuneration Policy | 200 | ||
Q. | Remuneration Policy | Remuneration Committee Chair’s letter | 192 |
Director’s remuneration policy | 200 | ||
R. | Independent Judgement and Discretion | Remuneration Committee Chair’s letter | 192 |
Consideration of wider workforce remuneration | 205 | ||
Fiscal 24 Board Attendance | Annual General Meeting 2023 | Board (maximum 6) | Audit Committee (maximum 5) | Nomination Committee (maximum 6) | Remuneration Committee (maximum 6) |
Javier Ferrán | ü | 6/6 | — | 5/6 | — |
Debra Crew | ü | 6/6 | — | — | — |
Lavanya Chandrashekar | ü | 6/6 | — | — | — |
Susan Kilsby | ü | 6/6 | 5/5 | 6/6 | 6/6 |
Melissa Bethell | ü | 6/6 | 5/5 | 6/6 | 6/6 |
Karen Blackett | ü | 6/6 | 4/5 | 6/6 | 5/6 |
Valérie Chapoulaud-Floquet | ü | 5/6 | 4/5 | 5/6 | 5/6 |
Sir John Manzoni | ü | 6/6 | 5/5 | 5/6 | 6/6 |
Alan Stewart | ü | 6/6 | 5/5 | 6/6 | 6/6 |
Ireena Vittal | ü | 6/6 | 5/5 | 6/6 | 6/6 |
Former Directors | |||||
Lady Mendelsohn(1) | N/A | 1/1 | 1/1 | 1/1 | 1/1 |
Highlights of fiscal 24 | |||
•Shaping Diageo's future through our business transformation projects, across our supply chain and systems infrastructures, and the strategy refresh which led to creation of the Growth Ambition. •Announcing changes in key Board roles to build our strong leadership during the next few months and into the second half of fiscal 25. •Refocusing our culture on our core values and behaviours to embed agility and maintain our highly engaged, talented and diverse workforce. | |||
Read more on pages 170, 173 and 175 | |||
Diversity | |||
Diageo has a long-standing commitment to being an inclusive and diverse organisation, including at the most senior leadership levels. Our diverse Board composition has enabled Diageo to be ranked as one of the best performing FTSE 100 companies in terms of female representation, as recognised by the FTSE Women Leaders Review, and has met the Parker Review's target as to ethnic minority representation. As an example, three of the Board's most critical roles, Chief Executive, Chief Financial Officer and Senior Independent Director, are held by women. | |||
Read more on pages 190-191 | |||
Building our leadership | |||
During the year, the Nomination Committee and Board has been creating the leadership required at Board and Executive Committee levels to continue growing Diageo's business, including enabling smooth transitions in key roles including that of the Board Chair, Audit Committee Chair and Chief Financial Officer. | |||
Board composition | |||
ò | Chair |
ò | Executive director |
ò | Non-executive director |
Purpose, values and culture | |||
The Board has a critical role in monitoring the degree to which culture and values are embedded within the company. A key part of this is the Board’s workforce engagement programme which, during fiscal 24, enabled Non-Executive Directors, usually in pairs, to engage directly with over 500 colleagues from 12 markets and all functions, through eight virtual and seven in-person focus group sessions. Subjects being discussed varied broadly with a separate session being held on executive remuneration and reward policy. Attendee sentiment was also captured through a confidential survey following each session. | |||
See pages 172-173 for details of the feedback received | |||
Strategy refresh | |||
Recognising the scale of Diageo's growth over the past several years and informed by shorter term external challenges, the Chief Executive has undertaken a review of Diageo's strategy during fiscal 24. This review has led to the launch of the Growth Ambition to focus priorities and drive future growth, which was approved by the Board at the Annual Strategy Conference in April 2024. | |||
Read more on page 170 | |||
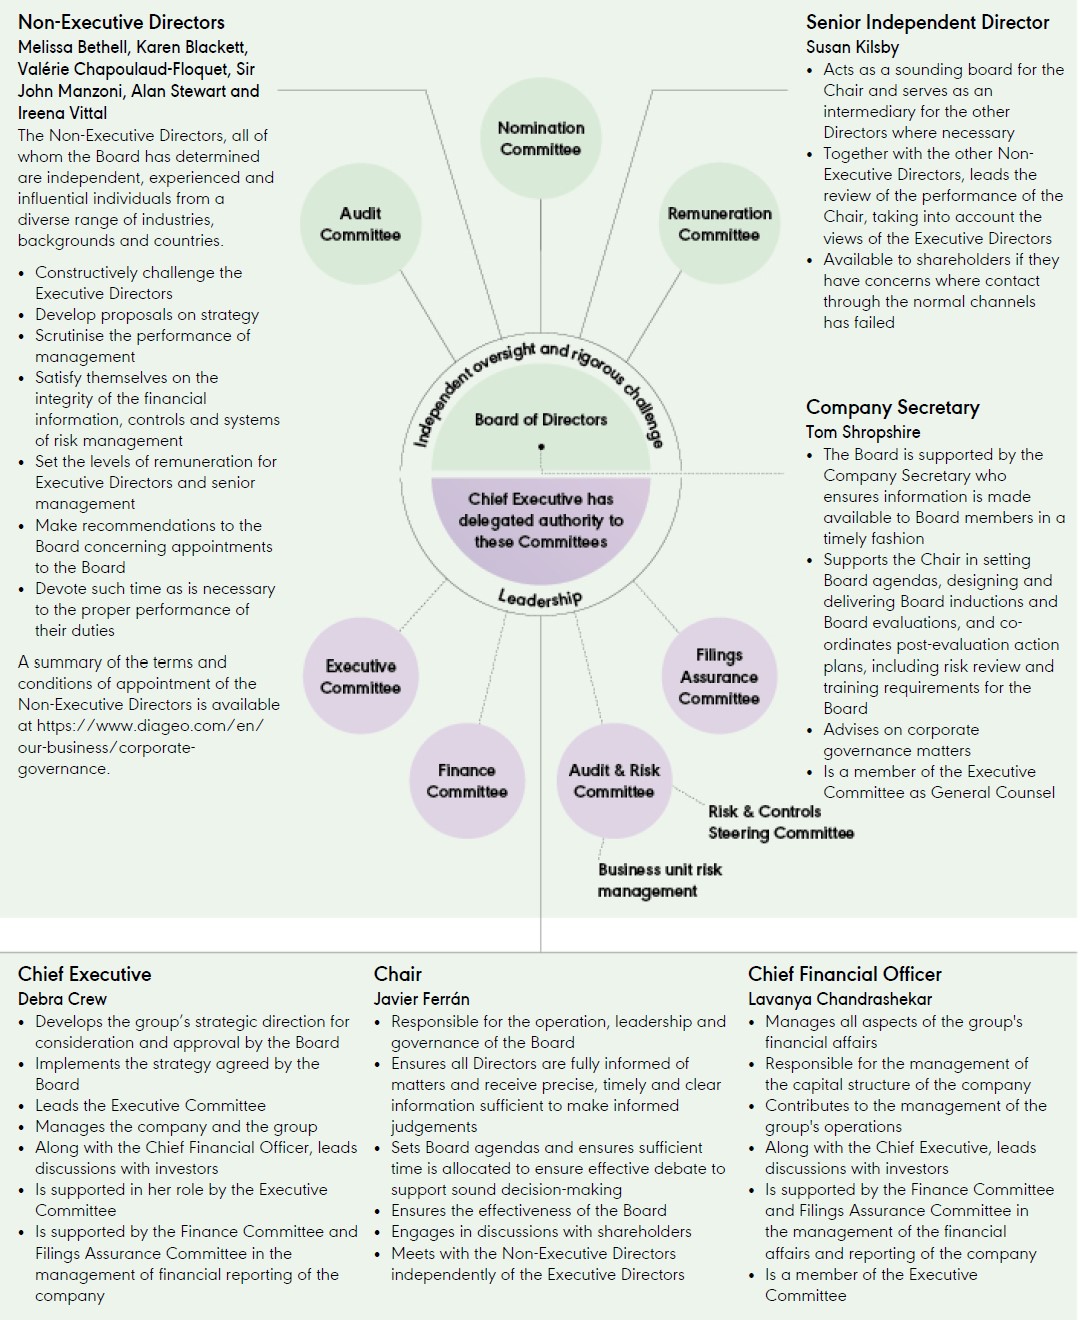
Position | Board skills and competencies | Key external appointments | ||
Javier Ferrán  | Key strengths: Brings extensive board-level experience from the drinks and consumer products industry, including at chief executive level, and has a wealth of experience in consumer goods through his venture capital activities to draw from in his role as Chair and leader of the Board | Current external appointments: Chair, International Consolidated Airlines Group, S.A. Previous relevant experience: Non-Executive Director and Senior Independent Director, Associated British Foods plc; Non-Executive Director, Coca-Cola European Partners plc; Member, Advisory Board of ESADE Business School; President and CEO, Bacardi Limited; Non-Executive Director, SABMiller plc | ||
Chair | ||||
Nationality: Spanish | ||||
Appointed: Chair and Chair of the Nomination Committee: January 2017 (Appointed Chair Designate and Non-Executive Director: July 2016) | ||||
Debra Crew  | Key strengths: Has broad experience in various consumer products sectors at board, chief executive and management leadership levels, as well as over five years' experience in non- executive and executive roles at Diageo | Current external appointments: Non-Executive Director, Stanley Black & Decker, Inc. Previous Diageo roles: Interim Chief Executive; Chief Operating Officer; President, North America; Non-Executive Director, Diageo plc Previous relevant experience: Non-Executive Director, Newell Brands, Mondelēz International Inc.; President and CEO, Reynolds American, Inc; President, PepsiCo North America Nutrition, PepsiCo Americas Beverages, Western Europe Region; various positions with Kraft Foods, Nestlé, S.A., and Mars | ||
Chief Executive | ||||
Nationality: American | ||||
Appointed: Chief Executive and Executive Director: June 2023 | ||||
Lavanya Chandrashekar | Key strengths: Brings broad financial expertise, commercial skills and strong consumer goods experience to manage the group’s affairs relating to financial controls, accounting, tax, treasury and investor relations | Previous Diageo roles: Chief Financial Officer, Diageo North America and Global Head of Investor Relations Previous relevant experience: VP Finance, Global Cost Leadership and Supply Chain, Mondelēz International; VP Finance, North America, Mondelēz International; VP Finance, Eastern Europe, Middle East and Africa, Mondelēz International; various senior finance roles at Procter & Gamble | ||
Chief Financial Officer | ||||
Nationality: American | ||||
Appointed: Chief Financial Officer and Executive Director: July 2021 | ||||
Susan Kilsby  | Key strengths: Brings wide- ranging corporate governance and board- level experience across a number of industries, including a consumer goods sector focus, with particular expertise in mergers and acquisitions, corporate finance and transaction advisory work | Current external appointments: Non-Executive Chair, Fortune Brands Innovations, Inc.; Non-Executive Director and Chair of Corporate Responsibility Committee, Unilever PLC; Non- Executive Director and Chair of Talent and Remuneration Committee, COFRA Holding AG; Member and Chair of Remuneration Committee, the Takeover Panel Previous relevant experience: Senior Independent Director and Chair of Remuneration Committee, BHP Group Plc, BHP Group Limited; Senior Independent Director, BBA Aviation plc; Chair, Shire plc; Chair, Mergers and Acquisitions EMEA, Credit Suisse; Non- Executive Director, Goldman Sachs International, Keurig Green Mountain, L’Occitane International, Coca-Cola HBC, NHS England | ||
Senior Independent Director | ||||
Nationality: American/British | ||||
Appointed: Senior Independent Director: October 2019 (Appointed Non-Executive Director: April 2018 and Chair of the Remuneration Committee: January 2019) | ||||
Melissa Bethell  | Key strengths: Has extensive international corporate and financial experience, including in relation to private equity, financial sectors, strategic consultancy and advisory services, as well as having strong non-executive experience at board and committee levels across a range of industries, including retail, consumer goods and financial services | Current external appointments: Non-Executive Director, Tesco PLC, Exor N.V.; Senior Advisor and Director of investee companies, Atairos Europe Previous relevant experience: Managing Director and Senior Advisor, Private Equity, Bain Capital; Non-Executive Director, Atento S.A., Worldpay plc, Samsonite S.A. | ||
Non-Executive Director | ||||
Nationality: American/British | ||||
Appointed: Non-Executive Director: June 2020 |
Board committees |  | Audit Committee |  | Executive Committee |  | Nomination Committee |  | Remuneration Committee |  | Chair of the committee |
Position | Board skills and competencies | Key external appointments | |||
Karen Blackett | Key strengths: Brings expertise in marketing, media and the creative industries, as well as broad experience in public policy and strategic initiatives through a number of different government, industry and public bodies | Current external appointments: Chancellor, University of Portsmouth; Founding Trustee, BEO (Black Equity Organisation); Non-Executive Director, Creative UK Previous relevant experience: UK President, WPP plc; UK Race Equality Business Champion, HM Government; Business Ambassador, Department for International Trade, HM Government; Chairwoman, MediaCom UK & Ireland; Chief Executive Officer, GroupM UK, MediaCom UK; Chief Operations Officer, MediaCom EMEA; Marketing Director, MediaCom; UK Country Manager, WPP plc; Non-Executive Director, The Pipeline | |||
Non-Executive Director | |||||
Nationality: British | |||||
Appointed: Non-Executive Director: June 2022 | |||||
Valérie Chapoulaud-Floquet | Key strengths: Brings strong experience and expertise in the luxury consumer goods sector, having spent her career in the industry working in a number of international markets, including developed and emerging markets, and as a former CEO in the premium drinks industry | Current external appointments: Non-Executive Director, Lead Independent Director and Chair of Governance Committee, Danone S.A.; Non-Executive Director, Acné Studios A.B., Agrolimen S.A., Nextstage S.C.A.; Vice Chair, Sofisport Previous relevant experience: Chief Executive Officer, Rémy Cointreau S.A.; President and CEO for the Americas, Louis Vuitton, LVMH Group; President and CEO for North America, Louis Vuitton, LVMH Group; President South Europe, Louis Vuitton, LVMH Group; President & CEO, Louis Vuitton Taiwan, LVMH Group; President, Luxury Product Division USA, L’Oréal Group; Non-Executive Director, Jacobs Holding AG | |||
Non-Executive Director | |||||
Nationality: French | |||||
Appointed: Non-Executive Director: January 2021 | |||||
Sir John Manzoni | Key strengths: Has strong commercial executive experience as a former CEO in the energy sector and non- executive board-level experience, including in the alcoholic beverage industry, as well as more recent expertise in public policy and government affairs | Current external appointments: Chair, SSE plc; Chair, Atomic Weapons Establishment; Non-Executive Director, KBR Inc Previous relevant experience: Chief Executive of the Civil Service and Permanent Secretary of the Cabinet Office, HM Government; President and Chief Executive Officer, Talisman Energy; Chief Executive, Refining & Marketing, BP p.l.c.; Chief Executive, Gas & Power, BP p.l.c.; Non-Executive Director, SABMiller plc | |||
Non-Executive Director | |||||
Nationality: British | |||||
Appointed: Non-Executive Director: October 2020 | |||||
Alan Stewart  | Key strengths: Has a strong background in financial, investment banking and commercial matters, with particular expertise in consumer retail industries, as well as board and committee- level experience at industry institutions | Current external appointments: Non-Executive Director and Chair of Audit Committee, Burberry Group plc; Partner, Altair Advisory LLP Previous relevant experience: Chief Financial Officer, Tesco PLC; Non- Executive Director, Tesco Bank; Chief Financial Officer, Marks & Spencer Group plc, AWAS; Non-Executive Director, Games Workshop plc; Group Finance Director, WH Smith PLC; Chief Executive, Thomas Cook UK; Non-Executive Director and Chair of the Remuneration Committee, Reckitt Benckiser Group plc | |||
Non-Executive Director | |||||
Nationality: British | |||||
Appointed: Non-Executive Director: September 2014 (Appointed Chair of the Audit Committee: January 2017) | |||||
Ireena Vittal | Key strengths: Brings a wealth of FMCG experience from a career in executive consulting with a focus on consumer sectors and emerging markets, including India, as well as broad experience in non- executive board roles in the UK and India | Current external appointments: Non-Executive Director, Compass plc, Asian Paints Limited; Non-Executive and Lead Independent Director, Godrej Consumer Products Limited; Director and Member, UrbanClap Technologies India Private Limited; Advisory Board Member, Russell Reynolds Associates Previous relevant experience: Head of Marketing and Sales, Hutchinson Max Telecom; Partner, McKinsey and Company; Non-Executive Director, Wipro Limited, Housing Development Finance Corporation Limited, Titan Company Limited, Tata Global Beverages Limited, GlaxoSmithKline Consumer Healthcare | |||
Non-Executive Director | |||||
Nationality: Indian | |||||
Appointed: Non-Executive Director: October 2020 | |||||
Board committees | | Audit Committee | | Executive Committee | | Nomination Committee | | Remuneration Committee | | Chair of the committee | ||
Position | Key external appointments | ||
1 | Ewan Andrew | Current external appointments: Member, Scotch Whisky Association Council, Scottish Business Climate Collaboration Board, One Planet Business for Biodiversity Board, Gartner Executive Advisory Board Previous Diageo roles: Supply Director, International Supply Centre; Senior Vice President, Supply Chain & Procurement, Latin America and Caribbean; Senior Vice President Manufacturing & Distilling, North America; various supply chain, operational management and procurement roles | |
President, Global Supply Chain & Procurement and Chief Sustainability Officer | |||
Nationality: British | |||
Appointed: September 2019 | |||
2 | Alvaro Cardenas | Previous Diageo roles: Managing Director, Andean Region; Director, End-to-End Global Commercial Processes; Finance Director, South East Asia Region, PUB (Paraguay, Uruguay and Brazil) Region, Andean Region, Colombia | |
President, Latin America and Caribbean | |||
Nationality: Colombian | |||
Appointed: January 2021 | |||
3 | Cristina Diezhandino | Previous Diageo roles: Global Category Director, Scotch & Managing Director, Reserve Brands; Managing Director, Caribbean and Central America; Marketing & Innovation Director, Diageo Africa; Category Director, Scotch Portfolio & Gins; Global Brand Director, Johnnie Walker Previous relevant experience: Corporate Marketing Director, Allied Domecq Spain; marketing roles, Unilever HPC US, UK and Spain | |
Chief Marketing Officer | |||
Nationality: Spanish | |||
Appointed: July 2020 | |||
4 | Sally Grimes | Current external appointments: Director, Continental Grains Company Previous relevant experience: Chief Executive Officer, Clif Bar & Company; Group President, Prepared Foods, Tyson Foods; President, International & Chief Global Growth Officer, Tyson Foods; President, Gourmet Food Group and Chief Innovation Officer, Hillshire Brands Company | |
Chief Executive Officer, North America | |||
Nationality: American | |||
Appointed: October 2023 | |||
5 | John Kennedy | Previous Diageo roles: President, Europe and India; President, Europe and Western Europe; Chief Operating Officer, Western Europe; Marketing Director, Australia; General Manager for Innovation, North America; President and Chief Executive Officer, Diageo Canada; Managing Director, Diageo Ireland Previous relevant experience: Brand management roles, GlaxoSmithKline, Quaker Oats | |
President, Europe | |||
Nationality: American | |||
Appointed: January 2024 | |||
6 | Daniel Mobley | Previous Diageo roles: Corporate Relations Director, Europe Previous relevant experience: Regional Head of Corporate Affairs, India & South Asia, Regional Head of Corporate Affairs, Africa, Group Head of Government Relations, Standard Chartered; extensive government experience including in HM Treasury and Foreign & Commonwealth Office | |
Global Corporate Relations Director | |||
Nationality: British | |||
Appointed: June 2017 | |||
7 | Hina Nagarajan | Current external appointments: Non-Executive Director, BP p.l.c. Previous Diageo roles: CEO-Designate, United Spirits Limited; Managing Director, Africa Regional Markets Previous relevant experience: Managing Director, China & SVP North Asia, Reckitt Benckiser; General Manager, Malaysia & Singapore, Reckitt Benckiser; CEO & MD Mary Kay India; senior marketing and general management roles, ICI Paints India and Nestlé India | |
Managing Director and CEO of United Spirits Limited | |||
Nationality: Indian | |||
Appointed: July 2021 | |||
8 | Dayalan Nayager | Previous Diageo roles: President, Africa; Managing Director, Great Britain and Justerini & Brooks, Ireland and France, Global Travel; Regional Director, Global Travel Europe; Commercial Director, South Africa; Customer Marketing Director, South Africa; Key Account Director, South Africa Previous relevant experience: Various positions, Heinz, Mars | |
President, Africa and Chief Commercial Officer | |||
Nationality: South African/British | |||
Appointed: July 2022 | |||
9 | John O'Keeffe | Previous Diageo roles: President, Asia Pacific & Global Travel; President, Africa & Beer; CEO and Managing Director, Guinness Nigeria; Global Head, Innovation; Global Head, Beer and Baileys; Managing Director, Russia and Eastern Europe; various management and marketing positions | |
President, Asia Pacific, Global Travel and India | |||
Nationality: Irish | |||
Appointed: July 2015 |
10 | Louise Prashad | Previous Diageo roles: Global Talent Director; Talent & OE Director, Africa; HR Director, Europe, West Latin America and Caribbean, Global Functions; Talent and Learning Director UK, Ireland and North America; HR Director Great Britain; Global Supply; Global Commercial Previous relevant experience: various HR roles, Stakis Group and Hilton Hotels | |
Chief HR Officer | |||
Nationality: British | |||
Appointed: January 2022 | |||
11 | Tom Shropshire | Current external appointments: Member of the Court (Non-Executive Director), The Bank of England; Trustee, New York University School of Law; Member of the Steering Committee, The Parker Review; Interim Chair, Charity Projects Limited (Comic Relief) Previous relevant experience: Partner & Global US Practice Head, Linklaters LLP | |
General Counsel & Company Secretary | |||
Nationality: American/British | |||
Appointed: July 2021 |
Further details on the Board Committees can be found in the separate reports from each committee on pages 178-224, and details of the Executive Committee can be found on pages 156. |

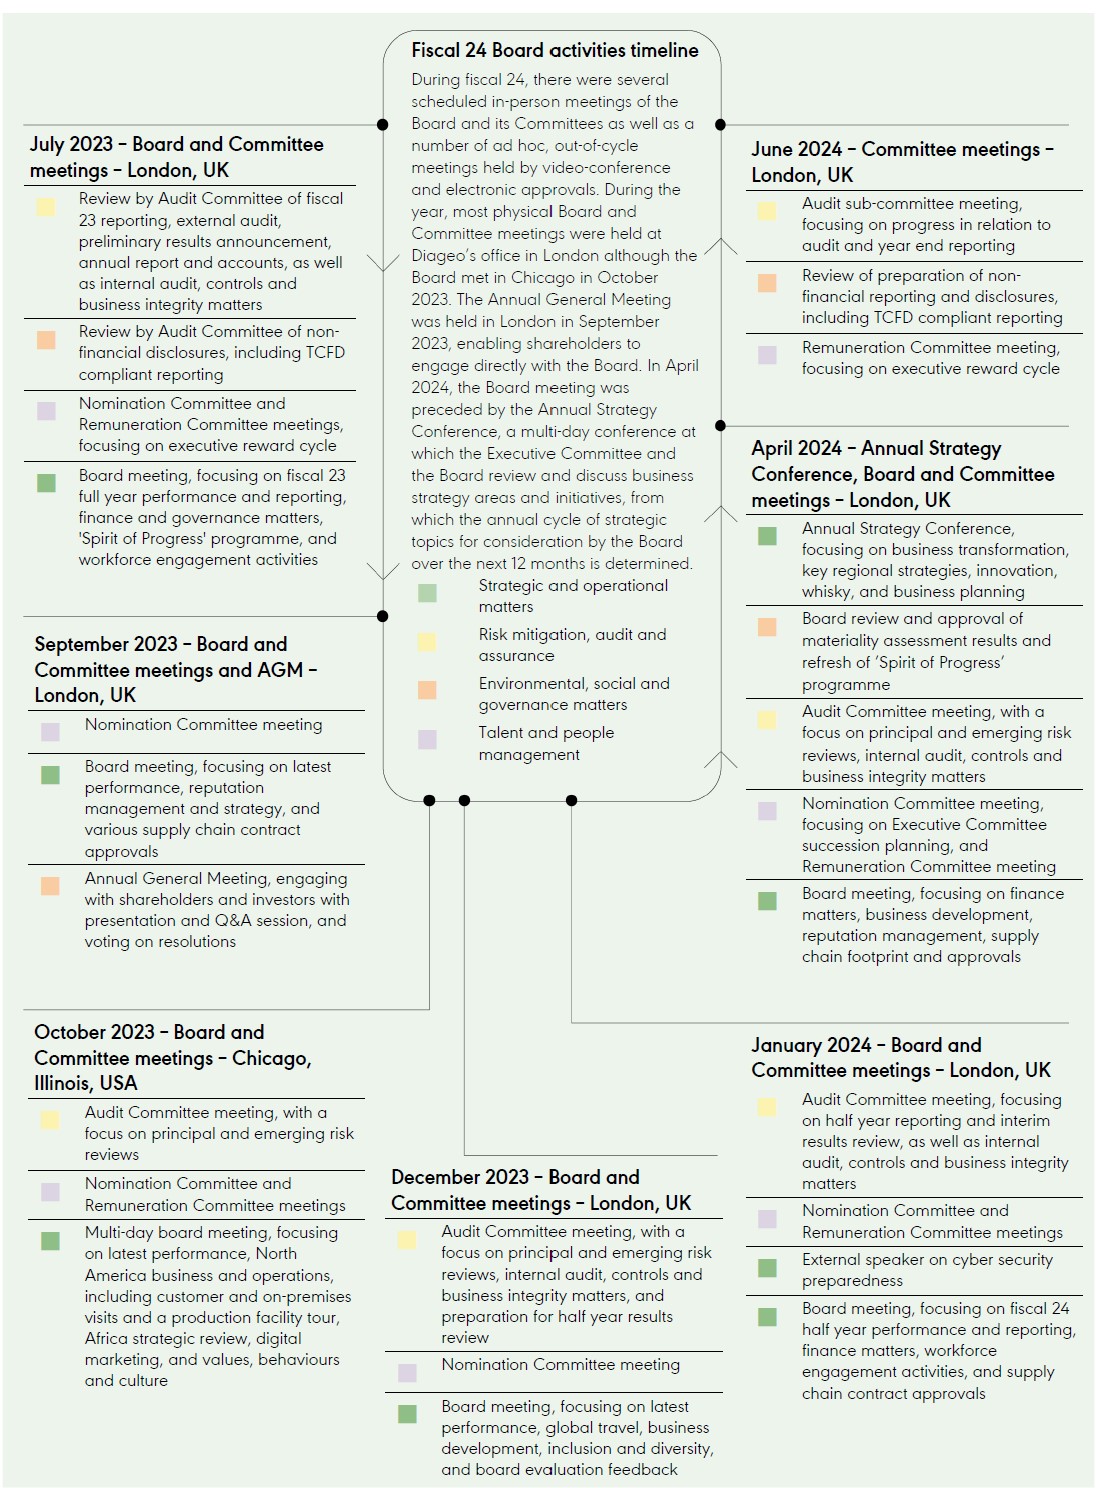
Areas of focus | Strategic outcomes | Stakeholders | |
Strategic matters | •Held a two-day Annual Strategy Conference (ASC) focusing on key strategic matters, including implementation of strategic transformation programmes, regional reviews of North America and Asia Pacific, whisky strategy, developments in the group's ESG programme including ’Spirit of Progress’ •Regularly reviewed the group’s performance against the strategy •Received reports on the financial performance of the group as against the annual plan •Reviewed the group’s governance frameworks for reputation management, tax strategy and policy •Received reports on the macroeconomic environment, socio-political matters and emerging trends •Carried out deep dives into key strategic topics including its operations, portfolio and footprint in North America and Africa, its digital marketing strategy, and its global travel business |   |     |
Operational matters | •Reviewed and approved the group's three-year plan and annual funding plan, insurance, banking and capital expenditure requirements •Regularly reviewed and approved the group’s M&A and business development activities, reorganisations and various other projects •Reviewed the group's internal culture and values, including in respect of diversity and inclusion, values and behaviours •Approved capital expenditure investments, and various significant procurement, systems and other contracts, having taken into consideration financial, operational, sustainability and other ESG related factors •Reviewed the company’s capital allocation, funding and liquidity positions, and those of its pension schemes •Reviewed and approved the company’s return of capital proposals, including interim and final dividends and share buyback programme •Approved new roles and appointments to the Board, including a new future Chair of the Board, a new Chief Financial Officer and a new Chair of the Audit Committee of the Board •Acting through the Nomination Committee, reviewed the company’s succession planning and talent strategy |  |   |
ESG matters | •Supervised conduct of double materiality assessment, reviewed progress in relation to the group's ’Spirit of Progress’ programme and refreshed the programme in light of the initial double materiality assessment results •Received reports on workforce engagement over the year •Received regular investor reports •Received regular updates on ESG matters and progress towards ‘Spirit of Progress‘ targets •Engaged an external facilitator to carry out evaluation of the Board’s performance, reviewed results and agreed action points •Reviewed schedule of matters reserved for the Board and terms of reference of its Committees |  |  |
Assurance and risk management | •Received reports in relation to material legal matters, including disputes, regulatory and governance developments, and areas of legal or regulatory risk •On the recommendation of the Audit Committee, approved the company’s risk footprint, including reviewing and updating the principal risks •On the recommendation of the Audit Committee, approved the company’s filings, financial and non-financial reporting including interim and preliminary results announcements, US filings and Annual Report | | |
Stakeholders key | |||||||
 | Unleash the power of our brands & portfolio… | | People | | Customers | | Communities |
 | …to lead and shape consumer trends… | ||||||
| Consumers | | Suppliers | | Investors | ||
 | …executed with operational excellence | ||||||
Stakeholder and why we engage | ||||
Our people –People are at the core of our business –We aim to build a trusting, respectful and inclusive culture where people feel engaged and fulfilled –We want our people to be treated with dignity at work and their human rights respected | What we believe matters most to them •Prioritisation of health, safety and well- being •Learning and development opportunities •Purpose, culture and benefits •Contributing to the growth of our brands and performance •Promotion of inclusion and diversity •Sustainability and societal credentials How the Board seeks to engage •Active dialogue maintained throughout the year as part of the Board's ongoing workforce engagement programme •Direct engagement through visits to offices, production and supply chain sites during the year •Indirect engagement through feedback from works councils, employee and workforce forums, community groups, Your Voice and pulse surveys and townhall meetings | Reporting to the Board •Regular reports from workforce engagement activities •Feedback through employee surveys, including annual group-wide Your Voice survey •Sessions on different aspects of culture, values and behaviours at Board meetings led by Chief HR Officer Upcoming priorities •Maintaining focus on simplifying internal processes, including upgrading and transforming business operations and systems •Continuing workforce engagement activities including as part of business transformation implementation and change management | ||
Consumers •Understanding our consumers is critical for our business’s long-term growth •Consumer motivations, attitudes and behaviours form the basis of our business strategy, brand marketing and innovation •We want consumers to enjoy our products responsibly and for them to ‘drink better, not more’ | What we believe matters most to them •Choice of brands for different occasions, including no- and lower- alcohol •Innovation in heritage brands and creation and nurturing of new brands •Responsible marketing •Great experiences •Product quality •Sustainability and societal credentials •Price How the Board seeks to engage •Monitoring consumer behaviours, motivations and insights •Responding to and anticipating emerging consumer trends as part of strategic sessions, including the Annual Strategy Conference •Regular review of business development opportunities, including active brand portfolio management •Review of innovation pipeline as part of the Annual Strategy Conference | Reporting to the Board •Regular performance updates by the Chief Executive, including on key consumer trends •Papers prepared by strategy team on evolving consumer behaviours globally and in key regions •Regular updates by Business Development and Innovation teams on organic and inorganic opportunities and portfolio choices Upcoming priorities •Ongoing review of portfolio and category participation opportunities •Developing pipeline of innovation informed by consumer insights •Enhancing marketing effectiveness through detailed understanding of consumer motivation, globally and by region or market | ||
Stakeholder and why we engage | ||||
Customers •Our customers are a broad range of businesses, large and small, on-trade and off-trade, retailers, wholesalers and distributors, digital and e-commerce •We want to nurture mutually beneficial relationships to deliver joint value and great consumer experiences | What we believe matters most to them •A portfolio of leading brands that meets evolving consumer preferences •Identification of opportunities that offer profitable growth •Insights into consumer behaviour and shopper trends •Trusted product quality •Innovation, promotional support and merchandising •Availability and reliable supply and stocking •Technical expertise •Joint risk assessment and mitigation •Sustainability and societal credentials How the Board seeks to engage •Regular review of innovation pipeline and inorganic opportunities to ensure a broad portfolio at multiple price points •Review of supply chain footprint to ensure efficient delivery of products to customers •Direct engagement with key customers during market visits | Reporting to the Board •Regular performance updates by the Chief Executive, including customer and route-to-consumer concerns •Deep dive reviews on key regions or markets, such as Great Britain and North America, including consideration of key customer relationships and ways of working Upcoming priorities •Scheduling face-to-face meetings for Directors to meet representatives of key customers during market visits and throughout Board calendar •Enhancing relationships between the company and its customers through engagement opportunities | ||
Suppliers •Our suppliers, service providers and agencies are experts in their fields •We rely on them to deliver high-quality products and market responsibly •We collaborate with them to improve our collective impact, ensure sustainable and resilient supply chains, and make positive contributions to society | What we believe matters most to them •Strong, mutually beneficial partnerships •Strategic alignment and growth opportunities •Fair contract and payment terms •Collaboration to realise innovation •Consistent performance measures •Joint risk assessment and mitigation •Sustainability and societal credentials How the Board seeks to engage •Periodic review of supply chain footprint in key markets to ensure resilience and flexibility, monitoring environmental impacts and efficiencies •Review and approval of material supply and procurement contracts including for critical raw materials •Supporting management in improving supplier relationships through fair contract and payment terms, compliance with Diageo's 'Partnering with Suppliers Standard' and working collaboratively to mitigate environmental impacts and achieve ESG goals | Reporting to the Board •Terms of material contracts with suppliers are reviewed by the Board •Periodic updates provided to the Board in relation to supply chain agility programme rollout •Proposals put to the Board include summaries of potential implications for suppliers as a key stakeholder group Upcoming priorities •Continued focus on rollout of supply chain agility programme •Monitoring impact of supply chain disruption on operations •Supervision of initiatives to improve sustainability and supply chain resilience | ||
Stakeholder and why we engage | ||||
Communities •We aim to create long-term value for the communities in which we live, work, source and sell •We can help build thriving communities and strengthen our business through empowering people, increasing access to opportunities and championing inclusion and diversity | What we believe matters most to them •Impact of our operations on the local economy •Access to skills development, employment and supplier opportunities •Inclusion, diversity and tackling inequality in all forms •Responsible use of natural resources, biodiversity and sustainability •Transparency and engagement How the Board seeks to engage •Setting targets and monitoring progress on broader societal matters, including promoting positive drinking, inclusion and diversity •Considering the environmental and social consequences for communities of its key decisions, including encouraging inclusion and diversity, equal employment opportunities, skills development and support for communities and through wider value chains | Reporting to the Board •Reports provided to Board on progress made in relation to 'Spirit of Progress' targets •Proposals put to the Board include summaries of potential implications for local communities •Reports on macroeconomic and socio-political events provided to Board by management Upcoming priorities •Enabling acceleration of key aspects of 'Spirit of Progress' targets, including in respect of positive drinking and water stewardship •Increased focus on carbon reduction initiatives | ||
Governments and regulators •The regulatory environment is critical to the success of our business •We share information and perspectives with those who influence policy and regulation to enable them to understand our views on areas that can impact public health and our business | What we believe matters most to them •Compliance with applicable laws and regulations •Contribution to national and local economic development and public health priorities •International trade, excise, regulation and tackling illicit trade •Tackling harmful drinking and the impact of responsible drinking initiatives •Climate change and water sustainability agendas, including carbon reduction, human rights, environmental impacts, sustainable agriculture, biodiversity and support for communities How the Board seeks to engage •Indirect engagement through periodic updates from the Chief Executive and corporate relations executives •Review of macroeconomic and geopolitical developments as part of strategy sessions •Updates on regulatory developments, including in relation to non-financial reporting, corporate governance and public policy | Reporting to the Board •Reports on socio-political events and issues periodically provided to the Board •Developments in regulatory matters, including governance and reporting obligations, are included in biannual reports to the Board prepared by management Upcoming priorities •Monitoring developments in regulation and best practice in respect of non-financial reporting requirements, corporate governance and audit regime •Supporting management's advocacy in relation to key public policy matters including water stewardship, positive drinking, inclusion and diversity | ||
Stakeholder and why we engage | ||||
Investors •We want to enable equity and debt investors to have an in-depth understanding of our strategy, our operational, financial and holistic performance, so that they can more accurately assess the value of our business and the opportunities and risks of investing in it | What we believe matters most to them •Strategic priorities, opportunities and risks •Financial performance •Corporate governance •Leadership credentials, experience and succession •Executive remuneration policy •Shareholder returns •Environmental, inclusion and diversity, and social commitments and progress How the Board seeks to engage •Regular engagement between key investors and Chief Executive and Chief Financial Officer through Investor Relations programme of events •Participation in investor conferences such as the Consumer Analyst Group of New York meeting (CAGNY) •Hosting investor events such as the Capital Markets Event held in New York in November 2023 •Attendance at the Annual General Meeting in September 2023, including responding to questions from shareholders | Reporting to the Board •Monthly reports compiled by Investor Relations team provided to the Board, providing details on engagement sessions with investors and key trends •Chief Executive reporting investor sentiment to the Board as part of regular updates at Board meetings, including feedback following participation at analyst and investor conferences Upcoming priorities •Continued proactive engagement with investors through structured programme of engagement activities over the year •Preparing for the Annual General Meeting to be held in September 2024 •Engaging directly with investors through post-results announcement roadshows | ||
Engaging with investors and shareholders | ||
Diageo's Investor Relations (IR) team support the Chief Executive, Chief Financial Officer and other members of the Board and Executive Committee with arranging a programme of engagement events, attendance at analyst conferences, meetings and calls with a wide variety of shareholders, investors and analysts. The IR team monitor Diageo's share price performance and trading patterns, review analyst research notes and recommendations, peer group and other sector news, providing regular reports to the Board and Executive Committee. During fiscal 24, there have been over 400 meetings or calls between investors and management, including the Chief Executive, Chief Financial Officer or other members of the Executive Committee and IR team. A key example of how the company engages with investors is the Capital Markets Event held in November 2023 at which Diageo's Executive Committee highlighted the company's strategic priorities, showcased case studies of strategy being put into action, including in relation to the opportunities for whisky in India, innovation in Guinness and the rollout of tequila into new markets. These engagement events allow investors to get a more detailed understanding of our market dynamics and opportunities and how Diageo looks to grow its business, while also allowing management to have a direct dialogue with investors. | ||
Fiscal 24 investor activity timeline | ||||||
August 2023 | September 2023 | October 2023 | November 2023 | December 2023 | ||
•Announcemen t of Diageo's Preliminary Results for fiscal 23 on 1 August 2023 •Roadshow by the CEO and CFO in the UK and US | •Annual General Meeting held on 28 September 2023 •IR team held a number of one-to-one meetings and conference calls with various investors | •IR team had meetings with investors on an individual and group basis | •Trading update announcement •Capital Markets Event hosted in New York by CEO, CFO and Executive Committee members | •CEO, CFO and other Executive Committee members had various meetings and calls with investors | ||
January 2024 | February 2024 | March and April 2024 | May 2024 | June 2024 | ||
•Announcemen t of Diageo's Interim Results for fiscal 24 on 30 January 2024 | •Roadshow by CEO and CFO in London, New York and Boston •CEO and CFO presented at the CAGNY conference | •The CEO, CFO and IR team met with several investors, individually and in groups | •Roadshow hosted by Barclays with CFO and IR team in San Francisco and Los Angeles | •CFO attended Deutsche Bank Conference in Paris | ||
Creation of our Growth Ambition |
Decision made Supported by the group strategy team and Executive Committee, the Chief Executive has carried out a review and assessment of our strategy in light of the evolving external environment, resulting in the identification of strategic imperatives and priorities to enable future growth. This overview, which was presented to and approved by the Board, led to the creation of Diageo’s Growth Ambition, further details of which are set out on pages 25-26. |
Stakeholder considerations Diageo’s strategy has been to consistently and steadily gain share and build global brands despite various challenges and dynamic external factors, such as Covid-19, the cost of living crisis, consumer trends and stakeholder expectations. In recent years, the macroeconomic, geopolitical and societal environment has continued to be volatile seeing a period of accelerated change in many respects, including digitalisation and technological advances, while other longer-term trends, such as premiumisation, have broadly continued, albeit in a less consistent manner. The Growth Ambition has at its core the interests and demands of consumers, which vary considerably by market, and, by extension, customers. The review also considered the interests and needs of Diageo’s employees and broader workforce, who need the systems, processes, structures and capabilities to enable growth by responding to and leading consumer trends appropriately. The review also considered the interests of shareholders, aiming to create value, which can be reinvested in our brands and business, and returned to shareholders. |
’Spirit of Progress’ review and refinement |
Decision made Diageo’s ambitious global ESG action plan, ‘Spirit of Progress’, was launched in 2020, having been approved by the Board, with the aim to make a positive impact on people and the planet and to help create a more inclusive and sustainable world. Approaching the mid-point of the overall programme, during fiscal 24 management undertook a review of the action plan’s current status and recommended a refinement and focus of resources on those targets which address our highest risks and in respect of which we can have the greatest impact. The Board approved the review and resulting refinement of these targets and priority areas. |
Stakeholder considerations Diageo has a longstanding commitment to carrying on its business in a sustainable and resilient way, given the importance of environmental and social responsibility and the impact that the Company has on its different stakeholder groups. For example, Diageo’s workforce want to work for a company that values the environment and community in which it operates, encourages inclusion of a diverse range of people and builds respect, engagement and fulfillment. Investors and shareholders benefit from business practices which are sustainable and result in consistent holistic performance, balancing resource and capital allocation over time. The review, which is described in more detail on page 97, considered the underlying targets of the programme’s three priority areas and the degree to which progress had been made against them, the reasons why significant progress had been made against certain targets but not against other targets, and the preliminary results of management's double materiality assessment. The review also included consideration of various external factors and uncertainties which impact our ability to achieve certain targets, how stakeholder approaches and expectations developed over time, and areas where Diageo could have a disproportionate impact through additional resource and focus. As a result of the review, Diageo will focus its efforts on those areas and targets which address our highest risks and in respect of which we can have the greatest impact, recognising the continuing importance of sustainability to our stakeholders. |
Appointment of future Board Chair |
Decision made The Board approved the appointment of Sir John Manzoni, an existing Non-Executive Director, as Chair of the Board effective on or around 5 February 2025, succeeding Javier Ferrán, who will be standing down in his ninth year on the Board. |
Stakeholder considerations The Board considered Sir John Manzoni’s record since joining the Board in 2020, having made high-quality contributions to Board and committee meetings, providing effective and constructive challenge to management and demonstrating objective and independent judgment. The Board considered that Sir John facilitated constructive Board relations in a manner which was consistent with the Board’s transparent and open culture, and had supported the current Chair in instilling appropriate values, behaviours and culture in the Board and senior management. Sir John has extensive leadership experience across a number of complex and fast-changing sectors, in the UK and globally, including in executive and non-executive capacities within the private sector as well as in the UK civil service. His experience in the public sector, working with government, civil service and regulators, would be particularly beneficial to Diageo. Sir John’s current appointments and commitments were also noted, including his roles on other company boards, in light of the commitments and demands of the role, as was the fact that he was independent on appointment, as required by the Code, and remained independent. Overall, the Board concluded that Sir John was the most suitable candidate and that his appointment as Chair would be of benefit to the company, its shareholders and wider stakeholders. |
Key recommendations | Actions for focus in 2024/25 | ||
General feedback | |||
•Continue to ensure Board members feel well integrated into the Board and company | •Increase lines of communication between management and Board members | ||
•Ensure focus on diversity continues | •Consider opportunities for more engagement between Board members and the workforce | ||
Board composition and succession | |||
•Nomination Committee to tailor induction programmes for specific new Non-Executive Directors depending on their background and experience | •Enhance the succession planning transition process to identify potential new Board members with relevant sector experience | ||
•Continue to review the balance of skills, expertise and knowledge of the Board | |||
•Continue to increase focus on communication channels with brokers, shareholders and other stakeholders | •Focus recruitment and talent pipeline on key areas for additional expertise | ||
•Enhance and align technology with the growth agenda and with testing various assumptions | |||
People and culture | |||
•Continue external talent search for executive and senior leader roles as well as focus on the development of internal talent | •Continue to promote and protect the company’s corporate culture and values | ||
•Ensure regular structured engagement between Nomination Committee members and high potential internal candidates | •Continue to review the talent pipeline of executives and senior management | ||
•Review and track high potential candidates both internally and externally | |||
Strategy and risk | |||
•Review and track key strategic decisions and investments focusing on medium and longer-term issues as well as emerging trends | •Enhance the group risk appetite statement, including in relation to description of risk appetite for principal risks | ||
•Continue to maintain strategic focus and to monitor the changing business landscape including wider external competition and consumers | |||
•Allocate appropriate time and resources during Board discussions to ensure the right challenge and support is provided on strategic and operational risk reviews | |||
•Continue to focus on the company’s approach to ESG and effective stakeholder engagement as well as shareholder communication |
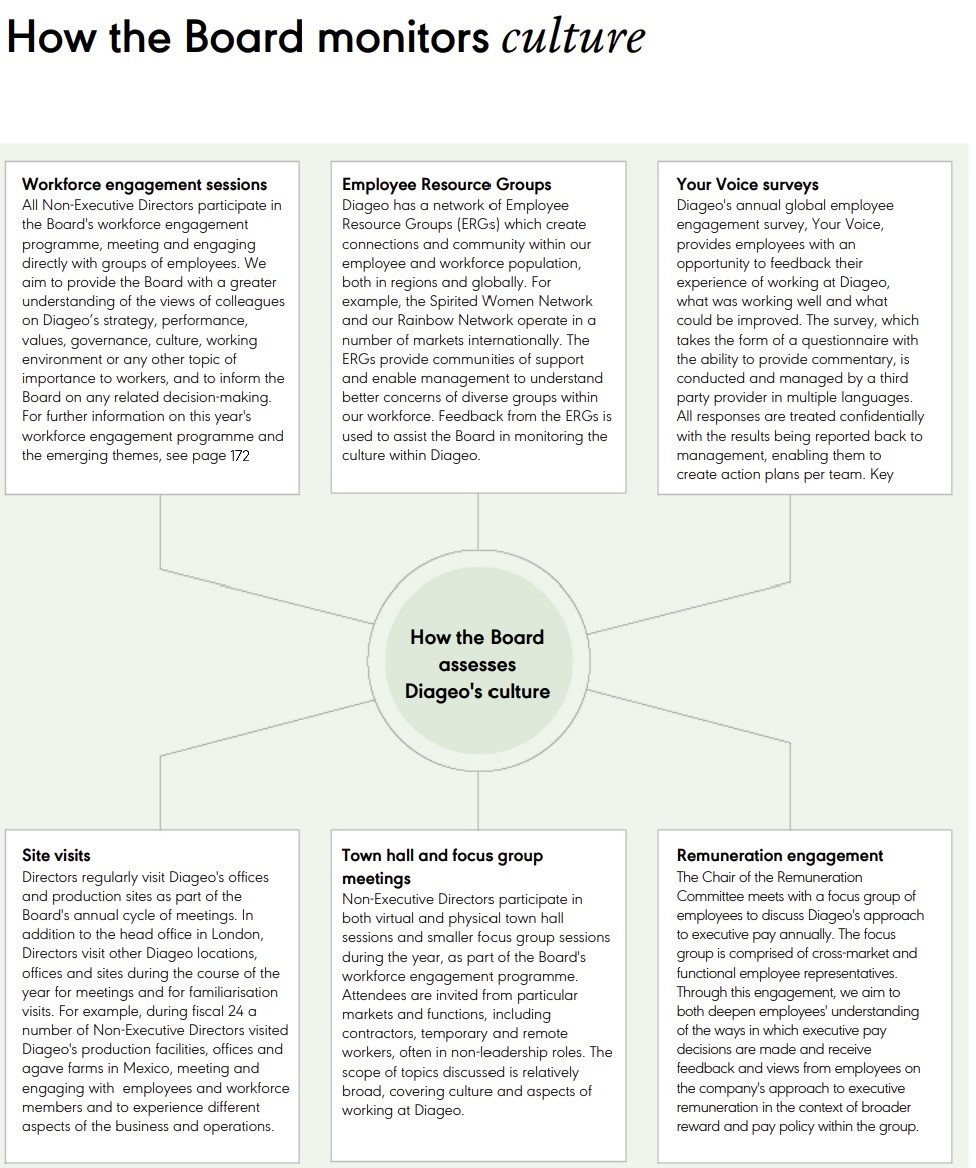
Audit tender process | |||
April 2023 | Review of the audit market including firms outside the ‘Big 4’ professional consultancy firms to determine their minimum capability and capacity requirements. | ||
May to June 2023 | Constituted a sub-committee of the Audit Committee and identified shortlisted firms for interview. | ||
September to October 2023 | Determined list of assessment criteria, created and opened data room to share information, and carried out series of management meetings with each shortlisted firms. | ||
October to November 2023 | Presentation to the Audit Committee followed by the submission of formal requests for proposal from the shortlisted firms. | ||
December 2023 | Review of proposals from firms, consideration by Audit Committee and recommendation to the Board. | ||


ò | Reported |
ò | Reported through SpeakUp |
ò | Substantiated breaches |
ò | Code-related leavers |
Areas of focus | Strategic outcome | |
Corporate reporting | •Half and full year external reporting updates •Interim and preliminary results review and approval •Annual Report and consolidated financial statements, Form 20-F review and approval •Implications of group functional and presentation currency change on reporting |    |
Internal controls | •GAR updates •Business Integrity updates including breach and reporting update •Controls testing update and Section 404 assessment •Implications on controls environment of systems and process changes •Business transformation projects monitoring •Inventory and stock in trade monitoring controls review and enhancements | |
External audit and assurance | •Report on external audit at half and full year periods •Insights and observations on reporting review •Auditor independence and non-audit work reviews •Auditor independence policy review •Review of management representation letters •Appointment of auditor and review of terms of engagement and fees •Auditor performance and effectiveness review and assessment •Commencement of auditor tender process •Audit regime reform and approach to assurance | |
Risk management | •Principal and emerging risk reviews and tracking •Risk updates, including group risk footprint and risk appetite review and approvals •Business ethics and integrity, human rights, anti-counterfeit, geo- political volatility and business interruption, business transformation, stock in trade, cyber security and IT resilience, climate change and sustainability, and international taxation risk reviews | |
Key | |||||||
Strategic outcomes | |||||||
| Efficient growth | | Credibility and trust | | Consistent value creation | | Engaged people |
Matter considered | How the Audit Committee addressed the matter | |
The nature and size of any one-off items impacting the quality of the earnings and cash flows. | The Audit Committee assessed whether the related presentation and disclosure of those items in the financial statements were appropriate based on management’s analysis, and concluded that they were. | |
Items that were to be presented as exceptional. Refer to note 3 of the Financial Statements. | The Audit Committee assessed whether the reporting of those items as exceptional, was in line with the group’s accounting policy, and that sufficient disclosure was provided in the financial statements, and concluded that they were. | |
Whether the carrying value of assets, in particular intangible assets, was supportable. Refer to notes 6, 9, 10 and 13 of the Financial Statements. | The Audit Committee reviewed the methodology applied in conducting impairment reviews and the result of management's impairment assessments that were performed during the year. The Committee was provided with information about the carrying amounts and the key assumptions incorporated in management’s estimate of discounted cash flows of significant assets that are sensitive to key assumptions. The Committee reviewed the key assumptions used in the impairment testing, including management’s cash flow forecasts, growth rates and the discount rate used in value in use calculations and agreed they were appropriate. The Committee agreed with management’s judgements and conclusions, whereby the previous impairment charge of $379 million in respect of Shui Jing Fang brand has been reversed, while Chase brand and related goodwill and fixed assets, certain brands in the US ready to drink portfolio, and some smaller other brands and investments in associates have been impaired by $170 million in the year ended 30 June 2024, out of which $155 million was reported as exceptional operating charge. The Committee agreed that the recoverable amount of the company’s other assets was in excess of their carrying value and that appropriate disclosure was provided with respect to assets impaired, and whose value is more sensitive to changes in assumptions. | |
The group’s more significant tax exposures and the appropriateness of any related provisions and financial statement disclosures. Refer to page 134 of 'Risk factors' and note 7 of the Financial Statements. | The Audit Committee agreed that disclosure of tax risk appropriately addresses the significant change in the international tax environment, and that appropriate provisions and other disclosure with respect to uncertain tax positions were reflected in the financial statements. | |
The appropriateness of the valuation of post-employment liabilities, and the recognition of any surplus. Refer to note 14 of the Financial Statements. | The measurement of post-employment liabilities is sensitive to changes in long-term interest rates, inflation and mortality assumptions. Having reviewed management’s papers setting out key changes to actuarial assumptions, the Audit Committee agreed that the assumptions used in the valuation are appropriate. The Committee reviewed management’s assessment of the economic benefit available as a refund of the surplus or as a reduction of contribution and the key judgements made in respect of the surplus restriction and concluded that those judgements were appropriate. The Committee reviewed and concluded that sufficient disclosures were provided in the financial statements. | |
Significant legal matters impacting the group. Refer to note 19 of the Financial Statements. | The Committee agreed that adequate provision and/or disclosure have been made for all material litigation and disputes, based on the current most likely outcomes, including the litigation summarised in note 19 of the Financial Statements. | |
Functional currency of Diageo plc and presentation currency of Diageo group. | The Audit Committee agreed that in line with reporting requirements the functional currency of Diageo plc has changed from sterling to US dollar which is applied prospectively from fiscal 24. This is because the group's share of net sales and expenses in the US and other countries whose currencies correlate closely with the US dollar has been increasing over the years, and that trend is expected to continue in line with the group's strategic focus. Diageo has also decided to change its presentation currency to US dollar with effect from 1 July 2023, applied retrospectively, as it believes that this change will provide better alignment of the reporting of performance with its business exposures. | |
Whether the Annual Report is fair, balanced and understandable. | The Audit Committee concluded that the Annual Report, taken as a whole, is fair, balanced and understandable and provides the information necessary for shareholders to assess the company’s performance, business model and strategy and that there is an appropriate balance between statutory (GAAP) and adjusted (non-GAAP) measures. | |
The impact of climate change on the group’s financial reporting and financial statements. Refer to pages 113-131 of 'Pioneer grain-to-glass sustainability' and note 1 and note 9 of the Financial Statements. | The Audit Committee agreed that the disclosures on pages 113-131 made in response to the recommendations of the Task Force on Climate-related Financial Disclosures are appropriate and that the assumptions used in the financial statements are consistent with these disclosures. |
Cyber Security Risk Management |
Cyber security risk management is an integral part of Diageo’s overall group risk management programme and aligned to Diageo’s risk management framework, with cyber security risk forming a central part of the principal risk ‘Cyber and IT resilience’ as set out on page 140. Our cyber security risk management programme is aligned to industry best practices and provides a framework for handling cyber security threats and incidents across the global organisation, including threats and incidents associated with the use of IT applications and services provided by IT and non-IT third parties. Our programme is designed to work across all Diageo functions, markets, and entities. This framework includes steps for assessing the severity of a cyber security threat, identifying the source of a cyber security threat including whether the cyber security threat is associated with a third-party service provider, implementing cyber security countermeasures and mitigation strategies and informing management and our Board of material cyber security threats and incidents. Our cyber security team also engages third-party security experts for industry benchmarking analysis, risk assessments and conducting system enhancements and support when necessary. Our cyber security team is responsible for assessing our cyber security risk management programme and we engage third parties for such assessments approximately every one to two years. In addition, our cyber security processes includes a training and awareness outreach programme that provides training to all employees annually and more frequent targeted training across functions, markets, and entities. The Board has overall responsibility for our risk management, including in respect of cyber security, oversight of which has been delegated to the Audit Committee. The Audit Committee is responsible for ensuring that management has processes in place designed to identify and evaluate cyber security risks to which the company is exposed and implement processes and programmes to manage cyber security risks and mitigate cyber security incidents. The Audit Committee also reports material cyber security risks to the Board. Management is responsible for identifying, considering and assessing material cyber security risks on an ongoing basis, establishing processes to ensure that such potential cyber security risk exposures are monitored, putting in place appropriate mitigation measures and maintaining cyber security programmes. Our cyber security programmes are under the direction of our Chief Information Security Officer (CISO) who receives reports from our cyber security team and monitors the prevention, detection, mitigation, and remediation of cyber security incidents. Our CISO and dedicated personnel are certified and experienced information systems security professionals and information security managers with many years of relevant industry experience and accredited certifications. Management, including the CISO and our cyber security team, regularly update the Audit Committee on the company’s cyber security programmes, material cyber security risks and mitigation strategies and provide cyber security reports on a half-yearly basis that cover, among other topics, assessments of the company’s cyber security programmes, developments in cyber security and updates to the company’s cyber security programmes, security risk footprint with risk appetite, and mitigation strategies. During fiscal 24, we did not identify any cyber security threats that have materially affected or are reasonably likely to materially affect our business strategy, results of operations, or financial condition. However, despite our efforts, we cannot eliminate all risks from cyber security threats, or provide assurances that we have not experienced an undetected cyber security incident. For more information about these risks, please see the section on ‘Our Principal Risks and Risk Management’ on pages 134-144. |
Number of Board members | Percentage of the Board | Number of senior positions on the Board (CEO, CFO, SID and Chair) | Number in executive management | Percentage of executive management | |
Men | 3 | 30.0% | 1 | 7 | 54.0% |
Women | 7 | 70.0% | 3 | 6 | 46.0% |
Not specified/prefer not to say | — | — | — | — | — |
Number of Board members | Percentage of the Board | Number of senior positions on the Board (CEO, CFO, SID and Chair) | Number in executive management | Percentage of executive management | |
White British or other White (including minority-white groups) | 6 | 60.0% | 3 | 7 | 53.8% |
Mixed/Multiple Ethnic Groups | — | — | — | 1 | 7.7% |
Asian/Asian British | 3 | 30.0% | 1 | 3 | 23.1% |
Black/African/Caribbean/Black British | 1 | 10.0% | — | 1 | 7.7% |
Other ethnic group, including Arab | — | — | — | 1 | 7.7% |
Not specified/prefer not to say | — | — | — | — | — |
Board composition | Non-Executive Director tenure | Board gender diversity | Board ethnic diversity |


ò | Chair | ò | 0 – 3 years | ò | Male | ò | Directors of colour | |||
ò | Executive Director | ò | 3 – 6 years | ò | Female | ò | White European | |||
ò | Non-Executive Director | ò | 6 – 9 years |

ò | British | ò | Indian | |
ò | American | ò | Irish | |
ò | American/British | ò | South African/British | |
ò | Colombian | ò | Spanish | |
Delivery of business strategy | |
Short and long-term incentive plans reward the delivery of our business strategy and Growth Ambition. Performance measures are reviewed regularly and stretching targets are set relative to the company’s growth plans and peer group forecasted performance. The Committee seeks to embed simplicity and transparency in the design and delivery of executive reward. | |
Creating sustainable, long-term performance | |
A significant proportion of remuneration is delivered in variable pay linked to business and individual performance, focused on consistent and responsible drivers of long-term growth. Performance against targets is assessed in the context of underlying business performance and the ‘quality of earnings’. | |
Winning best talent | |
Well designed and market-competitive total remuneration, with an appropriate balance of fixed reward and upside opportunity, allows us to attract and retain the best talent from all over the world in a competitive talent market, which is critical to our continued business success. | |
Consideration of stakeholder interests | |
Executives are focused on creating sustainable share price growth. The requirement to build significant personal shareholdings in Diageo, and to hold shares acquired from long-term incentive awards for two years post-vesting aligns executives and shareholders. Decisions on executive remuneration are made with consideration of the interests of the wider workforce and other stakeholders, as well as the external climate. |
Remuneration at a glance | |||||
Salary | Allowances and benefits | Annual incentive | Long-term incentives | Shareholding requirement | |
Purpose | •Supports the attraction and retention of the best global talent with the capability to deliver Diageo’s strategy | •Provision of market-competitive and cost-effective benefits supports attraction and retention of talent | •Incentivises delivery of Diageo’s financial and strategic targets •Provides focus on key financial metrics and the individual’s contribution to the company’s performance | •Rewards consistent long-term performance in line with Diageo’s business strategy •Provides focus on delivering superior long-term returns to shareholders | •Ensures alignment between the interests of Executive Directors and shareholders |
Key features of current policy | •Normally reviewed annually on 1 October •Salaries take account of external market and internal employee context | •Provision of competitive benefits linked to local market practice •Maximum company pension contribution is 14% of salary, which is aligned to the offering for the wider workforce in the United Kingdom | •Target opportunity is 100% of salary and maximum is 200% of salary •Performance measures, weightings and stretching targets are set by the Remuneration Committee •Subject to malus and clawback provisions •Executive Directors defer a minimum of one-third of earned bonus payment into Diageo shares held for three years •Remainder paid out in cash after the end of the financial year | •Annual grant of performance shares and share options ◦CEO award up to 500% of salary ◦CFO award up to 480% of salary (% of salary for both CEO and CFO described in performance share equivalents) •Performance measures, weightings and stretching targets are set annually •Three-year performance period plus two-year retention period •Subject to malus and clawback provisions •Number of awards granted is based on a six-month average share price to 30 June preceding grant date | •Minimum shareholding requirement within five years of appointment: ◦CEO 500% of salary ◦CFO 400% of salary •Post- employment shareholding requirement for Executive Directors of 100% of the in- employment requirement (or, if lower, their actual shareholding on cessation) to be retained in full for two years after leaving the company |
Planned for year ending 30 June 2025 | •4.25% salary increase for the CEO, below the annual salary budgets for the wider workforce in the United Kingdom •New CFO appointment from autumn 2024. No salary increase in fiscal 25 | •Allowances and benefits unchanged from prior year •Company pension contributions 14% of salary | •Size of annual incentive award opportunity is unchanged from prior year. For fiscal 25, measures are net sales growth, operating profit growth and operating cash conversion, 80% in total weighted equally, with remaining 20% on individual objectives | –Performance measures are net sales growth, relative TSR, cumulative free cash flow, profit before exceptional items and tax and ‘Spirit of Progress‘ measures –Size of long-term incentive award opportunity is in line with the policy | •No change to in- employment shareholding requirement •Post- employment shareholding in line with the Policy |
Implementation in year ended 30 June 2024 | •4% salary increase for the CFO, slightly below the annual salary budgets for the wider workforce in the United Kingdom and the United States •No increase for the CEO in fiscal 24 following appointme nt on 8 June 2023 | •Allowances and benefits unchanged from prior year •Company pension contribution of 14% for CEO and CFO. Aligned to the UK workforce | •Payout of 16% of maximum for the financial elements of the plan •Total payout of 24.8% of maximum for the CEO and 22.8% for the CFO | •Vesting of 2021 performance shares at 58.9% of maximum for Debra Crew, and 56.5% of maximum for Lavanya Chandrashekar •The 2021 share options lapsed for both Debra Crew and Lavanya Chandrashekar | •As at 30 June 2024, Debra Crew's shareholding was 240% of salary (she has until June 2028 to meet her requirement) •As at 30 June 2024, Lavanya Chandrashekar's shareholding was 100% of salary (she had until July 2026 to meet her requirement) |
Organic net sales growth | Cumulative free cash flow | ||||||||||||||
CAGR | Threshold | Midpoint | Maximum | Threshold | Midpoint | Maximum | |||||||||
5.0% | 7.0% | 9.0% | $10,058m | $11,273m | $12,488m | ||||||||||
l | l | ||||||||||||||
Actual 8.7% | Actual $9,798m | ||||||||||||||
Organic profit before exceptional items and tax growth | Relative TSR ranking vs peer group | |||||||||||||
CAGR | Threshold | Midpoint | Maximum | Threshold | Midpoint | Maximum | ||||||||
6.5% | 10.0% | 13.5% | 9th (median) | – | 3rd (upper quintile) | |||||||||
l | l | |||||||||||||
Actual 6.9% | Actual 14th | |||||||||||||
ESG measure | Unit of measurement | Threshold | Midpoint | Maximum | Actual |
Carbon reduction | Reduction in greenhouse gas emissions (cum%) | 19.1% | 23.1% | 27.1% | 19.6% |
Water efficiency | Improvement in water efficiency (cum%) | 6.3% | 9.2% | 12.1% | 4.2% |
Positive drinking | Number of people who confirmed changed attitudes on the dangers of underage drinking following participation in a Diageo supported education programme | 2.3m | 3.0m | 3.7m | 3.8m |
Inclusion & diversity | % female leaders globally | 44% | 45% | 46% | 44% |
% ethnically diverse leaders globally | 39% | 40% | 41% | 46% |
Net sales growth | Operating profit growth | |||||||||||||
Threshold | Target | Maximum | Threshold | Midpoint | Maximum | |||||||||
3.1% | 6.1% | 9.1% | 1.4% | 6.4% | 11.4% | |||||||||
l | l | |||||||||||||
Actual -0.6% | Actual -4.8% | |||||||||||||
Operating cash conversion | |||||||
Threshold | Target | Maximum | |||||
95% | 100% | 105% | |||||
l | |||||||
Actual 99.6% | |||||||
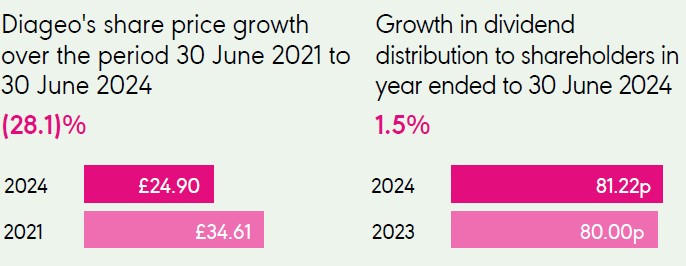
5-year vesting outcomes of long-term incentives | 5-year history of annual incentive payouts | |||
Executive Director vesting outcome (% of maximum) | Annualised TSR % | Payout (% of maximum) | Operating profit growth % | |
ò | Performance shares |
ò | Share options |
ò | Annualised total shareholder return over three-year long-term incentive performance period |
ò | Annual incentive payout (financial measures excluding individual business objectives) |
ò | Organic operating profit growth (% on prior year) |
For | Against | Total votes cast | Abstentions | ||
Directors’ remuneration policy | Total number of votes | 1,663,080,546 | 80,098,370 | 1,743,178,916 | 1,023,145 |
Percentage of votes cast | 95.41% | 4.59% | 100% | n/a | |
Directors' remuneration report (excluding the policy) | Total number of votes | 1,640,705,024 | 77,090,228 | 1,717,795,252 | 26,428,462 |
Percentage of votes cast | 95.51% | 4.49% | 100% | n/a |
l | Base salary |
Purpose and link to strategy | |
Supports the attraction and retention of the best global talent with the capability to deliver Diageo’s strategy and performance goals. | |
Operation | |
•Normally reviewed annually or following a change in responsibilities with any increases usually taking effect from 1 October. •The Remuneration Committee considers the following parameters when reviewing base salary levels: ◦Pay increases for other employees across the group. ◦Economic conditions and governance trends. ◦The individual’s performance, skills and responsibilities. ◦Base salaries (and total remuneration) at companies of similar size and international scope to Diageo, with roles typically benchmarked against the FTSE 30 excluding financial services companies, or against similar comparator groups in other locations dependent on the Executive Director’s home market as well as global consumer goods companies. | |
Opportunity | |
Salary increases will be made in the context of the broader employee pay environment, and will normally be in line with those made to other employees in the relevant markets in which Diageo operates, typically the United Kingdom and the United States, unless there is a change in role or responsibility or other exceptional circumstances. | |
l | Benefits |
Purpose and link to strategy | |
Provides market-competitive and cost-effective benefits as part of remuneration packages designed to attract and retain the best global talent. | |
Operation | |
•The provision of benefits typically depends on the country of residence of the Executive Director and may include but is not limited to a company car or travel allowance, the provision of a contracted car service or equivalent, product allowance, life insurance, accidental death and disability insurance, medical and dental cover, tax support and tax return preparation costs. •The Remuneration Committee has discretion to offer additional allowances, or benefits, to Executive Directors, if considered appropriate and reasonable. These may include, but are not limited to, relocation expenses, housing allowance and school fees where a Director is asked to relocate from his/her home location as part of their appointment. Where appropriate, for example in relation to relocation benefits, the company may also meet the tax costs associated with the benefit provision. | |
Opportunity | |
•The benefits package is set at a level which the Remuneration Committee considers: ◦provides an appropriate level of benefits depending on the role and individual circumstances; ◦is appropriate in the context of the benefits offered to the wider workforce in the relevant market; and ◦is in line with comparable roles in companies of a similar size and complexity in the relevant market. | |
l | Post-retirement provision |
Purpose and link to strategy | |
Provides competitive post-retirement benefits which are part of remuneration packages designed to attract and retain the best global talent. | |
Operation | |
•Provision of market-competitive pension arrangements or a cash alternative based on a percentage of base salary. | |
Opportunity | |
•The maximum pension contribution, or cash alternative allowance, for Executive Directors is 14% of salary. The current CEO and CFO receive a pension contribution of 14% of salary, in line with the UK workforce. |
l | Annual Incentive Plan (AIP) |
Purpose and link to strategy | |
Incentivises delivery of Diageo’s annual financial targets and the achievement of key individual objectives which are chosen to align with the business strategy and create a platform for sustainable longer-term performance. Compulsory deferral of a minimum of one-third of any annual incentive earned into shares for three years promotes longer-term alignment of Executive Directors' interests with shareholders’ interests. | |
Operation | |
•Performance measures, weightings and targets are set by the Remuneration Committee. Appropriately stretching targets are set by reference to the operating plan and historical and projected performance for the company and its peer group. •The level of award is determined with reference to Diageo’s overall financial and strategic performance and individual performance. •A minimum of one-third of the actual earned bonus payment is normally deferred into a share award (pre-tax deferral) or owned shares (post-tax deferral) under the Deferred Bonus Share Plan, to be held for a minimum period of three years, other than in exceptional circumstances. The remainder of the bonus payment is paid out in cash after the end of the financial year. •The Remuneration Committee has discretion to adjust the level of payment if it is not deemed to reflect appropriately the individual’s contribution or the overall business performance. Any discretionary adjustments will be detailed in the following year’s annual report on remuneration. •The Remuneration Committee has discretion to apply malus or clawback to bonus as detailed in the 'Malus and Clawback' section below. •In the case of pre-tax deferral, notional dividends accrue on deferred bonus share awards, delivered as shares or cash at the discretion of the Remuneration Committee at the end of the vesting period (on post-tax deferral into owned shares, actual dividends are payable). | |
Opportunity | |
For threshold performance, up to 50% of salary may be earned, with up to 100% of salary earned for on-target performance and a maximum of 200% of salary payable for outstanding performance. The maximum includes the deferred share element but excludes dividend equivalents payable in respect of deferred share awards. | |
Performance conditions | |
Annual incentive plan awards are normally based 70%-100% on financial measures which may include, but are not limited to, measures of sales, profit and cash, and 0%-30% on broader objectives based on strategic goals and/or individual contribution. The Remuneration Committee has discretion to amend the performance measures in exceptional circumstances if it considers it appropriate to do so, e.g. in cases of accounting policy changes, merger and acquisition activities or disposals. Any such amendments would be fully disclosed and explained in the following year’s annual report on remuneration. | |
l | Diageo Long-Term Incentive Plan (DLTIP) |
Purpose and link to strategy | |
Provides a long-term incentive to achieve key performance measures which support the company’s strategy, and to align interests with shareholders. | |
Operation | |
•An annual grant of performance shares and/or market-price share options which vest subject to a performance test and continued employment, normally over a period of three years. •Measures and stretching targets are reviewed annually by the Remuneration Committee for each new award. •The Remuneration Committee has the authority to exercise discretion to adjust the vesting outcome based on its assessment of the overall business performance over the performance period. This may include the consideration of factors such as holistic performance relative to peers, stakeholder outcomes and significant investment projects, for example. •Following vesting, there is normally a further retention period of two years. Executive Directors are able to exercise an option or sell sufficient shares to cover any tax liability when an award vests, provided they retain the net shares arising for the two-year retention period. •Notional dividends accrue on performance share awards to the extent that the performance conditions have been met, delivered as shares or cash at the discretion of the Remuneration Committee at the end of the vesting period. •The Remuneration Committee has discretion to apply malus or clawback to bonus as detailed in the 'Malus and Clawback' section below. | |
Opportunity | |
•The maximum annual grants for the Chief Executive and Chief Financial Officer are 500% and 480% of salary in performance share equivalents respectively (where a market-price option is valued at one-third of a performance share). Included within that maximum, no more than 375% of salary will be awarded in face-value terms in options, with the balance awarded in performance shares, to any Executive Director in any year. •Awards vest at 20% of maximum for threshold performance and 100% of maximum if the performance conditions are met in full. The vesting schedule related to the levels of performance between threshold and maximum, including whether or not this will include an interim stretch performance level, will be determined by the Remuneration Committee on an annual basis and disclosed in the relevant remuneration report for that year. There is a ranking profile for the vesting of the part of the award based on relative total shareholder return, starting at 20% of maximum for achieving the threshold. | |
Performance conditions | |
The vesting of awards is linked to a range of measures which may include, but are not limited to: •a growth measure (e.g. net sales growth, operating profit growth); •a measure of efficiency (e.g. operating margin, cumulative free cash flow, return on invested capital); •a measure of Diageo’s performance in relation to its peers (e.g. relative total shareholder return); and •a measure relating to our ‘Spirit of Progress‘ (environmental, social or governance) priorities. Measures that apply to performance shares and market-price options may differ, as is the case for current awards. Weightings of these measures may also vary year-on-year. The Remuneration Committee has discretion to amend the performance conditions in exceptional circumstances if it considers it appropriate to do so, e.g. in cases of accounting policy changes, merger and acquisition activities or disposals. Any such amendments would be fully disclosed and explained in the following year’s annual report on remuneration. |
Malus and Clawback | |
Under the AIP and DLTIP, the Remuneration Committee has discretion to apply malus and clawback in the circumstances specified in the applicable malus and clawback policy from time to time in place, for example: •Material misstatement of results or an error resulting in overpayment. •Risk failure resulting in material financial loss or any business area being the subject of a regulatory investigation or in breach of regulation. •Employee misconduct/disciplinary action. •Employee accountability for material reputational damage to the group which could have been avoided. •In respect of the application of malus, deterioration in the financial situation of the group which limits the ability to fund incentive awards. •Any other matter which, in the reasonable opinion of the Remuneration Committee, is required to be considered to comply with prevailing legal and/or regulatory requirements. The malus and clawback provisions may be invoked for one year following an AIP cash payment and two years following a DLTIP vesting. Where the Remuneration Committee determines that malus and/or clawback will apply, the Remuneration Committee has discretion to determine the basis of application and the means by which malus and/or clawback will be implemented. The malus and clawback policy will be reviewed from time to time to ensure that the policy is compliant with any regulatory requirements, such as the NYSE listing rules. |
l | All-employee share plans |
Purpose and link to strategy | |
To encourage broader employee share ownership through locally approved plans. | |
Operation | |
•The company operates tax-efficient all-employee share acquisition plans in various jurisdictions. •Executive Directors’ eligibility may depend on their country of residence, tax status and employment company. | |
Opportunity | |
•Limits for all-employee share plans are set by the tax authorities. The company may choose to set its own lower limits. | |
Performance conditions | |
•Under the UK Share Incentive Plan, the annual award of Freeshares may be based on Diageo plc financial measures which may include, but are not limited to, measures of sales, profit and cash. | |
l | Shareholding requirement |
Purpose and link to strategy | |
•Ensures alignment between the interests of Executive Directors and shareholders. | |
Operation | |
•The minimum in-employment shareholding requirement is 500% of base salary for the Chief Executive and 400% of base salary for any other Executive Directors. •Executive Directors are normally expected to build up their in-employment shareholding within five years of their appointment to the Board. •Shares that count towards these minimum shareholding requirements are shares beneficially held by the Executive Director and their connected persons, including Deferred Bonus Share Plan (DBSP) shares within the three-year deferral period, on a net (if post-tax deferral)/notional net (if pre-tax deferral) of tax basis. •Executive Directors are restricted from selling more than 50% of shares which vest under the long-term incentive plan or deferred bonus share plan (excluding the sale of shares to cover tax on vesting and other exceptional circumstances to be specifically approved by the Chief Executive and/or Chair), until the shareholding requirement is met. •In order to provide further long-term alignment with shareholders, Executive Directors will normally be expected to maintain a Diageo shareholding of 100% of the in-employment shareholding requirement (or, if lower, their actual shareholding on cessation) for two years after leaving the company. •The Executive Directors enter into a deed undertaking to comply with the requirement and committing to hold the required number of shares in a specified nominee account. | |
l | Chair of the Board and Non-Executive Directors' fees |
Purpose and link to strategy | |
•Supports the attraction and retention of world-class talent and reflects the value of the individual, their skills and experience. | |
Operation | |
•Fees for the Chairman and Non-Executive Directors are normally reviewed every year. •A proportion of the Chairman’s annual fee may be used for the monthly purchase of Diageo ordinary shares, which have to be retained until the Chairman retires from the company or ceases to be a Director. •Fees are reviewed in light of market practice in the FTSE 30, excluding financial services companies, and anticipated workload, tasks and potential liabilities. •The Chairman and Non-Executive Directors do not participate in any of the company’s incentive plans nor do they receive pension contributions or benefits. Their travel and accommodation expenses in connection with attendance at Board meetings (and any tax thereon) are paid by the company. •The Chairman and the Non-Executive Directors are eligible to receive a product allowance or cash equivalent at the same level as the Executive Directors. •All Non-Executive Directors have letters of appointment. A summary of their terms and conditions of appointment is available at www.diageo.com. The Chairman of the Board, Javier Ferrán, was re-appointed on 6 October 2022 for a three-year term, terminable on three months’ notice by either party or, if terminated by the company, by payment of three months’ fees in lieu of notice. | |
Opportunity | |
•Fees for Non-Executive Directors are within the limits set by the shareholders from time to time, with an aggregate limit of £1,750,000, excluding the Chair’s fees. |
Executive Director | Date of service contract |
Debra Crew | 28 March 2023 |
Lavanya Chandrashekar | 13 January 2021 |
Notice period | The contracts provide for a period of six months’ notice by the Executive Director or 12 months’ notice by the company, the same as would apply for any newly-appointed Executive Director. A payment may be made in lieu of notice consisting of a sum equivalent to the base salary which the Executive Director would have received for any notice period outstanding on the date employment ends and the cost to the company of providing contractual benefits for this period (including pension contributions but excluding incentive plans). If, on the termination date, the Executive Director has exceeded their accrued holiday entitlement, the value of such excess may be deducted by the company from any sums due to them. If the Executive Director, on the termination date, has accrued but untaken holiday entitlement, the company will, at its discretion, either require the Executive Director to take such unused holiday during any notice period or make a payment to them in lieu of it, provided that if the employment is terminated for cause then the Executive Director will not be entitled to any such payment. |
Mitigation | The Remuneration Committee requires (or may exercise its discretion to require) a proportion of the termination payment to be paid in instalments and, upon the Executive Director commencing new employment, to be subject to mitigation. |
Annual Incentive Plan (AIP) | Where the Executive Director leaves for reasons including retirement, death in service, disability, ill-health, injury, redundancy, transfer out of the group and other circumstances at the Remuneration Committee’s discretion during the financial year, the Executive Director is usually entitled to an incentive payment pro-rated for the period of service during the performance period, which is typically payable at the usual payment date unless the Committee decides otherwise. Where the Executive Director leaves for any other reason, no payment or bonus deferral will be made. The amount is subject to performance measures being met and is at the discretion of the Committee. The Committee has discretion to determine an earlier payment date, for example, on death in service. The bonus may, if the Committee decides, be paid wholly in cash. |
2020 Deferred Bonus Share Plan (DBSP) | Where the Executive Director leaves for any reason other than dismissal, they are entitled to retain any deferred bonus shares, which vest in full on departure, subject to any holding requirements under the post-employment shareholding policy. It is not considered necessary for the bonus deferral to continue to apply after leaving, since the bonus is already earned based on performance, and there is a post-employment shareholding requirement that ensures the Executive Director continues to be invested in the company’s longer-term interests. On a takeover, awards vest in full. On other corporate events, the Remuneration Committee may allow awards to vest in full. |
Diageo Long-Term Incentive Plan (DLTIP) | Where the Executive Director leaves for reasons including retirement, death in service, disability, ill-health, injury, redundancy, transfer out of the group and other circumstances at the Remuneration Committee’s discretion during the financial year, awards continue in effect. Awards will vest on the original vesting date with the exception of death in service, when awards will vest on the date of death, in each case unless the Remuneration Committee decides otherwise. When an Executive Director leaves for any other reason, all unvested awards generally lapse immediately. The applicable retention period for vested awards continues for all leavers (other than in cases of disability, ill-health or death in service, where the retention period will end on the date of death or leaving employment), unless the Remuneration Committee decides otherwise. Where awards were granted in the form of options, on vesting they are generally exercisable for 12 months (or six months for approved options). The proportion of the award released depends on the extent to which the performance condition is met. The number of shares is reduced on a pro-rata basis reflecting the length of time the Executive Director was employed by the company during the performance period, unless the Remuneration Committee decides otherwise (for example, in the case of death in service). Where an Executive Director leaves within one month of the normal vesting date of the award, awards are not time pro-rated, unless the Remuneration Committee decides otherwise. On a takeover or other corporate event, awards vest subject to the extent to which the performance conditions are met and, unless the Remuneration Committee decides otherwise, the awards are time pro-rated. Otherwise the Committee, in agreement with the new company, may decide that awards should be swapped for awards over shares in the new company. |
Repatriation/other | In cases where an Executive Director was recruited from outside the United Kingdom and has been relocated to the United Kingdom as part of their appointment, the company may pay reasonable repatriation costs for leavers at the Remuneration Committee’s discretion. The company may also pay for reasonable costs in relation to the termination, for example, tax, legal and outplacement support, where appropriate. |
Non-Executive Directors | Date of appointment to the Board | Current letter of appointment expires |
Javier Ferrán | 22 July 2016 | AGM 2025 |
Susan Kilsby | 4 April 2018 | AGM 2024 |
Melissa Bethell | 30 June 2020 | AGM 2026 |
Karen Blackett | 1 June 2022 | AGM 2025 |
Valérie Chapoulaud-Floquet | 1 January 2021 | AGM 2024 |
Sir John Manzoni | 1 October 2020 | AGM 2026 |
Alan Stewart | 1 September 2014 | AGM 2024 |
Ireena Vittal | 2 October 2020 | AGM 2026 |
Debra Crew(1)(8) | Lavanya Chandrashekar(1) | |||||||||||
2024 | 2024 | 2023 | 2023 | 2024 | 2024 | 2023 | 2023 | |||||
£ '000 | $ '000 | £ '000 | $ '000 | £ '000 | $ '000 | £ '000 | $ '000 | |||||
Fixed pay | ||||||||||||
Salary | £1,392 | $1,750 | £105 | $126 | £823 | $1,034 | £831 | $997 | ||||
Benefits (2) | £112 | $140 | £4 | $5 | £37 | $47 | £53 | $63 | ||||
Pension(3) | £193 | $242 | £10 | $13 | £112 | $140 | £110 | $133 | ||||
Total fixed pay(7) | £1,696 | $2,132 | £120 | $145 | £972 | $1,221 | £993 | $1,193 | ||||
Performance related pay | ||||||||||||
Annual incentive(4) | £690 | $868 | £79 | $95 | £379 | $476 | £603 | $723 | ||||
Long-term incentives(5) | £678 | $852 | £166 | $199 | £1,350 | $1,697 | £258 | $309 | ||||
Other incentives (6) | £3 | $4 | — | — | £4 | $5 | £3 | $4 | ||||
Total variable pay(7) | £1,371 | $1,724 | £245 | $294 | £1,732 | $2,178 | £864 | $1,037 | ||||
Total single figure of remuneration(7) | £3,067 | $3,856 | £365 | $439 | £2,704 | $3,399 | £1,857 | $2,230 | ||||
(1) | Exchange rate | The amounts shown in US dollars are converted to sterling using the cumulative weighted average exchange rate for the respective financial year. For the year ended 30 June 2024, the exchange rate was £1 = $1.26 and for the year ended 30 June 2023 it was £1 = $1.20. Debra Crew and Lavanya Chandrashekar are paid in US dollars. | |
(2) | Benefits | The benefits numbers include the gross value of all taxable benefits. For Debra Crew, these include flexible benefits allowance ($22.1k), tax return preparation ($19.2k), contracted car service ($58.7k), medical and dental ($22.2k), product allowance and life and long-term disability cover. Lavanya Chandrashekar's benefits include flexible benefits allowance ($23.8k), travel allowance ($13.5k), product allowance and life and long-term disability cover. | |
(3) | Pension | Pension benefits reflect the increase in the pension fund balances over the year in the Diageo North America Inc. pension plans which are over and above the increase due to inflation. Debra Crew started to accrue benefits in the Supplemental Executive Retirement Plan (SERP) from 1 October 2022. Lavanya Chandrashekar started accruing benefits in the SERP from 1 July 2021. The company pension contribution has been 14% of salary from 1 January 2023 for all Executive Directors, aligned to the rate for the UK workforce. | Page 211 |
(4) | Annual incentive | The performance achieved under the fiscal 24 annual incentive plan resulted in an outcome of 16.0% of maximum for the financial elements of the plan. Financial elements represented 80% of the maximum incentive opportunity. Taking account of performance against Individual Business Objectives (IBOs), which represent 20% of the maximum opportunity, the annual incentive payout is 24.8% of maximum for Debra Crew and 22.8% of maximum for Lavanya Chandrashekar. In accordance with their elections to defer post-tax, one-third of the annual incentive for fiscal 24 shown in the table above for Debra Crew and Lavanya Chandrashekar will be deferred into owned shares which are held for three years in a nominee account. | Page 207 |
(5) | Long-term incentives | Long-term incentives represent the estimated gain (based on the average three-month ADR price to 30 June 2024 of $137.77) delivered through share options and performance shares where performance conditions have been met in the respective financial year. It also includes the value of additional shares earned in lieu of dividends on these vested performance shares. For Debra Crew, the 2021 performance shares and share options were granted before she became an Executive Director, and due to a slightly different vesting schedule for awards granted below the Board, vested at 58.9% and 0.0% of maximum respectively. The long-term incentive value reflects the proportion of the three-year period in which she was appointed as CEO. Lavanya Chandrashekar's 2021 performance shares and share options were granted after she became an Executive Director and vested at 56.5% and 0.0% of maximum respectively. Of the 2024 long term incentive amounts shown in the table above none are related to share price appreciation over the fiscal 22 to fiscal 24 performance period. For fiscal 23, long-term incentives comprise performance shares and share options awarded in 2020 that vested in September 2023 at 98.8% and 77.5% of maximum respectively for Debra Crew and Lavanya Chandrashekar, including dividend equivalents on performance shares. These 2020 long-term incentive amounts have been restated to reflect the ADR share price on the vesting date of $160.19 instead of the average three-month ADR share price used in last year’s report of $178.52. | Page 209 |
(6) | Other incentives | Other incentives include the grant face value of awards made under the all-employee share plans. Awards do not have performance conditions attached. | |
(7) | Totals | Some figures and sub-totals add up to slightly different amounts than the totals due to rounding. | |
(8) | Other | The 2023 figures shown for Debra Crew are in respect of the period from 5 June 2023 to 30 June 2023; following her appointment as interim CEO on 5 June 2023 and CEO and Executive Director on 8 June 2023. |
Annual incentive plan (AIP) payouts for 2024 |
Group financial measures(1) | ||||||
Measure | Weighting | Threshold | Target | Maximum | Actual | Payout (% of total AIP opportunity) |
Payout opportunity (% maximum) | 25% | 50% | 100% | |||
Net sales value (% growth)(2) | 26.7% | 3.1% | 6.1% | 9.1% | (0.6)% | — |
Operating profit (% growth)(2) | 26.7% | 1.4% | 6.4% | 11.4% | (4.8)% | — |
Operating cash conversion(3) | 26.7% | 95.0% | 100.0% | 105.0% | 99.6% | 12.80% |
Full year performance for 1 July 2023 - 30 June 2024 | 80.0% | 12.80% |
Individual business objectives | |||
Measure (IBOs equally weighted) and target | Weighting | Result | Payout (% of total AIP opportunity) |
Debra Crew Chief Executive | 20.00% | 12.00% | |
Global market share performance Grow or hold total trade market share in 2/3rds of total net sales in measured markets | 10.00% | We gained or held total trade market share in markets that total 75% of our net sales in fiscal 24(6) | 5.00% |
Productivity improvement Deliver an overall productivity improvement in fiscal 24 of $505m across all cost categories | 10.00% | The productivity target for fiscal 24 has been exceeded as set out below: By the end of fiscal 24, we delivered $698m in productivity savings across all cost categories including supply, marketing and indirect overheads | 7.00% |
Lavanya Chandrashekar Chief Financial Officer | 20.00% | 10.00% | |
Productivity improvement Deliver an overall productivity improvement in fiscal 24 of $505m across all cost categories | 10.00% | The productivity target for fiscal 24 has been exceeded as set out below: By the end of fiscal 24, we delivered $698m in productivity savings across all cost categories including supply, marketing and indirect overheads | 7.00% |
Finance transformation Implement actions to continue the improvement of financial forecasting and sustainable cash management Deliver the agreed project milestones for the finance technology roll out within budget Implement the new functional and presentational currency into all areas of management and reporting | 10.00% | A summary of performance against the finance transformation milestones for fiscal 24 is as follows: Automated forecasting models built internally, rolled out and subject to further embedding Key actions completed to support the delivery of strong cash performance Initial stage of a significant programme of global technology change underway Go live of required changes to functional currency in over 50 systems, restructuring of FX hedges and completion of reporting cycles | 3.00% |
Payout | |||||
Group (weighted 80%) | IBO (weighted 20%) | Total (% max) | Total (% annual salary) | Total (’000) USD | |
Debra Crew(4),(5) | 12.80% | 12.00% | 24.80% | 49.60% | $868 |
Lavanya Chandrashekar(4),(5) | 12.80% | 10.00% | 22.80% | 45.60% | $476 |
Long-term incentive plans (LTIPs) vesting in 2024 |
TSR ranking (out of 17) | Vesting (% max) | TSR ranking (out of 17) | Vesting (% max) | TSR peer group (16 companies) | ||||
1st, 2nd or 3rd | 100 | 7th | 55 | AB InBev | Heineken | Pernod Ricard | ||
4th | 95 | 8th | 45 | Brown-Forman | Kimberly-Clark | Procter & Gamble | ||
5th | 75 | 9th | 20 | Carlsberg | L'Oréal | Reckitt Benckiser | ||
6th | 65 | 10th or below | 0 | The Coca-Cola Company | Mondelēz International | Unilever | ||
Colgate-Palmolive | Nestlé | |||||||
Groupe Danone | PepsiCo | |||||||
Vesting of 2021 DLTIP(5) | Weighting | Threshold | Midpoint | Maximum | Actual | Debra Crew vesting (% maximum)(5)(6) | Lavanya Chandrashekar vesting (% maximum)(5)(6) |
Vesting if performance achieved (% maximum)(6) | 20%/25% | 60%/62.5% | 100% | ||||
Organic net sales value growth (NSV)(1) | 40.0% | 5.0% | 7.0% | 9.0% | 8.7% | 37.8% | 37.6% |
Profit before exceptional items and tax (PBET) growth(2) | 40.0% | 6.5% | 10.0% | 13.5% | 6.9% | 11.7% | 9.8% |
Carbon reduction (ESG) | 5.0% | 19.1% | 23.1% | 27.1% | 19.6% | 1.5% | 1.3% |
Water efficiency (ESG) | 5.0% | 6.3% | 9.2% | 12.1% | 4.2% | — | — |
Positive drinking (ESG) | 5.0% | 2.3m | 3.0m | 3.7m | 3.8m | 5.0% | 5.0% |
Inclusion & diversity - % female leaders globally (ESG) | 2.5% | 44.0% | 45.0% | 46.0% | 44.0% | 0.6% | 0.5% |
Inclusion & diversity - % ethnically diverse leaders globally (ESG) | 2.5% | 39.0% | 40.0% | 41.0% | 46.0% | 2.5% | 2.5% |
Vesting of performance shares (% maximum) | 58.9% | 56.5% | |||||
Cumulative free cash flow (FCF)(3) | 50.0% | $10,058m | $11,273m | $12,488m | $9,798m | — | — |
Relative total shareholder return(4) | 50.0% | 9th | — | 3rd | 14th | — | — |
Vesting of share options (% maximum) | — | — |
Award | Award Date | Awarded (ADRs) | Vesting (% Max) | Vesting (ADRs) | Option price | ADR price | Dividend equivalent share | Estimated value ($'000)(1) | |
Debra Crew (2) | Performance Shares | 03/09/2021 | 9663 | 58.9% | 5,691 | $137.77 | 494 | $852 | |
Share Options | 03/09/2021 | 9663 | — | — | $194.75 | $137.77 | — | — | |
Lavanya Chandrashekar | Performance Shares | 03/09/2021 | 20,060 | 56.5% | 11,333 | $137.77 | 985 | $1,697 | |
Share Options | 03/09/2021 | 20,060 | — | — | $194.75 | $137.77 | — | — |
30 June 2024 | 30 June 2023 | |
Executive Director | US benefit value $'000 | US benefit value $'000 |
Debra Crew(1) | 1,245 | 958 |
Lavanya Chandrashekar(2) | 689 | 520 |
Executive Director | UK benefits (DPS) | US benefits (Cash Balance Plan) | US benefits (BSP) | US benefits (SERP) | |
Debra Crew | n/a | 65 | 6 months after leaving service, or age 55 if later | 6 months after leaving service, or age 55 if later | |
Lavanya Chandrashekar | n/a | 65 | 6 months after leaving service, or age 55 if later | 6 months after leaving service, or age 55 if later |
Performance shares | Share options | |||||||||
2023 DLTIP | Organic net sales value (CAGR) | Organic profit before exceptional items and tax (CAGR) | Greenhouse gas reduction | Water efficiency index | Positive drinking | % Female leaders | % Ethnically diverse leaders | Cumulative free cash flow(1) | Relative TSR | |
Weighting | 40% | 40% | 5% | 5% | 5% | 2.5% | 2.5% | 50% | 50% | |
Target range | 4.0% - 8.0% | 4.5% - 11.5% | 17.9% - 25.9% | 3.7% - 8.3% | 2.8m - 4.2m | 47% - 49% | 44% - 46% | $9,400m - $12,600m | 9th - 3rd and above | |
Executive Director | Date of grant | Plan | Share type | Awards made during the year | Exercise price | Face value $'000 | Face value (% of salary) |
Debra Crew | 04/09/2023 | DLTIP - share options | ADR | 36,971 | $166.67 | $6,563 | 375% |
Debra Crew | 04/09/2023 | DLTIP - performance shares | ADR | 36,971 | $6,563 | 375% | |
Lavanya Chandrashekar | 04/09/2023 | DLTIP - share options | ADR | 21,182 | $166.67 | $3,760 | 360% |
Lavanya Chandrashekar | 04/09/2023 | DLTIP - performance shares | ADR | 21,182 | $3,760 | 360% |
Plan name | Date of award | Performa nce period | Year of vesting | Award calculati on share price | Exercise price | Number of shares/ options at 30 June 2023(1) | Granted | Vested/ exercised | Dividen d equivale nt shares released | Lapsed | Number of shares/ options at 30 June 2024(1) | |
Debra Crew | ||||||||||||
DLTIP - Share Options(4) | Sep 2021 | 2021-2024 | 2024 | $194.75 | 27,019 | 27,019 | ADR | |||||
DLTIP - Share Options | Sep 2022 | 2022-2025 | 2025 | $176.95 | 26,629 | 26,629 | ADR | |||||
DLTIP - Share Options | Sep 2023 | 2023-2026 | 2026 | $166.67 | 36,971 | 36,971 | ADR | |||||
Total unvested share options subject to performance in Ordinary shares(2) | 362,476 | ORD | ||||||||||
DLTIP - Share Options(3) | Sep 2020 | 2020-2023 | 2023 | $133.88 | 30,076 | 23,308 | 6,768 | 23,308 | ADR | |||
Total vested but unexercised share options in Ordinary shares(2) | 93,232 | ORD | ||||||||||
DLTIP - Performance Shares | Sep 2020 | 2020-2023 | 2023 | $143.63 | 30,076 | 29,715 | 2,101 | 361 | — | ADR | ||
DESAP - Performance Shares(5) | Sep 2020 | 2020-2023 | 2023 | $143.63 | 19,494 | 20,622 | 1,362 | 234 | — | ADR | ||
Total vested shares subject to performance in Ordinary shares(2) | — | ORD | ||||||||||
DLTIP - Performance Shares(4) | Sep 2021 | 2021-2024 | 2024 | $174.97 | 27,019 | 27,019 | ADR | |||||
DLTIP - Performance Shares | Sep 2022 | 2022-2025 | 2025 | $195.29 | 26,629 | 26,629 | ADR | |||||
DLTIP - Performance Shares | Sep 2023 | 2023-2026 | 2026 | $177.50 | 36,971 | 36,971 | ADR | |||||
DESAP - Performance Shares(5) | Mar 2022 | 2023-2025 | 2026 | $197.06 | 8,796 | 8,796 | ADR | |||||
DESAP - Performance Shares(5) | Mar 2022 | 2024-2026 | 2027 | $197.06 | 8,930 | 8,930 | ADR | |||||
DESAP - Performance Shares(5) | Mar 2022 | 2025-2027 | 2028 | $197.06 | 8,930 | 8,930 | ADR | |||||
Total unvested shares subject to performance in Ordinary shares(2) | 469,100 | ORD | ||||||||||
DESAP - Restricted Stock Unit(5) | Mar 2022 | 2027 | $197.06 | 8,796 | 8,796 | ADR | ||||||
DESAP - Restricted Stock Unit(5) | Mar 2022 | 2028 | $197.06 | 8,930 | 8,930 | ADR | ||||||
DESAP - Restricted Stock Unit(5) | Mar 2022 | 2029 | $197.06 | 8,930 | 8,930 | ADR | ||||||
Total unvested shares not subject to performance in Ordinary shares(2) | 106,624 | ORD | ||||||||||
Lavanya Chandrashekar | ||||||||||||
DLTIP - Share Options(3) | Sep 2018 | 2018-2021 | 2021 | $140.89 | 3,832 | 3,832 | 3,832 | ADR | ||||
DLTIP - Share Options(3) | Sep 2018 | 2018-2021 | 2021 | $140.89 | 1,064 | 1,064 | 1,064 | ADR | ||||
Total vested but unexercised share options in Ordinary shares(2) | 19,584 | ORD | ||||||||||
DLTIP - Share Options(4) | Sep 2021 | 2021-2024 | 2024 | $194.75 | 20,060 | 20,060 | ADR | |||||
DLTIP - Share Options | Sep 2022 | 2022-2025 | 2025 | $176.95 | 18,512 | 18,512 | ADR | |||||
DLTIP - Share Options | Sep 2023 | 2023-2026 | 2026 | $166.67 | 21,182 | 21,182 | ADR | |||||
Total unvested share options subject to performance in Ordinary shares(2) | 239,016 | ORD | ||||||||||
DLTIP - Performance Shares | Sep 2020 | 2020-2023 | 2023 | $143.63 | 1,827 | 1,805 | 127 | 22 | — | ADR | ||
Total vested shares subject to performance in Ordinary shares(2) | — | ORD | ||||||||||
DLTIP - Performance Shares | Sep 2021 | 2021-2024 | 2024 | $174.97 | 20,060 | 20,060 | ADR | |||||
DLTIP - Performance Shares | Sep 2022 | 2022-2025 | 2025 | $195.29 | 18,512 | 18,512 | ADR | |||||
DLTIP - Performance Shares | Sep 2023 | 2023-2026 | 2026 | $177.50 | 21,182 | 21,182 | ADR | |||||
Total unvested shares subject to performance in Ordinary shares(2) | 239,016 | ORD | ||||||||||
DLTIP - Restricted Stock Units(6) | Sep 2020 | 2020-2023 | 2023 | $143.63 | 2,635 | 2,635 | 2,635 | — | ADR | |||
Total unvested shares not subject to performance in Ordinary shares(2) | — | ORD | ||||||||||
Directors’ shareholding requirement and share interests |
Ordinary shares or equivalent(1),(2) | ||||||
24 July 2024 | 30 June 2024 (or date of cessation, if earlier) | 30 June 2023 (or date of appointment if later) | Shareholding requirement (% salary)(3) | Shareholding at 30 June 2024 (% salary)(3) | Shareholding requirement met | |
Chair | ||||||
Javier Ferrán(5) | 314,830 | 314,498 | 310,468 | |||
Executive Directors | ||||||
Debra Crew(4)(5) | 122,736 | 122,736 | 260 | 500% | 240% | No - to be met by June 2028 |
Lavanya Chandrashekar (4),(5),(6) | 30,412 | 30,406 | 17,901 | 400% | 100% | No - to be met by July 2026 |
Non-Executive Directors | ||||||
Susan Kilsby(5) | 2,600 | 2,600 | 2,600 | |||
Melissa Bethell | 2,668 | 2,668 | 2,668 | |||
Valérie Chapoulaud-Floquet | 2,154 | 2,154 | 2,098 | |||
Sir John Manzoni | 3,007 | 3,007 | 2,929 | |||
Lady Nicola Mendelsohn(8) | N/A | 5,000 | 5,000 | |||
Alan Stewart(7) | 7,550 | 7,550 | 7,354 | |||
Ireena Vittal | — | — | — | |||
Karen Blackett | 702 | 702 | — | |||
Distributions to shareholders (13.7)% | Staff pay5.4% |


Total shareholder return - value of hypothetical £100 holding | Chief Executive total remuneration (includes legacy LTIP awards) (£'000) |
ò | Diageo |
ò | FTSE 100 |
ò | Chief Executive total remuneration |
Ivan Menezes(1) £'000 F15 | Ivan Menezes(1) £'000 F16 | Ivan Menezes(1) £'000 F17 | Ivan Menezes(1) £'000 F18 | Ivan Menezes(1) £'000 F19 | Ivan Menezes(1) £'000 F20 | Ivan Menezes(1) £'000 F21 | Ivan Menezes(1) £'000 F22 | Ivan Menezes(1) £'000 F23 | Debra Crew(1)(2) £'000 F23 | Debra Crew(1)(2) £'000 F24 | |
Chief Executive total remuneration(2) | 3,888 | 4,156 | 3,399 | 8,995 | 11,776 | 2,273 | 6,019 | 7,343 | 10,582 | 403 | 3,067 |
Annual incentive(3) | 44.0% | 65.0% | 68.0% | 70.0% | 61.0% | 0.0% | 93.8% | 93.8% | 37.3% | 35.4% | 24.8% |
Share options(3) | 0.0% | 0.0% | 0.0% | 60.0% | 73.1% | 27.5% | 10.0% | 61.5% | 77.5% | 77.5% | 0.0% |
Performance shares(3) | 33.0% | 31.0% | 0.0% | 70.0% | 89.3% | 10.0% | 29.3% | 59.3% | 98.7% | 98.8% | 58.9% |
Remuneration for the wider workforce and CEO pay ratio |
Year | Method | 25th percentile pay ratio | Median pay ratio | 75th percentile pay ratio |
2024(1) | Option A | 69:1 | 51:1 | 40:1 |
2024 | Total pay and benefits | £44,668 | £60,620 | £77,388 |
2024 | Salary | £39,229 | £50,720 | £59,850 |
2023(2)(3) | Option A(4) | 231:1 | 177:1 | 137:1 |
2022(3) | Option A(4) | 146:1 | 114:1 | 90:1 |
2021 | Option A(4) | 127:1 | 100:1 | 79:1 |
2020 | Option A(4) | 50:1 | 38:1 | 31:1 |
2019 | Option A(4) | 265:1 | 208:1 | 166:1 |
2024 | 2023 | 2022 | 2021 | 2020 | |||||||||||
Salary | Bonus | Benefits | Salary | Bonus | Benefits | Salary | Bonus | Benefits | Salary | Bonus | Benefits | Salary | Bonus | Benefits | |
Plc employee average(1) | 6.2% | (44.8%) | 10.0% | 9.0% | (61.3%) | (7.2%) | 11.1% | 25.8% | 10.5% | 5.1% | N/A(5) | 38.8% | 7.5% | (100.0%) | 9.0% |
Average global employee(2) | 11.1% | (17.6%) | 3.1% | 12.9% | (41.6%) | 17.0% | 6.4% | 38.4% | 11.7% | — | 278.8% | 12.6% | 5.3% | (67.8%) | 6.9% |
Executive Directors(3) | |||||||||||||||
Debra Crew(5) | N/A(5) | N/A(5) | N/A(5) | N/A(5) | N/A(5) | N/A(5) | N/A(5) | N/A(5) | N/A(5) | N/A(5) | N/A(5) | N/A(5) | N/A(5) | N/A(5) | N/A(5) |
Lavanya Chandrashekar | 3.8% | (34.1%) | (22.1%) | 2.3% | (58.8)% | (89.4)% | N/A(5) | N/A(5) | N/A(5) | N/A(5) | N/A(5) | N/A(5) | N/A(5) | N/A(5) | N/A(5) |
Non-Executive Directors(4) | |||||||||||||||
Melissa Bethell | 3.6% | _ | 218.4% | 3.0% | — | 10.1% | 2.3% | — | 16.0% | N/A(5) | — | — | — | — | — |
Karen Blackett (5) | 3.6% | _ | 4231.3% | N/A(5) | — | N/A(5) | N/A(5) | — | N/A(5) | — | — | — | — | — | — |
Valérie Chapoulaud- Floquet | 3.6% | _ | 159.0% | 3.0% | — | 108.5% | — | — | — | N/A(5) | — | — | — | — | — |
Javier Ferrán (Chair) | 4.1% | _ | 132.9% | 2.3% | — | (22.4%) | 8.3% | — | 28.8% | — | — | — | — | — | — |
Susan Kilsby | 4.5% | _ | 182.7% | 2.6% | — | 125.7% | 3.8% | — | 300.0% | 9.6% | — | (87.7%) | 37.3% | — | 68.9% |
Sir John Manzoni | 3.6% | _ | 241.5% | 3.0% | — | 20.0% | — | — | — | — | — | — | — | — | — |
Lady Nicola Mendelsohn | N/A(5) | _ | N/A(5) | 3.0% | — | — | 2.3% | — | — | 3.2% | — | — | 3.3% | — | — |
Alan Stewart | 2.7% | _ | 252.8% | 3.2% | — | — | 4.7% | — | — | 2.4% | — | — | 2.5% | — | — |
Ireena Vittal | 3.6% | _ | 689.2% | 3.0% | — | 734.0% | — | — | — | — | — | — | — | — | — |
Non-Executive Directors |
2024 | 2023 | |
Per annum fees | £'000 | £'000 |
Chair of the Board | 700 | 670 |
Non-Executive Directors | ||
Base fee | 108 | 104 |
Senior Non-Executive Director | 35 | 30 |
Chair of the Audit Committee | 35 | 35 |
Chair of the Remuneration Committee | 35 | 35 |
Fees £'000 | Taxable benefits £'000(1) | Total £'000(2) | ||||
2024 | 2023 | 2024 | 2023 | 2024 | 2023 | |
Chair | ||||||
Javier Ferrán | 692 | 665 | 4 | 1 | 696 | 666 |
Non-Executive Directors | ||||||
Melissa Bethell | 107 | 103 | 5 | 2 | 112 | 105 |
Karen Blackett | 107 | 103 | 5 | 1 | 112 | 104 |
Valérie Chapoulaud-Floquet | 107 | 103 | 13 | 10 | 120 | 113 |
Susan Kilsby | 176 | 168 | 14 | 11 | 190 | 179 |
Sir John Manzoni | 107 | 103 | 4 | 2 | 111 | 105 |
Lady Nicola Mendelsohn(3) | 26 | 103 | 1 | 1 | 27 | 104 |
Alan Stewart | 142 | 138 | 4 | 1 | 146 | 139 |
Ireena Vittal | 107 | 103 | 10 | 10 | 117 | 113 |
Salary increases for the year ending 30 June 2025 |
Debra Crew | Lavanya Chandrashekar | |||
Salary at 1 October ('000) | 2024 | 2023 | 2024 | 2023 |
Base salary | $1,824 | $1,750 | $1,044 | $1,044 |
% increase (over previous year) | 4.25% | n/a | 0% | 4% |
Annual incentive design for the year ending 30 June 2025 |
Long-term incentive awards to be made in the year ending 30 June 2025 |
Grant value (% salary) | Chief Executive | Chief Financial Officer |
Performance share equivalents (1 share: 3 options) | ||
Performance shares | 375% | 360% |
Share options | 125% | 120% |
Total | 500% | 480% |
Performance shares | Share options | |||||||||||
Organic profit before exceptional items and tax (CAGR) | Environmental, social & governance (ESG) | |||||||||||
Organic net sales (CAGR) | Greenhouse gas reduction | Water efficiency index | Positive drinking | % Female leaders | % Ethnically diverse leaders | Vesting schedule | Relative Total Shareholder Return | Cumulative free cash flow ($m) | Vesting schedule | |||
Weighting (% total) | 40% | 40% | 5% | 5% | 5% | 2.5% | 2.5% | 50.0% | 50.0% | |||
Maximum | 6.0% | 9.1% | 29.9% | 11.2% | 3.7m | 50% | 49% | 100% | 3rd and above | $9,950 | 100% | |
Midpoint | 4.5% | 6.1% | 23.1% | 8.7% | 3.1m | 48% | 47% | 60% | — | $8,550 | 60% | |
Threshold | 3.0% | 3.1% | 16.3% | 6.2% | 2.5m | 46% | 45% | 20% | 9th | $7,150 | 20% | |
Shareholder | Number of ordinary shares | Percentage of issued ordinary share (excluding treasury shares) | Date of notification of interest |
BlackRock Investment Management (UK) Limited (indirect holding)(1) | 147,296,928 | 5.89% | 3 December 2009 |
Capital Research and Management Company (indirect holding) | 124,653,096 | 4.99% | 28 April 2009 |
Massachusetts Financial Services Company (indirect holding) | 111,560,606 | 4.99% | 29 February 2024 |
Information (including that required by UK Listing Authority Listing Rule 9.8.4) | Location in Annual Report |
Agreements with controlling shareholders | Not applicable |
Contracts of significance | Not applicable |
Details of long-term incentive schemes | Directors’ remuneration report |
Directors’ indemnities and compensation | Directors’ remuneration report - Additional information; Consolidated financial statements - note 21 Related party transactions |
Dividends | Group financial review; Consolidated financial statements - Unaudited financial information |
Engagement with employees | Corporate governance report - Workforce engagement statement |
Engagement with suppliers, customers and others | Corporate governance report - Stakeholder engagement |
Events post 30 June 2024 | Consolidated financial statements - note 23 Post balance sheet events |
Financial risk management | Consolidated financial statements - note 16 Financial instruments and risk management |
Future developments | Chair’s statement; Chief Executive’s statement; Market overview and investment case; Business model; Our growth ambition |
Greenhouse gas emissions | Pioneer grain-to-glass sustainability; Non-Financial and sustainability information statement |
Interest capitalised | Not applicable |
Non-pre-emptive issues of equity for cash (including in respect of major unlisted subsidiaries) | Not applicable |
Parent participation in a placing by a listed subsidiary | Not applicable |
Political donations | Corporate governance report |
Provision of services by a controlling shareholder | Not applicable |
Publication of unaudited financial information | Unaudited financial information |
Purchase of own shares | Repurchase of shares; Consolidated financial statements - note 18 Equity |
Research and development | Other additional information - Research and development; Consolidated financial statements - note 4 Operating costs |
Review of the business and principal risks and uncertainties | Chief Executive’s statement; Our principal risks and risk management; Pioneer grain-to-glass sustainability; Business review |
Share capital - structure, voting and other rights | Consolidated financial statements - note 18 Equity |
Share capital - employee share plan voting rights | Consolidated financial statements - note 18 Equity |
Shareholder waivers of dividends | Consolidated financial statements - note 18 Equity |
Shareholder waivers of future dividends | Consolidated financial statements - note 18 Equity |
Streamlined Energy and Carbon Reporting (SECR) disclosures | Pioneer grain-to-glass sustainability |
Sustainability and responsibility | Pioneer grain-to-glass sustainability |
Waiver of emoluments by a director | Not applicable |
Waiver of future emoluments by a director | Not applicable |
Notes | Year ended 30 June 2024 $ million | Year ended 30 June 2023 re-presented(1) $ million | Year ended 30 June 2022 re-presented(1) $ million | |
Sales | 2 | |||
Excise duties | 4 | ( | ( | ( |
Net sales | 2 | |||
Cost of sales | 4 | ( | ( | ( |
Gross profit | ||||
Marketing | 4 | ( | ( | ( |
Other operating items | 4 | ( | ( | ( |
Operating profit | ||||
Non-operating items | 3 | ( | ( | |
Finance income | 5 | |||
Finance charges | 5 | ( | ( | ( |
Share of after tax results of associates and joint ventures | 6 | |||
Profit before taxation | ||||
Taxation | 7 | ( | ( | ( |
Profit for the year | ||||
Attributable to: | ||||
Equity shareholders of the parent company | ||||
Non-controlling interests | ||||
million | million | million | ||
Weighted average number of shares | ||||
Shares in issue excluding own shares | ||||
Dilutive potential ordinary shares | ||||
cents | cents | cents | ||
Basic earnings per share | ||||
Diluted earnings per share |
Notes | Year ended 30 June 2024 $ million | Year ended 30 June 2023 re-presented(1) $ million | Year ended 30 June 2022 re-presented(1) $ million | |
Other comprehensive income | ||||
Items that will not be recycled subsequently to the income statement | ||||
Net remeasurement of post-employment benefit plans | ||||
Group | 14 | ( | ( | |
Associates and joint ventures | ||||
Non-controlling interests | 14 | ( | ||
Tax on post-employment benefit plans | ( | |||
Changes in the fair value of equity investments at fair value through other comprehensive income | ( | ( | ( | |
( | ( | |||
Items that may be recycled subsequently to the income statement | ||||
Exchange differences on translation of foreign operations | ||||
Group | ( | ( | ||
Associates and joint ventures | 6 | ( | ( | |
Non-controlling interests | ( | ( | ( | |
Net investment hedges | ( | ( | ||
Exchange loss recycled to the income statement | ||||
On disposal of foreign operations | 8 | |||
On step acquisitions | ||||
Tax on exchange differences – group | ( | |||
Effective portion of changes in fair value of cash flow hedges | ||||
Hedge of foreign currency debt of the group | ( | |||
Transaction exposure hedging of the group | ( | |||
Hedges by associates and joint ventures | ( | ( | ||
Commodity price risk hedging of the group | ( | |||
Recycled to income statement – hedge of foreign currency debt of the group | ( | |||
Recycled to income statement – transaction exposure hedging of the group | ( | ( | ||
Recycled to income statement – commodity price risk hedging of the group | ( | ( | ||
Cost of hedging | ( | |||
Recycled to income statement – cost of hedging | ( | |||
Tax on effective portion of changes in fair value of cash flow hedges | ( | |||
Hyperinflation adjustments | ||||
Tax on hyperinflation adjustments(2) | ( | ( | ( | |
( | ( | |||
Other comprehensive (loss)/income, net of tax, for the year | ( | ( | ||
Profit for the year | ||||
Total comprehensive income for the year | ||||
Attributable to: | ||||
Equity shareholders of the parent company | ||||
Non-controlling interests | 18 | ( | ||
Total comprehensive income for the year |
30 June 2024 | 30 June 2023 | 1 July 2022 | |||||
Notes | $ million | $ million | re-presented(1) $ million | re-presented(1) $ million | re-presented(1) $ million | re-presented(1) $ million | |
Non-current assets | |||||||
Intangible assets | 9 | ||||||
Property, plant and equipment | 10 | ||||||
Biological assets | 11 | ||||||
Investments in associates and joint ventures | 6 | ||||||
Other investments | 13 | ||||||
Other receivables | 15 | ||||||
Other financial assets | 16 | ||||||
Deferred tax assets | 7 | ||||||
Post-employment benefit assets | 14 | ||||||
Current assets | |||||||
Inventories | 15 | ||||||
Trade and other receivables | 15 | ||||||
Corporate tax receivables | 7 | ||||||
Assets held for sale | 8 | ||||||
Other financial assets | 16 | ||||||
Cash and cash equivalents | 17 | ||||||
Total assets | |||||||
Current liabilities | |||||||
Borrowings and bank overdrafts | 17 | ( | ( | ( | |||
Other financial liabilities | 16 | ( | ( | ( | |||
Share buyback liability | ( | ||||||
Trade and other payables | 15 | ( | ( | ( | |||
Liabilities held for sale | 8 | ( | ( | ||||
Corporate tax payables | 7 | ( | ( | ( | |||
Provisions | 15 | ( | ( | ( | |||
( | ( | ( | |||||
Non-current liabilities | |||||||
Borrowings | 17 | ( | ( | ( | |||
Other financial liabilities | 16 | ( | ( | ( | |||
Other payables | 15 | ( | ( | ( | |||
Provisions | 15 | ( | ( | ( | |||
Deferred tax liabilities | 7 | ( | ( | ( | |||
Post-employment benefit liabilities | 14 | ( | ( | ( | |||
( | ( | ( | |||||
Total liabilities | ( | ( | ( | ||||
Net assets | |||||||
Equity | |||||||
Share capital | 18 | ||||||
Share premium | |||||||
Other reserves | ( | ||||||
Retained earnings | |||||||
Equity attributable to equity shareholders of the parent company | |||||||
Non-controlling interests | 18 | ||||||
Total equity | |||||||
Other reserves | Retained earnings/(deficit) | ||||||||||
Notes | Share capital $ million | Share premium $ million | Capital redemption reserve $ million | Hedging and exchange reserve $ million | Own shares $ million | Other retained earnings $ million | Total $ million | Equity attributable to parent company shareholders $ million | Non- controlling interests $ million | Total equity $ million | |
At 30 June 2021 (re-presented(1)) | ( | ( | |||||||||
Adjustment to 2021 closing equity in respect of hyperinflation in Türkiye | — | — | — | — | — | ||||||
Adjusted opening balance | ( | ( | |||||||||
Retranslation impact of opening balances(2) | ( | ( | ( | ||||||||
Profit for the year | — | — | — | — | — | ||||||
Other comprehensive (loss)/income | — | — | — | ( | — | ( | |||||
Total comprehensive (loss)/income for the year | — | — | — | ( | — | ||||||
Employee share schemes | — | — | — | — | — | ||||||
Share-based incentive plans | 18 | — | — | — | — | — | — | ||||
Share-based incentive plans in respect of associates | — | — | — | — | — | — | |||||
Tax on share-based incentive plans | — | — | — | — | — | — | |||||
Share-based payments and purchase of own shares in respect of subsidiaries | — | — | — | — | — | ( | ( | ( | ( | ( | |
Unclaimed dividend | — | — | — | — | — | ||||||
Change in fair value of put option | — | — | — | — | — | ( | ( | ( | — | ( | |
Share buyback programme | ( | — | — | — | ( | ( | ( | — | ( | ||
Dividend declared for the year | 18 | — | — | — | — | — | ( | ( | ( | ( | ( |
At 30 June 2022 (re-presented(1)) | ( | ( | |||||||||
Retranslation impact of opening balances(2) | ( | ( | ( | ||||||||
Profit for the year | — | — | — | — | — | ||||||
Other comprehensive income/(loss) | — | — | — | — | ( | ( | ( | ( | ( | ||
Total comprehensive income/(loss) for the year | — | — | — | — | ( | ||||||
Employee share schemes | — | — | — | — | — | ||||||
Share-based incentive plans | 18 | — | — | — | — | — | — | ||||
Share-based incentive plans in respect of associates | — | — | — | — | — | — | |||||
Tax on share-based incentive plans | — | — | — | — | — | — | |||||
Share-based payments and purchase of own shares in respect of subsidiaries | — | — | — | — | — | ||||||
Purchase of non-controlling interests | 8 | — | — | — | — | — | ( | ( | ( | ( | ( |
Associates' transactions with non-controlling interests | — | — | — | — | — | ( | ( | ( | — | ( | |
Unclaimed dividend | — | — | — | — | — | ||||||
Change in fair value of put option | — | — | — | — | — | ( | ( | ( | — | ( | |
Share buyback programme | ( | — | — | — | ( | ( | ( | — | ( | ||
Dividend declared for the year | 18 | — | — | — | — | — | ( | ( | ( | ( | ( |
At 30 June 2023 (re-presented(1)) | ( | ( | |||||||||
Adjustment to 2023 closing equity in respect of hyperinflation in Ghana | — | — | — | — | — | ||||||
Adjusted opening balance | ( | ( | |||||||||
Profit for the year | — | — | — | — | — | ||||||
Other comprehensive (loss)/income | — | — | — | ( | — | ( | ( | ( | |||
Total comprehensive (loss)/income for the year | — | — | — | ( | — | ||||||
Employee share schemes | — | — | — | — | — | ||||||
Share-based incentive plans | 18 | — | — | — | — | — | — | ||||
Share-based incentive plans in respect of associates | — | — | — | — | — | — | |||||
Share-based payments and purchase of own shares in respect of subsidiaries | — | — | — | — | — | ( | ( | ( | ( | ( | |
Purchase of non-controlling interests | 8 | — | — | — | — | — | ( | ( | ( | ( | |
Tax on purchase of non-controlling interests | — | — | — | — | — | ||||||
Unclaimed dividend | — | — | — | — | — | ||||||
Change in fair value of put option | — | — | — | — | — | — | |||||
Share buyback programme | ( | — | — | — | ( | ( | ( | — | ( | ||
Dividend declared for the year | 18 | — | — | — | — | — | ( | ( | ( | ( | ( |
At 30 June 2024 | ( | ( | |||||||||
Year ended 30 June 2024 | Year ended 30 June 2023 | Year ended 30 June 2022 | |||||
Notes | $ million | $ million | re- presented(1) $ million | re- presented(1) $ million | re- presented(1) $ million | re- presented(1) $ million | |
Cash flows from operating activities | |||||||
Profit for the year | |||||||
Taxation | |||||||
Share of after tax results of associates and joint ventures | ( | ( | ( | ||||
Net finance charges | |||||||
Non-operating items | ( | ||||||
Operating profit | |||||||
Increase in inventories | ( | ( | ( | ||||
(Increase)/decrease in trade and other receivables | ( | ( | |||||
(Decrease)/increase in trade and other payables and provisions | ( | ( | |||||
Net increase in working capital | ( | ( | ( | ||||
Depreciation, amortisation and impairment | |||||||
Dividends received | |||||||
Post-employment payments less amounts included in operating profit | ( | ( | ( | ||||
Other items | |||||||
Cash generated from operations | |||||||
Interest received | |||||||
Interest paid | ( | ( | ( | ||||
Taxation paid | ( | ( | ( | ||||
( | ( | ( | |||||
Net cash inflow from operating activities | |||||||
Cash flows from investing activities | |||||||
Disposal of property, plant and equipment and computer software | |||||||
Purchase of property, plant and equipment and computer software | ( | ( | ( | ||||
Movements in loans and other investments | ( | ( | ( | ||||
Sale of businesses and brands | 8 | ||||||
Acquisition of subsidiaries | 8 | ( | ( | ( | |||
Investments in associates and joint ventures | 8 | ( | ( | ( | |||
Net cash outflow from investing activities | ( | ( | ( | ||||
Cash flows from financing activities | |||||||
Share buyback programme | 18 | ( | ( | ( | |||
Net sale of own shares for share schemes | |||||||
Purchase of treasury shares in respect of subsidiaries | ( | ( | |||||
Dividends paid to non-controlling interests | ( | ( | ( | ||||
Proceeds from bonds | 17 | ||||||
Repayment of bonds | 17 | ( | ( | ( | |||
Purchase of shares of non-controlling interests | 8 | ( | ( | ||||
Cash inflow from other borrowings | |||||||
Cash outflow from other borrowings | ( | ( | ( | ||||
Equity dividends paid | ( | ( | ( | ||||
Net cash outflow from financing activities | ( | ( | ( | ||||
Net decrease in net cash and cash equivalents | 17 | ( | ( | ( | |||
Exchange differences | ( | ( | ( | ||||
Reclassification to assets held for sale | ( | ||||||
Net cash and cash equivalents at beginning of the year | |||||||
Net cash and cash equivalents at end of the year | |||||||
Net cash and cash equivalents consist of: | |||||||
Cash and cash equivalents | 17 | ||||||
Bank overdrafts | 17 | ( | ( | ( | |||
2024 | 2023 | 2022 | |
Sterling | |||
Income statement and cash flows(1) | |||
Assets and liabilities(2) | |||
Euro | |||
Income statement and cash flows(1) | |||
Assets and liabilities(2) |
North America | Europe | Asia Pacific | Latin America and Caribbean | Africa | SC&P | Eliminate inter- segment sales | Total operating segments | Corporate and other | Total | |
$ million | $ million | $ million | $ million | $ million | $ million | $ million | $ million | $ million | $ million | |
2024 | ||||||||||
Sales | ( | |||||||||
Net sales | ||||||||||
At budgeted exchange rates(1) | ( | |||||||||
Acquisitions and disposals | ||||||||||
SC&P allocation | ( | |||||||||
Retranslation to actual exchange rates | ( | ( | ( | ( | ( | ( | ( | |||
Hyperinflation | ||||||||||
Net sales | ( | |||||||||
Operating profit/(loss) | ||||||||||
At budgeted exchange rates(1) | ( | — | ( | |||||||
Acquisitions and disposals | ( | ( | — | |||||||
SC&P allocation | ( | ( | ( | ( | ( | — | ||||
Fair value remeasurements | ( | — | ||||||||
Retranslation to actual exchange rates | ( | ( | ( | — | ( | ( | ( | |||
Hyperinflation | ( | ( | — | ( | ( | |||||
Operating profit/(loss) before exceptional items | — | ( | ||||||||
Exceptional operating items(2) | ( | ( | — | |||||||
Operating profit/(loss) | — | ( | ||||||||
Non-operating items | ( | |||||||||
Net finance charges | ( | |||||||||
Share of after tax results of associates and joint ventures | ||||||||||
Profit before taxation |
North America | Europe | Asia Pacific | Latin America and Caribbean | Africa | SC&P | Eliminate inter- segment sales | Total operating segments | Corporate and other | Total | |
re- presented $ million | re- presented $ million | re- presented $ million | re- presented $ million | re- presented $ million | re- presented $ million | re- presented $ million | re- presented $ million | re- presented $ million | re- presented $ million | |
2023 | ||||||||||
Sales | ( | |||||||||
Net sales | ||||||||||
At budgeted exchange rates(1) | ( | |||||||||
Acquisitions and disposals | ||||||||||
SC&P allocation | ( | |||||||||
Retranslation to actual exchange rates | ( | ( | ( | ( | ( | ( | ( | ( | ( | |
Hyperinflation | ||||||||||
Net sales | ( | |||||||||
Operating profit/(loss) | ||||||||||
At budgeted exchange rates(1) | ( | — | ( | |||||||
Acquisitions and disposals | ( | ( | — | ( | ( | |||||
SC&P allocation | ( | ( | ( | ( | — | |||||
Fair value remeasurements | — | |||||||||
Retranslation to actual exchange rates | ( | ( | ( | ( | ( | — | ( | ( | ||
Hyperinflation | — | |||||||||
Operating profit/(loss) before exceptional items | — | ( | ||||||||
Exceptional operating items(2) | ( | ( | ( | ( | — | ( | ( | |||
Operating profit/(loss) | — | ( | ||||||||
Non-operating items | ||||||||||
Net finance charges | ( | |||||||||
Share of after tax results of associates and joint ventures | ||||||||||
Profit before taxation |
North America | Europe | Asia Pacific | Latin America and Caribbean | Africa | SC&P | Eliminate inter- segment sales | Total operating segments | Corporate and other | Total | |
re- presented $ million | re- presented $ million | re- presented $ million | re- presented $ million | re- presented $ million | re- presented $ million | re- presented $ million | re- presented $ million | re- presented $ million | re- presented $ million | |
2022 | ||||||||||
Sales | ( | |||||||||
Net sales | ||||||||||
At budgeted exchange rates(1) | ( | |||||||||
Acquisitions and disposals | ||||||||||
SC&P allocation | ( | |||||||||
Retranslation to actual exchange rates | ( | ( | ( | ( | ( | ( | ( | |||
Hyperinflation | ||||||||||
Net sales | ( | |||||||||
Operating profit/(loss) | ||||||||||
At budgeted exchange rates(1) | ( | — | ( | |||||||
Acquisitions and disposals | ( | ( | — | ( | ( | |||||
SC&P allocation | ( | ( | ( | ( | ( | — | ||||
Fair value remeasurements | ( | — | ||||||||
Retranslation to actual exchange rates | ( | ( | — | ( | ( | |||||
Hyperinflation | — | |||||||||
Operating profit/(loss) before exceptional items | — | ( | ||||||||
Exceptional operating items(2) | ( | ( | ( | — | ( | ( | ||||
Operating profit/(loss) | — | ( | ||||||||
Non-operating items | ( | |||||||||
Net finance charges | ( | |||||||||
Share of after tax results of associates and joint ventures | ||||||||||
Profit before taxation |
North America $ million | Europe $ million | Asia Pacific $ million | Latin America and Caribbean $ million | Africa $ million | SC&P $ million | Corporate and other $ million | Total $ million | |
2024 | ||||||||
Purchase of property, plant and equipment and computer software | ||||||||
Depreciation and intangible asset amortisation | ( | ( | ( | ( | ( | ( | ( | ( |
Underlying impairment | ( | ( | ||||||
Exceptional impairment of tangible assets | ( | ( | ( | ( | ||||
Exceptional impairment of intangible assets | ( | ( | ||||||
2023 (re-presented) | ||||||||
Purchase of property, plant and equipment and computer software | ||||||||
Depreciation and intangible asset amortisation | ( | ( | ( | ( | ( | ( | ( | ( |
Exceptional impairment of tangible assets | ( | ( | ( | |||||
Exceptional impairment of intangible assets | ( | ( | ( | ( | ||||
2022 (re-presented) | ||||||||
Purchase of property, plant and equipment and computer software | ||||||||
Depreciation and intangible asset amortisation | ( | ( | ( | ( | ( | ( | ( | ( |
Exceptional impairment of tangible assets | ( | ( | ||||||
Exceptional impairment of intangible assets | ( | ( | ( |
Category analysis | Geographic analysis | |||||||||
Spirits $ million | Beer $ million | Ready to drink $ million | Other $ million | Total $ million | United States $ million | India $ million | Great Britain $ million | Rest of World $ million | Total $ million | |
2024 | ||||||||||
Sales(1) | ||||||||||
Non-current assets(2), (3) | ||||||||||
2023 (re-presented) | ||||||||||
Sales(1) | ||||||||||
Non-current assets(2), (3) | ||||||||||
2022 (re-presented) | ||||||||||
Sales(1) | ||||||||||
Non-current assets(2), (3) | ||||||||||
2024 $ million | 2023 re-presented $ million | 2022 re-presented $ million | |
Exceptional operating items | |||
Brand, goodwill and other assets impairment income from reversal/(charge) (1) | ( | ( | |
Supply chain agility programme (2) | ( | ( | |
Various dispute and litigation matters (3) | ( | ||
Distribution termination fee (4) | ( | ||
Winding down Russian operations (5) | ( | ||
Other exceptional operating items (6) | ( | ||
( | ( | ||
Non-operating items | |||
Sale of businesses and brands | |||
Windsor business (7) | ( | ( | |
Guinness Cameroun S.A. (8) | ( | ||
Guinness Nigeria plc (9) | ( | ||
USL Popular brands (10) | |||
Archers brand (11) | |||
USL businesses (12) | |||
Tyku brand (13) | ( | ||
Picon brand (14) | |||
Meta Abo Brewery (15) | ( | ||
Step acquisition - Mr Black (16) | ( | ||
Other non-operating exceptional items (17) | |||
( | ( | ||
Exceptional items before taxation | ( | ( | ( |
Tax on exceptional items (note 7 (b)) | ( | ||
Total exceptional items | ( | ( | ( |
Attributable to: | |||
Equity shareholders of the parent company | ( | ( | ( |
Non-controlling interests | ( | ( | |
Total exceptional items | ( | ( | ( |
2024 $ million | 2023 re-presented $ million | 2022 re-presented $ million | |
Thalidomide (note 15 (d)) | ( | ( | ( |
Winding down Russian operations | ( | ( | ( |
Supply chain agility programme | ( | ( | |
Distribution termination fee | ( | ||
Litigation | ( | ||
Donations | ( | ||
Total cash payments | ( | ( | ( |
2024 $ million | 2023 re-presented $ million | 2022 re-presented $ million | |
Excise duties | |||
Cost of sales | |||
Marketing | |||
Other operating items | |||
Comprising: | |||
Excise duties | |||
India | |||
Great Britain | |||
United States | |||
Other | |||
Increase in inventories | ( | ( | ( |
Raw materials and consumables | |||
Marketing | |||
Other external charges | |||
Staff costs | |||
Depreciation, amortisation and impairment | |||
Gains on disposal of properties | ( | ( | |
Net foreign exchange losses | |||
Other operating income | ( | ( | ( |
2024 $ million | 2023 re-presented $ million | 2022 re-presented $ million | |
Audit of these financial statements | |||
Audit of financial statements of subsidiaries | |||
Audit related assurance services(1) | |||
Total audit fees (Audit fees) | |||
Other assurance services (Audit related fees)(2) | |||
2024 $ million | 2023 re-presented $ million | 2022 re-presented $ million | |
Aggregate remuneration | |||
Wages and salaries | |||
Share-based incentive plans | |||
Employer’s social security | |||
Employer’s pension | |||
Defined benefit plans | |||
Defined contribution plans | |||
Other post-employment plans | |||
2024 | 2023 | 2022 | |
North America | |||
Europe | |||
Asia Pacific | |||
Latin America and Caribbean | |||
Africa | |||
SC&P | |||
Corporate and other | |||
2024 $ million | 2023 re-presented $ million | 2022 re-presented $ million | |
Depreciation, amortisation and impairment | |||
Brand and goodwill impairment (gain)/charges | ( | ||
Tangible asset impairment and accelerated depreciation | |||
Staff costs | |||
Other external charges | |||
Other operating income | ( | ||
Total exceptional operating items (note 3) | ( | ||
Cost of sales | |||
Other operating (income)/expenses | ( |
2024 $ million | 2023 re-presented $ million | 2022 re-presented $ million | |
Interest income | |||
Fair value gain on financial instruments | |||
Total interest income(1) | |||
Interest charge on bonds, commercial paper, bank loans and overdrafts | ( | ( | ( |
Interest charge on finance leases | ( | ( | ( |
Other interest charges | ( | ( | ( |
Fair value loss on financial instruments | ( | ( | ( |
Total interest charges(1) | ( | ( | ( |
Net interest charges | ( | ( | ( |
Net finance income in respect of post-employment plans in surplus (note 14) | |||
Monetary gain on hyperinflation in various economies (note 1 (f)) | |||
Interest income in respect of direct and indirect tax | |||
Unwinding of discounts | |||
Total other finance income | |||
Net finance charge in respect of post-employment plans in deficit (note 14) | ( | ( | ( |
Monetary loss on hyperinflation in various economies (note 1 (f)) | ( | ( | ( |
Interest charge in respect of direct and indirect tax | ( | ( | ( |
Unwinding of discounts | ( | ( | ( |
Change in financial liability - Zacapa (Level 3) | ( | ( | |
Other finance charges | ( | ( | ( |
Total other finance charges | ( | ( | ( |
Net other finance income/(charges) | ( |
Moët Hennessy $ million | Others $ million | Total $ million | |
Cost less provisions | |||
At 30 June 2022 (re-presented) | |||
Exchange differences | |||
Additions | |||
Share of profit/(loss) after tax | ( | ||
Step acquisition | ( | ( | |
Dividends | ( | ( | ( |
Share of movements in other comprehensive income and equity | |||
Transfer | |||
Impairment charged during the year | ( | ( | |
At 30 June 2023 (re-presented) | |||
Exchange differences | ( | ( | ( |
Additions | |||
Share of profit/(loss) after tax | ( | ||
Dividends | ( | ( | ( |
Share of movements in other comprehensive income and equity | |||
Impairment charged during the year | ( | ( | |
At 30 June 2024 |
2024 $ million | 2023 re-presented $ million | 2022 re-presented $ million | |
Sales | |||
Profit for the year | |||
Total comprehensive income |
2024 $ million | 2023 re-presented $ million | |
Non-current assets | ||
Current assets | ||
Total assets | ||
Non-current liabilities | ( | ( |
Current liabilities | ( | ( |
Total liabilities | ( | ( |
Net assets |
United Kingdom | Rest of world | Total | |||||||
2024 $ million | 2023 re- presented $ million | 2022 re- presented $ million | 2024 $ million | 2023 re- presented $ million | 2022 re- presented $ million | 2024 $ million | 2023 re- presented $ million | 2022 re- presented $ million | |
Current tax | |||||||||
Current year | |||||||||
Adjustments in respect of prior years | ( | ( | ( | ( | ( | ||||
Deferred tax | |||||||||
Origination and reversal of temporary differences | ( | ( | ( | ||||||
Changes in tax rates | ( | ( | |||||||
Adjustments in respect of prior years | ( | ( | ( | ( | |||||
( | ( | ( | ( | ( | |||||
Taxation on profit | |||||||||
2024 $ million | 2023 re-presented $ million | 2022 re-presented $ million | |
Brand impairment(1) | ( | ( | |
Disposal of businesses and brands(2) | ( | ||
Supply chain agility programme | ( | ( | |
Various dispute and litigation matters(3) | ( | ||
US guarantee fee claim(4) | ( | ||
Distribution termination fee | ( | ||
Winding down Russian operations | |||
Other items | ( | ||
( | ( |
2024 $ million | 2024 % | 2023 re-presented $ million | 2023 % | 2022 re-presented $ million | 2022 % | |
Profit before taxation | ||||||
Notional charge at UK corporation tax rate | ||||||
Elimination of notional tax on share of after tax results of associates and joint ventures | ( | ( | ( | ( | ( | ( |
Differences in overseas tax rates | ( | ( | ||||
Disposal of businesses and brands | ( | ( | ||||
Other items not chargeable | ( | ( | ( | ( | ( | ( |
Impairment | ( | ( | ||||
Other items not deductible | ||||||
Irrecoverable withholding taxes | ||||||
Movement in provision in respect of uncertain tax positions(1) | ||||||
Changes in tax rates | ( | ( | ||||
Adjustments in respect of prior years(2) | ( | ( | ( | ( | ||
Taxation on profit | ||||||
Tax rate before exceptional items | — | — | — |
Property, plant and equipment $ million | Intangible assets $ million | Post employment plans $ million | Tax losses $ million | Other temporary differences(1) $ million | Total $ million | |
At 30 June 2022 (re-presented) | ( | ( | ( | ( | ||
Exchange differences | ( | ( | ||||
Recognised in income statement | ( | ( | ||||
Recognised in other comprehensive income and equity | ( | ( | ( | |||
Tax rate change – recognised in income statement | ( | ( | ( | ( | ||
Acquisition of subsidiaries | ( | ( | ||||
Transfer from asset held for sale | ( | ( | ( | |||
Sale of businesses | ( | ( | ||||
At 30 June 2023 (re-presented) | ( | ( | ( | ( | ||
Exchange differences | ( | ( | ||||
Recognised in income statement | ( | ( | ( | ( | ( | |
Recognised in other comprehensive loss and equity | ( | ( | ( | ( | ||
Tax rate change – recognised in income statement | ( | |||||
Tax rate change – recognised in other comprehensive loss and equity | ( | ( | ( | ( | ||
Acquisition(2) | ||||||
Transfer to asset held for sale | ( | ( | ( | |||
Sale of businesses | ( | |||||
At 30 June 2024 | ( | ( | ( | ( |
2024 $ million | 2023 re-presented $ million | |
Deferred tax assets | ||
Deferred tax liabilities | ( | ( |
( | ( |
2024 $ million | 2023 re-presented $ million | |
Capital losses – indefinite | ||
Trading losses – indefinite | ||
Trading and capital losses – expiry dates up to 2033 | ||
Net assets acquired and consideration | |||
2024 $ million | 2023 re-presented $ million | 2022 re-presented $ million | |
Brands and other intangibles | |||
Property, plant and equipment | |||
Inventories | |||
Other working capital | ( | ||
Deferred tax | ( | ( | |
Cash | |||
Fair value of assets and liabilities | |||
Goodwill arising on acquisition | |||
Settlement of pre-existing relationship | ( | ||
Step acquisitions | ( | ( | |
Consideration payable | |||
Satisfied by: | |||
Cash consideration paid | ( | ( | |
Contingent consideration payable | ( | ( | |
Deferred consideration payable | ( | ( | |
( | ( | ||
Consideration | |||
2024 $ million | 2023 re-presented $ million | 2022 re-presented $ million | |
Acquisitions in the year - subsidiaries | |||
Cash consideration paid | ( | ( | |
Cash acquired | |||
Prior year acquisitions - subsidiaries | |||
Contingent consideration paid for Casamigos | ( | ||
Other consideration | ( | ( | ( |
Investments in associates | |||
Cash consideration paid - increase in ownership interest | ( | ( | ( |
Capital injection(1) | ( | ( | ( |
Net cash outflow on acquisition of businesses | ( | ( | ( |
Purchase of shares of non-controlling interests | ( | ( | |
Total net cash outflow | ( | ( | ( |
Windsor business $ million | Other $ million | 2024 $ million | 2023 re- presented $ million | 2022 re- presented $ million | |
Sale consideration | |||||
Cash received | |||||
(Cash)/overdraft disposed of | ( | ( | ( | ||
Transaction and other directly attributable costs paid | ( | ( | ( | ( | ( |
Net cash received | ( | ||||
Deferred consideration receivable | |||||
Transaction and other directly attributable costs payable | ( | ( | ( | ( | ( |
( | |||||
Net assets disposed of | |||||
Brands | ( | ( | |||
Goodwill | ( | ||||
Other non-current assets | ( | ( | ( | ( | |
Assets and liabilities held for sale | ( | ||||
Inventories | ( | ( | ( | ( | |
Other working capital | |||||
Other borrowings | |||||
Corporate tax | ( | ( | |||
Deferred tax | ( | ||||
Post-employment benefit liabilities | |||||
( | ( | ( | ( | ||
Impairment charge recognised up until the date of sale | ( | ||||
Exchange recycled from other comprehensive income | ( | ( | ( | ( | |
(Loss)/gain on disposal before taxation | ( | ( | ( | ( | |
Taxation | ( | ( | |||
(Loss)/gain on disposal after taxation | ( | ( | ( | ( |
2024 $ million | |
Property, plant and equipment | |
Inventories | |
Trade and other receivables | |
Deferred tax asset | |
Cash | |
Assets held for sale | |
Trade and other payables | ( |
Corporate tax | ( |
Provisions | ( |
Liabilities held for sale | ( |
Total |
Brands $ million | Goodwill $ million | Other intangibles $ million | Computer software $ million | Total $ million | |
Cost | |||||
At 30 June 2022 (re-presented) | |||||
Hyperinflation adjustment | |||||
Exchange differences | ( | ( | ( | ||
Additions | |||||
Disposals | ( | ( | |||
Reclassification from/(to) asset held for sale | ( | ||||
At 30 June 2023 (re-presented) | |||||
Hyperinflation adjustment | |||||
Exchange differences | ( | ( | ( | ( | |
Additions | |||||
Disposals | ( | ( | ( | ( | |
At 30 June 2024 | |||||
Amortisation and impairment | |||||
At 30 June 2022 (re-presented) | |||||
Exchange differences | ( | ( | ( | ||
Amortisation for the year | — | — | |||
Impairment | |||||
Disposals | ( | ( | |||
Reclassification from/(to) asset held for sale | ( | ||||
At 30 June 2023 (re-presented) | |||||
Exchange differences | ( | ( | ( | ( | |
Amortisation for the year | — | — | |||
Impairment | |||||
Reversal of impairment | ( | ( | |||
Disposals | ( | ( | ( | ( | |
At 30 June 2024 | |||||
Carrying amount | |||||
At 30 June 2024 | |||||
At 30 June 2023 (re-presented) | |||||
At 30 June 2022 (re-presented) |
Principal markets | 2024 $ million | 2023 re-presented $ million | |
Crown Royal whisky | |||
Captain Morgan rum | |||
Smirnoff vodka | |||
Johnnie Walker whisky | |||
Shui Jing Fang Chinese white spirit | |||
Casamigos tequila | |||
Yenì raki | |||
McDowell's No.1 whisky, rum and brandy | |||
Don Papa rum | |||
Don Julio tequila | |||
Aviation American Gin | |||
Seagram's 7 Crown whiskey | |||
Signature whisky | |||
Zacapa rum | |||
Black Dog whisky | |||
Antiquity whisky | |||
Gordon's gin | |||
Bell's whisky | |||
Other brands | |||
2024 $ million | 2023 re-presented $ million | |
North America | ||
Europe | ||
Türkiye | ||
Asia Pacific | ||
Greater China | ||
India | ||
Latin America and Caribbean – Mexico | ||
Other cash-generating units | ||
2024 | 2023 | |||
Pre-tax discount rate % | Terminal growth rate % | Pre-tax discount rate % | Terminal growth rate % | |
North America – United States | ||||
Europe | ||||
United Kingdom | ||||
Türkiye | ||||
Asia Pacific | ||||
India | ||||
Greater China | ||||
Latin America and Caribbean | ||||
Mexico | ||||
Carrying value of CGU $ million | Headroom $ million | 8pps decrease in annual growth rate in forecast period 2025-2030 $ million | |
Aviation American Gin | ( |
Land and buildings $ million | Plant and equipment $ million | Fixtures and fittings $ million | Returnable bottles and crates $ million | Under construction $ million | Total $ million | |
Cost | ||||||
At 30 June 2022 (re-presented) | ||||||
Hyperinflation adjustment | ||||||
Exchange differences | ( | ( | ( | ( | ||
Acquisitions | ||||||
Sale of businesses | ( | ( | ( | ( | ( | ( |
Additions | ||||||
Disposals | ( | ( | ( | ( | ( | ( |
Transfers | ( | |||||
Reclassification from assets held for sale | ||||||
At 30 June 2023 (re-presented) | ||||||
Hyperinflation adjustment | ||||||
Exchange differences | ( | ( | ( | ( | ( | ( |
Sale of businesses | ( | ( | ( | ( | ||
Additions | ||||||
Disposals | ( | ( | ( | ( | ( | ( |
Transfers | ( | |||||
Reclassification to assets held for sale | ( | ( | ( | ( | ( | |
At 30 June 2024 | ||||||
Depreciation | ||||||
At 30 June 2022 (re-presented) | — | |||||
Exchange differences | ( | ( | ( | — | ( | |
Depreciation charge for the year | — | |||||
Exceptional accelerated depreciation and impairment | — | |||||
Sale of businesses | ( | ( | ( | ( | — | ( |
Disposals | ( | ( | ( | ( | — | ( |
Reclassification from assets held for sale | — | |||||
At 30 June 2023 (re-presented) | — | |||||
Exchange differences | ( | ( | ( | ( | — | ( |
Depreciation charge for the year | — | |||||
Exceptional accelerated depreciation and impairment | — | |||||
Sale of businesses | ( | ( | ( | — | ( | |
Disposals | ( | ( | ( | ( | — | ( |
Reclassification to assets held for sale | ( | ( | ( | — | ( | |
At 30 June 2024 | — | |||||
Carrying amount | ||||||
At 30 June 2024 | ||||||
At 30 June 2023 (re-presented) | ||||||
At 30 June 2022 (re-presented) |
Biological assets $ million | |
Fair value | |
At 30 June 2022 (re-presented) | |
Exchange differences | |
Transferred to inventories | ( |
Fair value change | |
Farming cost capitalised | |
At 30 June 2023 (re-presented) | |
Exchange differences | ( |
Transferred to inventories | ( |
Fair value change | ( |
Farming cost capitalised | |
At 30 June 2024 |
Land and buildings $ million | Plant and equipment $ million | Total $ million | |
At 30 June 2022 (re-presented) | |||
Exchange differences | ( | ( | |
Additions | |||
Reclassification from assets held for sale | |||
Derecognition due to disposal of business | ( | ( | ( |
Depreciation | ( | ( | ( |
At 30 June 2023 (re-presented) | |||
Exchange differences | ( | ( | ( |
Additions | |||
Disposal | ( | ( | ( |
Depreciation | ( | ( | ( |
At 30 June 2024 |
2024 $ million | 2023 re-presented $ million | |
Current lease liabilities | ( | ( |
Non-current lease liabilities | ( | ( |
( | ( |
Loans $ million | Other investments $ million | Total $ million | |
Cost less allowances or fair value | |||
At 30 June 2022 (re-presented) | |||
Additions | |||
Repayments and disposals | ( | ( | |
Fair value adjustment | ( | ( | |
Capitalised interest | |||
Impairment charged during the year | ( | ( | |
At 30 June 2023 (re-presented) | |||
Additions | |||
Repayments and disposals | ( | ( | |
Fair value adjustment | ( | ( | |
Capitalised interest | |||
Impairment reversed/(charged) during the year | ( | ||
At 30 June 2024 |
Principal plans | Date of valuation |
United Kingdom(1) | 1 April 2021 |
Ireland(2) | 31 December 2021 |
United States | 1 January 2023 |
2024 $ million | 2023 re-presented $ million | 2022 re-presented $ million | |
Current service cost and administrative expenses | ( | ( | ( |
Past service gains/(losses) – ordinary activities | ( | ||
Gains on curtailments and settlements | |||
Charge to operating profit | ( | ( | ( |
Net finance income in respect of post-employment plans | |||
Charge before taxation(1) | ( | ( | ( |
Actual returns less amounts included in finance income | ( | ( | ( |
Experience gains/(losses) | ( | ( | |
Changes in financial assumptions | |||
Changes in demographic assumptions | ( | ||
Other comprehensive (loss)/income | ( | ( | |
Changes in the surplus restriction | ( | ||
Total other comprehensive (loss)/income | ( | ( |
2024 $ million | 2023 re-presented $ million | 2022 re-presented $ million | |
United Kingdom | ( | ||
Ireland | |||
United States | ( | ( | ( |
Other | ( | ( | ( |
( | ( | ( |
Plan assets $ million | Plan liabilities $ million | Net surplus $ million | |
At 30 June 2022 (re-presented) | ( | ||
Exchange differences | ( | ||
Disposals | |||
Income/(charge) before taxation | ( | ( | |
Other comprehensive (loss)/income(1) | ( | ( | |
Contributions by the group | |||
Employee contributions | ( | ||
Benefits paid | ( | ||
At 30 June 2023 (re-presented) | ( | ||
Exchange differences | ( | ( | |
Income/(charge) before taxation | ( | ( | |
Other comprehensive (loss)/income(1) | ( | ( | |
Contributions by the group | |||
Settlements | ( | ||
Employee contributions | ( | ||
Benefits paid | ( | ||
At 30 June 2024 | ( |
2024 | 2023 (re-presented) | |||
Plan assets $ million | Plan liabilities $ million | Plan assets $ million | Plan liabilities $ million | |
Pensions | ||||
United Kingdom | ( | ( | ||
Ireland | ( | ( | ||
United States | ( | ( | ||
Other | ( | ( | ||
Post-employment medical | ( | ( | ||
Other post-employment | ( | ( | ||
( | ( | |||
2024 | 2023 (re-presented) | |||
Non- current assets(1) $ million | Non- current liabilities $ million | Non- current assets(1) $ million | Non- current liabilities $ million | |
Funded plans | ( | ( | ||
Unfunded plans | — | ( | — | ( |
( | ( | |||
United Kingdom | Ireland | United States(1) | |||||||
2024% | 2023% | 2022% | 2024% | 2023% | 2022% | 2024% | 2023% | 2022% | |
Rate of general increase in salaries(2) | |||||||||
Rate of increase to pensions in payment | |||||||||
Rate of increase to deferred pensions | |||||||||
Discount rate for plan liabilities | |||||||||
Inflation – CPI | |||||||||
Inflation – RPI | — | — | — | — | — | — | |||
United Kingdom(1) | Ireland(2) | United States | |||||||
2024 Age | 2023 Age | 2022 Age | 2024 Age | 2023 Age | 2022 Age | 2024 Age | 2023 Age | 2022 Age | |
Retiring currently at age 65 | |||||||||
Male | |||||||||
Female | |||||||||
Currently aged 45, retiring at age 65 | |||||||||
Male | |||||||||
Female | |||||||||
United Kingdom | Ireland | United States | |||||||
Benefit/(cost) | Operating profit $ million | Profit after taxation $ million | Plan liabilities(1) $ million | Operating profit $ million | Profit after taxation $ million | Plan liabilities(1) $ million | Operating profit $ million | Profit after taxation $ million | Plan liabilities(1) $ million |
Effect of | |||||||||
Effect of | ( | ( | ( | ( | ( | ( | ( | ( | ( |
Effect of | ( | ( | ( | ( | ( | ( | ( | ( | |
Effect of | |||||||||
Effect of expectancy | ( | ( | ( | ( | ( | ( | |||
2024 | |||||||||
United Kingdom $ million | Ireland $ million | United States and other $ million | Total $ million | ||||||
Quoted | Unquoted | Quoted | Unquoted | Quoted | Unquoted | Quoted | Unquoted | Total | |
Equities | |||||||||
Bonds | |||||||||
Fixed-interest government | |||||||||
Inflation-linked government | |||||||||
Investment grade corporate | |||||||||
Non-investment grade | |||||||||
Loan securities | |||||||||
Liability Driven Investment (LDI) | |||||||||
Property - unquoted | |||||||||
Hedge funds | |||||||||
Interest rate and inflation swaps | ( | ( | ( | ||||||
Cash and other | |||||||||
Total bid value of assets | |||||||||
2023 (re-presented) | |||||||||
United Kingdom $ million | Ireland $ million | United States and other $ million | Total $ million | ||||||
Quoted | Unquoted | Quoted | Unquoted | Quoted | Unquoted | Quoted | Unquoted | Total | |
Equities | |||||||||
Bonds | |||||||||
Fixed-interest government | |||||||||
Inflation-linked government | |||||||||
Investment grade corporate | |||||||||
Non-investment grade | |||||||||
Loan securities | |||||||||
Liability Driven Investment (LDI) | |||||||||
Property - unquoted | |||||||||
Hedge funds | |||||||||
Interest rate and inflation swaps | ( | ( | ( | ( | |||||
Cash and other | |||||||||
Total bid value of assets | |||||||||
Valuation date | ||||||
31 December 2024 | 31 December 2027 | 31 December 2030 | ||||
€ million | $ million | € million | $ million | € million | $ million | |
Maximum conditional contribution | ||||||
United Kingdom | Ireland | United States | ||||
2024 $ million | 2023 re-presented $ million | 2024 $ million | 2023 re-presented $ million | 2024 $ million | 2023 re-presented $ million | |
Maturity analysis of benefits expected to be paid | ||||||
Within one year | ||||||
Between 1 to 5 years | ||||||
Between 6 to 15 years | ||||||
Between 16 to 25 years | ||||||
Beyond 25 years | ||||||
Total | ||||||
years | years | years | years | years | years | |
Average duration of the defined benefit obligation | ||||||
2024 $ million | 2023 re-presented $ million | |
Raw materials and consumables | ||
Work in progress | ||
Maturing inventories | ||
Finished goods and goods for resale | ||
2024 $ million | 2023 re-presented $ million | |
Raw materials and consumables | ||
Maturing inventories | ||
2024 $ million | 2023 re-presented $ million | 2022 re-presented $ million | |
Balance at beginning of the year | |||
Exchange differences | ( | ( | ( |
Income statement charge | |||
Utilised | ( | ( | ( |
Sale of businesses | ( | ( | ( |
2024 | 2023 (re-presented) | |||
Current assets $ million | Non-current assets $ million | Current assets $ million | Non-current assets $ million | |
Trade receivables | ||||
Interest receivable | ||||
VAT recoverable and other prepaid taxes | ||||
Other receivables | ||||
Prepayments | ||||
Accrued income | ||||
2024 $ million | 2023 re-presented $ million | |
Not overdue | ||
Overdue 1 – 30 days | ||
Overdue 31 – 60 days | ||
Overdue 61 – 90 days | ||
Overdue 91 – 180 days | ||
Overdue more than 180 days | ||
2024 $ million | 2023 re-presented $ million | 2022 re-presented $ million | |
Balance at beginning of the year | |||
Exchange differences | ( | ( | ( |
Income statement (release)/charge | ( | ||
Written off | ( | ( | ( |
2024 | 2023 (re-presented) | |||
Current liabilities $ million | Non-current liabilities $ million | Current liabilities $ million | Non-current liabilities $ million | |
Trade payables | ||||
Interest payable | ||||
Tax and social security excluding income tax | ||||
Other payables | ||||
Accruals | ||||
Deferred income | ||||
Dividend payable | ||||
Dividend payable to non-controlling interests | ||||
Thalidomide $ million | Other $ million | Total $ million | |
At 30 June 2023 (re-presented) | |||
Exchange differences | ( | ( | |
Provisions charged during the year | |||
Provisions utilised during the year | ( | ( | ( |
Transfers from other payables | ( | ( | |
Unwinding of discounts | |||
At 30 June 2024 | |||
Current liabilities | |||
Non-current liabilities | |||
2024 | 2023 | |||
$ million | % | re-presented $ million | % | |
Fixed rate | ||||
Floating rate(1) | ||||
Impact of financial derivatives and fair value adjustments | ( | ( | ( | ( |
Lease liabilities | ||||
Net borrowings | ||||
Average monthly net borrowings | Effective interest rate | ||||
2024 $ million | 2023 re-presented $ million | 2022 re-presented $ million | 2024 % | 2023 % | 2022 % |
Impact on income statement gain/(loss) | Impact on consolidated comprehensive income gain/(loss)(1) (2) | |||
2024 | 2023 re- presented | 2024 | 2023 re- presented | |
$ million | $ million | $ million | $ million | |
( | ( | ( | ( | |
( | — | ( | — | |
— | — | |||
Gross amount $ million | Right of asset offset $ million | Right of liability offset $ million | Net amount $ million | |
2024 | ||||
Derivative financial assets | ( | ( | ||
Derivative financial liabilities | ( | ( | ||
2023 | ||||
Derivative financial assets | ( | ( | ||
Derivative financial liabilities | ( | ( |
Due within 1 year $ million | Due between 1 and 3 years $ million | Due between 3 and 5 years $ million | Due after 5 years $ million | Total $ million | Carrying amount at balance sheet date $ million | |
2024 | ||||||
Borrowings(1) | ( | ( | ( | ( | ( | ( |
Interest on borrowings(1)(2) | ( | ( | ( | ( | ( | ( |
Lease capital repayments | ( | ( | ( | ( | ( | ( |
Lease future interest payments | ( | ( | ( | ( | ( | |
Trade and other financial liabilities(3) | ( | ( | ( | ( | ( | ( |
Non-derivative financial liabilities | ( | ( | ( | ( | ( | ( |
Cross currency swaps (gross) | ||||||
Receivable | ||||||
Payable | ( | ( | ( | ( | ( | |
Other derivative instruments (net) | ( | ( | ( | ( | ( | |
Derivative instruments(2) | ( | ( | ( | ( | ( | |
2023 (re-presented) | ||||||
Borrowings(1) | ( | ( | ( | ( | ( | ( |
Interest on borrowings(1)(2) | ( | ( | ( | ( | ( | ( |
Lease capital repayments | ( | ( | ( | ( | ( | ( |
Lease future interest payments | ( | ( | ( | ( | ( | |
Trade and other financial liabilities(3) | ( | ( | ( | ( | ( | ( |
Non-derivative financial liabilities | ( | ( | ( | ( | ( | ( |
Cross currency swaps (gross) | ||||||
Receivable | ||||||
Payable | ( | ( | ( | ( | ( | |
Other derivative instruments (net) | ( | ( | ( | ( | ||
Derivative instruments(2) | ( | ( |
2024 $ million | 2023 re-presented $ million | |
Expiring within one year | ||
Expiring between one and two years | ||
Expiring after two years | ||
2024 $ million | 2023 re-presented $ million | |
Derivative assets | ||
Derivative liabilities | ( | ( |
Valuation techniques based on observable market input (Level 2) | ||
Financial assets - other | ||
Financial liabilities - other | ( | ( |
Valuation techniques based on unobservable market input (Level 3) | ( | ( |
Zacapa financial liability | Contingent consideration recognised on acquisition of businesses | Zacapa financial liability | Contingent consideration recognised on acquisition of businesses | |
2024 | 2024 | 2023 | 2023 | |
$ million | $ million | re-presented $ million | re-presented $ million | |
At the beginning of the year | ( | ( | ( | ( |
Net gains/(losses) included in the income statement | ( | |||
Net losses included in exchange in other comprehensive income | ( | |||
Net gains/(losses) included in retained earnings | ( | |||
Acquisitions | ( | |||
Settlement of liabilities | ||||
At the end of the year | ( | ( | ( | ( |
Notional amounts $ million | Maturity | Range of hedged rates(1) | |
2024 | |||
Net investment hedges | |||
Derivatives in net investment hedges of foreign operations | September 2024 - April 2043 | sterling euro Chinese yuan | |
Foreign currency borrowings in net investment hedges | September 2024 - June 2038 | sterling euro | |
Cash flow hedges | |||
Derivatives in cash flow hedge (foreign currency debt) | September 2028 - June 2034 | euro | |
Derivatives in cash flow hedge (foreign currency risk) | September 2024 - December 2025 | sterling euro Mexican peso | |
Derivatives in cash flow hedge (commodity price risk) | July 2024 - September 2025 | Feed Wheat: Natural Gas: | |
Fair value hedges | |||
Derivatives in fair value hedge (interest rate risk) | April 2025 - April 2030 | EURIBOR SOFR |
Notional amounts re-presented $ million | Maturity | Range of hedged rates(1) | |
2023 (re-presented) | |||
Net investment hedges | |||
Derivatives in net investment hedges of foreign operations | July 2023 | US dollar | |
Foreign currency borrowings in net investment hedges | September 2023 - March 2032 | euro | |
Cash flow hedges | |||
Derivatives in cash flow hedge (foreign currency debt) | September 2036 - April 2043 | US dollar | |
Derivatives in cash flow hedge (foreign currency risk) | September 2023 - December 2024 | US dollar - | |
Derivatives in cash flow hedge (commodity price risk) | July 2023 - September 2024 | Feed Wheat: LME Aluminium: | |
Fair value hedges | |||
Derivatives in fair value hedge (interest rate risk) | September 2023 - April 2030 | EURIBOR( SOFR USDLIBOR |
At the beginning of the year $ million | Consolidated income statement $ million | Consolidated statement of comprehensive income $ million | Other(2) $ million | At the end of the year $ million | |
2024 | |||||
Net investment hedges(1) | |||||
Derivatives in net investment hedges of foreign operations | ( | ||||
Foreign currency borrowings in net investment hedges | ( | ( | ( | ||
Cash flow hedges(1) | |||||
Derivatives in cash flow hedge (foreign currency debt) | ( | ( | ( | ||
Derivatives in cash flow hedge (foreign currency risk) | ( | ( | |||
Derivatives in cash flow hedge (commodity price risk) | ( | ( | ( | ||
Fair value hedges(1) | |||||
Derivatives in fair value hedge (interest rate risk) | ( | — | — | ( | |
Fair value hedge hedged item | ( | — | — | ||
Instruments in fair value hedge relationship | ( | ( | — | — | ( |
2023 (re-presented) | |||||
Net investment hedges(1) | |||||
Derivatives in net investment hedges of foreign operations | ( | ||||
Foreign currency borrowings in net investment hedges | ( | ( | ( | ||
Cash flow hedges(1) | |||||
Derivatives in cash flow hedge (foreign currency debt) | ( | ( | |||
Derivatives in cash flow hedge (foreign currency risk) | ( | ( | |||
Derivatives in cash flow hedge (commodity price risk) | ( | ( | ( | ||
Fair value hedges(1) | |||||
Derivatives in fair value hedge (interest rate risk) | ( | ( | ( | — | ( |
Fair value hedge hedged item | — | ||||
Instruments in fair value hedge relationship | ( | ( | — | ( |
Fair value through income statement $ million | Assets and liabilities at amortised cost $ million | Not categorised as a financial instrument $ million | Total $ million | Current $ million | Non-current $ million | |
2024 | ||||||
Other investments and loans(1) | — | |||||
Trade and other receivables | — | |||||
Cash and cash equivalents | — | — | — | |||
Derivatives in cash flow hedge (foreign currency risk) | — | — | ||||
Derivatives in cash flow hedge (commodity price risk) | — | — | ||||
Derivatives in net investment hedge | — | — | ||||
Other instruments | — | — | ||||
Total other financial assets | — | |||||
Total financial assets | ||||||
Borrowings(2) | — | ( | — | ( | ( | ( |
Trade and other payables | ( | ( | ( | ( | ( | ( |
Derivatives in fair value hedge (interest rate risk) | ( | — | — | ( | ( | ( |
Derivatives in cash flow hedge (foreign currency debt) | ( | — | — | ( | ( | |
Derivatives in cash flow hedge (foreign currency risk) | ( | — | — | ( | ( | ( |
Derivatives in cash flow hedge (commodity price risk) | ( | — | — | ( | ( | |
Derivatives in net investment hedge | ( | — | — | ( | ( | ( |
Other instruments | ( | — | ( | ( | ||
Leases | — | ( | — | ( | ( | ( |
Total other financial liabilities | ( | ( | — | ( | ( | ( |
Total financial liabilities | ( | ( | ( | ( | ( | ( |
Total net financial assets/(liabilities) | ( | ( | ( | ( | ( | |
2023 (re-presented) | ||||||
Other investments and loans(1) | — | |||||
Trade and other receivables | — | |||||
Cash and cash equivalents | — | — | — | |||
Derivatives in cash flow hedge (foreign currency debt) | — | — | ||||
Derivatives in cash flow hedge (foreign currency risk) | — | — | ||||
Derivatives in cash flow hedge (commodity price risk) | — | — | ||||
Other instruments | — | — | ||||
Leases | — | — | — | |||
Total other financial assets | — | |||||
Total financial assets | ||||||
Borrowings(2) | — | ( | — | ( | ( | ( |
Trade and other payables | ( | ( | ( | ( | ( | ( |
Derivatives in fair value hedge (interest rate risk) | ( | — | — | ( | ( | ( |
Derivatives in cash flow hedge (foreign currency risk) | ( | — | — | ( | ( | ( |
Derivatives in cash flow hedge (commodity price risk) | ( | — | — | ( | ( | ( |
Other instruments | ( | — | ( | ( | ||
Leases | — | ( | — | ( | ( | ( |
Total other financial liabilities | ( | ( | — | ( | ( | ( |
Total financial liabilities | ( | ( | ( | ( | ( | ( |
Total net financial liabilities | ( | ( | ( | ( | ( | ( |
2024 $ million | 2023 re-presented $ million | |
Bank overdrafts | ||
Commercial paper | ||
Bank and other loans | ||
Credit support obligations | ||
€ | ||
$ | ||
€ | ||
$ | ||
€ | ||
€ | ||
€ | ||
Fair value adjustment to borrowings | ( | ( |
Borrowings due within one year | ||
$ | ||
€ | ||
€ | ||
€ |
$ | ||
$ | ||
€ | ||
€ | ||
£ | ||
$ | ||
$ | ||
€ | ||
€ | ||
€ | ||
$ | ||
£ | ||
$ | ||
£ | ||
€ | ||
$ | ||
€ | ||
$ | ||
£ | ||
$ | ||
$ | ||
€ | ||
$ | ||
$ | ||
£ | ||
$ | ||
$ | ||
Bank and other loans | ||
Fair value adjustment to borrowings | ( | ( |
Borrowings due after one year | ||
Total borrowings before leases and derivative financial instruments | ||
Fair value of cross currency interest rate swaps | ( | ( |
Fair value of foreign currency swaps and forwards | ( | |
Fair value of interest rate hedging instruments | ||
Lease liabilities | ||
Gross borrowings | ||
Less: Cash and cash equivalents | ( | ( |
Net borrowings |
2024 $ million | 2023 re-presented $ million | |
Within one year | ||
Between one and three years | ||
Between three and five years | ||
Beyond five years | ||
2024 $ million | 2023 re-presented $ million | 2022 re-presented $ million | |
Issued | |||
€ denominated | |||
£ denominated | |||
$ denominated | |||
Repaid | |||
€ denominated | ( | ( | |
$ denominated | ( | ( | ( |
2024 $ million | 2023 re-presented $ million | |
At beginning of the year | ||
Net decrease in cash and cash equivalents before exchange | ||
Net increase in bonds and other borrowings(1) | ||
Increase in net borrowings from cash flows | ||
Exchange differences on net borrowings | ||
Other non-cash items(2) | ||
Net borrowings at end of the year |
2024 | 2023 | |||
Cash and cash equivalents $ million | Gross borrowings(1) $ million | Cash and cash equivalents re-presented $ million | Gross borrowings(1) re-presented $ million | |
US dollar | ( | ( | ||
Euro(2) | ( | ( | ||
Sterling | ( | ( | ||
Indian rupee | ( | ( | ||
Mexican peso | ( | ( | ||
Hungarian forint | ( | ( | ||
Kenyan shilling | ( | ( | ||
Chinese yuan | ( | ( | ||
Nigerian naira | ||||
Other(2) | ( | ( | ||
Total | ( | ( | ||
Number of shares million | Nominal value $ million | |
At 30 June 2022 re-presented | ||
Retranslation impact of opening balances(1) | — | |
Shares cancelled | ( | ( |
At 30 June 2023 (re-represented) | ||
Shares cancelled | ( | ( |
At 30 June 2024 |
Hedging reserve $ million | Exchange reserve $ million | Total $ million | |
At 30 June 2021 (re-presented) | ( | ( | |
Other comprehensive loss | ( | ( | ( |
Retranslation impact of opening balances(1) | |||
At 30 June 2022 (re-presented) | ( | ( | |
Other comprehensive income/(loss) | ( | ||
Retranslation impact of opening balances(1) | ( | ( | |
At 30 June 2023 (re-presented) | ( | ( | |
Other comprehensive loss | ( | ( | ( |
At 30 June 2024 | ( | ( |
Number of shares million | Purchase consideration $ million | |
At 30 June 2021 (re-presented) | ||
Retranslation impact of opening balances(1) | ( | |
Share trust arrangements | ( | ( |
Shares used to satisfy options | ( | ( |
Shares purchased - share buyback programme | ||
Shares cancelled | ( | ( |
At 30 June 2022 (re-presented) | ||
Retranslation impact of opening balances(1) | ||
Share trust arrangements | ( | ( |
Shares used to satisfy options | ( | ( |
Shares purchased - share buyback programme | ||
Shares cancelled | ( | ( |
At 30 June 2023 (re-presented) | ||
Share trust arrangements | ( | ( |
Shares used to satisfy options | ( | ( |
Shares purchased - share buyback programme | ||
Shares cancelled | ( | ( |
At 30 June 2024 |
Period | Number of shares purchased under share buyback programme | Total number of shares purchased | Average price paid cents(2) | Authorised purchases unutilised at month end |
July 2023 | ||||
August 2023 | ||||
1-28 September 2023 | ||||
29-30 September 2023(1) | ||||
October 2023 | ||||
November 2023 | ||||
December 2023 | ||||
January 2024 | ||||
February 2024 | ||||
March 2024 | ||||
April 2024 | ||||
May 2024 | ||||
June 2024 | ||||
Total |
2024 | 2023 | 2022 | |
$ million | re-presented $ million | re-presented $ million | |
Amounts recognised as distributions to equity shareholders in the year | |||
Final dividend for the year ended 30 June 2023 | |||
Interim dividend for the year ended 30 June 2024 | |||
2024 | 2023 | 2022 | |||
USL $ million | Others $ million | Total $ million | Total re-presented $ million | Total re-presented $ million | |
Income statement | |||||
Sales | |||||
Net sales | |||||
Profit for the year(1) | |||||
Other comprehensive (loss)/income(2) | ( | ( | ( | ( | |
Total comprehensive income/(loss) | ( | ||||
Attributable to non-controlling interests | ( | ||||
Balance sheet | |||||
Non-current assets(3) | |||||
Current assets | |||||
Non-current liabilities | ( | ( | ( | ( | ( |
Current liabilities | ( | ( | ( | ( | ( |
Net assets | |||||
Attributable to non-controlling interests | |||||
Cash flow | |||||
Net cash inflow from operating activities | |||||
Net cash outflow from investing activities | ( | ( | ( | ( | ( |
Net cash outflow from financing activities | ( | ( | ( | ( | ( |
Net increase in cash and cash equivalents | |||||
Exchange differences | ( | ( | ( | ( | ( |
Dividends payable to non-controlling interests | ( | ( | ( | ( | ( |
2024 $ million | 2023 re-presented $ million | 2022 re-presented $ million | |
Executive share award plans | |||
Executive share option plans | |||
Savings plans | |||
2024 | 2023 re-presented | 2022 re-presented | |
Risk free interest rate | |||
Expected life of the awards | |||
Dividend yield | |||
Weighted average share price | |||
Weighted average fair value of awards granted in the year(1) | |||
Number of awards granted in the year | |||
Fair value of all awards granted in the year | $ | $ | $ |
2024 million | 2023 million | 2022 million | |
Number of awards outstanding at 1 July | |||
Granted | |||
Awarded | ( | ( | ( |
Forfeited | ( | ( | ( |
Number of awards outstanding at 30 June |
2024 $ million | 2023 re- presented $ million | 2022 re- presented $ million | |
Income statement items | |||
Sales | |||
Purchases | |||
Balance sheet items | |||
Group payables | |||
Group receivables | |||
Loans receivable | |||
Cash flow items | |||
Loans and equity contributions, net |
2024 | 2023 | 2022 | |
$ million | re-presented $ million | re-presented $ million | |
Salaries and short-term employee benefits | |||
Annual incentive plan | |||
Non-Executive Directors’ fees | |||
Share-based payments(1) | |||
Post-employment benefits | |||
2024 | 2023 | 2022 | |
$ million | re-presented $ million | re-presented $ million | |
Salaries and short-term employee benefits | |||
Annual incentive plan | |||
Non-Executive Directors' fees | |||
Share option exercises(1) | |||
Shares vesting(1) | |||
Post-employment benefits | |||
Country of incorporation | Country of operation | Percentage of equity owned(1) | Business description | |
Subsidiaries | ||||
Diageo Ireland Unlimited Company | Production, marketing and distribution of premium drinks | |||
Diageo Great Britain Limited | Marketing and distribution of premium drinks | |||
Diageo Scotland Limited | Production, marketing and distribution of premium drinks | |||
Diageo Brands B.V. | Marketing and distribution of premium drinks | |||
Diageo North America, Inc. | Production, importing, marketing and distribution of premium drinks | |||
United Spirits Limited(2) | Production, importing, marketing and distribution of premium drinks | |||
Diageo Capital plc(3) | ||||
Diageo Capital B.V.(3) | ||||
Diageo Finance plc(3) | ||||
Diageo Investment Corporation | ||||
Mey İçki Sanayi ve Ticaret A.Ş. | Production, marketing and distribution of premium drinks | |||
Associates | ||||
Moët Hennessy, SAS(4) | Production, marketing and distribution of premium drinks |
North America million | Europe million | Asia Pacific million | Latin America and Caribbean million | Africa million | Corporate million | Total million | |
Volume (equivalent units) | |||||||
Year ended 30 June 2023 reported | 52.4 | 51.3 | 80.8 | 26.2 | 32.7 | — | 243.4 |
Reclassification | — | 0.5 | (0.5) | — | — | — | — |
Disposals(1) | — | (0.1) | (6.2) | — | (1.3) | — | (7.6) |
Year ended 30 June 2023 adjusted | 52.4 | 51.7 | 74.1 | 26.2 | 31.4 | — | 235.8 |
Organic movement | (2.3) | (0.6) | 0.6 | (4.1) | (1.9) | — | (8.3) |
Acquisitions and disposals(1) | — | 0.2 | 0.2 | — | 2.6 | — | 3.0 |
Year ended 30 June 2024 reported | 50.1 | 51.3 | 74.9 | 22.1 | 32.1 | — | 230.5 |
Organic movement % | (4) | (1) | 1 | (16) | (6) | — | (4) |
North America $ million | Europe $ million | Asia Pacific $ million | Latin America and Caribbean $ million | Africa $ million | Corporate $ million | Total $ million | |
Sales | |||||||
Year ended 30 June 2023 reported (re-presented) | 8,859 | 7,245 | 6,484 | 2,714 | 2,864 | 104 | 28,270 |
Exchange | 6 | 132 | 59 | 11 | 28 | 1 | 237 |
Reclassification | — | 62 | (62) | — | — | — | — |
Disposals(1) | — | (7) | (377) | — | (196) | — | (580) |
Hyperinflation | — | (185) | — | — | — | — | (185) |
Year ended 30 June 2023 adjusted | 8,865 | 7,247 | 6,104 | 2,725 | 2,696 | 105 | 27,742 |
Organic movement | (351) | 415 | 320 | (487) | 258 | 13 | 168 |
Acquisitions and disposals(1) | 3 | 30 | 35 | — | 131 | — | 199 |
Exchange | (3) | (294) | (139) | 172 | (632) | 5 | (891) |
Hyperinflation | — | 626 | — | 22 | 25 | — | 673 |
Year ended 30 June 2024 reported | 8,514 | 8,024 | 6,320 | 2,432 | 2,478 | 123 | 27,891 |
Organic movement % | (4) | 6 | 5 | (18) | 10 | 12 | 1 |
North America $ million | Europe $ million | Asia Pacific $ million | Latin America and Caribbean $ million | Africa $ million | Corporate $ million | Total $ million | |
Net sales | |||||||
Year ended 30 June 2023 reported (re-presented) | 8,109 | 4,303 | 3,841 | 2,159 | 2,039 | 104 | 20,555 |
Exchange | 6 | 56 | 55 | 13 | 21 | 1 | 152 |
Reclassification | — | 62 | (62) | — | — | — | — |
Disposals(1) | — | (4) | (126) | — | (131) | — | (261) |
Hyperinflation | — | (71) | — | — | — | — | (71) |
Year ended 30 June 2023 adjusted | 8,115 | 4,346 | 3,708 | 2,172 | 1,929 | 105 | 20,375 |
Organic movement | (206) | 124 | 164 | (459) | 235 | 13 | (129) |
Acquisitions and disposals(1) | 2 | 30 | 30 | — | 131 | — | 193 |
Exchange | (3) | (59) | (85) | 105 | (539) | 5 | (576) |
Hyperinflation | — | 363 | — | 21 | 22 | — | 406 |
Year ended 30 June 2024 reported | 7,908 | 4,804 | 3,817 | 1,839 | 1,778 | 123 | 20,269 |
Organic movement % | (3) | 3 | 4 | (21) | 12 | 12 | (1) |
North America $ million | Europe $ million | Asia Pacific $ million | Latin America and Caribbean $ million | Africa $ million | Corporate $ million | Total $ million | |
Marketing | |||||||
Year ended 30 June 2023 reported (re-presented) | 1,631 | 765 | 655 | 355 | 235 | 22 | 3,663 |
Exchange | (1) | 8 | 4 | — | (3) | 2 | 10 |
Reclassification | — | 1 | (1) | — | (12) | — | (12) |
Disposals(1) | — | — | (13) | — | (5) | — | (18) |
Hyperinflation | — | (7) | — | — | — | — | (7) |
Year ended 30 June 2023 adjusted | 1,630 | 767 | 645 | 355 | 215 | 24 | 3,636 |
Organic movement | (10) | 34 | 16 | (70) | 35 | 2 | 7 |
Acquisitions and disposals(1) | 5 | 22 | 5 | — | 4 | — | 36 |
Exchange | 2 | 10 | (15) | 21 | (50) | 3 | (29) |
Hyperinflation | — | 40 | — | — | 1 | — | 41 |
Year ended 30 June 2024 reported | 1,627 | 873 | 651 | 306 | 205 | 29 | 3,691 |
Organic movement % | (1) | 4 | 2 | (20) | 16 | 8 | — |
North America $ million | Europe $ million | Asia Pacific $ million | Latin America and Caribbean $ million | Africa $ million | Corporate $ million | Total $ million | |
Operating profit before exceptional items | |||||||
Year ended 30 June 2023 reported (re-presented) | 3,222 | 1,312 | 1,104 | 783 | 289 | (397) | 6,313 |
Exchange(2) | 27 | (2) | 29 | 42 | 110 | 45 | 251 |
Reclassification(ii) | — | 47 | (47) | — | — | — | — |
Fair value remeasurement of contingent considerations, equity option and earn-out arrangements | (122) | (30) | — | (1) | — | — | (153) |
Acquisitions and disposals(1) | 2 | 17 | (32) | — | (38) | — | (51) |
Hyperinflation | — | 19 | — | — | — | — | 19 |
Year ended 30 June 2023 adjusted | 3,129 | 1,363 | 1,054 | 824 | 361 | (352) | 6,379 |
Organic movement | (142) | (15) | 60 | (302) | 86 | 9 | (304) |
Acquisitions and disposals(1) | (12) | (14) | 7 | — | 27 | — | 8 |
Fair value remeasurement of contingent considerations, equity option and earn-out arrangements | 128 | 27 | — | — | — | — | 155 |
Fair value remeasurement of biological assets | — | — | — | (16) | — | — | (16) |
Exchange(2) | 133 | 26 | (58) | (5) | (332) | (23) | (259) |
Hyperinflation | — | (8) | — | 1 | (11) | — | (18) |
Year ended 30 June 2024 reported | 3,236 | 1,379 | 1,063 | 502 | 131 | (366) | 5,945 |
Organic movement % | (5) | (1) | 6 | (37) | 24 | 3 | (5) |
Organic operating margin % (3) | |||||||
Year ended 30 June 2024 | 37.8 | 30.2 | 28.8 | 30.5 | 20.7 | n/a | 30.0 |
Year ended 30 June 2023 | 38.6 | 31.4 | 28.4 | 37.9 | 18.7 | n/a | 31.3 |
Organic operating margin movement (bps) | (79) | (121) | 35 | (746) | 194 | n/a | (130) |
Volume EU million | Sales $ million | Net sales $ million | Marketing $ million | Operating profit $ million | |
Year ended 30 June 2023 (re-presented) | |||||
Acquisitions | |||||
Balcones Distilling | — | — | — | — | 2 |
Don Papa Rum | — | — | — | — | 20 |
— | — | — | — | 22 | |
Disposals | |||||
USL Popular brands | (5.9) | (277) | (43) | — | (6) |
Archers brand | (0.1) | (7) | (4) | — | (3) |
Windsor | (0.3) | (100) | (83) | (13) | (26) |
Guinness Cameroun S.A. | (1.3) | (196) | (131) | (5) | (38) |
(7.6) | (580) | (261) | (18) | (73) | |
Acquisitions and disposals | (7.6) | (580) | (261) | (18) | (51) |
Year ended 30 June 2024 | |||||
Acquisitions | |||||
Mr Black | — | 3 | 2 | 1 | (4) |
Balcones Distilling | — | — | — | 4 | (8) |
Gordon's | 1.2 | 105 | 105 | 4 | 8 |
Don Papa Rum | 0.2 | 30 | 30 | 22 | (14) |
1.4 | 138 | 137 | 31 | (18) | |
Disposals | |||||
Windsor | 0.2 | 35 | 30 | 5 | 7 |
Guinness Cameroun S.A. | 1.4 | 26 | 26 | — | 19 |
1.6 | 61 | 56 | 5 | 26 | |
Acquisitions and disposals | 3.0 | 199 | 193 | 36 | 8 |
2024 $ million | 2023 re-presented $ million | |
Profit attributable to equity shareholders of the parent company | 3,870 | 4,445 |
Exceptional operating and non-operating items | 14 | 402 |
Exceptional tax items and tax in respect of exceptional operating and non-operating items | 24 | (226) |
Exceptional items attributable to non-controlling interests | 104 | (173) |
Profit attributable to equity shareholders of the parent company before exceptional items | 4,012 | 4,448 |
Weighted average number of shares | million | million |
Shares in issue excluding own shares | 2,234 | 2,264 |
Dilutive potential ordinary shares | 5 | 7 |
Diluted shares in issue excluding own shares | 2,239 | 2,271 |
cents | re-presented cents | |
Basic earnings per share before exceptional items | 179.6 | 196.5 |
Diluted earnings per share before exceptional items | 179.2 | 195.9 |
2024 $ million | 2023 re-presented $ million | |
Net cash inflow from operating activities | 4,105 | 3,636 |
Disposal of property, plant and equipment and computer software | 14 | 16 |
Purchase of property, plant and equipment and computer software | (1,510) | (1,417) |
Free cash flow | 2,609 | 2,235 |
2024 $ million | 2023 re-presented $ million | |
Profit for the year | 4,166 | 4,479 |
Taxation | 1,294 | 1,163 |
Share of after tax results of associates and joint ventures | (414) | (443) |
Net finance charges | 885 | 712 |
Non-operating items | 70 | (364) |
Operating profit | 6,001 | 5,547 |
Exceptional operating items | (56) | 766 |
Fair value remeasurements | (141) | (153) |
Depreciation, amortisation and impairment(1) | 678 | 597 |
Hyperinflation adjustment | 6 | (33) |
Retranslation to budgeted exchange rates | 248 | 512 |
6,736 | 7,236 | |
Cash generated from operations | 6,065 | 5,744 |
Net exceptional cash paid(2) | 185 | 30 |
Post-employment payments less amounts included in operating profit(1) | 18 | 31 |
Net movement in maturing inventories(3) | 577 | 693 |
Provision movement | 29 | 81 |
Dividends received | (269) | (271) |
Other items(1) | (88) | 17 |
Hyperinflation adjustment | (23) | (34) |
Retranslation to budgeted exchange rates | 216 | 461 |
6,710 | 6,752 | |
Operating cash conversion | 99.6% | 93.3% |
2024 $ million | 2023 re-presented $ million | |
Operating profit | 6,001 | 5,547 |
Exceptional operating items | (56) | 766 |
Profit before exceptional operating items attributable to non-controlling interests | (192) | (207) |
Share of after tax results of associates and joint ventures | 414 | 443 |
Tax at the tax rate before exceptional items of 23.2% (2023 – 23.0%) | (1,475) | (1,554) |
4,692 | 4,995 | |
Average net assets (excluding net post-employment benefit assets/liabilities) | 11,270 | 10,914 |
Average non-controlling interests | (1,941) | (2,001) |
Average net borrowings | 20,361 | 18,297 |
Average invested capital | 29,690 | 27,210 |
Return on average invested capital | 15.8% | 18.4% |
2024 $ million | 2023 re-presented $ million | |
Borrowings due within one year | 2,885 | 2,142 |
Borrowings due after one year | 18,616 | 18,649 |
Fair value of foreign currency derivatives and interest rate hedging instruments | 42 | 40 |
Lease liabilities | 604 | 564 |
Less: Cash and cash equivalents | (1,130) | (1,813) |
Net borrowings | 21,017 | 19,582 |
Post-employment benefit liabilities before tax | 429 | 471 |
Adjusted net borrowings | 21,446 | 20,053 |
Profit for the year | 4,166 | 4,479 |
Taxation | 1,294 | 1,163 |
Net finance charges | 885 | 712 |
Depreciation, amortisation and impairment (excluding exceptional accelerated depreciation and impairment) | 678 | 597 |
Exceptional accelerated depreciation and impairment | (185) | 700 |
EBITDA | 6,838 | 7,651 |
Exceptional operating items (excluding accelerated depreciation and impairment) | 129 | 66 |
Non-operating items | 70 | (364) |
Adjusted EBITDA | 7,037 | 7,353 |
Adjusted net borrowings to adjusted EBITDA | 3.0 | 2.7 |
2024 $ million | 2023 re-presented $ million | |
Taxation on profit (a) | 1,294 | 1,163 |
Tax in respect of exceptional items | (24) | 158 |
Exceptional tax credit | — | 68 |
Tax before exceptional items (b) | 1,270 | 1,389 |
Profit before taxation (c) | 5,460 | 5,642 |
Non-operating items | 70 | (364) |
Exceptional operating items | (56) | 766 |
Profit before taxation and exceptional items (d) | 5,474 | 6,044 |
Tax rate after exceptional items (a/c) | 23.7% | 20.6% |
Tax rate before exceptional items (b/d) | 23.2% | 23.0% |
Timeframe | Short term (0-5yrs) | Medium term (2030) | Long term (2050) | |||
Geography | All Diageo and key third-party operations in North America, Scotland (fiscal 21); India, Africa, Mexico and Türkiye (fiscal 22); Asia Pacific, Europe and Latin America and Caribbean (fiscal 23). In fiscal 24, we assessed a further 13 new acquisitions or important third-party sites to complete our assessment. | |||||
Risk types | Physical risks Water (availability, quality, temperature), temperature, flooding, landslide, wildfires, wind, humidity | Transition risks and opportunities | ||||
Temperature scenarios | +4 to +5ºC (extreme) RCP 8.5' | +2 to +3ºC (moderate) RCP 4.5' | 1.5ºC to 2ºC (Paris agreement) RCP 2.6' | |||
Scope | ||||||
Raw materials 1,200+ suppliers' sites Key raw materials* (wheat, barley, maize, cane and beet sugar, vanilla, aniseed, grapes, broken rice, sorghum, agave, dairy, hops) *+4 to +5ºC scenario only | Processing Approximately 250 Diageo and third-party operations sites Detailed assessments of 39 sites | Distribution Key road, rail routes Key sea ports (69) | Risks reviewed Policy and legal risks Technology risks Market risks Reputation risks | Opportunities Resource efficiency Energy source Products and services Markets | ||
Scenario analysis Energy Transport Packaging Raw materials | Scenario analysis Pack weight reduction Circular offerings | |||||
Region | Global | United Kingdom | United States | Canada | Mexico | Türkiye | India | Africa | Asia Pacific | LAC | Ireland |
Glass | l | ||||||||||
Aluminium | l | ||||||||||
Land transport | l | ||||||||||
Ocean transport | l | ||||||||||
Energy | l | l | l | l | l | l | l | l | l | ||
Electricity | l | l | l | l | l | l | l | l | l | ||
Raw materials: | |||||||||||
Barley | l | ||||||||||
Wheat | l | ||||||||||
Maize | l | ||||||||||
Rice | l | ||||||||||
Sorghum | l | ||||||||||
Sugar | l | ||||||||||
Vanilla | l | ||||||||||
Aniseed | l | ||||||||||
Agave | l | ||||||||||
Grapes | l | ||||||||||
Hops | l | ||||||||||
Dairy | l |
Target | Scale up our SMASHED partnership and educate 10 million young people, parents and teachers on the dangers of underage drinking |
Performance measures | •Number of people educated on the dangers of underage drinking through a Diageo-supported education programme •Number of people who confirmed changed attitudes on the dangers of underage drinking following participation in a Diageo-supported education programme |
Definition | SMASHED is our flagship underage drinking programme, developed and delivered in partnership with Collingwood Learning (Collingwood) and sponsored by Diageo. Our SMASHED partnership aims to change attitudes to underage drinking through live theatre performances, workshops and interactive online learning experiences. Live: A live or virtual theatre performance in schools or other community setting, with interactive workshops for students, resources for teachers and parents, and comprehensive evaluations. Online: An innovative and engaging e-learning course, telling the SMASHED story through film clips, with interactive learning tools, student assessment and teacher support. Offline: SMASHED Online programme can also be delivered offline through PowerPoint and film clips. People educated: Target age group (10-17), who have participated in the live or online learning experience. Completions for online are counted only on course completion, and live completion is counted when the individuals, as recorded by the teacher, have completed the session, which is then confirmed by the local delivery partner. Changed attitudes: A young person who confirmed a changed attitude is someone who responds to the post- survey question by stating that they are less likely to drink underage. This is supported by evidenced progression through pre- and post-performance surveys against all other learning outcomes, with the ‘less likely to drink underage’ results as the core indicator. |
Reporting period | 1 June to 31 May. The complexity of gathering data from hundreds of schools globally with different academic years means there is a lag in reporting information from our live programmes. Each financial year we include data from 1 June to 31 May. The baseline year for the reporting of cumulative progress is our financial year ended 30 June 2018. |
Scope exception | When SMASHED is delivered by a third party and is partially funded by Diageo, we only claim the proportion of people educated that our funding contributes to. |
Target (continued) | Scale up our SMASHED partnership and educate 10 million young people, parents and teachers on the dangers of underage drinking |
Data preparation and measurement | The number of people educated is supplied by in-country delivery partners to Collingwood through teachers and online records. We have assumed that teachers are an impartial and accurate provider of student numbers, with clear knowledge of the groups allocated to SMASHED. We have also assumed that students participating in SMASHED live and online have adequate literacy skills to understand and complete written evaluation forms. SMASHED Live operates pre- and post-evaluation surveys of the target audience of young learners. The following sampling criteria have been established to measure attitude change: •Assess at least 20% of programme participants through pre- and post-evaluation surveys. •The participants that make the 20% sample must be selected randomly. •If the sample is less than 200 people, the same participants must take the pre- and post-evaluation surveys. The number of people who confirmed changed attitude is calculated by projecting the results of the survey, for those who have confirmed in the post-survey question that they are less likely to drink underage, to the total number of people educated for the events run. From September 2022, where an audience numbers over 500 students in one session, we categorised these as ‘large scale special events’. Where large scale events were run if there are a sufficient number of facilitators (ratio 1:200 students) then the full number of people educated were included. If the number of facilitators present is below this ratio, then the number of people in attendance were capped at the large-scale event number. From October 2023, we extended capping of our participants to a 1:200 teacher to student ratio across all sizes of events and formats. This enhancement balances the need for large gathering programme delivery with maintaining impactful instruction and participation. The data, alongside supporting evidence is supplied by delivery partners and then consolidated and reviewed by Collingwood before being shared with Diageo for review and reporting. |
Limitations | We consider double counting to be highly unlikely, given the SMASHED activity is only delivered once to any audience within the curricular requirements for the year and our delivery partners also ensure additional quality measures, which are detailed below. No unique personal identifiers are collected, for data privacy reasons. •Where two programmes are available, we mitigate the risk of duplication by offering programmes strategically to different school areas. •Our delivering markets self-declare duplication risks proactively. These self-reported risks of duplication have been omitted from reported figures. •We request all markets document steps they take to avoid duplication of audience participation year- on-year with an annual deduplication statement. Output from these statements provide a tailored, specific, and culturally appropriate approach to avoiding double counting. •We have assumed that the number of students expected to either repeat a year group or change secondary schools is negligible, based on the most recent statistics from third parties. |
Target | Extend our UNITAR partnership, and promote changes in attitudes to drink driving, reaching five million people by 2030 |
Performance measure | Number of people educated about the dangers of drink driving |
Definition | Our Wrong Side of the Road (WSOTR) digital learning resource with the United Nations Institute for Training and Research (UNITAR), primarily delivered online, is designed to help people understand the consequences of drink driving by listening to the repercussions for people who decided to get behind the wheel after drinking. All stories shared via WSOTR are real and aim to help prevent other people from making the same mistakes. The purpose is to show the effects that this decision can have on the individual and the people around them, helping viewers to consider what would happen if they were in a similar situation. We have also introduced a pilot programme called Sober versus Drink Driving. This is a gamification approach to educating people about how alcohol impacts core driving skills. The intention is to demonstrate how drinking impacts their ability to control the vehicle. We have initiated a trial in six markets and also in one of our brand homes, the Guinness Storehouse in St. James’ Gate, Dublin. People educated: Any individual who completes the WSOTR training or Sober versus Drink Driving. Completions for online or in person training are only counted on course completion. Adaptations of the programmes are only made for language translation. |
Scope exception | For programmes that are partially funded by Diageo, we only claim the proportion of people educated that our funding contributes to. |
Reporting period | 1 July to 30 June. Our baseline year is fiscal 22. |
Data preparation and measurement | Data preparation depends on the format of the training. For online trainings, completions are reported daily based on Diageo’s own system or via third parties who must provide back-up data. For offline trainings, data is reported quarterly and reviewed by the Diageo global team. |
Limitation | - |
Performance measure | Code of Business Conduct mandatory training |
Definition | Annually, we request all Diageo employees to complete the Code of Business Conduct e-learning. This requires employees to confirm their commitment to their compliance and ethics accountabilities, and certify that they have read, understood, and complied with our Code of Business Conduct and supporting global policies. |
Scope exception | Employees on long-term leave e.g. family leave, sickness leave. |
Data preparation and measurement | We deliver the Code of Business Conduct e-learning through our global online training tool, Diageo My Learning Hub, which holds participation and completion records for the course. Participation and completion records are reported to market and function leadership teams and reviewed by Business Integrity leads. |
Limitation | - |
Performance measure | Reported and substantiated breaches |
Definition | Reported breaches are potential breaches of our Code of Business Conduct, policies or standards made known to the business, either via our SpeakUp service or brought to our attention internally. Substantiated breaches are those reports that ultimately result in sufficient evidence being gathered to support the concern raised and if dismissal occurred, these employees would be recorded as a Code-related leaver. |
Scope exception | - |
Data preparation and measurement | We restate the number of substantiated breaches and Code-related leavers from previous years to include the outcomes of those reports made in one financial year, but for which the investigation and any associated disciplinary actions are not closed until the following financial year. This enables us to make a full and accurate year-on-year comparison. |
Limitation | - |
Performance measure | Lost-time accident frequency rate (LTAFR) |
Definition | LTAFR is the number of lost time accidents (LTAs) for employees and contractors who work under Diageo’s direct supervision. The calculation is based on actual working hours and is expressed as a rate per 1,000 full-time equivalent (Occupational Health and Safety (OH&S) FTE). OH&S FTE differs from our employee based FTE; it includes contractors. Direct supervision exists when Diageo directly defines the contractors’ deliverables and the methods and processes by which the work is performed. We define an LTA as any work-related incident resulting in injury or illness, where a healthcare professional or Diageo recommends one or more full days away from work, or where a job restriction or modification prevents the employee from conducting their routine tasks and activities and from working a full shift. We consider an injury or illness to be work-related when an event or exposure in the work environment (including people working at home) either caused or contributed to the resulting condition, or significantly aggravated a medically documented and treated pre-existing injury or illness. |
Scope exception | If the injured person did not report the accident on the same shift to their immediate line manager and/or Diageo point of contact, this accident is not in scope as work-related. |
Data preparation and measurement | We collect and report safety data for all locations (manufacturing, corporate office, remote commercial and remote home working) where we have operational control, including all office sites. Each month, locations are required to collate and submit details associated with all incidents, accidents and LTAs, as well as OH&S FTE data for their site. Contractor agencies provide data on the hours worked by each contractor under Diageo’s direct supervision. This is then combined with Diageo employee data to calculate the total OH&S FTE data for the month. Data is submitted by locations onto our global reporting platform on a monthly basis. |
Limitation | We do not report LTAFR for independent contractors because of the difficulty and administrative burden in accurately recording headcount. |
Performance measure | Total recordable accident frequency rate (TRAFR) |
Definition | TRAFR includes all work-related fatalities, lost time accidents and medical treatment cases for Diageo employees wherever they carry out their work-related activities. It includes fatalities and lost time accidents for all contractors (not only those under our direct supervision) and outsourced service providers while on Diageo premises. It also includes medical treatment cases for all site-based contractors. The calculation is based on actual working hours and is expressed as a rate per 1,000 OH&S workers. Definition for ‘Injury or illness’ as under LTAFR. |
Scope exception | The exception is the same as under LTAFR. Working hours are excluded from the calculation for contractors visiting Diageo premises for a short period of time. |
Data preparation and measurement | The data preparation is the same as LTAFR. |
Limitation | We do not report medical treatment cases for contractors visiting Diageo premises on a temporary basis. |
Performance measure | Number of fatalities |
Definition | A fatality includes any work-related fatality of an employee or contractor under our direct supervision in their day-to- day work environment (on or off our premises), or any work-related fatality suffered by an outsourced service provider or contractor not under our direct supervision while on our premises. We consider a fatality to be work-related when an event or exposure in the work environment (including people working at home) either caused or contributed to the event. |
Scope exception | - |
Data preparation and measurement | The data preparation is the same as LTAFR. |
Limitation | - |
Performance measure | Lost-time injury frequency rate (LTIFR) |
Definition | Lost-time injury frequency rate (LTIFR) is a standard Occupational Safety and Health Administration (OSHA) metric that measures the number of lost-time injuries occurring in a workplace per one million hours worked. |
Scope exception | The scope exception is the same as LTAFR. |
Data preparation and measurement | The data preparation is the same as LTAFR. |
Limitation | We do not report LTIFR for independent contractors because of the difficulty and administrative burden in accurately recording headcount. |
Performance measure | Lost-time injury rate (LTIR) |
Definition | LTIR is a standard OSHA metric that calculates the number of lost-time injuries occurring in a workplace per 200,000 hours worked. |
Scope exception | The scope exception is the same as LTAFR. |
Data preparation and measurement | The data preparation is the same as LTAFR. |
Limitation | We do not report LTIR for independent contractors because of the difficulty and administrative burden in accurately recording headcount. |
Performance measure | Employee Engagement Index |
Definition | The Employee Engagement Index is calculated as the percentage of respondents who answer positively to three questions in our Your Voice survey: I am proud to work for Diageo; I would recommend Diageo as a great place to work; I am extremely satisfied with Diageo as a place to work. |
Scope exception | Contractors and employees on long-term leave are excluded. |
Reporting period | The data was collected between 2 and 26 April 2024, so the results are based on feedback from participants in that particular window. |
Data preparation and measurement | The index is calculated from an anonymous annual survey run by an independent third-party. |
Limitation | - |
Employee profile data | ||
Performance measures | Average number of employees by region by gender | Average number of employees by role by gender |
Definition | Employees on a full-time equivalent basis who are directly employed by Diageo have been allocated to the region in which they reside. | Employees on a full-time equivalent basis who are directly employed by Diageo have been allocated to the role in which they occupy. We define Executive as a member of the Executive Committee; senior manager (Senior Leaders, Level 2 and Level 3) as those in top leadership positions excluding Executive Committee members; line manager as all Diageo employees (excluding Executive Committee and senior managers) with one or more direct reports; and supervised employee as all remaining Diageo employees who have no direct reports. |
Scope exception | All Diageo employees on a full-time equivalent basis are in scope for this performance measure. However, people data from joint ventures and associates where Diageo does not have operational control are not included. | All Diageo employees are in scope for this performance measure. However, people data from joint ventures and associates where Diageo does not have operational control are not included. |
Data preparation and measurement | Total employee data comprises our average number of FTE employees across 12 months. The average is calculated based on the FTE numbers from the last day of each month over the past year. Employee type includes Regular, Graduates and Fixed Term Contract (FTC) across all markets. | Total employee data comprises our average number of FTE employees across 12 months except Executives, which are reported as of 30 June 2024 because of the small population size. The average is calculated based on the FTE numbers from the last day of each month over the past year. Employee type includes Regular, Graduates and Fixed Term Contract (FTC) across all markets. |
Limitations | Joint operations are included but, where Diageo does not have operational control, only high-level regional data is available. Markets where our global HR system, Workday, is not in place are reliant on manual data collection or, in some cases, we may not be able to obtain data. Data on family leave is only available for markets where we have implemented our global HR system, Workday. | Joint operations are included but, where Diageo does not have operational control, only high-level regional data is available. Markets where our global HR system, Workday, is not in place are reliant on manual data collection or, in some cases, we may not be able to obtain data. Data on family leave is only available for markets where we have implemented our global HR system, Workday. |
Ambition | Champion gender diversity, with an ambition to achieve 50% representation of women in leadership roles by 2030 |
Performance measure | Percentage of female leaders globally |
Definition | Leadership roles comprise Executive Committee members (Exec), Senior Leaders (SL), Level 2 (L2) and Level 3 (L3) roles, some of which will be vacant at any point in time. Employee type includes those on regular and fixed-term contracts. Gender data is disclosed by employees themselves on a voluntary basis on our online Human Resources system (Workday). |
Scope exception | Non-Executive Directors and extended workers (agency workers, independent contractors, freelancers and consultants) are not in scope, nor are joint ventures, joint operations not managed by Diageo or associates where Diageo does not have operational control. |
Data preparation and measurement | The performance measure is calculated as the average of filled leadership roles at the end of each of the four quarters across the fiscal year. The total leadership population is calculated from markets that collect gender information through Workday, enabling all employees in scope to self-disclose this information. |
Limitation | Where employees have chosen not to declare their gender, this information is excluded from the gender representation data. |
Ambition | Champion ethnic diversity with an ambition to increase representation of leaders from ethnically diverse backgrounds to 45% by 2030 |
Performance measure | Percentage of ethnically diverse leaders globally |
Definition | Leadership roles comprise Executive Committee members (Exec), Senior Leaders (SL), Level 2 (L2) and Level 3 (L3) roles, some of which will be vacant at any point in time. Employee type includes those on regular and fixed-term contracts. We define ethnically diverse as those ethnic groups who are, or were historically, systematically under- represented, disenfranchised and/or economically excluded. Ethnically diverse people can be a majority or a minority in a country. We determined eight categories of ethnicity, considering Diageo’s market footprint, historic underrepresentation and alignment across regions: Asian, Black, Hispanic/Latin American, Indian, Indigenous, Middle Eastern and Turkish, Mixed and Other Ethnic Groups. Based on a third-party study commissioned by Diageo, ‘Hispanic/Latin American’ is adopted as a term to categorise all people originating from the Latin America and Caribbean (LAC) region, including both indigenous and historically migrant populations. For the purposes of this data gathering exercise, all employees identifying as White with a LAC nationality have been recorded as Hispanic/Latin American. |
Scope exception | Non-Executive Directors and extended workers (agency workers, independent contractors, freelancers and consultants) are not in scope, nor are joint ventures, joint operations not managed by Diageo or associates where Diageo does not have operational control. While Workday is live across all geographies in which leaders are based, ethnicity data collection is not legally available in Denmark, France, Italy, Portugal, Spain and Sweden. Any leaders based in these locations are not in scope. |
Data preparation and measurement | The performance target is calculated as the average of filled leadership roles at the end of each of the four quarters across the fiscal year. Ethnicity is selected by individuals within the leadership population from a pre-defined list that encompasses those ethnic types most readily seen within the specific country, based on local census and governmental data. Ethnicity data is disclosed by employees on a voluntary basis on Workday. The relevant ethnicity fields are based on the country in which the individual is employed to ensure all are culturally relevant. Employees based in India are not able to submit ethnicity data through Workday due to cultural sensitivities. Nationality is obtained by the local HR team through official identification documents during the onboarding process. For India-based employees not of Indian nationality, the local HR director confirms their ethnicity through a confidential conversation with the individual. Non-LAC nationals are mapped to their identified ethnicity. |
Limitation | Employees who declined to self-identify or have not disclosed their ethnicity are not counted as ethnically diverse. |
Ambition | Provide business and hospitality skills to 200,000 people, increasing employability and improving livelihoods through Learning for Life and our other skills programmes |
Performance measure | Number of people reached through Learning for Life and other skills programmes |
Definition | Our hospitality skills training programmes, including Learning for Life, aim to increase participants’ employability, improve livelihoods and support a thriving hospitality sector. Our entrepreneurship programmes provide business skills related to Diageo’s activities with the aim of supporting participants to start their own business. Our training courses are delivered in different ways: physical, live online sessions or via e-learning. Our training curriculums includes technical skills, life skills, sustainability and inclusion and diversity. People reached through Learning for Life: Participants are counted when an individual successfully completes the curriculum, evidenced by either online training system records or classroom records. |
Scope exception | Only markets running business and hospitality programmes are in scope. |
Data preparation and measurement | We collate the number of beneficiaries of Learning for Life and other skills programmes through participant programme completion records (collected face-to-face or via our online training systems) maintained by Diageo programme managers or third-party delivery partners. |
Limitations | Accuracy relies on the quality of data provided by our third-party delivery partners. For entrepreneurship programmes to be included, the metric owner applies judgment in determining whether the initiatives are appropriate to be included under the definition of providing business or hospitality skills related to our value chain. Third-party delivery partners avoid double counting through checking the name of the participants on programme registration forms in the case of physical trainings or using unique identifiers for online trainings and e-learnings. Even with these procedures, there remains a limited risk of double counting which we will be addressing through increased controls in the future. |
Target | Reduce water use in our operations with a 40% improvement in water use efficiency in water- stressed areas and a 30% improvement across the company |
Performance measures | •Water efficiency index - water-stressed areas •Water efficiency index - across the company |
Additional performance measures | Percentage change in water efficiency index from the prior year and from the baseline Note: This metric is used in all new Long Term Incentive Plans awarded from fiscal 24 onwards. |
Definition | We prepare and report water withdrawal (use) using internally developed reporting methodologies based on the GRI Standards. Water withdrawal (use) includes water obtained from ground water, surface water, mains supply and water delivered to the site by tanker, less any clean water provided directly from a site to local communities. Also excluded from reported water withdrawal data is uncontaminated water abstracted and returned to the same source under local consent, water abstracted from the sea and rainwater collection. Water efficiency for distillation is measured as water use per litre of pure alcohol (LPA) distilled for finished products only. Water efficiency for brewing and packaging is measured as water use per litre packaged. When preparing the water efficiency index, the change in water efficiency for distillation and the change in water efficiency for brewing and packaging are weighted by the proportion of water used (m3) by all sites in each production type relative to the total water use, and added together. This is then compared to the baseline and prior year. For water-stressed only: We classify a site as in water-stressed areas if the site is in a location which meets the definition of ‘water-stressed’, which is identified through a combination of sources, including the World Resources Institute (WRI) Aqueduct tool, UN definitions, internal water risk survey information and external reviews by independent hydrologists. An assessment to identify our sites located in water-stressed areas is completed every two years. We include any new-build or acquired sites and exclude any sites divested. All sites identified as water-stressed up until the 2025 water risk assessment will be included in the scope of our current 2030 water efficiency commitment for water-stressed areas. Newly classified water-stressed sites are retrospectively applied to the fiscal 20 baseline, including the water use and distilled, brewed or packaged production volumes. Similarly, sites reclassified as no longer water-stressed are removed from the fiscal 20 baseline. This approach ensures consistency in tracking performance, versus the more stretching target of 40% improvement for water-stressed sites. For reference, the water efficiency index formula is: 100 – (((% Change in Water efficiency, l/l distilled*% of water withdrawals for distillation) + (% Change in Water efficiency, l/l brewing and packaging*% of water withdrawals for brewing and packaging))*100). |
Scope exception | The volume of water used on land under our operational control in Mexico and Türkiye is reported separately from water used in our direct operations and not included in our water efficiency calculations. |
Data preparation and measurement | Water withdrawal (use) is measured primarily from meter readings and invoices. In limited cases, estimates are used. Distilled, brewed and packaged production volumes are based on production records. All sites (including offices, warehouses, maltings, etc.) are mapped to either distillation or brewing and packaging, based on their prevailing production type. This mapping is reviewed annually and applied in determining the: •water use distillation (m3); •water use brewing and packaging, (m3); •proportion of total water abstracted for each production type (%); and •water efficiency for distillation (l/LPA) and brewing and packaging, (l/l). Water efficiency index performance is attributed to the prevailing production type and excludes the production from the secondary production process in the calculations (e.g. a site with distillation and packaging processes allocated to distillation only considers the distilled production and excludes the packaged production in the calculations). We measure water withdrawal (use), litres of pure alcohol and litres of packaged product by site and aggregate them at the production type level. |
Limitation | In limited cases (e.g. failure or malfunction of water meters), estimates are used for water withdrawals. |
Target | Reduce water use in our operations with a 40% improvement in water use efficiency in water- stressed areas and a 30% improvement across the company |
Performance measure | •Water use efficiency per litre of product packaged (Litres/Litre) - across the company •Water use efficiency per litre of product packaged (Litres/Litre) - water-stressed areas |
Additional performance measure | Percentage improvement in litres of water used per litre of product packaged from the prior year and from the baseline. Note: This metric is used in Long Term Incentive Plans for those awarded prior to fiscal 24. |
Definition | We prepare and report water withdrawal (use) using internally developed reporting methodologies based on the GRI Standards. Water withdrawal includes water obtained from ground water, surface water, mains supply and water delivered to the site by tanker, less any clean water provided back to local communities directly from a site. Uncontaminated water abstracted and returned to the same source under local consent, water abstracted from the sea and rainwater collection, are excluded from reported water withdrawal data. For water-stressed only: We classify a site as in water-stressed areas if the site is in a location which meets the definition of ‘water-stressed’ which is identified through a combination of sources, including the World Resources Institute (WRI) Aqueduct tool, UN definitions, internal water risk survey information and external reviews by independent hydrologists. An assessment to identify our sites located in water-stressed areas is completed approximately every two years. We include any new-build or acquired sites and exclude any sites divested. All sites identified as water-stressed up until the 2025 water risk assessment will be included in the scope of our current 2030 water efficiency commitment for water-stressed areas. Newly classified water-stressed sites are retrospectively applied to the fiscal 20 baseline, including the water use and packaged volumes. Similarly, sites reclassified as no longer water-stressed are removed from the fiscal 20 baseline. This approach ensures consistency in tracking performance, versus the more stretching target of 40% improvement for water stressed sites. |
Scope exception | The volume of water used on land under our operational control in Mexico and Türkiye is reported separately from water used in our direct operations and not included in our water efficiency calculations. |
Data preparation and measurement | Water withdrawal (use) is measured primarily from meter readings and invoices. In limited cases, estimates are used. Water efficiency per litre of packaged product is calculated by dividing total water withdrawal by the total packaged volume. We use litres of packaged product as the measure for comparison, because this indicates how much water has been used relative to the amount of finished product that has been packaged. We measure litres of packaged product by site and aggregate them at group level. |
Limitation | In limited cases (e.g. failure or malfunction of water meters), estimates are used for water withdrawals. |
Target | Replenish more water than we use for our operations for all of our sites in water-stressed areas by 2026 |
Performance measures | Annual volumetric replenishment capacity of projects developed (m3) Cumulative volumetric replenishment capacity of projects developed from fiscal 16 to fiscal 24 |
Definition | Our ambition is to replenish more water than we use in sites at our defined water-stressed areas, based on 2026 projected production volume. Our definition of replenishment (or volumetric water benefit) is aligned with the World Resources Institute’s (WRI) definition. Replenishment activities beneficially modify the hydrology and address shared water challenges and improve water stewardship outcomes. We classify areas as water-stressed if our site is in a location which meets the definition of ‘water-stressed’ through a combination of sources, including the World Resources Institute (WRI) Aqueduct tool (at the Minor Basin level), UN definitions, internal water risk survey information and external reviews by independent hydrologists. An assessment to identify our sites located in water-stressed areas is completed approximately every two years. We include any new-build or acquired sites and exclude any sites divested. Newly classified water-stressed sites are subsequently included in our ambition. Similarly, sites reclassified as no longer water-stressed are removed from the ambition. This approach ensures consistency in tracking performance versus our projected volumes for water-stressed sites which we expect will be in production in fiscal 26. To be considered within the annual volumetric replenishment capacity, replenishment projects need to be in a relevant water-stressed area (e.g. a site’s water basin and/or water-stressed water basins from which we source local raw materials). |
Scope exception | As the target date for the water replenishment programme is fiscal 26, any newly identified sites in water- stressed areas in our fiscal 25 water risk assessment will be out of scope for the replenishment programme. Any site located in a water-stressed area using under 1000 m3 of water is considered de minimis and out of scope. |
Reporting period | The complexity of gathering data from different project partners means there is a lag in reporting information our projects. Each financial year we include data from 1 June to 31 May. The baseline year is fiscal 16. |
Data preparation and measurement | The methodology for calculating the volume of water replenished is based on the WRI’s ‘Volumetric Water Benefit Accounting: A Method For Implementing and Valuing Water Stewardship Activities (2019)’, which informs the Diageo Water Replenishment Programme Technical Protocol 2021. Replenishment capacity created by replenishment projects is calculated using Diageo’s Water Replenishment Programme Technical Protocol 2021. The Diageo Water Replenishment Implementation Guide 2022 provides instructions for markets on how to implement the Technical Protocol. The Water Replenishment Implementation Guide and Technical Protocol are reviewed on an as-needed basis. Implementation partners are appointed in our water-stressed areas based on their expertise in particular project types which based on the risk assessments and consultations with local communities, NGOs and authorities, we believe will deliver the most impact. These implementation partners are responsible for project delivery. Data required to calculate the indicative volume of water replenished is collected by the project’s implementation partner. An estimate of volumes is made at the inception of the project, and then validated when the project becomes operational. This data is then validated by an external validator and confirmed by the Diageo Head of Environment. All current year validated replenished volumes are summed together across all projects, which is the annual replenishment volumetric capacity added in the year. The current year annual replenishment volumetric figure (in m3) is then added to previous volumetric figures, net of any volumes which represent over delivery at any of our water stressed sites to arrive at a cumulative replenishment volumetric total since 2020. This amount is compared to projected fiscal 26 water usage. The estimated site water usage for fiscal 26 is restated every year to reflect latest estimates and previous fiscal actuals. When projects are delivered by a third party and partially funded by Diageo, to avoid double counting, we only claim the proportion of volumetric capacity attributable to Diageo. |
Limitation | Our cumulative replenishment figure includes historic projects where natural changes in the amount of water replenished can occur over time. We reassess these projects using a risk-based approach, testing that the projects continue to deliver the replenishment capacity which was validated at the commissioning phase. Where there are significant changes (greater than 5%) of original replenishment capacity, this is updated in the current year cumulative figure. |
Target | Engage in collective action in all of our priority water basins to improve water accessibility, availability and quality and contribute to a net positive water impact |
Performance measure | Percentage of priority water basins with collective action participation |
Definition | We identify priority water basins by using a Diageo criticality assessment (based on expert judgement and water consumption volumes) and by those facing high water risk, according to the WRI Aqueduct tool. We select these basins, where Diageo sites are located, as we believe they would benefit most from Diageo participating in collective action to address shared water challenges. Water collective action incorporates multi-stakeholder water stewardship initiatives and/or projects that include partnership with government entities, local communities, NGOs, civil society organisations and other stakeholders in the basin. The way we engage in collective action is dependent on what is required from the different initiatives that we are involved in. Our main role is usually the contribution of funds and strategic input but we also play additional roles to deliver effective collective action. The roles include, but are not limited to, financing projects, convening stakeholders to join existing or to start new initiatives, basin and project modelling, project implementation, catchment monitoring and evaluation, policy and regulatory engagement, water advocacy, institutional capacity building and/or training. We also contribute to the global development of guidance and models for best practice, multi-stakeholder collective action. |
Scope exception | This metric only includes our priority water basins as defined above. Where collective action activity is deemed to be minimal, we do not count this activity as collective action engagement in that priority water basin. |
Data preparation and measurement | Evidence of collective action participation in priority water basins is collected at the country level and reviewed by the Diageo global metric owner. |
Limitation | Judgment is applied when determining what is considered to be greater than minimal collective action engagement. The action we engage in are multi-stakeholder and multi-year; impact is measured over time. We reflect on the collective impact, and our individual contributions in making the judgment that our engagements were greater than a minimal threshold. |
Target | Become net zero carbon in our direct operations (Scope 1 and 2) |
Performance measures | •Percentage change in absolute greenhouse gas emissions (direct and indirect greenhouse gas emissions by weight (market/net based)) from the prior year and the fiscal 2020 year baseline •Direct greenhouse gas emissions by weight (market/net based) (1,000 tonnes CO2e) •Indirect greenhouse gas emissions by weight (market/net based) (1,000 tonnes CO2e) •Total direct and indirect greenhouse gas emissions by weight (market/net based) (1,000 tonnes CO2e) •Market based (net) intensity ratio of GHG emissions (grams CO2e per litre of packaged product) •Direct greenhouse gas emissions by weight (location/gross based) (1,000 tonnes CO2e) •Indirect greenhouse gas emissions by weight (location/gross based) (1,000 tonnes CO2e) •Total direct and indirect greenhouse gas emissions by weight (location/gross based) (1,000 tonnes CO2e) •Location based (gross intensity) ratio of GHG emissions (grams CO2e per litre of packaged product) |
Definition | Scope 1 and 2 greenhouse gas emissions are presented as the absolute greenhouse gas emissions (Direct – Scope 1 emissions from on-site energy consumption of fuel sources and Indirect – Scope 2 emissions from purchased electricity and heat) in 1,000 tonnes CO2e using market-based and location-based reporting methodologies. Market-based and location-based greenhouse gas emission intensity ratio is calculated as grammes per CO2e per litre, using direct operations packaged product volume in litres. |
Scope exception | We exclude minor quantities of Scope 1 greenhouse gas emissions up to 0.5% of a site’s emissions, to a maximum of 50 tonnes CO2e per emission source, as well as the greenhouse gas emissions associated with biogas flaring, since they are determined to be immaterial to our overall impacts. Biological/biogenic CO2 emissions from the combustion of bioenergy and from direct operations processes such as fermentation to create alcohol, are outside of scope and are reported separately. However, bioenergy CO2e emissions associated with methane and nitrous oxides that are not absorbed in bioenergy feedstock growth, are included in Scope 1 emissions. We do not include carbon offsets or credits in the Scope 1 and 2 GHG emissions market-based or location- based approach. |
Data preparation and measurement | We calculate CO2e emissions data based on direct measurement of energy use (meter readings/invoices) for the majority of sites. Market-based and location-based emissions We externally report Scope 1 and 2 greenhouse gas emissions using metric tonnes of CO2e to compare the emissions from the seven main greenhouse gases based on their global warming potential. We base our CO2e reduction targets and reporting protocols (since 2007) on market-based emissions. We also calculate our emissions using the location-based approach, where direct operations greenhouse gas emissions are reported without the benefit of indirectly supplied renewable energy. Direct (Scope 1) emissions We report fuel consumption by fuel type at site level using the environmental management system. Using calorific values, the fuel is then converted to energy consumption, in kilowatt hours (kWh), by fuel type and is multiplied by the relevant CO2e emission factor to derive total CO2e emissions. Scope 1 emission factors for fuels are typically average fuel CO2e emissions factors and calorific values (the latest available at the end of the period) from the UK Government Department for Energy Security and Net Zero (DESNZ). For market-based emissions calculations, we apply product-specific factors where available. Energy attribute certificates (EACs), derived from our distillery by-product feedstock and processed by a third party to generate biomethane, form a component of our decarbonisation, together with purchased renewable gas EACs (i.e. from certificate-backed biomethane supplied indirectly through the natural gas grid). For location-based emissions calculations, we apply product-specific factors, where available, but the specific emission factors associated with EACs are not used (i.e. indirectly supplied renewable gas through grid is reported using standard, natural gas grid emission factors). Indirect (Scope 2) emissions We report greenhouse gas emissions from electricity (Scope 2) as market-based emissions and as location- based emissions in line with the WRI/WBCSD GHG Protocol Scope 2 guidance 2015. For market-based emissions, electricity consumption recorded on our environmental management system is multiplied by emissions factors specified in EACs, contracts, power purchase agreements and supplier utility emissions, as detailed in the GHG Protocol’s Scope 2 guidance. We use GHG Protocol Scope 2 to ensure EACs and associated financial instruments meet the required standards. GHG emission factors relating to indirect, Scope 2 emissions are updated with latest available by end of the period. For location-based emissions, grid imported electricity consumption recorded on our environmental management system is multiplied by regional or sub-national emission factors (where available) to calculate Scope 2 location-based GHG emissions. These include, for example, The Commission for Regulation of Utilities (CRU) (Ireland), DESNZ (United Kingdom), the National Inventory Report (Canada), US eGRID (United States) and the Indian power sector report (India). In all other cases, country or sub-regional factors are provided by the International Energy Agency (IEA). Location-based emission factors are reviewed annually and updated with latest available at the end of the period. Fugitive and owned agricultural [Scope 1] emissions We calculate fugitive emissions based on the amount of emitted ozone-depleting substances and fluorinated gases, multiplied by the relevant emission factor to represent the global warming potential in tonnes of CO2e. Annually, each site reports the quantity (mass) of each material/gas emitted based on any added/topped-up amount, reported via the environmental management system. The mass of each emitted ozone-depleting substance and fluorinated gas is multiplied by the relevant emission factor and then added together to report the equivalent GHG emissions in tonnes of CO2e. We calculate agricultural emissions from direct operations owned and operated by Diageo based on fertiliser use. The annual quantity (mass) of inorganic fertiliser is multiplied by the percentage of nitrogen content and by the relevant GHG emission and conversion factors (e.g. nitrogen to nitrous oxide, nitrous oxide GHG emission factor) to determine the equivalent tonnes CO2e emissions. Scope 1 and Scope 2 data aggregation For market-based: Total direct and indirect greenhouse gas emissions by weight (market/net based) (1,000 tonnes CO2e) is the aggregation of Scope 1 and 2 GHG emissions with fugitive and owned agriculture emissions to calculate total direct operations market-based emissions. The percentage reduction in absolute greenhouse gas emissions (direct and indirect greenhouse gas emissions by weight (market/net based)) from the prior year is a percentage change calculation with reference to the corresponding prior year figure. Our net zero emissions target for 2030 remains consistent with earlier reporting protocols and is based on market-based emissions. For location-based: We aggregate location-based Scope 1 and 2 GHG emissions with fugitive and owned agriculture emissions (as detailed in the market-based approach above) to calculate direct operations total location-based emissions. GHG emission intensity ratios Total, aggregated direct operations market-based and location-based emissions (as detailed above) are divided, respectively, by the volume of direct operations packaged product reported in the same period. The market-based and location-based emissions are converted to grammes of CO2e and the volume of packaged product is reported in litres to generate relevant GHG emission intensity ratios in g CO2e/litre packaged. |
Limitation | Where invoices or site meter readings are not available, for example, due to timing differences or metering issues, we estimate consumption. |
Target | Reduce our value chain (Scope 3) carbon emissions by 50% |
Performance measure | Percentage change in absolute greenhouse gas emissions (ktCO2e) from the prior year |
Definition | Scope 3 emissions are indirect greenhouse gas (GHG) emissions generated by activities upstream or downstream of our operations that are not accounted for as Scope 1 and 2 GHG emissions. Scope 3 greenhouse gas emissions are assessed for relevance across 15 value chain categories and sub- categories and for Diageo, these are deemed relevant: •Category 1: Purchased raw materials, packaging and third party manufacturers. •Category 2: Capital goods. •Category 3: Fuels and energy-related activities. •Category 4: Upstream and downstream logistics and distribution. •Category 5: Waste generated in operations. •Category 6: Business travel. •Category 7: Employee commuting, including the emissions associated with leased and a limited number of Diageo owned vehicles not accounted for in Scope 1 and Scope 2 GHG emissions. •Category 11: Use of products sold. •Category 12: End of life of products sold. We do not include carbon offsets or credits in Scope 3 GHG emissions. |
Scope exception | Any categories of Scope 3 emissions not listed in the definition above are out of scope for reporting. These are either excluded on the basis of materiality or a lack of reliable data. |
Reporting period | All Scope 3 data is included for the current fiscal, with the exception of transportation and distribution (category 4). We have moved the reporting period from a one-year lag to now including data from June - May. |
Target | Reduce our value chain (Scope 3) carbon emissions by 50% |
Data preparation and measurement | We externally report Scope 3 GHG emissions using metric tonnes of CO2e to compare the emissions from the four greenhouse gases – carbon dioxide (CO2), methane (CH4), nitrous oxide (N2O) and hydrofluorocarbons (HFCs) – included in our calculations, based on their global warming potential. Diageo uses a combination of consumption and spend based activity data to determine Scope 3 GHG emissions for all categories deemed relevant. The Diageo GHG Emission Factors Master Database contains the specific emission factor used and the associated source file. This activity data is multiplied by relevant emission factors sourced from industry-average databases, unless there are supplier specific factors. Where relevant, the supplier specific factors are preferred over industry-average database factors. Emission factors are updated annually based on updates to the industry- average databases and with published emission factors from suppliers. Inflation and Exchange Rate Adjustment For all spend-based calculations in the Scope 3 inventory, the emission factors used are based on 2019/2020 US dollars. In alignment with the GHG Protocol Scope 3 Calculation Guidance (Section 1, page 49), spend values are adjusted to reflect the differences in market values between the year of the spend based factors (2019) and the current period using country-specific inflation and exchange rates so the emission factor can be appropriately applied. The spend values are deflated by multiplying the current year spend by a ratio of the consumer price indices (CPI) of 2019/20 and the current year. The CPI values are obtained from S&P Global per country that Diageo has operations in, and it was assumed that all spend per site was acquired in, and thus subject to inflation of, the country of the site. The exchange rates are obtained with guidance from Diageo’s internal accounting department. Diageo use two calculation methods: 1) The average data method: The average data as described in the GHG Protocol Scope 3 Calculation Guidance are used to calculate these emissions. The quantity of relevant goods or services purchased in the reporting year is multiplied by the secondary (e.g. industrial average) emission factors (e.g. average emissions per unit good or service). Cradle-to-Tiers 1 supplier emission factors of the purchased goods or services per unit of mass are used (e.g. kg CO2e /kg). The average data method is represented by the following equation: CO2e emissions for purchased goods or services = Σ(mass of purchased good or service (kg) x emission factor of purchased good or service per unit of mass (kg CO2e/kg)). This method is applied for the following scope 3 categories: •Category 1: Purchased goods and services. •Category 3: Fuel and energy-related activities. •Category 4: Upstream transportation and distribution. •Category 5: Waste generated in operations. •Category 6: Business travel. •Category 7: Upstream leased assets. •Category 11: Use of sold products. •Category 12: End of life treatment of sold products. 2) The spend-based data method: The spend-based data method is used to calculate these emissions. The spend on relevant capital goods purchased in the reporting year is multiplied by the spend-based emission factor (e.g. average emissions per unit spent). The calculation method is represented by the following equation: CO2e emissions for capital goods = Σ (spend on capital goods (USD) x emission factor of purchased capital good per economic value (kg CO2e/USD)) This method is applied for the following scope 3 categories: •Category 2: Capital Purchase goods and services. For the transportation and distribution (category 4) calculation, we have updated the GHG factors to the latest Global Logistics Emissions Council (GLEC) factors. The latest Global Warming Potential (GWP – 2021 IPCC report) are used in Diageo’s GHG calculation and the Biogenic GHG emissions are not included. |
Limitations | Due to inherent limitations related to measurement uncertainty and/or the availability of actual activity data, we utilise Diageo and/or industry average activity data for certain purchased goods or services. Due to limited primary greenhouse gas factors from suppliers, secondary greenhouse gas factor sources are used, such as industry recognised emission factors and others. As such, Scope 3 greenhouse gas emissions reporting is inherently limited and processes to refine data calculations are constantly under review. |
Target | Use 100% renewable energy across all our direct operations |
Performance measure | •Change in percentage of renewable energy across our direct operations from the prior year •Total direct (renewable and non-renewable) energy consumption (TJ) •Direct energy efficiency (MJ/litre packaged) •Indirect energy efficiency (MJ/litre packaged) •Total direct and indirect energy efficiency (MJ/litre packaged) |
Definition | We report total energy use and renewable energy use in megawatt hours (MWh) and/or terajoules (TJ). Total energy and renewable energy use are determined from direct and indirect energy consumption; energy generated on our sites and purchased energy. We determine direct energy (renewable/non- renewable) from the quantity of different fuel types (in metric tonnes, litres) of renewable and non- renewable fuels and by applying the relevant calorific value (either from DESNZ or the supplier). We measure indirect energy (renewable/non-renewable) in MWh and/or TJ from energy utilities or suppliers and/or by applying the relevant EACs. We include directly connected renewable energy generated on or near our sites, where all energy is used on site and no EACs are created (e.g. roof-mounted solar panels with all generated renewable electricity used on site). |
Scope exception | We exclude minor energy sources that account for less than 0.5% of a site's overall Scope 1 and 2 emissions, up to a maximum of 50 t CO2e of individual emission source. They are considered immaterial to our overall impact. |
Data preparation and measurement | We report total energy and renewable energy in MWh and/or TJ. We calculate direct and indirect energy data based on the direct measurement of energy use (meter readings/invoices for volumes of fuel supplied). We report fuel consumption by fuel type at site level using the environmental management system. Using calorific values, the fuel is then converted to energy consumption, in kWh, by fuel type and classified as either renewable or non-renewable based on fuel type or source. EACs, derived from our distillery by- product feedstock and processed by a third-party to generate biogas, together with purchased renewable gas EACs, are applied to relevant natural gas supplied to sites via a common carrier pipeline/network. All indirect energy generated and used on site, along with purchased indirect energy supplied through the grid is classified as renewable by the allocation of EACs, contracts, power purchase agreements and supplier-specific utility factors, where relevant. To calculate the percentage of renewable energy use, we divide total renewable energy (direct and indirect energy supplies (in MWh)) by total energy use, comprising all reported energy sources (MWh). Direct energy efficiency (MJ/L); indirect energy efficiency (MJ/L) and total energy efficiency (MJ/L) are determined from total direct energy (MJ), total indirect energy (MJ) and total energy (MJ) and divided by the volume of packaged product (litres). |
Limitation | Energy data is calculated based on direct measurement of energy use (meter readings/invoices) for the majority of sites. Where invoices are not available, for example, due to timing differences, consumption is estimated. |
Target | Continue our work to increase recycled content in our packaging (increasing the percentage of recycled content in our packaging to 60%) |
Performance measure | Change in percentage of recycled content (by weight) |
Definition | We determine recycled content by establishing the percentage weight of non-virgin materials used to generate the packaging components. |
Scope exception | — |
Data preparation | We collate packaging material volume data for the total volume of packaging purchased. We collect recycled content data through quarterly supplier questionnaires and then consolidate and internally verify it. |
Limitation | Reporting relies on suppliers' technical information, timely completion of quarterly questionnaires and supporting supplementary information. |
Target | Continue our work to reduce total packaging (delivering a 10% reduction in packaging weight) |
Performance measure | Percentage reduction of total packaging (by weight) |
Definition | We determine changes to packaging weight by quantifying the weight reduction in grammes multiplied by the number of product codes (SKUs) affected, on an annualised basis. |
Scope exception | — |
Data preparation | We collate packaging material volume data for total volume of packaging purchased and weight. We verify weight data through quarterly supplier questionnaires. |
Limitation | Reporting relies on suppliers' technical information, timely completion of quarterly questionnaires and supporting supplementary information. |
Target | Develop regenerative agriculture programmes in five key sourcing landscapes |
Performance measure | Number of regenerative agriculture programmes |
Definition | We define our key sourcing landscapes as locations from which we source our most material crops, in terms of product dependency (e.g. agave for tequila), volumes sourced and contribution to our Scope 3 GHG footprint. The programmes include: •On-the-ground programmes with farmers to test and integrate regenerative and low-carbon practices in crop production systems •On-farm measurements and data collection protocols to track improvements in soil health, soil carbon, biodiversity, water stewardship and farm profitability •Collaborative programmes with our suppliers, other commodity off-takers, expert agronomists, technology providers, NGOs or specialist organisations Our regenerative agriculture programmes currently expand across three crop systems and three geographies including barley in Ireland for our beer category (Guinness), wheat and barley for our scotch and grain neutral spirit categories in the United Kingdom and agave for our tequila category in Mexico. We are also building partnerships across additional agricultural sourcing hubs to advocate for regenerative landscape transitions including Telangana state in India for broken rice, Kentucky and Tennessee in the United States for corn and rye and Kenya, Ghana and Nigeria across sorghum smallholder value chains. |
Scope exception | Where programme activity is in early stages of deployment in a particular sourcing area, we do not include this sourcing area as covered by a regenerative agriculture programme. |
Data preparation | Data is consolidated for each pilot programme. Tracking and reporting on improvements against key outcomes is managed centrally. |
Limitation | Judgement is applied when determining what is considered to be greater than minimal programme activity. The investments we make could be through a consortium, and include other stakeholders. Impact is typically measured over time. Our approach is to assess the impact of our individual contributions in relation to the overall investment impact in determining whether our contributions were greater than a minimal level of programme activity. |
Other additional information |
2024 | 2023 | |
Category | $ million | $ million |
Whisk(e)y | 6,290 | 5,777 |
- From this attributable to scotch | 4,862 | 4,475 |
Other | 1,542 | 1,523 |
Total maturing inventory | 7,832 | 7,300 |
1.1 | |
2.1 | Indenture, dated as of 3 August 1998, among Diageo Capital plc, Diageo plc and The Bank of New York Mellon (incorporated by reference to Exhibit 4.1 to the Registration Statement on Form F-1 (File No. 333-8874) filed with the Securities and Exchange Commission on 24 July 1998 (pages 365 to 504 of paper filing)).(i) |
2.2 | Indenture, dated as of 1 June 1999, among Diageo Investment Corporation, Diageo plc and The Bank of New York Mellon (incorporated by reference to Exhibit 2.2 to the Annual Report on Form 20-F (File No. 001-10691) filed with the Securities and Exchange Commission on 15 November 2001 (pages 241 to 317 of paper filing)).(i) |
2.3 | |
2.4 | |
4.1 | |
4.2 | |
4.3 | |
4.4 | |
4.5 | |
4.6 | |
4.7 | |
4.8 | |
4.9 | |
4.10 | |
4.11 | |
4.12 | |
4.13 | |
4.14 |
4.15 | |
6.1 | |
8.1 | |
11.1 | |
12.1 | |
12.2 | |
13.1 | |
13.2 | |
15.1 | |
15.2 | |
97.1 | |
101.INS | Inline XBRL Instance Document |
101.SCH | Inline XBRL Taxonomy Extension Schema |
101.CAL | Inline XBRL Taxonomy Extension Schema Calculation Linkbase |
101.DEF | Inline XBRL Taxonomy Extension Schema Definition Linkbase |
101.LAB | Inline XBRL Taxonomy Extension Schema Label Linkbase |
101.PRE | Inline XBRL Taxonomy Extension Schema Presentation Linkbase |
DIAGEO plc |
(REGISTRANT) |
/s/ Lavanya Chandrashekar |
Name: Lavanya Chandrashekar |
Title: Chief Financial Officer |
1 August 2024 |
Term used in UK annual report | US equivalent or definition |
Associates | Entities accounted for under the equity method |
American Depositary Receipt (ADR) | Receipt evidencing ownership of an ADS |
American Depositary Share (ADS) | Registered negotiable security, listed on the New York Stock Exchange, representing four Diageo plc ordinary shares of 28101/108 pence each |
Called up share capital | Common stock |
Capital redemption reserve | Other additional capital |
Company | Diageo plc |
CPI | Consumer price index |
Creditors | Accounts payable and accrued liabilities |
Debtors | Accounts receivable |
Employee share schemes | Employee stock benefit plans |
Employment or staff costs | Payroll costs |
Equivalent units | An equivalent unit represents one nine-litre case of spirits, which is approximately 272 servings. A serving comprises 33ml of spirits, 165ml of wine, or 330ml of ready to drink or beer. To convert volume of products other than spirits to equivalent units: beer in hectolitres divide by 0.9, wine in nine-litre cases divide by five, ready to drink in nine-litre cases divide by 10, and certain pre-mixed products classified as ready to drink in nine-litre cases divide by five. |
Euro, €, ¢ | Euro currency |
Exceptional items | Items that, in management’s judgement, need to be disclosed separately by virtue of their size or nature |
Excise duty | Tax charged by a sovereign territory on the production, manufacture, sale or distribution of selected goods (including imported goods) within that territory. It is generally based on the quantity or alcohol content of goods, rather than their value, and is typically applied to alcohol products and fuels. |
Finance lease | Capital lease |
Financial year | Fiscal year |
Free cash flow | Net cash flow from operating activities aggregated with net purchase and disposal of property, plant and equipment and computer software and with movements in loans |
Freehold | Ownership with absolute rights in perpetuity |
GAAP | Generally accepted accounting principles |
Group and Diageo | Diageo plc and its consolidated subsidiaries |
IFRS | International Financial Reporting Standards (IFRS) Accounting Standards adopted by the UK (UK-adopted International Accounting Standards) and IFRSs, as issued by the International Accounting Standards Board (IASB), including interpretations issued by the IFRS Interpretations Committee |
Impact Databank, IWSR, IRI, Beverage Information Group and Plato Logic | Information source companies that research the beverage alcohol industry and are independent from industry participants |
Net sales | Sales after deducting excise duties |
Noon buying rate | Buying rate at noon in New York City for cable transfers in sterling as certified for customs purposes by the Federal Reserve Bank of New York |
Operating profit | Net operating income |
Organic movement | At level foreign exchange rates and after adjusting for exceptional items, acquisitions and disposals for continuing operations |
Own shares | Treasury stock |
Pound sterling, sterling, £, pence, p | UK currency |
Price/mix | Price/mix is the number of percentage points by which the organic movement in net sales exceeds the organic movement in volume. The difference arises because of changes in the composition of sales between higher and lower priced variants/markets or as price changes are implemented. |
Profit | Earnings |
Term used in UK annual report | US equivalent or definition |
Profit for the year | Net income |
Provisions | Accruals for losses/contingencies |
Reserves | Accumulated earnings, other comprehensive income and additional paid in capital |
RPI | Retail price index |
Ready to drink | Ready to drink products. Ready to drink also include ready to serve products, such as pre- mix cans in some markets, and progressive adult beverages in the United States and certain markets supplied by the United States. |
SEC | US Securities and Exchange Commission |
Share premium | Additional paid in capital or paid in surplus |
Shareholders’ funds | Shareholders’ equity |
Shareholders | Stockholders |
Shares | Common stock |
Shares and ordinary shares | Diageo plc’s ordinary shares |
Shares in issue | Shares issued and outstanding |
Trade and other payables | Accounts payable and accrued liabilities |
Trade and other receivables | Accounts receivable |
US dollar, US$, $, ¢ | US currency |
Title of each class | Trading symbol(s) | Name of each exchange on which registered |
American Depositary Shares | DEO | New York Stock Exchange |
Ordinary shares of 28101/108 pence each | New York Stock Exchange(i) |