Operating and Financial Review
1 Our business
3
REGISTRATION STATEMENT PURSUANT TO SECTION 12(b) OR 12(g) OF THE SECURITIES EXCHANGE ACT OF 1934 |
ANNUAL REPORT PURSUANT TO SECTION 13 OR 15 (d) OF THE SECURITIES EXCHANGE ACT OF 1934 |
TRANSITION REPORT PURSUANT TO SECTION 13 OR 15 (d) OF THE SECURITIES EXCHANGE ACT OF 1934 |
SHELL COMPANY REPORT PURSUANT TO SECTION 13 OR 15(d) OF THE SECURITIES EXCHANGE ACT OF 1934 |
Commission file number: |
(ABN 49 004 028 077) |
(Exact name of registrant as specified in its charter) |
VICTORIA, STRALIA |
(Jurisdiction of incorporation or organisation) |
VICTORIA STRALIA (Address of principal executive offices) |
BHP GROUP LIMITED RALIA TELEPHONE AUSTRALIA 1300 55 47 57TELEPHONE INTERNATIONAL + FACSIMILE + (Name, telephone, email and/or facsimile number and address of company contact person) |
Title of each class |
Trading symbol(s) |
Name of each exchange on which registered | ||
| * | Evidenced by American Depositary Receipts. Each American Depositary Receipt represents two ordinary shares of BHP Group Limited. |
| ** | Not for trading, but only in connection with the listing of the American Depositary Shares. |
BHP Group Limited | ||
Fully Paid Ordinary Shares |
| ☒ | Accelerated filer | ☐ | ||||
| Non-accelerated filer | ☐ | Emerging growth company | ||||
U.S. GAAP ☐ |
Other ☐ |
1 |
References in this Annual Report to a ‘joint venture’ are used for convenience to collectively describe assets that are not wholly owned by BHP. Such references are not intended to characterise the legal relationship between the owners of the asset. |
| Item Number |
Description |
Report section reference | ||||
| 1. |
Identity of Directors, Senior Management and Advisors |
Not applicable | ||||
| 2. |
Offer Statistics and Expected Timetable |
Not applicable | ||||
| 3. |
Key Information |
|||||
| A | [Reserved] | — | ||||
| B | Capitalization and indebtedness | Not applicable | ||||
| C | Reasons for the offer and use of proceeds | Not applicable | ||||
| D | Risk factors | 9.1 | ||||
| 4. |
Information on the Company |
|||||
| A | History and development of the company | Cover page, Company details, Chair’s review, Chief Executive Officer’s review, Operating and Financial Review 1 to 10, Additional information 2, 4 to 9.4 | ||||
| B | Business overview | Operating and Financial Review 1 to 5, 10, Additional information 2, 4 to 8, 9.3, 9.8 and Note 1 to the Financial Statements | ||||
| C | Organizational structure | Additional information 9.3 and Note 28 to the Financial Statements | ||||
| D | Property, plants and equipment | Operating and Financial Review 3, 5.1, 5.2, 7 to 10, Additional information 2, 4 to 6 and Notes 11, 15 and 21 to the Financial Statements | ||||
| 4A. |
Unresolved Staff Comments |
None | ||||
| 5. |
Operating and Financial Review and Prospects |
|||||
| A | Operating results | Operating and Financial Review 4, 10, Additional information 9.8 | ||||
| B | Liquidity and capital resources | Operating and Financial Review 4, Financial Statements 1.4, Notes 11, 20 to 23 and 37 to the Financial Statements | ||||
| C | Research and development, patents and licenses, etc. | Operating and Financial Review 3, 5 to 10, Directors’ Report 10, Additional information 2, 5, 6 and Notes 11 and 15 to the Financial Statements | ||||
| D | Trend information | Chair’s review, Chief Executive Officer’s review, Operating and Financial Review 1 to 5, 7, 9, 10, Additional information 2, 4 to 7 | ||||
| E | Critical Accounting Estimates | IFRS is applied in the Financial Statements as issued by the IASB | ||||
| 6. |
Directors, Senior Management and Employees |
|||||
| A | Directors and senior management | Governance 4.1, 6.1, Directors’ Report 2.1 | ||||
| B | Compensation | Remuneration Report | ||||
| C | Board practices | Governance 4.1, 4.6, 5.2, 5.4, Remuneration Report | ||||
| D | Employees | Operating and Financial Review 6, Additional information 7 | ||||
| E | Share ownership | Remuneration Report, Directors’ Report 3, 4 and Notes 16, 17 and 25 to the Financial Statements | ||||
| 7. |
Major Shareholders and Related Party Transactions |
|||||
| A | Major shareholders | Additional information 9.5 | ||||
| B | Related party transactions | Remuneration Report and Notes 24 and 31 to the Financial Statements | ||||
| C | Interests of experts and counsel | Not applicable | ||||
| 8. |
Financial Information |
|||||
| A | Consolidated Statements and Other Financial Information | Operating and Financial Review 8, Additional information 8, 9.6, Financial Statements beginning on page F-1 in this Annual Report and Financial Statements 1A | ||||
| B | Significant Changes | Note 33 to the Financial Statements | ||||
| 9. |
The Offer and Listing |
|||||
| A | Offer and listing details | Additional information 9.2 | ||||
| B | Plan of distribution | Not applicable | ||||
| C | Markets | Additional information 9.2 | ||||
| D | Selling shareholders | Not applicable | ||||
| E | Dilution | Not applicable | ||||
| F | Expenses of the issue | Not applicable | ||||
| 10. |
Additional Information |
|||||
| A | Share capital | Not applicable | ||||
| B | Memorandum and articles of association | Additional information 9.3, 9.4 | ||||
| C | Material contracts | Not applicable | ||||
| D | Exchange controls | Additional information 9.8 | ||||
| E | Taxation | Additional information 9.9 | ||||
| F | Dividends and paying agents | Not applicable | ||||
| G | Statement by experts | Not applicable | ||||
| H | Documents on display | Additional information 9.4 | ||||
| I | Subsidiary information | Note 28 to the Financial Statements and Exhibit 8.1 | ||||
| 11. |
Quantitative and Qualitative Disclosures About Market Risk |
Note 23 to the Financial Statements | ||||
| 12. |
Description of Securities Other than Equity Securities |
|||||
| A | Debt Securities | Not applicable | ||||
| B | Warrants and Rights | Not applicable | ||||
| C | Other Securities | Not applicable | ||||
| D | American Depositary Shares | Additional information 9.7 and Exhibit 2.1 | ||||
| 13. |
Defaults, Dividend Arrearages and Delinquencies |
There have been no defaults, dividend arrearages or delinquencies | ||||
| 14. |
Material Modifications to the Rights of Security Holders and Use of Proceeds |
|||||
| A | Additional information 9.3, 9.4 and Exhibits 1.1 and 2.1 | |||||
| B | Not applicable | |||||
| C | Not applicable | |||||
| D | Not applicable | |||||
| E | Not applicable | |||||
| 15. |
Controls and Procedures |
Governance 7.2 and Financial Statements 1A | ||||
| 16A. |
Audit committee financial expert |
Governance 5.2 | ||||
| 16B. |
Code of Ethics |
Governance 8.1 | ||||
| 16C. |
Principal Accountant Fees and Services |
Governance 7.2 and Note 34 to the Financial Statements | ||||
| 16D. |
Exemptions from the Listing Standards for Audit Committees |
Not applicable | ||||
| 16E. |
Purchases of Equity Securities by the Issuer and Affiliated Purchasers |
Directors’ Report 3 | ||||
| 16F. |
Change in Registrant’s Certifying Accountant |
Not applicable | ||||
| 16G. |
Corporate Governance |
Governance | ||||
| 16H. |
Mine Safety Disclosure |
Not applicable | ||||
| 16I. |
Disclosure Regarding Foreign Jurisdictions that Prevent Inspections |
Not applicable | ||||
| 17. |
Financial Statements |
Not applicable | ||||
| 18. |
Financial Statements |
Financial Statements begin on page F-1 in this Annual Report | ||||
| 19. |
Exhibits |
Exhibits | ||||
| • | Our people start each day with a sense of purpose and end the day with a sense of accomplishment. |
| • | Our teams are inclusive and diverse. |
| • | Our communities, customers and suppliers value their relationships with us and are better off for our presence. |
| • | Our asset portfolio is world class and sustainably developed. |
| • | Our operational discipline and financial strength enables our future growth. |
| • | Our shareholders receive a superior return on their investment. |
| • | Our commodities support continued economic growth and decarbonisation. |
| 1 | ||||||
| 2 | ||||||
| 1 | Our business | 3 | ||||
| 2 | Delivering value | 5 | ||||
| 2.1 | Our business model | 5 | ||||
| 2.2 | How we create and grow value | 7 | ||||
| 3 | Positioning for the future | 13 | ||||
| 4 | Financial review | 16 | ||||
| 4.1 | Group overview | 16 | ||||
| 4.2 | Key performance indicators | 17 | ||||
| 4.3 | Financial results | 19 | ||||
| 4.4 | Debt and sources of liquidity | 22 | ||||
| 5 | Our assets | 25 | ||||
| 5.1 | Minerals Australia | 25 | ||||
| 5.2 | Minerals Americas | 30 | ||||
| 5.3 | Commercial | 34 | ||||
| 6 | People and culture | 35 | ||||
| 7 | Sustainability | 40 | ||||
| 7.1 | Our sustainability approach | 40 | ||||
| 7.2 | Our material sustainability issues | 42 | ||||
| 7.3 | Our sustainability performance: Non-financial key performance indicators | 43 | ||||
| 7.4 | Safety | 45 | ||||
| 7.5 | Sexual harassment | 47 | ||||
| 7.6 | Health | 50 | ||||
| 7.7 | Ethics and business conduct | 54 | ||||
| 7.8 | Climate change | 56 | ||||
| 7.9 | Value chain sustainability | 68 | ||||
| 7.10 | Community | 70 | ||||
| 7.11 | Human rights | 72 | ||||
| 5 | Board Committees | 133 | ||||
| 5.1 | Nomination and Governance Committee | 133 | ||||
| 5.2 | Risk and Audit Committee | 134 | ||||
| 5.3 | Sustainability Committee | 135 | ||||
| 5.4 | Remuneration Committee | 136 | ||||
| 6 | Management | 137 | ||||
| 6.1 | Executive Leadership Team | 137 | ||||
| 6.2 | Senior management succession | 138 | ||||
| 6.3 | Performance evaluation of executives | 138 | ||||
| 7 | Risk management and assurance | 138 | ||||
| 7.1 | Risk management governance structure | 138 | ||||
| 7.2 | External audit and financial reporting | 139 | ||||
| 8 | Culture and conduct | 141 | ||||
| 8.1 | Our Code of Conduct and Our Charter | 141 | ||||
| 8.2 | Culture | 141 | ||||
| 8.3 | BHP’s EthicsPoint | 141 | ||||
| 8.4 | Diversity | 141 | ||||
| 9 | Shareholder and stakeholder engagement | 142 | ||||
| 10 | Market disclosure | 143 | ||||
| 11 | US requirements | 143 | ||||
| 1 | Review of operations, principal activities and state of affairs | 144 | ||||
| 2 | Directors | 144 | ||||
| 2.1 | Biographical details | 144 | ||||
| 2.2 | Director attendances at meetings | 145 | ||||
| 3 | Share capital and buy-back programs | 146 | ||||
| 4 | Share interests | 146 | ||||
| 5 | Secretaries | 147 | ||||
| 6 | Indemnities and insurance | 147 | ||||
| 7 | Dividends | 148 | ||||
| 8 | Auditors | 148 | ||||
| 9 | Non-audit services | 148 | ||||
| 1 | Financial information summary | 173 | ||||
| 2 | Information on mining operations | 174 | ||||
| 3 | Financial information by commodity | 193 | ||||
| 4 | Production | 196 | ||||
| 5 | Mineral resources and mineral reserves | 198 | ||||
| 6 | Major projects | 224 | ||||
| 7 | People – performance data | 225 | ||||
| 8 | Legal proceedings | 226 | ||||
9 |
231 | |||||
| 9.1 | History and development | 231 | ||||
| 9.2 | Markets | 231 | ||||
| 9.3 | Organisational structure | 231 | ||||
| 9.4 | Constitution | 232 | ||||
| 9.5 | Share ownership | 236 | ||||
| 9.6 | Dividends | 238 | ||||
| 9.7 | American Depositary Receipts fees and charges | 238 | ||||
| 9.8 | Government regulations | 239 | ||||
| 9.9 | Taxation | 242 | ||||
| 10 | Glossary | 247 | ||||
| 263 | ||||||
| • | unified our dual listed company structure under a single parent company listed on the Australian Securities Exchange |
| • | merged our Petroleum business with Woodside to create a top 10 energy provider and provide shareholders with further choice as to their exposure to oil and gas |
| • | simplified the coal portfolio through the sale of our interests in Cerrej ó |
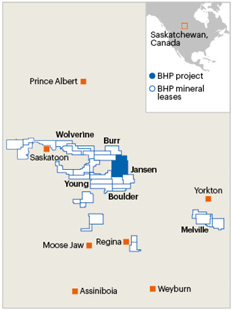
| • | approved an investment of US$5.7 billion in our Jansen Potash Project in Canada, marking BHP’s entry into a new commodity which provides shareholders with exposure to the growing population megatrend |
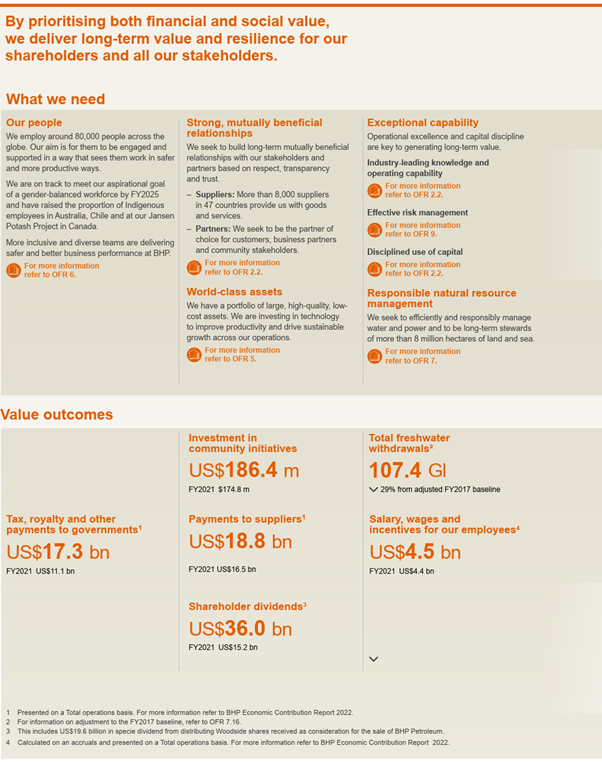
| • | We are committed to continuous improvement and we strive to operate more reliably and productively than our competitors. Being the best operator will help us safely generate better return on capital employed and outcompete others for new opportunities. |
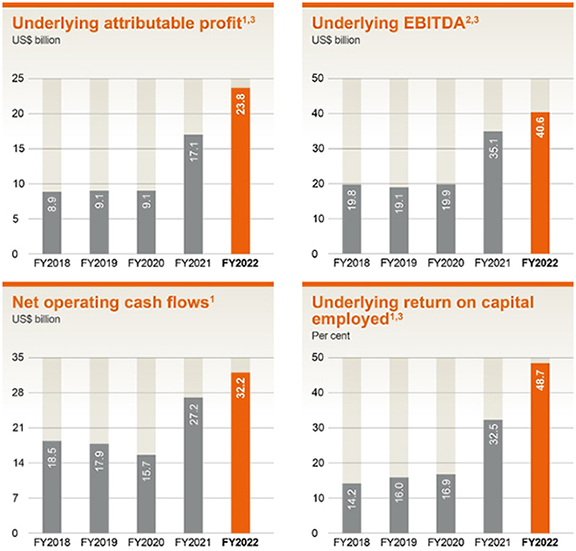
| • | We have delivered strong and consistent results and returns through our portfolio and operating discipline. We achieved net operating cashflow on a Total operations basis of US$32.2 billion in FY2022, above US$15 billion for the sixth consecutive year. |
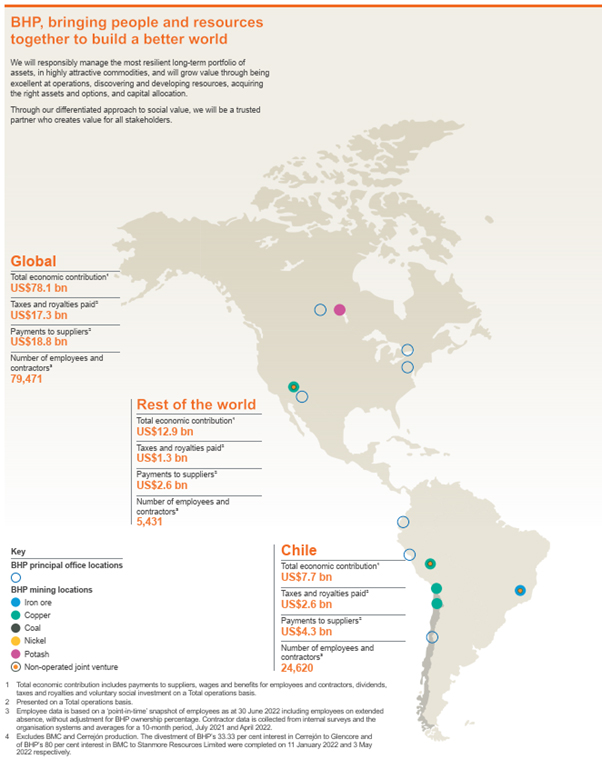
| • | We believe our focus on social value will lead to us being the partner of choice with communities, governments, suppliers, and customers. We seek respectful, mutually beneficial relationships with the communities where we operate and the suppliers, customers and governments we interact with. Our experience has been that engaging with those around us creates optionality, stronger relationships and access to more diverse thinking. It helps us be more creative and to find different ways to problem solve. It also means we are better able to see things coming towards us and can act pre-emptively. Aligning strongly with partners can prevent issues or delays with projects and, if issues do arise, means we are better able to collectively work on solutions. |
| • | We assess and rank decarbonisation projects across our operated assets through our Capital Allocation Framework (CAF). During FY2022, we integrated our 1.5°C Paris-aligned scenario into our strategy and capital allocation process, helping to ensure our capital expenditure plans are not misaligned with the Paris Agreement’s aim to pursue efforts to limit global warming to 1.5°C. |
| • | We recruit and retain the best people and empower them to run our operations safely and productively. We promote an inclusive and diverse environment where safety and wellbeing are the highest priorities, invest in development programs to build capability and improve performance and offer competitive remuneration. We invest in technology to manage risk, streamline processes and improve productivity. |
| • | The combination of our people, strategy and operational systems will help us to outperform our competitors and attract a lower cost of capital, while our CAF helps us make better use of this capital. |
| • | We remain on track to achieve our aspirational goal for a gender-balanced employee workforce globally by FY2025 . |
| • | We made progress during FY2022 against targets for increased Indigenous employment in our Minerals Australia operations, Minerals Americas operations in Chile and our Jansen Potash Project in Canada. |
1 |
Based on published C1 unit costs of major iron ore producers. There may be differences in the manner that third parties calculate or report unit costs data compared to BHP, which means that third-party data may not be comparable to our data. |
2 |
For more information refer to OFR 7.8. |
3 |
Based on ownership interest. Peers include: Anglo American, Antofagasta, Codelco, First Quantum Minerals, Freeport, Glencore, Rio Tinto, Southern Copper and Teck. Source peers: Wood Mackenzie Ltd, Q1 2022. |
4 |
Based on ownership interest. Source peers: MinEx Consulting. |
| • | Serve our customers |
| • | Pursue operating perfection |
| • | Empower our people |
| • | maintain safe, predictable and productive operations |
| • | drive productivity improvements, with an emphasis on automation and real-time, data-driven insights and decision-making |
| • | help drive inclusion and diversity by providing greater opportunities for roles that were traditionally labour intensive |
| • | unlock the next stage of value growth at BHP, from realising greater margins at our existing operations to finding new assets |
| • | improve sustainability outcomes through innovation |
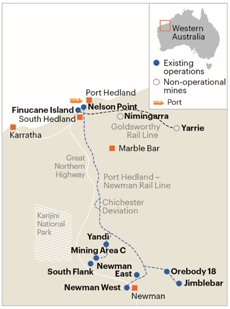
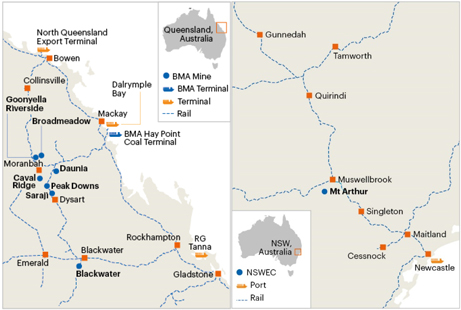
| • | We continued to automate our global trucking fleets. At South Flank we began to automate our fleet of 41 Komatsu haul trucks in the June 2022 quarter, with the program expected to be completed within 18 months. We continued deployment at Goonyella Riverside (expected to be completed by the end of December 2022) and completed the rollout at Daunia. We also commenced autonomous drilling at Spence. We expect to commence the rollout of automated trucks at Spence in FY2023. |
| • | We began testing two automated shiploaders at the Port Hedland export facility in Western Australia. In what we believe is a world first, 3D laser scan technology has been used in the A$50 million project. We intend to fully automate eight shiploaders by FY2024. The project is expected to enable an increase in production of more than 1 million tonnes of iron ore each year through greater precision, reduced spillage, faster load times and equipment optimisation. |
| • | Our in-house Grade Adjustment Model has been introduced at multiple WAIO sites and is expected to enable a US$22.8 million annual revenue uplift at WAIO. The model uses machine learning to target a reduction in iron ore grade variability across the supply chain. It uses data sources that capture movements of ore to map the iron ore grade coming from the mine to the iron grade shipped at port. |
| • | Through our Maintenance and Engineering Centre of Excellence, we continued the rollout of our Total Equipment Strategies (TES), which were initially applied to our mobile fleets and have been extended to our fixed plant. These strategies use mathematical analysis of breakdowns, maintenance patterns and original equipment manufacturer recommendations to recalibrate our maintenance programs to increase availability and reliability, and reduce maintenance costs and inventory values. For example, at our Newman iron ore operation in Western Australia, the mobile TES project for CAT 6060 excavators helped to extend the average equipment life by 40 per cent and delivered an availability uplift of 2 per cent. The outcome is 3.5 years of extra life which has helped to achieve capital productivity by deferral of US$120 million of capital expenditure over five years. |
| • | We have set GHG emissions reduction targets and goals (that are described in OFR 7.8) and our Climate Transition Action Plan 2021 (CTAP) received majority approval from shareholders in the ‘Say on Climate’ advisory vote at our 2021 Annual General Meetings. |
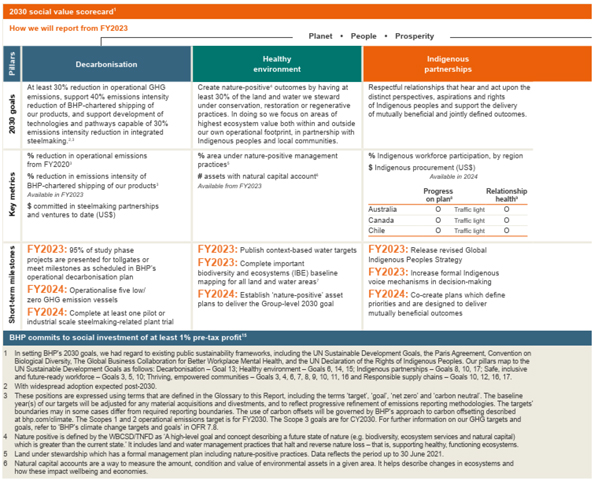
| • | We are working to create nature-positive 4 outcomes through the new goal we have set to have at least 30 per cent of the land and water we steward under conservation, restoration or regenerative practices by 2030. For more information refer to 2030 social value scorecard below and OFR 7.15. |
| • | We are working to transition our operations to renewable electricity. For more information, refer to OFR 5.1 and 7.8. |
| • | We are working with suppliers to drive innovation by participating in initiatives such as Komatsu’s GHG Alliance, which aims to develop commercially viable zero-GHG emissions haul trucks. For more information refer to OFR 7.8. |
| • | Our spend with Indigenous businesses increased by 75 per cent to US$149.9 million in FY2022 and the number of Indigenous vendors engaged rose by 53 per cent to 148. WAIO announced its intention to more than double its spend with Indigenous vendors to more than US$300 million by the end of FY2024. For more information refer to OFR 7.13. |
| • | We completed our most recent five-year sustainability targets in FY2022. Highlights included three years fatality-free, a reduction in the total number of workers exposed to our most material occupational exposures by 68 per cent, social investment of US$681.4 million over five years and a 29 per cent reduction in freshwater withdrawal volumes from our adjusted FY2017 baseline. For more information refer to OFR 7.3 and 7.8. |
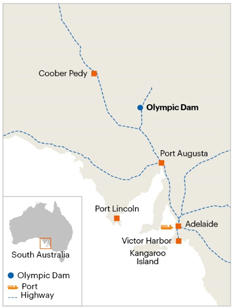
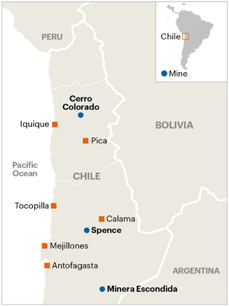
| • | Our Chilean operations Escondida and Spence, and Olympic Dam in Australia were awarded the Copper Mark during FY2022 recognising responsible production practices. For more information on our social value performance refer to OFR 7. |
| • | This includes 27 billion tonnes of ore at an average grade of 0.52 per cent at Escondida, where we are targeting an annual average of 1.2 million tonnes (Mt) of copper production over the medium term, a 20 per cent increase on Escondida’s FY2022 production of 1 Mt. |
| • | On the basis that tailings storage facility anomalies are resolved, production at Spence is expected to reach and average approximately 270 kilotonnes per annum (ktpa) of production for four years (including cathodes) following the completion of Spence Growth Option (SGO) plant modifications. This will be supported by capital expenditure of approximately US$100 million, which is planned for the SGO plant modifications and these are currently planned to be completed in CY2023, with further studies ongoing for additional capacity uplift. |
| • | At Olympic Dam, we have improved operating stability over time. Smelter operations have been strong following our planned major smelter maintenance, completed in January 2022. The next major rebuild is not expected for six years. |
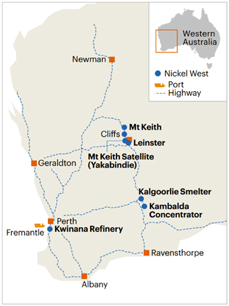
| • | Our nickel sulphate plant at Nickel West delivered first crystals in October 2021, allowing us to add further value to our nickel production. We intend to capitalise on the expected ongoing global demand for nickel for the electric vehicle industry, as the method we use to produce nickel sulphate results in a product we believe is ideal for battery production. |
| • | We continue to explore ways to increase the scale of Nickel West. |
| • | We have secured an increase to our WAIO iron ore environmental licence to expand port operations up to 330 million tonnes per annum (Mtpa) subject to the outcomes of a standard appeals process. |
| • | The ramp up of WAIO’s US$3.6 billion South Flank mine is ahead of schedule and we have revised our medium term production guidance to more than 300 Mtpa. We are assessing expansion alternatives to take us toward 330 Mtpa of production. |
1 |
Based on ownership interest. Peers include: Anglo American, Antofagasta, Codelco, First Quantum Minerals, Freeport, Glencore, Rio Tinto, Southern Copper, and Teck. Source peers: Wood Mackenzie Ltd, Q1 2022. |
2 |
Based on ownership interest. Source peers: MinEx Consulting. |
| Year ended 30 June |
2022 US$M |
2021 US$M |
2020 US$M |
|||||||||
| Greenfield exploration |
77 |
54 | 44 | |||||||||
| Resources assessment |
179 |
138 | 132 | |||||||||
| |
|
|
|
|
|
|||||||
| Total metals exploration and assessment |
256 |
192 | 176 | |||||||||
| |
|
|
|
|
|
|||||||
| Year ended 30 June |
2022 US$M |
2021 US$M |
2020 US$M |
|||||||||
| Exploration expense |
||||||||||||
| Copper |
85 |
53 | 54 | |||||||||
| Iron Ore |
54 |
55 | 47 | |||||||||
| Coal |
6 |
7 | 9 | |||||||||
| Group and unallocated items 1 |
54 |
19 | 13 | |||||||||
| |
|
|
|
|
|
|||||||
| Total Group |
199 |
134 | 123 | |||||||||
| |
|
|
|
|
|
|||||||
1 |
Group and unallocated items includes functions, other unallocated operations, including Potash, Nickel West and legacy assets (previously disclosed as closed mines in the Petroleum reportable segment), and consolidation adjustments. |
| Year ended 30 June US$M |
2022 |
2021 | ||||||
| Consolidated Income Statement (Financial Statements 1.1) |
||||||||
| Revenue 1 |
65,098 |
56,921 | ||||||
| Profit/(loss) after taxation from Continuing operations 1 |
22,400 |
13,676 | ||||||
| Profit/(loss) after taxation from Continuing and Discontinued operations attributable to BHP shareholders |
30,900 |
11,304 | ||||||
| Dividends per ordinary share – paid during the period (US cents) |
350.0 |
156.0 | ||||||
| Dividends per ordinary share – determined in respect of the period (US cents) |
325.0 |
301.0 | ||||||
| In specie dividend on merger of Petroleum with Woodside (US cents) |
386.4 |
– | ||||||
| Basic earnings/(loss) per ordinary share (US cents) |
610.6 |
223.5 | ||||||
| Consolidated Balance Sheet (Financial Statements 1.3) |
||||||||
| Total assets |
95,166 |
108,927 | ||||||
| Net assets |
48,766 |
55,605 | ||||||
| Consolidated Cash Flow Statement (Financial Statements 1.4) |
||||||||
| Net operating cash flows |
32,174 |
27,234 | ||||||
| Capital and exploration expenditure 2 |
7,545 |
7,120 | ||||||
| Other financial information (OFR 11) |
||||||||
| Net debt |
333 |
4,121 | ||||||
| Underlying attributable profit |
23,815 |
17,077 | ||||||
| Underlying attributable profit – Continuing operations 1 |
21,319 |
16,985 | ||||||
| Underlying EBITDA 1 |
40,634 |
35,073 | ||||||
| Underlying basic earnings per share (US cents) |
470.6 |
337.7 | ||||||
| Underlying basic earnings per share – Continuing operations (US cents) 1 |
421.2 |
335.9 | ||||||
| Underlying return on capital employed (per cent) |
48.7 |
32.5 | ||||||
1 |
Comparative periods have been adjusted for the effects of applying IFRS 5 ‘Non-current Assets Held for Sale and Discontinued Operations’ and discloses them on the same basis as the current period figures. For more information refer to Financial Statements note 27 ‘Discontinued operations’. |
2 |
Includes US$1,434 million related to Discontinued operations (FY2021: US$1,316 million). |
1 |
Includes data for Continuing and Discontinued operations for the financial years being reported. |
2 |
Excludes data from Discontinued operations for the financial years being reported. |
3 |
For more information on non-IFRS financial information refer to OFR 11. |
| Profit |
Earnings |
Cash |
Returns |
|||||||||||||||||||||||||||||
US$M |
US$M |
US$M |
US$M |
|||||||||||||||||||||||||||||
| Measure: |
Profit after taxation from Continuing and Discontinued operations |
|
33,055 |
Profit after taxation from Continuing and Discontinued operations |
33,055 |
Net operating cash flows from Continuing operations |
29,285 |
Profit after taxation from Continuing and Discontinued operations |
|
33,055 |
||||||||||||||||||||||
| Made up of: |
Profit after taxation | |
Profit after taxation | |
Cash generated by the Group’s consolidated operations, after dividends received, interest, proceeds and settlements of cash management-related instruments, taxation and royalty-related taxation. It excludes cash flows relating to investing and financing activities | |
Profit after taxation | | ||||||||||||||||||||||||
| Adjusted for: |
Exceptional items before taxation |
|
620 |
|
Exceptional items before taxation |
|
620 |
|
Net operating cash flows from Discontinued operations |
|
2,889 |
|
Exceptional items after taxation |
|
|
(7,085 |
) | |||||||||||||||
| Net finance costs excluding exceptional items from Discontinued operations | |
159 |
||||||||||||||||||||||||||||||
| Tax effect of exceptional items | 454 |
Tax effect of exceptional items | 454 |
Net finance costs excluding exceptional items from Continuing operations | |
679 |
||||||||||||||||||||||||||
| Exceptional items after tax attributable to non-controlling interests |
– |
Depreciation and amortisation excluding exceptional items | 5,683 |
Income tax expense on net finance costs | (287 |
) | ||||||||||||||||||||||||||
| |
|
|||||||||||||||||||||||||||||||
| Exceptional items attributable to BHP shareholders – Continuing operations | 1,074 |
Impairments of property, plant and equipment, financial assets and intangibles excluding exceptional items |
515 |
Profit after taxation excluding net finance costs and exceptional items | |
26,521 |
| |||||||||||||||||||||||||
| |
|
|||||||||||||||||||||||||||||||
| Exceptional items attributable to BHP shareholders – Discontinued operations | (8,159 |
) |
Net finance costs excluding exceptional items from Continuing operations | 679 |
Net assets at the beginning of period | 55,605 |
||||||||||||||||||||||||||
| Profit after taxation from Continuing and Discontinued operations attributable to non-controlling interests |
(2,155 |
) |
Taxation expense excluding exceptional items | 10,283 |
Net debt at the beginning of period | 4,121 |
||||||||||||||||||||||||||
| |
|
|||||||||||||||||||||||||||||||
| Profit after taxation from Discontinued operations (including exceptional items) | (10,655 |
) |
Capital employed at the beginning of period | 59,726 |
||||||||||||||||||||||||||||
| Net assets at the end of period | 48,766 |
|||||||||||||||||||||||||||||||
| Net debt at the end of period | 333 |
|||||||||||||||||||||||||||||||
| |
|
|||||||||||||||||||||||||||||||
| Capital employed at the end of period | 49,099 |
|||||||||||||||||||||||||||||||
| Average capital employed | 54,413 |
|||||||||||||||||||||||||||||||
| To reach our KPIs |
Underlying attributable profit |
|
23,815 |
|
Underlying EBITDA |
|
40,634 |
|
Net operating cash flows |
|
32,174 |
|
Underlying return on capital employed |
|
48.7% |
| ||||||||||||||||
| Why do we use it? |
Underlying attributable profit allows the comparability of underlying financial performance by excluding the impacts of exceptional items. |
|
Underlying EBITDA is used to help assess current operational profitability excluding the impacts of sunk costs (ie. depreciation from initial investment). It is a measure that management uses internally to assess the performance of the Group’s segments and make decisions on the allocation of resources. |
|
Net operating cash flows provide insights into how we are managing costs and increasing productivity across BHP. |
|
Underlying return on capital employed is an indicator of the Group’s capital efficiency. It is provided on an underlying basis to allow comparability of underlying financial performance by excluding the impacts of exceptional items. |
| ||||||||||||||||||||||||
| Year ended 30 June |
2022 US$M |
2021 US$M Restated |
2020 US$M Restated |
|||||||||
| Continuing operations |
||||||||||||
| Revenue 1 |
65,098 |
56,921 | 38,924 | |||||||||
| Other income |
1,398 |
380 | 720 | |||||||||
| Expenses excluding net finance costs |
(32,371 |
) |
(30,871 | ) | (25,453 | ) | ||||||
| Loss from equity accounted investments, related impairments and expenses |
(19 |
) |
(915 | ) | (508 | ) | ||||||
| |
|
|
|
|
|
|||||||
| Profit from operations |
34,106 |
25,515 | 13,683 | |||||||||
| |
|
|
|
|
|
|||||||
| Net finance costs |
(969 |
) |
(1,223 | ) | (858 | ) | ||||||
| Total taxation expense |
(10,737 |
) |
(10,616 | ) | (4,197 | ) | ||||||
| |
|
|
|
|
|
|||||||
| Profit after taxation from Continuing operations |
22,400 |
13,676 | 8,628 | |||||||||
| |
|
|
|
|
|
|||||||
| Discontinued operations |
||||||||||||
| Profit/(loss) after taxation from Discontinued operations |
10,655 |
(225 | ) | 108 | ||||||||
| |
|
|
|
|
|
|||||||
| Profit after taxation from Continuing and Discontinued operations |
33,055 |
13,451 | 8,736 | |||||||||
| |
|
|
|
|
|
|||||||
| Attributable to non-controlling interests |
2,155 |
2,147 | 780 | |||||||||
| Attributable to BHP shareholders |
30,900 |
11,304 | 7,956 | |||||||||
| |
|
|
|
|
|
|||||||
1 |
Includes the sale of third-party products. |
US$M |
||||||
Underlying EBITDA for year ended 30 June 2021 (Restated) |
35,073 |
|||||
| Net price impact: |
||||||
| Change in sales prices |
6,594 |
Higher average realised prices for metallurgical coal, thermal coal, copper and nickel, partially offset by lower average realised prices for iron ore. | ||||
| Price-linked costs |
(1,047 |
) |
Increased royalties reflecting higher realised prices for metallurgical coal and thermal coal and higher third-party concentrate purchase costs reflecting higher nickel prices, partially offset by lower royalties for iron ore. | |||
5,547 |
||||||
| Change in volumes |
(1,212 |
) |
Lower volumes across our operations associated with the impacts of COVID-19 (US$952 million), lower volumes at Olympic Dam as a result of the planned major smelter maintenance campaign, lower copper concentrator feed grade at Escondida, lower BMA volumes due to significant wet weather impacts, and lower volumes at Nickel West due to an unplanned smelter outage in the June 2022 quarter. This was partially offset by higher concentrate sales at Spence reflecting the continued ramp up of the Spence Growth Option and favourable weather compared to the prior year at WAIO. | |||
| Change in controllable cash costs | (540 |
) |
Higher costs across our operations due to the impacts of COVID-19 (US$277 million) reported as an exceptional item last year, higher costs at WAIO due to South Flank operational ramp-up expenditure and higher rail maintenance costs. Higher costs at Escondida due to an increase in material mined and workforce bonus payments for a new collective bargaining agreement. Higher costs at Spence due to a ramp-up of concentrate volumes, and a prior year one-off gain due to the cancellation of power contracts at Escondida and Spence. This was partially offset by favourable inventory movements at Olympic Dam, Nickel West, Escondida and Spence, and lower costs at BMA due to cost efficiency initiatives. | |||
| Change in other costs: | ||||||
| Exchange rates |
1,180 |
Impact of movements in the Australian dollar and Chilean peso against the US dollar. | ||||
| Inflation |
(867 |
) |
Impact of inflation on the Group’s cost base. | |||
| Fuel, energy, and consumable price movements |
(660 |
) |
Predominantly higher diesel and acid prices. | |||
| Non-cash |
(3 |
) |
||||
(350 |
) |
|||||
| Asset sales | 2 |
|||||
| Ceased and sold operations | 1,668 |
Reflects the contribution of BMC prior to divestment and a decrease in costs related to the closure and rehabilitation provision for closed mines of US$297 million compared with the prior year. | ||||
| Other items | 446 |
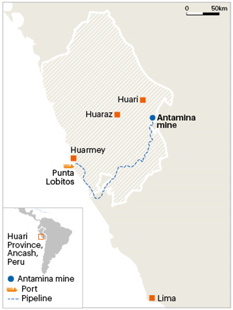
Other includes higher recovery of freight costs caused by movements in the freight index on consecutive voyage charter (CVC) voyages and higher average realised sales prices received by Antamina, partially offset by the write-off of iron ore dormant stockpiles. | ||||
Underlying EBITDA for year ended 30 June 2022 |
40,634 |
|||||
1 |
For information on the method of calculation of the principal factors that affect Underlying EBITDA, refer to OFR 11.2. |
| Year ended 30 June |
2022 US$M |
2021 US$M Restated |
2020 US$M Restated |
|||||||||
| Net operating cash flows from Continuing operations |
29,285 |
25,883 | 14,685 | |||||||||
| Net operating cash flows from Discontinued operations |
2,889 |
1,351 | 1,021 | |||||||||
| |
|
|
|
|
|
|||||||
| Net operating cash flows |
32,174 |
27,234 | 15,706 | |||||||||
| |
|
|
|
|
|
|||||||
| Net investing cash flows from Continuing operations |
(4,973 |
) |
(6,325 | ) | (6,583 | ) | ||||||
| Net investing cash flows from Discontinued operations |
(904 |
) |
(1,520 | ) | (1,033 | ) | ||||||
| Net cash completion payment on merger of Petroleum with Woodside |
(683 |
) |
– | – | ||||||||
| Cash and cash equivalents disposed on merger of Petroleum with Woodside |
(399 |
) |
– | – | ||||||||
| |
|
|
|
|
|
|||||||
| Net investing cash flows |
(6,959 |
) |
(7,845 | ) | (7,616 | ) | ||||||
| |
|
|
|
|
|
|||||||
| Net financing cash flows from Continuing operations |
(22,734 |
) |
(17,884 | ) | (9,713 | ) | ||||||
| Net financing cash flows from Discontinued operations |
(33 |
) |
(38 | ) | (39 | ) | ||||||
| |
|
|
|
|
|
|||||||
| Net financing cash flows |
(22,767 |
) |
(17,922 | ) | (9,752 | ) | ||||||
| |
|
|
|
|
|
|||||||
| Net increase/(decrease) in cash and cash equivalents |
2,448 |
1,467 | (1,662 | ) | ||||||||
| |
|
|
|
|
|
|||||||
| Net increase/(decrease) in cash and cash equivalents from Continuing operations |
1,578 |
1,674 | (1,611 | ) | ||||||||
| Net increase/(decrease) in cash and cash equivalents from Discontinued operations |
1,952 |
(207 | ) | (51 | ) | |||||||
| Net cash completion payment on merger of Petroleum with Woodside |
(683 |
) |
– | – | ||||||||
| Cash and cash equivalents disposed on merger of Petroleum with Woodside |
(399 |
) |
– | – | ||||||||
| |
|
|
|
|
|
|||||||
| • | a strong balance sheet through the cycle |
| • | diversification of funding sources |
| • | maintain borrowings and excess cash predominantly in US dollars |
1 |
We use non-IFRS financial information to reflect our underlying financial performance. For a discussion on the non-IFRS financial information we use refer to OFR 11. For the definition and method of calculation of non-IFRS financial information, refer to OFR 11.1. For the composition of net debt refer to Financial Statements note 20 ‘Net debt’. |
Facility available 2022 US$M |
Drawn 2022 US$M |
Undrawn 2022 US$M |
Facility available 2021 US$M |
Drawn 2021 US$M |
Undrawn 2021 US$M |
|||||||||||||||||||
| Revolving credit facility 1 |
5,500 |
– |
5,500 |
5,500 | – | 5,500 | ||||||||||||||||||
| |
|
|
|
|
|
|
|
|
|
|
|
|||||||||||||
| Total financing facility |
5,500 |
– |
5,500 |
5,500 | – | 5,500 | ||||||||||||||||||
| |
|
|
|
|
|
|
|
|
|
|
|
|||||||||||||
1 |
During the year we completed a one-year extension of the facility which is now due to mature on 10 October 2026. The committed US$5.5 billion revolving credit facility operates as a back-stop to the Group’s uncommitted commercial paper program. The combined amount drawn under the facility or as commercial paper will not exceed US$5.5 billion. As at 30 June 2022, US$ nil commercial paper was drawn (FY2021: US$ nil), therefore US$5.5 billion of committed facility was available to use (FY2021: US$5.5 billion). A commitment fee is payable on the undrawn balance and interest is payable on any drawn balance comprising a reference rate plus a margin. The agreed margins are typical for a credit facility extended to a company with the Group’s credit rating. |
| Year ended 30 June |
2022 US$M |
2021 US$M |
||||||||||||||
| Net debt at the beginning of the financial year |
(4,121 |
) |
(12,044 | ) | ||||||||||||
| |
|
|
|
|||||||||||||
| Net operating cash flows |
32,174 |
27,234 | ||||||||||||||
| Net investing cash flows |
(6,959 |
) |
(7,845 | ) | ||||||||||||
| |
|
|
|
|||||||||||||
| Free cash flow – Total operations |
25,215 |
19,389 | ||||||||||||||
| |
|
|
|
|||||||||||||
| Carrying value of interest bearing liability net repayments |
2,227 |
7,433 | ||||||||||||||
| Net settlements of interest bearing liabilities and debt related instruments |
(2,474 |
) |
(7,424 | ) | ||||||||||||
| Dividends paid |
(17,851 |
) |
(7,901 | ) | ||||||||||||
| Dividends paid to non-controlling interests |
(2,540 |
) |
(2,127 | ) | ||||||||||||
| Other financing activities 1 |
(149 |
) |
(234 | ) | ||||||||||||
| |
|
|
|
|||||||||||||
| Other cash movements |
(20,787 |
) |
(10,253 | ) | ||||||||||||
| |
|
|
|
|||||||||||||
| Fair value adjustment on debt (including debt related instruments) 2 |
5 |
58 | ||||||||||||||
| Foreign exchange impacts on cash (including cash management related instruments) |
27 |
(1 | ) | |||||||||||||
| Lease additions |
(736 |
) |
(1,079 | ) | ||||||||||||
| Divestment and demerger of subsidiaries and operations |
492 |
– | ||||||||||||||
| Others |
(428 |
) |
(191 | ) | ||||||||||||
| |
|
|
|
|||||||||||||
| Non-cash movements |
(640 |
) |
(1,213 | ) | ||||||||||||
| |
|
|
|
|||||||||||||
| Net debt at the end of the financial year |
(333 |
) |
(4,121 | ) | ||||||||||||
| |
|
|
|
|||||||||||||
1 |
Other financing activities mainly comprises purchases of shares by Employee Share Option Plan trusts of US$149 million (FY2021: US$234 million). |
2 |
The Group hedges against the volatility in both exchange and interest rates on debt, and also exchange on cash, with associated movements in derivatives reported in Other financial assets/liabilities as effective hedged derivatives (cross currency and interest rate swaps), in accordance with accounting standards. For more information refer to Financial Statements note 23 ‘Financial risk management’. |
| • | embedding flexibility into the way we work |
| • | encouraging and working with our supply chain partners to support our commitment to inclusion and diversity |
| • | uncovering and taking steps to mitigate potential bias in our systems, policies and processes, and in behaviours through the Respectful Behaviour campaign |
| • | ensuring our workplaces are safe for and attractive to a diverse range of people |
| • | continued market mapping to proactively target people or groups of people not actively looking to work for BHP or our industry |
| • | implemented a ‘Tell Us About You’ survey, our first self-identification survey to measure the rich diversity of our workforce |
| • | integrated inclusive leadership capabilities at all levels of our leadership learning curriculum |
| • | embedded the Ways of Working Framework to guide employees and leaders to ‘Work where you get great outcomes’ |
| • | launched Phase 3 of the Respectful Behaviour campaign to reinforce our zero tolerance of sexual harassment, racism and bullying including global ‘Stop for Safety’ sessions for all employees and contractors |
1 |
Based on a ‘point-in-time’ |
2022 |
2021 | 2020 | ||||||||||
| Female employees |
12,674 |
11,868 | 9,961 | |||||||||
| Male employees |
26,536 |
27,953 | 27,557 | |||||||||
| Female people leaders |
1,695 |
1,439 | 1,157 | |||||||||
| Male people leaders |
4,380 |
4,276 | 4,002 | |||||||||
| Female Executive Leadership Team members |
5 |
5 | 4 | |||||||||
| Male Executive Leadership Team members |
5 |
5 | 6 | |||||||||
| Female Board members |
4 |
4 | 3 | |||||||||
| Male Board members |
8 |
8 | 9 | |||||||||
1 |
Based on a ‘point-in-time’ |
2 |
For FY2022, this does not include employees who left BHP via the merger of BHP Petroleum and Woodside (approximately 1,000 employees) or the sale of BHP Mitsui Coal to Stanmore Resources (approximately 500 employees). |
| Location |
Period |
Target (%) |
30 June 2022 (%) |
|||||||
| Minerals America operations employees in Chile |
By the end of FY2026 | 10.0 |
8.7 |
|||||||
| Minerals Australia operations employees in Australia 2 |
By the end of FY2025 | 8.0 |
8.3 |
|||||||
| Jansen Potash Project and operation employees in Canada 3 |
By the end of FY2027 | 20.0 |
7.2 |
|||||||
1 |
Point in time data at 30 June 2022. |
2 |
Indigenous employee representation overall in Australia as at 30 June 2022 was 7.4 per cent including Minerals Australia operations, 8.3 per cent Indigenous, and non-operational locations, 2.5 per cent Indigenous. |
3 |
Indigenous workforce representation at Potash Jansen Project and operations of 20.7 per cent includes employees, 7.2 per cent Indigenous, and contractors, 23.8 per cent Indigenous. |
| • | creating relations with our workforce based on a culture of trust and cooperation |
| • | negotiating where there are requirements to collectively bargain (and recognising the rights of our workforce to collectively bargain) |
| • | closing out agreements with our workforce in South America and Australia, with no lost time due to industrial action, to the extent possible |
| • | ensuring we comply with legal obligations and regional labour regulations |
| • | BHP Iron Ore Pty Ltd commenced bargaining in January 2022 for the BHPIO Locomotive Drivers Agreement 2022, which is ongoing. |
| • | OS MCAP Pty Ltd recommenced bargaining in December 2022 for the Operations Services Production Agreement 2018, which is ongoing. |
| • | OS ACPM Pty Ltd recommenced bargaining in December 2022 for the Operations Services Maintenance Agreement 2018, which is ongoing. |
| • | BHP Coal Pty Ltd commenced bargaining in February 2021 for the BMA Enterprise Agreement 2021, which is ongoing. |
| • | BM Alliance Coal Operations Pty Ltd commenced bargaining in June 2022 for the BMACO Broadmeadow Mine Agreement 2022, which is ongoing. |
| • | Escondida: O&M union N°1 of 2,333 employees signed in August 2021 for 36 months. |
| • | Cerro Colorado: O&M union N°1 of 705 employees signed in September 2021 for 36 months. |
1 |
To date, our voluntary social investment has been calculated as 1 per cent of the average of the previous three years’ pre-tax profit. For FY2023–FY2030, our social investment will be assessed as a total over the seven-year goals period to FY2030, rather than calculated as an average of the previous three years’ pre-tax profit. |
2 |
These include our Indigenous Peoples Framework, Social Value Framework, Inclusion and Diversity Statement, Climate Change Strategy, approach to the environment, Closure Strategy, Human Rights Policy Statement, and approach to community engagement. |
| • | Recognise our responsibility to our workforce – where a major change in our business is expected to affect our workforce, we will engage in meaningful dialogue and support those impacted. |
| • | Create opportunity for meaningful engagement and co-designed processes – we will seek to develop relationships with stakeholders and partners, including government, local businesses, community members, suppliers, Indigenous peoples and workers, that support understanding of the issues and co-creation of solutions. We will communicate transparently on the types of changes the business needs to make and enable active participation of those most impacted. |
| • | Recognise the impacts associated with gender, land connectedness and social and economic vulnerability – we will not assume all people are affected similarly. We will seek to understand how impacts may be differently experienced, including for Indigenous peoples, and recognise that plans and solutions must take into account the particular strengths of each community and tackle the unique impacts they experience. |
| • | Recognise that the economic, social and environmental dimensions of sustainable development are interrelated – we will aim to avoid or mitigate adverse environmental impacts of change and transitions, while pursuing opportunities to build climate resilience and environmentally sustainable communities. |
1 |
Our sustainability standards index is included in our ESG Standards and Databook, available at bhp.com/sustainability. |
2 |
Certain information has been omitted from this report for the purposes of US reporting. |
1 |
‘Material’ in this context refers to the materiality of a risk under BHP’s Risk Framework. For information on our Risk Framework refer to OFR 9. |
| People |
Target |
FY2022 result |
Year-on-year | |||||
| Zero work-related fatalities | Zero work-related fatalities and there was a 30 per cent decrease in the high-potential injury frequency rate from FY2021. High-potential injury trends remain a primary focus to assess progress against our most important safety objective, eliminating fatalities. | FY2018 1 FY2019 2 FY2020 FY2021 FY2022 3 |
2 1 0 0 0 | |||||
| Year-on-year 4 per million hours worked |
An increase in total recordable injury frequency (TRIF) of 8 per cent from FY2021. This shift was influenced by COVID-19 through an 8 per cent reduction in hours worked between the first and second halves of FY2022. TRIF has decreased by 9 per cent since FY2018. |
FY2018 1 FY2019 2 FY2020 FY2021 FY2022 3 |
4.4 4.7 4.2 3.7 4.0 | |||||
| 50 per cent reduction in the number of workers potentially exposed 5 to our most material exposures of diesel particulate matter, respirable silica and coal mine dust compared to our FY20176 baseline by FY2022 |
We exceeded our target by reducing the total number of workers potentially exposed to our most material exposures by 68 per cent compared to our adjusted FY2017 6 |
Adjusted FY2017 baseline 6 FY2018 6 FY2019 6 FY2020 6 FY2021 6,7 FY2022 6 |
4,176 2,803 2,160 1,683 1,372 1,333 | |||||
| Society |
Zero significant community events 8 |
No significant community events resulting from BHP operated activities were recorded in FY2022 | FY2018 FY2019 FY2020 FY2021 FY2022 3 |
0 0 0 0 0 | ||||
| Not less than 1 per cent of pre-tax profits 9 invested in community programs that contribute to the quality of life in the communities where we operate and support the achievement of the UN Sustainable Development Goals10 |
Social investment of US$681.4 million over five years | FY2018 1 FY2019 11 FY2020 FY2021 FY2022 3 |
US$77.1 million US$93.5 million US$149.6 million US$174.8 million US$186.4 million | |||||
| By FY2022, implement our Indigenous Peoples Strategy across all our operated assets through the development of Regional Indigenous Peoples Plans |
Regional Indigenous People Plans have been implemented across Australia (Reconciliation Action Plan (RAP)) and North and South America | |||||||
| Environment |
Zero significant environmental events 8 |
No significant environmental events resulting from BHP operated activities were recorded in FY2022 | FY2018 FY2019 FY2020 FY2021 FY2022 3 |
0 0 0 0 0 | ||||
| Reduce FY2022 withdrawal of freshwater 12 by 15 per cent from FY2017 levels |
Exceeded our target, with a 29 per cent reduction in freshwater withdrawal volumes compared to our adjusted FY2017 baseline 13 |
Adjusted FY2017 baseline 13 FY2018 13 FY2019 13 FY2020 13 FY2021 13 FY2022 13 |
152,249 ML 133,265 ML 149,237 ML 122,331 ML 108,440 ML 107,398 ML | |||||
| By FY2022, improve marine and terrestrial biodiversity outcomes by: • developing a framework to evaluate and verify the benefits of our actions, in collaboration with others • contributing to the management of areas of national or international conservation significance exceeding our disturbed land footprint (‘area conserved’ target) |
Biodiversity framework was developed with the support of Conservation International and Proteus, a cross-sector partnership between the UN Environment Programme World Conservation Monitoring Centre (UNEP WCMC) and business ‘Area conserved’ target has been met by our operational and voluntary conservation investments over the target period, given BHP’s FY2022 total disturbed land footprint was 149,312 hectares. |
Year-on-year The total land set aside for conservation on land on which we operate and other land we steward was 65,870 hectares in FY2022. In addition to these conservation areas, we made several voluntary investments over the target period, of which an area of 4,465,260 hectares contributed to achievement of the ‘area conserved’ target. | ||||||
1 |
FY2018 data includes Continuing and Discontinued operations (Onshore US assets). |
2 |
FY2019 data includes Discontinued operations (Onshore US assets) to 28 February 2019 and Continuing operations. |
3 |
FY2022 data includes the operated assets in our Petroleum business up to the date of the merger with Woodside (1 June 2022) and BMC up to the date of completion of the sale (3 May 2022). |
4 |
The sum of (fatalities + lost-time cases + restricted work cases + medical treatment cases) multiplied by 1 million/actual hours worked by our employees and contractors. Stated in units of per million hours worked. We adopt the US Government’s Occupational Safety and Health Administration Guidelines for the recording and reporting of occupational injuries and illnesses. |
5 |
For exposures exceeding our FY2017 baseline occupational exposure limits, without considering protection afforded by the use of personal protective equipment (where required). The baseline exposure profile (as at 30 June 2017) is derived through a combination of quantitative exposure measurements and qualitative assessments undertaken by specialist occupational hygienists consistent with best practice as defined by the American Industrial Hygiene Association. |
6 |
The FY2017 baseline has been adjusted for Discontinued operations (Onshore US assets and Petroleum) and the divestment of BMC. These adjustments have also been applied to FY2018-FY2022 emissions stated in this table to aid comparability. |
7 |
As of FY2021, the Occupational Exposure Limit for Coal was reduced to 1.5 mg/m3 compared to 2.0 mg/m3 in previous years. |
8 |
A significant event resulting from BHP operated activities is one with an actual severity rating of four or above, based on our internal severity rating scale (tiered from one to five by increasing severity) as defined in our mandatory minimum performance requirements for risk management. |
9 |
To date, our voluntary social investment has been calculated as 1 per cent of the average of the previous three years’ pre-tax profit. For FY2023–FY2030, our social investment will be assessed as a total over the seven-year goals period to FY2030, rather than calculated as an average of the previous three years’ pre-tax profit. |
10 |
Expenditure includes BHP’s equity share for operated and non-operated joint ventures, and comprises cash, administrative costs, including costs to facilitate the operation of the BHP Foundation. |
11 |
FY2019 data includes Discontinued operations (Onshore US assets) to 31 October 2018 and Continuing operations. |
12 |
‘Withdrawal’ is defined as water withdrawn and intended for use (in accordance with ‘Water Reporting Good Practice Guide’, ICMM (2021)). ‘Fresh water’ is defined as waters other than seawater, wastewater from third parties and hypersaline groundwater. Freshwater withdrawal also excludes entrained water that would not be available for other uses. These exclusions have been made to align with the target’s intent to reduce the use of freshwater sources subject to competition from other users or the environment. |
13 |
The FY2017 baseline has been adjusted to account for: the materiality of the strike affecting water withdrawals at Escondida in FY2017 and improvements to water balance methodologies at WAIO and BMA, exclusion of hypersaline, wastewater, entrainment, supplies from desalination and removal of data for Discontinued operations (Onshore US assets, Petroleum) and BMC. These adjustments have also been applied to FY2018-FY2022 freshwater withdrawal stated in this table to aid comparability. |
| • | no fatalities at BHP |
| • | a decrease of 30 per cent in the high-potential injury frequency rate from FY2021. The highest number of events with potential for one or more fatalities was related to vehicle and mobile equipment accidents. High-potential injury trends remain a primary focus to assess progress against our most important safety objective, eliminating fatalities |
| • | an increase in total recordable injury frequency (TRIF) of 8 per cent from FY2021. This shift was influenced by COVID-19 through an 8 per cent reduction in hours worked between the first and second halves of FY2022. TRIF has decreased by 9 per cent since FY2018. The highest number of injuries was related to slips, trips and falls for both employees and contractors |
| • | a consistent application of field leadership activities, which occurred at a sustainable frequency rate of 9,341 activities per million hours worked with over 1,517,117 activities completed and more than 68,000 employees and contractors participating in the program at least once. Scheduled activities compared to non-scheduled activities increased by 46 per cent from FY2021 and coaching increased by 6 per cent |
| • | one safety fine at our operated assets |
| Year ended 30 June |
2022 |
2021 | 2020 | |||||||||
| High-potential injuries |
23 |
33 | 42 | |||||||||
| Employees | Contractors | |||||||
| High-potential injury frequency 3 |
0.03 | 0.03 | ||||||
| Year ended 30 June |
2022 |
2021 | 2020 | |||||||||
| Total recordable injury frequency 4 |
4.0 |
3.7 | 4.2 | |||||||||
| Employees | Contractors | |||||||
| Total recordable injury frequency 3 |
0.77 | 0.82 | ||||||
1 |
Data includes BMC up to the date of completion of the sale (3 May 2022) and operated assets in our Petroleum business up to the date of the merger with Woodside (1 June 2022) |
2 |
High-potential injury includes injuries with fatality potential. The basis of calculation was revised in FY2020 from event count to injury count as part of a safety reporting methodology improvement. |
3 |
Employee and contractor frequency per 200,000 hours worked. |
4 |
Combined employee and contractor frequency per 1 million hours worked. |
| • | Fatality Elimination Program |
| • | Integrated Contractor Management Program |
| • | Field Leadership Program |
| • | developed five-year fatality elimination roadmap guidelines, including the recommended sequencing of strengthened controls based on effort, cost and near miss reduction impact |
| • | updated the Our Requirements for Safety |
| • | created the ‘Control Shift’ methodology for assets to replicate FEL processes for specific risks not considered within our top 10 risks (i.e. vehicle and mobile equipment, dropped object, electrical, lifting, geotechnical failure, entanglement/crushing, energy release, loss of containment, fire/explosion, fall from height) |
| • | created an online dashboard to enhance local implementation plans, providing global visibility of challenges, similarities and differences, thereby assisting assets with their implementation |
| • | published technical bulletins related to FEL controls to provide detailed implementation guidance based on site experience and lessons learnt |
| • | undertook a human performance benchmarking study to identify the latest developments and best practices in the field of human behaviour |
| • | developed the scope of work library as an online resource containing best practice examples for different types of contractor engagements |
| • | created contract execution plans as a means of applying the Our Requirements for Contractor Management |
| • | established an integration stream ensuring enhancements are holistic and cover functional interactions |
| • | undertook assurance and audit activities across BHP including contractor engagements |
| • | implemented a contractor perception survey that runs in parallel with our internal survey. The survey highlighted some results on the experience of our contractor workforce consistent with the internal survey and other areas of focus |
| • | determined organisational design changes to improve contract ownership and management practices |
| • | commenced deployment of a technology solution which supports an enterprise-wide approach to contractor on-boarding and management |
| • | enhanced the efficiency and effectiveness of supervisor time in the field by integrating the BHP Operating System (BOS) process confirmation and field leadership planned task observation processes into a planned task confirmation |
| • | continued to improve the quality of field leadership activities by increasing coaching and delivery of field leadership engagements |
| • | conducted field leadership activities to support the verification of risks that have the potential to result in fatalities across our operated assets |
| • | embedded the global, standardised field leadership procedure designed to increase the effectiveness of field leadership activities across the business |
| • | conducted field leadership on COVID-19 controls, designed to sustain effectiveness within the changing environment |
| • | 37 involved non-consensual kissing or touching of a sexual nature, which includes a broad range of behaviour of varying severity. None of these cases involved non-consensual penetration or intercourse, however we recognise that this conduct can occur and has occurred in the past |
| • | 66 involved other forms of sexual harassment, including inappropriate comments of a sexual nature, unwelcome gestures or comments, sending inappropriate text messages or images, or other unwanted advances or invitations |
| • | Of these 103 substantiated cases, in 101 cases the individual responsible has had their employment terminated (or they have been removed from site if a contractor), they have resigned or are otherwise no longer working at BHP. |
1 |
‘Sexual harassment’ is, as defined in the Respect@Work report, an unwelcome sexual advance, unwelcome request for sexual favours or other unwelcome conduct of a sexual nature, which makes a person feel offended, humiliated and/or intimidated, where a reasonable person would anticipate that reaction in the circumstances. Sexual harassment encompasses a range of conduct including displaying sexually graphic images, sexually suggestive comments, suggestive or inappropriate looks, gestures or staring, non-consensual touching or acts of a sexual nature and sexual assault. |
2 |
EthicsPoint is our confidential reporting tool. It is accessible to all, including external stakeholders and the public, to report conduct that may be unethical, illegal or inconsistent with Our Code of Conduct |
3 |
This does not include investigations that are currently in progress. |
| • | engaged and learnt from external experts who reviewed the controls we have in place and advised on best practice in preventing sexual harassment, and minimising further harm when responding to sexual harassment |
| • | engaged Kristen Hilton (former Victorian Equal Opportunity and Human Rights Commissioner) to provide expert guidance on our prevention and response framework |
| • | conducted a sexual harassment audit across Minerals Americas further to the FY2021 sexual harassment audit conducted across Minerals Australia |
| • | contributed to knowledge sharing with other industry participants in relation to addressing sexual harassment, and considered broader learnings from external reports such as the Australian Human Rights Commission’s Respect@Work: Sexual Harassment National Inquiry Report and the Report into Workplace Culture at Rio Tinto by Elizabeth Broderick & Co |
| • | worked with our contracting and supplier organisations to address sexual harassment, including collaboration on response protocols, joint training sessions and knowledge sharing |
| • | undertook a series of listening workshops |
| • | focusing on increasing female leader representation across our operations |
| • | continuous improvement across our suite of controls |
| • | engaging with our people, encouraging and empowering them to take action as active bystanders and enhance capability |
| • | encouraging increased reporting |
| • | enhancing our approach to supporting impacted persons to thrive at BHP and have successful careers with us |
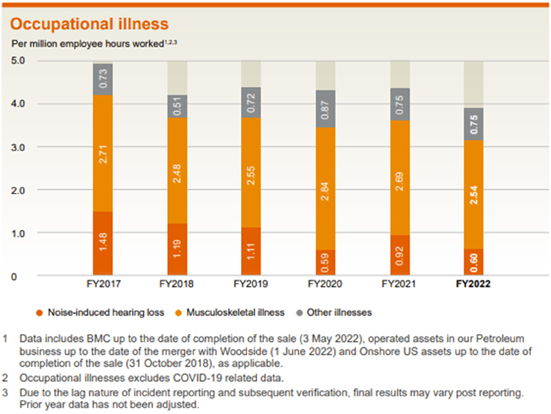
1 |
An illness that occurs as a consequence of work-related activities or exposure. |
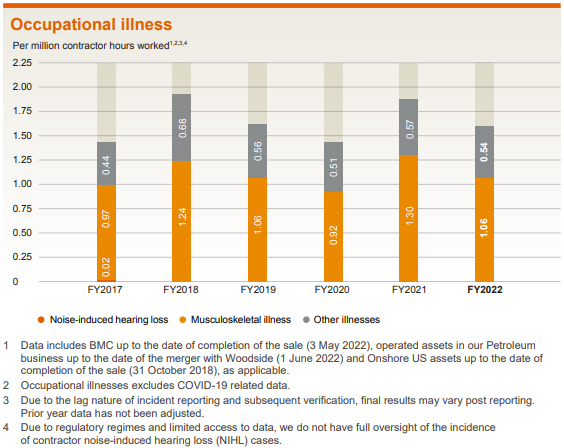
1 |
For exposures exceeding our FY2017 occupational exposure limits, without considering protection afforded by the use of personal protective equipment (where required). |
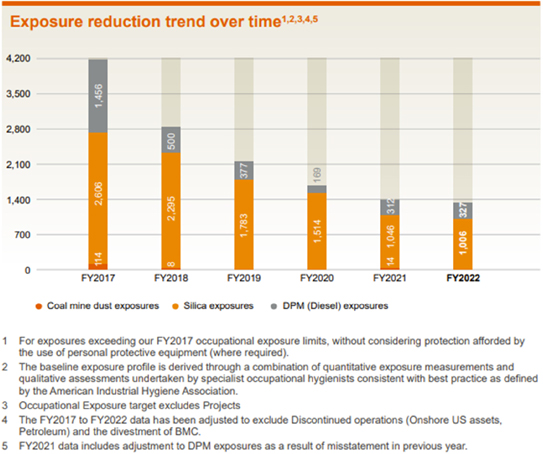
1 |
The baseline exposure profile is derived through a combination of quantitative exposure measurements and qualitative assessments undertaken by specialist occupational hygienists consistent with best practice as defined by the American Industrial Hygiene Association. |
2 |
Occupational Exposure target excludes Projects. |
3 |
The FY2017 to FY2022 data has been adjusted to exclude Discontinued operations (Onshore US assets, Petroleum) and the divestment of BMC. |
4 |
FY2021 data includes adjustment to DPM exposures as a result of misstatement in previous year. |
1 |
CMDLD is the name given to the lung diseases related to exposure to coal mine dust and includes coal workers’ pneumoconiosis, silicosis, mixed dust pneumoconiosis and chronic obstructive pulmonary disease. |
2 |
Cases reported to DNRME are not an indication of work relatedness. BHP evaluates each case for work relatedness and where identified, the case will be included in occupational illness reporting. |
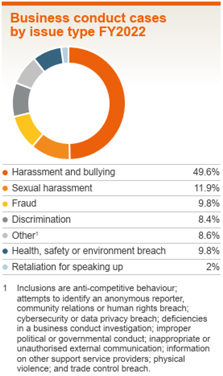
1 |
Information is available at bhp.com/our-approach/our-company/our-code-of-conduct/ |
2 |
Some EthicsPoint reports are enquiries, or are not related to business conduct concerns, or are a duplicate of an existing report. |
3 |
This excludes reports not containing a business conduct concern and excludes reports logged by leaders on behalf of others. Case classification is made at the time of the report. |
4 |
The calculation is based on reports received and completed in FY2022, containing one or more substantiated allegations. Not all reports resulted in a finding. This can occur if there is insufficient information, the respondent is not able to be identified, was previously terminated, or that the impacted person did not wish to proceed. |
| • | a medium-term target to reduce operational GHG emissions by at least 30 per cent from FY2020 levels by FY2030 |
| • | a long-term goal to achieve net zero operational GHG emissions by 2050 |
| • | We are pursuing the long-term goal of net zero Scope 3 GHG emissions by 2050. Achievement of this goal is uncertain, particularly given the challenges of a net zero pathway for our customers in steelmaking, and we cannot ensure the outcome alone. To progress towards this goal: 2 |
| • | We will target net zero by 2050 for the operational GHG emissions of our direct suppliers. 3 |
| • | We will target net zero by 2050 for GHG emissions from all shipping of BHP products. |
| • | We will continue to partner with customers and others to try to accelerate the transition to carbon neutral steelmaking and other downstream processes. |
| • | Our 2030 goals are to: |
| • | support industry to develop technologies and pathways capable of 30 per cent emissions intensity reduction in integrated steelmaking, with widespread adoption expected post 2030 |
| • | support 40 per cent emissions intensity reduction of BHP-chartered shipping of BHP products |
1 |
These positions are expressed using terms that are defined in the Glossary to this Report, including the terms ‘target’, ‘goal’, ‘net zero’ and ‘carbon neutral’. The baseline year(s) of our targets will be adjusted for any material acquisitions and divestments, and to reflect progressive refinement of emissions reporting methodologies. The targets’ boundaries may in some cases differ from required reporting boundaries. The use of carbon offsets will be governed by BHP’s approach to carbon offsetting described at bhp.com/climate. |
2 |
The targets are referable to a FY2020 baseline year. Our ability to achieve the targets is subject to the widespread availability of carbon neutral solutions to meet our requirements, including low/zero-emissions technologies, fuels, goods and services. |
3 |
Operational GHG emissions of our direct suppliers means the Scope 1 and Scope 2 emissions of our direct suppliers included in BHP’s Scope 3 reporting categories of purchased goods and services (including capital goods), fuel- and energy-related activities, business travel and employee commuting. |
| Targets |
FY2022 progress | |
| Short-term: |
We have achieved and exceeded our FY2022 target on the basis of significant progress securing renewable energy supply via PPAs, notably in Minerals Americas, with Escondida and Spence mostly supplied by renewable energy for their electricity in the first half of CY2022. | |
| Medium-term: |
| Targets and goals |
FY2022 progress | |
| Steelmaking 2030 goal: |
• Announced a Memorandum of Understanding (MOU) for up to US$10 million investment with POSCO in October 2021 to jointly study optimising coal/coke quality for low-carbon blast furnace operation and Carbon Capture Utilisation and Storage (CCUS).• This, together with MOUs announced in FY2021, provides up to US$75 million for steel decarbonisation partnerships with four key customers representing approximately 12 per cent of reported global steel production. For more information refer to our steel decarbonisation framework in Value chain GHG emissions. • Commenced feasibility studies with Baowu, HBIS, JFE, into CCUS and Direct Reduced Iron (DRI) technologies, use of hydrogen in steelmaking, and iron ore blends suitable for DRI production. • Invested US$11 million in venture investments in electrolysis technology companies Electrasteel and Boston Metal. | |
| Maritime 2030 goal: BHP-chartered shipping of BHP products.Target: |
• In May 2022, we joined the First Mover’s Coalition as a member in the shipping sector, on the basis of committing that 10 per cent of BHP’s products shipped to our customers, on our time charter vessels, will be on vessels using zero emissions fuels by 2030. 1 • Formed a consortium with Rio Tinto, Oldendorff, Star Bulk, and the Global Maritime Forum to analyse and support the potential to develop an iron ore maritime green corridor, fuelled by green ammonia. • Chartered the world’s first LNG-fuelled Newcastlemax bulk carriers to transport iron ore from Western Australia to Asia for five years. The fuel, along with improved efficiency of the vessel design, is expected to significantly reduce GHG emissions intensity per voyage. | |
| Commitment |
FY2022 progress | |
| Assessing capital alignment with a 1.5ºC world – our approach to strategy and operational and commercial decision-making in consideration of a range of different global, sectoral and regional scenarios, including a 1.5ºC outcome |
• The impact of our 1.5°C Paris-aligned scenario on portfolio value was assessed and reviewed against the portfolio mix and major capital allocation decisions. All investment decisions now require an assessment of viability under our 1.5°C scenario. Work continues to determine future climate requirements for planning and capital allocation processes. | |
| Climate policy engagement – including our strengthened approach to industry associations to ensure our review identifies areas of inconsistency with the Paris Agreement |
• We plan to publish our next formal industry association review in the second half of CY2022. • As part of our normal practice, we intend to analyse the industry association reviews published by our peers and relevant material published by civil society groups and other stakeholders, with the goal of strengthening our own review methodology, where possible. | |
| Just transition – our approach to dealing with the challenges associated with the transition of our communities and workforce as assets come to the end of their operating life |
• We have set out our Equitable Change and Transition Position establishing our approach to changes and transitions in our communities. Refer to OFR 7.1. | |
1 |
Subject to the availability of technology, supply, safety standards, and the establishment of reasonable thresholds for price premiums. |
| • | Transition risks low-carbon economy. For more information refer to Transition risks. |
| • | Physical risks |
1 |
Central Energy View reflects, and is periodically updated to respond to, existing policy trends and commitments. Lower Carbon View accelerates decarbonisation trends and policies, particularly in easier-to-abate |
2 |
This scenario aligns with the aims of the Paris Agreement and requires steep global annual emissions reduction, sustained for decades, to stay within a 1.5°C carbon budget. 1.5°C is above pre-industrial levels. For more information about the assumptions, outputs and limitations of our 1.5°C Paris-aligned scenario, refer to the BHP Climate Change Report 2020 available at bhp.com. |
3 |
There are inherent limitations with scenario analysis and it is difficult to predict which, if any, of the scenarios might eventuate. Scenarios do not constitute definitive outcomes for us. Scenario analysis relies on assumptions that may or may not be, or prove to be, correct and may or may not eventuate, and scenarios may be impacted by additional factors to the assumptions disclosed. |
1 |
The first seven risks in the table were selected based on the number of operated assets that identified them as material in accordance with BHP’s Risk Framework and the average Maximum Foreseeable Loss severity rating assigned to each. The absence of a tick means either the risk was identified at the asset, but not rated as material under our Risk Framework, or that it was not identified for that asset. Legacy assets and non-operated joint ventures have been excluded from the analysis. Legacy assets are to be included in the risk evaluations planned for FY2023. The eighth risk in the table is a collation of material value chain risks with implications across the regions; its position in the table does not indicate its level of potential impact relative to the other risks. |
| Minerals Australia |
Minerals Americas |
|||||||||||||||||
| Risk description |
BMA |
NSWEC |
Nickel West |
Olympic Dam |
WAIO |
Escondida |
Jansen |
Pampa Norte |
Risk management 1 | |||||||||
| Geotechnical instability and erosion of tailings storage facility (TSF) landforms and structures under conditions of extreme rainfall, leading to TSF failure |
✓ |
✓ |
✓ |
✓ |
✓ |
✓ |
✓ |
Our approach to TSF failure risk management at operated assets is multi-dimensional and includes the following key elements: maintenance of dam integrity; operation, surveillance and maintenance; emergency preparedness and response; TSF governance and standards; and Group-level oversight and assurance. The Our Requirements for Tailings Storage Facilities We are working to incorporate climate risk management into the TSF life cycle and have conducted a detailed study on the potential impact of climate change on Laguna Seca TSF at Escondida. | ||||||||||
| Water shortages impacting production, associated activities (e.g. dust suppression, ore handling) and reputation due to changes in average rainfall and temperature/evaporation |
✓ |
✓ |
✓ |
✓ |
✓ |
✓ |
We have a range of risk management measures for our water-related risks, including consideration of climate change projections as relevant (and where available), covered in more detail at bhp.com/water. | |||||||||||
| Flooding of mine and/or key production infrastructure (e.g. plants, conveyor belts etc.) due to extreme precipitation |
✓ |
✓ |
✓ |
✓ |
✓ |
Per above, risk management measures for our water-related risks are covered in more detail at bhp.com/water. We have developed internal guidance on incorporating climate change projections into mine water planning, hydrologic assessment and infrastructure design. We are conducting a pilot study on quantifying the potential impact of this risk, to inform future value-at-risk | ||||||||||||
| Disruption and/or damage to port and coastal infrastructure and operations due to higher sea levels, cyclones, storm surge and changes in marine ecosystems |
✓ |
✓ |
✓ |
✓ |
✓ |
We maintain response plans for various scenarios that could impact our ability to access key markets, including physical disruptions of outbound supply chain logistics. Stockpile and capacity management and use of weather forecasts are some of the tools that may assist in minimising operational disruption at our ports from weather and/or climate-related events. We are undertaking more detailed evaluations of the potential climate change impacts for our port and coastal infrastructure, including at Port Hedland and Hay Point. | ||||||||||||
| Minerals Australia |
Minerals Americas |
|||||||||||||||||
| Risk description |
BMA |
NSWEC |
Nickel West |
Olympic Dam |
WAIO |
Escondida |
Jansen |
Pampa Norte |
Risk management 1 | |||||||||
| Workforce health and safety incidents due to extreme events (e.g. extreme temperature causing heat stress) |
✓ |
✓ |
✓ |
✓ |
✓ |
The Our Requirements for Health Our Requirements for Safety Our Requirements for Community At our operating sites, we have weather detection monitoring (e.g. wet bulb temperature) and associated weather preparation and response plans (including Trigger Action Response Plans (TARPs)) to enable our response to potential extreme weather events. Our sites also have Emergency Management Plans in place, and personnel trained in emergency response. | ||||||||||||
| Disruption and/or damage to electrical infrastructure (e.g. motors, cooling and control systems) due to extreme temperatures |
✓ |
✓ |
✓ |
✓ |
We aim to operate our critical equipment in accordance with industry best practice and ensure that critical equipment components are compliant with relevant design standards. We have extensive inspection and maintenance routines, hold inventory of critical spares, and undertake detailed contingency planning, in order to remain resilient in the face of potential equipment failure or inefficiencies. A number of our sites in FY2023 will evaluate the potential impact on electrical infrastructure of extreme temperatures under different climate scenarios. | |||||||||||||
| Disruption and/or damage to water supply infrastructure due to extreme precipitation or flooding |
✓ |
✓ |
✓ |
Regular maintenance of water infrastructure, such as treatment plants, pipelines and tanks is critical to ensure that water is adequate for our operated assets, both in quantity and quality. BHP requires our water infrastructure to be designed and constructed to meet internal and external standards. | ||||||||||||||
| Disruption in the supply of critical production inputs and critical infrastructure due to extreme weather events |
Identified as value chain risks across the relevant regions |
We assess supply categories according to commercial dependency and supplier risk, both elements that have informed our selection of key value chain inputs for further evaluation of physical climate risk. This work aims to minimise potential adverse impacts from physical climate risk in our value chain. At our Spence copper asset, we have assessed supply chain resilience in relation to the impact that swells, extreme rainfall, earthquakes and tsunamis could have on the supply of diesel, sulphuric acid and supplies for concentrates. The assessment identified specific mitigating controls for consideration by the asset. | ||||||||||||||||
1 |
The risk management measures in this column describe our current approach, which is subject to review for new or additional climate-related measures arising from the subsequent risk evaluation work program planned across all of our operated assets (including legacy assets) in FY2023. |
| • | The Minerals Americas PPAs became operational in August 2021 and January 2022, with Escondida and Spence aiming to use 100 per cent renewable electricity by the mid-2020s. |
| • | BMA’s PPA with CleanCo will deliver approximately 50 per cent of its annual electricity from renewable sources by 2025. 1 |
| • | Nickel West signed PPAs to provide its operations with renewable power, with agreements for the Flat Rocks Wind Farm, the Merredin Solar Farm and the Northern Goldfields Solar Project. |
| • | Olympic Dam entered into renewable energy supply arrangements for up to 50 per cent of its electricity by 2025. 2 |
1 |
Including the purchase of large-scale generation certificates (LGCs). |
2 |
Including the purchase of LGCs. A portion of the LGCs are to be created from the new Port Augusta Renewable Energy Park. |
| Potential emissions intensity reduction |
Optimisation stage 20% CO 2 reduction vs. BAU 1 |
Transition stage 50-60% CO2 reduction vs. BAU |
Green end state 90% CO 2 reduction vs. BAU | |||
| Customer partnerships |
• HBIS: Enhanced lump utilisation, slag recycling • POSCO: Coke quality optimisation • JFE: Coking coal and iron ore impact on agglomeration |
• Baowu: Modified BF oxygen and hydrogen injection • Baowu & POSCO: CCUS application within integrated steelmaking • Tata: Use of biomass and CCU |
• HBIS: Hydrogen DRI • JFE: DRI pathways with BHP ores | |||
| Innovation & technology |
• R&D novel beneficiation technologies • R&D microalgae blending for premium coking coal quality |
• R&D ultramafic sequestration • R&D with Hatch and University of Newcastle on hydrogen injection into modified BF • Supported the CCUS Knowledge Centre, as a member of the CO2CRC |
• Ventures completed lab trials producing metallic iron using BHP ores with Boston Metal and Electra Steel | |||
| Product & portfolio |
• Studying beneficiation at our Jimblebar iron ore operation • Studying improvements of BMA metallurgical coal quality |
• Testing programs to assess performance of BHP’s ores in DRI and electric furnace steel production | ||||
| Advocacy & standards |
• Joined the Global Low-Carbon Metallurgy Innovation Alliance, which is led by Baowu and includes World Steel Association and many steel industry stakeholders• Engage with industry decarbonisation initiatives, including our customers, Responsible Steel, and the Australia Industry Energy Transition Initiative, by sharing expertise and participating in consultation on emissions standards and accelerating decarbonisation pathways | |||||
1 |
BAU means business as usual, referring to a trajectory of steelmaking emissions intensity if no changes occur. |
| 1. | Conduct feasibility studies or lab/bench-scale research and development in priority areas. |
| 2. | Pilot-scale trial, where we jointly test potential solutions to key technical challenges at a larger scale that is sufficient to understand the impact of raw material and operational parameters. |
| 3. | Trial at a customer plant, where we focus on optimal, high impact decarbonisation solutions for deployment on a limited basis at select sites. |
| • | Advocacy: |
| • | Zero-emission fuels: zero-emissions fuels by FY2030.1 BHP has also formed a consortium with Rio Tinto, Oldendorff, Star Bulk and the Global Maritime Forum to analyse and support the development of an iron ore maritime green corridor, fuelled by green ammonia. |
| • | Transition fuels: LNG-fuelled Newcastlemax bulk carriers to transport iron ore from Western Australia to Asia from Eastern Pacific Shipping (EPS) for five years and awarded the LNG fuel contract to Shell. The fuel, along with improved efficiency of the vessel design, is expected to reduce GHG emissions intensity by up to 30 per cent on a per voyage basis. We have already operationalised two vessels and expect to deliver another three vessels in FY2023. BHP is also exploring biofuels as an interim GHG emission abatement option for shipping. In FY2022, we issued a Request for Proposal for procurement of sustainable-certified (REDII or ISCC)2 biodiesel. |
1 |
Subject to the availability of technology, supply, safety standards and the establishment of reasonable thresholds for price premiums. |
2 |
Renewable Energy Directive or International Sustainability and Carbon Certification. |
1 |
This percentage is calculated as a share of our total spend in FY2021, and total spend is defined as the categories of spend that are relevant to Scope 3 emissions reporting categories, which excludes intra-company payments, internal payroll, community and charitable donations, and expenses associated with regulatory compliance and taxation. |
2 |
For more information refer to bhp.com/news/articles/2022/06/new-bhp-grants-to-support-blue-carbon-market. |
3 |
For more information refer to bhp.com/sustainability/communities/social-investment. |
4 |
For example, we undertook a pilot carbon neutral commodity transaction with US copper cable and wire manufacturer, Southwire. We did not retire any of the offsets tied to that transaction against our own voluntary targets or goals. For more information refer to bhp.com/news/media-centre/releases/2021/10/bhp-and-southwire-collaborate-for-first-carbon-neutral-copper-cathode-delivery |
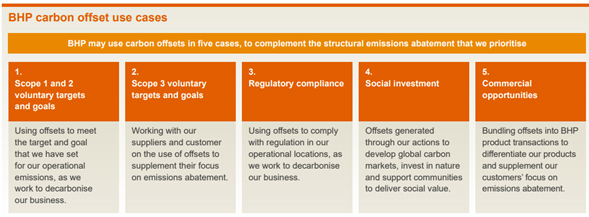
| • | Registered under an internationally recognised standard |
| • | Adheres to a robust emission reduction accounting methodology |
| • | Demonstrates that the emissions reductions are additional |
| • | Has a high likelihood of permanence |
| • | Provides robust mitigation against leakage |
| • | Demonstrates high environmental and social integrity |
| • | Restrict early vintage years |
1 |
For more information refer to bhp.com/sustainability/climate-change/carbon-offsets . |
| • | the Copper Mark |
| • | the London Metal Exchange (LME) Policy on Responsible Sourcing of LME-Listed Brands |
| • | the ICMM Mining Principles and associated Performance Expectations |
| • | the Global Industry Standard on Tailings Management |
| • | Towards Sustainable Mining (TSM) |
1 |
‘Carbon neutral’ is not intended to imply certification under any standard or application of a particular methodology and includes all those greenhouse gas emissions as defined for BHP reporting purposes. |
| • | The two most common themes across BHP operated assets were concerns regarding: (i) the continued impacts of the COVID-19 pandemic and associated recovery initiatives; and (ii) local employment. |
| • | In Chile, community concerns focused on environmental impacts and the overall sustainability of the mining industry, the development of local communities and the impacts of automation. Complaints about contractor behaviour included claims that certain commitments were not honoured and some local Indigenous community stakeholders raised concerns about water resources in the high Andean wetlands and greater employment opportunities at Escondida. |
| • | In Canada, community concerns and complaints related to the increase in activity at the Jansen Potash Project, including routes of haul trucks and greater community support and local procurement opportunities. |
| • | In Australia, key community issues centred on local employment and associated skills and labour shortages, the impact on local procurement from supply chain delays, and our COVID-19 vaccination mandate with particular mental health and wellbeing concerns raised by Traditional Owners. Community complaints also related to operational impacts, largely lighting, dust, noise, odour, emissions, blasting overpressure and vibration. |
| • | Following the announcement of the divestment of our interest in BMC, some local stakeholders focused on whether community support would continue under new ownership and the local Traditional Owners sought assurance that the Indigenous Land Use Agreement would be honoured by the new owners. |
| • | The announcement that BHP would retain New South Wales Energy Coal and intends to proceed with a managed process to cease mining at the asset by the end of FY2030 was received in a neutral to positive manner overall, with community stakeholders generally expressing support for BHP retaining the asset to a managed closure rather than selling to new owners. |
1 |
A significant event resulting from BHP operated activities is one with an actual severity rating of four or above, based on our internal severity rating scale (tiered from one to five by increasing severity) as defined in our mandatory minimum performance requirements for risk management. |
2 |
An event or community complaint relating to an adverse impact/event that has escalated to the point where a third-party intervention or adjudication is required to resolve it. |
| • | broadening our community data sets to create a more integrated and multidimensional understanding of community issues, including the incorporation of inputs received via Indigenous-specific engagement channels |
| • | greater data triangulation and the overlay of regional, national, global and industry emerging trends analysis with local insights |
| • | implementing an enterprise-wide stakeholder management system with linkages to our local community complaint and grievance mechanisms |
| • | enhancing internal understanding of reporting processes, systems and requirements |
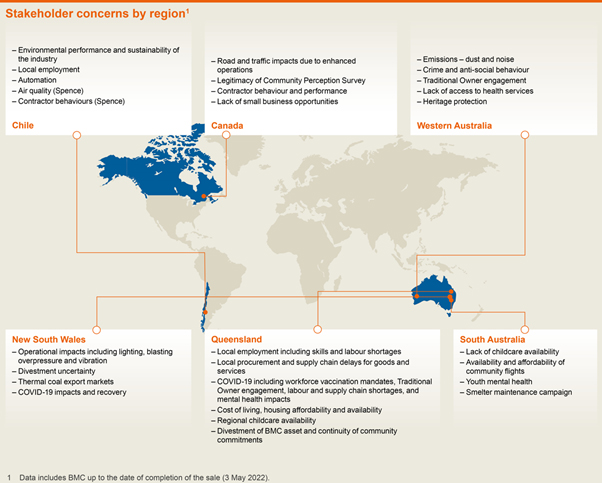
| • | better representing the human rights context and potential impacts to human rights for existing material risks, including labour conditions (such as sexual harassment and mental health) and environment (such as climate change, water and biodiversity) |
| • | improving representation of specific human rights risks in our risk profile, such as risks in local procurement programs that operate independently of our global procurement process, the risk of violating consultation and consent frameworks that respect the rights of Indigenous peoples, the risk of lacking accessible and effective complaints and grievance mechanisms, and analysis regarding potential impacts specific to vulnerable groups (such as Indigenous peoples, women and LGBT+ community) |
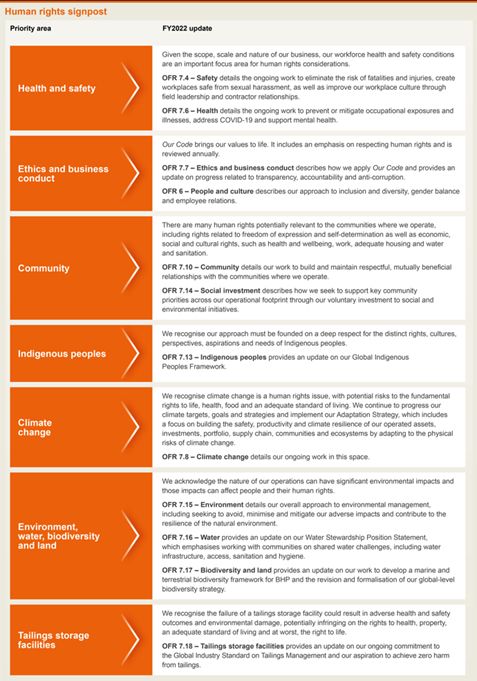
| • | better align to the UNGP Reporting Framework Index |
| • | include quantitative metrics for our operations and our supply chain, as well as qualitative commentary and the voices of rights holders |
| • | focus on mid- to long-term outcomes in addition to short-term outputs |
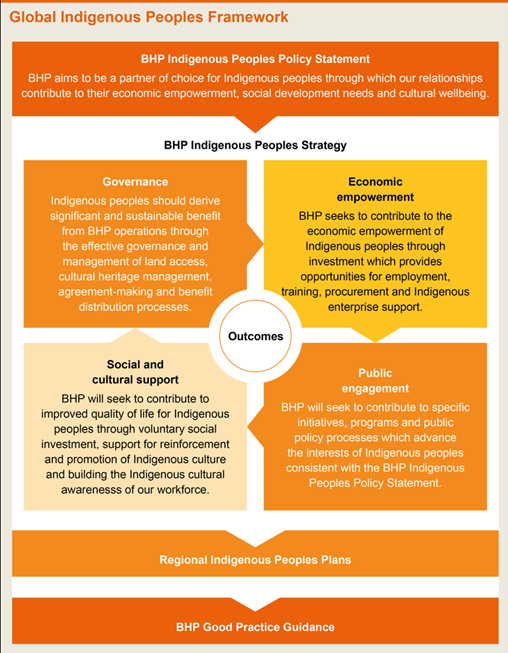
| 1 | BHP Indigenous Peoples Policy Statement |
| 2 | BHP Indigenous Peoples Strategy and Good Practice Guidance |
| 3 | Regional Indigenous Peoples Plans |
Performance |
||||||||||||||||||||
| RAP target deliverable or metric 2 |
FY2018 | FY2019 | FY2020 | FY2021 | FY2022 |
|||||||||||||||
| Indigenous spend 3 |
US$42.8m | US$57.5m | US$67.4m | US$85.5m | US$149.9m |
|||||||||||||||
| Indigenous community investment 4 |
US$11.1m | US$8.2m | US$16.6m | US$12.5m | US$29m |
|||||||||||||||
1 |
Data includes BMC up to the date of completion of the sale (3 May 2022), operated assets in our Petroleum business up to the date of the merger with Woodside (1 June 2022) and Onshore US assets up to the date of completion of the sale (31 October 2018), as applicable. |
2 |
These RAP targets concluded 31 December 2021. |
3 |
RAP target – The identification of specific opportunities for business development and engagement for Aboriginal and Torres Strait Islander communities in Local Procurement Plans and associated targets. |
4 |
RAP target – Australian operations engage and consult with Aboriginal and Torres Strait Islander Peoples in social research that is conducted to understand local and regional contexts, that then informs social investment planning and outcomes. |
| • | We created and resourced a new Minerals Americas Indigenous Engagement team to centralise accountability for Indigenous engagement. This promotes alignment across our regions of operation and enables us to share standards and processes designed to support Indigenous communities affected by our existing operations. |
| • | We delivered against our commitment to strengthen our cultural heritage practices within the Americas. Commencing with a particular emphasis on our operations in Chile, we: |
¡ |
established new critical controls and procedures to manage cultural heritage values within and around our operations |
¡ |
introduced new information systems and geospatial tools to track and protect cultural heritage sites |
¡ |
created a dedicated team within our HSE function to administer cultural heritage management activities at the asset level |
¡ |
reinforced the consideration of cultural heritage management dimensions within our agreement-making practices |
¡ |
engaged independent experts to analyse existing practice against the emerging Indigenous policy landscape |
1 |
To date, our voluntary social investment has been calculated as 1 per cent of the average of the previous three years’ pre-tax profit. |
2 |
The direct costs associated with implementing social investment activities, including labour, travel, research and development, communications and costs to facilitate the operation of the BHP Foundation. |
Social investment framework | ||||
Theme |
Aim | FY2022 | ||
| Future of work |
We aim to enhance human capability and social inclusion through education and vocational training and skills development. | • Through our support, 22,401 people completed education or training courses in digital, technology, leadership and/or problem-solving initiatives. Over 10,469 of these participants were Indigenous people and 7,583 were women. • 426 education institutions aligned course content to business needs to better prepare participants for future work readiness. • 1,249 participants found paid employment following completion of their training. | ||
| Future of environment |
We aim to contribute to environmental resilience through biodiversity conservation, ecosystem restoration, water stewardship and climate change mitigation and adaptation. | • We made 131 investments in nature-based solutions. • We contributed to improved management of approximately 8 million hectares. • 77 scientific or thought leadership papers or specific knowledge sharing events were supported. | ||
| Future of communities |
We aim to contribute to the understanding, development and sustainable use of resources to support communities to be more adaptive and resilient. | • Through our support, 940 organisations enhanced their internal capability to be able to support and deliver solutions that contribute to building efficient and sustainable communities. • 1,168 organisations planned or delivered initiatives that increase/improve infrastructure, use of technology and/or use resources that enhance community resilience, including 171 initiatives specific to Indigenous peoples. | ||
| • | Healthy environment: the Great Barrier Reef Foundation’s Resilient Reefs Initiative has been recognised by UNESCO as a model for successful resilience-based coral reef management and will be promoted as a global model for the management of all World Heritage listed reefs. |
| • | Safe, inclusive and future-ready workforce: UN Women’s Second Chance Education project is providing more than 90,000 marginalised women access to quality learning, entrepreneurship and employment opportunities. |
| • | Thriving, empowered communities: Open Contracting Partnership works with governments and key stakeholders to ensure money flowing from natural resource wealth is converted into better outcomes for citizens, for example, the implementation of open contracting in Chile has reduced the cost of some medicines. |
| • | Indigenous partnerships: Reconciliation Australia’s Narragunnawali: Reconciliation in Education program has resources and tools for schools and early learning services to contribute to the reconciliation movement. Approximately 10,000 Australian schools and early learning services registered to develop a Reconciliation Action Plan on the Narragunnawali platform. |
1 |
For FY2023–FY2030, our social investment will be assessed as a total over the seven-year goal period to FY2030, rather than calculated as an average of the previous three-years’ pre-tax profit. |
| • | develop a more integrated nature-positive approach and healthy environment goal as part of our 2030 goals |
| • | refresh our Water Stewardship Strategy and formalise our biodiversity strategy |
| • | invest in voluntary conservation projects as part of BHP’s contribution to environmental resilience more broadly |
| • | extracting it for ore processing and to access ore |
| • | dust suppression |
| • | processing mine tailings |
| • | providing drinking water and sanitation facilities |
| • | using marine water for desalination |
1 |
Where ‘withdrawal’ is defined as water withdrawn and intended for use (in accordance with ‘Water Reporting, Good Practice Guide (2 nd Ed), ICMM (2021)). ‘Fresh water’ is defined as waters other than seawater, wastewater from third parties and hypersaline groundwater. Freshwater withdrawal also excludes entrained water that would not be available for other uses. These exclusions have been made to align with the target’s intent to reduce the use of freshwater sources of potential value to other users or the environment. |
2 |
The FY2017 baseline data has been adjusted to account for: the materiality of the strike affecting water withdrawals at Escondida in FY2017 and improvements to water balance methodologies at WAIO and BMA, and exclusion of hypersaline, wastewater, entrainment, supplies from desalination and Discontinued operations (Onshore US assets and Petroleum) and the divestment of BMC. |
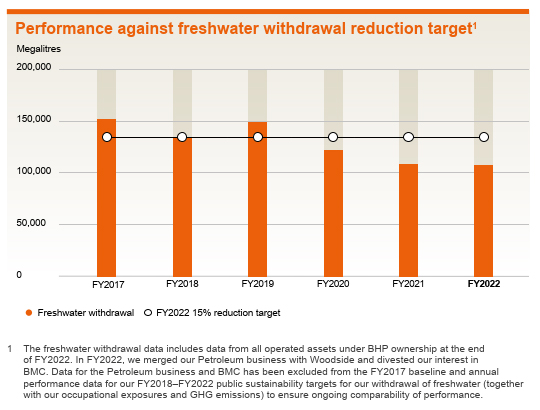
1 |
The CEO Water Mandate is a UN Global Compact initiative that mobilizes business leaders on water, sanitation, and the Sustainable Development Goals. Endorsers of the CEO Water Mandate commit to continuous progress against six core elements of stewardship and in so doing understand and manage their own water risks. Companies that endorse the Mandate agree to continuous improvement in six core areas of their water stewardship practice: Direct Operations, Supply Chain & Watershed Management, Collective Action, Public Policy, Community Engagement and Transparency. BHP is an active signatory of the Mandate |
| • | We do not explore or extract resources within the boundaries of World Heritage listed properties. |
| • | We do not explore or extract resources adjacent to World Heritage listed properties, unless the proposed activity is compatible with the outstanding universal values for which the World Heritage property is listed. |
| • | We do not explore or extract resources within or adjacent to the boundaries of the International Union for Conservation of Nature (IUCN) Protected Areas Categories I to IV, unless a plan is implemented that meets regulatory requirements, takes into account stakeholder expectations and contributes to the values for which the protected area is listed. |
| • | We do not operate where there is a risk of direct impacts to ecosystems that could result in the extinction of an IUCN Red List Threatened Species in the wild. |
| • | We do not dispose of mined waste rock or tailings into a river or marine environment. |
1 |
In April 2019, the Church of England Pensions Board and the Council on Ethics Swedish National Pension Funds wrote to approximately 700 mining firms to request specific disclosures of their tailings facilities. |
2 |
The number of tailings storage facilities (TSFs) is based on the definition agreed to by the ICMM Tailings Advisory Group at the original time of submission and expanded to align with the TSF definition established in the Global Industry Standard for Tailings Management (GISTM). We keep this definition under review. In FY2022, four TSFs were removed from the BHP TSF portfolio following the sale of our interests in two assets: two TSFs at Cerrejón (NOJV) in January 2022 and two TSFs at BMC (operated joint venture) in May 2022. One new, active TSF, TSF 6 at Olympic Dam, has been included. |
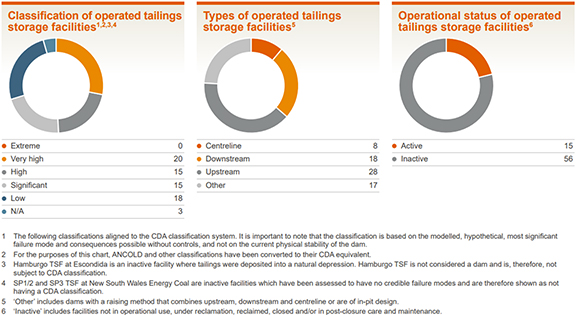
| • | More than 22,000 general damages claims (including loss of life, injury, property damage, business impacts, loss of income and moral damages) have been resolved, and more than 290,000 people have been paid a total of approximately R$305 million (approximately US$69 million) 1 for temporary water interruption as at 30 June 2022. |
| • | Approximately R$7.1 billion (approximately US$1.4 billion) 1 has been paid to more than 66,000 people under the court-mandated simplified indemnity system (known as the ‘Novel’ system) as at 30 June 2022. The Novel system is designed to provide compensation for informal workers who have had difficulty proving the damages they suffered, such as cart drivers, sand miners, artisanal miners and street vendors. More than 166,000 people have applied to join the Novel system to 30 June 2022. |
1 |
USD amount is calculated based on actual transactional (historical) exchange rates related to Renova funding. |
| • | Risk identification – threats and opportunities are identified and each is assigned an owner, or accountable individual. |
| • | Risk assessments – risks are assessed using appropriate and internationally recognised techniques to determine their potential impacts and likelihood, prioritise them and inform risk treatment options. |
| • | Risk treatment – controls are implemented to prevent, minimise and/or mitigate threats, and enable and/or enhance opportunities. |
| • | Monitoring and review – risks and controls are reviewed periodically and on an ad hoc basis (including where there are high-potential events or changes in the external environment) to evaluate performance. |
| • | Communication – relevant information is recorded in our enterprise risk management system to support continuous improvement and share risk intelligence across the Group. |
OPERATIONAL EVENTS |
| Risks associated with operational events in connection with our activities globally, resulting in significant adverse impacts on our people, communities, the environment or our business. |
Why is this important to BHP? |
| We engage in activities that have the potential to cause harm to our people and assets, communities, other stakeholders and/or the environment, including serious injuries, illness and fatalities, loss of infrastructure, amenities and livelihood, and damage to sites of cultural significance. An operational event at our operated or non-operated assets or through our value chain could also cause damage or disruptions to our assets and operations, impact our financial performance, result in litigation or class actions and cause long-term damage to our licence to operate and reputation. The potential physical impacts of climate change could increase the likelihood and/or severity of risks associated with operational events. Impacts of operational events may also be amplified if we fail to respond in a way that is consistent with our corporate values and stakeholder expectations. |
| Examples of potential threats |
| • Failure of a water or tailings storage facility, such as the tragic failure of the Fundão dam at Samarco in 2015 or a failure at one of our facilities in Australia, Chile, Peru, the United States, Canada or Brazil. • Unplanned fire events or explosions (on the surface and underground). • Geotechnical instability events (such as failure of underground excavations, unexpected large wall instabilities in our open pit mines, or potential interaction between our mining activities and community infrastructure or natural systems), including at our underground or open pit mines in Australia, Chile, Peru, the United States, Canada or Brazil. • Air, land (road and rail) and marine transportation events (such as aircraft crashes or vessel collisions, groundings or hydrocarbon release) that occur while transporting people, supplies or products to exploration, operation or customer locations, which include remote and environmentally sensitive areas in Australia, South America, Asia, the United States and Canada. • Critical infrastructure or hazardous materials containment failures, other occupational or process safety events or workplace exposures. • Operational events experienced by third parties, which may also result in unavailability of shared critical infrastructure (such as railway lines or ports) or transportation routes (such as the Port Hedland channel in Western Australia). |
ACCESSING KEY MARKETS |
| Risks associated with market concentration and our ability to sell and deliver products into existing and future key markets, impacting our economic efficiency. |
Why is this important to BHP? |
| We rely on the sale and delivery of the commodities we produce to customers around the world. Changes to laws, international trade arrangements, contractual terms or other requirements and/or geopolitical developments could result in physical, logistical or other disruptions to our operations in, or the sale or delivery of our commodities to, key markets. These disruptions could affect sales volumes or prices obtained for our products, adversely impacting our financial performance, results of operations and growth prospects. |
| Examples of potential threats |
| • Government actions, including economic sanctions, tariffs or other trade restrictions, imposed by or on countries where we operate or into which we sell or deliver our products may prevent BHP from trading or make it more difficult for BHP to trade in key markets. For example, the Ukraine conflict and corresponding implementation of economic sanctions, export controls and other restrictive measures by the United States, United Kingdom, European Union and other jurisdictions against Russia contributed to increased volatility for some of the commodities we sell and some of the key supplies we buy (including diesel and ammonia). • Physical disruptions to the delivery of our products to customers in key markets, including due to the disruption of shipping routes, closure or blockage of ports or land logistics (road or rail) or military conflict. In some cases, physical disruptions may be driven or intensified by weather, climate variability or other manifestations of climate change. • Legal or regulatory changes (such as royalties or taxes, port or import restrictions or customs requirements, shipping/maritime regulatory changes, restrictions on movements or imposition of quarantines, or changing environmental restrictions or regulations, including measures with respect to carbon-intensive industries or imports) and commercial changes (such as changes to the standards and requirements of customers) may adversely impact our ability to sell, deliver or realise full market value for our products. • Failure to maintain strong relationships with customers or changes to customer demands for our products may reduce our market share or adversely impact our financial performance. • Increasing geopolitical tensions (such as the escalation of events relating to the Ukraine conflict) may adversely affect our strategic and business planning decisions and/or increase the time it takes us to manage our access to key markets, particularly if we fail to detect or anticipate deviations in the geopolitical environment in a timely manner. |
OPTIMISING GROWTH AND PORTFOLIO RETURNS |
| Risks associated with our ability to position our asset portfolio to generate returns and value for shareholders, including through acquisitions, mergers and divestments. |
Why is this important to BHP? |
| We make decisions and take actions in pursuit of our strategy to optimise our asset portfolio and to secure and create growth options in future facing commodities (such as copper, nickel and potash). These may include active portfolio changes (such as divestment of our interests in BMC and Cerrejón, and merger of our Petroleum business with Woodside), as well as maturing organic growth options across our existing portfolio. A strategy that does not support BHP’s objectives and/or ill-timed execution of our strategy (including as a result of not having sector-leading talent and capabilities) or other circumstances may lead to a loss of value that impacts our ability to deliver returns to shareholders and fund our investment and expansion opportunities. It may also result in our asset portfolio being less resilient to movements in commodity prices, which are determined by or linked to prices in world markets. In the short term, this may reduce our cash flow, ability to access capital and our dividends. A failure to optimise our asset portfolio for structural movements in commodity prices over the long term may result in asset impairments and could adversely affect the results of our operations, financial performance and returns to investors. |
| Examples of potential threats |
| • Failure to optimise our portfolio through effective and efficient acquisitions, exploration, large project delivery, mergers, divestments or expansion of existing assets (including due to sub-optimal capital prioritisation) may adversely impact returns to investors. For example, a scarcity of growth options that align with our strategy could require us to mine deeper, lower-grade deposits, which may lead to higher operating and capital costs.• Failure to identify potential changes in commodity attractiveness and missed entry or commodity exit opportunities may result in decreased return on capital spend for, or overpayment to acquire or invest in, new assets or projects, stranded assets or reduced divestment proceeds. • Failure to achieve expected commercial objectives from assets or investments, such as cost savings, sales revenues or operational performance (including as a result of inaccurate commodity price assumptions or resources and reserves estimates), may result in returns that are lower than anticipated and loss of value. Impacts could be exacerbated by effects of the COVID-19 pandemic and Ukraine conflict, including supply chain disruptions (for example, disruption in the energy sector impacting our end-user markets), labour shortages, inflationary pressures on raw materials and unfavourable exchange rates, creating operational headwinds and challenging on-time and on-budget project delivery. |
| • Renegotiation or nullification of permits, inability to secure new permits or approvals, increased royalties, expropriation or nationalisation of our assets, or other legal, regulatory, political, judicial or fiscal or monetary policy instability or changes (for example, legislation, regulations or government policies implemented in Australia by the new federal government, which may include new rules governing the pay of contractors) may increase our costs or adversely impact our ability to achieve expected commercial objectives from assets or investments, access reserves, develop, maintain or operate our assets, enter new jurisdictions, or otherwise optimise our portfolio. • Inability to predict long-term trends in the supply, demand and price of commodities and optimise our asset portfolio accordingly may restrict our ability to generate long-term returns from the portfolio. For example, slowing economic growth in China due to factors such as the COVID-19 pandemic, political and trade tensions or the market volatility and uncertainty resulting from the Ukraine conflict may result in lower demand and prices for our products, which would adversely impact our portfolio returns.• Commodity prices have historically been and may continue to be subject to significant volatility, including due to global economic and geopolitical factors, industrial activity, commodity supply and demand (including inventory levels), technological change, product substitution, tariffs, interest rate movements and exchange rate fluctuations. Our usual policy and practice is to sell our products at prevailing market prices and, as such, movements in commodity prices may affect our financial performance. Long-term price volatility or sustained low prices may adversely impact our financial performance as we do not generally have the ability to offset costs through price increases. |
SIGNIFICANT SOCIAL OR ENVIRONMENTAL IMPACTS |
| Risks associated with significant impacts of our operations on and contributions to communities and environments throughout the life cycle of our assets and across our value chain. |
Why is this important to BHP? |
| The long-term viability of our business is closely connected to the wellbeing of the communities and environments where we have a presence. At any stage of the asset life cycle, our activities and operations may have or be seen to have significant adverse impacts on communities and environments. In these circumstances, we may fail to meet the evolving expectations of our stakeholders (including investors, governments, employees, suppliers, customers and Indigenous peoples and other community members) whose support is needed to realise our strategy and purpose. This could lead to loss of stakeholder support or regulatory approvals, increased taxes and regulation, enforcement action, litigation or class actions, or otherwise impact our licence to operate and adversely affect our reputation, ability to attract and retain talent, ability to access capital, operational continuity and financial performance. |
| Examples of potential threats |
| • Engaging in or being associated with activities (including through non-operated joint ventures and our value chain) that have or are perceived to have individual or cumulative adverse impacts on the environment, biodiversity and land management, water access and management, human rights or cultural heritage. |
| • Failing to meet stakeholder expectations in connection with our legal and regulatory obligations, relationships with Indigenous peoples, community wellbeing and the way we invest in communities or our approach to environment, climate change, biodiversity and land management, water access and management, human rights or cultural heritage priorities. |
| • Political, regulatory and judicial developments (such as constitutional reform in Chile that could lead to adjustments to water and other resource rights) could increase uncertainty in relation to our operating environment, requiring us to adjust our business plans or strategy. For example, changes to regulations may require us to modify mine plans, limit our access to reserves and resources, delay the timing or increase costs associated with closure and rehabilitation of assets, or expose BHP to unanticipated environmental or other legacy liabilities. |
| • Failing to identify and manage potential physical climate change risks to communities, biodiversity and ecosystems. For example, changes to species habitat or distribution as a result of sustained higher temperatures could result in land access restrictions or litigation, or limit our access to new opportunities. |
INADEQUATE BUSINESS RESILIENCE |
| Risks associated with unanticipated or unforeseeable adverse events and a failure of planning and preparedness to respond to, manage and recover from adverse events (including potential physical impacts of climate change). |
Why is this important to BHP? |
| In addition to the threats described in our other risk factors, our business could experience unanticipated, unforeseeable or other adverse events (internal or external) that could harm our people, disrupt our operations or value chain, or damage our assets or corporate offices, including our non-operated assets in which BHP has a non-controlling interest. A failure to identify or understand exposure, adequately prepare for these events (including maintaining business continuity plans) or build wider organisational resilience may inhibit our (or our third-party partners’) ability to respond and recover in an effective and efficient manner. This could cause material adverse impacts on our business, such as reduced ability to access resources, markets and the operational or other inputs required by our business, reduced production or sales of commodities, or increased regulation, which could adversely impact our financial performance, share price or reputation and could lead to litigation (including class actions). |
| Examples of potential threats |
| • Geopolitical, global economic, regional or local developments or adverse events, such as social unrest, strikes, work stoppages, labour disruptions, social activism, terrorism, bomb threats, economic slowdown, acts of war or other significant disruptions in areas where we operate or have interests. For example, production at Escondida in FY2022 was impacted by public road blockades associated with social unrest. |
| • Natural events, including earthquakes, tsunamis, hurricanes, cyclones, fires, solar flares and pandemics. For example, continued COVID-19 related absences contributed to a fall in production volumes in the March 2022 quarter for copper, iron ore, nickel and energy coal. |
| • Potential physical impacts of climate change, such as acute risks that are event driven (including increased frequency and severity of extreme weather events) and chronic risks resulting from longer-term changes in climate patterns. Hazards and impacts may include changes in precipitation patterns, water shortages, rising sea levels, increased storm intensity, prolonged extreme temperatures and increased drought, fire and tidal flooding. |
| • Failure by suppliers, contractors or joint venture partners to perform existing contracts or obligations (including due to insolvency), such as construction of large projects or supply of key inputs to our business (for example, consumables for our mining equipment). |
| • Failure of our risk management or other processes (including controls) to prepare for or manage any of the risks discussed in this ‘Risk factors’ section may inhibit our (or our third-party partners’) ability to manage any resulting adverse events and may disrupt our operations or adversely impact our financial performance or reputation. |
LOW-CARBON TRANSITION |
| Risks associated with the transition to a low-carbon economy. |
Why is this important to BHP? |
| Transition risks arise from policy, regulatory, legal, technological, market and other societal responses to the challenges posed by climate change and the transition to a low-carbon economy. As a world-leading resources company, BHP is exposed to a range of transition risks that could affect the execution of our strategy or our operational efficiency, asset values and growth options, resulting in a material adverse impact on our financial performance, share price or reputation, including litigation. The complex and pervasive nature of climate change means transition risks are interconnected with and may amplify our other risk factors. Additionally, the inherent uncertainty of potential societal responses to climate change may create a systemic risk to the global economy. |
| Examples of potential threats |
| • Introduction or improvement of low-carbon technologies or changes in customer preference for products that support the transition to a low-carbon economy may decrease demand for some of our products (which may be abrupt or unanticipated), increase our costs or decrease the availability of key inputs to production. For example: |
| • ‘Green steel’ technologies may reduce demand for our metallurgical coal or iron ore. |
| • Increased scrap-based steel production may reduce demand for our metallurgical coal and iron ore by limiting production that is required globally. |
| • New battery technologies that use less nickel could enter the market and reduce demand for our nickel products. |
| • Failure to address investor concerns on the potential impact of climate change on and from BHP’s portfolio and operations may result in reduced investor confidence. |
| • Social concerns around climate change may result in investors divesting our securities or pressure on financial institutions not to provide financing for our fossil fuel assets, which could limit our ability to access capital markets and potentially result in reduced access to financing or increased financing costs, or otherwise adversely impact our ability to optimise our portfolio. |
| • Perceived or actual misalignment of BHP’s climate actions (goals, targets and performance) with societal and investor expectations, or a failure to deliver our climate actions, may result in damage to our reputation, climate-related litigation (including class actions) or give rise to other adverse regulatory, legal or market responses. |
| • Sub-optimal selection, implementation or effectiveness of technology that is intended to contribute towards the delivery of our climate targets, goals and strategies, or unavailability of that technology (including due to a failure of external equipment manufacturers to deliver on schedule or competition for limited supply) could delay or increase costs in achieving our plans for operational decarbonisation. |
| • Changes in laws, regulations, policies, obligations, government actions and our ability to anticipate and respond to such changes, including GHG emission targets, restrictive licencing, carbon taxes, carbon offset regulations, border adjustments or the addition or removal of subsidies, may give rise to adverse regulatory, legal or market responses. For example, the implementation of regulations intended to reduce GHG emissions in the steel industry in China could adversely impact demand for our metallurgical coal and/or iron ore. |
ADOPTING TECHNOLOGIES AND MAINTAINING DIGITAL SECURITY |
| Risks associated with adopting and implementing new technologies, and maintaining the effectiveness of our existing digital landscape (including cyber defences) across our value chain. |
| Why is this important to BHP? |
| Our business and operational processes across our value chain are increasingly dependent on the effective application and adoption of technology, which we use as a lever to deliver on our current and future operational, financial and social objectives. This exposes BHP to risks originating from adopting or implementing new technologies, or failing to take appropriate action to position BHP for the digital future, which may impact the capabilities we require, the effectiveness and efficiency of our operations and our ability to compete effectively. We may also fail to maintain the effectiveness of our existing and future digital landscape, including cyber defences, exposing us to technology availability, reliability and cybersecurity risks. These could lead to operational events, commercial disruption (such as an inability to process or ship our products), corruption or loss of system data, misappropriation or loss of funds, unintended loss or disclosure of commercial or personal information, enforcement action or litigation. An inability to adequately maintain existing technology or implement critical new technology, or any sustained disruption to our existing technology, may also adversely affect our licence to operate, reputation, results of operations and financial performance. |
| Examples of potential threats |
| • Failure to invest in appropriate technologies or to keep pace with advancements in technology that support the pursuit of our objectives may adversely impact the effectiveness or efficiency of our business and erode our competitive advantage. For example, a failure to implement appropriate technologies that support our assets to produce higher-grade commodities or less waste from existing resources could limit our ability to sell our commodities or reduce costs. |
| • Failing to identify, access and secure necessary infrastructure and key inputs (including electricity, internet bandwidth, data, software, licences or other rights in intellectual property, hardware and talent) to support new technology innovations and advanced technologies may adversely affect our ability to adopt, operate or retain access to those technologies. This includes artificial intelligence and machine learning, process automation, robotics, data analytics, cloud computing, smart devices and remote working solutions. For example, adopting new technology to reduce GHG emissions through the use of alternative energy sources may require new infrastructure, while effective implementation of new digital technologies may be heavily dependent on access to relevant data. |
| • Failure or outage of our information or operational technology systems. |
| • Cyber events or attacks on our information or operational technology systems, including on third-party partners and suppliers (such as our cloud service providers). For example, a cyber attack could result in a failure of business-critical technology systems at one or more of our assets, which may reduce operational productivity and/or adversely impact safety. |
ETHICAL MISCONDUCT |
| Risks associated with actual or alleged deviation from societal or business expectations of ethical behaviour (including breaches of laws or regulations) and wider or cumulative organisational cultural failings, resulting in significant reputational impacts. |
Why is this important to BHP? |
| Actual or alleged conduct of BHP or our people or third-party partners that deviates from the standard of ethical behaviour expected of us could result in reputational damage or a breach of law or regulations. Such conduct includes fraud, corruption, anti-competitive behaviour, money laundering, breaching trade or financial sanctions, market manipulation, privacy breaches, ethical misconduct and wider organisational cultural failings. A failure to act ethically or legally may result in negative publicity, investigations, public inquiries, regulatory enforcement action, litigation or other civil or criminal proceedings, or increased regulation. It could also threaten the validity of our tenements or permits, or adversely impact our reputation, results of operations, financial performance or share price. Impacts may be amplified if our senior leaders fail to uphold BHP’s values or address actual or alleged misconduct in a way that is consistent with societal and stakeholder expectations. Our workplace culture may also be eroded, adversely affecting our ability to attract and retain talent. Risks and impacts are also heightened by the complex and continuously evolving legal and regulatory frameworks that apply to the jurisdictions where we operate and potentially conflicting obligations under different national laws. |
| Examples of potential threats |
| • Failing to prevent breaches of international standards, laws, regulations or other legal, regulatory, ethical, environmental, governance or compliance obligations, such as external misstatements, inaccurate financial or operational reporting or a breach of our continuous disclosure obligations. |
| • Corruption (for example, due to the acquisition of early-stage options in non-OECD countries), market conduct or anti-competitive behaviour, including in relation to our joint venture operations. |
| • Failing to comply with trade or financial sanctions (which are complex and subject to rapid change and may potentially result in conflicting obligations), health, safety and environmental laws and regulations, native title and other land right or tax or royalty obligations. |
| • Failing to protect our people from harm (including to mental and physical health) due to misconduct that takes place in connection with their work, such as discrimination or sexual harassment. |
| • | Our focus on safety and the wellbeing of our people, communities and the environment may increase operational resilience and stakeholder confidence, enhancing our ability to attract and retain talent and access (or lower the cost of) capital. |
| • | Collaborating with industry peers and relevant organisations on minimum standards (such as the internationally recognised Flight Safety Foundation’s Basic Aviation Risk Standard, Global Industry Standard on Tailings Management, Large Open Pit Project guidelines on open-pit mining design and management, and the Cave Mining 2040 Consortium on deep mining design and management) supports improvements to wider industry management of operational risks and may also identify opportunities to improve our own practices. |
| • | Planning, designing, constructing, operating, maintaining and monitoring surface and underground mines, water and tailings storage facilities, and other infrastructure and equipment in a manner designed to maintain structural integrity, prevent incidents and protect our people, assets, communities, the environment and other stakeholders. |
| • | Specifying minimum requirements and technical specifications, such as for transportation (including high-occupancy vehicles, aircraft and their operators) and geotechnical (including characterisation, design, ground control and monitoring), and compliance with operating specifications, industry codes and other relevant standards, including BHP’s mandatory minimum performance requirements. |
| • | Defining key governance roles, such as a dam owner (an internal BHP individual who is accountable for maintaining effective governance and integrity of each tailings storage facility) and providing training and qualifications for our people. |
| • | Inspections, technical reviews, audits and other assurance activities, such as independent dam safety reviews and geotechnical review boards. |
| • | Maintaining evacuation routes, supporting equipment, crisis and emergency response plans and business continuity plans. |
| • | Incorporating future climate projections into risks associated with operational events through ongoing assessment of potential physical climate change risks. |
| • | OFR 7.4 – Safety |
| • | OFR 7.18 – Tailings storage facilities |
| • | OFR 8 – Samarco |
| • | bhp.com/sustainability |
| • | Monitoring macroeconomic, societal, geopolitical and policy developments and trends may reveal new markets or commodities, or identify opportunities to strengthen secondary markets for existing products. |
| • | Developing strategic partnerships and strong, mutually beneficial relationships with our customers may enable us to create value. |
| • | Building a deep understanding of geopolitical threats and opportunities and their potential impacts on global trade flows and our business could enhance our strategy, business planning and response, providing a potential competitive advantage. |
| • | Identifying the potential for weather, climate variability or climate change to disrupt delivery of products and implementing management measures may increase the resilience of our operations and value chain. |
| • | Signal monitoring and building relationships with and understanding the perspectives of influential stakeholders may improve our ability to understand and provide input to policy development, and to respond to and manage any impacts from policy changes (such as trade policies). |
| • | Monitoring and assessing our ability to access key markets, and maintaining sales plans, product placement and business resilience strategies and relationships with relevant stakeholders. |
| • | Maintaining response plans for various scenarios (including physical disruptions of logistics) to mitigate disruptions to our ability to access key markets. |
| • | Monitoring geopolitical and macroeconomic developments and trends, including through signal monitoring and our enterprise-level watch list of emerging themes, to provide an early indication of events that could impact our ability to access key markets. |
| • | Identifying weather and/or climate-related vulnerabilities and implementing controls to mitigate disruptions to our ability to physically access key markets. |
| • | Diversifying our asset and commodity portfolio, such as our ongoing investment in potash through the Jansen Potash Project, to reduce exposure to market concentration risks. |
| • | Acquisition of new resources or acceleration of organic growth options in future facing commodities may strengthen and diversify our portfolio and protect and grow value over the long term. |
| • | Ability to predict long-term commodity demand, supply and price trends may lead to BHP being able to identify and acquire new future facing commodities and assets ahead of our competitors or exit from declining commodities in a timely manner, strengthening our portfolio and leading to long-term, higher portfolio returns. |
| • | BHP may be perceived as a welcome and valued or preferred partner for the development of new resource opportunities, enabling us to secure new assets or exploration opportunities to create long-term optionality in the portfolio. |
| • | Strategies, processes and frameworks to grow and protect our portfolio and to assist in delivering ongoing returns to shareholders include: |
| • | our exploration and business development programs, which focus on replenishing our resource base and enhancing our portfolio (including creating and securing more options in future facing commodities) |
| • | our long-term strategic outlook and ongoing strategic processes to assess our competitive advantage and enable the identification of threats to, or opportunities for, our portfolio through forecasting and scenario modelling |
| • | monitoring signals to interpret external events and trends, and designing commodity strategies and price protocols that are reviewed by management and the Board |
| • | our Capital Allocation Framework, corporate planning processes, investment approval processes and annual reviews (including resilience testing) of portfolio valuations |
| • | our balance sheet and liquidity framework, which is designed to maintain a robust balance sheet with sufficient liquidity and access to diverse sources of funding |
| • | Pursuing a considered approach to new country entry, including development of capability to operate in higher-risk jurisdictions, in order to support portfolio opportunities. |
| • | Further developing BHP’s social value proposition to position BHP as a preferred partner for the development of resource opportunities in line with the expectations of local communities, host governments and other global stakeholders. |
| • | Managing commodity price exposure through the diversity of commodities, markets, geographies and currencies provided by our portfolio, as well as our financial risk management practices in relation to our commercial activities. |
| • | OFR 3 – Positioning for the future |
| • | OFR 10 – Performance by commodity |
| • | Financial Statements note 23 ‘Financial risk management’ |
| • | Our support for responsible stewardship of natural resources may enhance the resilience of environments and communities to potential threats (including the potential physical impacts of climate change). For example, BHP has commenced a pilot study on developing a Natural Capital Account at a restored mine site to understand how we can better incorporate nature-related threats and opportunities into our strategic planning, risk management and asset allocation decisions. |
| • | Strong social performance, including sustainable mining and a focus on the wellbeing of communities, could generate competitive advantage in the jurisdictions where we operate. For example, BHP was recognised for our contribution to the development of female leaders in the Chilean mining sector (Inspirational Women in Mining Awards), which may enhance our attractiveness as a place to work and support talent retention. |
| • | Our global social value strategy may improve stakeholder relations, enhance community trust and increase investor confidence and demand for our commodities. |
| • | Greater clarity, transparency and standards associated with regulatory regimes that support and protect communities and the environment may increase requirements across our sector, generating competitive advantage for companies that have already invested in social and environmental performance. |
| • | Building our reputation for sustainable and responsible operating practices (such as through the Copper Mark, which was awarded to three of our copper assets in FY2022) may increase demand for some of our commodities and improve our access to talent and capital. |
| • | The Our Requirements for Community Our Requirements for Environment and Climate Change |
| • | Engaging in regular, open and transparent dialogue with stakeholders to better understand their expectations, concerns and interests, and undertaking research to better understand stakeholder perceptions. |
| • | Building social value into our decision-making process, along with financial considerations, including through our new social value framework and 2030 People, Planet and Prosperity goals. |
| • | Building stakeholder trust and contributing to environmental and community resilience, including through collaborating on shared challenges (such as climate change and water stewardship), enhanced external reporting of our operated assets’ potential impacts on biodiversity and maximising the value of social investments through our social investment strategy. |
| • | Conducting regular research and impact assessments for operated assets to better understand the social, environmental, human rights and economic context. This supports us to identify and analyse stakeholder, community and human rights impacts, including modern slavery risks and emerging issues. We also complete due diligence screening on suppliers through our Ethical Supply Chain and Transparency program. |
| • | Integrating closure into our planning, decision-making and other activities through the life cycle of our operated assets, as set out in our mandatory minimum performance requirements for closure. |
| • | OFR 6 – People and culture |
| • | OFR 7.8 – Climate change |
| • | OFR 7.10 – Community |
| • | OFR 7.11 – Human rights |
| • | OFR 7.13 – Indigenous peoples |
| • | OFR 7.14 – Social investment |
| • | OFR 7.15 – Environment |
| • | OFR 7.16 – Water |
| • | OFR 7.17 –Biodiversity and land |
| • | bhp.com/sustainability |
| • | Risk identification and management supports proactive, focused and prioritised deployment of resources to reduce exposure to adverse events. It may be used to inform priorities and strategies across BHP, supporting a proportionate and cost-effective response, which could provide a competitive advantage at a regional or global level. |
| • | Building wider organisational resilience may enable us to maintain dividends to shareholders amid adverse external events and make growth-generating, counter-cyclical investments, as well as to help us mitigate the impacts of unforeseeable adverse events. For example, we have developed new agile and remote ways of working in response to the COVID-19 pandemic, which may also increase our resilience to other adverse events. |
| • | Adapting to climate change across our operations and value chain could enhance the safety, productivity and climate resilience of our operated assets, position BHP as a supplier of choice and provide competitive advantage (for example, by fulfilling our commitment to security of supply). Support for climate vulnerable communities and ecosystems may also improve our social value proposition. |
| • | Implementing Group-wide controls to enhance business resilience, including BHP’s mandatory minimum performance requirements for security, crisis and emergency management and business continuity plans, and seeking to maintain an investment grade credit rating. |
| • | Monitoring our current state of readiness (preparedness, redundancy and resilience), including through scenario analysis and business resilience exercises, supporting organisational capability in our operations, functions and senior management to effectively and efficiently respond to and recover from adverse events should they materialise. |
| • | Monitoring the external environment, including political and economic factors, through signal monitoring, our geopolitical monitoring and public policy frameworks and our enterprise-level watch list of emerging themes, to support early identification of policy changes or adverse events for which we may need to increase preparedness. |
| • | Identifying security threats that could directly or indirectly impact our operations and people in countries of interest to BHP. |
| • | Implementing our Adaptation Strategy with respect to the physical risks of climate change, including requiring operated assets and functions to identify and progressively assess potential physical climate change risks (including to our value chain) and build climate change adaptation into their plans, activities and investments. |
| • | Sourcing quality, centralised climate data covering each of our operating locations so that our operated assets and functions have access to appropriate data to support climate studies that will inform investment decisions around enhancing our operational resilience. |
| • | BHP Climate Change Report 2020 |
| • | BHP Climate Transition Action Plan 2021 |
| • | OFR 7.8 – Climate change |
| • | OFR 7.12 – Security services |
| • | bhp.com/sustainability |
| • | Our copper, nickel, iron ore and metallurgical coal provide essential building blocks for renewable power generation and electric vehicles, and can play an important part in the transition to a low-carbon economy. |
| • | Our potash fertiliser options can promote more efficient and profitable agriculture and alleviate the increased competition for arable land. |
| • | Increased collaboration with customers, suppliers and original equipment manufacturers, such as BHP’s partnerships with HBIS Group, China Baowu, JFE, POSCO and Tata Steel to explore technologies to reduce GHG emissions across the steel value chain, can provide opportunities for the development of new products and markets. |
| • | Establishing public positions on, and mandatory minimum performance requirements for managing, climate change threats and opportunities, which are set out in our Climate Change Report 2020, our Climate Transition Action Plan 2021 and the Our Requirements for Environment and Climate Change |
| • | Using climate-related scenarios (including our Paris-aligned 1.5°C scenario), themes and signposts (such as monitoring policy, regulatory, legal, technological, market and other societal developments) to evaluate the resilience of our portfolio and inform our strategy. |
| • | Considering transition risks (including carbon prices) when making capital expenditure decisions or allocating capital through our Capital Allocation Framework, supporting the prioritisation of capital and investment approval processes. |
| • | Seeking to mitigate our exposure to risks arising from policy and regulation in our operating jurisdictions and markets by reducing our operational GHG emissions and taking a product stewardship approach to GHG emissions in our value chain. |
| • | Advocating for the introduction of an effective, long-term policy framework that can deliver a measured transition to a low-carbon economy. |
| • | BHP Climate Change Report 2020 |
| • | BHP Climate Transition Action Plan 2021 |
| • | OFR 3 – Positioning for the future |
| • | OFR 7.8 – Climate change |
| • | bhp.com/sustainability/climate-change |
| • | Applying digital solutions across our operations and value chain may unlock greater productivity and safety performance. For example, using predictive analytics to enable operations to identify asset condition and efficiencies may improve safety, production and equipment availability, and reduce maintenance and other costs. |
| • | Technology solutions to reduce GHG emissions may support BHP, our suppliers and customers in achieving climate action targets. For example, BHP has become a founding partner of Komatsu’s GHG Alliance in the ongoing development of zero GHG emissions haul trucks. |
| • | Developing and applying artificial intelligence in mine planning, remote operation and advanced robotic technologies may identify or provide access to previously unknown or inaccessible deposits and development of end-to-end autonomous mining systems. |
| • | Using digital simulations and predictive trend modelling may enable us to optimise the deployment of new technologies, such as automation and electrification, support early identification of process variances and faults, and support the marketing of our products to customers. |
| • | Our assets, functions and projects are responsible for managing localised or project-specific exposure to technology and cyber risks, including risks associated with business- critical technology systems. Enterprise-level risks that are specific to technology, such as those that pose a greater threat to our wider business and strategic opportunities, are generally managed by our global Technology team and other relevant stakeholders to support delivery of our technology strategy. |
| • | We collaborate with industry and research partners to develop technological solutions. |
| • | Our Technology Risk Committee oversees the management and improvement of technology risks and controls, and supports the embedment of a sustainable risk culture in our Technology team. |
| • | We employ a number of measures designed to protect against, detect and respond to cyber events or attacks, including BHP’s mandatory minimum performance requirements for technology and cybersecurity, cybersecurity performance requirements for suppliers, cybersecurity resilience programs, an enterprise security framework and cybersecurity standards, cybersecurity risk and control guidance, security awareness programs and training to build capability, security assessments and continuous monitoring, restricted physical access to hardware and crisis management plans. |
| • | OFR 2.2 |
| • | Our capability to manage ethical misconduct risks may expand portfolio growth options by providing greater assurance that we can operate legally and ethically in high-risk jurisdictions. |
| • | Managing ethical misconduct risks in line with societal and stakeholder expectations may distinguish BHP from competitors and enhance our ability to raise capital, attract and retain talent, engage with governments and communities in new jurisdictions, obtain permits, partner with external organisations or suppliers, or market our products to customers. |
| • | Playing a leading role in the management of ethical misconduct risks, such as sexual harassment risks, may help BHP to increase ethical and behavioural standards across the resources industry. |
| • | Setting the ‘tone from the top’ through Our Charter, which is central to our business and describes our purpose, values and how we measure success. |
| • | Implementing internal policies, standards, systems and processes for governance and compliance to support an appropriate culture and prioritise respectful behaviours at BHP, including: |
¡ |
Our Code of Conduct and BHP’s mandatory minimum performance requirements for business conduct, market disclosure and other matters |
¡ |
training on Our Code of Conduct and in relation to anti-corruption, market conduct and competition |
¡ |
ring fencing protocols to separate potentially competing businesses within BHP |
¡ |
governance and compliance processes, including classification of sensitive transactions, as well as accounting, procurement and other internal controls, and tailored monitoring of control effectiveness |
¡ |
oversight and engagement with high-risk areas by our Ethics and Investigations, Compliance and Internal Audit teams, and the Disclosure Committee |
¡ |
review and endorsement by our Compliance team of the highest-risk transactions, such as gifts and hospitality, engagement of third parties, community donations and sponsorships above defined thresholds |
¡ |
automated counterparty and transaction screening against lists of entities subject to trade sanctions |
¡ |
our EthicsPoint anonymous reporting service, supported by an ethics and investigations framework and central investigations team |
¡ |
our ‘Together we can stop sexual harassment’ campaign, launched across all our offices and sites in Australia, and ‘Stop for Safety’ sessions held globally by our leaders to set expectations around racism, sexual harassment and other disrespectful behaviours |
| • | Continuing to enforce Our Code of Conduct via appropriate investigations and responses including disciplinary action, in addition to deployment of appropriate safety controls to prevent harm. |
| • | Requiring anti-corruption and human rights risks to be considered as part of our new country entry approval process. |
| • | Our Charter and Our Code of Conduct |
| • | OFR 7.5 – Sexual harassment |
| • | OFR 7.7 – Ethics and business conduct |
| • | Corporate Governance Statement |
| Year ended 30 June US$M |
2022 |
2021 | ||||||||||
| Revenue |
16,849 |
15,726 | ||||||||||
| Underlying EBITDA |
8,565 |
8,489 | ||||||||||
| Net operating assets |
27,420 |
26,928 | ||||||||||
| Capital expenditure |
2,528 |
2,180 | ||||||||||
| Total copper production (kt) |
1,574 |
1,636 | ||||||||||
| Average realised prices |
||||||||||||
| Copper (US$/lb) |
4.16 |
3.81 | ||||||||||
| Escondida unit costs (US$M) |
FY2022 |
FY2021 | ||||||
| Revenue |
9,500 |
9,470 | ||||||
| Underlying EBITDA |
6,198 |
6,483 | ||||||
| |
|
|
|
|||||
| Gross costs |
3,302 |
2,987 | ||||||
| |
|
|
|
|||||
| Less: by-product credits |
430 |
478 | ||||||
| Less: freight |
230 |
162 | ||||||
| |
|
|
|
|||||
| Net costs |
2,642 |
2,347 | ||||||
| |
|
|
|
|||||
| Sales (kt) |
1,001 |
1,066 | ||||||
| Sales (Mlb) |
2,206 |
2,350 | ||||||
| |
|
|
|
|||||
| Cost per pound (US$) 1,2,3 |
1.20 |
1.00 | ||||||
| |
|
|
|
|||||
1 |
FY2022 based on average exchange rates of USD/CLP 811. |
2 |
FY2022 includes COVID-19 related costs of US$0.02 per pound, which was reported as an exceptional item in FY2021 (FY2021: US$0.03 per pound). |
3 |
FY2021 includes a one off gain from the optimised outcome from renegotiation of cancelled power contracts of US$0.04 per pound. |
| Year ended 30 June US$M |
2022 |
2021 | ||||||||
| Revenue |
30,767 |
34,475 | ||||||||
| Underlying EBITDA |
21,707 |
26,278 | ||||||||
| Net operating assets |
16,823 |
18,663 | ||||||||
| Capital expenditure |
1,848 |
2,188 | ||||||||
| Total iron ore production (Mt) |
253 |
254 | ||||||||
| Average realised prices |
||||||||||
| Iron ore (US$/wmt, FOB) |
113.10 |
130.56 | ||||||||
| WAIO unit costs (US$M) |
FY2022 |
FY2021 | ||||||
| Revenue |
30,632 |
34,337 | ||||||
| Underlying EBITDA |
21,788 |
26,270 | ||||||
| |
|
|
|
|||||
| Gross costs |
8,844 |
8,067 | ||||||
| |
|
|
|
|||||
| Less: freight 1 |
2,497 |
1,755 | ||||||
| Less: royalties |
2,134 |
2,577 | ||||||
| |
|
|
|
|||||
| Net costs |
4,213 |
3,735 | ||||||
| |
|
|
|
|||||
| Sales (kt, equity share) |
250,688 |
252,052 | ||||||
| |
|
|
|
|||||
| Cost per tonne (US$) 2,3 |
16.81 |
14.82 | ||||||
| |
|
|
|
|||||
1 |
Year on year increase of freight costs driven by higher diesel prices and vessel demand increases from global supply chain pressures relating to COVID-19. |
2 |
FY2022 based on an average realised exchange rate of AUD/USD 0.73. |
3 |
FY2022 includes COVID-19 related costs of US$0.50 per tonne (including US$0.22 per tonne relating to operations and US$0.28 per tonne relating to demurrage). FY2021 excluded COVID-19 related costs of US$0.51 per tonne (including US$0.25 per tonne relating to operations and US$0.26 per tonne relating to demurrage) that was reported as an exceptional item. In FY2021 an additional US$0.12 per tonne relating to capital projects was also reported as an exceptional item. |
| Year ended 30 June US$M |
2022 |
2021 | ||||||||
| Revenue |
15,549 |
5,154 | ||||||||
| Underlying EBITDA |
9,504 |
288 | ||||||||
| Net operating assets |
7,650 |
7,512 | ||||||||
| Capital expenditure |
621 |
579 | ||||||||
| Total metallurgical coal production (Mt) |
37 |
41 | ||||||||
| Total energy coal production (Mt) |
18 |
19 | ||||||||
| Average realised prices |
||||||||||
| Metallurgical coal (US$/t) |
347.10 |
106.64 | ||||||||
| Hard coking coal (HCC) (US$/t) |
366.82 |
112.72 | ||||||||
| Weak coking coal (WCC) (US$/t) |
296.51 |
89.62 | ||||||||
| Thermal coal (US$/t) |
216.78 |
58.42 | ||||||||
BMA unit costs 1 |
NSWEC unit costs |
|||||||||||||||
| US$M |
FY2022 |
FY2021 | FY2022 |
FY2021 | ||||||||||||
| Revenue |
10,254 |
3,537 | 3,034 |
839 | ||||||||||||
| Underlying EBITDA |
6,335 |
567 | 1,807 |
(169 | ) | |||||||||||
| |
|
|
|
|
|
|
|
|||||||||
| Gross costs |
3,919 |
2,970 | 1,227 |
1,008 | ||||||||||||
| |
|
|
|
|
|
|
|
|||||||||
| Less: freight |
50 |
54 | – |
– | ||||||||||||
| Less: royalties |
1,282 |
275 | 227 |
66 | ||||||||||||
| |
|
|
|
|
|
|
|
|||||||||
| Net costs |
2,587 |
2,641 | 1,000 |
942 | ||||||||||||
| |
|
|
|
|
|
|
|
|||||||||
| Sales (kt, equity share) |
29,049 |
31,958 | 14,124 |
14,626 | ||||||||||||
| |
|
|
|
|
|
|
|
|||||||||
| Cost per tonne (US$) 2,3 |
89.06 |
82.64 | 70.80 |
64.41 | ||||||||||||
| |
|
|
|
|
|
|
|
|||||||||
1 |
Queensland Coal unit costs no longer reported as the divestment of BHP’s 80 per cent interest in BMC to Stanmore Resources Limited was completed on 3 May 2022. |
2 |
FY2022 based on an average realised exchange rate of AUD/USD 0.73. |
3 |
FY2022 includes COVID-19 related costs of US$0.24 per tonne and US$0.57 per tonne, which was reported as an exceptional item in FY2021 (FY2021: US$0.98 and US$0.40 per tonne) relating to BMA and NSWEC respectively. |
Impact on profit after taxation from Continuing operations (US$M) |
Impact on Underlying EBITDA (US$M) |
|||||||
| US¢1/lb on copper price |
22 | 31 | ||||||
| US$1/t on iron ore price |
160 | 228 | ||||||
| US$1/t on metallurgical coal price |
16 | 23 | ||||||
| US$1/t on energy coal price |
9 | 13 | ||||||
| US¢1/lb on nickel price |
1 | 1 | ||||||
| Year ended 30 June |
2022 US$M |
2021 US$M Restated |
2020 US$M Restated |
|||||||||
| Continuing operations |
||||||||||||
| Revenue |
– |
– | – | |||||||||
| Other income |
840 |
34 | 489 | |||||||||
| Expenses excluding net finance costs, depreciation, amortisation and impairments |
(494 |
) |
(545 | ) | (1,019 | ) | ||||||
| Depreciation and amortisation |
– |
– | – | |||||||||
| Net impairments |
– |
(2,371 | ) | (409 | ) | |||||||
| Loss from equity accounted investments, related impairments and expenses |
(676 |
) |
(1,456 | ) | (508 | ) | ||||||
| |
|
|
|
|
|
|||||||
| Profit/(loss) from operations |
(330 |
) |
(4,338 | ) | (1,447 | ) | ||||||
| |
|
|
|
|
|
|||||||
| Financial expenses |
(290 |
) |
(85 | ) | (93 | ) | ||||||
| Financial income |
– |
– | – | |||||||||
| |
|
|
|
|
|
|||||||
| Net finance costs |
(290 |
) |
(85 | ) | (93 | ) | ||||||
| |
|
|
|
|
|
|||||||
| Profit/(loss) before taxation |
(620 |
) |
(4,423 | ) | (1,540 | ) | ||||||
| |
|
|
|
|
|
|||||||
| Income tax (expense)/benefit |
(454 |
) |
(1,057 | ) | 239 | |||||||
| Royalty-related taxation (net of income tax benefit) |
– |
– | – | |||||||||
| |
|
|
|
|
|
|||||||
| Total taxation (expense)/benefit |
(454 |
) |
(1,057 | ) | 239 | |||||||
| |
|
|
|
|
|
|||||||
| Profit/(loss) after taxation from Continuing operations |
(1,074 |
) |
(5,480 | ) | (1,301 | ) | ||||||
| |
|
|
|
|
|
|||||||
| Discontinued operations |
||||||||||||
| Profit/(loss) after taxation from Discontinued operations |
8,159 |
(317 | ) | (4 | ) | |||||||
| |
|
|
|
|
|
|||||||
| Profit/(loss) after taxation from Continuing and Discontinued operations |
7,085 |
(5,797 | ) | (1,305 | ) | |||||||
| |
|
|
|
|
|
|||||||
| Total exceptional items attributable to non-controlling interests |
– |
(24 | ) | (201 | ) | |||||||
| Total exceptional items attributable to BHP shareholders |
7,085 |
(5,773 | ) | (1,104 | ) | |||||||
| |
|
|
|
|
|
|||||||
| Exceptional items attributable to BHP shareholders per share (US cents) |
140.0 |
(114.2 | ) | (21.9 | ) | |||||||
| |
|
|
|
|
|
|||||||
| Weighted basic average number of shares (Million) |
5,061 |
5,057 | 5,057 | |||||||||
| |
|
|
|
|
|
|||||||
| Year ended 30 June |
2022 US$M |
2021 US$M |
2020 US$M |
|||||||||
| Profit after taxation from Continuing and Discontinued operations attributable to BHP shareholders |
30,900 |
11,304 | 7,956 | |||||||||
| Total exceptional items attributable to BHP shareholders 1 |
(7,085 |
) |
5,773 | 1,104 | ||||||||
| |
|
|
|
|
|
|||||||
| Underlying attributable profit |
23,815 |
17,077 | 9,060 | |||||||||
| |
|
|
|
|
|
|||||||
1 |
For more information refer to Financial Statements note 3 ‘Exceptional items’. |
| Year ended 30 June |
2022 US cents |
2021 US cents |
2020 US cents |
|||||||||
| Basic earnings per ordinary share |
610.6 |
223.5 | 157.3 | |||||||||
| Exceptional items attributable to BHP shareholders per share 1 |
(140.0 |
) |
114.2 | 21.9 | ||||||||
| |
|
|
|
|
|
|||||||
| Underlying basic earnings per ordinary share |
470.6 |
337.7 | 179.2 | |||||||||
| |
|
|
|
|
|
|||||||
1 |
For more information refer to Financial Statements note 3 ‘Exceptional items’. |
| Year ended 30 June |
2022 US$M |
2021 US$M Restated |
2020 US$M Restated |
|||||||||
| Profit after taxation from Continuing and Discontinued operations attributable to BHP shareholders |
30,900 |
11,304 | 7,956 | |||||||||
| (Profit)/loss after taxation from Discontinued operations attributable to members of BHP |
(10,655 |
) |
225 | (108 | ) | |||||||
| Total exceptional items attributable to BHP shareholders 1 |
(7,085 |
) |
5,773 | 1,104 | ||||||||
| Total exceptional items attributable to BHP shareholders for Discontinued operations 2 |
8,159 |
(317 | ) | (4 | ) | |||||||
| |
|
|
|
|
|
|||||||
| Underlying attributable profit – Continuing operations |
21,319 |
16,985 | 8,948 | |||||||||
| |
|
|
|
|
|
|||||||
1 |
For more information refer to Financial Statements note 3 ‘Exceptional items’. |
2 |
For more information refer to Financial Statements note 27 ‘Discontinued operations’. |
| Year ended 30 June |
2022 US$M |
2021 US$M Restated |
2020 US$M Restated |
|||||||||
| Underlying attributable profit – Continuing operations |
21,319 |
16,985 | 8,948 | |||||||||
| Weighted basic average number of shares (Million) |
5,061 |
5,057 | 5,057 | |||||||||
| |
|
|
|
|
|
|||||||
| Underlying attributable earnings per ordinary share – Continuing operations (US cents) |
421.2 |
335.9 | 176.9 | |||||||||
| |
|
|
|
|
|
|||||||
| Year ended 30 June |
2022 US$M |
2021 US$M Restated |
2020 US$M Restated |
|||||||||
| Profit from operations |
34,106 |
25,515 | 13,683 | |||||||||
| Exceptional items included in profit from operations 1 |
330 |
4,338 | 1,447 | |||||||||
| |
|
|
|
|
|
|||||||
| Underlying EBIT |
34,436 |
29,853 | 15,130 | |||||||||
| |
|
|
|
|
|
|||||||
| Depreciation and amortisation expense |
5,683 |
5,084 | 4,667 | |||||||||
| Net impairments |
515 |
2,507 | 482 | |||||||||
| Exceptional item included in Depreciation, amortisation and impairments 1 |
– |
(2,371 | ) | (409 | ) | |||||||
| |
|
|
|
|
|
|||||||
| Underlying EBITDA |
40,634 |
35,073 | 19,870 | |||||||||
| |
|
|
|
|
|
|||||||
1 |
For more information refer to Financial Statements note 3 ‘Exceptional items’. |
| Year ended 30 June 2022 US$M |
Copper |
Iron Ore |
Coal |
Group and unallocated items/ eliminations 2 |
Total Group |
|||||||||||||||
| Profit from operations |
6,249 |
18,823 |
9,582 |
(548 |
) |
34,106 |
||||||||||||||
| Exceptional items included in profit from operations 1 |
81 |
648 |
(849 |
) |
450 |
330 |
||||||||||||||
| Depreciation and amortisation expense |
1,765 |
2,203 |
762 |
953 |
5,683 |
|||||||||||||||
| Net impairments |
470 |
33 |
9 |
3 |
515 |
|||||||||||||||
| |
|
|
|
|
|
|
|
|
|
|||||||||||
| Underlying EBITDA |
8,565 |
21,707 |
9,504 |
858 |
40,634 |
|||||||||||||||
| |
|
|
|
|
|
|
|
|
|
|||||||||||
| Year ended 30 June 2021 US$M Restated |
Copper | Iron Ore | Coal | Group and unallocated items/ eliminations 2 |
Total Group | |||||||||||||||
| Profit from operations |
6,665 | 22,975 | (2,144 | ) | (1,981 | ) | 25,515 | |||||||||||||
| Exceptional items included in profit from operations 1 |
144 | 1,319 | 1,567 | 1,308 | 4,338 | |||||||||||||||
| Depreciation and amortisation expense |
1,608 | 1,971 | 845 | 660 | 5,084 | |||||||||||||||
| Net impairments |
72 | 13 | 1,077 | 1,345 | 2,507 | |||||||||||||||
| Exceptional item included in Depreciation, amortisation and impairments 1 |
– | – | (1,057 | ) | (1,314 | ) | (2,371 | ) | ||||||||||||
| |
|
|
|
|
|
|
|
|
|
|||||||||||
| Underlying EBITDA |
8,489 | 26,278 | 288 | 18 | 35,073 | |||||||||||||||
| |
|
|
|
|
|
|
|
|
|
|||||||||||
| Year ended 30 June 2020 US$M Restated |
Copper | Iron Ore | Coal | Group and unallocated items/ eliminations 2 |
Total Group | |||||||||||||||
| Profit from operations |
1,362 | 12,310 | 793 | (782 | ) | 13,683 | ||||||||||||||
| Exceptional items included in profit from operations 1 |
1,228 | 614 | 18 | (413 | ) | 1,447 | ||||||||||||||
| Depreciation and amortisation expense |
1,740 | 1,608 | 807 | 512 | 4,667 | |||||||||||||||
| Net impairments |
426 | 22 | 14 | 20 | 482 | |||||||||||||||
| Exceptional item included in Depreciation, amortisation and impairments 1 |
(409 | ) | – | – | – | (409 | ) | |||||||||||||
| |
|
|
|
|
|
|
|
|
|
|||||||||||
| Underlying EBITDA |
4,347 | 14,554 | 1,632 | (663 | ) | 19,870 | ||||||||||||||
| |
|
|
|
|
|
|
|
|
|
|||||||||||
1 |
For more information refer to Financial Statements note 3 ‘Exceptional items’. |
2 |
Group and unallocated items includes functions, other unallocated operations, including Potash, Nickel West, legacy assets, and consolidation adjustments. |
| Year ended 30 June 2022 US$M |
Profit from operations |
Exceptional items included in profit from operations 1 |
Depreciation and amortisation |
Net impairments |
Exceptional items included in Depreciation, amortisation and impairments 1 |
Underlying EBITDA |
||||||||||||||||||
| Potash |
(149 |
) |
– |
2 |
– |
– |
(147 |
) | ||||||||||||||||
| Nickel West |
327 |
– |
91 |
2 |
– |
420 |
||||||||||||||||||
| Corporate, legacy assets and eliminations |
(726 |
) |
450 |
860 |
1 |
– |
585 |
|||||||||||||||||
| |
|
|
|
|
|
|
|
|
|
|
|
|||||||||||||
| Total |
(548 |
) |
450 |
953 |
3 |
– |
858 |
|||||||||||||||||
| |
|
|
|
|
|
|
|
|
|
|
|
|||||||||||||
| Year ended 30 June 2021 US$M Restated |
Profit from operations |
Exceptional items included in profit from operations 1 |
Depreciation and amortisation |
Net impairments |
Exceptional items included in Depreciation, amortisation and impairments 1 |
Underlying EBITDA |
||||||||||||||||||
| Potash |
(1,489 | ) | 1,320 | 2 | 1,314 | (1,314 | ) | (167 | ) | |||||||||||||||
| Nickel West |
146 | 3 | 79 | 31 | – | 259 | ||||||||||||||||||
| Corporate, legacy assets and eliminations |
(638 | ) | (15 | ) | 579 | – | – | (74 | ) | |||||||||||||||
| |
|
|
|
|
|
|
|
|
|
|
|
|||||||||||||
| Total |
(1,981 | ) | 1,308 | 660 | 1,345 | (1,314 | ) | 18 | ||||||||||||||||
| |
|
|
|
|
|
|
|
|
|
|
|
|||||||||||||
| Year ended 30 June 2020 US$M Restated |
Profit from operations |
Exceptional items included in profit from operations 1 |
Depreciation and amortisation |
Net impairments |
Exceptional items included in Depreciation, amortisation and impairments 1 |
Underlying EBITDA |
||||||||||||||||||
| Potash |
(130 | ) | – | 3 | – | – | (127 | ) | ||||||||||||||||
| Nickel West |
(113 | ) | 5 | 68 | 3 | – | (37 | ) | ||||||||||||||||
| Corporate, legacy assets and eliminations |
(539 | ) | (418 | ) | 441 | 17 | – | (499 | ) | |||||||||||||||
| |
|
|
|
|
|
|
|
|
|
|
|
|||||||||||||
| Total |
(782 | ) | (413 | ) | 512 | 20 | – | (663 | ) | |||||||||||||||
| |
|
|
|
|
|
|
|
|
|
|
|
|||||||||||||
1 |
For more information refer to Financial Statements note 3 ‘Exceptional items’. |
| Year ended 30 June 2022 US$M |
Copper |
Iron Ore |
Coal |
Group and unallocated items/ eliminations 1 |
Total Group |
|||||||||||||||
| Revenue – Group production |
13,946 |
30,748 |
15,549 |
1,860 |
62,103 |
|||||||||||||||
| Revenue – Third-party products |
2,903 |
19 |
– |
73 |
2,995 |
|||||||||||||||
| |
|
|
|
|
|
|
|
|
|
|||||||||||
| Revenue |
16,849 |
30,767 |
15,549 |
1,933 |
65,098 |
|||||||||||||||
| |
|
|
|
|
|
|
|
|
|
|||||||||||
| Underlying EBITDA – Group production |
8,529 |
21,707 |
9,504 |
858 |
40,598 |
|||||||||||||||
| Underlying EBITDA – Third-party products |
36 |
– |
– |
– |
36 |
|||||||||||||||
| |
|
|
|
|
|
|
|
|
|
|||||||||||
| Underlying EBITDA 2 |
8,565 |
21,707 |
9,504 |
858 |
40,634 |
|||||||||||||||
| |
|
|
|
|
|
|
|
|
|
|||||||||||
| Segment contribution to the Group’s Underlying EBITDA 3 |
22% |
54% |
24% |
100% |
||||||||||||||||
| Underlying EBITDA margin 4 |
61% |
71% |
61% |
65% |
||||||||||||||||
| Year ended 30 June 2021 US$M Restated |
Copper | Iron Ore | Coal | Group and unallocated items/ eliminations 1 |
Total Group | |||||||||||||||
| Revenue – Group production |
13,482 | 34,457 | 5,154 | 1,543 | 54,636 | |||||||||||||||
| Revenue – Third-party products |
2,244 | 18 | – | 23 | 2,285 | |||||||||||||||
| |
|
|
|
|
|
|
|
|
|
|||||||||||
| Revenue |
15,726 | 34,475 | 5,154 | 1,566 | 56,921 | |||||||||||||||
| |
|
|
|
|
|
|
|
|
|
|||||||||||
| Underlying EBITDA – Group production |
8,425 | 26,277 | 288 | 18 | 35,008 | |||||||||||||||
| Underlying EBITDA – Third-party products |
64 | 1 | – | – | 65 | |||||||||||||||
| |
|
|
|
|
|
|
|
|
|
|||||||||||
| Underlying EBITDA 2 |
8,489 | 26,278 | 288 | 18 | 35,073 | |||||||||||||||
| |
|
|
|
|
|
|
|
|
|
|||||||||||
| Segment contribution to the Group’s Underlying EBITDA 3 |
24% | 75% | 1% | 100% | ||||||||||||||||
| Underlying EBITDA margin 4 |
62% | 76% | 6% | 64% | ||||||||||||||||
| Year ended 30 June 2020 US$M Restated |
Copper | Iron Ore | Coal | Group and unallocated items/ eliminations 1 |
Total Group | |||||||||||||||
| Revenue – Group production |
9,577 | 20,782 | 6,242 | 1,191 | 37,792 | |||||||||||||||
| Revenue – Third-party products |
1,089 | 15 | – | 28 | 1,132 | |||||||||||||||
| |
|
|
|
|
|
|
|
|
|
|||||||||||
| Revenue |
10,666 | 20,797 | 6,242 | 1,219 | 38,924 | |||||||||||||||
| |
|
|
|
|
|
|
|
|
|
|||||||||||
| Underlying EBITDA – Group production |
4,306 | 14,561 | 1,632 | (663 | ) | 19,836 | ||||||||||||||
| Underlying EBITDA – Third-party products |
41 | (7 | ) | – | – | 34 | ||||||||||||||
| |
|
|
|
|
|
|
|
|
|
|||||||||||
| Underlying EBITDA 2 |
4,347 | 14,554 | 1,632 | (663 | ) | 19,870 | ||||||||||||||
| |
|
|
|
|
|
|
|
|
|
|||||||||||
| Segment contribution to the Group’s Underlying EBITDA 3 |
21% | 71% | 8% | 100% | ||||||||||||||||
| Underlying EBITDA margin 4 |
45% | 70% | 26% | 52% | ||||||||||||||||
1 |
Group and unallocated items includes functions, other unallocated operations, including Potash, Nickel West, legacy assets, and consolidation adjustments. Revenue not attributable to reportable segments comprises the sale of freight and fuel to third parties. Exploration and technology activities are recognised within relevant segments. |
2 |
We differentiate sales of our production from sales of third-party products to better measure the operational profitability of our operations as a percentage of revenue. These tables show the breakdown between our production and third-party products, which is necessary for the calculation of the Underlying EBITDA margin and margin on third-party products. |
| • | Production variability and occasional shortfalls from our assets means that we sometimes source third-party materials to ensure a steady supply of product to our customers. |
| • | To optimise our supply chain outcomes, we may buy physical product from third parties. |
| • | To support the development of liquid markets, we will sometimes source third-party physical products and manage risk through both the physical and financial markets. |
3 |
Percentage contribution to Group Underlying EBITDA, excluding Group and unallocated items. |
4 |
Underlying EBITDA margin excludes third-party products. |
2022 |
2021 (Restated) | 2020 (Restated) | ||||||||||||||||||||||||||||||||||
| Year ended 30 June |
Profit before taxation US$M |
Income tax expense US$M |
% |
Profit before taxation US$M |
Income tax expense US$M |
% | Profit before taxation US$M |
Income tax expense US$M |
% | |||||||||||||||||||||||||||
| Statutory effective tax rate |
33,137 |
(10,737 |
) |
32.4 |
24,292 | (10,616 | ) | 43.7 | 12,825 | (4,197 | ) | 32.7 | ||||||||||||||||||||||||
| Adjusted for: |
||||||||||||||||||||||||||||||||||||
| Exchange rate movements |
– |
(233 |
) |
– | (33 | ) | – | 41 | ||||||||||||||||||||||||||||
| Exceptional items 1 |
620 |
454 |
4,423 | 1,057 | 1,540 | (239 | ) | |||||||||||||||||||||||||||||
| |
|
|
|
|
|
|
|
|
|
|
|
|
|
|
|
|
|
|||||||||||||||||||
| Adjusted effective tax rate |
33,757 |
(10,516 |
) |
31.2 |
28,715 | (9,592 | ) | 33.4 | 14,365 | (4,395 | ) | 30.6 | ||||||||||||||||||||||||
| |
|
|
|
|
|
|
|
|
|
|
|
|
|
|
|
|
|
|||||||||||||||||||
1 |
For more information refer to Financial Statements note 3 ‘Exceptional items’. |
| Year ended 30 June |
2022 US$M |
2021 US$M Restated |
2020 US$M Restated |
|||||||||
| Capital expenditure (purchases of property, plant and equipment) |
5,855 |
5,612 | 5,991 | |||||||||
| Add: Exploration expenditure |
256 |
192 | 176 | |||||||||
| |
|
|
|
|
|
|||||||
| Capital and exploration expenditure (cash basis) – Continuing operations |
6,111 |
5,804 | 6,167 | |||||||||
| |
|
|
|
|
|
|||||||
| Capital expenditure (purchases of property, plant and equipment) – Discontinued operations |
1,050 |
994 | 909 | |||||||||
| Add: Exploration expenditure – Discontinued operations |
384 |
322 | 564 | |||||||||
| |
|
|
|
|
|
|||||||
| Capital and exploration expenditure (cash basis) – Discontinued operations |
1,434 |
1,316 | 1,473 | |||||||||
| |
|
|
|
|
|
|||||||
| Capital and exploration expenditure (cash basis) – Total operations |
7,545 |
7,120 | 7,640 | |||||||||
| |
|
|
|
|
|
|||||||
| Year ended 30 June |
2022 US$M |
2021 US$M Restated |
2020 US$M Restated |
|||||||||
| Net operating cash flows from Continuing operations |
29,285 |
25,883 | 14,685 | |||||||||
| Net investing cash flows from Continuing operations |
(4,973 |
) |
(6,325 | ) | (6,583 | ) | ||||||
| |
|
|
|
|
|
|||||||
| Free cash flow – Continuing operations |
24,312 |
19,558 | 8,102 | |||||||||
| |
|
|
|
|
|
|||||||
| Net operating cash flows from Discontinued operations |
2,889 |
1,351 | 1,021 | |||||||||
| Net investing cash flows from Discontinued operations |
(904 |
) |
(1,520 | ) | (1,033 | ) | ||||||
| Net cash completion payment on merger of Petroleum with Woodside |
(683 |
) |
– | – | ||||||||
| Cash and cash equivalents disposed on merger of Petroleum with Woodside |
(399 |
) |
– | – | ||||||||
| |
|
|
|
|
|
|||||||
| Free cash flow – Discontinued operations |
903 |
(169 | ) | (12 | ) | |||||||
| |
|
|
|
|
|
|||||||
| Free cash flow – Total operations |
25,215 |
19,389 | 8,090 | |||||||||
| |
|
|
|
|
|
|||||||
| Year ended 30 June |
2022 US$M |
2021 US$M |
2020 US$M |
|||||||||
| Interest bearing liabilities – Current |
2,622 |
2,628 | 5,012 | |||||||||
| Interest bearing liabilities – Non current |
13,806 |
18,355 | 22,036 | |||||||||
| |
|
|
|
|
|
|||||||
| Total interest bearing liabilities |
16,428 |
20,983 | 27,048 | |||||||||
| |
|
|
|
|
|
|||||||
| Comprising: |
||||||||||||
| Borrowing |
13,852 |
17,087 | 23,605 | |||||||||
| Lease liabilities |
2,576 |
3,896 | 3,443 | |||||||||
| |
|
|
|
|
|
|||||||
| Less: Lease liability associated with index-linked freight contracts |
274 |
1,025 | 1,160 | |||||||||
| |
|
|
|
|
|
|||||||
| Less: Cash and cash equivalents |
17,236 |
15,246 | 13,426 | |||||||||
| |
|
|
|
|
|
|||||||
| Less: Net debt management related instruments 1 |
(1,688 |
) |
557 | 433 | ||||||||
| Less: Net cash management related instruments 2 |
273 |
34 | (15 | ) | ||||||||
| |
|
|
|
|
|
|||||||
| Less: Total derivatives included in net debt |
(1,415 |
) |
591 | 418 | ||||||||
| |
|
|
|
|
|
|||||||
| Net debt |
333 |
4,121 | 12,044 | |||||||||
| |
|
|
|
|
|
|||||||
| Net assets |
48,766 |
55,605 | 52,175 | |||||||||
| |
|
|
|
|
|
|||||||
| Gearing |
0.7% |
6.9% | 18.8% | |||||||||
| |
|
|
|
|
|
|||||||
1 |
Represents the net cross currency and interest rate swaps included within current and non-current other financial assets and liabilities. |
2 |
Represents the net forward exchange contracts related to cash management included within current and non-current other financial assets and liabilities. |
| Year ended 30 June |
2022 US$M |
2021 US$M |
||||||
| Net debt at the beginning of the period |
(4,121 |
) |
(12,044 | ) | ||||
| |
|
|
|
|||||
| Net operating cash flows |
32,174 |
27,234 | ||||||
| Net investing cash flows |
(6,959 |
) |
(7,845 | ) | ||||
| Net financing cash flows |
(22,767 |
) |
(17,922 | ) | ||||
| |
|
|
|
|||||
| Net increase in cash and cash equivalents from Continuing and Discontinued operations |
2,448 |
1,467 | ||||||
| |
|
|
|
|||||
| Carrying value of interest bearing liability net repayments |
2,227 |
7,433 | ||||||
| |
|
|
|
|||||
| Carrying value of debt related instruments settlements/(proceeds) |
– |
(167 | ) | |||||
| |
|
|
|
|||||
| Carrying value of cash management related instruments (proceeds)/settlements |
(247 |
) |
403 | |||||
| |
|
|
|
|||||
| Fair value adjustment on debt (including debt related instruments) |
5 |
58 | ||||||
| Foreign exchange impacts on cash (including cash management related instruments) |
27 |
(1 | ) | |||||
| Lease additions |
(736 |
) |
(1,079 | ) | ||||
| Divestment and demerger of subsidiaries and operations |
492 |
– | ||||||
| Other |
(428 |
) |
(191 | ) | ||||
| |
|
|
|
|||||
| Non-cash movements |
(640 |
) |
(1,213 | ) | ||||
| |
|
|
|
|||||
| Net debt at the end of the period |
(333 |
) |
(4,121 | ) | ||||
| |
|
|
|
|||||
| Year ended 30 June |
2022 US$M |
2021 US$M Restated |
||||||
| Net assets |
48,766 |
55,605 | ||||||
| Less: Non-operating assets |
||||||||
| Cash and cash equivalents |
(17,236 |
) |
(15,246 | ) | ||||
| Trade and other receivables 1 |
(72 |
) |
(280 | ) | ||||
| Other financial assets 2 |
(1,363 |
) |
(1,516 | ) | ||||
| Current tax assets |
(263 |
) |
(279 | ) | ||||
| Deferred tax assets |
(56 |
) |
(1,912 | ) | ||||
| Assets held for sale |
– |
(324 | ) | |||||
| Petroleum Discontinued operations operating assets 3 |
– |
(13,757 | ) | |||||
| |
|
|
|
|||||
| Add: Non-operating liabilities |
||||||||
| Trade and other payables 4 |
201 |
227 | ||||||
| Interest bearing liabilities |
16,428 |
20,983 | ||||||
| Other financial liabilities 5 |
1,851 |
588 | ||||||
| Current tax payable |
3,032 |
2,800 | ||||||
| Non-current tax payable |
87 |
120 | ||||||
| Deferred tax liabilities |
3,063 |
3,314 | ||||||
| Liabilities directly associated with the assets held for sale |
– |
17 | ||||||
| Petroleum Discontinued operations operating liabilities 3 |
– |
5,684 | ||||||
| |
|
|
|
|||||
| Net operating assets |
54,438 |
56,024 | ||||||
| |
|
|
|
|||||
| Net operating assets |
||||||||
| Copper |
27,420 |
26,928 | ||||||
| Iron Ore |
16,823 |
18,663 | ||||||
| Coal |
7,650 |
7,512 | ||||||
| Group and unallocated items 6 |
2,545 |
2,921 | ||||||
| |
|
|
|
|||||
| Total |
54,438 |
56,024 | ||||||
| |
|
|
|
|||||
1 |
Represents loans to associates, external finance receivable and accrued interest receivable included within other receivables. |
2 |
Represents cross currency and interest rate swaps, forward exchange contracts related to cash management and investment in shares, other investments and receivables contingent on outcome of future events relating to mining and regulatory approvals. |
3 |
Represents the Petroleum operating assets and operating liabilities as at 30 June 2021 that were merged with Woodside on 1 June 2022. |
4 |
Represents accrued interest payable included within other payables. |
5 |
Represents cross currency and interest rate swaps and forward exchange contracts related to cash management. |
6 |
Group and unallocated items include functions, other unallocated operations including Potash, Nickel West, legacy assets, and consolidation adjustments. |
Revenue US$M |
Total expenses, Other income and Loss from equity accounted investments US$M |
Profit from operations US$M |
Depreciation, amortisation and impairments and Exceptional Items US$M |
Underlying EBITDA US$M |
||||||||||||||||
| Year ended 30 June 2021 (Restated) |
||||||||||||||||||||
| Revenue |
56,921 |
|||||||||||||||||||
| Other income |
380 |
|||||||||||||||||||
| Expenses excluding net finance costs |
(30,871 |
) |
||||||||||||||||||
| Loss from equity accounted investments, related impairments and expenses |
(915 |
) |
||||||||||||||||||
| |
|
|||||||||||||||||||
| Total other income, expenses excluding net finance costs and Loss from equity accounted investments, related impairments and expenses |
(31,406 |
) |
||||||||||||||||||
| |
|
|||||||||||||||||||
| Profit from operations |
25,515 |
|||||||||||||||||||
| Depreciation, amortisation and impairments 1 |
7,591 |
|||||||||||||||||||
| Exceptional item included in Depreciation, amortisation and impairments |
(2,371 |
) |
||||||||||||||||||
| Exceptional items |
4,338 |
|||||||||||||||||||
| |
|
|||||||||||||||||||
| Underlying EBITDA |
35,073 |
|||||||||||||||||||
| |
|
|
|
|
|
|
|
|
|
|||||||||||
| Change in sales prices |
7,267 | (673 | ) | 6,594 |
– | 6,594 |
||||||||||||||
| Price-linked costs |
– | (1,047 | ) | (1,047 |
) |
– | (1,047 |
) | ||||||||||||
| |
|
|
|
|
|
|
|
|
|
|||||||||||
| Net price impact |
7,267 | (1,720 | ) | 5,547 |
– | 5,547 |
||||||||||||||
| |
|
|
|
|
|
|
|
|
|
|||||||||||
| Change in volumes |
(1,235 | ) | 23 | (1,212 |
) |
– | (1,212 |
) | ||||||||||||
| |
|
|
|
|
|
|
|
|
|
|||||||||||
| Operating cash costs |
– | (473 | ) | (473 |
) |
– | (473 |
) | ||||||||||||
| Exploration and business development |
– | (67 | ) | (67 |
) |
– | (67 |
) | ||||||||||||
| |
|
|
|
|
|
|
|
|
|
|||||||||||
| Change in controllable cash costs 2 |
– | (540 | ) | (540 |
) |
– | (540 |
) | ||||||||||||
| |
|
|
|
|
|
|
|
|
|
|||||||||||
| Exchange rates |
(3 | ) | 1,183 | 1,180 |
– | 1,180 |
||||||||||||||
| Inflation on costs |
– | (867 | ) | (867 |
) |
– | (867 |
) | ||||||||||||
| Fuel, energy, and consumable price movements |
– | (660 | ) | (660 |
) |
– | (660 |
) | ||||||||||||
| Non-cash |
– | (3 | ) | (3 |
) |
– | (3 |
) | ||||||||||||
| One-off items |
– | – | – |
– | – |
|||||||||||||||
| |
|
|
|
|
|
|
|
|
|
|||||||||||
| Change in other costs |
(3 | ) | (347 | ) | (350 |
) |
– | (350 |
) | |||||||||||
| |
|
|
|
|
|
|
|
|
|
|||||||||||
| Asset sales |
– | 2 | 2 |
– | 2 |
|||||||||||||||
| Ceased and sold operations |
1,482 | 186 | 1,668 |
– | 1,668 |
|||||||||||||||
| Other |
666 | (220 | ) | 446 |
– | 446 |
||||||||||||||
| |
|
|
|
|
|
|
|
|
|
|||||||||||
| Depreciation, amortisation and impairments |
– | (978 | ) | (978 |
) |
978 | – |
|||||||||||||
| Exceptional items |
– | 4,008 | 4,008 |
(4,008 | ) | – |
||||||||||||||
| |
|
|
|
|
|
|
|
|
|
|||||||||||
| Year ended 30 June 2022 |
||||||||||||||||||||
| Revenue |
65,098 |
|||||||||||||||||||
| Other income |
1,398 |
|||||||||||||||||||
| Expenses excluding net finance costs |
(32,371 |
) |
||||||||||||||||||
| Loss from equity accounted investments, related impairments and expenses |
(19 |
) |
||||||||||||||||||
| |
|
|||||||||||||||||||
| Total other income, expenses excluding net finance costs and Loss from equity accounted investments, related impairments and expenses |
(30,992 |
) |
||||||||||||||||||
| |
|
|||||||||||||||||||
| Profit from operations |
34,106 |
|||||||||||||||||||
| Depreciation, amortisation and impairments 1 |
6,198 |
|||||||||||||||||||
| Exceptional item included in Depreciation, amortisation and impairments |
– |
|||||||||||||||||||
| Exceptional items |
330 |
|||||||||||||||||||
| |
|
|||||||||||||||||||
| Underlying EBITDA |
40,634 |
|||||||||||||||||||
| |
|
|||||||||||||||||||
1 |
Depreciation and impairments that we classify as exceptional items are excluded from depreciation, amortisation and impairments. Depreciation, amortisation and impairments includes non-exceptional impairments of US$515 million (FY2021: US$136 million). |
2 |
Collectively, we refer to the change in operating cash costs and change in exploration and business development as Change in controllable cash costs. Operating cash costs by definition do not include non-cash costs. The change in operating cash costs also excludes the impact of exchange rates and inflation, changes in fuel, energy costs and consumable costs, changes in exploration and business development costs and one-off items. These items are excluded so as to provide a consistent measurement of changes in costs across all segments, based on the factors that are within the control and responsibility of the segment. |
| Year ended 30 June |
2022 US$M |
2021 US$M |
2020 US$M |
|||||||||
| Profit after taxation from Continuing and Discontinued operations |
33,055 |
13,451 | 8,736 | |||||||||
| Exceptional items 1 |
(7,085 |
) |
5,797 | 1,305 | ||||||||
| |
|
|
|
|
|
|||||||
| Subtotal |
25,970 |
19,248 | 10,041 | |||||||||
| |
|
|
|
|
|
|||||||
| Adjusted for: |
||||||||||||
| Net finance costs |
1,128 |
1,305 | 911 | |||||||||
| Exceptional items included within net finance costs 1 |
(290 |
) |
(85 | ) | (93 | ) | ||||||
| Income tax expense on net finance costs |
(287 |
) |
(337 | ) | (267 | ) | ||||||
| |
|
|
|
|
|
|||||||
| Profit after taxation excluding net finance costs and exceptional items |
26,521 |
20,131 | 10,592 | |||||||||
| |
|
|
|
|
|
|||||||
| Net assets at the beginning of the period |
55,605 |
52,175 | 51,753 | |||||||||
| Net debt at the beginning of the period |
4,121 |
12,044 | 9,446 | |||||||||
| |
|
|
|
|
|
|||||||
| Capital employed at the beginning of the period |
59,726 |
64,219 | 61,199 | |||||||||
| |
|
|
|
|
|
|||||||
| Net assets at the end of the period |
48,766 |
55,605 | 52,175 | |||||||||
| Net debt at the end of the period |
333 |
4,121 | 12,044 | |||||||||
| |
|
|
|
|
|
|||||||
| Capital employed at the end of the period |
49,099 |
59,726 | 64,219 | |||||||||
| |
|
|
|
|
|
|||||||
| Average capital employed |
54,413 |
61,973 | 62,709 | |||||||||
| |
|
|
|
|
|
|||||||
| Underlying return on capital employed |
48.7% |
32.5% | 16.9% | |||||||||
| |
|
|
|
|
|
|||||||
1 |
For more information refer to Financial Statements note 3 ‘Exceptional items’. |
| Year ended 30 June 2022 US$M |
Copper |
Iron Ore |
Coal |
Group and unallocated items/ eliminations 1 |
Total Continuing |
Petroleum Discontinued operations |
Total Group |
|||||||||||||||||||||
| Profit after taxation excluding net finance costs and exceptional items |
3,981 |
13,896 |
6,293 |
(256 |
) |
23,914 |
2,607 |
26,521 |
||||||||||||||||||||
| Average capital employed |
24,310 |
15,275 |
6,893 |
3,196 |
49,674 |
4,739 |
54,413 |
|||||||||||||||||||||
| |
|
|
|
|
|
|
|
|
|
|
|
|
|
|||||||||||||||
| Underlying return on capital employed |
16% |
91% |
91% |
– |
48.1% |
– |
48.7% |
|||||||||||||||||||||
| |
|
|
|
|
|
|
|
|
|
|
|
|
|
|||||||||||||||
| Year ended 30 June 2021 US$M Restated |
Copper | Iron Ore | Coal | Group and unallocated items/ eliminations 1 |
Total Continuing |
Petroleum Discontinued operations |
Total Group |
|||||||||||||||||||||
| Profit after taxation excluding net finance costs and exceptional items |
4,191 | 16,640 | (454 | ) | (395 | ) | 19,982 | 149 | 20,131 | |||||||||||||||||||
| Average capital employed |
23,710 | 16,042 | 8,262 | 4,470 | 52,484 | 9,489 | 61,973 | |||||||||||||||||||||
| |
|
|
|
|
|
|
|
|
|
|
|
|
|
|||||||||||||||
| Underlying return on capital employed |
18% | 104% | (5% | ) | – | 38.1% | 1.6% | 32.5% | ||||||||||||||||||||
| |
|
|
|
|
|
|
|
|
|
|
|
|
|
|||||||||||||||
1 |
Group and unallocated items includes functions, other unallocated operations including Potash, Nickel West, legacy assets and consolidation adjustments. |
| Year ended 30 June 2022 US$M |
Western Australia Iron Ore |
BHP Mitsubishi Alliance |
Antamina |
Nickel West |
Escondida |
Pampa Norte |
Olympic Dam |
Potash |
New South Wales Energy Coal 1 |
Other |
Total Continuing |
Petroleum Discontinued operations |
Total Group |
|||||||||||||||||||||||||||||||||||||||
| Profit after taxation excluding net finance costs and exceptional items |
14,051 |
4,153 |
684 |
250 |
3,346 |
81 |
(9 |
) |
(123 |
) |
1,309 |
172 |
23,914 |
2,607 |
26,521 |
|||||||||||||||||||||||||||||||||||||
| Average capital employed |
18,783 |
6,725 |
1,284 |
650 |
9,891 |
4,380 |
8,660 |
3,321 |
(413 |
) |
(3,607 |
) |
49,674 |
4,739 |
54,413 |
|||||||||||||||||||||||||||||||||||||
| |
|
|
|
|
|
|
|
|
|
|
|
|
|
|
|
|
|
|
|
|
|
|
|
|
|
|||||||||||||||||||||||||||
| Underlying return on capital employed |
75% |
62% |
53% |
38% |
34% |
2% |
(0 |
)% |
(4 |
)% |
– |
– |
48.1% |
– |
48.7% |
|||||||||||||||||||||||||||||||||||||
| |
|
|
|
|
|
|
|
|
|
|
|
|
|
|
|
|
|
|
|
|
|
|
|
|
|
|||||||||||||||||||||||||||
| Year ended 30 June 2021 US$M Restated |
Western Australia Iron Ore |
BHP Mitsubishi Alliance |
Antamina | Nickel West |
Escondida | Pampa Norte |
Olympic Dam |
Potash | New South Wales Energy Coal |
Other | Total Continuing |
Petroleum Discontinued operations |
Total Group |
|||||||||||||||||||||||||||||||||||||||
| Profit after taxation excluding net finance costs and exceptional items |
16,665 | (13 | ) | 593 | 136 | 3,281 | 302 | 214 | 5 | (203 | ) | (998 | ) | 19,982 | 149 | 20,131 | ||||||||||||||||||||||||||||||||||||
| Average capital employed |
18,661 | 6,796 | 1,353 | 295 | 10,353 | 3,760 | 8,021 | 3,710 | 269 | (734 | ) | 52,484 | 9,489 | 61,973 | ||||||||||||||||||||||||||||||||||||||
| |
|
|
|
|
|
|
|
|
|
|
|
|
|
|
|
|
|
|
|
|
|
|
|
|
|
|||||||||||||||||||||||||||
| Underlying return on capital employed |
89% | (0% | ) | 44% | 46% | 32% | 8% | 3% | 0% | (75% | ) | – | 38.1% | 1.6% | 32.5% | |||||||||||||||||||||||||||||||||||||
| |
|
|
|
|
|
|
|
|
|
|
|
|
|
|
|
|
|
|
|
|
|
|
|
|
|
|||||||||||||||||||||||||||
1 |
NSWEC has not been shown as ROCE is distorted by negative capital employed due to the rehabilitation provision being the primary balance remaining on Balance Sheet following previous impairments. |
Non-IFRS financialinformation |
Reasons why we believe the non-IFRS financial information are useful |
Calculation methodology | ||
| Underlying attributable profit |
Allows the comparability of underlying financial performance by excluding the impacts of exceptional items. Allows the comparability of underlying financial performance by excluding the impacts of exceptional items and the contribution of Discontinued operations and is also the basis on which our dividend payout ratio policy is applied. |
Profit after taxation from Continuing and Discontinued operations attributable to BHP shareholders excluding any exceptional items attributable to BHP shareholders. | ||
| Underlying attributable profit – Continuing operations |
Underlying attributable profit from Continuing operations also excludes the contribution of Discontinued operations from the above metrics. | |||
| Underlying basic earnings per share |
On a per share basis, allows the comparability of underlying financial performance by excluding the impacts of exceptional items. On a per share basis, allows the comparability of underlying financial performance by excluding the impacts of exceptional items and the contribution of Discontinued operations. |
Underlying attributable profit divided by the weighted basic average number of shares. | ||
| Underlying basic earnings per share – Continuing operations |
Underlying attributable profit – Continuing operations divided by the weighted basic average number of shares. | |||
| Underlying EBITDA |
Used to help assess current operational profitability excluding the impacts of sunk costs (i.e. depreciation from initial investment). Each is a measure that management uses internally to assess the performance of the Group’s segments and make decisions on the allocation of resources. |
Earnings before net finance costs, depreciation, amortisation and impairments, taxation expense, Discontinued operations and exceptional items. Underlying EBITDA includes BHP’s share of profit/(loss) from investments accounted for using the equity method including net finance costs, depreciation, amortisation and impairments and taxation expense/(benefit). | ||
| Underlying EBITDA margin |
Underlying EBITDA excluding third-party product EBITDA, divided by revenue excluding third-party product revenue. | |||
| Underlying EBIT |
Used to help assess current operational profitability excluding net finance costs and taxation expense (each of which are managed at the Group level) as well as Discontinued operations and any exceptional items. |
Earnings before net finance costs, taxation expense, Discontinued operations and any exceptional items. Underlying EBIT includes BHP’s share of profit/(loss) from investments accounted for using the equity method including net finance costs and taxation expense/(benefit). | ||
| Profit from operations |
Earnings before net finance costs, taxation expense and Discontinued operations. Profit from operations includes Revenue, Other income, Expenses excluding net finance costs and BHP’s share of profit/(loss) from investments accounted for using the equity method including net finance costs and taxation expense/(benefit). |
Non-IFRS financialinformation |
Reasons why we believe the non-IFRS financial information are useful |
Calculation methodology | ||
| Capital and exploration expenditure |
Used as part of our Capital Allocation Framework to assess efficient deployment of capital. Represents the total outflows of our operational investing expenditure. Represents the total outflows of our operational investing expenditure excluding the contribution of Discontinued operations. |
Purchases of property, plant and equipment and exploration expenditure including the contribution of Discontinued operations | ||
| Capital and exploration expenditure – Continuing operations |
Purchases of property, plant and equipment and exploration expenditure. | |||
| Free cash flow |
It is a key measure used as part of our Capital Allocation Framework. Reflects our operational cash performance inclusive of investment expenditure, which helps to highlight how much cash was generated in the period to be available for the servicing of debt and distribution to shareholders. Reflects our operational cash performance inclusive of investment expenditure, but excluding the contribution of Discontinued operations. |
Net operating cash flows less net investing cash flows. | ||
| Free cash flow – Continuing operations |
Net operating cash flows from Continuing operations less net investing cash flows from Continuing operations. | |||
| Net debt |
Net debt shows the position of gross debt less index-linked freight contracts offset by cash immediately available to pay debt if required and any associated derivative financial instruments. Liability associated with index-linked freight contracts, which are required to be remeasured to the prevailing freight index at each reporting date, are excluded from the net debt calculation due to the short-term volatility of the index they relate to not aligning with how the Group uses net debt for decision making in relation to the Capital Allocation Framework. Net debt includes the fair value of derivative financial instruments used to hedge cash and borrowings to reflect the Group’s risk management strategy of reducing the volatility of net debt caused by fluctuations in foreign exchange and interest rates. Net debt, along with the gearing ratio, is used to monitor the Group’s capital management by relating net debt relative to equity from shareholders. |
Interest bearing liabilities less liability associated with index-linked freight contracts less cash and cash equivalents less net cross currency and interest rate swaps less net cash management related instruments for the Group at the reporting date. | ||
| Gearing ratio |
Ratio of Net debt to Net debt plus Net assets. | |||
| Net operating assets |
Enables a clearer view of the assets deployed to generate earnings by highlighting the net operating assets of the business separate from the financing and tax balances. This measure helps provide an indicator of the underlying performance of our assets and enhances comparability between them. |
Operating assets net of operating liabilities, including the carrying value of equity accounted investments and predominantly excludes cash balances, loans to associates, interest bearing liabilities, derivatives hedging our net debt, assets held for sale, liabilities directly associated with assets held for sale and tax balances. |
Non-IFRS financialinformation |
Reasons why we believe the non-IFRS financial information are useful |
Calculation methodology | ||
| Underlying return on capital employed (ROCE) |
Indicator of the Group’s capital efficiency and is provided on an underlying basis to allow comparability of underlying financial performance by excluding the impacts of exceptional items. |
Profit after taxation excluding exceptional items and net finance costs (after taxation) divided by average capital employed. Profit after taxation excluding exceptional items and net finance costs (after taxation) is profit after taxation from Continuing and Discontinued operations excluding exceptional items, net finance costs and the estimated taxation impact of net finance costs. These are annualised for a half year end reporting period. The estimated tax impact is calculated using a prima facie taxation rate on net finance costs (excluding any foreign exchange impact). Average capital employed is calculated as the average of net assets less net debt for the last two reporting periods. | ||
| Adjusted effective tax rate |
Provides an underlying tax basis to allow comparability of underlying financial performance by excluding the impacts of exceptional items. |
Total taxation expense/(benefit) excluding exceptional items and exchange rate movements included in taxation expense/(benefit) divided by Profit before taxation from Continuing operations excluding exceptional items. | ||
| Unit cost |
Used to assess the controllable financial performance of the Group’s assets for each unit of production. Unit costs are adjusted for site specific non controllable factors to enhance comparability between the Group’s assets. |
Ratio of net costs of the assets to the equity share of sales tonnage. Net costs is defined as revenue less Underlying EBITDA and excludes freight and other costs, depending on the nature of each asset. Freight is excluded as the Group believes it provides a similar basis of comparison to our peer group. Escondida unit costs exclude: • by-product credits being the favourable impact of by-products (such as gold or silver) to determine the directly attributable costs of copper production.WAIO, BMA and NSWEC unit costs exclude: • royalties as these are costs that are not deemed to be under the Group’s control, and the Group believes exclusion provides a similar basis of comparison to our peer group. |
Principal factor |
Method of calculation | |
Change in sales prices |
Change in average realised price for each operation from the prior period to the current period, multiplied by current period sales volumes. | |
Price-linked costs |
Change in price-linked costs (mainly royalties) for each operation from the prior period to the current period, multiplied by current period sales volumes. | |
Change in volumes |
Change in sales volumes for each operation multiplied by the prior year average realised price less variable unit cost. | |
Controllable cash costs |
Total of operating cash costs and exploration and business development costs. | |
Operating cash costs |
Change in total costs, other than price-linked costs, exchange rates, inflation on costs, fuel, energy, and consumable price movements, non-cash costs and one-off items as defined below for each operation from the prior period to the current period. | |
Exploration and business development |
Exploration and business development expense in the current period minus exploration and business development expense in the prior period. | |
Exchange rates |
Change in exchange rate multiplied by current period local currency revenue and expenses. | |
Inflation on costs |
Change in inflation rate applied to expenses with contractual links to inflation indexes, other than depreciation and amortisation, price-linked costs, exploration and business development expenses, expenses in ceased and sold operations and expenses in new and acquired operations. | |
Fuel, energy, and consumable price movements |
Fuel and energy expense and price differences above inflation on consumables in the current period minus fuel and energy expense in the prior period. | |
Non-cash |
Change in net impact of capitalisation and depletion of deferred stripping from the prior period to the current period. | |
One-off items |
Change in costs exceeding a pre-determined threshold associated with an unexpected event that had not occurred in the last two years and is not reasonably likely to occur within the next two years. | |
Asset sales |
Profit/(loss) on the sale of assets or operations in the current period minus profit/(loss) on sale of assets or operations in the prior period. | |
Ceased and sold operations |
Underlying EBITDA for operations that ceased or were sold in the current period minus Underlying EBITDA for operations that ceased or were sold in the prior period. | |
Share of profit/(loss) from equity accounted investments |
Share of profit/(loss) from equity accounted investments for the current period minus share of profit/(loss) from equity accounted investments in the prior period. | |
Other |
Variances not explained by the above factors. |
| • | the fourth edition of the ASX Corporate Governance Council’s Corporate Governance Principles and Recommendations (ASX Fourth Edition); and |
| • | the governance requirements that apply to us as a result of our London Stock Exchange and New York Stock Exchange (NYSE) listings and our registration with the Securities Exchange Commission (SEC) in the United States. |
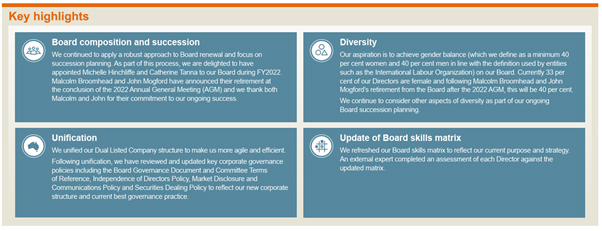
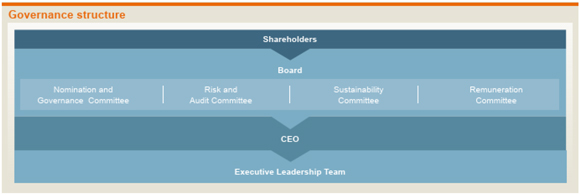

| • | CEO appointment and determination of the terms of the appointment |
| • | approval of the appointment of Executive Leadership Team (ELT) members, and material changes to the organisational structure involving direct reports to the CEO |
| • | strategy, annual budgets, balance sheet management and funding strategy |
| • | determination of commitments, capital and non-capital items, acquisitions and divestments above specified limits |
| • | performance assessment of the CEO and the Group |
| • | approving the Group’s values, Our Code of Conduct |
| • | management of Board composition, processes and performance |
| • | determination and adoption of documents (including the publication of reports and statements to shareholders) that are required by the Group’s constitutional documents, statute or by other external regulation |
| • | briefings and development sessions to provide each Director with a deeper understanding of the activities, environment, key issues and direction of the assets, along with broader sustainability and geopolitical considerations |
| • | site visits to provide insights into key issues at the site and to provide an opportunity for direct engagement with stakeholders |
| • | engagement with the Forum on Corporate Responsibility (FCR), which comprises civil society leaders in various fields of sustainability, to discuss FCR members’ views on current and emerging trends and risks |
| • | provide the breadth and depth of understanding necessary to effectively create long-term shareholder value |
| • | protect and promote the interests of BHP and the creation of social value |
| • | ensure the talent, capability and culture of BHP to support the long-term delivery of our strategy |
Skills and attributes |
Number of Directors |
|||
| Mining Senior executive who has deep operating or technical mining experience with a large company operating in multiple countries; successfully optimised and led a suite of large, global, complex operating assets that have delivered consistent and sustaining levels of high performance (related to cost, returns and throughput); successfully led exploration projects with proven results and performance; delivered large capital projects that have been successful in terms of performance and returns; and a proven record in terms of health, safety and environmental performance and results. |
4 | |||
| Global experience Global experience gained from working, managing business units and residing in multiple geographies over an extended period of time, including a deep understanding of and experience with global markets, and macro-political and economic environments. |
10 | |||
| Strategy Senior executive who has had accountability for enterprise-wide strategy development and implementation in industries with long cycles, and developing and leading business transformation strategies. |
12 | |||
| Commodity value chain and customers End-to-end |
10 | |||
| Financial acumen Extensive experience and the capability to evaluate financial statements and understand key financial drivers of the business, bringing a deep understanding of corporate finance and internal financial controls. |
12 | |||
| Operating risk Extensive experience with the development and oversight of complex frameworks focused on the identification, assessment and assurance of operational workplace, health, safety and environmental risks. |
11 | |||
| Technology Recent experience and expertise with the development, selection and implementation of leading and business transforming technology and innovation, and responding to digital disruption. |
6 | |||
| Capital allocation and cost efficiency Extensive direct experience gained through a senior executive role in capital allocation discipline, cost efficiency and cash flow, with proven long-term performance. |
10 | |||
| Social value, community and stakeholder engagement Extensive track record of positive external stakeholder engagement including in relation to community issues and social responsibility. In-depth understanding of public policy, government relations and the intersection between value generation and corporate reputation. |
8 | |||
| • | Review of skills and experience matrix |
| • | Identification of suitable Non-executive Director candidates |
| • | Board and Committee succession |
| • | Partnering with search firms regarding candidate searches |
| • | Board evaluation and Director development |
| • | 2022 training and development program |
| • | Director induction |
| • | Independence of Non-executive Directors |
| • | Authorisation of situations of actual or potential conflict |
| • | Crisis management |
| • | Accounting matters for consideration, materiality limits, half-year and full-year results |
| • | Sarbanes-Oxley Act of 2002 (SOX) compliance |
| • | Financial governance procedures |
| • | Funding loan and guarantee updates |
| • | Samarco dam failure provision, including related provisions and contingent liabilities |
| • | Carrying value of other long-term assets |
| • | Climate change in financial reporting |
| • | Closure and rehabilitation provisions |
| • | Disputes and litigation updates |
| • | Status and results of the external audit |
| • | Management and External Auditor closed sessions |
| • | Audit plan and review of the External Auditor’s performance |
| • | External Auditor independence and non-audit services |
| • | Material risk reports including updates on BHP’s Risk Framework, our most significant risks, performance against risk appetite, emerging risks and signals, and risk culture |
| • | Internal audit reports, annual internal audit plan and review of performance of the Internal Audit team |
| • | Compliance, Ethics and Investigations reports including on sexual harassment, regulatory compliance reports, and grievance and investigation processes |
| • | Reserves and resources updates |
| • | Review of key HSEC risks |
| • | Site visits and asset deep dives that include updates on key HSEC matters and HSEC performance and an opportunity to engage directly with the workforce |
| • | Review of internal audit reports and approval of the HSEC components of the internal audit plan |
| • | Review of the HSE function and Group HSE Officer |
| • | Review of sustainability reporting, including consideration of processes for preparation and assurance provided by EY |
| • | Review of BHP’s Modern Slavery Statement |
| • | Review of BHP’s performance on HSEC matters, including cultural heritage, community relations, greenhouse gas emissions targets and goals, closure and rehabilitation, biodiversity and human rights |
| • | Monitoring against the FY2018–FY2022 HSEC targets |
| • | Approving and recommending to the Board, the Group’s 2030 goals which form part of the new social value framework |
| • | Review of performance outcomes under the FY2022 HSEC performance metrics and considering HSEC performance metrics for FY2023 |
| • | Remuneration of the CEO, other ELT members and the Group Company Secretary |
| • | Remuneration arrangements for ELT members upon appointment |
| • | The impact of the COVID-19 pandemic on remuneration |
| • | Considering remuneration implications of unification and the merger of Petroleum and Woodside Energy Group Limited |
| • | Performance measures, performance levels and incentive award outcomes |
| • | Long-Term Incentive Plan sector peer group review |
| • | Chair fees |
| • | Remuneration by gender |
| • | Annual Remuneration Report |
| • | Shareholder engagement |
| • | Shareplus enrolment update |
| • | Induction, training and development program |
| • | Board Committee procedures, including closed sessions |

| • | reviewing the terms of engagement of the External Auditor |
| • | considering the external audit plan, in particular to gain assurance that it is tailored to reflect changes in circumstances from the prior year |
| • | meeting with the audit partners, particularly the lead audit engagement partners, throughout the year and without management present |
| • | discussing with the audit engagement partners the skills and experience of the broader audit team |
| • | considering the quality of the External Auditor’s performance following the completion of the audit |
| • | Audit services – work that constitutes the agreed scope of the statutory audit and includes the statutory audits of BHP and its entities (including interim reviews).The RAC monitors the audit services engagements and if necessary, approves any changes in terms and conditions resulting from changes in audit scope, Group structure or other relevant events. |
| • | Audit-related and other assurance services – work that is outside the scope of the statutory audit but is consistent with the role of the external statutory auditor. This category includes work that is reasonably related to the performance of an audit or review and is a logical extension of the audit or review scope, is of an assurance or compliance nature and is work that the external auditors must or are best placed to undertake and is permissible under the relevant applicable standard. |
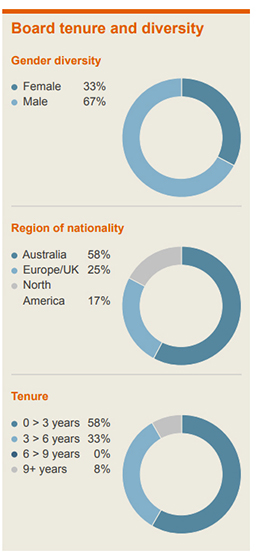
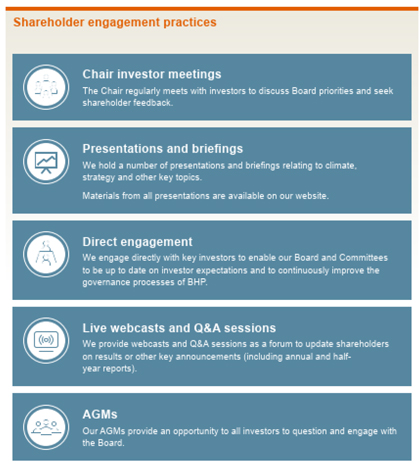
| • | discussions with major institutional investors and proxy advisers in relation to the Climate Transition Action Plan 2021, and obtaining shareholder approval at the 2021 AGMs |
| • | presentations and briefings provided to investors about the merger of BHP’s Petroleum business with Woodside |
| • | communications to investors about the unification of our Dual Listed Company structure, including General Meetings in Australia and London for investors to directly engage with the Board on this topic |
| • | live webcasts and Q&A sessions with senior leaders for shareholders to directly ask questions of management |
| • | an investor briefing on social value which included the launch of our 2030 social value goals |


Board |
Risk and Audit Committee |
Nomination and Governance Committee |
Remuneration Committee |
Sustainability Committee |
||||||||||||||||
| Terry Bowen |
15/15 | 11/11 | 5/5 | – | – | |||||||||||||||
| Malcolm Broomhead |
15/15 | – | 2/2 | 1 |
– | 2/2 | 1 | |||||||||||||
| Xiaoqun Clever |
15/15 | 11/11 | – | – | – | |||||||||||||||
| Ian Cockerill |
15/15 | 11/11 | – | – | 5/5 | |||||||||||||||
| Anita Frew 2 |
7/7 | 5/5 | – | 2/2 | – | |||||||||||||||
| Gary Goldberg 3 |
15/15 | – | 5/5 | 5/5 | 5/5 | |||||||||||||||
| Mike Henry |
15/15 | – | – | – | – | |||||||||||||||
| Michelle Hinchliffe 4 |
4/4 | 2/2 | – | – | – | |||||||||||||||
| Susan Kilsby 5 |
7/7 | – | – | 2/2 | 5 |
– | ||||||||||||||
| Ken MacKenzie |
15/15 | – | 5/5 | – | – | |||||||||||||||
| John Mogford 6 |
15/15 | – | 5/5 | – | 5/5 | |||||||||||||||
| Christine O’Reilly |
15/15 | 11/11 | 5/5 | 5/5 | – | |||||||||||||||
| Catherine Tanna 7 |
3/3 | – | – | 2/2 | 2/2 | |||||||||||||||
| Dion Weisler |
15/15 | – | – | 5/5 | 3/3 | 8 | ||||||||||||||
1 |
Malcolm Broomhead ceased being a member of the Nomination and Governance Committee and Sustainability Committee on 11 November 2021 |
2 |
Anita Frew served as a Non-executive Director from 15 September 2015 until her retirement as a member of the Board, Risk and Audit Committee and Remuneration Committee on 11 November 2021 |
3 |
Gary Goldberg ceased being a member of the Remuneration Committee on 17 June 2022. He became Chair of the Sustainability Committee on 18 June 2022 |
4 |
Michelle Hinchliffe became a member of the Board and the Risk and Audit Committee on 1 March 2022 |
5 |
Susan Kilsby served as a Non-executive Director from 1 April 2019 until her retirement as a member of the Board and the Remuneration Committee on 11 November 2021 |
6 |
John Mogford ceased being a member of the Nomination and Governance Committee on 17 June 2022. He ceased being the Chair of the Sustainability Committee on 17 June 2022, but remains a member of this Committee |
7 |
Catherine Tanna became a member of the Board, Remuneration Committee and Sustainability Committee on 4 April 2022 |
8 |
Dion Weisler became a member of the Sustainability Committee on 12 November 2021 |
| Period |
A Total number of shares purchased and transferred to employees to satisfy employee awards |
B Average price paid per share 1 US$ |
C Total number of shares purchased as part of publicly announced plans or programs |
D Maximum number of shares that may yet be purchased under the plans or programs |
||||||||||||||||
BHP Group Limited 2 |
BHP Group Plc (now BHP Group (UK) Limited) |
|||||||||||||||||||
| 1 Jul 2021 to 31 Jul 2021 |
– | – | – | – | 211,207,180 | 3 | ||||||||||||||
| 1 Aug 2021 to 31 Aug 2021 |
63,567 | 32.08 | – | – | 211,207,180 | 3 | ||||||||||||||
| 1 Sep 2021 to 30 Sep 2021 |
– | – | – | – | 211,207,180 | 3 | ||||||||||||||
| 1 Oct 2021 to 31 Oct 2021 |
– | – | – | – | 211,207,180 | 3 | ||||||||||||||
| 1 Nov 2021 to 30 Nov 2021 |
– | – | – | – | 211,207,180 | 3 | ||||||||||||||
| 1 Dec 2021 to 31 Dec 2021 |
– | – | – | – | 211,207,180 | 3 | ||||||||||||||
| 1 Jan 2022 to 31 Jan 2022 |
– | – | – | – | 211,207,180 | 3,4 | ||||||||||||||
| 1 Feb 2022 to 28 Feb 2022 |
– | – | – | – | – | |||||||||||||||
| 1 Mar 2022 to 31 Mar 2022 |
3,354,850 | 35.95 | – | – | – | |||||||||||||||
| 1 Apr 2022 to 30 Apr 2022 |
– | – | – | – | – | |||||||||||||||
| 1 May 2022 to 31 May 2022 |
– | – | – | – | – | |||||||||||||||
| 1 Jun 2022 to 30 Jun 2022 |
949,819 | 28.37 | – | – | – | |||||||||||||||
| |
|
|
|
|
|
|
|
|
|
|||||||||||
| Total |
4,368,236 | 34.24 | – | – | – | |||||||||||||||
| |
|
|
|
|
|
|
|
|
|
|||||||||||
1 |
The shares were purchased in the currency of the stock exchange on which the purchase took place and the sale price has been converted into US dollars using the average weekly exchange rate of the week that such purchases took place for purchases on the ASX, and the average monthly exchange rate of the month that such purchases took place for purchases on the LSE |
2 |
BHP Group Limited is able to buy-back and cancel BHP Group Limited shares within the ‘10/12 limit’ without shareholder approval in accordance with section 257B of the Australian Corporations Act 2001. Any future on-market share buy-back program would be conducted in accordance with the Australian Corporations Act 2001 and with the ASX Listing Rules |
3 |
At the Annual General Meetings held during 2019, 2020 and 2021, shareholders authorised BHP Group Plc to make on-market purchases of up to 211,207,180 of its ordinary shares, representing 10 per cent of BHP Group Plc’s issued capital at the time |
4 |
BHP Group Plc (now BHP Group (UK) Limited) is no longer able to make on-market purchases of its ordinary shares as a result of its delisting in connection with the unification transaction with BHP Group Limited and as such it can no longer utilise the shareholder authorisation in relation to on-market purchases obtained at the Annual General Meeting in 2021 |
| • | (either directly, indirectly or beneficially) 521,592 shares in BHP Group Limited |
| • | rights and options over 978,790 shares in BHP Group Limited |
| Executive KMP member |
As at date of Directors’ Report |
|||
| Edgar Basto |
130,038 | |||
| David Lamont |
6,345 | |||
| Geraldine Slattery |
127,232 | |||
| Ragnar Udd |
118,955 | |||
Ken MacKenzie |
Mike Henry | |
| Chair | Chief Executive Officer | |
| Dated: 16 August 2022 |
| Abbreviation |
Item | |
| AGM |
Annual General Meeting | |
| CDP |
Cash and Deferred Plan | |
| CEO |
Chief Executive Officer | |
| DEP |
Dividend Equivalent Payment | |
| ELT |
Executive Leadership Team | |
| GHG |
Greenhouse gas | |
| HSEC |
Health, safety, environment and community | |
| IFRS |
International Financial Reporting Standards | |
| KMP |
Key Management Personnel | |
| LTIP | Long-Term Incentive Plan | |
| MAP | Management Award Plan | |
| MSR | Minimum shareholding requirement | |
| ROCE | Return on Capital Employed | |
| STIP | Short-Term Incentive Plan | |
| TSR | Total Shareholder Return | |
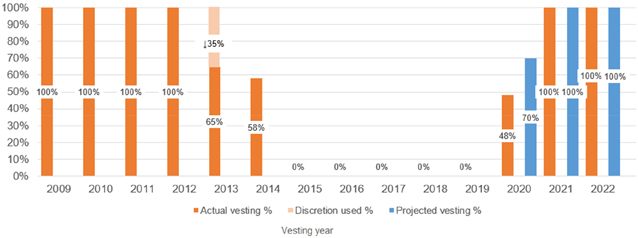
| Fixed remuneration |
CDP |
LTIP | ||
| • Base salary US$1.750 million per annum, an increase of 3% from 1 September 2022. • Pension contribution 10% of base salary. |
• Target cash award of 80% of base salary (maximum 120%). • Plus two awards of deferred shares each of equivalent value to the cash award, vesting in two and five years, respectively. • Three performance categories: • HSEC – 25% • Financial – 50% • Individual – 25% |
• The LTIP grant is based on a face value of 200% of base salary. • Our LTIP awards have rigorous relative TSR performance hurdles measured over five years. |
| • | considering and approving remuneration for members of the ELT |
| • | setting targets for and reviewing outcomes against performance measures and conditions of relevant incentive plans, including the Committee considering its discretion over FY2022 plan outcomes |
| • | reviewing the fee for the BHP Chair, which remains unchanged |
| • | considering remuneration and remuneration reporting implications of unification and the merger of the Petroleum business and Woodside |
| • | reviewing and adopting changes and improvements flowing from regulatory requirements and guidance, which in turn helps us improve our processes and approaches |
| • | engaging with shareholders and other key stakeholders |
| • | undertaking reviews of remuneration by gender and the annual Shareplus enrolment |
| • | Mike Henry, CEO and Executive Director |
| • | Edgar Basto, President Minerals Australia |
| • | David Lamont, Chief Financial Officer |
| • | Geraldine Slattery, President Petroleum from 1 July 2021 to 31 May 2022 and Senior Executive Officer from 1 June to 30 June 2022 |
| • | Ragnar Udd, President Minerals Americas |
| • | Non-executive Directors – for detailsNon-executive Directors, including dates of appointment or cessation (where relevant), refer to 2.2 Directors’ Report. |
| Fixed remuneration |
CDP |
LTIP | ||||
Purpose and link to strategy |
Market competitive fixed remuneration is paid in order to attract, motivate and retain high-quality and experienced executives, and provide appropriate remuneration for these important roles in the Group. | The CDP encourages and focuses executives’ efforts for the relevant financial year on the delivery of the Group’s strategic priorities, balancing financial and non-financial performance, to deliver short, medium and long-term success aligned to our purpose and Our Charter |
The purpose of the LTIP is to focus executive’s efforts on the achievement of sustainable long-term value creation and success of the Group (including appropriate management of business risks). | |||
Remuneration components and link to performance |
Fixed remuneration comprises base salary, pension contributions and benefits. Competitive fixed remuneration is aligned to global complexity, size, reach and industry, and reflects executives’ responsibilities, location, skills, performance, qualifications and experience. |
Annual variable pay opportunity linked to execution of business strategy. A balanced scorecard of short, medium and long-term elements including HSEC (25% weighting), financial (50% weighting) and individual performance measures (25% weighting) are chosen on the basis that they are expected to have a significant short, medium and long-term impact on the success of the Group, with appropriate targets for each measure which will appropriately motivate Executive KMP to achieve outperformance that contributes to the long-term sustainability of the Group and shareholder wealth creation. | Annual long-term variable pay opportunity based on grants of five-year performance rights designed to align executives’ reward with sustained shareholder wealth creation in excess of relevant comparator group(s), through the relative TSR performance condition. Relative TSR has been chosen as an appropriate measure as it enables an objective external assessment over a sustained period on a basis that is familiar to shareholders. | |||
| CDP |
LTIP | |||
Assessment of performance |
Achievement against each scorecard measure is assessed by the Committee and the Board, with guidance provided by other relevant Board Committees in respect of HSEC, financial and other measures, and a CDP award determined. If performance is below the threshold level for any measure, no CDP award will be provided in respect of that portion of the CDP award opportunity. In the event the Committee does not consider the outcomes that would otherwise apply to be a true reflection of the performance of the Group or should it consider that individual performance or other circumstances makes this an inappropriate outcome, it retains the discretion to not provide all or a part of any CDP award. This is an important mitigation against the risk of unintended award outcomes. |
Vesting of the LTIP award is dependent on BHP’s TSR relative to the TSR of relevant comparator group(s) over a five-year performance period. 25% of the award will vest where BHP’s TSR is equal to the median TSR of the relevant comparator group(s), as measured over the performance period. Where TSR is below the median, awards will not vest. Vesting occurs on a sliding scale between the median TSR of the relevant comparator group(s) up to a nominated level of TSR outperformance over the relevant comparator group(s), as determined by the Committee, above which 100% of the award will vest. Where the TSR performance condition is not met, there is no retesting and awards will lapse. The Committee also retains discretion to lapse any portion or all of the award where it considers the vesting outcome is not appropriate given Group or individual performance. This is an important mitigation against the risk of unintended outcomes. | ||
Delivery and vesting |
CDP awards are provided as cash and two awards of deferred shares, each of equivalent value to the cash award, vesting in two and five years respectively. Awards of deferred shares comprise rights to receive ordinary BHP shares in the future at the end of the deferral periods. Before the awards vest (or are exercised), these rights are not ordinary shares and do not carry entitlements to ordinary dividends or other shareholder rights; however, a DEP is provided on vested awards. The Committee has a discretion to settle CDP awards in cash. Vesting of five-year deferred shares under the CDP is underpinned by a holistic review of performance at the end of the five-year vesting period, including a review of HSEC performance, profitability, cash flow, balance sheet health, returns to shareholders, corporate governance and conduct over the five-year period. |
LTIP awards consist of rights to receive ordinary BHP shares in the future if the performance and service conditions are met. Before vesting (or exercise), these rights are not ordinary shares and do not carry entitlements to ordinary dividends or other shareholder rights; however, a DEP is provided on vested awards. The Committee has a discretion to settle LTIP awards in cash. Vesting of five-year performance rights under the LTIP is underpinned by a holistic review of performance at the end of the five-year performance period, including a review of HSEC performance, profitability, cash flow, balance sheet health, returns to shareholders, corporate governance and conduct over the five-year period. | ||
Cessation of employment |
On cessation of employment, a ‘good leaver’ 1 may receive a pro-rated cash award based on performance for that year. For a ‘good leaver’, their unvested CDP deferred awards generally remain on foot (wholly or in part) unless the Committee determine otherwise. If the executive is not a ‘good leaver’, all unvested CDP deferred awards will lapse. |
On cessation of employment, for a ‘good leaver’ 1 their unvested LTIP awards generally remain on foot on termination and are pro-rated for the portion of the vesting period served. These awards are eligible for vesting in the ordinary course, subject to any applicable performance conditions. If the executive is not a ‘good leaver’, all unvested LTIP awards will lapse. | ||
Malus and clawback |
CDP awards (including cash and deferred share awards) and LTIP awards are subject to the Group’s malus and clawback policy (see below). | |||
1 |
‘Good leaver’ treatment may apply where the reason for the cessation of employment with BHP is due to forced early retirement, retrenchment or redundancy, termination by mutual agreement or retirement with the agreement of the Group, or such other circumstances that do not constitute resignation or termination for cause. |
| • | an error in the Group’s Financial Statements that requires a material downward restatement |
| • | performance of a participant, or of the business or of the Group does not justify vesting or where the participant’s conduct or performance has been in breach of their employment contract, any laws, rules, codes of conduct or policies applicable to them or the standards reasonably expected of a person in their position |
| • | misstatement or misrepresentation of the performance of the company |
| • | where any team, business area, member of the Group or profit centre in which the participant works or worked has been found guilty in connection with any regulatory investigation or has been in breach of any laws, rules, codes of conduct or policies applicable to it or the standards reasonably expected of it |
| • | an event that has had, or may have a material adverse effect on the value or reputation of any member of the Group |
| • | where the Committee determines there has been material damage to the Group’s social licence to operate |
| • | a catastrophic health, safety, environment or community event or events occurring in any part of the Group |
| • | an act, omission or event occurs which constitutes a material failure of risk management or of other operational systems and controls |
| • | a participant is found to have contributed to circumstances that give rise to a material loss for any Group Company |
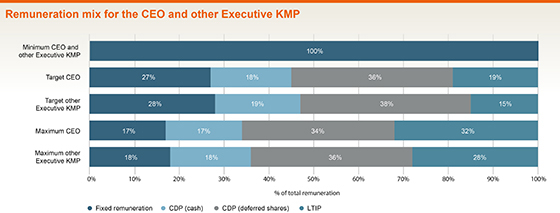
| US$(’000) |
Base salary |
Benefits 1 |
Pension 2 |
CDP 3 |
LTIP 4 |
Total |
||||||||||||||||||||||
| Mike Henry |
FY2022 |
1,700 |
168 |
170 |
3,917 |
8,712 |
14,667 |
|||||||||||||||||||||
| FY2021 | 1,700 | 120 | 170 | 4,692 | 7,939 | 14,621 | ||||||||||||||||||||||
1 |
Benefits are non-pensionable and include net movements in leave balances, private family health insurance, spouse business-related travel, car parking, fringe benefits tax and personal tax return preparation in required countries. |
2 |
Mike Henry’s FY2022 and FY2021 pension contributions were provided based on 10 per cent of base salary. |
3 |
The values shown are the full CDP value (cash and deferred equity) earned as a consequence of performance during FY2022 and FY2021. The FY2022 CDP award will be provided one-third in cash in September 2022 and two-thirds in deferred equity, with one-third due to vest in FY2025 and one-third due to vest in FY2027 (on the terms of the CDP). The FY2021 CDP award was provided one-third in cash in September 2021 and two-thirds in deferred equity, with one-third due to vest in FY2024 and one-third due to vest in FY2026 (on the terms of the CDP). |
4 |
Mike Henry’s LTIP award values for FY2022 and FY2021 (refer below) are based on the full awards he received in 2017 and 2016 respectively when he was President Operations, Minerals Australia (prior to becoming and with no proration applied for time as CEO), and 100 per cent of the awards vesting. For FY2022 the LTIP award value is calculated on the average share price for the month of July 2022 (which will be updated for the actual share price on the vesting date in the 2023 Remuneration Report); whereas the LTIP award value for FY2021 was calculated on the actual share price on the vesting date. |
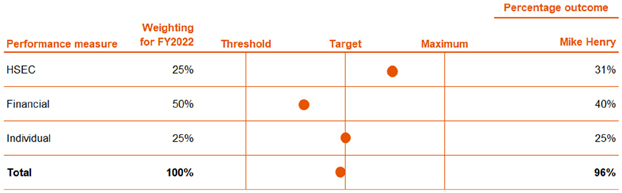
| HSEC measures |
Scorecard targets |
Performance against scorecard targets |
Measure outcome | |||
| Significant events | No significant (actual level 4) health, safety (including fatalities), environment or community events during the year. | • There were no fatalities or other significant HSEC events during FY2022 at operated assets. • In addition, for a maximum outcome to be awarded, strong progress was required on the development and implementation of controls in relation to the Fatality Elimination Program, sexual harassment and cultural heritage, and this was achieved in relation to the Fatality Elimination Program and cultural heritage for FY2022. While we continued to make progress on the implementation of our actions to eliminate sexual harassment during FY2022, we have more to do in FY2023. |
Between target and maximum. | |||
| Climate change | Reported GHG emissions in FY2022 are below the FY2017 level. A majority of planned decarbonisation projects are presented for tollgates and all asset adaptation plans are updated. Work undertaken as planned under partnerships with strategic customers in the steel sector established in FY2021, one more partnership formalised, and a review of Scope 3 goals and estimation methodologies completed. |
• For FY2022, we improved on our operational GHG emissions target of 14.6Mt, with an outcome of 12.5Mt 1 , which was greater than 10% below the target (i.e. required for maximum).• Each region presented 90% of GHG reduction projects schedules and adaptation plans, updated for material changes, which were incorporated in the planning process. The completion of early stage development studies that contributed to the Group’s medium term target and financial and economic evaluation of physical climate change risks and adaptation measures (i.e. both required for maximum) was largely completed, with work continuing into FY2023. • During the year, we commenced Phase 1 work for each of the three strategic Memorandum of Understandings (MOUs) signed with steel customers in FY2021 (China Baowu (China), JFE Steel Corporation (Japan) and HBIS Limited (China)), including the commencement and delivery of work plans for each partnership. An additional steelmaking partnership MOU was signed with POSCO (South Korea) in October 2021, a new customer partnership was signed focussed on plant trials with Zenith Steel (China), and a review of BHP Scope 3 goals and methodology was completed. An industrial scale sinter plant emission reduction trial (i.e. required for maximum) was commenced with Zenith Steel in May 2022 relating to the optimisation stage of steel decarbonisation. |
Between target and maximum. | |||
| Management of priority tailings storage facilities (TSFs) | All priority TSFs are assessed based on key risk indicator data, and are either within appetite or continued operation outside appetite is approved with remediation progressing to plan. | • All priority TSFs are within appetite based on key risk indicator data or continued operation outside appetite is approved with remediation progressing to plan. • We have continued improving our key risk indicator performance with 85% of all key risk indicators for priority TSFs rated either on target or less risk being taken than target, against a target of 85% and 90% required for maximum. |
Target. | |||
1 |
As reported to the Sustainability Committee and Remuneration Committee meetings in early August 2022 and considered for the purposes of determining FY2022 CDP outcomes. The GHG emissions for FY2022 are subject to third-party verification. |
| Financial measure |
Scorecard targets |
Performance against scorecard targets |
Measure outcome | |||
| ROCE | For FY2022, the target for ROCE was 38.1%, with a threshold of 33.5% and a maximum of 42.0%. Achievement of the ROCE target will result in a target CDP outcome. The ROCE target considers the upside opportunities and downside risks inherent in BHP’s businesses, and is an outcome that the Committee believes would be a level of performance that shareholders would view positively. The maximum and threshold are an appropriate range of ROCE outcomes, given the upside opportunities and downside risks, that represent an upper limit of stretch outperformance that would represent the maximum CDP award, and a lower limit of underperformance below which no CDP award should be made. The performance range around target is subject to a greater level of downside risk than there is upside opportunity, mainly due to physical and regulatory asset constraints. Accordingly, the range between threshold and target is somewhat greater than that between target and maximum. For maximum, the Committee takes care not to create leveraged incentives that encourage executives to push for short-term performance that goes beyond our risk appetite and current operational capacity. The Committee retains, and has a track record of applying, downward discretion (but not upwards discretion) to ensure the CDP outcome is appropriately aligned with the overall performance of the Group for the year, and is fair and equitable to management and shareholders. |
ROCE of 48.7% was reported by BHP for FY2022. Adjusted for the factors outlined below, ROCE is 36.3%, which is below target. The following adjustments were made to ensure the outcomes appropriately reflect the performance of management for the year: • The full elimination of the impacts of positive movements in commodities prices and exchange rates decreased ROCE by 6.9 percentage points. • Adjustments for other material items made to ensure the outcomes reflect the performance of management for the year decreased ROCE by 5.5 percentage points. This was mainly due to the elimination of the positive effect on reported ROCE outcomes of lower depreciation and lower asset values in the closing balance sheet due to the merger of the Petroleum business with Woodside and the sale of our interest in BMC. This downwards adjustment was necessary to ensure the basis of the ROCE outcome for CDP purposes was the same as the basis upon which Petroleum and our interest in BMC were included in the ROCE target for FY2022. • Having reviewed the FY2022 exceptional items (as described in Financial Statements note 3 Exceptional items), the Committee determined these should not be considered for the purposes of determining the FY2022 ROCE CDP outcome and that no further action was required in respect of exceptional items. The key drivers of the FY2022 ROCE outcome of 36.3% being below the target for FY2022 of 38.1% set at the commencement of the year were: • In Minerals Australia, production volumes were lower than expected mainly driven by labour and supply constraints across most assets associated with COVID-19, delays in the ramp up of South Flank at Western Australian Iron Ore, labour availability issues and interrupted autonomous haulage rollout at BMA, and the longer than planned duration of the smelter maintenance campaign at Olympic Dam. In addition, input prices were higher across all assets. |
Below target. | |||
| • In Minerals Americas, in addition to unplanned maintenance and higher input prices at all assets, production volumes were impacted by lower than expected recoveries at Pampa Norte due to plant design issues related to the Spence Growth Option and higher clay content, and lower than expected copper concentrator feed grade at Escondida. • In Petroleum, despite achieving planned production, sales volumes were lower than expected due to unfavourable timing, partly offset by better than expected cost performance. |
| Individual measures |
Individual scorecard targets |
Performance against scorecard targets |
Measure outcome | |||
| Social value | Deliver a successful Say on Climate outcome at the 2021 AGMs. | • The Climate Transition Action Plan/Say on Climate was successfully approved at the 2021 AGMs with 85% of votes in favour. |
Target. | |||
| Deliver an external update on BHP’s embedment and measurement of Social Value. | • A Social Value Framework (SVF) was developed and approved by the Board in October 2021 and subsequently deployed across BHP. In June 2022, the SVF was presented to our workforce as well as externally via an investor roundtable, and both internal and external engagements were received positively. |
|||||
| People | Increase in female participation by three percentage points. | • Female participation increased in FY2022 by 2.5 percentage points to 32.3% at 30 June 2022, compared to 29.8% at 30 June 2021. |
Below target. | |||
| Engagement and Perception Survey (EPS) improvement survey on survey over the year and substantively improve lower performing teams. | • While most of our people continue to feel safe, engaged and enabled, our EPS results declined marginally in FY2022. The EPS results of lower performing teams were, on average, similar in FY2022 compared to the prior year, even though a number of lower performing teams did show improvement. |
|||||
| Performance | >90% of BHP Operating System (BOS) deployments on track, Operational Excellence Indicator (OEI) > 40 at 75% of sites at end of deployment, and > 75% improving OEI improving assessment-on-assessment |
• 94% of BOS deployments are on track according to plan. 88% of BOS sites at the end of deployment achieved an OEI score above the target of 40 (with an average OEI score of 43). 91% of sites already in deployment recorded an assessment-on-assessment |
Slightly above target. | |||
| Enable the data strategy and associated value creation through transforming data accuracy, consistency and access. | • The data strategy has been reinforced to enable value creation through transformation of data accuracy, consistency and cloud-native access. We have also established a data analytics operating model which retains capabilities in the assets and functions whilst enabling standards and tool replication across the Group to remove duplication, and migrated 1SAP and an additional 78 applications to the cloud to unlock enhanced performance and enhance cybersecurity. |
|||||
| Portfolio | Progress the strategic review activities with respect to Petroleum, our interest in BMC and New South Wales Energy Coal as approved by the Board. | • We made strong progress on strategic review activities as approved by the Board, including the merger of our Petroleum business with Woodside (completed in June 2022), and the divestments of our interests in Cerrejón (completed in January 2022) and BMC (completed in May 2022). In June 2022, we announced that we will retain New South Wales Energy Coal and will seek approval to continue mining through to cessation of operations in FY2030. |
Slightly above target. | |||
| Additional nickel and copper search spaces captured. | • While we secured additional investments in nickel and copper projects, the public offer made for Noront Resources (nickel) was unsuccessful. |
|||||
| Continued maturation of the innovation and venture business units. | • Our pursuit of innovation has progressed, with 60 innovation concepts generated for evaluation in FY2022. Strong progress also continues across ventures, with 9 investments executed during FY2022, while ventures also supported market intelligence in our strategic evaluations of new products and processes. |
|||||
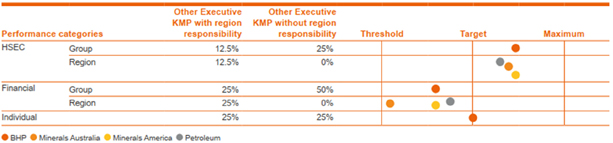
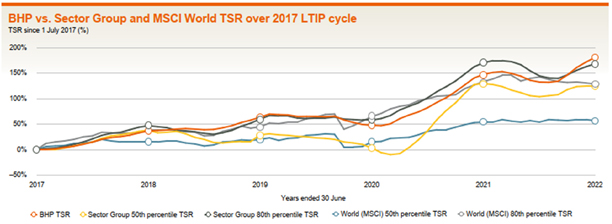
| • | BHP’s relative TSR performance was slightly above the weighted median of BHP’s sector peers |
| • | BHP’s financial performance, as measured by the CDP finance measure outcomes, was slightly below target |
| • | the CEO’s view that David had performed in line with expectations in his role |
Performance period |
• 1 July 2021 to 30 June 2026 | |
Performance conditions |
• An averaging period of six months will be used in the TSR calculations. • BHP’s TSR relative to the weighted median TSR of sector peer companies selected by the Committee (Sector Group TSR) and the MSCI World Index (World TSR) will determine the vesting of 67% and 33% of the award, respectively. • Each company in the sector peer group is weighted by market capitalisation. The maximum weighting for any one company is 25% and the minimum is set at 0.4% to reduce sensitivity to any single sector peer company. • For the whole of either portion of the award to vest, BHP’s TSR must be at or exceed the weighted 80th percentile of the Sector Group TSR or the World TSR (as applicable). Threshold vesting (25% of each portion of the award) occurs where BHP’s TSR equals the weighted 50th percentile (i.e. the median) of the Sector Group TSR or the World TSR (as applicable). Vesting occurs on a sliding scale between the weighted 50th and 80th percentiles. | |
| Sector peer group companies (1) |
• Resources (85%): Anglo American, Fortescue Metals, Freeport-McMoRan, Glencore, Rio Tinto, Southern Copper, Teck Resources, Vale. • Oil and gas (15%): Apache, BP, Canadian Natural Res., Chevron, ConocoPhillips, Devon Energy, EOG Resources, ExxonMobil, Occidental Petroleum, Shell, Woodside. | |
1 |
From November 2018, CONSOL Energy was removed from the sector comparator group, as due to its internal restructuring it had become a less comparable peer. |
| • | The CEO’s and other Executive KMP’s base salaries will increase by 3 per cent following a review by the Committee of the external market demand for senior executive talent and updated benchmarking. The Committee considers the increases modest in this context, as well as being below the median salary increase applied for other BHP employees of approximately 4 per cent. |
| • | In addition, having reviewed Ragnar Udd’s performance and development in role since appointment in November 2020, including the dynamic context and growing importance of the Americas region to the Group, the Committee provided an additional increase of 6 per cent increase in base salary (i.e. 9 per cent in total). |
| Performance categories |
Weighting |
Target measures | ||||
| Safety and Sustainability |
25 | % | The following Safety and Sustainability (previously HSEC) performance measures are designed to incentivise achievement of the Group’s public goals. Significant events (10%): No significant (actual level 4) health, safety (including fatalities), environment or community events during the year. Achievement of sexual harassment and Fatality Implementation Program FY2023 deliverables. Climate change (10%): FY2023 GHG emissions targets met, aligned with progress towards the 2030 medium term target. A majority of planned decarbonisation projects are presented for tollgates or milestones as scheduled. Progress Memorandum of Understanding commitments with steel customers. Indigenous partnerships (5%): Achieve uplift in Indigenous, Traditional Owner and First Nations vendor procurement. Planned progress on Indigenous employment/participation targets. Release revised Global Indigenous Peoples Strategy. | |||
| Financial |
50 | % | ROCE is underlying profit after taxation (excluding after-taxation finance costs and exceptional items) divided by average capital employed. When assessing management’s performance, adjustments are made to the ROCE result to allow for changes in commodity prices, foreign exchange movements and other material items to ensure the assessment appropriately measures outcomes that are within the control and influence of the Group and its executives. For reasons of commercial sensitivity, the target for ROCE is not disclosed in advance. | |||
| Individual |
25 | % | The CEO’s individual measures for FY2023 comprise the contribution to BHP’s overall performance and the management team and the delivery of projects and initiatives within the scope of the CEO role as set out by the Board. These include projects and initiatives in respect of social value, people, performance and portfolio. These performance measures are aligned with medium and long-term strategy aspirations that are intended to drive long-term value for shareholders and other stakeholders, and the Board considers a 25% weighting in the CDP to be appropriate for these important elements. Individual performance measures for other Executive KMP similarly contribute to the delivery of projects and initiatives within the scope of their role and BHP’s overall performance. | |||
| Fees |
Benefits | |||
Purpose and link to strategy |
Competitive fees are paid in order to attract and retain high-quality individuals, and to provide appropriate remuneration for the role undertaken. Fees are set at a competitive level based on benchmarks and advice provided by external advisers. | Competitive benefits are paid in order to attract and retain high-quality individuals and adequately remunerate them for the role undertaken, including the considerable travel burden. | ||
Remuneration components |
The Chair is paid a single fee for all responsibilities. Non-executive Directors are paid a base fee and relevant committee membership fees. Committee Chairs and the Senior Independent Director are paid an additional fee to reflect their extra responsibilities.All fee levels are reviewed annually and any changes are ordinarily effective from 1 July. Fee levels reflect the size and complexity of the Group and the geographies in which the Group operates. The economic environment and the financial performance of the Group are taken into account. Consideration is also given to salary reviews across the rest of the Group. Where the payment of pension contributions is required by law, these contributions are deducted from the Director’s overall fee entitlements. |
Travel allowances are paid on a per-trip basis reflecting the considerable travel burden imposed on members of the Board as a consequence of the global nature of the organisation and apply when a Director needs to travel internationally to attend a Board meeting or site visits at our multiple geographic locations.As a consequence of our prior dual listed company structure, Non-executive Directors are required to prepare personal tax returns in Australia and the UK, regardless of whether they reside in one or neither of those countries. They are accordingly reimbursed for the costs of personal tax return preparation in whichever of the UK and/or Australia is not their place of residence (including payment of the tax cost associated with the provision of the benefit). | ||
| Levels of fees and travel allowances for Non-executive Directors (in US$) |
From 1 July 2022 |
|||
| Base annual fee |
160,000 | |||
| |
|
|||
| Plus additional fees for: |
||||
Senior Independent Director |
48,000 | |||
| |
|
|||
| Committee Chair: |
||||
| Risk and Audit |
60,000 | |||
| Remuneration |
45,000 | |||
| Sustainability |
45,000 | |||
| Nomination and Governance |
No additional fee | |||
| |
|
|||
| Committee membership: |
||||
| Risk and Audit |
32,500 | |||
| Remuneration |
27,500 | |||
| Sustainability |
27,500 | |||
| Nomination and Governance |
18,000 | |||
| |
|
|||
| Travel allowance: 1 |
||||
| Greater than 3 but less than 10 hours |
7,000 | |||
| 10 hours or more |
15,000 | |||
| |
|
|||
| Chair’s fee |
880,000 | |||
| |
|
|||
1 |
In relation to travel for Board business, the time thresholds relate to the flight time to travel to the meeting location (i.e. one way flight time). Only one travel allowance is paid per round trip. |
Short-term benefits |
Post- employment benefits |
Share-based payments |
||||||||||||||||||||||||||||||||
| US$(‘000) |
Financial year |
Base salary / Fees 1 |
Annual cash incentive 2 |
Non-monetary benefits 3 |
Other benefits 4 |
Retirement benefits 5 |
Value of CDP/STIP awards 2, 6 |
Value of LTIP awards 6 |
Total |
|||||||||||||||||||||||||
| Executive Director |
||||||||||||||||||||||||||||||||||
| Mike Henry |
FY2022 |
1,700 |
1,306 |
168 |
– |
170 |
1,890 |
2,297 |
7,531 |
|||||||||||||||||||||||||
| FY2021 | 1,700 | 1,564 | 120 | – | 170 | 1,487 | 2,315 | 7,356 | ||||||||||||||||||||||||||
| Other Executive KMP |
||||||||||||||||||||||||||||||||||
| Edgar Basto |
FY2022 |
950 |
646 |
45 |
– |
95 |
698 |
786 |
3,220 |
|||||||||||||||||||||||||
| FY2021 | 950 | 866 | 60 | – | 95 | 432 | 839 | 3,242 | ||||||||||||||||||||||||||
| Peter Beaven 7 |
FY2021 |
417 |
400 |
39 |
– |
83 |
876 |
787 |
2,602 |
|||||||||||||||||||||||||
| David Lamont |
FY2022 |
950 |
730 |
37 |
300 |
95 |
615 |
1,754 |
4,481 |
|||||||||||||||||||||||||
| FY2021 | 554 | 510 | 42 | – | 55 | 167 | 935 | 2,263 | ||||||||||||||||||||||||||
| Daniel Malchuk 7 |
FY2021 |
333 |
307 |
23 |
– |
67 |
765 |
620 |
2,115 |
|||||||||||||||||||||||||
| Geraldine Slattery |
FY2022 |
850 |
700 |
– |
695 |
128 |
1,019 |
856 |
4,248 |
|||||||||||||||||||||||||
| FY2021 | 800 | 800 | 25 | – | 160 | 777 | 930 | 3,492 | ||||||||||||||||||||||||||
| Ragnar Udd |
FY2022 |
850 |
653 |
32 |
– |
85 |
576 |
676 |
2,872 |
|||||||||||||||||||||||||
| FY2021 | 567 | 521 | 49 | 420 | 57 | 190 | 483 | 2,287 | ||||||||||||||||||||||||||
| Non-Executive Directors |
||||||||||||||||||||||||||||||||||
| Terry Bowen |
FY2022 |
248 |
– |
– |
32 |
15 |
– |
– |
295 |
|||||||||||||||||||||||||
| FY2021 | 219 | – | – | 4 | 12 | – | – | 235 | ||||||||||||||||||||||||||
| Malcolm Broomhead |
FY2022 |
165 |
– |
– |
31 |
12 |
– |
– |
208 |
|||||||||||||||||||||||||
| FY2021 | 195 | – | – | 3 | 10 | – | – | 208 | ||||||||||||||||||||||||||
| Ian Cockerill |
FY2022 |
233 |
– |
– |
61 |
– |
– |
– |
294 |
|||||||||||||||||||||||||
| FY2021 | 220 | – | – | – | – | – | – | 220 | ||||||||||||||||||||||||||
| Xiaoqun Clever 8 |
FY2022 |
193 |
– |
– |
18 |
– |
– |
– |
211 |
|||||||||||||||||||||||||
| FY2021 | 144 | – | – | – | – | – | – | 144 | ||||||||||||||||||||||||||
| Anita Frew 9 |
FY2022 |
81 |
– |
– |
2 |
– |
– |
– |
83 |
|||||||||||||||||||||||||
| FY2021 | 220 | – | – | 2 | – | – | – | 222 | ||||||||||||||||||||||||||
| Gary Goldberg 3 |
FY2022 |
301 |
– |
– |
71 |
– |
– |
– |
372 |
|||||||||||||||||||||||||
| FY2021 | 246 | – | – | 2 | – | – | – | 248 | ||||||||||||||||||||||||||
| Michelle Hinchliffe 8 |
FY2022 |
64 |
– |
– |
30 |
– |
– |
– |
94 |
|||||||||||||||||||||||||
| Susan Kilsby 9 |
FY2022 |
69 |
– |
– |
16 |
– |
– |
– |
85 |
|||||||||||||||||||||||||
| FY2021 | 220 | – | – | 1 | – | – | – | 221 | ||||||||||||||||||||||||||
| Ken MacKenzie |
FY2022 |
863 |
– |
– |
32 |
17 |
– |
– |
912 |
|||||||||||||||||||||||||
| FY2021 | 864 | – | – | 4 | 16 | – | – | 884 | ||||||||||||||||||||||||||
| Lindsay Maxsted 9 |
FY2021 |
33 |
– |
– |
3 |
2 |
– |
– |
38 |
|||||||||||||||||||||||||
| John Mogford |
FY2022 |
234 |
– |
– |
17 |
– |
– |
– |
251 |
|||||||||||||||||||||||||
| FY2021 | 215 | – | – | 2 | – | – | – | 217 | ||||||||||||||||||||||||||
| Christine O’Reilly 8 |
FY2022 |
276 |
– |
– |
32 |
– |
– |
– |
308 |
|||||||||||||||||||||||||
| FY2021 | 162 | – | – | – | 9 | – | – | 171 | ||||||||||||||||||||||||||
| Catherine Tanna 8 |
FY2022 |
49 |
– |
– |
30 |
4 |
– |
– |
83 |
|||||||||||||||||||||||||
| Shriti Vadera 9 |
FY2021 |
74 |
– |
– |
1 |
– |
– |
– |
75 |
|||||||||||||||||||||||||
| Dion Weisler 3 |
FY2022 |
191 |
– |
– |
32 |
14 |
– |
– |
237 |
|||||||||||||||||||||||||
| FY2021 | 178 | – | – | 1 | 9 | – | – | 188 | ||||||||||||||||||||||||||
1 |
Base salaries and fees shown in this table reflect the amounts paid over the 12-month period from 1 July 2021 to 30 June 2022 for each Executive KMP and Non-Executive Director. There were no changes to Executive KMP base salaries during FY2022. The following Non-Executive Directors have received special exertion fees for additional or extra services they performed in FY2022 in connection with major transactions undertaken by the Group: in connection with the unification of BHP’s dual listed structure – Gary Goldberg received an additional fee of US$20,000 as Chair of the Transaction Committee and Ian Cockerill and Terry Bowen received US$12,500 each as members of the Transaction Committee; and in connection with the merger of the Petroleum business with Woodside – Christine O’Reilly received an additional fee of US$20,000 as Chair of the Transaction Committee and Terry Bowen and John Mogford received US$12,500 each as members of the Transaction Committee. |
2 |
Annual cash incentive in this table is the cash portion of CDP awards earned in respect of performance during each financial year for each executive. CDP is provided one-third in cash and two-thirds in deferred equity (which are included in the Share-based payments columns of the table). The cash portion of CDP awards is paid to Executive KMP in September of the year following the relevant financial year. The minimum possible value awarded to each individual is nil and the maximum is 360 per cent of base salary (120 per cent in cash and 240 per cent in deferred equity). For FY2022, Executive KMP earned the following CDP awards as a percentage of the maximum (the remaining portion has been forfeited): Mike Henry 64 per cent, Edgar Basto 57 per cent, David Lamont 64 per cent, Geraldine Slattery 69 per cent, and Ragnar Udd 64 per cent. Peter Beaven’s and Daniel Malchuk’s FY2021 CDP was paid in cash and prorated to reflect the period served until they ceased to be KMP on 30 November 2020 and 31 October 2020 respectively. |
3 |
Non-monetary benefits are non-pensionable and include items such as net leave accruals, private family health insurance, spouse business-related travel, car parking, fringe benefits tax and personal tax return preparation in required countries. |
4 |
Other benefits are non-pensionable and for FY2022 include a sign-on cash award on commencement of employment for David Lamont representing compensation for remuneration that David forfeited or did not receive as a consequence of leaving CSL to join BHP in 2020; an encashment of annual leave entitlements under the US Annual Leave policy for Geraldine Slattery, together with a retention award for Geraldine to ensure her services were retained by BHP after the August 2021 announcement of the merger of the Petroleum business with Woodside; and in FY2021, a one-off relocation allowance (with no trailing entitlements) provided to Ragnar Udd relating to his international relocation from Australia to Chile. The majority of the amounts disclosed for benefits for Non-executive Directors are usually travel allowances (amounts of between US$ nil and US$70,000 for FY2022) however, the COVID-19 pandemic restricted Non-executive Director travel during FY2021 and FY2022. For FY2022, amounts of between US$ nil and US$4,000 are included in respect of tax return preparation; and amounts of between US$ nil and US$1,500 are included in respect of the reimbursement of the tax cost associated with the provision of taxable benefits. |
5 |
Retirement benefits for each Executive KMP in FY2021 and FY2022 were 10 per cent of base salary as per the remuneration framework, with the exception of the retirement benefits reported for Geraldine Slattery of 15 per cent of base salary for FY2022 and the retirement benefits reported for Peter Beaven, Daniel Malchuk and Geraldine Slattery of 20 per cent of base salary for FY2021 in accordance with prior remuneration framework. Non-Executive Director fees are inclusive of minimum superannuation contributions of up to 10 per cent of remuneration for FY2022 in accordance with Australian superannuation legislation. No other pension contributions were paid. |
6 |
The IFRS fair value of CDP and LTIP awards is estimated at grant date. Refer to Financial Statements note 25 Employee share ownership plans. |
7 |
The remuneration reported for Peter Beaven and Daniel Malchuk reflects service as Executive KMP up to 30 November 2020 and 31 October 2020, respectively. |
8 |
The FY2021 remuneration for Xiaoqun Clever and Christine O’Reilly relates to part of the year only, as they joined the Board on 1 October 2020 and 12 October 2020 respectively. The FY2022 remuneration for Michelle Hinchliffe and Catherine Tanna relates to part of the year only, as they joined the Board on 1 March 2022 and 4 April 2022 respectively. |
9 |
The FY2022 remuneration for Anita Frew and Susan Kilsby relates to part of the year only, as they retired from the Board on 11 November 2021. The FY2021 remuneration for Lindsay Maxsted and Shriti Vadera relates to part of the year only, as they retired from the Board on 4 September 2020 and 15 October 2020 respectively. |
Award type |
Date of grant |
At 1 July 2021 |
Granted |
Uplift 1 |
Vested |
Lapsed |
At 30 June 2022 |
Award vesting date 2 |
Market price on date of: |
Gain on awards (‘000) 5 |
DEP on awards (‘000) |
|||||||||||||||||||||||||||||||
Grant 3 |
Vesting 4 |
|||||||||||||||||||||||||||||||||||||||||
| Mike Henry |
||||||||||||||||||||||||||||||||||||||||||
| CDP |
23-Nov-21 |
– | 49,304 | – | – | – | 49,304 | Aug 26 | A$38.05 | – | – | – | ||||||||||||||||||||||||||||||
| CDP |
23-Nov-21 |
– | 49,304 | – | – | – | 49,304 | Aug 23 | A$38.05 | – | – | – | ||||||||||||||||||||||||||||||
| CDP |
20-Oct-20 |
44,348 | – | – | – | – | 44,348 | Aug 25 | A$35.90 | – | – | – | ||||||||||||||||||||||||||||||
| CDP |
20-Oct-20 |
44,348 | – | – | – | – | 44,348 | Aug 22 | A$35.90 | – | – | – | ||||||||||||||||||||||||||||||
| STIP |
20-Nov-19 |
17,420 | – | – | 17,420 | – | – | 18 Aug 21 | A$37.24 | A$47.70 | A$831 | A$66 | ||||||||||||||||||||||||||||||
| LTIP |
23-Nov-21 |
– | 107,183 | – | – | – | 107,183 | Aug 26 | A$38.05 | – | – | – | ||||||||||||||||||||||||||||||
| LTIP |
20-Oct-20 |
140,239 | – | – | – | – | 140,239 | Aug 25 | A$35.90 | – | – | – | ||||||||||||||||||||||||||||||
| LTIP |
20-Nov-19 |
153,631 | – | – | – | – | 153,631 | Aug 24 | A$37.24 | – | – | – | ||||||||||||||||||||||||||||||
| LTIP |
18-Dec-18 |
172,413 | – | – | – | – | 172,413 | Aug 23 | A$33.50 | – | – | – | ||||||||||||||||||||||||||||||
| LTIP |
24-Nov-17 |
218,020 | – | – | – | – | 218,020 | Aug 22 | A$27.97 | – | – | – | ||||||||||||||||||||||||||||||
| LTIP |
9-Dec-16 |
192,360 | – | – | 192,360 | – | – | 18 Aug 21 | A$25.98 | A$47.70 | A$9,176 | A$1,634 | ||||||||||||||||||||||||||||||
| Edgar Basto |
||||||||||||||||||||||||||||||||||||||||||
| CDP |
23-Nov-21 |
– | 27,312 | 3,292 | – | – | 30,604 | Aug 26 | A$38.05 | – | – | – | ||||||||||||||||||||||||||||||
| CDP |
23-Nov-21 |
– | 27,312 | 3,292 | – | – | 30,604 | Aug 23 | A$38.05 | – | – | – | ||||||||||||||||||||||||||||||
| LTIP |
23-Nov-21 |
– | 52,409 | 6,316 | – | – | 58,725 | Aug 26 | A$38.05 | – | – | – | ||||||||||||||||||||||||||||||
| LTIP |
20-Oct-20 |
68,572 | – | 8,263 | – | – | 76,835 | Aug 25 | A$35.90 | – | – | – | ||||||||||||||||||||||||||||||
| MAP |
19-May-20 |
28,245 | – | 3,404 | – | – | 31,649 | Aug 24 | A$35.05 | – | – | – | ||||||||||||||||||||||||||||||
| MAP |
19-May-20 |
28,245 | – | 3,404 | – | – | 31,649 | Aug 23 | A$35.05 | – | – | – | ||||||||||||||||||||||||||||||
| MAP |
25-Sep-19 |
28,245 | – | 3,404 | – | – | 31,649 | Aug 22 | A$36.53 | – | – | – | ||||||||||||||||||||||||||||||
| MAP |
24-Sep-18 |
27,651 | – | – | 27,651 | – | – | 18 Aug 21 | A$33.83 | A$47.70 | A$1,319 | – | ||||||||||||||||||||||||||||||
| David Lamont |
||||||||||||||||||||||||||||||||||||||||||
| Performance shares |
1-Dec-20 |
77,000 | – | 9,279 | – | – | 86,279 | Aug 22 | A$38.56 | – | – | – | ||||||||||||||||||||||||||||||
| CDP |
23-Nov-21 |
– | 16,072 | 1,937 | – | – | 18,009 | Aug 26 | A$38.05 | – | – | – | ||||||||||||||||||||||||||||||
| CDP |
23-Nov-21 |
– | 16,072 | 1,937 | – | – | 18,009 | Aug 23 | A$38.05 | – | – | – | ||||||||||||||||||||||||||||||
| LTIP |
23-Nov-21 |
– | 52,409 | 6,316 | – | – | 58,725 | Aug 26 | A$38.05 | – | – | – | ||||||||||||||||||||||||||||||
| LTIP |
1-Dec-20 |
68,572 | – | 8,263 | – | – | 76,835 | Aug 25 | A$38.56 | – | – | – | ||||||||||||||||||||||||||||||
| Geraldine Slattery |
||||||||||||||||||||||||||||||||||||||||||
| CDP |
23-Nov-21 |
– | 25,219 | 3,039 | – | – | 28,258 | Aug 26 | A$38.05 | – | – | – | ||||||||||||||||||||||||||||||
| CDP |
23-Nov-21 |
– | 25,219 | 3,039 | – | – | 28,258 | Aug 23 | A$38.05 | – | – | – | ||||||||||||||||||||||||||||||
| CDP |
20-Oct-20 |
25,490 | – | 3,072 | – | – | 28,562 | Aug 25 | A$35.90 | – | – | – | ||||||||||||||||||||||||||||||
| CDP |
20-Oct-20 |
25,490 | – | 3,072 | – | – | 28,562 | Aug 22 | A$35.90 | – | – | – | ||||||||||||||||||||||||||||||
| STIP |
20-Nov-19 |
6,628 | – | – | 6,628 | – | – | 18 Aug 21 | A$37.24 | A$47.70 | A$316 | A$25 | ||||||||||||||||||||||||||||||
| LTIP |
23-Nov-21 |
– | 46,892 | 5,651 | – | – | 52,543 | Aug 26 | A$38.05 | – | – | – | ||||||||||||||||||||||||||||||
| LTIP |
20-Oct-20 |
54,136 | – | 6,524 | – | – | 60,660 | Aug 25 | A$35.90 | – | – | – | ||||||||||||||||||||||||||||||
| LTIP |
20-Nov-19 |
104,748 | – | 12,623 | – | – | 117,371 | Aug 24 | A$37.24 | – | – | – | ||||||||||||||||||||||||||||||
| MAP |
21-Feb-19 |
28,527 | – | 3,438 | – | – | 31,965 | Aug 23 | A$34.83 | – | – | – | ||||||||||||||||||||||||||||||
| MAP |
21-Feb-19 |
28,527 | – | 3,438 | – | – | 31,965 | Aug 22 | A$34.83 | – | – | – | ||||||||||||||||||||||||||||||
| MAP |
24-Sep-18 |
28,527 | – | 28,527 | – | – | 18 Aug 21 | A$33.83 | A$47.70 | A$1,361 | – | |||||||||||||||||||||||||||||||
| Ragnar Udd |
||||||||||||||||||||||||||||||||||||||||||
| CDP |
23-Nov-21 |
– | 16,434 | 1,981 | – | – | 18,415 | Aug 26 | A$38.05 | – | – | – | ||||||||||||||||||||||||||||||
| CDP |
23-Nov-21 |
– | 16,434 | 1,981 | – | – | 18,415 | Aug 23 | A$38.05 | – | – | – | ||||||||||||||||||||||||||||||
| LTIP |
23-Nov-21 |
– | 46,892 | 5,651 | – | – | 52,543 | Aug 26 | A$38.05 | – | – | – | ||||||||||||||||||||||||||||||
| LTIP |
2-Nov-20 |
61,354 | – | 7,394 | – | – | 68,748 | Aug 25 | A$33.81 | – | – | – | ||||||||||||||||||||||||||||||
| MAP |
21-Aug-20 |
21,231 | – | 2,559 | – | – | 23,790 | Aug 24 | A$38.36 | – | – | – | ||||||||||||||||||||||||||||||
| MAP |
21-Aug-20 |
21,231 | – | 2,559 | – | – | 23,790 | Aug 23 | A$38.36 | – | – | – | ||||||||||||||||||||||||||||||
| MAP |
25-Sep-19 |
21,231 | – | 2,559 | – | – | 23,790 | Aug 22 | A$36.53 | – | – | – | ||||||||||||||||||||||||||||||
| MAP |
24-Sep-18 |
25,565 | – | 25,565 | – | – | 18 Aug 21 | A$33.83 | A$47.70 | A$1,219 | – | |||||||||||||||||||||||||||||||
1 |
Uplift awards granted as a consequence of the merger of the Petroleum business with Woodside. For the CEO shareholder approval for these awards will be sought at the 2022 AGM and following approval these would be granted in or around November 2022. Uplift awards for other Executive KMP were granted on 17 June 2022. |
2 |
Where the vesting date is not yet known, the estimated vesting month is shown. Where awards lapse, the lapse date is shown. If the vesting conditions are met, awards will vest on or as soon as practicable after the first non-prohibited period date occurring after 30 June of the preceding year of vest. The year of vesting is the second (STIP and CDP two-year awards), third (MAP), fourth (MAP) or fifth (MAP, CDP five-year awards and LTIP) financial year after grant. All awards are conditional awards and have no exercise period, exercise price or expiry date; instead ordinary fully paid shares are automatically delivered upon the vesting conditions being met. Where vesting conditions are not met, the conditional awards will immediately lapse. |
3 |
The market price shown is the closing price of BHP shares on the relevant date of grant. No price is payable by the individual to receive a grant of awards. The IFRS fair value of the CDP and LTIP awards granted in FY2022 at the grant date of 23 November 2021 are as follows: CDP – A$38.05 and LTIP – A$18.92. |
4 |
The market price shown is the closing price of BHP shares on the relevant date of vest. |
5 |
The gain on awards is calculated using the market price on date of vesting or exercise (as applicable) less any exercise price payable. The amounts that vested and were lapsed for the awards during FY2022 are as follows: CDP – 100 per cent vested; LTIP – 100 per cent vested; MAP – 100 per cent vested. |
| BHP Group Limited |
FY2022 |
FY2021 |
FY2020 |
FY2019 |
FY2018 |
|||||||||||||||
| Share price at beginning of year |
A$48.22 |
A$35.82 | A$41.68 | A$33.60 | A$23.23 | |||||||||||||||
| Share price at end of year |
A$41.25 |
A$48.57 | A$35.82 | A$41.16 | A$33.91 | |||||||||||||||
| Dividends paid |
A$10.18 |
1 |
A$2.07 | A$2.13 | A$3.08 | 2 |
A$1.24 | |||||||||||||
| Attributable profit (US$ million, as reported) |
30,900 |
11,304 | 7,956 | 8,306 | 3,705 | |||||||||||||||
1 . |
The FY2022 dividends paid includes A$5.38 in respect of the in-specie dividend associated with the merger of the Petroleum business with Woodside. |
2 |
The FY2019 dividends paid includes A$1.41 in respect of the special dividend associated with the divestment of Onshore US. |
Held at 1 July 2021 1 |
Purchased |
Received as remuneration 2 |
Sold |
Held at 30 June 2022 |
||||||||||||||||
| Mike Henry |
395,241 | – | 245,423 | 119,072 | 521,592 | |||||||||||||||
| Edgar Basto |
134,889 | – | 27,651 | 32,502 | 130,038 | |||||||||||||||
| David Lamont |
6,345 | – | – | – | 6,345 | |||||||||||||||
| Geraldine Slattery 3, 4 |
100,917 | – | 35,681 | 9,366 | 127,232 | |||||||||||||||
| Ragnar Udd 3 |
105,816 | – | 25,565 | 12,426 | 118,955 | |||||||||||||||
| Terry Bowen |
11,000 | – | – | – | 11,000 | |||||||||||||||
| Malcolm Broomhead |
19,000 | – | – | – | 19,000 | |||||||||||||||
| Xiaoqun Clever |
7,000 | 1,000 | – | – | 8,000 | |||||||||||||||
| Ian Cockerill 3 |
13,188 | 1,111 | – | – | 14,299 | |||||||||||||||
| Anita Frew 6 |
15,000 | – | – | – | 15,000 | |||||||||||||||
| Gary Goldberg 4 |
10,000 | 2,000 | – | – | 12,000 | |||||||||||||||
| Michelle Hinchliffe 5 |
– | 8,508 | – | – | 8,508 | |||||||||||||||
| Susan Kilsby 6 |
6,900 | – | – | – | 6,900 | |||||||||||||||
| Ken MacKenzie |
52,351 | – | – | – | 52,351 | |||||||||||||||
| John Mogford |
13,938 | – | – | – | 13,938 | |||||||||||||||
| Christine O’Reilly 3 |
7,420 | 2,000 | – | – | 9,420 | |||||||||||||||
| Catherine Tanna 5 |
10,400 | – | – | – | 10,400 | |||||||||||||||
| Dion Weisler |
1,544 | 6,000 | – | – | 7,544 | |||||||||||||||
1 |
Includes shares in BHP Group Plc held directly, indirectly or beneficially, by each individual (including shares held in the name of all close members of the Director’s or Executive KMP’s family and entities over which either the Director or Executive KMP or the family member has, directly or indirectly, control, joint control or significant influence) prior to unification. |
2 |
Includes DEP in the form of shares on equity awards vesting, where applicable, as disclosed in 5.2 Equity awards. |
3 |
The opening balances for Ian Cockerill, Christine O’Reilly, Geraldine Slattery and Ragnar Udd have been adjusted to include an additional 929 shares, 420 shares, 3,592 shares and 398 shares, respectively. |
4 |
The following BHP Group Limited shares were held in the form of American Depositary Shares: 1,892 for Geraldine Slattery and 6,000 for Gary Goldberg. |
5 |
The opening balances for Michelle Hinchliffe and Catherine Tanna reflect their shareholdings on the date that each became Non-executive Directors being 1 March 2022 and 4 April 2022, respectively. |
6 |
Shares shown as held by Anita Frew and Susan Kilsby at 30 June 2022 are their balances at the date of their retirement from the Board on 11 November 2021. |
| • | The MSR for the CEO was five times annual pre-tax base salary. At the end of FY2022, the CEO met the MSR. |
| • | The MSR for other Executive KMP was three times annual pre-tax base salary. At the end of FY2022, the other Executive KMP met the MSR, except for David Lamont, as he was appointed as Executive KMP on 1 December 2020. |
| • | No Executive KMP sold or purchased shares during FY2022, other than sales to satisfy taxation obligations, apart from Edgar Basto, who sold shares in order to fund the purchase of a residential dwelling. |
| |
Christine O’Reilly |
| Chair, Remuneration Committee |
| 16 August 2022 |
| Year ended 30 June US$M |
2022 |
2021 | 2020 | 2019 | 2018 | |||||||||||||||
| Consolidated Income Statement (Financial Statements 1.1) |
||||||||||||||||||||
| Revenue 1 |
65,098 |
56,921 | 38,924 | 38,446 | 37,817 | |||||||||||||||
| Profit from operations 1 |
34,106 |
25,515 | 13,683 | 13,629 | 14,437 | |||||||||||||||
| Profit after taxation from Continuing operations 1 |
22,400 |
13,676 | 8,628 | 8,528 | 8,559 | |||||||||||||||
| Profit/(loss) after taxation from Discontinued operations 1 |
10,655 |
(225 | ) | 108 | 657 | (3,736 | ) | |||||||||||||
| Profit after taxation from Continuing and Discontinued operations attributable to BHP shareholders (Attributable profit) |
30,900 |
11,304 | 7,956 | 8,306 | 3,705 | |||||||||||||||
| Profit after taxation from Continuing operations attributable to BHP shareholders 1 |
20,245 |
11,529 | 7,848 | 7,656 | 7,467 | |||||||||||||||
| Dividends per ordinary share – paid during the period (US cents) |
350.0 |
156.0 | 143.0 | 220.0 | 98.0 | |||||||||||||||
| Dividends per ordinary share – determined in respect of the period (US cents) |
325.0 |
301.0 | 120.0 | 235.0 | 118.0 | |||||||||||||||
| In specie dividend on merger of Petroleum with Woodside (US cents) |
386.4 |
– | – | – | – | |||||||||||||||
| Basic earnings per ordinary share (US cents) 2 |
610.6 |
223.5 | 157.3 | 160.3 | 69.6 | |||||||||||||||
| Diluted earnings per ordinary share (US cents) 2 |
609.3 |
223.0 | 157.0 | 159.9 | 69.4 | |||||||||||||||
| Basic earnings from Continuing operations per ordinary share (US cents) 1,2 |
400.0 |
228.0 | 155.2 | 147.8 | 140.3 | |||||||||||||||
| Diluted earnings from Continuing operations per ordinary share (US cents) 1,2 |
399.2 |
227.5 | 154.8 | 147.4 | 139.9 | |||||||||||||||
| Number of ordinary shares (million) 2 |
||||||||||||||||||||
| – At period end |
5,062 |
5,058 | 5,058 | 5,058 | 5,324 | |||||||||||||||
| – Weighted average |
5,061 |
5,057 | 5,057 | 5,180 | 5,323 | |||||||||||||||
| – Diluted |
5,071 |
5,068 | 5,069 | 5,193 | 5,337 | |||||||||||||||
| Consolidated Balance Sheet (Financial Statements 1.3) 3 |
||||||||||||||||||||
| Total assets |
95,166 |
108,927 | 105,733 | 101,811 | 112,943 | |||||||||||||||
| Net assets |
48,766 |
55,605 | 52,175 | 51,753 | 60,599 | |||||||||||||||
| Share capital (including share premium) |
4,638 |
2,686 | 2,686 | 2,686 | 2,761 | |||||||||||||||
| Total equity attributable to BHP shareholders |
44,957 |
51,264 | 47,865 | 47,169 | 55,521 | |||||||||||||||
| Consolidated Cash Flow Statement (Financial Statements 1.4) |
||||||||||||||||||||
| Net operating cash flows 4 |
32,174 |
27,234 | 15,706 | 17,871 | 18,461 | |||||||||||||||
| Capital and exploration expenditure 5 |
7,545 |
7,120 | 7,640 | 7,566 | 6,753 | |||||||||||||||
| Other financial information (OFR 11) |
||||||||||||||||||||
| Net debt 6 |
333 |
4,121 | 12,044 | 9,446 | 11,605 | |||||||||||||||
| Underlying attributable profit 6 |
23,815 |
17,077 | 9,060 | 9,124 | 8,933 | |||||||||||||||
| Underlying attributable profit - Continuing operations 1,6 |
21,319 |
16,985 | 8,948 | 8,431 | 10,393 | |||||||||||||||
| Underlying EBITDA 1,6 |
40,634 |
35,073 | 19,870 | 19,093 | 19,829 | |||||||||||||||
| Underlying EBIT 1,6 |
34,436 |
29,853 | 15,130 | 14,581 | 15,003 | |||||||||||||||
| Underlying basic earnings per share (US cents) 6 |
470.6 |
337.7 | 179.2 | 176.1 | 167.8 | |||||||||||||||
| Underlying basic earnings per share - Continuing operations (US cents) 1,6 |
421.2 |
335.9 | 176.9 | 162.8 | 195.2 | |||||||||||||||
| Underlying return on capital employed (per cent) 6 |
48.7 |
32.5 | 16.9 | 16.0 | 14.2 | |||||||||||||||
1 |
Comparative periods have been adjusted for the effects of applying IFRS 5 ‘Non-current Assets Held for Sale and Discontinued Operations’ and discloses them on the same basis as the current period figures. For more information refer to Financial Statements note 27 ‘Discontinued operations’. |
2 |
For more information on earnings per share refer to Financial Statements note 7 ‘Earnings per share’. |
3 |
The Consolidated Balance Sheet for comparative periods includes the associated assets and liabilities in relation to Petroleum (merger with Woodside in FY2022), BMC and Cerrejón (both disposed in FY2022) and Onshore US (disposed in FY2019) as IFRS 5 ‘Non-current Assets Held for Sale and Discontinued Operations’ does not require the Consolidated Balance Sheet to be restated for comparative periods. |
4 |
Net operating cash flows are after dividends received, net interest paid, proceeds and settlements of cash management related instruments, net taxation paid and includes Net operating cash flows from Discontinued operations. |
5 |
Capital and exploration expenditure is presented on a cash basis and represents purchases of property, plant and equipment plus exploration expenditure from the Consolidated Cash Flow Statement and includes purchases of property, plant and equipment plus exploration expenditure from Discontinued operations. For more information refer to Financial Statements note 27 ‘Discontinued operations’. Exploration expenditure is capitalised in accordance with our accounting policies, as set out in Financial Statements note 11 ‘Property, plant and equipment’. |
6 |
We use non-IFRS financial information to reflect the underlying performance of the Group. Underlying attributable profit, Underlying basic earnings per share and Underlying return on capital employed includes Continuing and Discontinued operations. Refer to OFR 11 for a reconciliation of non-IFRS financial information to their respective IFRS measure. Refer to OFR 11.1 for the definition and method of calculation of non-IFRS financial information. Refer to Financial Statements note 20 ‘Net debt’ for the composition of Net debt. |
| Mine & location |
Means of access |
Type and amount of ownership |
Operator |
Title, leases or options and acreage involved |
History and stage of property |
Mine type & mineralisation style |
Power source |
Processing plants and other available facilities | ||||||||
| Olympic Dam |
||||||||||||||||
| 560 km northwest of Adelaide, South Australia | Public road Copper cathode trucked to ports Uranium oxide transported by road to ports Gold bullion transported by road and plane |
BHP 100% | BHP | Mining lease granted by South Australian Government expires in 2036. Approximately 17,788 hectares Right of extension for 50 years (subject to remaining mine life) |
Production stage Acquired in 2005 as part of Western Mining Corporation (WMC) acquisition Copper production began in 1988 Nominal milling capacity raised to 9 Mtpa in 1999 Optimisation project completed in 2002 New copper solvent extraction plant commissioned in 2004 Major smelter maintenance campaigns completed in 2017 and 2022 |
Underground Large poly-metallic deposit of iron oxide-copper-uranium-gold mineralisation |
Electricity transmitted via (i) BHP’s 275 kV power line from Port Augusta and (ii) ElectraNet’s system upstream of Port Augusta Energy purchased via Retail Agreement |
Underground automated train and trucking network feeding crushing, storage and ore hoisting facilities 2 grinding circuits Nominal milling capacity: 10.3 Mtpa Flash furnace produces copper anodes, which are then refined to produce copper cathodes Electrowon copper cathode and uranium oxide concentrate produced by leaching and solvent extracting flotation tailings Gold cyanide leach circuit and gold room producing gold bullion | ||||||||
Key permit conditions |
The Roxby Downs (Indenture Ratification) Act 1982 (Indenture Act) applies to Olympic Dam’s operations. It contains conditions from the South Australian Government, including relating to the protection and management of the environment; water; closure and rehabilitation considerations; local procurement and community plans/initiatives/project commitments; and payment of royalties. Olympic Dam also holds other relevant approvals and tenements granted by the South Australian Government, including under the SA Mining Act. | |||||||||||||||
| Mine & location |
Means of access |
Type and amount of ownership |
Operator |
Title, leases or options and acreage involved |
History and stage of property |
Mine type & mineralisation style |
Power source |
Processing plants and other available facilities | ||||||||
| WAIO | ||||||||||||||||
| Mt Newman joint venture | ||||||||||||||||
| Pilbara region, Western Australia Newman West (Mt Whaleback, Orebodies 29, 30, 31, 32 and 35) Newman East (Orebodies 24, 25) |
Private road Ore transported by Mt Newman JV-owned rail to Port Hedland (427 km) |
BHP Minerals 85% Mitsui-ITOCHU Iron 10% ITOCHU Minerals and Energy of Australia 5% |
BHP | Mineral lease granted and held under the Iron Ore (Mount Newman) Agreement Act 1964 expires in 2030 with right to successive renewals of 21 years each. ML244SA - approximately 78,934 hectares | Production stage Production began at Mt Whaleback in 1969 Production from Orebodies 24, 25, 29, 30, 31, 32 and 35 complements production from Mt Whaleback Production from Orebodies 31 and 32 started in 2015 and 2017 respectively Mining at Orebody 18 ceased in 2020 after depletion |
Open-cut Bedded ore types classified as per host Archaean or Proterozoic iron formation, which are Brockman and Marra Mamba; also present is iron-rich detrital material |
Power for all mine operations in the Central and Eastern Pilbara is supplied by BHP’s natural gas-fired Yarnima power stationPower consumed in port operations is supplied via a contract with Alinta |
Newman Hub: primary crusher, ore handling plant, heavy media beneficiation plant, stockyard blending facility, single cell rotary car dumper, train load out (nominal capacity 75 Mtpa) Orebody 25 Ore processing plant (nominal capacity 12 Mtpa) ceased operation mid FY2022 | ||||||||
Key permit conditions |
State Agreement contains conditions set by the Western Australian Government, including requirements for future development proposals; environmental compliance and reporting obligations; closure and rehabilitation considerations; local procurement and community plans/initiatives/investment requirements; payment of rent, taxes and government royalties. Tenements granted by the Western Australian Government under the Mining Act. Key permit conditions include resource reporting, environmental compliance and reporting, rehabilitation considerations and offset payments and payment of lease rentals, and royalties. Registered Indigenous Land Use Agreements with conditions, including appropriate native title compensation and opportunity sharing; enshrine heritage protections and land access rights; and guarantee certain heritage, environment and consultation processes. | |||||||||||||||
| Mine & location |
Means of access |
Type and amount of ownership |
Operator |
Title, leases or options and acreage involved |
History and stage of property |
Mine type & mineralisation style |
Power source |
Processing plants and other available facilities | ||||||||
| WAIO |
||||||||||||||||
| Yandi joint venture |
||||||||||||||||
| Pilbara region, Western Australia | Private road Ore transported by Mt Newman JV-owned rail to Port Hedland (316 km)Yandi JV’s railway spur links Yandi hub to Mt Newman JV main line |
BHP Minerals 85% ITOCHU Minerals and Energy of Australia 8% Mitsui Iron Ore Corporation 7% |
BHP | Mining lease granted pursuant to the Iron Ore (Marillana Creek) Agreement Act 1991 expires in 2033 with 1 renewal right to a further 21 years to 2054 M270SA - approximately 30,344 hectares |
Production stage Production began at the Yandi mine in 1992 Capacity of Yandi hub expanded between 1994 and 2013 Yandi has commenced production ramp down activity in FY2022 |
Open-cut Channel Iron Deposits are Cainozoic fluvial sediments |
Power for all mine operations in the Central and Eastern Pilbara is supplied by BHP’s natural gas-fired Yarnima power stationPower consumed in port operations is supplied via a contract with Alinta |
4 primary crushers, 3 ore handling plants, stockyard blending facility and 2 train load outs (nominal capacity 80 Mtpa) Decommissioning has commenced on 2 ore handling plants, as part of planned ramp down activities | ||||||||
Key permit conditions |
State Agreement contains conditions set by the Western Australian Government, including requirements for future development proposals; environmental compliance and reporting obligations; closure and rehabilitation considerations; local procurement and community plans/initiatives/investment requirements; payment of rent, taxes and government royalties. Tenements granted by the Western Australian Government under the Mining Act. Key permit conditions include resource reporting, environmental compliance and reporting, rehabilitation considerations and offset payments and payment of lease rentals, and royalties. Registered Indigenous Land Use Agreements with conditions, including appropriate native title compensation and opportunity sharing; enshrine heritage protections and land access rights; and guarantee certain heritage, environment and consultation processes. | |||||||||||||||
| Mine & location |
Means of access |
Type and amount of ownership |
Operator |
Title, leases or options and acreage involved |
History and stage of property |
Mine type & mineralisation style |
Power source |
Processing plants and other available facilities | ||||||||
| WAIO |
||||||||||||||||
| Jimblebar operation* |
||||||||||||||||
| Pilbara region, Western Australia Jimblebar Bill’s Hill, Eastern Syncline and Mt Helen (jointly called Western Ridge deposits) |
Private road Jimblebar ore is transported via overland conveyor (12.4 km) and by Mt Newman JV-owned rail to Port Hedland (428 km)The Western Ridge deposits are located close to Newman Operations and all production will be trucked and/or transported via overland conveyor |
BHP Minerals 85% ITOCHU Minerals and Energy of Australia 8% Mitsui & Co. Iron Ore Exploration & Mining 7% *Jimblebar is an ‘incorporated’ venture, with the above companies holding A Class Shares with rights to certain parts of mining lease 266SA held by BHP Iron Ore (Jimblebar) Pty Ltd (BHPIOJ) BHPIOJ holds 100% of the B Class Shares, which has rights to all other Jimblebar assets |
BHP | Mining lease granted pursuant to the Iron Ore (McCamey’s Monster) Agreement Authorisation Act 1972 expires in 2030 with rights to successive renewals of 21 years each M266SA – approximately 51,756 hectares |
Production stage Production began in March 1989 From 2004, production was transferred to Wheelarra JV as part of the Wheelarra sublease agreement This sublease agreement expired in March 2018 Ore was first produced from the newly commissioned Jimblebar hub in late 2013 Jimblebar sells ore to the Newman JV proximate to the Jimblebar hub Production at Western Ridge commenced in FY2022 |
Open-cut Bedded ore types classified as per host Archaean or Proterozoic banded iron formation, which are Brockman and Marra Mamba; also present is iron-rich detrital material |
Power for all mine operations in the Central and Eastern Pilbara is supplied by BHP’s natural gas-fired Yarnima power stationPower consumed in port operations is supplied via a contract with Alinta |
3 primary crushers, ore handling plant, train loadout, stockyard blending facility and supporting mining hub infrastructure (nominal capacity 71 Mtpa) Production from the Western Ridge deposits will be processed through existing processing facility for Newman Operations | ||||||||
Key permit conditions |
State Agreement contains conditions set by the Western Australian Government, including requirements for future development proposals; environmental compliance and reporting obligations; closure and rehabilitation considerations; local procurement and community plans/initiatives/investment requirements; payment of rent, taxes and government royalties. Tenements granted by the Western Australian Government under the Mining Act. Key permit conditions include resource reporting, environmental compliance and reporting, rehabilitation considerations and offset payments and payment of lease rentals, and royalties. Registered Indigenous Land Use Agreement with conditions, including appropriate native title compensation and opportunity sharing; enshrine heritage protections and land access rights; and guarantee certain heritage, environment and consultation processes. | |||||||||||||||
| Mine & location |
Means of access |
Type and amount of ownership |
Operator |
Title, leases or options and acreage involved |
History and stage of property |
Mine type & mineralisation style |
Power source |
Processing plants and other available facilities | ||||||||
| WAIO |
||||||||||||||||
| Mt Goldsworthy joint venture |
||||||||||||||||
| Pilbara region, Western Australia Yarrie Nimingarra Mining Area C (includes South Flank) |
Private road Yarrie and Nimingarra iron ore transported by Mt Goldsworthy JV-owned rail to Port Hedland (218 km)Mining Area C iron ore transported by Mt Newman JV-owned rail to Port Hedland (360 km)South Flank iron ore transported by overland conveyors (8–16 km) to the Mining Area C processing hub Mt Goldsworthy JV railway spur links Mining Area C and South Flank to Yandi railway spur |
BHP Minerals 85% Mitsui Iron Ore Corporation 7% ITOCHU Minerals and Energy of Australia 8% |
BHP | 1 mineral lease and 1 mining lease both granted pursuant to the Iron Ore (Goldsworthy – Nimingarra) Agreement Act 1972, expire 2035, with rights to successive renewals of 21 years each. ML251SA and M263SA – approximately 15,623 hectares A number of smaller mining leases granted under the Mining Act 1978 expire in 2026 with rights to successive renewals of 21 years. 5 leases – approximately 2,999 hectares 3 mineral leases granted under the Iron Ore (Mount Goldsworthy) Agreement Act 1964, which expire 2028, with rights to successive renewals of 21 years each. ML235SA, ML249SA and ML281SA – approximately 91,124 hectares |
Production stage Operations commenced at Mt Goldsworthy in 1966 and at Shay Gap in 1973 Original Goldsworthy mine closed in 1982 Associated Shay Gap mine closed in 1993 Mining at Nimingarra mine ceased in 2007, then continued from adjacent Yarrie area Production commenced at Mining Area C mine in 2003 Yarrie mine operations were suspended in February 2014 First ore at South Flank commenced in May 2021 |
Mining Area C, South Flank, Yarrie and Nimingarra are open-cut Bedded ore types classified as per host Archaean or Proterozoic iron formation, which are Brockman, Marra Mamba and Nimingarra; also present is iron-rich detrital material |
Power for all remaining mine operations in the Central and Eastern Pilbara is supplied by BHP’s natural gas-fired Yarnima power stationPower consumed in port operations is supplied via a contract with Alinta |
Mining Area C: 2 primary crushers, 2 ore handling plants, stockyard blending facility and train load out (nominal capacity 60 Mtpa) South Flank: 2 primary crushers, 1 ore handling plant, stockyard and blending facility and train load out (nominal capacity 80 Mtpa) | ||||||||
Key permit conditions |
State Agreements contain conditions set by the Western Australian Government, including requirements for future development proposals; environmental compliance and reporting obligations; closure and rehabilitation considerations; local procurement and community plans/initiatives/investment requirements; payment of rent, taxes and government royalties. Tenements granted by the Western Australian Government under the Mining Act. Key permit conditions include resource reporting, environmental compliance and reporting, rehabilitation considerations and offset payments and payment of lease rentals, and royalties. Registered Indigenous Land Use Agreements with conditions, including appropriate native title compensation and opportunity sharing; enshrine heritage protections and land access rights; and guarantee certain heritage, environment and consultation processes. | |||||||||||||||
| Mine & location |
Means of access |
Type and amount of ownership |
Operator |
Title, leases or options and acreage involved |
History and stage of property |
Mine type & mineralisation style |
Power source |
Processing plants and other available facilities | ||||||||
WAIO |
||||||||||||||||
POSMAC joint venture |
||||||||||||||||
| Pilbara region, Western Australia | Private road POSMAC JV sells ore to Mt Goldsworthy JV at Mining Area C Ore is transported via Mt Goldsworthy JV-owned rail and Mt Newman JV-owned rail to Port Hedland |
BHP Minerals 65% ITOCHU Minerals and Energy of Australia 8% Mitsui Iron Ore Corporation 7% POS-Ore 20% |
BHP | Sublease over part of Mt Goldsworthy Mining Area C mineral lease that expires on the earlier of termination of the mineral lease or the end of the POSMAC JV. ML281SA – approximately 56,335 hectares | Production stage Production commenced in October 2003 POSMAC JV sells all ore to Mt Goldsworthy JV at Mining Area C |
Open-cut Bedded ore types classified as per host Archaean or Proterozoic iron formation, which is Marra Mamba |
Power for all mine operations in the Central and Eastern Pilbara is supplied by BHP’s natural gas-fired Yarnima power stationPower consumed in port operations is supplied via a contract with Alinta |
POSMAC sells all ore to Mt Goldsworthy JV, which is then processed at Mining Area C | ||||||||
Key permit conditions |
Key permit conditions of POSMAC joint venture are captured within the Mount Goldsworthy joint venture key permit conditions outlined above. | |||||||||||||||
| Mine & location |
Means of access |
Type and amount of ownership |
Operator |
Title, leases or options and acreage involved |
History and stage of property |
Mine type & mineralisation style |
Power source |
Processing plants and other available facilities | ||||||||
BHP Mitsubishi Alliance | ||||||||||||||||
Central Queensland Coal Associates joint venture | ||||||||||||||||
| Bowen Basin, Queensland, Australia Goonyella Riverside Broadmeadow Daunia Caval Ridge Peak Downs Saraji Blackwater Saraji South |
Public road Coal transported by rail to Hay Point, Gladstone, Dalrymple Bay and Abbot Point ports Distances between the mines and port are between 160 km and 315 km |
BHP 50% Mitsubishi Development 50% |
BMA | Mining leases, including undeveloped tenements, have expiry dates ranging up to 2043, renewable for further periods as Queensland Government legislation allows. Approximately 125,100 hectares Mining is permitted to continue under the legislation during the renewal application period All required renewal applications were lodged and pending a decision from the Minister |
Production stage Goonyella mine commenced in 1971, merged with adjoining Riverside mine in 1989 Operates as Goonyella Riverside Production commenced at: Peak Downs in 1972 Saraji in 1974 Norwich Park in 1979 Blackwater in 1967 Broadmeadow (longwall operations) in 2005 Daunia in 2013 and Caval Ridge in 2014 Production at Saraji South (formerly Norwich Park) ceased in May 2012; limited product is due to be sourced from Saraji South for processing at Saraji scheduled from the December 2022 quarter and will be included under the Saraji mine |
All open-cut except Broadmeadow (longwall underground)Bituminous coal is mined from the Permian Moranbah and Rangal Coal measures Products range from premium quality, low volatile, high vitrinite, hard coking coal to medium volatile hard coking coal, to weak coking coal, some pulverised coal injection (PCI) coal and medium ash thermal coal as a secondary product |
Queensland electricity grid connection is under long-term contracts and energy purchased via Retail Agreements | On-site beneficiation processing facilitiesCombined nominal capacity: in excess of 67 Mtpa | ||||||||
Key permit conditions |
Key permit conditions are contained in the various legislation set by the Queensland Government and include conditions relating to carrying out works in accordance with the environmental authority and approved development plans, payment of rents, reporting and payment of royalties. Mining leases granted under the Central Queensland Coal Associates Agreement Act 1968 place an extraction cap of 1,860 Mt. | |||||||||||||||
| Mine & location |
Means of access |
Type and amount of ownership |
Operator |
Title, leases or options and acreage involved |
History and stage of property |
Mine type & mineralisation style |
Power source |
Processing plants and other available facilities | ||||||||
New South Wales Energy Coal | ||||||||||||||||
Mt Arthur Coal | ||||||||||||||||
| Approximately 126 km northwest of Newcastle, New South Wales, Australia | Public road Export coal transported by third-party rail to Newcastle port |
BHP 100% | BHP | Current Development Consent expires in 2026 Mt Arthur Coal Mine (MAC) continues to work on obtaining new State and Commonwealth approvals to continue open-cut mining at MAC beyond 30 June 2026MAC holds 10 mining leases, 2 sub leases and 3 exploration licences MAC’s primary mining lease (ML 1487) was granted for a further 21-year term from June 2022Total mining leases approximately 8,750 hectares |
Production stage Production commenced in 2002 Approval to expand mining granted in 2010 with an additional area also granted by an approval modification in 2014 Domestic sales ceased during FY2020 with conveyor to Bayswater and Liddell Power Stations decommissioned On 16 June 2022, BHP announced the decision to cease mining at the asset by the end of FY2030 |
Open-cut Produces a medium rank bituminous thermal coal |
NSW electricity grid connection under a deemed long-term contract and energy purchased via a Retail Agreement | Beneficiation facilities: coal handling, preparation, washing plants Nominal capacity: in excess of 23 Mtpa | ||||||||
Key permit conditions |
The project approval contains key conditions: (i) it requires MAC to be operated generally in accordance with the environmental assessment; and (ii) permits extraction of up to 36 Mtpa of run of mine coal from underground and open-cut operations, with open-cut extraction limited to 32 Mtpa. | |||||||||||||||
| Mine & location |
Means of access |
Type and amount of ownership |
Operator |
Title, leases or options and acreage involved |
History and stage of property |
Mine type & mineralisation style |
Power source |
Processing plants and other available facilities | ||||||||
| Nickel West | ||||||||||||||||
| Mt Keith mine and concentrator | ||||||||||||||||
| 450 km north of Kalgoorlie, Western Australia Mt Keith Mine Mt Keith Satellite Mine (Yakabindie) |
Private road Nickel concentrate transported by road to Leinster for drying and on-shipping |
BHP 100% | BHP | Mining leases granted by Western Australian Government Key leases expire between 2029 and 2036 First renewal of 21 years is as a right. Further renewals at government discretion Mt Keith mining leases approximately 9,240 hectares Mt Keith satellite mining leases approximately 3,835 hectares |
Production stage Commissioned in 1995 by WMC Acquired in 2005 as part of WMC acquisition Mt Keith Satellite Mine contains 2 open-pit mines: Six Mile Well in full production and Goliath currently being pre-stripped |
Open-cut Disseminated textured magmatic nickel-sulphide mineralisation associated with a metamorphosed ultramafic intrusion |
On-site third-party gas-fired turbines with backup from diesel engine generationContracts expire in December 2038 Natural gas sourced and transported under separate long-term contracts |
Concentration plant with a nominal capacity of 11 Mtpa of ore | ||||||||
| Key permit conditions |
Use of the land for the purposes set out by the Western Australian Government under granted mining tenements and broadly comprise of submission of detailed mining proposals; payment of royalties, annual rent to the State Government; rates to relevant local governments; compliance with environmental regulations and mine closure requirements and other reporting obligations. Existing mining operations are also subject to an Indigenous Land Use Agreement (ILUA), which includes commitments for payments made to trust accounts; Indigenous employment and business opportunities; heritage and cultural protections. | |||||||||||||||
| Mine & location |
Means of access |
Type and amount of ownership |
Operator |
Title, leases or options and acreage involved |
History and stage of property |
Mine type & mineralisation style |
Power source |
Processing plants and other available facilities | ||||||||
| Nickel West |
||||||||||||||||
| Leinster mine complex and concentrator |
||||||||||||||||
| 375 km north of Kalgoorlie, Western Australia Venus sub-level caving operationB11 block caving operation Camelot open-pit mineRocky’s Reward open-pit mine |
Public road Nickel concentrate shipped by road and rail to Kalgoorlie Nickel Smelter |
BHP 100% | BHP | Mining leases granted by Western Australian Government Key leases expire between 2025 and 2040 Renewals of principal mineral lease in accordance with State Agreement ratified by the Nickel (Agnew) Agreement Act 1974 Leinster mining leases approximately 6,325 hectares Camelot mining leases approximately 2,353 hectares |
Production stage Production commenced in 1979 Acquired in 2005 as part of WMC acquisition Leinster underground ceased operations in 2013 and recommenced operations in 2016 with Venus sub-level cave now in operation and B11 block cave developing its undercut and draw pointsRocky’s Reward open-pit mine ceased mining in 2021 |
Open-cut and undergroundSteeply dipping disseminated and massive textured nickel-sulphide mineralisation associated with metamorphosed ultramafic lava flows and intrusions |
On-site third-party gas-fired turbines with back up from diesel engine generationContracts expire in December 2038 Natural gas sourced and transported under separate long-term contracts |
Concentration plant with a nominal capacity: 3 Mtpa of ore | ||||||||
Key permit conditions |
Use of the land for the purposes set out by the Western Australian Government in the Nickel (Agnew) Agreement Act 1974 and other Nickel West granted tenements broadly comprise of submission of detailed mining proposals; payment of royalties, annual rent to Western Australian Government; rates to relevant local governments; compliance with environmental regulations and mine closure requirements and other reporting obligations. Existing mining operations are also subject to an Indigenous Land Use Agreement (ILUA), which includes commitments for payments made to trust accounts; Indigenous employment and business opportunities; heritage and cultural protections. | |||||||||||||||
| Mine & location |
Means of access |
Type and amount of ownership |
Operator |
Title, leases or options and acreage involved |
History and stage of property |
Mine type & mineralisation style |
Power source |
Processing plants and other available facilities | ||||||||
Nickel West |
||||||||||||||||
Cliffs mine |
||||||||||||||||
| 450 km north of Kalgoorlie, Western Australia | Private road Nickel ore transported by road to Leinster or Mt Keith for further processing |
BHP 100% | BHP | Mining leases granted by Western Australian Government Key leases expire between 2025 and 2028 First renewal of 21 years is as of right. Further renewals at government discretion Mining leases approximately 2,675 hectares |
Production stage Production commenced in 2008 Acquired in 2005 as part of WMC acquisition |
Underground Steeply dipping massive textured nickel-sulphide mineralisation associated with metamorphosed ultramafic lava flows |
Supplied from Mt Keith | Mine site | ||||||||
Key permit conditions |
Use of the land for the purposes set out by the Western Australian Government under granted mining tenements and broadly comprise of submission of detailed mining proposals; payment of royalties, annual rent to the State Government; rates to relevant local government; compliance with environmental regulations and mine closure requirements and other reporting obligations. Existing mining operations are also subject to an Indigenous Land Use Agreement (ILUA), which includes commitments for payments made to trust accounts; Indigenous employment and business opportunities; heritage and cultural protections. | |||||||||||||||
| Smelter, refinery or processing plant |
Location |
Ownership |
Operator |
Title, leases or options |
Key permit conditions |
Product |
Power source |
Nominal production capacity | ||||||||
| Nickel West |
||||||||||||||||
| Kambalda |
||||||||||||||||
| nickel concentrator | 56 km south of Kalgoorlie, Western Australia | BHP 100% | BHP | Mineral leases granted by Western Australian Government Key leases expire in 2028 Mining leases approximately 242 hectares |
Use of the land for the purposes set out by the Western Australian Government under granted mining tenements and broadly comprise of submission of detailed mining proposals; payment of royalties, annual rent to the State Government; rates to relevant local government; compliance with environmental regulations and mine closure requirements and other reporting obligations | Concentrate containing approximately 13% nickel | On-site third-party gas-fired turbines supplemented by access to grid powerContracts expire in December 2038 Natural gas sourced and transported under separate long-term contracts |
1.6 Mtpa ore Nickel sourced through ore tolling and concentrate purchase arrangements with third parties in Kambalda and outer regions | ||||||||
| Kalgoorlie |
||||||||||||||||
| nickel smelter | Kalgoorlie, Western Australia | BHP 100% | BHP | Freehold title over the property | Matte containing approximately 65% nickel | On-site third-party gas-fired turbines supplemented by access to grid powerContracts expire in December 2038 Natural gas sourced and transported under separate long-term contracts |
110 ktpa nickel metal in matte | |||||||||
| Kwinana |
||||||||||||||||
| nickel refinery | 30 km south of Perth, Western Australia | BHP 100% | BHP | Freehold title over the property | London Metal Exchange grade nickel briquettes, nickel powder Also intermediate products, including copper sulphide, cobalt-nickel-sulphide, ammonium-sulphate Nickel sulphate containing approximately 22% nickel |
Power is sourced from the local grid, which is supplied under a retail contract, supplemented by a Power Purchase Agreement with Merredin Solar Farm for 50% of its output | 82.5 ktpa nickel metal in powder, briquettes, and nickel sulphate (with approval to increase up to 90 ktpa) 99 kt–100 kt nickel sulphate (approximately 22 kt–24 kt nickel) | |||||||||
| Mine & location |
Means of access |
Type and amount of ownership |
Operator |
Title, leases or options and acreage involved |
History and stage of property |
Mine type & mineralisation style |
Power source |
Processing plants and other available facilities | ||||||||
Escondida |
||||||||||||||||
| Atacama Desert 170 km southeast of Antofagasta, Chile |
Private road available for public use Copper cathode transported by privately owned rail to ports at Antofagasta and Mejillones Copper concentrate transported by Escondida-owned pipelines to its Coloso port facilities |
BHP 57.5% Rio Tinto 30% JECO Corporation consortium comprising Mitsubishi, JX Nippon Mining and Metals 10% JECO 2 Ltd 2.5% |
BHP | Mining concession from Chilean Government valid indefinitely (subject to payment of annual fees) Mining concessions (exploitation): approximately 380,000 hectares |
Production stage Original construction completed and production commenced in 1990 Start of operations of the third concentrator plant in 2015 Inauguration of Escondida Water Supply desalination plant (CY2018) and its extension (CY2019) |
2 open-cut pits: Escondida and Escondida NorteEscondida and Escondida Norte mineral deposits are adjacent but distinct supergene enriched porphyry copper deposits |
Escondida-owned transmission lines connect to Chile’s northern power grid Electricity sourced from external vendors and Tamakaya SpA (100% owned by BHP), which generates power from the Kelar gas-fired power plantRenewable power agreements signed in FY2020 with supply commenced in FY2022 |
Crushing facilities feed concentrator and leaching processes 3 concentrator plants produce copper concentrate from sulphide ore by flotation extraction process (by-products: gold and silver)2 solvent extraction and electrowinning plants produce copper cathode Nominal capacity: 422 ktpd (nominal milling capacity) and 350 ktpa copper cathode (nominal capacity of tank house) | ||||||||
| 2 x 168 km concentrate pipelines, 167 km water pipeline Port facilities at Coloso, Antofagasta Desalinated water plant (total water capacity of 3,800 litres per second) | ||||||||||||||||
Key permit conditions |
Mining companies in Chile must comply with an Environmental Impact Assessment (EIA) approved by the Environmental Assessment Service (SEA) in order to operate. Changes in the scope of the operation can trigger a Environmental Impact Declaration (DIA) or a full EIA. Mining companies must also pay a yearly mining concession. | |||||||||||||||
| Mine & location |
Means of access |
Type and amount of ownership |
Operator |
Title, leases or options and acreage involved |
History and stage of property |
Mine type & mineralisation style |
Power source |
Processing plants and other available facilities | ||||||||
Pampa Norte Spence |
||||||||||||||||
| Atacama Desert 162 km northeast of Antofagasta, Chile |
Public road Copper cathode transported by rail to ports at Mejillones and Antofagasta Copper concentrate transported by rail or trucks to port in Mejillones Molybdenum concentrate is transported by trucks |
BHP 100% | BHP | Mining concession from Chilean Government valid indefinitely (subject to payment of annual fees) Mining concessions (exploitation): approximately 44,000 hectares |
Production stage First copper produced in 2006 Spence Growth Option project (i.e. new 95 ktpd copper concentrator and molybdenum plants) produced first copper in December 2020 and first molybdenum in April 2022 |
Open-cut Enriched and oxidised porphyry copper deposit containing in situ copper oxide mineralisation that overlies a near-horizontal sequence of supergene sulphides, transitional sulphides, and finally primary (hypogene) sulphide mineralisation |
Spence-owned transmission lines connect to Chile’s northern power grid Electricity purchased from external vendors Renewable power agreements signed in FY2020 with supply commenced in FY2022 |
Crushing facilities feed concentrator and leaching processes 1 copper concentrator plant with 95 ktpd capacity (by-products: gold and silver), molybdenum plant and a 1,000 lps desalinated water plant under a Build, Own, Operate, Transfer (BOOT) agreementDynamic leach pads, solvent extraction and electrowinning plant Nominal capacity of tank house: 200 ktpa copper cathode | ||||||||
Key permit conditions |
Mining companies in Chile must comply with an EIA approved by the SEA in order to operate Changes in the scope of the operation can trigger a DIA or a full EIA Mining companies must also pay a yearly mining concession | |||||||||||||||
| Mine & location |
Means of access |
Type and amount of ownership |
Operator |
Title, leases or options and acreage involved |
History and stage of property |
Mine type & mineralisation style |
Power source |
Processing plants and other available facilities | ||||||||
Pampa Norte Cerro Colorado |
||||||||||||||||
| Atacama Desert 120 km east of Iquique, Chile |
Public road Copper cathode trucked to port at Iquique |
BHP 100% | BHP | Mining concession from Chilean Government valid indefinitely (subject to payment of annual fees) Current environmental licence expires at the end of CY2023 Mining concessions (exploitation): approximately 34,000 hectares |
Production stage Commercial production commenced in 1994 Expansions in 1996 and 1998 |
Open-cut Enriched and oxidised porphyry copper deposit containing in situ copper oxide mineralisation that overlies a near-horizontal sequence of supergene sulphides, transitional sulphides and finally primary (hypogene) sulphide mineralisation |
Electricity purchased from external vendors | Crushing facilities, dynamic leach pads, solvent extraction plant, electrowinning plant Nominal capacity of tank house: 130 ktpa copper cathode | ||||||||
Key permit conditions |
Mining companies in Chile must comply with an EIA approved by the SEA in order to operate. Changes in the scope of the operation can trigger a DIA or a full EIA. Mining companies must also pay a yearly mining concession. | |||||||||||||||
| Mine & location |
Means of access |
Type and amount of ownership |
Operator |
Title, leases or options and acreage involved |
History and stage of property |
Mine type & mineralisation style |
Power source |
Processing plants and other available facilities | ||||||||
| Antamina |
||||||||||||||||
| Andes mountain range 270 km northeast of Lima, Peru |
Public road Copper and zinc concentrates transported by Antamina-owned pipeline to its Punta Lobitos port Molybdenum and lead/bismuth concentrates transported by truck |
BHP 33.75% Glencore 33.75% Teck 22.5% Mitsubishi 10% |
Compañía Minera Antamina S.A. | Mining rights from Peruvian Government held indefinitely, subject to payment of annual fees and supply of information on investment and production Total acreage: approximately 6,600 hectares |
Production stage Commercial production commenced in 2001 |
Open-cut Zoned porphyry and skarn deposit with central copper dominated ores and an outer band of copper-zinc dominated ores |
Long-term contracts with individual power producers |
Primary crusher, concentrator, copper and zinc flotation circuits, bismuth/moly cleaning circuit Nominal milling capacity 145 ktpd 304 km concentrate pipeline Port facilities at Huarmey | ||||||||
Key permit conditions |
In April 2022, Antamina submitted to Peruvian authorities an Environmental Impact Study Modification (MEIA), which would enable Antamina to extend its life from 2028 to 2036, maintaining annual production volumes within its current operational footprint. | |||||||||||||||
| Mine & location |
Means of access |
Type and amount of ownership |
Operator |
Title, leases or options and acreage involved |
History and stage of property |
Mine type & mineralisation style |
Power source |
Processing plants and other available facilities | ||||||||
Resolution |
||||||||||||||||
| Superior, Arizona, Pinal County, US |
Public road | BHP 45% Rio Tinto 55% (operator) |
Resolution Copper Mining LLC | Private land, patented and unpatented mining claims Total acreage: approximately 46,000 acres |
Exploration stage The Resolution deposit is within the footprint and adjacent the historical Magma Copper Mine The Resolution Non-Operated Joint Venture (NOJV) was formed in 2004 with Rio Tinto as operator |
Underground Porphyry copper and molybdenum deposit |
115kV power lines to East and West Plant sites with supply contract with Salt River Project | Water treatment and reverse osmosis plant, two active underground shafts with associated support infrastructure including hoisting, ventilation and cooling, and a rail corridor connecting the site to the national rail network | ||||||||
| Key permit conditions | The Resolution Copper Project is subject to a federal permitting process pursuant to the National Environmental Policy Act (NEPA) and other U.S. legislation, including requirements for consultation, coordination and collaboration with Native American Tribes. The NEPA process is led by the U.S. Forest Service. The Resolution Copper Project is also required to obtain several state and local permits, including air quality and groundwater protection permits. | |||||||||||||||
| Mine & location |
Means of access |
Type and amount of ownership |
Operator |
Title, leases or options and acreage involved |
History and stage of property |
Mine type & mineralisation style |
Power source |
Processing plants and other available facilities | ||||||||
| Samarco |
||||||||||||||||
| Southeast Brazil | Public road Conveyor belts used to transport iron ore to beneficiation plant Three slurry pipelines owned by Samarco used to transport concentrate to its pellet plants on coast Iron ore pellets exported via port facilities |
BHP Brasil 50% Vale S.A. 50% |
Samarco | Mining concessions granted by Brazilian Government subject to compliance with the mine plan Samarco recommenced iron ore pellet production in December 2020, having met licensing requirements to restart operations at its Germano complex in Minas Gerais and its Ubu complex in Espírito Santo Mining rights for approximately 1,605 hectares |
Production stage Production began at Germano mine in 1977 and at Alegria complex in 1992 Second pellet plant built in 1997 Third pellet plant, second concentrator and second pipeline built in 2008 Fourth pellet plant, third concentrator and third pipeline built in 2014 |
Open-cut Itabirites (metamorphic quartz-hematite rock) and friable hematite ores |
Samarco holds interests in 2 hydroelectric power plants, which supply part of its electricity Power supply contract with Cemig Geração e Transmissão expires in 2026 |
Samarco’s gradual restart of operations includes 1 concentrator and a new system of tailings disposal combining a confined pit and filtration plant for dry stacking of sandy tailings Beneficiation plants, pipelines, pellet plants and port facilities | ||||||||
Key permit conditions |
Samarco has an operating licence (LOC – Corrective Operating License) obtained for the return of operations. For the continuity of operations, it has a long-term licensing plan that includes expansion of the mining area and new structures for the disposal of waste and tailings. | |||||||||||||||
| Mine & location |
Means of access |
Type and amount of ownership |
Operator |
Title, leases or options and acreage involved |
History and stage of property |
Mine type & mineralisation style |
Power source |
Processing plants and other available facilities | ||||||||
Jansen Stage 1 (under construction) |
||||||||||||||||
| Province of Saskatchewan Approximately 150 km east of Saskatoon, Canada |
Public road Muriate of Potash (MOP) to be transported by rail to the port at Westshore Terminal in Delta, British Columbia, Canada |
BHP 100% | BHP | The total area of the Jansen lease is approximately 1,156 square km All surface lands have been acquired |
Development stage Stage 1 is currently under construction |
Underground The Lower Patience Lake (LPL) sub-member is the potash horizon targeted for Jansen. The LPL sub-member is composed of sylvite (KCl), halite (NaCl) with variable amounts of disseminated insolubles and clay seams |
Permanent power supply to be constructed | Mill, buildings, and other facilities and infrastructure are planned to be constructed Construction of production and service shafts was completed during FY2022 | ||||||||
Key permit conditions |
An Environmental Assessment is required to be submitted to the regulatory authority in order to determine the potential environmental and social impacts of a project during construction, operation and closure. Depending on the activity, permits from municipal, provincial and federal agencies may also be required. | |||||||||||||||
| Year ended 30 June 2022 US$M |
Revenue |
Underlying EBITDA |
D&A |
Underlying EBIT |
Net operating assets |
Capital expenditure |
Exploration gross |
Exploration to profit |
||||||||||||||||||||||||
| Escondida 1 |
9,500 |
6,198 |
907 |
5,291 |
11,703 |
860 |
||||||||||||||||||||||||||
| Pampa Norte 2 |
2,670 |
1,363 |
893 |
470 |
4,543 |
673 |
||||||||||||||||||||||||||
| Antamina 3 |
1,777 |
1,289 |
146 |
1,143 |
1,306 |
323 |
||||||||||||||||||||||||||
| Olympic Dam |
1,776 |
409 |
421 |
(12 |
) |
9,877 |
966 |
|||||||||||||||||||||||||
| Other 3,4 |
– |
(157 |
) |
16 |
(173 |
) |
(9 |
) |
29 |
|||||||||||||||||||||||
| |
|
|
|
|
|
|
|
|
|
|
|
|||||||||||||||||||||
| Total Copper from Group production |
15,723 |
9,102 |
2,383 |
6,719 |
27,420 |
2,851 |
||||||||||||||||||||||||||
| |
|
|
|
|
|
|
|
|
|
|
|
|||||||||||||||||||||
| Third-party products |
2,903 |
36 |
– |
36 |
– |
– |
||||||||||||||||||||||||||
| |
|
|
|
|
|
|
|
|
|
|
|
|
|
|
|
|||||||||||||||||
| Total Copper |
18,626 |
9,138 |
2,383 |
6,755 |
27,420 |
2,851 |
96 |
92 |
||||||||||||||||||||||||
| |
|
|
|
|
|
|
|
|
|
|
|
|
|
|
|
|||||||||||||||||
| Adjustment for equity accounted investments 5 |
(1,777 |
) |
(573 |
) |
(148 |
) |
(425 |
) |
– |
(323 |
) |
(11 |
) |
(7 |
) | |||||||||||||||||
| |
|
|
|
|
|
|
|
|
|
|
|
|
|
|
|
|||||||||||||||||
| Total Copper statutory result |
16,849 |
8,565 |
2,235 |
6,330 |
27,420 |
2,528 |
85 |
85 |
||||||||||||||||||||||||
| |
|
|
|
|
|
|
|
|
|
|
|
|
|
|
|
|||||||||||||||||
| Year ended 30 June 2021 US$M |
Revenue | Underlying EBITDA |
D&A | Underlying EBIT |
Net operating assets |
Capital expenditure |
Exploration gross |
Exploration to profit |
||||||||||||||||||||||||
| Escondida 1 |
9,470 | 6,483 | 969 | 5,514 | 11,926 | 666 | ||||||||||||||||||||||||||
| Pampa Norte 2 |
1,801 | 954 | 390 | 564 | 4,510 | 678 | ||||||||||||||||||||||||||
| Antamina 3 |
1,627 | 1,158 | 142 | 1,016 | 1,362 | 237 | ||||||||||||||||||||||||||
| Olympic Dam |
2,211 | 598 | 313 | 285 | 9,045 | 830 | ||||||||||||||||||||||||||
| Other 3,4 |
– | (230 | ) | 10 | (240 | ) | 85 | 7 | ||||||||||||||||||||||||
| |
|
|
|
|
|
|
|
|
|
|
|
|||||||||||||||||||||
| Total Copper from Group production |
15,109 | 8,963 | 1,824 | 7,139 | 26,928 | 2,418 | ||||||||||||||||||||||||||
| |
|
|
|
|
|
|
|
|
|
|
|
|||||||||||||||||||||
| Third-party products |
2,244 | 64 | – | 64 | – | – | ||||||||||||||||||||||||||
| |
|
|
|
|
|
|
|
|
|
|
|
|
|
|
|
|||||||||||||||||
| Total Copper |
17,353 | 9,027 | 1,824 | 7,203 | 26,928 | 2,418 | 62 | 58 | ||||||||||||||||||||||||
| |
|
|
|
|
|
|
|
|
|
|
|
|
|
|
|
|||||||||||||||||
| Adjustment for equity accounted investments 5 |
(1,627 | ) | (538 | ) | (144 | ) | (394 | ) | – | (238 | ) | (9 | ) | (5 | ) | |||||||||||||||||
| |
|
|
|
|
|
|
|
|
|
|
|
|
|
|
|
|||||||||||||||||
| Total Copper statutory result |
15,726 | 8,489 | 1,680 | 6,809 | 26,928 | 2,180 | 53 | 53 | ||||||||||||||||||||||||
| |
|
|
|
|
|
|
|
|
|
|
|
|
|
|
|
|||||||||||||||||
1 |
Escondida is consolidated under IFRS 10 and reported on a 100 per cent basis. |
2 |
Includes Spence and Cerro Colorado. |
3 |
Antamina, SolGold and Resolution are equity accounted investments and their financial information presented above with the exception of net operating assets reflects BHP Group’s share. |
4 |
Predominantly comprises divisional activities, greenfield exploration and business development. Includes Resolution and SolGold. |
5 |
Total Copper statutory result revenue excludes US$1,777 million (FY2021: US$1,627 million) revenue related to Antamina. Total Copper statutory result Underlying EBITDA includes US$148 million (FY2021: US$144 million) D&A and US$425 million (FY2021: US$394 million) net finance costs and taxation expense related to Antamina, Resolution and SolGold that are also included in Underlying EBIT. Total Copper Capital expenditure excludes US$323 million (FY2021: US$237 million) related to Antamina and US$ nil (FY2021: US$1 million) related to SolGold. Exploration gross excludes US$11 million (FY2021: US$9 million) related to SolGold of which US$7 million (FY2021: US$5 million) was expensed. |
| Year ended 30 June 2022 US$M |
Revenue |
Underlying EBITDA |
D&A |
Underlying EBIT |
Net operating assets |
Capital expenditure |
Exploration gross 1 |
Exploration to profit |
||||||||||||||||||||||||
| Western Australia Iron Ore |
30,632 |
21,788 |
2,119 |
19,669 |
20,376 |
1,847 |
||||||||||||||||||||||||||
| Samarco 2 |
– |
– |
– |
– |
(3,433 |
) |
– |
|||||||||||||||||||||||||
| Other 3 |
116 |
(81 |
) |
117 |
(198 |
) |
(120 |
) |
1 |
|||||||||||||||||||||||
| |
|
|
|
|
|
|
|
|
|
|
|
|||||||||||||||||||||
| Total Iron Ore from Group production |
30,748 |
21,707 |
2,236 |
19,471 |
16,823 |
1,848 |
||||||||||||||||||||||||||
| |
|
|
|
|
|
|
|
|
|
|
|
|||||||||||||||||||||
| Third-party products 4 |
19 |
– |
– |
– |
– |
– |
||||||||||||||||||||||||||
| |
|
|
|
|
|
|
|
|
|
|
|
|
|
|
|
|||||||||||||||||
| Total Iron Ore |
30,767 |
21,707 |
2,236 |
19,471 |
16,823 |
1,848 |
95 |
54 |
||||||||||||||||||||||||
| |
|
|
|
|
|
|
|
|
|
|
|
|
|
|
|
|||||||||||||||||
| Adjustment for equity accounted investments |
– |
– |
– |
– |
– |
– |
– |
– |
||||||||||||||||||||||||
| |
|
|
|
|
|
|
|
|
|
|
|
|
|
|
|
|||||||||||||||||
| Total Iron Ore statutory result |
30,767 |
21,707 |
2,236 |
19,471 |
16,823 |
1,848 |
95 |
54 |
||||||||||||||||||||||||
| |
|
|
|
|
|
|
|
|
|
|
|
|
|
|
|
|||||||||||||||||
| Year ended 30 June 2021 US$M |
Revenue | Underlying EBITDA |
D&A | Underlying EBIT |
Net operating assets |
Capital expenditure |
Exploration gross 1 |
Exploration to profit |
||||||||||||||||||||||||
| Western Australia Iron Ore |
34,337 | 26,270 | 1,959 | 24,311 | 21,289 | 2,186 | ||||||||||||||||||||||||||
| Samarco 2 |
– | – | – | – | (2,794 | ) | – | |||||||||||||||||||||||||
| Other 3 |
120 | 7 | 25 | (18 | ) | 168 | 2 | |||||||||||||||||||||||||
| |
|
|
|
|
|
|
|
|
|
|
|
|||||||||||||||||||||
| Total Iron Ore from Group production |
34,457 | 26,277 | 1,984 | 24,293 | 18,663 | 2,188 | ||||||||||||||||||||||||||
| |
|
|
|
|
|
|
|
|
|
|
|
|||||||||||||||||||||
| Third-party products 4 |
18 | 1 | – | 1 | – | – | ||||||||||||||||||||||||||
| |
|
|
|
|
|
|
|
|
|
|
|
|
|
|
|
|||||||||||||||||
| Total Iron Ore |
34,475 | 26,278 | 1,984 | 24,294 | 18,663 | 2,188 | 100 | 55 | ||||||||||||||||||||||||
| |
|
|
|
|
|
|
|
|
|
|
|
|
|
|
|
|||||||||||||||||
| Adjustment for equity accounted investments |
– | – | – | – | – | – | – | – | ||||||||||||||||||||||||
| |
|
|
|
|
|
|
|
|
|
|
|
|
|
|
|
|||||||||||||||||
| Total Iron Ore statutory result |
34,475 | 26,278 | 1,984 | 24,294 | 18,663 | 2,188 | 100 | 55 | ||||||||||||||||||||||||
| |
|
|
|
|
|
|
|
|
|
|
|
|
|
|
|
|||||||||||||||||
1 |
Includes US$41 million of capitalised exploration (FY2021: US$45 million). |
2 |
Samarco is an equity accounted investment and its financial information presented above, with the exception of net operating assets, reflects BHP Billiton Brasil Ltda’s share. All financial impacts following the Samarco dam failure have been reported as exceptional items in both reporting periods. |
3 |
Predominantly comprises divisional activities, towage services, business development and ceased operations. |
4 |
Includes inter-segment and external sales of contracted gas purchases. |
| Year ended 30 June 2022 US$M |
Revenue |
Underlying EBITDA |
D&A |
Underlying EBIT |
Net operating assets |
Capital expenditure |
Exploration gross |
Exploration to profit |
||||||||||||||||||||||||
| BHP Mitsubishi Alliance |
10,254 |
6,335 |
627 |
5,708 |
7,802 |
491 |
||||||||||||||||||||||||||
| New South Wales Energy Coal 1 |
3,122 |
1,868 |
91 |
1,777 |
(121 |
) |
73 |
|||||||||||||||||||||||||
| Colombia 2 |
– |
– |
– |
– |
– |
– |
||||||||||||||||||||||||||
| Other 3,4 |
2,260 |
1,363 |
80 |
1,283 |
(31 |
) |
57 |
|||||||||||||||||||||||||
| |
|
|
|
|
|
|
|
|
|
|
|
|||||||||||||||||||||
| Total Coal from Group production |
15,636 |
9,566 |
798 |
8,768 |
7,650 |
621 |
||||||||||||||||||||||||||
| |
|
|
|
|
|
|
|
|
|
|
|
|||||||||||||||||||||
| Third-party products |
– |
– |
– |
– |
– |
– |
||||||||||||||||||||||||||
| |
|
|
|
|
|
|
|
|
|
|
|
|
|
|
|
|||||||||||||||||
| Total Coal |
15,636 |
9,566 |
798 |
8,768 |
7,650 |
621 |
17 |
6 |
||||||||||||||||||||||||
| |
|
|
|
|
|
|
|
|
|
|
|
|
|
|
|
|||||||||||||||||
| Adjustment for equity accounted investments 5,6 |
(87 |
) |
(62 |
) |
(27 |
) |
(35 |
) |
– |
– |
– |
– |
||||||||||||||||||||
| |
|
|
|
|
|
|
|
|
|
|
|
|
|
|
|
|||||||||||||||||
| Total Coal statutory result |
15,549 |
9,504 |
771 |
8,733 |
7,650 |
621 |
17 |
6 |
||||||||||||||||||||||||
| |
|
|
|
|
|
|
|
|
|
|
|
|
|
|
|
|||||||||||||||||
| Year ended 30 June 2021 US$M |
Revenue | Underlying EBITDA |
D&A | Underlying EBIT |
Net operating assets |
Capital expenditure |
Exploration gross |
Exploration to profit |
||||||||||||||||||||||||
| BHP Mitsubishi Alliance |
3,537 | 567 | 597 | (30 | ) | 7,240 | 440 | |||||||||||||||||||||||||
| New South Wales Energy Coal 1 |
927 | (87 | ) | 144 | (231 | ) | (289 | ) | 50 | |||||||||||||||||||||||
| Colombia 2 |
281 | 74 | 86 | (12 | ) | – | 21 | |||||||||||||||||||||||||
| Other 3,4 |
778 | (96 | ) | 152 | (248 | ) | 561 | 90 | ||||||||||||||||||||||||
| |
|
|
|
|
|
|
|
|
|
|
|
|||||||||||||||||||||
| Total Coal from Group production |
5,523 | 458 | 979 | (521 | ) | 7,512 | 601 | |||||||||||||||||||||||||
| |
|
|
|
|
|
|
|
|
|
|
|
|||||||||||||||||||||
| Third-party products |
– | – | – | – | – | – | ||||||||||||||||||||||||||
| |
|
|
|
|
|
|
|
|
|
|
|
|
|
|
|
|||||||||||||||||
| Total Coal |
5,523 | 458 | 979 | (521 | ) | 7,512 | 601 | 20 | 7 | |||||||||||||||||||||||
| |
|
|
|
|
|
|
|
|
|
|
|
|
|
|
|
|||||||||||||||||
| Adjustment for equity accounted investments 5,6 |
(369 | ) | (170 | ) | (114 | ) | (56 | ) | – | (22 | ) | – | – | |||||||||||||||||||
| |
|
|
|
|
|
|
|
|
|
|
|
|
|
|
|
|||||||||||||||||
| Total Coal statutory result |
5,154 | 288 | 865 | (577 | ) | 7,512 | 579 | 20 | 7 | |||||||||||||||||||||||
| |
|
|
|
|
|
|
|
|
|
|
|
|
|
|
|
|||||||||||||||||
1 |
Newcastle Coal Infrastructure Group is an equity accounted investment and its financial information presented above with the exception of net operating assets reflects BHP Group’s share. |
2 |
On 11 January 2022, BHP completed the sale of its 33.33 per cent interest in Cerrejón to Glencore. The transaction was first announced on 28 June 2021 for a total cash consideration of US$294 million with an effective economic date of 31 December 2020. During the year ended 30 June 2022, the Group received dividends of US$238 million from Cerrejón, reducing completion proceeds, net of expected transaction costs at completion date. For more information refer to Financial Statements note 29 ‘Investments accounted for using the equity method’. |
3 |
On 3 May 2022, BHP completed the sale of its 80 per cent interest in BHP Mitsui Coal (BMC) to Stanmore SMC Holdings Pty Ltd, a wholly owned entity of Stanmore Resources Limited (Stanmore Resources) resulting in a net after tax gain on disposal of US$840 million that has been recognised as an exceptional item. For more information refer to Financial Statements note 3 ‘Exceptional items’. The Group’s share of BMC revenue, Underlying EBITDA, D&A, Underlying EBIT, Net operating assets and Capital expenditure have been presented within ‘Other’. |
4 |
Predominantly comprises BMC, divisional activities and ceased operations. |
5 |
Total Coal statutory result revenue excludes US$ nil (FY2021: US$281 million) revenue related to Cerrejón. Total Coal statutory result Underlying EBITDA includes US$ nil (FY2021: US$86 million) D&A and US$ nil (FY2021: US$2 million) net finance costs and taxation benefit related to Cerrejón, that are also included in Underlying EBIT. Total Coal statutory result Capital expenditure excludes US$ nil (FY2021: US$21 million) related to Cerrejón. |
6 |
Total Coal statutory result revenue excludes US$87 million (FY2021: US$88 million) revenue related to Newcastle Coal Infrastructure Group. Total Coal statutory result excludes US$62 million (FY2021: US$82 million) Underlying EBITDA, US$27 million (FY2021: US$28 million) D&A and US$35 million (FY2021: US$54 million) Underlying EBIT related to Newcastle Coal Infrastructure Group until future profits exceed accumulated losses. Total Coal Capital expenditure excludes US$ nil (FY2021: US$1 million) related to Newcastle Coal Infrastructure Group. |
| Year ended 30 June 2022 US$M |
Revenue |
Underlying EBITDA |
D&A |
Underlying EBIT |
Net operating assets |
Capital expenditure |
Exploration gross |
Exploration to profit |
||||||||||||||||||||||||
| Potash |
– |
(147 |
) |
2 |
(149 |
) |
3,570 |
376 |
– |
– |
||||||||||||||||||||||
| Nickel West |
1,926 |
420 |
93 |
327 |
721 |
362 |
42 |
37 |
||||||||||||||||||||||||
| |
|
|
|
|
|
|
|
|
|
|
|
|
|
|
|
|||||||||||||||||
| Year ended 30 June 2021 US$M |
Revenue | Underlying EBITDA |
D&A | Underlying EBIT |
Net operating assets |
Capital expenditure |
Exploration gross |
Exploration to profit |
||||||||||||||||||||||||
| Potash |
– |
(167 | ) | 2 | (169 | ) | 3,073 | 268 | – |
– |
||||||||||||||||||||||
| Nickel West |
1,545 | 259 | 110 | 149 | 300 | 286 | 17 | 17 | ||||||||||||||||||||||||
| |
|
|
|
|
|
|
|
|
|
|
|
|
|
|
|
|||||||||||||||||
BHP interest % |
BHP share of production 1 Year ended 30 June |
|||||||||||||||
2022 |
2021 | 2020 | ||||||||||||||
| Copper 2 |
||||||||||||||||
| Payable metal in concentrate (‘000 tonnes) |
||||||||||||||||
| Escondida, Chile 3 |
57.5 | 802.6 |
871.7 | 925.9 | ||||||||||||
| Pampa Norte, Chile 5 |
100 | 111.2 |
27.4 | 0 | ||||||||||||
| Antamina, Peru 4 |
33.75 | 149.9 |
144.0 | 124.5 | ||||||||||||
| |
|
|
|
|
|
|||||||||||
| Total copper concentrate |
1,063.7 |
1,043.1 | 1,050.4 | |||||||||||||
| |
|
|
|
|
|
|||||||||||
| Copper cathode (‘000 tonnes) |
||||||||||||||||
| Escondida, Chile 3 |
57.5 | 201.4 |
196.5 | 259.4 | ||||||||||||
| Pampa Norte, Chile 5 |
100 | 170.0 |
190.8 | 242.7 | ||||||||||||
| Olympic Dam, Australia |
100 | 138.4 |
205.3 | 171.6 | ||||||||||||
| |
|
|
|
|
|
|||||||||||
| Total copper cathode |
509.8 |
592.6 | 673.7 | |||||||||||||
| |
|
|
|
|
|
|||||||||||
| Total copper concentrate and cathode |
1,573.5 |
1,635.7 | 1,724.1 | |||||||||||||
| |
|
|
|
|
|
|||||||||||
| Lead |
||||||||||||||||
| Payable metal in concentrate (‘000 tonnes) |
||||||||||||||||
| Antamina, Peru 4 |
33.75 | 1.1 |
2.5 | 1.7 | ||||||||||||
| |
|
|
|
|
|
|||||||||||
| Total lead |
1.1 |
2.5 | 1.7 | |||||||||||||
| |
|
|
|
|
|
|||||||||||
| Zinc |
||||||||||||||||
| Payable metal in concentrate (‘000 tonnes) |
||||||||||||||||
| Antamina, Peru 4 |
33.75 | 123.2 |
145.1 | 88.5 | ||||||||||||
| |
|
|
|
|
|
|||||||||||
| Total zinc |
123.2 |
145.1 | 88.5 | |||||||||||||
| |
|
|
|
|
|
|||||||||||
| Gold |
||||||||||||||||
| Payable metal in concentrate (‘000 ounces) |
||||||||||||||||
| Escondida, Chile 3 |
57.5 | 167.0 |
167.0 | 177.4 | ||||||||||||
| Pampa Norte, Chile 5 |
100 | 28.9 |
4.7 | |||||||||||||
| Olympic Dam, Australia (refined gold) |
100 | 119.5 |
146.0 | 146.0 | ||||||||||||
| |
|
|
|
|
|
|||||||||||
| Total gold |
315.4 |
317.7 | 323.4 | |||||||||||||
| |
|
|
|
|
|
|||||||||||
| Silver |
||||||||||||||||
| Payable metal in concentrate (‘000 ounces) |
||||||||||||||||
| Escondida, Chile 3 |
57.5 | 5,334 |
5,759 | 6,413 | ||||||||||||
| Antamina, Peru 4 |
33.75 | 5,078 |
5,965 | 4,116 | ||||||||||||
| Pampa Norte, Chile 5 |
100 | 1,011 |
214 | |||||||||||||
| Olympic Dam, Australia (refined silver) |
100 | 743 |
810 | 984 | ||||||||||||
| |
|
|
|
|
|
|||||||||||
| Total silver |
12,166 |
12,748 | 11,513 | |||||||||||||
| |
|
|
|
|
|
|||||||||||
| Uranium |
||||||||||||||||
| Payable metal in concentrate (tonnes) |
||||||||||||||||
| Olympic Dam, Australia |
100 | 2,375 |
3,267 | 3,678 | ||||||||||||
| |
|
|
|
|
|
|||||||||||
| Total uranium |
2,375 |
3,267 | 3,678 | |||||||||||||
| |
|
|
|
|
|
|||||||||||
| Molybdenum |
||||||||||||||||
| Payable metal in concentrate (tonnes) |
||||||||||||||||
| Antamina, Peru 4 |
33.75 | 798 |
863 | 1,666 | ||||||||||||
| Pampa Norte, Chile 5 |
100 | 71 |
||||||||||||||
| |
|
|
|
|
|
|||||||||||
| Total molybdenum |
869 |
863 | 1,666 | |||||||||||||
| |
|
|
|
|
|
|||||||||||
BHP interest % |
BHP Group share of production 1 Year ended 30 June |
|||||||||||||||
2022 |
2021 | 2020 | ||||||||||||||
| Iron ore |
||||||||||||||||
| Western Australia Iron Ore |
||||||||||||||||
| Production (‘000 tonnes) 6 |
||||||||||||||||
| Newman, Australia |
85 | 57,041 |
63,221 | 65,641 | ||||||||||||
| Area C Joint Venture, Australia |
85 | 94,431 |
52,386 | 51,499 | ||||||||||||
| Yandi Joint Venture, Australia |
85 | 38,922 |
68,596 | 69,262 | ||||||||||||
| Jimblebar, Australia 7 |
85 | 58,782 |
67,393 | 61,754 | ||||||||||||
| Wheelarra, Australia |
85 | 0 |
0 | 3 | ||||||||||||
| |
|
|
|
|
|
|||||||||||
| Total Western Australia Iron Ore |
249,176 |
251,596 | 248,159 | |||||||||||||
| |
|
|
|
|
|
|||||||||||
| Samarco, Brazil 4 |
50 | 4,071 |
1,938 | – | ||||||||||||
| |
|
|
|
|
|
|||||||||||
| Total iron ore |
253,247 |
253,534 | 248,159 | |||||||||||||
| |
|
|
|
|
|
|||||||||||
| Coal |
||||||||||||||||
| Metallurgical coal |
||||||||||||||||
| Production (‘000 tonnes) 8 |
||||||||||||||||
| Blackwater, Australia |
50 | 5,834 |
6,224 | 5,545 | ||||||||||||
| Goonyella Riverside, Australia |
50 | 8,360 |
9,448 | 8,765 | ||||||||||||
| Peak Downs, Australia |
50 | 4,944 |
5,892 | 5,783 | ||||||||||||
| Saraji, Australia |
50 | 4,614 |
4,489 | 4,963 | ||||||||||||
| Daunia, Australia |
50 | 1,491 |
1,928 | 2,170 | ||||||||||||
| Caval Ridge, Australia |
50 | 3,899 |
3,903 | 4,349 | ||||||||||||
| |
|
|
|
|
|
|||||||||||
| Total BHP Mitsubishi Alliance |
29,142 |
31,884 | 31,575 | |||||||||||||
| |
|
|
|
|
|
|||||||||||
| South Walker Creek, Australia 9 |
80 | 4,941 |
4,887 | 5,415 | ||||||||||||
| Poitrel, Australia 9 |
80 | 2,981 |
3,854 | 4,128 | ||||||||||||
| |
|
|
|
|
|
|||||||||||
| Total BHP Mitsui Coal 11 |
7,922 |
8,741 | 9,543 | |||||||||||||
| |
|
|
|
|
|
|||||||||||
| Total metallurgical coal |
37,064 |
40,625 | 41,118 | |||||||||||||
| |
|
|
|
|
|
|||||||||||
| Energy coal |
||||||||||||||||
| Production (‘000 tonnes) |
||||||||||||||||
| New South Wales Energy Coal, Australia |
100 | 13,701 |
14,326 | 16,052 | ||||||||||||
| Cerrejón, Colombia 4 |
33.3 | 4,236 |
4,964 | 7,115 | ||||||||||||
| |
|
|
|
|
|
|||||||||||
| Total energy coal |
17,937 |
19,290 | 23,167 | |||||||||||||
| |
|
|
|
|
|
|||||||||||
| Nickel |
||||||||||||||||
| Saleable production (‘000 tonnes) |
||||||||||||||||
| Nickel West, Australia 10 |
100 | 76.8 |
89.0 | 80.1 | ||||||||||||
| |
|
|
|
|
|
|||||||||||
| Total nickel |
76.8 |
89.0 | 80.1 | |||||||||||||
| |
|
|
|
|
|
|||||||||||
1 |
BHP share of production includes the Group’s share of production for which profit is derived from our equity accounted investments, unless otherwise stated. |
2 |
Metal production is reported on the basis of payable metal. |
3 |
Shown on 100 per cent basis. BHP interest in saleable production is 57.5 per cent. |
4 |
For statutory financial reporting purposes, this is an equity accounted investment. We have included production numbers from our equity accounted investments as the level of production and operating performance from these operations impacts Underlying EBITDA of the Group. Our use of Underlying EBITDA is explained in OFR 4.3. BHP completed the sale of its 33.3 per cent interest in Cerrejón on 11 January 2022. Production for Cerrejón reported until 31 December 2021. |
5 |
Includes Cerro Colorado and Spence. |
6 |
Iron ore production is reported on a wet tonnes basis. |
7 |
Shown on 100 per cent basis. BHP interest in saleable production is 85 per cent. |
8 |
Metallurgical coal production is reported on the basis of saleable product. Production figures include some thermal coal. |
9 |
Shown on 100 per cent basis. BHP interest in saleable production is 80 per cent. |
10 |
Nickel contained in matte and refined nickel metal, including briquette, powder, nickel sulphate and by-product streams. |
11 |
BHP completed the sale of its 80 per cent interest in BHP Mitsui Coal (BMC) on 3 May 2022. Production reported until 30 April 2022. |
| • | documented procedures and standards defining minimum requirements on critical aspects to support exploration and resource development programs |
| • | peer review of data collection including staged sign off by reviewers |
| • | quality control checks on drill hole positions, collar and down hole surveys |
| • | geological logs verified by either peer review or cross validation from other data sources, such as, sample analysis, downhole geophysical logging, core photography or scanning technologies |
| • | sample security protocols at all stages of handling, from sample collection, transportation, preparation and analysis, including the storage of core or pulps post analysis |
| • | industry standard practices for sample analysis quality control. Insertion of standards, duplicates, and blanks into sample batches at a frequency to enable the assessment of analytical data quality |
| • | commercial or internal laboratories site inspected periodically and their internal quality control data is reviewed. From time to time a selection of samples are analysed at alternate laboratories to monitor laboratory performance |
| • | quality control data reviewed at regular intervals to verify deviations to enable timely remediation |
| • | quality assurance and quality control data validation and verification processes in place to support database integrity. This is based on automatic routines inbuilt into the geological databases. Inconsistencies are reviewed, verified and where required rectified by the responsible geologist |
| • | geological databases periodically audited from source data |
| • | geological data is stored on company servers and are routinely backed up |
| • | geological models, including interpretation and mineralisation domains, internally peer reviewed prior to estimation |
| • | source data review from database extracts, using exploratory data statistical analysis prior to use in the estimation of mineral resources. Identification of data to exclude, outliers and visual checks against estimation domains |
| • | peer reviews of the estimation inputs based on statistical studies and estimation parameters as applied in industry standard estimation software |
| • | visual and statistical validation of the estimates against source data and where available reconciliation to previous models, operational models and production data |
| • | peer review of the classification applied, considering quantitative measures and qualitative considerations |
| • | peer review of assumptions applied that convert resources to reserves |
| • | independent audits or reviews for new or materially changed mineral resources and mineral reserves |
| • | areas of uncertainty in the estimates impacting local interpretations |
| • | bulk density assumptions, based on sample test work or operational results |
| • | metallurgical recovery assumptions, based on test work or plant performance |
| • | changes in commodity prices, costs and exchange rate assumptions |
| • | geotechnical and hydrogeological considerations impacting on underground or open-cut mining assumptions |
| • | ore loss and dilution, mining selectivity and production rate assumptions |
| • | cut-off value changes to meet product specifications |
| • | changes in environmental, permitting and social license to operate assumptions |
| • | The reporting of mineral resources and mineral reserves estimates are required to follow BHP’s standard procedures for public reporting in accordance with current regulatory requirements. |
| • | Annual risk reviews are conducted with qualified persons and BHP employees on all mineral resources and mineral reserves to be reported including year on year change impact assessment, reconciliation performance metrics for the operating mines and control assessment for the estimation inputs. The information and supporting documentation is prepared by the applicable qualified persons relating to the estimates and is evaluated for compliance with BHP’s internal controls. Based on these reviews, recommendations of endorsement are provided to our senior management for the use and reporting of the mineral resources and mineral reserves estimates. |
| • | Periodic internal technical ‘deep dive’ assessments of mineral resources and mineral reserves estimates are conducted on a frequency that is informed by asset materiality and outcomes of the annual risk reviews. |
| • | Management and closure reviews of actions assigned to qualified persons and BHP employees resulting from the annual risk reviews and technical ‘deep dive’ assessments are conducted. |
| • | Assurance is undertaken over the reporting documentation provided by qualified persons for public release and management and verification of inputs into BHP mineral resources and mineral reserves reporting database. |
| Copper 1,2 |
Mining Method |
Measured Resources |
Indicated Resources |
Measured + Indicated Resources |
Inferred Resources |
|||||||||||||||||||||||||||||||||||||||||||||||||||||||||||||||||||||||||||||||
Tonnage |
Qualities |
Tonnage |
Qualities |
Tonnage |
Qualities |
Tonnage |
Qualities |
|||||||||||||||||||||||||||||||||||||||||||||||||||||||||||||||||||||||||||||
Mt |
%Cu |
Mt |
%Cu |
Mt |
%Cu |
Mt |
%Cu |
|||||||||||||||||||||||||||||||||||||||||||||||||||||||||||||||||||||||||||||
| Chile |
|
|||||||||||||||||||||||||||||||||||||||||||||||||||||||||||||||||||||||||||||||||||
| Escondida 3,4,5,6,7 |
||||||||||||||||||||||||||||||||||||||||||||||||||||||||||||||||||||||||||||||||||||
| Oxide |
OC | 4.0 | 0.48 | – | – | – | 5.0 | 0.47 | – | – | – | 9.0 | 0.48 | – | – | – | 2.0 | 0.75 | – | – | – | |||||||||||||||||||||||||||||||||||||||||||||||||||||||||||||||
| Mixed |
OC | 4.0 | 0.53 | – | – | – | 9.0 | 0.44 | – | – | – | 13 | 0.47 | – | – | – | 11 | 0.49 | – | – | – | |||||||||||||||||||||||||||||||||||||||||||||||||||||||||||||||
| Sulphide |
OC | 596 | 0.49 | – | – | – | 1,020 | 0.49 | – | – | – | 1,620 | 0.49 | – | – | – | 5,370 | 0.53 | – | – | – | |||||||||||||||||||||||||||||||||||||||||||||||||||||||||||||||
| |
|
|
|
|
|
|
|
|
|
|
|
|
|
|
|
|
|
|
|
|
|
|
|
|
|
|
|
|
|
|
|
|
|
|
|
|
|
|
|
|||||||||||||||||||||||||||||||||||||||||||||
| Escondida Total |
604 |
0.49 |
– |
– |
– |
1,030 |
0.49 |
– |
– |
– |
1,640 |
0.49 |
– |
– |
– |
5,380 |
0.53 |
– |
– |
– |
||||||||||||||||||||||||||||||||||||||||||||||||||||||||||||||||
| |
|
|
|
|
|
|
|
|
|
|
|
|
|
|
|
|
|
|
|
|
|
|
|
|
|
|
|
|
|
|
|
|
|
|
|
|
|
|
|
|||||||||||||||||||||||||||||||||||||||||||||
| Pampa Norte 8 |
OC | 282 | 0.45 | – | – | – | 570 | 0.47 | – | – | – | 852 | 0.46 | – | – | – | 636 | 0.44 | – | – | – | |||||||||||||||||||||||||||||||||||||||||||||||||||||||||||||||
Australia |
Mt |
%Cu |
kg/tU 3 O8 |
g/tAu |
g/tAg |
Mt |
%Cu |
kg/tU 3 O8 |
g/tAu |
g/tAg |
Mt |
%Cu |
kg/tU 3 O8 |
g/tAu |
g/tAg |
Mt |
%Cu |
kg/tU 3 O8 |
g/tAu |
g/tAg |
||||||||||||||||||||||||||||||||||||||||||||||||||||||||||||||||
| Olympic Dam 9 |
UG | 485 | 1.32 | 0.38 | 0.56 | 2 | 437 | 1.26 | 0.37 | 0.50 | 2 | 922 | 1.29 | 0.38 | 0.53 | 2 | 170 | 1.41 | 0.39 | 0.62 | 3 | |||||||||||||||||||||||||||||||||||||||||||||||||||||||||||||||
Peru |
Mt |
%Cu |
%Zn |
g/tAg |
ppmMo |
Mt |
%Cu |
%Zn |
g/tAg |
ppmMo |
Mt |
%Cu |
%Zn |
g/tAg |
ppmMo |
Mt |
%Cu |
%Zn |
g/tAg |
ppmMo |
||||||||||||||||||||||||||||||||||||||||||||||||||||||||||||||||
| Antamina 10 |
|
OC & UG |
|
41 | 0.70 | 0.51 | 11 | 150 | 159 | 0.85 | 0.63 | 11 | 180 | 200 | 0.82 | 0.61 | 11 | 180 | 425 | 0.99 | 0.57 | 11 | 170 | |||||||||||||||||||||||||||||||||||||||||||||||||||||||||||||
| |
|
|
|
|
|
|
|
|
|
|
|
|
|
|
|
|
|
|
|
|
|
|
|
|
|
|
|
|
|
|
|
|
|
|
|
|
|
|
|
|||||||||||||||||||||||||||||||||||||||||||||
| Total copper |
1,410 |
0.77 |
– |
– |
– |
2,200 |
0.66 |
– |
– |
– |
3,620 |
0.71 |
– |
– |
– |
6,610 |
0.57 |
– |
– |
– |
||||||||||||||||||||||||||||||||||||||||||||||||||||||||||||||||
| |
|
|
|
|
|
|
|
|
|
|
|
|
|
|
|
|
|
|
|
|
|
|
|
|
|
|
|
|
|
|
|
|
|
|
|
|
|
|
|
|||||||||||||||||||||||||||||||||||||||||||||
1 |
Mineral resources are being first time reported in accordance with S-K 1300 and are presented for the portion attributable to BHP’s economic interest. All tonnes and quality information have been rounded, small differences may be present in the totals. |
2 |
Mineral resources are presented exclusive of mineral reserves. |
3 |
Escondida, in which BHP has a 57.5% interest, is considered a material property for purposes of Item 1304 of S-K 1300. |
4 |
Escondida point of reference for the mineral resources was mine gate. |
5 |
Escondida mineral resources estimates were based on a copper price of US$3.04/lb. |
6 |
Escondida mineral resources cut-off criteria used was Oxide ≥ 0.20% soluble Cu; Mixed ≥ 0.30% Cu; Sulphide ≥ 0.25% Cu for mineralisation assigned to be processed via leaching or ≥ 0.30% Cu for mineralisation assigned to be processed via the concentrator. |
7 |
Escondida metallurgical recoveries for Oxide 62%; Mixed 42%; Sulphide 42% for material processed by leaching or 83% for material processed via the concentrator. |
8 |
Pampa Norte, in which BHP has a 100% interest, includes Cerro Colorado and Spence deposits. The mineral resources estimates were based on a copper price of US$3.04/lb. The reference point for the mineral resources was mine gate. |
9 |
Olympic Dam mineral resources estimates, in which BHP has a 100% interest, were based on a copper price of US$3.04/lb, uranium oxide price of US$30.06/lb, gold price of US$1,817/troy oz and silver price of US$24.40/troy oz. The reference point for the mineral resources was mine gate, ex-processing. |
10 |
Antamina mineral resources estimates, in which BHP has a 33.75% interest, were based on a copper price of US$3.30/lb, zinc price of US$1.20/lb, silver price of US$25.10/troy oz and molybdenum price of US$11.10/lb. The reference point for the mineral resources was in situ. |
| Copper 1 |
Mining Method |
Proven Reserves |
Probable Reserves |
Total Reserves |
||||||||||||||||||||||||||||||||||||||||||||||||||||||||||||
Tonnage |
Qualities |
Tonnage |
Qualities |
Tonnage |
Qualities |
|||||||||||||||||||||||||||||||||||||||||||||||||||||||||||
Mt |
%Cu |
Mt |
%Cu |
Mt |
%Cu |
|||||||||||||||||||||||||||||||||||||||||||||||||||||||||||
| Chile |
||||||||||||||||||||||||||||||||||||||||||||||||||||||||||||||||
| Escondida 2,3,4,5,6 |
||||||||||||||||||||||||||||||||||||||||||||||||||||||||||||||||
| Oxide |
OC | 75 | 0.57 | – | – | – | 31 | 0.51 | – | – | – | 106 | 0.55 | – | – | – | ||||||||||||||||||||||||||||||||||||||||||||||||
| Sulphide |
OC | 1,560 | 0.70 | – | – | – | 939 | 0.56 | – | – | – | 2,500 | 0.65 | – | – | – | ||||||||||||||||||||||||||||||||||||||||||||||||
| Sulphide Leach |
OC | 755 | 0.46 | – | – | – | 197 | 0.40 | – | – | – | 952 | 0.45 | – | – | – | ||||||||||||||||||||||||||||||||||||||||||||||||
| |
|
|
|
|
|
|
|
|
|
|
|
|
|
|
|
|
|
|
|
|
|
|
|
|
|
|
|
|
|
|||||||||||||||||||||||||||||||||||
| Escondida Total |
2,390 |
0.62 |
– |
– |
– |
1,170 |
0.53 |
– |
– |
– |
3,560 |
0.59 |
– |
– |
– |
|||||||||||||||||||||||||||||||||||||||||||||||||
| |
|
|
|
|
|
|
|
|
|
|
|
|
|
|
|
|
|
|
|
|
|
|
|
|
|
|
|
|
|
|||||||||||||||||||||||||||||||||||
| Pampa Norte 7 |
OC | 725 | 0.51 | – | – | – | 419 | 0.50 | – | – | – | 1,150 | 0.50 | – | – | – | ||||||||||||||||||||||||||||||||||||||||||||||||
Australia |
Mt |
%Cu |
kg/tU 3 O8 |
g/tAu |
g/tAg |
Mt |
%Cu |
kg/tU 3 O8 |
g/tAu |
g/tAg |
Mt |
%Cu |
kg/tU 3 O8 |
g/tAu |
g/tAg |
|||||||||||||||||||||||||||||||||||||||||||||||||
| Olympic Dam 8 |
UG | 285 | 1.96 | 0.59 | 0.72 | 5 | 263 | 1.71 | 0.53 | 0.63 | 4 | 548 | 1.84 | 0.56 | 0.68 | 5 | ||||||||||||||||||||||||||||||||||||||||||||||||
Peru |
Mt |
%Cu |
%Zn |
g/tAg |
ppmMo |
Mt |
%Cu |
%Zn |
g/tAg |
ppmMo |
Mt |
%Cu |
%Zn |
g/tAg |
ppmMo |
|||||||||||||||||||||||||||||||||||||||||||||||||
| Antamina 9 |
OC | 57 | 0.92 | 0.65 | 9 | 280 | 48 | 0.98 | 0.99 | 11 | 230 | 105 | 0.94 | 0.80 | 10 | 260 | ||||||||||||||||||||||||||||||||||||||||||||||||
| |
|
|
|
|
|
|
|
|
|
|
|
|
|
|
|
|
|
|
|
|
|
|
|
|
|
|
|
|
|
|||||||||||||||||||||||||||||||||||
| Total copper |
3,460 |
0.71 |
– |
– |
– |
1,900 |
0.70 |
– |
– |
– |
5,360 |
0.71 |
– |
– |
– |
|||||||||||||||||||||||||||||||||||||||||||||||||
| |
|
|
|
|
|
|
|
|
|
|
|
|
|
|
|
|
|
|
|
|
|
|
|
|
|
|
|
|
|
|||||||||||||||||||||||||||||||||||
1 |
Mineral reserves are being first time reported in accordance with S-K 1300 and are presented for the portion attributable to BHP’s economic interest. All tonnes and quality information have been rounded, small differences may be present in the totals. |
2 |
Escondida, in which BHP has a 57.5% interest, is considered a material property for purposes of Item 1304 of S-K 1300. |
3 |
Escondida point of reference for the mineral reserves was mine gate. |
4 |
Escondida mineral reserves estimates were based on a copper price of US$2.79/lb. |
5 |
Escondida mineral reserves cut-off criteria used was Oxide ≥ 0.20% soluble Cu. For Sulphide ≥ 0.30% Cu and where greater than the variable cut-off of the concentrator. Sulphide ore is processed in the concentrator plants as a result of an optimised mine plan with consideration of technical and economic parameters in order to maximise net present value. Sulphide Leach ≥ 0.25% Cu and 70% or less of copper contained in chalcopyrite and lower than the variable cut-off grade. Sulphide leach ore is processed in the leaching plant as an alternative to the concentrator process. |
6 |
Escondida metallurgical recoveries for Oxide 62%; Sulphide Leach 42%; Sulphide 42% for material processed by leaching or 83% for material processed via the concentrator. |
7 |
Pampa Norte, in which BHP has a 100% interest, includes Cerro Colorado and Spence deposits. The mineral reserves estimates were based on a copper price of US$2.79/lb. The point of reference for the mineral reserves was mine gate. |
8 |
Olympic Dam mineral reserves estimates, in which BHP has a 100% interest, were based on a copper price of US$2.79/lb, uranium oxide price of US$28.68/lb, gold price of US$1,535.75/troy oz and silver price of US$17.16/troy oz. The point of reference for the mineral reserves was mine gate, ex-processing. |
9 |
Antamina mineral reserves estimates, in which BHP has a 33.75% interest, were based on a copper price of US$3.30/lb, zinc price of US$1.10/lb, silver price of US$20.70/troy oz and molybdenum price of US$9.30/lb. The point of reference for the mineral reserves was delivery to processing plant. |
| • | Escondida: Latitude 24°16’ S, Longitude 69° 04’ W |
| • | Escondida Norte: Latitude 24°13’ S, Longitude 69° 03’ W |
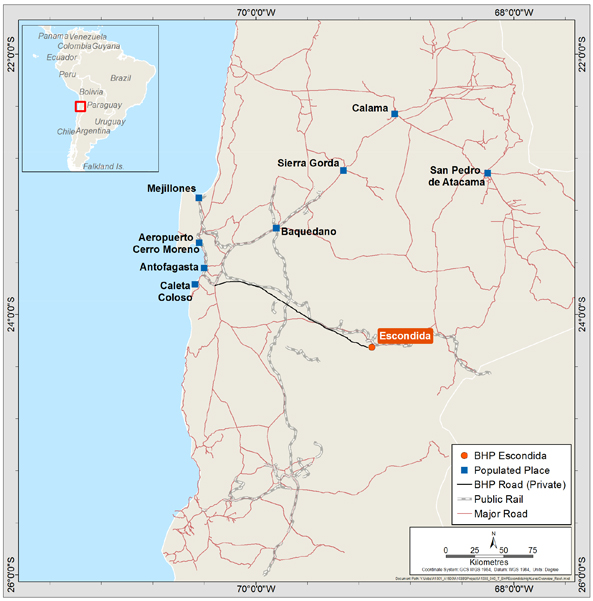
| Lease name |
Registered tenement holder |
Expiry date |
Surface area (ha) |
Annual rent and rate (UTM) 1 |
||||||||
| Alexis 1/1424 |
Minera Escondida Ltda. |
Permanent |
7,059 | 705.9 | ||||||||
| Amelia 1/1049 |
Minera Escondida Ltda. |
Permanent |
5,235 | 523.5 | ||||||||
| Catita 1/376 |
Minera Escondida Ltda. |
Permanent |
1,732 | 173.2 | ||||||||
| Claudia 1/70 |
Minera Escondida Ltda. |
Permanent |
557 | 55.7 | ||||||||
| Colorado 501/977 |
Minera Escondida Ltda. |
Permanent |
2,385 | 238.5 | ||||||||
| Costa 1/1861 |
Minera Escondida Ltda. |
Permanent |
9,159 | 915.9 | ||||||||
| Donaldo 1/612 |
Minera Escondida Ltda. |
Permanent |
3,060 | 306.0 | ||||||||
| Ela 1/100 |
Minera Escondida Ltda. |
Permanent |
500 | 50.0 | ||||||||
| Gata 1 1/100 |
Minera Escondida Ltda. |
Permanent |
400 | 40.0 | ||||||||
| Gata 2 1/50 |
Minera Escondida Ltda. |
Permanent |
200 | 20.0 | ||||||||
| Guillermo 1/368 |
Minera Escondida Ltda. |
Permanent |
1,785 | 178.5 | ||||||||
| Hole 14 |
Minera Escondida Ltda. |
Permanent |
1 | 0.1 | ||||||||
| Naty 1/46 |
Minera Escondida Ltda. |
Permanent |
230 | 23.0 | ||||||||
| Paola 1/3000 |
Minera Escondida Ltda. |
Permanent |
15,000 | 1,500.0 | ||||||||
| Pista 1/22 |
Minera Escondida Ltda. |
Permanent |
22 | 2.2 | ||||||||
| Pistita 1/5 |
Minera Escondida Ltda. |
Permanent |
9 | 0.9 | ||||||||
| Ramón 1/640 |
Minera Escondida Ltda. |
Permanent |
3,200 | 320.0 | ||||||||
| Rola 1/1680 |
Minera Escondida Ltda. |
Permanent |
8,400 | 840.0 | ||||||||
| Total |
58,934 |
5,893.0 |
||||||||||
1 |
Unidad Tributaria Mensual (UTM) is a Chilean state tax unit valued in Chilean pesos (CLP) per hectare. The 2022 rate is 0.1 UTM. Annual payments are made at the end of the Chilean tax year (end of March) for concessions. |
| Infrastructure |
Surface rights identifier 1 |
Surface area (ha) | ||||||||||
| Folio |
Number |
Year |
Register |
Regional office | ||||||||
| Pits, waste dumps, leach pads, plants |
619 V | 964 | 1984 | Hipotecas y Gravámenes | Bienes Raíces Antofagasta | 22,084 | ||||||
| Energy transmission lines, aqueducts, mineral pipelines, roads |
1121 V | 1117 | 2018 | Hipotecas y Gravámenes | Bienes Raíces Antofagasta | 26,988 | ||||||
1 |
As defined by Chilean legal requirements |
| • | 1998 Acid heap leaching of oxides commenced |
| • | 2002 Second concentrator (Phase 4) inaugurated |
| • | 2005 Mining commenced at Escondida Norte |
| • | 2006 Dump bio-leaching of sulphides commenced |
| • | 2007 First desalination plant commenced pumping |
| • | 2016 Third concentrator inaugurated |
| • | 2017 Second desalination plant commenced pumping |
| • | 2020 Operation converted to 100% use of desalination water |
| • | Resources estimated using ordinary kriging. |
| • | The sample data preparation including data capping. |
| • | The pit optimisation used to determine the resources that have reasonable prospects of economic extraction based on a copper price of US$3.04/lb. |
| • | The classified resource model. |
| • | Variable cut-off grade strategy that maximises throughput for the concentrator, smelter and refinery. |
| • | Commodity prices, operating and capital costs. |
| Iron ore 1,2 |
Mining Method |
Measured Resources |
Indicated Resources |
Measured + Indicated Resources |
Inferred Resources |
|||||||||||||||||||||||||||||||||||||||||||||||||||||||||||||||||||||||||||||||||||||||||||||||
Tonnage |
Qualities |
Tonnage |
Qualities |
Tonnage |
Qualities |
Tonnage |
Qualities |
|||||||||||||||||||||||||||||||||||||||||||||||||||||||||||||||||||||||||||||||||||||||||||||
Mt |
%Fe |
%P |
%SiO 2 |
%Al 2 O3 |
%LOI |
Mt |
%Fe |
%P |
%SiO 2 |
%Al 2 O3 |
%LOI |
Mt |
%Fe |
%P |
%SiO 2 |
%Al 2 O3 |
%LOI |
Mt |
%Fe |
%P |
%SiO 2 |
%Al 2 O3 |
%LOI |
|||||||||||||||||||||||||||||||||||||||||||||||||||||||||||||||||||||||||||||
| Australia |
|
|||||||||||||||||||||||||||||||||||||||||||||||||||||||||||||||||||||||||||||||||||||||||||||||||||
| WAIO 3,4,5,6,7,8 |
||||||||||||||||||||||||||||||||||||||||||||||||||||||||||||||||||||||||||||||||||||||||||||||||||||
| Mt Newman |
OC | 250 | 61.0 | 0.11 | 3.5 | 2.3 | 6.2 | 770 | 59.7 | 0.13 | 4.8 | 2.8 | 6.3 | 1,020 | 60.0 | 0.12 | 4.5 | 2.7 | 6.3 | 2,240 | 59.7 | 0.12 | 4.8 | 2.6 | 6.4 | |||||||||||||||||||||||||||||||||||||||||||||||||||||||||||||||||||||||||||
| Goldsworthy 9 |
OC | 100 | 56.7 | 0.13 | 7.9 | 3.6 | 6.8 | 490 | 58.8 | 0.08 | 6.0 | 3.0 | 6.0 | 590 | 58.4 | 0.09 | 6.4 | 3.1 | 6.2 | 3,900 | 59.9 | 0.10 | 5.2 | 2.3 | 6.2 | |||||||||||||||||||||||||||||||||||||||||||||||||||||||||||||||||||||||||||
| Yandi |
OC | 360 | 58.3 | 0.11 | 4.7 | 2.4 | 8.9 | 1,300 | 59.4 | 0.14 | 4.5 | 2.3 | 7.6 | 1,660 | 59.2 | 0.13 | 4.5 | 2.3 | 7.8 | 1,930 | 57.9 | 0.13 | 5.5 | 2.6 | 8.3 | |||||||||||||||||||||||||||||||||||||||||||||||||||||||||||||||||||||||||||
| Jimblebar |
OC | 210 | 60.1 | 0.10 | 5.1 | 2.9 | 5.2 | 560 | 59.5 | 0.14 | 5.3 | 3.1 | 5.7 | 760 | 59.7 | 0.13 | 5.2 | 3.0 | 5.6 | 280 | 58.6 | 0.10 | 5.7 | 3.4 | 6.2 | |||||||||||||||||||||||||||||||||||||||||||||||||||||||||||||||||||||||||||
| BHP (Non-JV) 10 |
OC | 170 | 60.5 | 0.13 | 4.8 | 2.5 | 5.6 | 200 | 59.3 | 0.13 | 6.1 | 2.5 | 6.0 | 370 | 59.9 | 0.13 | 5.5 | 2.5 | 5.8 | 2,050 | 59.0 | 0.13 | 4.9 | 2.8 | 7.1 | |||||||||||||||||||||||||||||||||||||||||||||||||||||||||||||||||||||||||||
| |
|
|
|
|
|
|
|
|
|
|
|
|
|
|
|
|
|
|
|
|
|
|
|
|
|
|
|
|
|
|
|
|
|
|
|
|
|
|
|
|
|
|
|
|
|
|
|
|||||||||||||||||||||||||||||||||||||||||||||||||||||
| Total iron ore |
1,090 |
59.5 |
0.11 |
4.8 |
2.6 |
6.8 |
3,320 |
59.4 |
0.13 |
5.0 |
2.7 |
6.6 |
4,400 |
59.4 |
0.12 |
5.0 |
2.6 |
6.7 |
10,410 |
59.3 |
0.12 |
5.1 |
2.6 |
6.8 |
||||||||||||||||||||||||||||||||||||||||||||||||||||||||||||||||||||||||||||
| |
|
|
|
|
|
|
|
|
|
|
|
|
|
|
|
|
|
|
|
|
|
|
|
|
|
|
|
|
|
|
|
|
|
|
|
|
|
|
|
|
|
|
|
|
|
|
|
|||||||||||||||||||||||||||||||||||||||||||||||||||||
1 |
Mineral resources are being first time reported in accordance with S-K 1300 and are presented for the portion attributable to BHP’s economic interest in the respective joint venture. All tonnes and quality information have been rounded, small differences may be present in the totals. |
2 |
Mineral resources are presented exclusive of mineral reserves. |
3 |
WAIO is considered a material property for purposes of Item 1304 of S-K 1300. BHP interest is 85% for all joint ventures except BHP (Non-JV) where it is 100%. |
4 |
Mineral resources qualities are presented as in situ mass percentage on a dry weight basis and tonnage as wet tonnes. Moisture content is based on deposit types, Brockman (BKM) – 3%; Marra Mamba (MM) – 4%; Channel Iron Deposit (CID) – 8% and Detrital Iron Deposits (DID) – 4%. |
5 |
WAIO point reference for the mineral resources was in situ. |
6 |
Mineral resources estimates were based on an iron ore price of US$86/dmt for Platts 62% Fe Fines Index free on board (FOB) Port Hedland basis. Based on the median three-year monthly average price over a timeframe of 1 July 2018 to 30 June 2021. |
7 |
Mineral resource estimates cut-off criteria was based on deposit types identified in the joint venture. These are BKM and MM 54% Fe; CID 52% Fe and DID 58% Fe and less than 6% Al2 O3 . |
8 |
WAIO is predominantly a producer of direct shipping ore and the metallurgical recovery was assumed as 100% for the purpose of reporting all mineral resources. |
9 |
Goldsworthy joint venture includes 2 Mt measured + indicated and 3 Mt of inferred mineral resources from the POSMAC joint venture that BHP has a 65% economic interest. |
10 |
BHP (Non-JV) mineral resources are those that are wholly attributable to BHP without associated mineral reserves. |
| Iron ore 1 |
Mining Method |
Proven Reserves |
Probable Reserves |
Total Reserves |
||||||||||||||||||||||||||||||||||||||||||||||||||||||||||||||||||||||||
Tonnage |
Qualities |
Tonnage |
Qualities |
Tonnage |
Qualities |
|||||||||||||||||||||||||||||||||||||||||||||||||||||||||||||||||||||||
Mt |
%Fe |
%P |
%SiO 2 |
%Al 2 O3 |
%LOI |
Mt |
%Fe |
%P |
%SiO 2 |
%Al 2 O3 |
%LOI |
Mt |
%Fe |
%P |
%SiO 2 |
%Al 2 O3 |
%LOI |
|||||||||||||||||||||||||||||||||||||||||||||||||||||||||||
| Australia |
|
|||||||||||||||||||||||||||||||||||||||||||||||||||||||||||||||||||||||||||
| WAIO 2,3,4,5,6,7 |
||||||||||||||||||||||||||||||||||||||||||||||||||||||||||||||||||||||||||||
| Mt Newman |
OC | 240 | 63.7 | 0.10 | 2.9 | 1.8 | 3.3 | 510 | 61.9 | 0.11 | 3.4 | 2.1 | 5.3 | 750 | 62.5 | 0.11 | 3.3 | 2.0 | 4.6 | |||||||||||||||||||||||||||||||||||||||||||||||||||||||||
| Goldsworthy 8 |
OC | 910 | 62.0 | 0.09 | 3.2 | 1.8 | 5.8 | 1,030 | 61.0 | 0.08 | 3.9 | 1.9 | 6.4 | 1,940 | 61.5 | 0.08 | 3.6 | 1.8 | 6.1 | |||||||||||||||||||||||||||||||||||||||||||||||||||||||||
| Jimblebar |
OC | 480 | 61.8 | 0.12 | 3.4 | 2.5 | 5.1 | 410 | 61.4 | 0.11 | 4.1 | 2.7 | 4.7 | 900 | 61.6 | 0.12 | 3.7 | 2.6 | 4.9 | |||||||||||||||||||||||||||||||||||||||||||||||||||||||||
| |
|
|
|
|
|
|
|
|
|
|
|
|
|
|
|
|
|
|
|
|
|
|
|
|
|
|
|
|
|
|
|
|
|
|
|
|||||||||||||||||||||||||||||||||||||||||
| Total iron ore |
1,630 |
62.2 |
0.10 |
3.2 |
2.0 |
5.2 |
1,960 |
61.3 |
0.09 |
3.8 |
2.1 |
5.7 |
3,590 |
61.7 |
0.10 |
3.6 |
2.1 |
5.5 |
||||||||||||||||||||||||||||||||||||||||||||||||||||||||||
| |
|
|
|
|
|
|
|
|
|
|
|
|
|
|
|
|
|
|
|
|
|
|
|
|
|
|
|
|
|
|
|
|
|
|
|
|||||||||||||||||||||||||||||||||||||||||
1 |
Mineral reserves are being first time reported in accordance with S-K 1300 regulations and are presented for the portion attributable to BHP’s economic interest in the respective joint ventures. All tonnes and quality information have been rounded, small differences may be present in the totals. |
2 |
WAIO is considered a material property for purposes of Item 1304 of S-K 1300. BHP interest is 85% for all joint ventures. |
3 |
Mineral reserves qualities are presented as in situ mass percentage on a dry weight basis and tonnage as wet tonnes. Moisture content is based on deposit types, Brockman (BKM) – 3%; Marra Mamba (MM) – 4%; Channel Iron Deposit (CID) – 8% and Detrital Iron Deposits (DID) – 4%. |
4 |
WAIO point of reference for the mineral reserves was as delivered to the ore handling/process plant. |
5 |
Mineral reserves estimates were based on an iron ore price of US$86/dmt for Platts 62% Fe Fines Index and US$103/dmt for lump, both FOB Port Hedland basis. |
6 |
WAIO joint ventures include Brockman (BKM) and Marra Mamba (MM) deposit types. All mineral reserves estimates applied a cut-off criteria of 58% Fe. |
7 |
WAIO is predominantly a producer of direct shipping ore and the metallurgical recovery was assumed as 99% for Mt Newman and 100% for Goldsworthy and Jimblebar joint ventures for the purposes of reporting mineral reserves. |
8 |
Goldsworthy joint venture includes 11Mt of mineral reserves from the POSMAC joint venture that BHP has a 65% economic interest. |
| • | Newman: Latitude: 23°21’40” S, Longitude: 119°40’15” E |
| • | Jimblebar: Latitude: 23°22’40” S, Longitude: 120°07’45” E |
| • | Mining Area C: Latitude: 22°55’30” S, Longitude: 118°58’55” E |
| • | South Flank: Latitude: 22°59’35” S, Longitude: 118°59’45” E |
| • | Yandi: Latitude: 22°43’15” S, Longitude: 119°05’15” E |
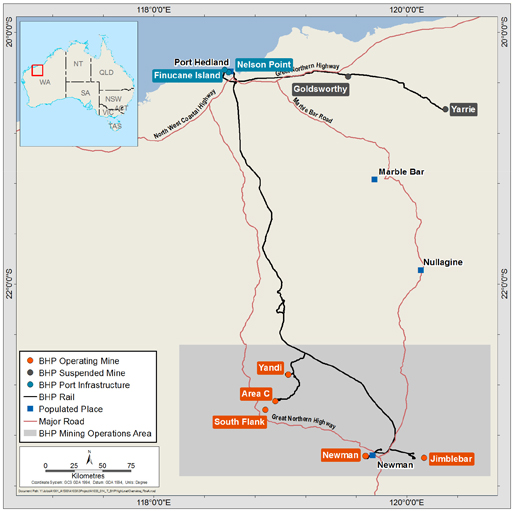
| 1. | Iron Ore (Mount Newman) Agreement Act 1964 (WA) - ML244SA held by the Mount Newman Joint Venture. |
| 2. | Iron Ore (Mount Goldsworthy) Agreement Act 1964 (WA) - ML235SA and ML249SA held by the Mount Goldsworthy (Northern Areas) Joint Venture and ML281SA held by the Mount Goldsworthy (Area C) Joint Venture. |
| 3. | Iron Ore (Goldsworthy-Nimingarra) Agreement Act 1972 (WA) - M263SA & ML251SA held by the Mount Goldsworthy (Northern Areas) Joint Venture. |
| 4. | Iron Ore (McCamey’s Monster) Agreement Authorisation Act 1972 (WA) - M266SA held by BHP Iron Ore (Jimblebar) Pty Ltd. |
| 5. | Iron Ore (Marillana Creek) Agreement Act 1991 (WA) - M270SA held by the Yandi Joint Venture. |
| Lease number |
Registered tenement holders 1 / interest |
Start date |
Expiry date 2 |
Legal area (ha) |
Annual rent and rate 4 |
|||||||||
| ML235SA |
BHP (85/100), Itochu (8/100), Mitsui (7/100) |
5/08/1965 | 4/08/2028 | 4,142 | $ | 4,818 | ||||||||
| ML244SA |
BHP (85/100), Itochu (10/100), Mitsui (5/100) |
7/04/1967 | 6/04/2030 | 78,934 | $ | 116,342 | ||||||||
| ML251SA |
BHP (85/100), Itochu (8/100), Mitsui (7/100) |
22/09/1972 | 21/09/2035 | 1,300 | $ | 7,433 | ||||||||
| ML249SA |
BHP (85/100), Itochu (8/100), Mitsui (7/100) |
8/05/1974 | 4/08/2028 | 30,647 | $ | 36,618 | ||||||||
| M266SA |
BHP (100/100) 3 |
11/10/1988 | 10/10/2030 | 51,756 | $ | 123,468 | ||||||||
| M263SA |
BHP (85/100), Itochu (8/100), Mitsui (7/100) |
22/01/1989 | 21/09/2035 | 14,323 | $ | 325,346 | ||||||||
| M270SA |
BHP (85/100), Itochu (8/100), Mitsui (7/100) |
4/09/1991 | 3/09/2033 | 30,344 | $ | 1,571,645 | ||||||||
| ML281SA |
BHP (85/100), Itochu (8/100), Mitsui (7/100) |
26/04/2002 | 4/08/2028 | 56,335 | $ | 157,882 | ||||||||
1 |
Full Legal entity names for the tenement holders are: (i) BHP: BHP Minerals Pty Ltd, (ii) Mitsui-Itochu: Mitsui-Itochu Iron Pty Ltd, (iii) Itochu: Itochu Minerals & Energy of Australia Pty Ltd and (iv) Mitsui: Mitsui Iron Ore Corporation Pty Ltd. |
2 |
All State Agreement Act leases, except M270SA, have right to successive renewals of 21 years each. M270SA has right to only two renewals, each for 21 years ultimately expiring in 2054. The lease will then revert to Mining Act. BHP will need to engage with the State Government before the expiry to renegotiate the terms of the State Agreement. |
3 |
M266SA is held by BHP Iron Ore (Jimblebar) Pty Ltd, a subsidiary of BHP Minerals Pty Ltd (BHP). In 2013, BHP entered into an incorporated Joint Venture (Jimblebar IJV) with Itochu and Mitsui in respect of the Jimblebar mining hub, owned by BHP Iron Ore (Jimblebar) Pty Ltd (BHPIOJ). The Jimblebar IJV is structured so that BHP, Itochu and Mitsui hold A Class Shares in BHPIOJ, which confer an 85:8:7 economic interest, respectively in the “Jimblebar Assets”, being certain assets of BHPIOJ including the Jimblebar mine. BHPIOJ also owns other assets, called “Excluded Assets”, in which BHP alone holds a 100% economic interest through B Class Shares in BHPIOJ. |
4 |
Statutory Rents and Rates are payable annually to the State Government and the Local Government/Shire respectively. |
| • | Resources estimated using ordinary kriging and inverse distance weighted methods. |
| • | Resources are reported exclusive of mineral reserves and are presented as in situ estimates. |
| • | Resources are reported on a wet tonnage basis for all deposit types associated with the joint ventures. |
| • | Standard open cut practices are assumed for all ore extraction. |
| • | Resources are excluded from reporting as appropriate for heritage, environmental, hydrological, tenure, and infrastructure purposes to minimise any potential impacts. |
| • | The latest and approved resource models and mineral resource estimates have been used for mine planning and conversion to mineral reserves by application of all relevant modifying factors. |
| • | The resource models are converted to mining models (WAIO equivalent of a “reserve” model) by regularising the resource model blocks to SMU-sized blocks. |
| • | The average of the previous three years (FY2019 to FY2021) actual yearly operating and capital costs are used to estimate the cut-off grades and mineral reserves. |
| • | The median of the three-year trailing calendar monthly average iron ore prices from July 2018 to June 2021 are used to estimate the cut-off grades and mineral reserves. |
| • | Mineral reserves are estimated using conventional open-cut mining method involving drill and blast with load and haul activities. |
| • | Pit optimisations are completed to determine economic pit limits using industry standard Lerch-Grossman algorithm. |
| • | Mine designs including pit, waste dumps and haul roads are generated in industry standard CAD software. The designs incorporate the minimum mining width based on the equipment and slope design parameters from geotechnical models. |
| • | WAIO’s run-of-mine |
Measured Resources |
Indicated Resources |
Measured + Indicated Resources |
Inferred Resources |
|||||||||||||||||||||||||||||||||||||||||||||||||||||||||||||||||
| Metallurgical coal 2,3 |
Mining method |
Tonnage Mt |
%Ash |
Qualities %VM |
%S |
Tonnage Mt |
%Ash |
Qualities %VM |
%S |
Tonnage Mt |
%Ash |
Qualities %VM |
%S |
Tonnage Mt |
%Ash |
Qualities %VM |
%S |
|||||||||||||||||||||||||||||||||||||||||||||||||||
| Australia |
||||||||||||||||||||||||||||||||||||||||||||||||||||||||||||||||||||
| BMA 4,5,6 |
OC & UG | 1,038 | 9.9 | 19.8 | 0.57 | 599 | 10.3 | 20.9 | 0.60 | 1,637 | 10.1 | 20.2 | 0.58 | 746 | 11.0 | 22.2 | 0.58 | |||||||||||||||||||||||||||||||||||||||||||||||||||
| |
|
|
|
|
|
|
|
|
|
|
|
|
|
|
|
|
|
|
|
|
|
|
|
|
|
|
|
|
|
|
|
|||||||||||||||||||||||||||||||||||||
| Total metallurgical coal |
1,038 |
9.9 |
19.8 |
0.57 |
599 |
10.3 |
20.9 |
0.60 |
1,637 |
10.1 |
20.2 |
0.58 |
746 |
11.0 |
22.2 |
0.58 |
||||||||||||||||||||||||||||||||||||||||||||||||||||
| |
|
|
|
|
|
|
|
|
|
|
|
|
|
|
|
|
|
|
|
|
|
|
|
|
|
|
|
|
|
|
|
|||||||||||||||||||||||||||||||||||||
1 |
Coal resources is used as an equivalent term to mineral resources. |
2 |
Coal resources are being first time reported in accordance with S-K 1300 and are presented for the portion attributable to BHP’s economic interest in the respective joint venture. All tonnes and quality information have been rounded, small differences may be present in the totals. |
3 |
Coal resources are presented exclusive of coal reserves. |
4 |
BMA mineral resources, in which BHP has a 50% interest, includes Goonyella Complex, Daunia, Caval Ridge, Peak Downs, Saraji, Saraji South and Blackwater deposits. |
5 |
The point of reference for the coal resources tonnage estimates is in situ. Coal qualities are presented as a potential product on an air-dried basis. |
6 |
Coal resources estimates comprise 94% metallurgical and 6% thermal coal product categories. Coal resources were assessed for reasonable prospects of economic extraction assuming a hard coking coal (Met) price of US$197/t and a thermal coal price of US$96/t for optimisation studies. |
Proven Reserves |
Probable Reserves |
Total Reserves |
Proven Marketable Reserves |
Probable Marketable Reserves |
Total Marketable Reserves |
|||||||||||||||||||||||||||||||||||||||||||||||||||||||||||
| Metallurgical coal 2 |
Mining method |
Tonnage Mt |
Tonnage Mt |
Tonnage Mt |
Tonnage Mt |
%Ash |
Qualities %VM |
%S |
Tonnage Mt |
%Ash |
Qualities %VM |
%S |
Tonnage Mt |
%Ash |
Qualities %VM |
%S |
||||||||||||||||||||||||||||||||||||||||||||||||
| Australia |
||||||||||||||||||||||||||||||||||||||||||||||||||||||||||||||||
| BMA 3,4,5,6 |
OC & UG | 1,012 | 283 | 1,295 | 659 | 10.0 | 21.1 | 0.56 | 169 | 10.4 | 22.3 | 0.62 | 828 | 10.0 | 21.4 | 0.57 | ||||||||||||||||||||||||||||||||||||||||||||||||
| |
|
|
|
|
|
|
|
|
|
|
|
|
|
|
|
|
|
|
|
|
|
|
|
|
|
|
|
|
|
|||||||||||||||||||||||||||||||||||
| Total metallurgical coal |
1,012 |
283 |
1,295 |
659 |
10.0 |
21.1 |
0.56 |
169 |
10.4 |
22.3 |
0.62 |
828 |
10.0 |
21.4 |
0.57 |
|||||||||||||||||||||||||||||||||||||||||||||||||
| |
|
|
|
|
|
|
|
|
|
|
|
|
|
|
|
|
|
|
|
|
|
|
|
|
|
|
|
|
|
|||||||||||||||||||||||||||||||||||
1 |
Coal reserves is used as an equivalent term to mineral reserves. |
2 |
Coal reserves are being first time reported in accordance with S-K 1300 and are presented for the portion attributable to BHP’s economic interest in the respective joint venture. All tonnes and quality information have been rounded, small differences may be present in the totals. |
3 |
BMA mineral reserves, in which BHP has a 50% interest, includes Goonyella Complex, Daunia, Caval Ridge, Peak Downs, Saraji, Saraji South and Blackwater deposits. |
4 |
Total coal reserves were at a 4% moisture content when mined. Total marketable reserves were at a product specification moisture content (9.5-10% Goonyella Complex; 9.5% Peak Downs; 10.5% Caval Ridge; 10.1% Saraji; 10-11% Saraji South; 7.5-11.5% Blackwater; 10-10.5% Daunia) and at an air-dried quality basis for sale after the beneficiation of the total coal reserves. |
5 |
The point of reference for the coal reserves was delivery to the coal handling process plants. |
6 |
Coal reserves estimates comprise 95% hard coking coal, 2% soft coking coal, 1% pulverised coal injection (PCI) and 2% thermal coal product categories. Coal reserves prices used for each of the coal categories were hard coking coal US$155/t, soft coking coal US$98/t, PCI US$99/t and thermal coal US$75/t. |
Measured Resources |
Indicated Resources |
Measured + Indicated Resources |
Inferred Resources |
|||||||||||||||||||||||||||||||||||||||||||||||||||||||||||||||||||||||||||||||||
| Energy coal 2,3 |
Mining Method |
Tonnage Mt |
%Ash |
Qualities %VM |
%S |
Kcal/kgCV |
Tonnage Mt |
%Ash |
Qualities %VM |
%S |
Kcal/kgCV |
Tonnage Mt |
%Ash |
Qualities %VM |
%S |
Kcal/kgCV |
Tonnage Mt |
%Ash |
Qualities %VM |
%S |
Kcal/kgCV |
|||||||||||||||||||||||||||||||||||||||||||||||||||||||||||||||
| Australia |
||||||||||||||||||||||||||||||||||||||||||||||||||||||||||||||||||||||||||||||||||||
| NSWEC 4,5,6,7 |
OC | 6.2 | 19.0 | 29.6 | 0.66 | 6,170 | 0.6 | 19.7 | 29.3 | 0.54 | 6,060 | 6.8 | 19.2 | 29.5 | 0.63 | 6,130 | 8.6 | 23.1 | 28.8 | 0.49 | 5,720 | |||||||||||||||||||||||||||||||||||||||||||||||||||||||||||||||
| |
|
|
|
|
|
|
|
|
|
|
|
|
|
|
|
|
|
|
|
|
|
|
|
|
|
|
|
|
|
|
|
|
|
|
|
|
|
|
|
|||||||||||||||||||||||||||||||||||||||||||||
| Total energy coal |
6.2 |
19.0 |
29.6 |
0.66 |
6,170 |
0.6 |
19.7 |
29.3 |
0.54 |
6,060 |
6.8 |
19.2 |
29.5 |
0.63 |
6,130 |
8.6 |
23.1 |
28.8 |
0.49 |
5,720 |
||||||||||||||||||||||||||||||||||||||||||||||||||||||||||||||||
| |
|
|
|
|
|
|
|
|
|
|
|
|
|
|
|
|
|
|
|
|
|
|
|
|
|
|
|
|
|
|
|
|
|
|
|
|
|
|
|
|||||||||||||||||||||||||||||||||||||||||||||
1 |
Coal resources is used as an equivalent term to mineral resources. |
2 |
Coal resources are being first time reported in accordance with S-K 1300 and are presented for the portion attributable to BHP’s economic interest. All tonnes and quality information have been rounded, small differences may be present in the totals. |
3 |
Coal resources are presented exclusive of coal reserves. |
4 |
NSWEC, in which BHP has a 100% interest, includes Mt Arthur Coal deposit. |
5 |
Coal qualities are reported on an air-dried in situ basis. Tonnages are reported as in situ. |
6 |
The point of reference for the coal resources was in situ. |
7 |
Coal resources estimates were based on thermal coal price of US$96/t. |
Proven Reserves |
Probable Reserves |
Total Reserves |
Proven Marketable Reserves |
Probable Marketable Reserves |
Total Marketable Reserves |
|||||||||||||||||||||||||||||||||||||||||||||||||||||||||||||||||||||||
| Energy coal 2 |
Mining Method |
Tonnage Mt |
Tonnage Mt |
Tonnage Mt |
Tonnage Mt |
%Ash |
Qualities %VM |
%S |
Kcal/kgCV |
Tonnage Mt |
%Ash |
Qualities %VM |
%S |
Kcal/kgCV |
Tonnage Mt |
%Ash |
Qualities %VM |
%S |
Kcal/kgCV |
|||||||||||||||||||||||||||||||||||||||||||||||||||||||||
| Australia |
||||||||||||||||||||||||||||||||||||||||||||||||||||||||||||||||||||||||||||
| NSWEC 3,4,5,6 |
OC | 95 | 49 | 144 | 69 | 15.8 | 30.5 | 0.53 | 5,880 | 36 | 15.8 | 30.4 | 0.53 | 5,880 | 104 | 15.8 | 30.4 | 0.53 | 5,880 | |||||||||||||||||||||||||||||||||||||||||||||||||||||||||
| |
|
|
|
|
|
|
|
|
|
|
|
|
|
|
|
|
|
|
|
|
|
|
|
|
|
|
|
|
|
|
|
|
|
|
|
|||||||||||||||||||||||||||||||||||||||||
| Total energy coal |
95 |
49 |
144 |
69 |
15.8 |
30.5 |
0.53 |
5,880 |
36 |
15.8 |
30.4 |
0.53 |
5,880 |
104 |
15.8 |
30.4 |
0.53 |
5,880 |
||||||||||||||||||||||||||||||||||||||||||||||||||||||||||
| |
|
|
|
|
|
|
|
|
|
|
|
|
|
|
|
|
|
|
|
|
|
|
|
|
|
|
|
|
|
|
|
|
|
|
|
|||||||||||||||||||||||||||||||||||||||||
1 |
Coal reserves is used as an equivalent term to mineral reserves. |
2 |
Coal reserves are being first time reported in accordance with S-K 1300 and are presented for the portion attributable to BHP’s economic interest. All tonnes and quality information have been rounded, small differences may be present in the totals. |
3 |
NSWEC, in which BHP has a 100% interest, includes Mt Arthur Coal deposit. |
4 |
Coal qualities are presented as a potential product on an air-dried basis. Tonnages for the coal reserves are reported on an in situ moisture basis. Moisture when mined was 8.7% and for marketable reserves was 9.5%. |
5 |
The point of reference for the coal reserves was as delivered to the coal handling process plant. |
6 |
Coal reserves estimates were based on thermal coal price of US$85/t. |
Measured Resources |
Indicated Resources |
Measured + Indicated Resources |
Inferred Resources |
|||||||||||||||||||||||||||||||||||||||||||||||||||||||||||||||||
| Potash 1,2 |
Mining Method |
Tonnage Mt |
%K 2 O |
Qualities %Insol. |
%MgO |
Tonnage Mt |
%K 2 O |
Qualities %Insol. |
%MgO |
Tonnage Mt |
%K 2 O |
Qualities %Insol. |
%MgO |
Tonnage Mt |
%K 2 O |
Qualities %Insol. |
%MgO |
|||||||||||||||||||||||||||||||||||||||||||||||||||
| Canada |
||||||||||||||||||||||||||||||||||||||||||||||||||||||||||||||||||||
| Jansen 3,4,5,6,7,8,9,10 |
||||||||||||||||||||||||||||||||||||||||||||||||||||||||||||||||||||
| LPL |
UG |
– |
– |
– |
– |
– |
– |
– |
– |
– |
– |
– |
– |
1,280 |
25.6 |
7.7 | 0.08 |
|||||||||||||||||||||||||||||||||||||||||||||||||||
| |
|
|
|
|
|
|
|
|
|
|
|
|
|
|
|
|
|
|
|
|
|
|
|
|
|
|
|
|
|
|
|
|||||||||||||||||||||||||||||||||||||
| Total potash |
– |
– |
– |
– |
– |
– |
– |
– |
– |
– |
– |
– |
1,280 |
25.6 |
7.7 |
0.08 |
||||||||||||||||||||||||||||||||||||||||||||||||||||
| |
|
|
|
|
|
|
|
|
|
|
|
|
|
|
|
|
|
|
|
|
|
|
|
|
|
|
|
|
|
|
|
|||||||||||||||||||||||||||||||||||||
1 |
Mineral resources are being first time reported in accordance with S-K 1300 and are presented for the portion attributable to BHP’s economic interest. All tonnes and quality information have been rounded, small differences may be present in the totals. |
2 |
Mineral resources are presented exclusive of mineral reserves. |
3 |
Jansen, in which BHP has a 100% interest, is considered a material property for the purposes of item 1304 of S-K 1300. |
4 |
The point of reference for the mineral resources was in situ. |
5 |
Mineral resources estimate was based on a potash price of US$338/t. The primary basis was Nutrien’s quarterly published offshore and onshore realised price from 2008 to 2020. |
6 |
Mineral resources are stated for the Lower Patient Lake (LPL) potash unit and using a seam thickness of 3.96 m from the top of 406 clay seam. |
7 |
Mineral resources are based on the expected metallurgical recovery of 92%. |
8 |
Potash or sylvite (KCl) content of the deposit is reported in potassium oxide form (K 2 O). The conversion from KCl to K2 O uses a mineralogical conversion factor of 1.583, for example, 25.6% K2 O grade is equivalent to 40.5% KCl. |
9 |
% MgO is used as a measure of carnallite (KCl.MgCl 2 .6H2 O) content where per cent carnallite equivalent = % MgO x 6.8918. |
10 |
Mineral resources tonnages are reported on an in situ moisture content basis and was estimated to be 0.3%. |
Proven Reserves |
Probable Reserves |
Total Reserves |
||||||||||||||||||||||||||||||||||||||||||||||||||
| Potash 1,2 |
Mining Method |
Tonnage Mt |
%K 2 O |
Qualities %Insol. |
%MgO |
Tonnage Mt |
%K 2 O |
Qualities %Insol. |
%MgO |
Tonnage Mt |
%K 2 O |
Qualities %Insol. |
%MgO |
|||||||||||||||||||||||||||||||||||||||
| Canada |
||||||||||||||||||||||||||||||||||||||||||||||||||||
| Jansen 3,4,5,6,7,8,9 |
||||||||||||||||||||||||||||||||||||||||||||||||||||
| LPL |
UG |
– |
– |
– |
– |
1,070 |
24.9 |
7.5 |
0.10 |
1,070 |
24.9 |
7.5 |
0.10 |
|||||||||||||||||||||||||||||||||||||||
| |
|
|
|
|
|
|
|
|
|
|
|
|
|
|
|
|
|
|
|
|
|
|
|
|||||||||||||||||||||||||||||
| Total potash |
– |
– |
– |
– |
1,070 |
24.9 |
7.5 |
0.10 |
1,070 |
24.9 |
7.5 |
0.10 |
||||||||||||||||||||||||||||||||||||||||
| |
|
|
|
|
|
|
|
|
|
|
|
|
|
|
|
|
|
|
|
|
|
|
|
|||||||||||||||||||||||||||||
1 |
Mineral reserves are being first time reported in accordance with S-K 1300 and are presented for the portion attributable to BHP’s economic interest. All tonnes and quality information have been rounded, small differences may be present in the totals. |
2 |
Jansen, in which BHP has a 100% interest, is considered a material property for the purposes of item 1304 of S-K 1300. |
3 |
The point of reference for the mineral reserves was ore as delivered to the mill for processing. |
4 |
Mineral reserves estimates were based on a potash price of US$338/t. The primary basis was Nutrien’s quarterly published offshore and onshore realised price from 2008 to 2020. |
5 |
Mineral reserves estimates cut-off is a function of mining parameters and seam thickness. The calculated cut-off grade from economic modelling where the mine plan would be break-even is 11.6% K2 O. |
6 |
Mineral reserves are based on the expected metallurgical recovery of 92%. |
7 |
Potash or sylvite (KCl) content of the deposit is reported in potassium oxide form (K 2 O). The conversion from KCl to K2 O uses a mineralogical conversion factor of 1.583, for example, 25.6% K2 O grade is equivalent to 40.5% KCl. |
8 |
% MgO is used as a measure of carnallite (KCl.MgCl 2 .6H2 O) content where per cent carnallite equivalent = % MgO x 6.8918. |
9 |
Mineral reserves tonnages are reported on an in-situ moisture content basis and was estimated to be 0.3%. |
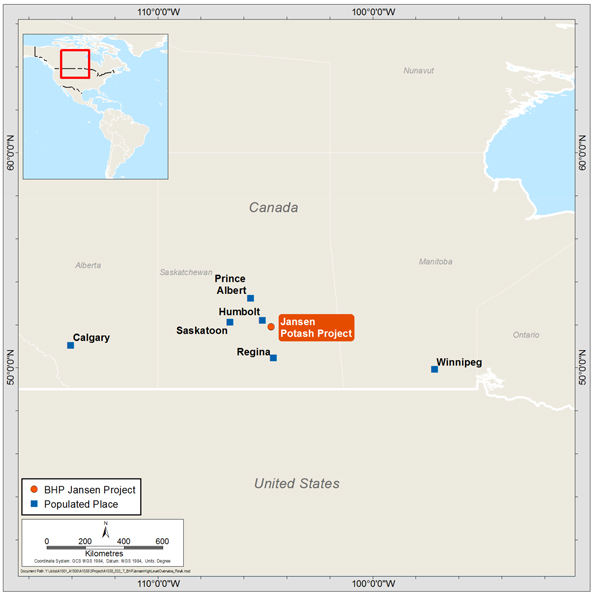
| • | Raw ore handling, storage and crushing; |
| • | Process mill building wet area comprising attrition scrubbing, de-sliming, flotation and de-brining; |
| • | Process mill building dry area comprising drying, screening, compaction and glazing; |
| • | Tailings processing, crystallizer and reagents; |
| • | Product handling, storage and loadout. |
| Lease description |
Area (ha) |
% |
Expiry date |
Annual lease payment 1 |
||||||||||||
| Jansen project total lease area |
115,638 | 100 | ||||||||||||||
| KLSA 011 Core lands |
63,939.43 | 55 | 22/11/2033 | 1,056,623.66 | ||||||||||||
| KLSA 011 Expansion lands |
41,724.73 | 36 | 22/11/2033 | |||||||||||||
| BHP acquired freehold mineral rights |
8,997.56 | 8 | Not applicable | |||||||||||||
| Total of Core, Expansion, and acquired freehold mineral rights |
114,661.72 |
99 |
||||||||||||||
1 |
Annual lease payment in CA$ |
| • | Cut-off parameter of 3.96 m from the top of the 406 clay seam contact with the top of Lower Patience Lake sub-member, aligned with the mining equipment requirements. |
| • | Geological anomalies identification including collapses representing potential water ingress hazards, carnallite anomalies impacting extraction and processing and no potash zones creating additional dilution. |
| • | Exclusion zones sterilising sections of the reserves due to lease boundaries and around drill holes. |
| • | Brine and solid salt waste estimate for disposal modelling into the aquifer and tailings management area. |
| • | The mining method will be continuous mining using long room and pillar method. |
| • | Extraction ratios to reduce stress and provide room stability. |
| • | Thickness of the roof salt beam (horizon) as potential planes of weakness, impacting amount of ground support or dilution estimates. |
| • | Mine design layout maximising the Mineral Resource extraction based on estimated thicknesses, avoiding anomalies (collapse, massive carnallite and no potash zones) and salt beam modelling. |
| • | Commodity price and operating costs. |
| Nickel 1,2 |
Mining Method |
Measured Resources |
Indicated Resources |
Measured + Indicated Resources |
Inferred Resources |
|||||||||||||||||||||||||||||||
Tonnage Mt |
Qualities %Ni |
Tonnage Mt |
Qualities %Ni |
Tonnage Mt |
Qualities %Ni |
Tonnage Mt |
Qualities %Ni |
|||||||||||||||||||||||||||||
| Australia |
||||||||||||||||||||||||||||||||||||
| Nickel West 3,4,5 |
OC & UG | 54 | 0.59 | 166 | 0.73 | 220 | 0.69 | 20 | 0.75 | |||||||||||||||||||||||||||
| |
|
|
|
|
|
|
|
|
|
|
|
|
|
|
|
|||||||||||||||||||||
| Total nickel |
54 |
0.59 |
166 |
0.73 |
220 |
0.69 |
20 |
0.75 |
||||||||||||||||||||||||||||
| |
|
|
|
|
|
|
|
|
|
|
|
|
|
|
|
|||||||||||||||||||||
1 |
Mineral resources are being first time reported in accordance with S-K 1300 and are presented for the portion attributable to BHP’s economic interest. All tonnes and quality information have been rounded, small differences may be present in the totals. |
2 |
Mineral resources are presented exclusive of mineral reserves. |
3 |
Nickel West mineral resources, in which BHP has a 100% interest, includes Leinster, Mt Keith, Yakabindie, Venus and Honeymoon Well deposits. |
4 |
The point of reference for the mineral resources was delivery to Leinster gatehouse. |
5 |
Mineral resources estimates were based on a nickel price of US$7.24/lb. |
| Nickel 1 |
Mining Method |
Proven Reserves |
Probable Reserves |
Total Reserves |
||||||||||||||||||||||||
Tonnage Mt |
Qualities %Ni |
Tonnage Mt |
Qualities %Ni |
Tonnage Mt |
Qualities %Ni |
|||||||||||||||||||||||
| Australia |
||||||||||||||||||||||||||||
| Nickel West 2,3,4 |
OC & UG | 110 | 0.58 | 47 | 0.72 | 157 | 0.62 | |||||||||||||||||||||
| |
|
|
|
|
|
|
|
|
|
|
|
|||||||||||||||||
| Total nickel |
110 |
0.58 |
47 |
0.72 |
157 |
0.62 |
||||||||||||||||||||||
| |
|
|
|
|
|
|
|
|
|
|
|
|||||||||||||||||
1 |
Mineral reserves are being first time reported in accordance with S-K 1300 and are presented for the portion attributable to BHP’s economic interest. All tonnes and quality information have been rounded, small differences may be present in the totals. |
2 |
Nickel West mineral reserves, in which BHP has a 100% interest, includes Leinster, Mt Keith and Yakabindie deposits. |
3 |
The point of reference for the mineral reserves was delivery to Leinster gatehouse. |
4 |
Mineral reserves estimates were based on nickel price of US$6.13/lb. |
| Commodity |
Project and ownership |
Project scope/capacity 1 |
Capital expenditure 1 US$M |
Date of initial production |
Progress/comments | |||||||||
Budget |
Target |
|||||||||||||
Projects completed during FY2022 |
||||||||||||||
| Potash |
Jansen Potash Project (Canada) 100% |
Investment to finish the excavation and lining of the production and service shafts, and to continue the installation of essential surface infrastructure and utilities | 2,972 | CY2027 | Completed in June 2022 | |||||||||
Projects in execution at 30 June 2022 |
||||||||||||||
| Potash |
Jansen Stage 1 (Canada) 100% |
Design, engineering and construction of an underground potash mine and surface infrastructure, with capacity to produce 4.35 Mtpa | 5,723 | CY2027 | Approved in August 2021. The project is 8% complete | |||||||||
1 |
Unless noted otherwise, references to capacity are on a 100 per cent basis, references to capital expenditure from subsidiaries are reported on a 100 per cent basis and references to capital expenditure from joint operations reflects BHP’s share. |
Employees by gender number and % |
||||||||||||||||||||||||||||||||
| Region |
Number and % of employees |
Average number and % of contractors 2 |
Male |
Male % |
Female |
Female % |
||||||||||||||||||||||||||
| Asia |
1,544 | 3.9 | 2,188 | 5.4 | 619 | 40.1 | 925 | 59.9 | ||||||||||||||||||||||||
| Australia |
29,368 | 74.9 | 20,052 | 49.8 | 20,341 | 69.3 | 9,027 | 30.7 | ||||||||||||||||||||||||
| Europe |
61 | 0.2 | 10 | <1.0 | 29 | 47.5 | 32 | 52.5 | ||||||||||||||||||||||||
| North America |
467 | 1.2 | 928 | 2.3 | 259 | 55.5 | 208 | 44.5 | ||||||||||||||||||||||||
| South America |
7,770 | 19.8 | 17,083 | 42.4 | 5,288 | 68.1 | 2,482 | 31.9 | ||||||||||||||||||||||||
| |
|
|
|
|
|
|
|
|
|
|
|
|
|
|
|
|||||||||||||||||
| Total |
39,210 |
100 |
40,261 |
100 |
26,536 |
67.7 |
12,674 |
32.3 |
||||||||||||||||||||||||
| |
|
|
|
|
|
|
|
|
|
|
|
|
|
|
|
|||||||||||||||||
Gender |
Region |
|||||||||||||||||||||||||||||||||||
| Employment category |
Total |
% of Total |
Male |
Female |
Asia |
Australia |
Europe |
North America |
South America |
|||||||||||||||||||||||||||
| Full time |
36,965 | 94.3 | 25,622 | 11,343 | 1,513 | 27,489 | 56 | 459 | 7,448 | |||||||||||||||||||||||||||
| Part time |
1,233 | 3.1 | 581 | 652 | 3 | 1,224 | 4 | 2 | ||||||||||||||||||||||||||||
| Fixed term full time |
943 | 2.4 | 311 | 632 | 28 | 587 | 1 | 5 | 322 | |||||||||||||||||||||||||||
| Fixed term part time |
28 | 0.1 | 6 | 22 | 27 | 1 | ||||||||||||||||||||||||||||||
| Casual |
41 | 0.1 | 16 | 25 | 41 | |||||||||||||||||||||||||||||||
| |
|
|
|
|
|
|
|
|
|
|
|
|
|
|
|
|
|
|||||||||||||||||||
| Total |
39,210 |
100 |
26,536 |
12,674 |
1,544 |
29,368 |
61 |
467 |
7,770 |
|||||||||||||||||||||||||||
| |
|
|
|
|
|
|
|
|
|
|
|
|
|
|
|
|
|
|||||||||||||||||||
Gender |
Gender % |
Age group % |
||||||||||||||||||||||||||||||||||
| Category |
Total |
Male |
Female |
Male % |
Female % |
Under 30 |
30-39 |
40-49 |
50+ |
|||||||||||||||||||||||||||
| Senior leaders |
259 | 168 | 91 | 64.9 | 35.1 | 0.0 | 12.4 | 53.6 | 34.0 | |||||||||||||||||||||||||||
| Managers |
1,228 | 781 | 447 | 63.6 | 36.4 | 0.2 | 28.3 | 48.5 | 23.0 | |||||||||||||||||||||||||||
| Supervising and professional |
16,208 | 10,131 | 6,077 | 62.5 | 37.5 | 10.1 | 40.4 | 31.2 | 18.3 | |||||||||||||||||||||||||||
| Operators and general support |
21,515 | 15,456 | 6,059 | 71.8 | 28.2 | 18 | 29.7 | 26.3 | 26.0 | |||||||||||||||||||||||||||
| |
|
|
|
|
|
|
|
|
|
|
|
|
|
|
|
|
|
|||||||||||||||||||
| Total |
39,210 |
26,536 |
12,674 |
67.7 |
32.3 |
14.0 |
34.0 |
29.2 |
22.8 |
|||||||||||||||||||||||||||
| |
|
|
|
|
|
|
|
|
|
|
|
|
|
|
|
|
|
|||||||||||||||||||
1 |
Based on a ‘point in time’ snapshot of employees as at 30 June including employees on extended absence, which was 948 in FY2022. There is no significant seasonal variation in employment numbers. |
2 |
Contractor data is collected from internal surveys and the organisation systems and averages for a 10-month period. |
3 |
Employees who left BHP via the merger of our Petroleum business with WoodsideEnergy Group Ltd (Woodside), which completed on 1 June 2022 (approximately 1,000 employees), or the sale of our 80 per cent interest in BHP Mitsui Coal Pty Ltd (BMC) to Stanmore Resources, which completed on 3 May 2022 (approximately 500 employees) are excluded. |
1 |
Currently, solely BHP Brasil, Vale and Samarco, the Federal Government and the state of Minas Gerais are defendants. |
2 |
The Public Prosecutors’ Office includes the Federal, State of Minas Gerais and State of Espírito Santo public prosecutors’ offices. |
3 |
The Public Defense Office includes the Federal, State of Minas Gerais and State of Espírito Santo public defense offices. |
| • | the issue does not affect any special rights of shareholders |
| • | if required, the issue is approved by shareholders |
| • | if the issue is of a class other than ordinary shares, the rights attaching to the class are expressed at the date of issue |
| • | arises because the Director is a shareholder of BHP and is held in common with the other shareholders of BHP |
| • | arises in relation to the Director’s remuneration as a Director of BHP |
| • | relates to a contract BHP is proposing to enter into that is subject to approval by the shareholders and will not impose any obligation on BHP if it is not approved by the shareholders |
| • | arises merely because the Director is a guarantor or has given an indemnity or security for all or part of a loan, or proposed loan, to BHP |
| • | arises merely because the Director has a right of subrogation in relation to a guarantee or indemnity referred to above |
| • | relates to a contract that insures, or would insure, the Director against liabilities the Director incurs as an officer of BHP, but only if the contract does not make BHP or a related body corporate the insurer |
| • | relates to any payment by BHP or a related body corporate in respect of an indemnity permitted by law, or any contract relating to such an indemnity, or |
| • | is in a contract, or proposed contract with, or for the benefit of, or on behalf of, a related body corporate and arises merely because the Director is a director of a related body corporate |
| • | a shareholder provides a valid written notice of the nomination; and |
| • | the person nominated by the shareholder satisfies candidature for the office and consents in writing to his or her nomination as a Director, |
| • | The holders of any preference shares will be entitled, in priority to any payment of dividend to the holders of any other class of shares, to a preferred right to participate as regards dividends up to but not beyond a specified amount in distribution. |
| • | Any surplus remaining after payment of the distributions above will be payable to the holders of BHP Group Limited ordinary shares in equal amounts per share. |
| • | the right (on redemption and on a winding-up) to payment in cash in priority to any other class of shares of (i) the amount paid or agreed to be considered as paid on each of the preference shares; and (ii) the amount, if any, equal to the aggregate of any dividends accrued but unpaid and of any arrears of dividends; and |
| • | the right, in priority to any payment of dividend on any other class of shares, to the preferential dividend. |
| • | the company as a special resolution; and |
| • | the holders of the issued shares of the affected class, either by a special resolution passed at a separate meeting of the holders of the issued shares of the class affected, or with the written consent of members with at least 75 per cent of the votes of that class. |
| Date of last notice |
||||||||||||||
| Title of class |
Identity of person or group |
Date received |
Date of change |
Number owned |
% of total voting rights 2 |
|||||||||
| Ordinary shares |
Citigroup Global Markets Australia Pty Limited | 26 April 2022 | 21 April 2022 | 318,921,856.17 | 6.2999 | % | ||||||||
| Ordinary shares |
BlackRock Group | 3 February 2022 | 31 January 2022 | 351,161,439 | 6.93 | % | ||||||||
| Ordinary shares |
First Sentier Investors Holdings Pty Limited | 25 January 2022 | 21 January 2022 | 148,776,229 | 5.04 | % | ||||||||
1 |
Between 1 July 2022 and 4 August 2022, BHP received a substantial shareholder notice from State Street Corporation on 22 July 2022, which included the following information: date of change 20 July 2022, the number of securities owned 261,205,833 and percentage of voting rights 5.16 per cent. |
2 |
The percentages quoted are based on the voting rights provided in the last substantial shareholders notice. |
BHP Group Limited |
Number of fully paid shares |
% of issued capital |
||||||||
| 1. | HSBC Custody Nominees (Australia) Limited 2 |
1,308,389,176 | 25.85 | |||||||
| 2. | J P Morgan Nominees Australia Pty Limited |
808,044,953 | 15.96 | |||||||
| 3. | Computershare Clearing Pty Ltd <CCNL DI A/C> 3 |
377,361,065 | 7.45 | |||||||
| 4. | Citicorp Nominees Pty Ltd |
345,389,241 | 6.82 | |||||||
| 5. | Citicorp Nominees Pty Limited <Citibank NY ADR Dep A/C> |
287,052,215 | 5.67 | |||||||
| 6. | South Africa Control A/C\C 4 |
215,543,062 | 4.26 | |||||||
| 7. | BNP Paribas Noms Pty Ltd <Drp> |
140,537,183 | 2.78 | |||||||
| 8. | National Nominees Limited |
133,886,307 | 2.64 | |||||||
| 9. | BNP Paribas Nominees Pty Ltd <Agency Lending Drp A/C> |
61,711,472 | 1.22 | |||||||
| 10. | Citicorp Nominees Pty Limited <Colonial First State Inv A/C> |
41,973,139 | 0.83 | |||||||
| 11. | HSBC Custody Nominees (Australia) Limited <Nt-Comnwlth Super Corp A/C> |
32,952,696 | 0.65 | |||||||
| 12. | BNP Paribas Nominees Pty Ltd ACF Clearstream |
21,016,512 | 0.42 | |||||||
| 13. | Computershare Nominees CI Ltd <ASX Shareplus Control A/C> |
19,149,708 | 0.38 | |||||||
| 14. | Australian Foundation Investment Company Limited |
13,413,159 | 0.26 | |||||||
| 15. | Netwealth Investments Limited <Wrap Services A/C> |
12,887,342 | 0.25 | |||||||
| 16. | BNP Paribas Nominees Pty Ltd Hub24 Custodial Serv Ltd <DRP A/C> |
10,288,935 | 0.20 | |||||||
| 17. | Argo Investments Limited |
8,968,304 | 0.18 | |||||||
| 18. | HSBC Custody Nominees (Australia) Limited 2 |
7,379,822 | 0.15 | |||||||
| 19. | HSBC Custody Nominees (Australia) Limited <Euroclear Bank SA NV A/C> |
6,927,263 | 0.14 | |||||||
| 20. | Solium Nominees (Australia) Pty Ltd <VSA A/C> |
5,574,376 | 0.11 | |||||||
| |
|
|
|
|||||||
3,858,445,930 |
76.22 |
|||||||||
| |
|
|
|
|||||||
1 |
Many of the 20 largest shareholders shown for BHP Group Limited hold shares as a nominee or custodian. In accordance with the reporting requirements, the tables reflect the legal ownership of shares and not the details of the underlying beneficial holders. |
2 |
HSBC Custody Nominees (Australia) Limited is listed twice in the above table as they are registered separately under the same name on the share register. |
3 |
Computershare Clearing Pty Ltd <CCNL DI A/C> represents the Depositary Interest Register (UK). |
4 |
South Africa Control A/C\C represents the South African branch register. |
BHP Group Limited |
||||||||||||||||
Number of shareholders |
% |
Number of shares |
% |
|||||||||||||
| Classification of holder |
||||||||||||||||
| Registered holders of voting securities |
1,613 | 0.26 | 3,665,430 | 0.07 | ||||||||||||
| ADR holders |
1,760 | 0.29 | 285,080,406 | 1 |
5.63 | |||||||||||
1 |
These shares translate to 142,540,203 ADRs. |
BHP Group Limited |
||||||||||||||||
Number of shareholders |
% |
Number of shares |
% |
|||||||||||||
| Registered address |
||||||||||||||||
| Australia |
595,906 | 97.41 | 5,006,223,404 | 98.89 | ||||||||||||
| New Zealand |
7,448 | 1.22 | 17,288,389 | 0.34 | ||||||||||||
| United Kingdom |
2,463 | 0.40 | 6,396,636 | 0.13 | ||||||||||||
| United States |
1,613 | 0.26 | 3,665,430 | 0.07 | ||||||||||||
| South Africa |
93 | 0.02 | 194,146 | 0.00 | ||||||||||||
| Other |
4,206 | 0.69 | 28,555,185 | 0.57 | ||||||||||||
| |
|
|
|
|
|
|
|
|||||||||
| Total |
611,729 | 100 | 5,062,323,190 | 100 | ||||||||||||
| |
|
|
|
|
|
|
|
|||||||||
BHP Group Limited |
||||||||||||||||
Number of shareholders |
% |
Number of shares 1 |
% |
|||||||||||||
| Size of holding |
||||||||||||||||
| 1 – 500 2 |
294,628 | 48.163 | 59,084,642 | 1.17 | ||||||||||||
| 501 – 1,000 |
109,464 | 17.894 | 83,778,512 | 1.65 | ||||||||||||
| 1,001 – 5,000 |
164,130 | 26.831 | 367,994,711 | 7.27 | ||||||||||||
| 5,001 – 10,000 |
26,073 | 4.262 | 183,985,534 | 3.63 | ||||||||||||
| 10,001 – 25,000 |
13,245 | 2.165 | 198,949,969 | 3.93 | ||||||||||||
| 25,001 – 50,000 |
2,766 | 0.452 | 94,261,200 | 1.86 | ||||||||||||
| 50,001 – 100,000 |
936 | 0.153 | 64,334,549 | 1.27 | ||||||||||||
| 100,001 – 250,000 |
347 | 0.057 | 49,498,045 | 0.98 | ||||||||||||
| 250,001 – 500,000 |
66 | 0.011 | 22,227,516 | 0.44 | ||||||||||||
| 500,001 – 1,000,000 |
25 | 0.004 | 17,084,058 | 0.34 | ||||||||||||
| 1,000,001 and over |
49 | 0.008 | 3,921,124,454 | 77.46 | ||||||||||||
| |
|
|
|
|
|
|
|
|||||||||
| Total |
611,729 | 100 | 5,062,323,190 | 100 | ||||||||||||
| |
|
|
|
|
|
|
|
|||||||||
1 |
One ordinary share entitles the holder to one vote. |
2 |
The number of BHP Group Limited shareholders holding less than a marketable parcel (A$500) based on the market price of A$38.17 as at 4 August 2022 was 9,468. |
| Depositary service |
Fee payable by the ADR holders | |
| Issuance of ADSs upon deposit of shares | Up to US$5.00 per 100 ADSs (or fraction thereof) issued | |
| Delivery of Deposited Securities against surrender of ADSs | Up to US$5.00 per 100 ADSs (or fraction thereof) surrendered | |
| Distribution of Cash Dividends | Up to US$1.50 per 100 ADSs (or fraction thereof) held | |
| Depositary service |
Fee payable by the ADR holders | |
| Cash Distributions other than Cash Dividends (i.e. sale of rights, other entitlements, return of capital) | Up to US$2.00 per 100 ADSs (or fraction thereof) held | |
| Distribution of ADSs pursuant to exercise of rights to purchase additional ADSs. Excludes stock dividends and stock splits | Up to US$5.00 per 100 ADSs (or fraction thereof) held | |
| Distribution of securities other than ADSs or rights to purchase additional ADSs (i.e., spin-off shares) |
Up to US$5.00 per 100 ADSs (or fraction thereof) held | |
| Distribution of ADSs pursuant to an ADR ratio change in which shares are distributed | No fee | |
Bruce |
Keith |
|||||||||||||||||||||||
Pre-sale interest % |
Post-sale licence interest % |
Post-sale decom. interest % |
Pre-sale interest % |
Post-sale licence interest % |
Post-sale decom. interest % |
|||||||||||||||||||
| BP |
37 | 1 | 37 | 34.83 | 0 | 34.83 | ||||||||||||||||||
| Total |
43.25 | 1 | 43.25 | 25 | 0 | 25 | ||||||||||||||||||
| BHP GB |
16 | 0 | 16 | 31.83 | 0 | 31.83 | ||||||||||||||||||
| Marubeni |
3.65 | 0 | 0 | 8.33 | 0 | 0 | ||||||||||||||||||
| Serica |
0 | 98 | 3.75 | 0 | 100 | 8.33 | ||||||||||||||||||
| • | subsequently received a share of pre-tax net cash flow attributable to its historic interest in the Bruce and Keith gas and oil fields of 60 per cent during December 2018, 50 per cent in CY2019 and 40 per cent in each of CY2020 and CY2021 under a Net Cash Flow Sharing Deed; and |
| • | will continue to receive a share of projected decommissioning costs up to a specified cap. |
| • | BHP Group Limited remains an Australian resident company, incorporated under the Corporations Act, that is listed on the ASX under the name ‘BHP Group Limited’ and trades under that name. |
| • | BHP Group Limited remains the ultimate holding company of, and continues to ultimately manage and control the companies conducting the businesses which are presently conducted by the subsidiaries of BHP Group Limited, including the Minerals and Services businesses, for so long as those businesses form part of the BHP Group. |
| • | The headquarters of BHP Group Limited (including the BHP Group’s corporate head offices) are to be in Australia. |
| • | The Chief Executive Officer of BHP Group Limited has their principal office in Australia. |
| • | The centre of administrative and practical management of BHP Group Limited is in Australia and BHP Group Limited’s corporate head office activities, of the kind presently carried on in Australia, continue to be managed in Australia. |
| • | The headquarters of BHP Group Limited is publicly acknowledged as being in Australia in significant public announcements and in all public documents. |
| • | The Chief Executive Officer of BHP Group Limited has their principal place of residence in Australia. |
| • | The majority of all regularly scheduled Board meetings of BHP Group Limited in any calendar year occurs in Australia. |
| • | a citizen or resident alien of the US; |
| • | a corporation (or other entity treated as a corporation for US federal income tax purposes) that is created or organised under the laws of the US or any political subdivision thereof; |
| • | an estate, the income of which is subject to US federal income taxation regardless of its source; or |
| • | a trust: |
| (a) | if a court within the US is able to exercise primary supervision over its administration and one or more US persons have the authority to control all of its substantial decisions; or |
| (b) | that has made a valid election to be treated as a US person for tax purposes. |
| • | franked; nor |
| • | declared by BHP Group Limited to be conduit foreign income. (Broadly, this means that the relevant part of the dividend is declared to have been paid out of foreign source amounts received by BHP Group Limited that are not subject to tax in Australia, such as dividends remitted to Australia by foreign subsidiaries). |
| • | is an Australian resident for Australian tax purposes (although the tax will generally not exceed 15 per cent where the US holder is eligible for benefits under the Australian Tax Treaty as a treaty resident of the US and any franking credits may be creditable against their Australian income tax liability); or |
| • | carries on business in Australia through a permanent establishment as defined in the Australian Tax Treaty, or performs personal services from a fixed base in Australia, and the shareholding in respect of which the dividend is paid is effectively connected with that permanent establishment or fixed base, (however, in such a case any franking credits may be creditable against the Australian income tax liability). |
| • | they are not eligible for benefits under the Australian Tax Treaty and the gain is sourced in Australia for Australian tax purposes; or |
| • | they are eligible for benefits under the Australian Tax Treaty but the gain constitutes any of the following (in which case the gain will be deemed to have an Australian source): |
| – | business profits of an enterprise attributable to a permanent establishment situated in Australia through which the enterprise carries on business in Australia; or |
| – | income or gains from the alienation of property that form part of the business property of a permanent establishment of an enterprise that the US holder has in Australia, or pertain to a fixed base available to the US holder in Australia for the purpose of performing independent personal services; or |
| – | income derived from the disposition of shares in a company, the assets of which consist wholly or principally of real property (which includes rights to exploit or to explore for natural resources) situated in Australia, whether such assets are held directly or indirectly through one or more interposed entities. |
| • | the US holder is an Australian resident for Australian tax purposes; or |
| • | the ordinary shares or ADSs have been used by the US holder in carrying on a business through a permanent establishment in Australia; or |
| • | the ordinary shares or ADSs constitute an ‘indirect Australian real property interest’ for Australian CGT purposes – this will generally be the case if the US holder (either alone or together with associates) directly or indirectly owns or owned 10 per cent or more of the issued share capital of BHP Group Limited at the time of the disposal or throughout a 12-month period during the two years prior to the time of disposal and, at the time of the disposal, the sum of the market values of BHP Group Limited’s assets that are taxable Australian real property (held directly or through interposed entities) exceeds the sum of the market values of BHP Group Limited’s assets (held directly or through interposed entities) that are not taxable Australian real property at that time (which, for these purposes includes mining, quarrying or prospecting rights in respect of minerals, petroleum or quarry materials situated in Australia); or |
| • | the US holder is an individual who is not eligible for benefits under the Australian Tax Treaty as a treaty resident of the US and elected on becoming a non-resident of Australia to continue to have the ordinary shares or ADSs subject to Australian capital gains tax. |
| • | to temporary residents of Australia who should seek advice that is specific to their circumstances; or |
| • | if the Investment Management Regime (IMR) applies to the US holder, which exempts from Australian income tax and capital gains tax gains made on disposals by certain categories of non-resident funds – called IMR entities – of (relevantly) portfolio interests in Australian public companies (subject to a number of conditions). The IMR exemptions broadly apply to widely held IMR entities in relation to their direct investments and indirect investments made through an independent Australian fund manager. The exemptions apply to gains made by IMR entities that are treated as companies for Australian tax purposes as well as gains made by non-resident investors in IMR entities that are treated as trusts and partnerships for Australian tax purposes. |
| • | they are resident in the UK; or |
| • | they carry on a trade, profession or vocation in the UK through a branch or agency for the year in which the disposal occurs and the shares or ADSs have been used, held or acquired for the purposes of such trade (or profession or vocation), branch or agency. In the case of a trade, the term ‘branch’ includes a permanent establishment. |
| • | had sole UK residence in the UK tax year preceding his/her departure from the UK; |
| • | had sole UK residence at any time during at least four of the seven UK tax years preceding his/her year of departure from the UK; and |
| • | subsequently becomes treated as having sole UK residence again before five complete UK tax years of non-UK residence have elapsed from the date he/she left the UK. |
Ag |
silver | |
AI 2 O3 |
alumina | |
Anth |
anthracite | |
Ash |
inorganic material remaining after combustion | |
Au |
gold | |
Cu |
copper | |
CV |
calorific value | |
Fe |
iron | |
Insol. |
insolubles | |
| K 2 O |
potassium oxide | |
| KCl |
potassium chloride | |
KCl.MgCl2.6H2O |
carnallite | |
LOI |
loss on ignition | |
LPL |
Lower Patience Lake (stratigraphic unit) | |
Met |
metallurgical coal | |
MgO |
magnesium oxide | |
Mo |
molybdenum | |
Ni |
nickel | |
| P |
phosphorous | |
Pc |
phosphorous in concentrate | |
PCI |
pulverised coal injection | |
| S |
sulphur | |
SCu |
soluble copper | |
SiO 2 |
silica | |
TCu |
total copper | |
Th |
thermal coal | |
U 3 O8 |
uranium oxide | |
VM |
volatile matter | |
Yield |
the percentage of material of interest that is extracted during mining and/or processing | |
Zn |
zinc | |
| % |
percentage or per cent | |
dmt |
dry metric tonne | |
g/t |
grams per tonne | |
ha |
hectare | |
kcal/kg |
kilocalories per kilogram | |
kg/tonne or kg/t |
kilograms per tonne | |
km |
kilometre | |
koz |
thousand troy ounces | |
kt |
kilotonnes | |
ktpa |
kilotonnes per annum | |
ktpd |
kilotonnes per day | |
kV |
kilovolt | |
kW |
kilowatt | |
kWh |
kilowatt hour | |
lb |
pound | |
m |
metre | |
m 3 |
cubic metre | |
ML |
megalitre | |
Mt |
million tonnes | |
Mtpa |
million tonnes per annum | |
MW |
megawatt | |
oz |
ounce | |
ppm |
parts per million | |
scf |
standard cubic feet | |
t |
tonne | |
TW |
terawatt | |
TWh |
terawatt hour | |
tpa |
tonnes per annum | |
tpd |
tonnes per day | |
t/h |
tonnes per hour | |
wmt |
wet metric tonnes | |
• |
100 per cent for operations accounted for as subsidiaries, regardless of the equity interest owned |
• |
for operations accounted for as a joint operation, the company’s interest in the operations |
• |
the sustainability of the volume and quality of the water resources, taking into account interactions of all other parties and any related environmental, social or cultural values and climate change forecasts |
• |
the state of water infrastructure, water access, sanitation and hygiene of local communities |
• |
the environmental health of the water catchments that feed the water resources taking into account the extent of vegetation, runoff, and any conservation of the area |
• |
external water governance arrangements and their effectiveness |
Exhibit 1 |
Constitution | |
*1.1 |
||
Exhibit 2 |
Securities | |
*2.1 |
||
Exhibit 4 |
Material Contracts | |
*4.1 |
||
*4.2 |
||
4.3 |
||
Exhibit 8 |
List of Subsidiaries | |
*8.1 |
||
Exhibit 12 |
Certifications (section 302) | |
*12.1 |
||
*12.2 |
||
Exhibit 13 |
Certifications (section 906) | |
*13.1 |
||
*13.2 |
||
Exhibit 15 |
Consents | |
*15.1 |
||
*15.2 |
||
*15.3 |
||
*15.4 |
||
Exhibit 96 |
Technical Report Summaries | |
*96.1 |
||
*96.2 |
||
*96.3 |
||
Exhibit 101 |
Interactive Data File | |
*101.INS |
Inline XBRL Instance Document—this instance document does not appear in the Interactive Data File because its XBRL tags embedded within the Inline XBRL document | |
*101.SCH |
Inline XBRL Taxonomy Extension Schema Document | |
*101.CAL |
Inline XBRL Taxonomy Extension Calculation Linkbase Document | |
*101.DEF |
Inline XBRL Taxonomy Extension Definition Linkbase Document | |
*101.LAB |
Inline XBRL Taxonomy Extension Label Linkbase Document | |
*101.PRE |
Inline XBRL Taxonomy Extension Presentation Linkbase Document | |
Exhibit 104 |
Cover Page Interactive Data File | |
*104 |
Cover page Interactive Data File (embedded within the Inline XBRL document) | |
1 |
Previously filed as an exhibit to BHP’s annual report on Form 20-F for the year ended 30 June 2016 on 21 September 2016. |
| 1 |
F-2 | |||
F-2 | ||||
F-3 | ||||
F-4 | ||||
F-5 | ||||
F-6 | ||||
F-12 | ||||
| 1A |
F-78 | |||
| 2 |
F-83 | |||
| 3 |
F-84 | |||
| 4 |
F-84 | |||
| F-12 | ||||
| F-12 | ||||
| 1 |
F-12 | |||
| 2 |
F-15 | |||
| 3 |
F-16 | |||
| 4 |
F-19 | |||
| 5 |
F-25 | |||
| 6 |
F-26 | |||
| 7 |
F-29 | |||
| F-30 | ||||
| 8 |
F-30 | |||
| 9 |
F-31 | |||
| 10 |
F-31 | |||
| F-32 | ||||
| 11 |
F-32 | |||
| 12 |
F-35 | |||
| 13 |
F-36 | |||
| 14 |
F-39 | |||
| 15 |
F-41 | |||
| F-44 | ||||
| 16 |
F-44 | |||
| 17 |
F-46 | |||
| 18 |
F-48 | |||
| 19 |
F-48 | |||
| F-49 | ||||
| 20 |
F-49 | |||
| 21 |
F-51 | |||
| 22 |
F-54 | |||
| 23 |
F-55 | |||
| F-62 | ||||
| 24 |
F-62 | |||
| 25 |
F-62 | |||
| 26 |
F-66 | |||
| F-68 | ||||
| 27 |
F-68 | |||
| 28 |
F-70 | |||
| 29 |
F-71 | |||
| 30 |
F-74 | |||
| 31 |
F-75 | |||
| F-76 | ||||
| 32 |
F-76 | |||
| 33 |
F-76 | |||
| F-77 | ||||
| 34 |
F-77 | |||
| 35 |
F-77 | |||
| 36 |
F-77 | |||
| 37 |
F-77 | |||
| • | Group’s current year results |
| • | impact of significant changes in the Group’s business or |
| • | aspects of the Group’s operations that are important to future performance |
2022 |
2021 |
2020 |
||||||||||||||
Notes |
US$M |
US$M Restated |
US$M Restated |
|||||||||||||
| Continuing operations |
||||||||||||||||
| Revenue |
2 | |||||||||||||||
| Other income |
5 | |||||||||||||||
| Expenses excluding net finance costs |
5 | ( |
) |
( |
) | ( |
) | |||||||||
| Loss from equity accounted investments, related impairments and expenses |
29 | ( |
) |
( |
) | ( |
) | |||||||||
| |
|
|
|
|
|
|||||||||||
| Profit from operations |
||||||||||||||||
| |
|
|
|
|
|
|||||||||||
| Financial expenses |
( |
) |
( |
) | ( |
) | ||||||||||
| Financial income |
||||||||||||||||
| |
|
|
|
|
|
|||||||||||
| Net finance costs |
22 | ( |
) |
( |
) | ( |
) | |||||||||
| |
|
|
|
|
|
|||||||||||
| Profit before taxation |
||||||||||||||||
| |
|
|
|
|
|
|||||||||||
| Income tax expense |
( |
) |
( |
) | ( |
) | ||||||||||
| Royalty-related taxation (net of income tax benefit) |
( |
) |
( |
) | ||||||||||||
| |
|
|
|
|
|
|||||||||||
| Total taxation expense |
6 | ( |
) |
( |
) | ( |
) | |||||||||
| |
|
|
|
|
|
|||||||||||
| Profit after taxation from Continuing operations |
||||||||||||||||
| |
|
|
|
|
|
|||||||||||
| Discontinued operations |
||||||||||||||||
| Profit/(loss) after taxation from Discontinued operations |
27 | ( |
) | |||||||||||||
| |
|
|
|
|
|
|||||||||||
| Profit after taxation from Continuing and Discontinued operations |
||||||||||||||||
| |
|
|
|
|
|
|||||||||||
| Attributable to non-controlling interests |
||||||||||||||||
| Attributable to BHP shareholders |
||||||||||||||||
| |
|
|
|
|
|
|||||||||||
| Basic earnings per ordinary share (cents) |
7 | 0.6 |
.5 | .3 | ||||||||||||
| Diluted earnings per ordinary share (cents) |
7 | 9.3 |
.0 | .0 | ||||||||||||
| Basic earnings from Continuing operations per ordinary share (cents) |
7 | .0 |
.0 | .2 | ||||||||||||
| Diluted earnings from Continuing operations per ordinary share (cents) |
7 | 2 |
.5 | .8 | ||||||||||||
| |
|
|
|
|
|
|||||||||||
2022 |
2021 | 2020 | ||||||||||||||
Notes |
US$M |
US$M | US$M | |||||||||||||
| Profit after taxation from Continuing and Discontinued operations |
||||||||||||||||
| Other comprehensive income |
||||||||||||||||
| Items that may be reclassified subsequently to the income statement: |
||||||||||||||||
| Hedges: |
||||||||||||||||
| (Losses)/gains taken to equity |
( |
) | ( |
) | ||||||||||||
| Losses/(gains) transferred to the income statement |
( |
) | ||||||||||||||
| Exchange fluctuations on translation of foreign operations taken to equity |
( |
) | ||||||||||||||
| Exchange fluctuations on translation of foreign operations transferred to income statement |
( |
) |
– | – | ||||||||||||
| Tax recognised within other comprehensive income |
6 | ( |
) | |||||||||||||
| |
|
|
|
|
|
|||||||||||
| Total items that may be reclassified subsequently to the income statement |
( |
) | ( |
) | ||||||||||||
| |
|
|
|
|
|
|||||||||||
| Items that will not be reclassified to the income statement: |
||||||||||||||||
| Re-measurement gains/(losses) on pension and medical schemes |
( |
) | ||||||||||||||
| Equity investments held at fair value |
( |
) | ( |
) | ( |
) | ||||||||||
| Tax recognised within other comprehensive income |
6 | ( |
) | ( |
) | |||||||||||
| |
|
|
|
|
|
|||||||||||
| Total items that will not be reclassified to the income statement |
( |
) | ||||||||||||||
| |
|
|
|
|
|
|||||||||||
| Total other comprehensive (loss)/income |
( |
) | ( |
) | ||||||||||||
| |
|
|
|
|
|
|||||||||||
| Total comprehensive income |
||||||||||||||||
| |
|
|
|
|
|
|||||||||||
| Attributable to non-controlling interests |
||||||||||||||||
| Attributable to BHP shareholders |
||||||||||||||||
| |
|
|
|
|
|
|||||||||||
2022 |
2021 |
|||||||||||
Notes |
US$M |
US$M |
||||||||||
| ASSETS |
||||||||||||
| Current assets |
||||||||||||
| Cash and cash equivalents |
20 | |||||||||||
| Trade and other receivables |
8 | |||||||||||
| Other financial assets |
23 | |||||||||||
| Inventories |
10 | |||||||||||
| Assets held for sale |
– |
|||||||||||
| Current tax assets |
||||||||||||
| Other |
||||||||||||
| |
|
|
|
|||||||||
| Total current assets |
||||||||||||
| |
|
|
|
|||||||||
| Non-current assets |
||||||||||||
| Trade and other receivables |
8 | |||||||||||
| Other financial assets |
23 | |||||||||||
| Inventories |
10 | |||||||||||
| Property, plant and equipment |
11 | |||||||||||
| Intangible assets |
12 | |||||||||||
| Investments accounted for using the equity method |
29 | |||||||||||
| Deferred tax assets |
14 | |||||||||||
| Other |
||||||||||||
| |
|
|
|
|||||||||
| Total non-current assets |
||||||||||||
| |
|
|
|
|||||||||
| Total assets |
||||||||||||
| |
|
|
|
|||||||||
| LIABILITIES |
||||||||||||
| Current liabilities |
||||||||||||
| Trade and other payables |
9 | |||||||||||
| Interest bearing liabilities |
20 | |||||||||||
| Liabilities directly associated with the assets held for sale |
– |
|||||||||||
| Other financial liabilities |
23 | |||||||||||
| Current tax payable |
||||||||||||
| Provisions |
4,15,19,26 | |||||||||||
| Deferred income |
||||||||||||
| |
|
|
|
|||||||||
| Total current liabilities |
||||||||||||
| |
|
|
|
|||||||||
| Non-current liabilities |
||||||||||||
| Interest bearing liabilities |
20 | |||||||||||
| Other financial liabilities |
23 | |||||||||||
| Non-current tax payable |
||||||||||||
| Deferred tax liabilities |
14 | |||||||||||
| Provisions |
4,15,19,26 | |||||||||||
| Deferred income |
||||||||||||
| |
|
|
|
|||||||||
| Total non-current liabilities |
||||||||||||
| |
|
|
|
|||||||||
| Total liabilities |
||||||||||||
| |
|
|
|
|||||||||
| Net assets |
||||||||||||
| |
|
|
|
|||||||||
| EQUITY |
||||||||||||
| Share capital – BHP Group Limited |
||||||||||||
| Share capital – BHP Group Plc |
– |
|||||||||||
| Treasury shares |
( |
) |
( |
) | ||||||||
| Reserves |
17 | |||||||||||
| Retained earnings |
||||||||||||
| |
|
|
|
|||||||||
| Total equity attributable to BHP shareholders |
||||||||||||
| Non-controlling interests |
17 | |||||||||||
| |
|
|
|
|||||||||
| Total equity |
||||||||||||
| |
|
|
|
|||||||||
| Ken MacKenzie |
Mike Henry | |
| Chair |
Chief Executive Officer |
2022 |
2021 |
2020 |
||||||||||||||
US$M |
US$M |
US$M |
||||||||||||||
Notes |
Restated |
Restated |
||||||||||||||
| Operating activities |
||||||||||||||||
| Profit before taxation from Continuing operations |
||||||||||||||||
| Adjustments for: |
||||||||||||||||
| Depreciation and amortisation expense |
||||||||||||||||
| Impairments of property, plant and equipment, financial assets and intangibles |
||||||||||||||||
| Net finance costs |
||||||||||||||||
| Loss from equity accounted investments, related impairments and expenses |
||||||||||||||||
| Other |
( |
) | ||||||||||||||
| Changes in assets and liabilities: |
||||||||||||||||
| Trade and other receivables |
( |
) | ( |
) | ||||||||||||
| Inventories |
( |
) | ( |
) | ( |
) | ||||||||||
| Trade and other payables |
( |
) | ||||||||||||||
| Provisions and other assets and liabilities |
( |
) | ||||||||||||||
| |
|
|
|
|
|
|||||||||||
| Cash generated from operations |
||||||||||||||||
| Dividends received |
||||||||||||||||
| Interest received |
||||||||||||||||
| Interest paid |
( |
) | ( |
) | ( |
) | ||||||||||
| Proceeds/(settlements) of cash management related instruments |
( |
) | ||||||||||||||
| Net income tax and royalty-related taxation refunded |
||||||||||||||||
| Net income tax and royalty-related taxation paid |
( |
) | ( |
) | ( |
) | ||||||||||
| |
|
|
|
|
|
|||||||||||
| Net operating cash flows from Continuing operations |
||||||||||||||||
| |
|
|
|
|
|
|||||||||||
| Net operating cash flows from Discontinued operations |
27 | |||||||||||||||
| |
|
|
|
|
|
|||||||||||
| Net operating cash flows |
||||||||||||||||
| |
|
|
|
|
|
|||||||||||
| Investing activities |
||||||||||||||||
| Purchases of property, plant and equipment |
( |
) | ( |
) | ( |
) | ||||||||||
| Exploration expenditure |
( |
) | ( |
) | ( |
) | ||||||||||
| Exploration expenditure expensed and included in operating cash flows |
||||||||||||||||
| Net investment and funding of equity accounted investments |
( |
) | ( |
) | ( |
) | ||||||||||
| Proceeds from sale of assets |
||||||||||||||||
| Proceeds/(settlements) from sale of subsidiaries, operations and joint operations net of their cash |
( |
) | – | |||||||||||||
| Other investing |
( |
) | ( |
) | ( |
) | ||||||||||
| |
|
|
|
|
|
|||||||||||
| Net investing cash flows from Continuing operations |
( |
) | ( |
) | ( |
) | ||||||||||
| |
|
|
|
|
|
|||||||||||
| Net investing cash flows from Discontinued operations |
27 | ( |
) | ( |
) | ( |
) | |||||||||
| |
|
|
|
|
|
|||||||||||
| Net cash completion payment on merger of Petroleum with Woodside |
27 | ( |
) | – | – | |||||||||||
| |
|
|
|
|
|
|
|
|
|
|
|
|
|
|
|
|
| Cash and cash equivalents disposed on merger of Petroleum with Woodside |
27 | ( |
) |
– | – | |||||||||||
| |
|
|
|
|
|
|||||||||||
| Net investing cash flows |
( |
) | ( |
) | ( |
) | ||||||||||
| |
|
|
|
|
|
|||||||||||
| Financing activities |
||||||||||||||||
| Proceeds from interest bearing liabilities |
||||||||||||||||
| Proceeds/(settlements) of debt related instruments |
– |
( |
) | |||||||||||||
| Repayment of interest bearing liabilities |
( |
) | ( |
) | ( |
) | ||||||||||
| Purchase of shares by Employee Share Ownership Plan (ESOP) Trusts |
( |
) | ( |
) | ( |
) | ||||||||||
| Dividends paid |
( |
) | ( |
) | ( |
) | ||||||||||
| Dividends paid to non-controlling interests |
( |
) | ( |
) | ( |
) | ||||||||||
| |
|
|
|
|
|
|||||||||||
| Net financing cash flows from Continuing operations |
( |
) | ( |
) | ( |
) | ||||||||||
| |
|
|
|
|
|
|||||||||||
| Net financing cash flows from Discontinued operations |
27 | ( |
) | ( |
) | ( |
) | |||||||||
| |
|
|
|
|
|
|||||||||||
| Net financing cash flows |
( |
) | ( |
) | ( |
) | ||||||||||
| |
|
|
|
|
|
|||||||||||
| Net increase/(decrease) in cash and cash equivalents from Continuing operations |
( |
) | ||||||||||||||
| Net increase/(decrease) in cash and cash equivalents from Discontinued operations |
( |
) | ( |
) | ||||||||||||
| Net cash completion payment on merger of Petroleum with Woodside |
( |
) | – | – | ||||||||||||
| Cash and cash equivalents disposed on merger of Petroleum with Woodside |
( |
) |
– | – | ||||||||||||
| Cash and cash equivalents, net of overdrafts, at the beginning of the financial year |
||||||||||||||||
| Foreign currency exchange rate changes on cash and cash equivalents |
( |
) | ( |
) | ||||||||||||
| |
|
|
|
|
|
|||||||||||
| Cash and cash equivalents, net of overdrafts, at the end of the financial year |
20 | |||||||||||||||
| |
|
|
|
|
|
|||||||||||
Attributable to BHP shareholders |
||||||||||||||||||||||||||||||||||||
Share capital |
Treasury shares |
Reserves |
Retained earnings |
Total equity attributable to BHP shareholders |
||||||||||||||||||||||||||||||||
| US$M |
BHP Group Limited |
BHP Group Plc |
BHP Group Limited |
BHP Group Plc |
Non- controlling interests |
Total equity |
||||||||||||||||||||||||||||||
| Balance as at 1 July 2021 |
( |
) |
( |
) |
||||||||||||||||||||||||||||||||
| |
|
|
|
|
|
|
|
|
|
|
|
|
|
|
|
|
|
|||||||||||||||||||
| Total comprehensive income |
– |
– |
– |
– |
( |
) | ||||||||||||||||||||||||||||||
| Transactions with owners: |
||||||||||||||||||||||||||||||||||||
| BHP Group Limited shares issued |
– |
( |
) | – |
– |
– |
– |
– |
– |
|||||||||||||||||||||||||||
| Purchase of shares by ESOP Trusts |
– |
– |
( |
) | ( |
) | – |
– |
( |
) | – |
( |
) | |||||||||||||||||||||||
| Employee share awards exercised net of employee contributions net of tax |
– |
– |
( |
) | ( |
) | – |
– |
– |
|||||||||||||||||||||||||||
| Vested employee share awards that have lapsed, been cancelled or forfeited |
– |
– |
– |
– |
( |
) | – |
– |
– |
|||||||||||||||||||||||||||
| Accrued employee entitlement for unexercised awards net of tax |
– |
– |
– |
– |
– |
– |
||||||||||||||||||||||||||||||
| Corporate structure unification |
( |
) | – |
– |
( |
) | – |
– |
– |
– |
||||||||||||||||||||||||||
| Dividends |
– |
– |
– |
– |
– |
( |
) | ( |
) | ( |
) | ( |
) | |||||||||||||||||||||||
| In specie dividend on merger of Petroleum with Woodside |
– |
– |
– |
– |
– |
( |
) |
( |
) |
– |
( |
) | ||||||||||||||||||||||||
| Divestment of subsidiaries, operations and joint operations |
– |
– |
– |
– |
– |
– |
– |
( |
) |
( |
) | |||||||||||||||||||||||||
| Transfers within equity on divestment of subsidiaries, operations and joint operations |
– |
– |
– |
– |
( |
) |
– |
– |
– |
|||||||||||||||||||||||||||
| Equity contributed net of tax |
– |
– |
– |
– |
– |
|||||||||||||||||||||||||||||||
| |
|
|
|
|
|
|
|
|
|
|
|
|
|
|
|
|
|
|||||||||||||||||||
| Balance as at 30 June 2022 |
– |
( |
) | – |
||||||||||||||||||||||||||||||||
| |
|
|
|
|
|
|
|
|
|
|
|
|
|
|
|
|
|
|||||||||||||||||||
| Balance as at 1 July 2020 |
( |
) | – | |||||||||||||||||||||||||||||||||
| |
|
|
|
|
|
|
|
|
|
|
|
|
|
|
|
|
|
|||||||||||||||||||
| Total comprehensive income |
– | – | – | – | ||||||||||||||||||||||||||||||||
| Transactions with owners: |
||||||||||||||||||||||||||||||||||||
| Purchase of shares by ESOP Trusts |
– | – | ( |
) | ( |
) | – | – | ( |
) | – | ( |
) | |||||||||||||||||||||||
| Employee share awards exercised net of employee contributions net of tax |
– | – | ( |
) | ( |
) | – | – | – | |||||||||||||||||||||||||||
| Vested employee share awards that have lapsed, been cancelled or forfeited |
– | – | – | – | ( |
) | – | – | – | |||||||||||||||||||||||||||
| Accrued employee entitlement for unexercised awards net of tax |
– | – | – | – | – | – | ||||||||||||||||||||||||||||||
| Dividends |
– | – | – | – | – | ( |
) | ( |
) | ( |
) | ( |
) | |||||||||||||||||||||||
| |
|
|
|
|
|
|
|
|
|
|
|
|
|
|
|
|
|
|||||||||||||||||||
| Balance as at 30 June 2021 |
( |
) | ( |
) | ||||||||||||||||||||||||||||||||
| |
|
|
|
|
|
|
|
|
|
|
|
|
|
|
|
|
|
|||||||||||||||||||
| Balance as at 1 July 2019 |
( |
) | – | |||||||||||||||||||||||||||||||||
| |
|
|
|
|
|
|
|
|
|
|
|
|
|
|
|
|
|
|||||||||||||||||||
| Total comprehensive income |
– | – | – | – | ( |
) | ||||||||||||||||||||||||||||||
| Transactions with owners: |
||||||||||||||||||||||||||||||||||||
| Purchase of shares by ESOP Trusts |
– | – | ( |
) | ( |
) | – | – | ( |
) | – | ( |
) | |||||||||||||||||||||||
| Employee share awards exercised net of employee contributions net of tax |
– | – | ( |
) | ( |
) | – | – | – | |||||||||||||||||||||||||||
| Vested employee share awards that have lapsed, been cancelled or forfeited |
– | – | – | – | ( |
) | – | – | – | |||||||||||||||||||||||||||
| Accrued employee entitlement for unexercised awards net of tax |
– | – | – | – | – | – | ||||||||||||||||||||||||||||||
| Dividends |
– | – | – | – | – | ( |
) | ( |
) | ( |
) | ( |
) | |||||||||||||||||||||||
| |
|
|
|
|
|
|
|
|
|
|
|
|
|
|
|
|
|
|||||||||||||||||||
| Balance as at 30 June 2020 |
( |
) | – | |||||||||||||||||||||||||||||||||
| |
|
|
|
|
|
|
|
|
|
|
|
|
|
|
|
|
|
|||||||||||||||||||
| • | are a consolidated general purpose financial report |
| • | have been prepared in accordance with the requirements of: |
¡ |
the Australian Corporations Act 2001 (Corporations Act 2001) |
¡ |
Australian Accounting Standards and other authoritative pronouncements of the Australian Accounting Standards Board (AASB) and International Financial Reporting Standards as issued by the International Accounting Standards Board (IASB) (collectively referred to as IFRS) |
| • | are prepared on a going concern basis as the Directors: |
¡ |
have made an assessment of the Group’s ability to continue as a going concern for the 12 months from the date of this report |
¡ |
consider it appropriate to adopt the going concern basis of accounting in preparing the Group’s Financial Statements |
| • | measure items on the basis of historical cost principles, except for the following items: |
¡ |
derivative financial instruments and certain other financial assets and liabilities, which are carried at fair value |
¡ |
non-current assets or disposal groups that are classified as held-for-sale or held-for-distribution, which are measured at the lower of carrying amount and fair value less costs to sell |
| • | include significant accounting policies in the notes to the Financial Statements that summarise the recognition and measurement basis used and are relevant to an understanding of the Financial Statements |
| • | apply a presentation currency of US dollars, consistent with the predominant functional currency of the Group’s operations. Amounts are rounded to the nearest million dollars, unless otherwise stated, in accordance with ASIC (Rounding in Financial/Directors’ Reports) Instrument 2016/191 |
| • | present reclassified comparative information where required for consistency with the current year’s presentation |
| • | adopt all new and amended standards and interpretations under IFRS, that are mandatory for application in periods beginning on 1 July 2021. None had a significant impact on the Financial Statements. Refer note 37 ‘New and amended accounting standards and interpretations and changes to accounting policies’ for details |
| • | have not early adopted any standards and interpretations that have been issued or amended but are not yet effective. Refer note 37 ‘New and amended accounting standards and interpretations and changes to accounting policies’ for details |
| • | the UK Companies Act 2006 |
| • | International Accounting Standards in conformity with the requirements of the UK Companies Act 2006 and International Financial Reporting Standards adopted pursuant to Regulation (EC) No. 1606/2002 as it applies in the European Union (EU) |
| • | International Accounting Standards adopted for use within the UK |
| • | has power over the investee |
| • | is exposed to, or has rights to, variable returns from its involvement with the entity |
| • | has the ability to affect those returns through its power to direct the activities of the entity |
| • | Joint operations: |
| • | Joint ventures: |
| • | has over 20 per cent but less than 50 per cent of the voting rights of an entity, unless it can be clearly demonstrated that this is not the case or |
| • | holds less than 20 per cent of the voting rights of an entity; however, has the power to participate in the financial and operating policy decisions affecting the entity |
| Foreign currency item |
Applicable exchange rate | |
| Transactions |
Date of underlying transaction | |
| Monetary assets and liabilities |
Period-end rate |
| Foreign currency amount |
Applicable exchange rate | |
| Income and expenses |
Date of underlying transaction | |
| Assets and liabilities |
Period-end rate | |
| Equity |
Historical rate | |
| Reserves |
Historical rate |
| Significant accounting policies, judgements and estimates | ||
| The Group’s accounting policies require the use of judgement, estimates and assumptions. All judgements, estimates and assumptions are based on the most current facts and circumstances and are reassessed on an ongoing basis. Actual results in future reporting periods may differ for these estimates under different assumptions and conditions. | ||
| Further information regarding the Group’s significant judgements and key estimates and assumptions, being those where changes may materially affect financial results and the carrying amount of assets and liabilities to be reported in the next reporting period, are embedded within the following notes: | ||
| Note |
||
| 4 |
Significant events – Samarco dam failure | |
| 6 |
Taxation | |
| 11 |
Overburden removal costs | |
| 11 |
Depreciation of property, plant and equipment | |
| 13 |
Impairments of non-current assets | |
| 15 |
Closure and rehabilitation provisions | |
| 21 |
Leases | |
| Additional information including sensitivity analysis, where appropriate, has been provided in the relevant notes to enhance an understanding of the impact of key estimates and assumptions on the Group’s financial position and performance. | ||
| Reserve estimates | ||
| Reserves are estimates of the amount of product that can be demonstrated to be able to be economically and legally extracted from the Group’s properties. In order to estimate reserves, assumptions are required about a range of technical and economic factors, including quantities, qualities, production techniques, recovery efficiency, production and transport costs, commodity supply and demand, commodity and carbon prices and exchange rates. | ||
| Estimating the quantity and/or quality of reserves requires the size, shape and depth of ore bodies to be determined by analysing geological data, such as drilling samples and geophysical survey interpretations. Economic assumptions used to estimate reserves change from period-to-period as additional technical and operational data is generated. This process may require complex and difficult geological judgements to interpret the data. | ||
| Reserve impact on financial reporting | ||
| Estimates of reserves may change from period-to-period as the economic assumptions used to estimate reserves change and additional geological data is generated during the course of operations. Changes in reserves may affect the Group’s financial results and financial position in a number of ways, including: | ||
| • asset carrying values may be affected due to changes in estimated future production levels | ||
| • depreciation, depletion and amortisation charged to the income statement may change where such charges are determined on the units of production basis, or where the useful economic lives of assets change | ||
| • overburden removal costs recorded on the balance sheet or charged to the income statement may change due to changes in stripping ratios or the units of production basis of depreciation | ||
| • closure and rehabilitation provisions may change where changes in estimated reserves affect expectations about the timing or cost of these activities | ||
| • the carrying amount of deferred tax assets may change due to changes in estimates of the likely recovery of the tax benefits | ||
1 |
Central Energy View reflects, and is periodically updated to respond to, existing policy trends and commitments. Lower Carbon View accelerates decarbonisation trends and policies, particularly in easier-to-abate sectors such as power generation and light duty vehicles. BHP’s Climate Change Report 2020 describes these scenarios in more detail. |
2 |
This scenario aligns with the aims of the Paris Agreement and requires steep global annual emissions reduction, sustained for decades, to stay within a 1.5°C carbon budget. 1.5°C is above pre-industrial levels. BHP’s Climate Change Report 2020 describes this scenario, including its assumptions, outputs and limitations, in more detail. |
| Reportable segment |
Principal activities | |
| Copper |
Mining of copper, silver, zinc, molybdenum, uranium and gold | |
| Iron Ore |
Mining of iron ore | |
| Coal |
Mining of metallurgical coal and energy coal | |
| Year ended 30 June 2022 US$M |
Copper |
Iron Ore |
Coal |
Group and unallocated items/ eliminations |
Group total |
|||||||||||||||
| Revenue |
||||||||||||||||||||
| Inter-segment revenue |
– | – | – | – | – | |||||||||||||||
| |
|
|
|
|
|
|
|
|
|
|||||||||||
| Total revenue |
||||||||||||||||||||
| |
|
|
|
|
|
|
|
|
|
|||||||||||
| Underlying EBITDA |
||||||||||||||||||||
| |
|
|
|
|
|
|
|
|
|
|||||||||||
| Depreciation and amortisation |
( |
) |
( |
) |
( |
) |
( |
) |
( |
) | ||||||||||
| Impairment losses 1 |
( |
) | ( |
) |
( |
) |
( |
) |
( |
) | ||||||||||
| |
|
|
|
|
|
|
|
|
|
|||||||||||
| Underlying EBIT |
( |
) | ||||||||||||||||||
| |
|
|
|
|
|
|
|
|
|
|||||||||||
| Exceptional items 2 |
( |
) |
( |
) |
( |
) |
( |
) | ||||||||||||
| Net finance costs |
( |
) | ||||||||||||||||||
| |
|
|
|
|
|
|
|
|
|
|||||||||||
| Profit before taxation |
||||||||||||||||||||
| |
|
|
|
|
|
|
|
|
|
|||||||||||
| Capital expenditure (cash basis) |
||||||||||||||||||||
| |
|
|
|
|
|
|
|
|
|
|||||||||||
| Profit/(loss) from equity accounted investments, related impairments and expenses |
( |
) |
– |
( |
) |
( |
) | |||||||||||||
| |
|
|
|
|
|
|
|
|
|
|||||||||||
| Investments accounted for using the equity method |
– |
– |
||||||||||||||||||
| |
|
|
|
|
|
|
|
|
|
|||||||||||
| Total assets 3 |
||||||||||||||||||||
| |
|
|
|
|
|
|
|
|
|
|||||||||||
| Total liabilities 3 |
||||||||||||||||||||
| |
|
|
|
|
|
|
|
|
|
|||||||||||
| Year ended 30 June 2021 US$M Restated |
Copper | Iron Ore | Coal | Group and unallocated items/ eliminations |
Group total |
|||||||||||||||
| Revenue |
||||||||||||||||||||
| Inter-segment revenue |
– | – | – | – | – | |||||||||||||||
| |
|
|
|
|
|
|
|
|
|
|||||||||||
| Total revenue |
||||||||||||||||||||
| |
|
|
|
|
|
|
|
|
|
|||||||||||
| Underlying EBITDA |
||||||||||||||||||||
| |
|
|
|
|
|
|
|
|
|
|||||||||||
| Depreciation and amortisation |
( |
) | ( |
) | ( |
) | ( |
) | ( |
) | ||||||||||
| Impairment losses 1 |
( |
) | ( |
) | ( |
) | ( |
) | ( |
) | ||||||||||
| |
|
|
|
|
|
|
|
|
|
|||||||||||
| Underlying EBIT |
( |
) | ( |
) | ||||||||||||||||
| |
|
|
|
|
|
|
|
|
|
|||||||||||
| Exceptional items 2 |
( |
) | ( |
) | ( |
) | ( |
) | ( |
) | ||||||||||
| Net finance costs |
( |
) | ||||||||||||||||||
| |
|
|||||||||||||||||||
| Profit before taxation |
||||||||||||||||||||
| |
|
|
|
|
|
|
|
|
|
|||||||||||
| Capital expenditure (cash basis) |
||||||||||||||||||||
| |
|
|
|
|
|
|
|
|
|
|||||||||||
| Profit/(loss) from equity accounted investments, related impairments and expenses |
( |
) | ( |
) | ( |
) | ( |
) | ||||||||||||
| |
|
|
|
|
|
|
|
|
|
|||||||||||
| Investments accounted for using the equity method |
– | – | ||||||||||||||||||
| |
|
|
|
|
|
|
|
|
|
|||||||||||
| Total assets 3 |
||||||||||||||||||||
| |
|
|
|
|
|
|
|
|
|
|||||||||||
| Total liabilities 3 |
||||||||||||||||||||
| |
|
|
|
|
|
|
|
|
|
|||||||||||
| Year ended 30 June 2020 US$M Restated |
Copper | Iron Ore | Coal | Group and unallocated items/ eliminations |
Group total |
|||||||||||||||
| Revenue |
||||||||||||||||||||
| Inter-segment revenue |
– | – | ( |
) | – | |||||||||||||||
| |
|
|
|
|
|
|
|
|
|
|||||||||||
| Total revenue |
||||||||||||||||||||
| |
|
|
|
|
|
|
|
|
|
|||||||||||
| Underlying EBITDA |
( |
) | ||||||||||||||||||
| |
|
|
|
|
|
|
|
|
|
|||||||||||
| Depreciation and amortisation |
( |
) | ( |
) | ( |
) | ( |
) | ( |
) | ||||||||||
| Impairment losses 1 |
( |
) | ( |
) | ( |
) | ( |
) | ( |
) | ||||||||||
| |
|
|
|
|
|
|
|
|
|
|||||||||||
| Underlying EBIT |
( |
) | ||||||||||||||||||
| |
|
|
|
|
|
|
|
|
|
|||||||||||
| Exceptional items 2 |
( |
) | ( |
) | ( |
) | ( |
) | ||||||||||||
| Net finance costs |
( |
) | ||||||||||||||||||
| |
|
|||||||||||||||||||
| Profit before taxation |
||||||||||||||||||||
| |
|
|
|
|
|
|
|
|
|
|||||||||||
| Capital expenditure (cash basis) |
||||||||||||||||||||
| |
|
|
|
|
|
|
|
|
|
|||||||||||
| Profit/(loss) from equity accounted investments, related impairments and expenses |
( |
) | ( |
) | ( |
) | ||||||||||||||
| |
|
|
|
|
|
|
|
|
|
|||||||||||
| Investments accounted for using the equity method |
– | |||||||||||||||||||
| |
|
|
|
|
|
|
|
|
|
|||||||||||
| Total assets 3 |
||||||||||||||||||||
| |
|
|
|
|
|
|
|
|
|
|||||||||||
| Total liabilities 3 |
||||||||||||||||||||
| |
|
|
|
|
|
|
|
|
|
|||||||||||
1 |
Impairment losses exclude exceptional items of US$ |
2 |
Exceptional items reported in Group and unallocated include Samarco dam failure costs of US$( |
3 |
Group and unallocated comparative periods total assets and total liabilities include Petroleum assets and liabilities that were previously disclosed as part of the Petroleum segment. |
Revenue by location of customer |
||||||||||||
2022 |
2021 |
2020 |
||||||||||
US$M |
US$M |
US$M |
||||||||||
Restated |
Restated |
|||||||||||
| Australia |
||||||||||||
| Europe |
||||||||||||
| China |
||||||||||||
| Japan |
||||||||||||
| India |
||||||||||||
| South Korea |
||||||||||||
| Rest of Asia |
||||||||||||
| North America |
||||||||||||
| South America |
||||||||||||
| Rest of world |
– |
|||||||||||
| |
|
|
|
|
|
|||||||
| |
|
|
|
|
|
|||||||
Non-current assets by location of assets |
||||||||||||
2022 |
2021 | 2020 | ||||||||||
US$M |
US$M | US$M | ||||||||||
| Australia |
||||||||||||
| North America |
||||||||||||
| South America |
||||||||||||
| Rest of world |
||||||||||||
| Unallocated assets 1 |
||||||||||||
| |
|
|
|
|
|
|||||||
| |
|
|
|
|
|
|||||||
1 |
Unallocated assets comprise deferred tax assets and other financial assets. |
2022 |
2021 |
2020 |
||||||||||
US$M |
US$M |
US$M |
||||||||||
Restated |
Restated |
|||||||||||
Escondida |
||||||||||||
Pampa Norte |
||||||||||||
Olympic Dam |
||||||||||||
Third - party products |
||||||||||||
Total Copper 1 |
||||||||||||
Western Australia Iron Ore |
||||||||||||
Third-party products |
||||||||||||
Other |
||||||||||||
Total Iron Ore |
||||||||||||
BHP Mitsubishi Alliance |
||||||||||||
New South Wales Energy Coal |
||||||||||||
Other 2 |
||||||||||||
Total Coal 3 |
||||||||||||
Group and unallocated items 4 |
||||||||||||
Inter-segment adjustment |
– |
– | ( |
) | ||||||||
Total revenue |
||||||||||||
1 |
Total Copper revenue includes: copper US$ |
2 |
Includes revenue related to BHP Mitsui Coal (BMC) divested in May 2022. |
3 |
Total Coal revenue includes: metallurgical coal US$ |
4 |
Group and unallocated items revenue includes: Nickel West US$ |
Year ended 30 June 2022 |
Gross |
Tax |
Net |
|||||||||
US$M |
US$M |
US$M |
||||||||||
Exceptional items by category |
||||||||||||
Samarco dam failure |
( |
) |
( |
) |
( |
) | ||||||
Impairment of US deferred tax assets |
– |
( |
) | ( |
) | |||||||
Corporate structure unification costs |
( |
) |
– |
( |
) | |||||||
BHP Mitsui Coal (BMC) gain on disposal |
– |
|||||||||||
Total |
( |
) |
( |
) |
( |
) | ||||||
Attributable to non-controlling interests |
– |
– |
– |
|||||||||
Attributable to BHP shareholders |
( |
) |
( |
) |
( |
) | ||||||
Year ended 30 June 2022 |
US$M |
|||
Other income |
– |
|||
Expenses excluding net finance costs: |
||||
Costs incurred directly by BHP Brasil and other BHP entities in relation to the Samarco dam failure |
( |
) | ||
Loss from equity accounted investments, related impairments and expenses: |
||||
Samarco impairment expense |
– |
|||
Samarco Germano dam decommissioning |
||||
Samarco dam failure provision |
( |
) | ||
Fair value change on forward exchange derivatives |
( |
) | ||
Net finance costs |
( |
) | ||
Income tax expense |
( |
) | ||
Total 1 |
( |
) | ||
1 |
Refer to note 4 ‘Significant events – Samarco dam failure’ for further information. |
US$M |
||||
Assets |
||||
Cash and cash equivalents |
||||
Trade and other receivables |
||||
Other financial assets |
||||
Inventories |
||||
Property, plant and equipment |
||||
Total assets |
||||
Liabilities |
||||
Trade and other payables |
||||
Interest bearing liabilities |
||||
Tax payable s |
||||
Provisions |
||||
Deferred tax liabilities |
||||
Total liabilities |
||||
Net assets disposed |
||||
Less non-controlling interest share of net assets disposed |
||||
BHP share of net assets disposed |
||||
Gross consideration |
||||
Transaction and other directly applicable costs |
( |
) | ||
Income tax expense |
– |
|||
Deferred consideration |
||||
Gain on disposal |
||||
Year ended 30 June 2021 Restated |
Gross | Tax | Net | |||||||||
| US$M | US$M | US$M | ||||||||||
Exceptional items by category |
||||||||||||
Samarco dam failure |
( |
) | ( |
) | ( |
) | ||||||
COVID-19 related costs |
( |
) | ( |
) | ||||||||
Impairment of Energy coal assets |
( |
) | ( |
) | ( |
) | ||||||
Impairment of Potash assets |
( |
) | ( |
) | ( |
) | ||||||
Total |
( |
) | ( |
) | ( |
) | ||||||
Attributable to non-controlling interests |
( |
) | ( |
) | ||||||||
Attributable to BHP shareholders |
( |
) | ( |
) | ( |
) | ||||||
Year ended 30 June 2021 |
US$M | |||
Other income |
||||
Expenses excluding net finance costs: |
||||
Costs incurred directly by BHP Brasil and other BHP entities in relation to the Samarco dam failure |
( |
) | ||
Loss from equity accounted investments, related impairments and expenses: |
||||
Samarco impairment expense |
( |
) | ||
Samarco Germano dam decommissioning |
( |
) | ||
Samarco dam failure provision |
( |
) | ||
Fair value change on forward exchange derivatives |
||||
Net finance costs |
( |
) | ||
Income tax expense |
( |
) | ||
Total 1 |
( |
) | ||
1 |
Refer to note 4 ‘Significant events – Samarco dam failure’ for further information. |
Year ended 30 June 2020 Restated |
Gross | Tax | Net | |||||||||
| US$M | US$M | US$M | ||||||||||
Exceptional items by category |
||||||||||||
Samarco dam failure |
( |
) | – | ( |
) | |||||||
Cancellation of power contracts |
( |
) | ( |
) | ||||||||
COVID-19 related costs |
( |
) | ( |
) | ||||||||
Cerro Colorado impairment |
( |
) | ( |
) | ( |
) | ||||||
Total |
( |
) | ( |
) | ||||||||
Attributable to non-controlling interests |
( |
) | ( |
) | ||||||||
Attributable to BHP shareholders |
( |
) | ( |
) | ||||||||
Year ended 30 June 2020 |
US$M | |||
Other income |
||||
Expenses excluding net finance costs: |
||||
Costs incurred directly by BHP Brasil and other BHP entities in relation to the Samarco dam failure |
( |
) | ||
Loss from equity accounted investments, related impairments and expenses: |
||||
Samarco impairment expense |
( |
) | ||
Samarco Germano dam decommissioning |
||||
Samarco dam failure provision |
( |
) | ||
Net finance costs |
( |
) | ||
Total 1 |
( |
) | ||
1 |
Refer to note 4 ‘Significant events – Samarco dam failure’ for further information. |
| Financial impacts of Samarco dam failure |
2022 |
2021 | 2020 | |||||||||
US$M |
US$M | US$M | ||||||||||
| Income statement |
||||||||||||
| Other income 1 |
– |
|||||||||||
| Expenses excluding net finance costs: |
||||||||||||
| Costs incurred directly by BHP Brasil and other BHP entities in relation to the Samarco dam failure 2 |
( |
) | ( |
) | ( |
) | ||||||
| Loss from equity accounted investments, related impairments and expenses: |
|
|||||||||||
| Samarco impairment expense 3 |
– |
( |
) | ( |
) | |||||||
| Samarco Germano dam decommissioning 4 |
( |
) | ||||||||||
| Samarco dam failure provision 5 |
( |
) |
( |
) | ( |
) | ||||||
| Fair value change on forward exchange derivatives 6 |
( |
) |
– | |||||||||
| |
|
|
|
|
|
|||||||
| Loss from operations |
( |
) |
( |
) | ( |
) | ||||||
| Net finance costs 7 |
( |
) |
( |
) | ( |
) | ||||||
| |
|
|
|
|
|
|||||||
| Loss before taxation |
( |
) |
( |
) | ( |
) | ||||||
| Income tax expense 8 |
( |
) |
( |
) | – | |||||||
| |
|
|
|
|
|
|||||||
| Loss after taxation |
( |
) |
( |
) | ( |
) | ||||||
| |
|
|
|
|
|
|||||||
| Balance sheet movement |
||||||||||||
| Trade and other payables |
( |
) |
( |
) | ( |
) | ||||||
| Derivatives |
( |
) |
– | |||||||||
| Tax liabilities |
( |
) |
( |
) | – | |||||||
| Provisions |
( |
) |
( |
) | ( |
) | ||||||
| |
|
|
|
|
|
|||||||
| Net liabilities |
( |
) |
( |
) | ( |
) | ||||||
| |
|
|
|
|
|
|||||||
2022 |
2021 | 2020 | ||||||||||||||||||||||
US$M |
US$M | US$M | ||||||||||||||||||||||
| Cash flow statement |
||||||||||||||||||||||||
| Loss before taxation |
( |
) |
( |
) | ( |
) | ||||||||||||||||||
| Adjustments for: |
||||||||||||||||||||||||
| Samarco impairment expense 3 |
– |
|||||||||||||||||||||||
| Samarco Germano dam decommissioning 4 |
( |
) |
( |
) | ||||||||||||||||||||
| Samarco dam failure provision 5 |
||||||||||||||||||||||||
| Fair value change on forward exchange derivatives 6 |
( |
) | – | |||||||||||||||||||||
| Proceeds of cash management related instruments |
– | – | ||||||||||||||||||||||
| Net finance costs 7 |
||||||||||||||||||||||||
| Changes in assets and liabilities: |
||||||||||||||||||||||||
| Trade and other payables |
||||||||||||||||||||||||
| |
|
|
|
|
|
|||||||||||||||||||
| Net operating cash flows |
( |
) | ||||||||||||||||||||||
| |
|
|
|
|
|
|||||||||||||||||||
| Net investment and funding of equity accounted investments 9 |
( |
) | ( |
) | ( |
) | ||||||||||||||||||
| |
|
|
|
|
|
|||||||||||||||||||
| Net investing cash flows |
( |
) | ( |
) | ( |
) | ||||||||||||||||||
| |
|
|
|
|
|
|||||||||||||||||||
| Net decrease in cash and cash equivalents |
( |
) | ( |
) | ( |
) | ||||||||||||||||||
| |
|
|
|
|
|
|||||||||||||||||||
1 |
Proceeds from insurance settlements. |
2 |
Includes legal and advisor costs incurred. |
3 |
Impairment expense from working capital funding provided during the period. |
4 |
US$( |
5 |
US$ |
6 |
During the period the Group entered into forward exchange contracts to limit the Brazilian reais exposure on the dam failure provisions. While not applying hedge accounting, the fair value changes in the forward exchange instruments are recorded within Loss from equity accounted investments, related impairments and expenses in the Income Statement. |
7 |
Amortisation of discounting of provision. |
8 |
Includes tax on forward exchange derivatives and other taxes incurred during the period. |
9 |
Includes US $ $ o ning provision. |
2022 |
2021 |
|||||||||||||||
US$M |
US$M |
|||||||||||||||
| At the beginning of the financial year |
||||||||||||||||
| Movement in provisions |
|
|||||||||||||||
| Comprising: |
||||||||||||||||
| Utilised |
( |
) |
( |
) | ||||||||||||
| Adjustments charged to the income statement: |
||||||||||||||||
| Change in estimate - Samarco dam failure provision |
||||||||||||||||
| Change in estimate - Samarco Germano dam decommissioning |
( |
) |
( |
) | ||||||||||||
| Amortisation of discounting impacting net finance costs |
||||||||||||||||
| Exchange translation |
( |
) |
||||||||||||||
| |
|
|
|
|||||||||||||
| At the end of the financial year |
||||||||||||||||
| |
|
|
|
|||||||||||||
| Comprising: |
||||||||||||||||
| Current |
||||||||||||||||
| Non-current |
||||||||||||||||
| |
|
|
|
|||||||||||||
| At the end of the financial year |
||||||||||||||||
| |
|
|
|
|||||||||||||
| Comprising: |
||||||||||||||||
| Samarco dam failure provision |
||||||||||||||||
| Samarco Germano dam decommissioning provision |
||||||||||||||||
| |
|
|
|
|||||||||||||
| Key judgements and estimates | ||
| Judgements | ||
| The outcomes of litigation are inherently difficult to predict and significant judgement has been applied in assessing the likely outcome of legal claims and determining which legal claims require recognition of a provision or disclosure of a contingent liability. The facts and circumstances relating to these cases are regularly evaluated in determining whether a provision for any specific claim is required. | ||
| Management has determined that a provision can only be recognised for obligations under the Framework Agreement and Samarco Germano dam decommissioning as at 30 June 2022. It is not yet possible to provide a range of possible outcomes or a reliable estimate of potential future exposures to BHP in connection to the contingent liabilities noted below, given their status. | ||
| Estimates | ||
| The provision for the Samarco dam failure currently only reflects the Group’s estimate of the remaining costs to complete Programs under the Framework Agreement and requires the use of significant judgements, estimates and assumptions. Based on current estimates, it is expected that approximately | ||
| While the provision has been measured based on the latest information available, changes in facts and circumstances are likely in future reporting periods and may lead to material revisions to these estimates. However, it is currently not possible to determine what facts and circumstances may change, therefore revisions in future reporting periods due to the key estimates and factors outlined below cannot be reliably measured. | ||
| The key estimates that may have a material impact on the provision in the next and future reporting periods include the: | ||
| • |
number of people eligible for financial assistance and compensation and the corresponding amount of expected compensation | |
| • |
costs to complete key infrastructure programs | |
| The provision may also be affected by factors including but not limited to: | ||
| • |
potential changes in scope of work and funding amounts required under the Framework Agreement including the impact of the decisions of the Interfederative Committee along with further technical analysis, community participation required under the Governance Agreement and rulings made by the 12 th Federal Court | |
| • |
the outcome of ongoing negotiations with State and Federal Prosecutors, including review of Fundação Renova’s Programs as provided in the Governance Agreement | |
| • |
actual costs incurred | |
| • |
resolution of uncertainty in respect of the nature and extent of Samarco’s long-term cash generation | |
| • |
updates to discount and foreign exchange rates | |
| • |
the outcomes of Samarco’s judicial reorganisation | |
| In addition, the provision may be impacted by decisions in, or resolution of, existing and potential legal claims in Brazil and other jurisdictions, including the outcome of the United Kingdom group action complaint and the negotiations seeking a definitive and substantive settlement of the obligations under the Framework Agreement and the R$ | ||
| Outcomes of the negotiations are highly uncertain and it is therefore not possible to provide a reliable estimate of potential outcomes. | ||
| Given these factors, future actual cash outflows may differ from the amounts currently provided and changes to any of the key assumptions and estimates outlined above could result in a material impact to the provision in the next and future reporting periods. | ||
The following section includes disclosure required by IFRS of Samarco’s provisions, contingencies and other matters arising from the dam failure for matters in addition to the above-mentioned claims to which Samarco is a party. |
Samarco |
Dam failure related provisions and contingencies |
In addition to its obligations under the Framework Agreement as at 30 June 2022, Samarco has recognised provisions of US$ |
Samarco is also named as a defendant in a number of other legal proceedings initiated by individuals, non-governmental organisations, corporations and governmental entities in Brazilian Federal and State courts following the Samarco dam failure. The lawsuits include claims for compensation, environmental rehabilitation and violations of Brazilian environmental and other laws, among other matters. The lawsuits seek various remedies including rehabilitation costs, compensation to injured individuals and families of the deceased, recovery of personal and property losses, moral damages and injunctive relief. In addition, government inquiries and investigations relating to the Samarco dam failure have been commenced by numerous agencies of the Brazilian government and are ongoing. Given the status of proceedings it is not possible to provide a range of possible outcomes or a reliable estimate of total potential future exposures to Samarco. |
Additional lawsuits and government investigations relating to the Samarco dam failure could be brought against Samarco. |
Samarco insurance |
Samarco has standalone insurance policies in place with Brazilian and global insurers. Insurers’ loss adjusters or claims representatives continue to investigate and assist with the claims process for matters not yet settled. As at 30 June 2022, an insurance receivable has not been recognised by Samarco in respect of ongoing matters. |
Samarco commitments |
At 30 June 2022, Samarco has commitments of US$ |
Samarco non-dam failure related contingent liabilities |
The following non-dam failure related contingent liabilities pre-date and are unrelated to the Samarco dam failure. Samarco is currently contesting both of these matters in the Brazilian courts. Given the status of these tax matters, the timing of resolution and potential economic outflow for Samarco is uncertain. |
Brazilian Social Contribution Levy |
Samarco has received tax assessments for the alleged non-payment of Brazilian Social Contribution Levy for the calendar years 2007-2014 totalling approximately R$ |
Brazilian corporate income tax rate |
Samarco has received tax assessments for alleged incorrect calculation of Corporate Income Tax (IRPJ) in respect of the 2000-2003 and 2007-2014 income years totalling approximately R$ |
2022 |
2021 |
2020 |
||||||||||
US$M |
US$M Restated |
US$M Restated |
||||||||||
Employee benefits expense: |
||||||||||||
Wages, salaries and redundancies |
||||||||||||
Employee share awards |
||||||||||||
Social security costs |
||||||||||||
Pension and other post-retirement obligations |
||||||||||||
Less employee benefits expense classified as exploration and evaluation expenditure |
( |
) |
( |
) | ( |
) | ||||||
Changes in inventories of finished goods and work in progress |
( |
) |
( |
) | ( |
) | ||||||
Raw materials and consumables used |
||||||||||||
Freight and transportation |
||||||||||||
External services |
||||||||||||
Third-party commodity purchases |
||||||||||||
Net foreign exchange (gains)/losses |
( |
) |
( |
) | ||||||||
Fair value change on derivatives 1 |
( |
) |
||||||||||
Government royalties paid and payable |
||||||||||||
Exploration and evaluation expenditure incurred and expensed in the current period |
||||||||||||
Depreciation and amortisation expense |
||||||||||||
Net impairments: |
||||||||||||
Property, plant and equipment |
||||||||||||
Goodwill and other intangible assets |
– |
– | ||||||||||
All other operating expenses |
||||||||||||
Total expenses |
||||||||||||
Insurance recoveries 2 |
( |
) | ( |
) | ( |
) | ||||||
(Gain)/loss on disposal of subsidiaries and operations 3 |
( |
) | – | |||||||||
Dividend income 4 |
( |
) |
( |
) | ( |
) | ||||||
Other income 5 |
( |
) |
( |
) |
( |
) | ||||||
Total other income |
( |
) |
( |
) | ( |
) | ||||||
1 |
Fair value change on derivatives is principally related to commodity price contracts, foreign exchange contracts and embedded derivatives used in the ordinary course of business as well as derivatives used as part of the funding of dividends. |
2 |
Insurance recoveries is principally related to claims received from Samarco dam failure. Refer to note 4 ‘Significant events – Samarco dam failure’ for further information. |
3 |
Mainly relates to the divestment of BMC in FY2022. Refer to note 3 ‘Exceptional items’ for further information. |
4 |
During FY2022, the Group received dividends of US$ |
5 |
Other income is generally income earned from transactions outside the course of the Group’s ordinary activities and may include certain management fees from non-controlling interests and joint arrangements, royalties and commission income. |
2022 |
2021 |
2020 |
||||||||||
US$M |
US$M |
US$M |
||||||||||
Restated |
Restated |
|||||||||||
| Total taxation expense comprises: |
||||||||||||
| Current tax expense |
||||||||||||
| Deferred tax expense/(benefit) |
( |
) | ||||||||||
| |
|
|
|
|
|
|||||||
| |
|
|
|
|
|
|||||||
2022 |
2021 |
2020 |
||||||||||
US$M |
US$M |
US$M |
||||||||||
Restated |
Restated |
|||||||||||
| Factors affecting income tax expense for the year |
||||||||||||
| Income tax expense differs to the standard rate of corporation tax as follows: |
||||||||||||
| Profit before taxation |
||||||||||||
| |
|
|
|
|
|
|||||||
| Tax on profit at Australian prima facie tax rate of |
||||||||||||
| |
|
|
|
|
|
|||||||
| Non-tax effected operating losses and capital gains 1 |
||||||||||||
| Tax on remitted and unremitted foreign earnings |
||||||||||||
| Investment and development allowance |
– |
– | ( |
) | ||||||||
| Tax rate changes |
– |
( |
) |
( |
) | |||||||
| Recognition of previously unrecognised tax assets |
( |
) |
( |
) | ( |
) | ||||||
| Tax effect of loss from equity accounted investments, related impairments and expenses 2 |
( |
) |
||||||||||
| Amounts (over)/under provided in prior years |
( |
) |
( |
) | ||||||||
| Foreign exchange adjustments |
( |
) |
( |
) | ||||||||
| Impact of tax rates applicable outside of Australia |
( |
) |
( |
) | ( |
) | ||||||
| Other |
( |
) | ||||||||||
| |
|
|
|
|
|
|||||||
| Income tax expense |
||||||||||||
| |
|
|
|
|
|
|||||||
| Royalty-related taxation (net of income tax benefit) |
( |
) | ||||||||||
| |
|
|
|
|
|
|||||||
| Total taxation expense |
||||||||||||
| |
|
|
|
|
|
|||||||
1 |
Includes the tax impacts related to the exceptional impairments of US deferred tax assets in the year ended 30 June 2022 NSWEC and Potash in the year ended 30 June 2021 and Cerro Colorado in the year ended 30 June 2020, as presented in note 3 ‘Exceptional items’. , |
2 |
The loss from equity accounted investments, related impairments and expenses is net of income tax, with the exception of the Samarco forward exchange derivatives described in note 4 ‘Significant events – Samarco dam failure’. This item removes the prima facie tax effect on such loss, related impairments and expenses, excluding the impact of the Samarco forward exchange derivatives which are taxable. |
2022 |
2021 |
2020 |
||||||||||
US$M |
US$M |
US$M |
||||||||||
| Income tax effect of: |
||||||||||||
| Items that may be reclassified subsequently to the income statement : |
||||||||||||
| Hedges: |
||||||||||||
| Gains/(losses) taken to equity |
( |
) | ||||||||||
| (Gains)/losses transferred to the income statement |
( |
) |
( |
) | ||||||||
| Others |
– |
( |
) | – | ||||||||
| |
|
|
|
|
|
|||||||
| Income tax credit/(charge) relating to items that may be reclassified subsequently to the income statement |
( |
) | ||||||||||
| |
|
|
|
|
|
|||||||
| Items that will not be reclassified to the income statement: |
||||||||||||
| Remeasurement gains/(losses) on pension and medical schemes |
( |
) |
( |
) | ||||||||
| Others |
– |
|||||||||||
| |
|
|
|
|
|
|||||||
| Income tax (charge)/credit relating to items that will not be reclassified to the income statement |
( |
) |
( |
) | ||||||||
| |
|
|
|
|
|
|||||||
| Total income tax credit/(charge) relating to components of other comprehensive income 1 |
( |
) | ||||||||||
| |
|
|
|
|
|
|||||||
1 |
Included within total income tax relating to components of other comprehensive income is US$ |
| Current tax |
Deferred tax |
Royalty-related taxation | ||
Current tax is the expected tax on the taxable income for the year, using tax rates and laws enacted or substantively enacted at the reporting date, and any adjustments to tax payable in respect of previous years. |
Deferred tax is the tax expected to be payable or recoverable on differences between the carrying amounts of assets and liabilities in the financial statements and the corresponding tax bases used in the computation of taxable profit, and is accounted for in accordance with IAS 12. Deferred tax is generally provided on temporary differences arising between the tax bases of assets and liabilities and their carrying amounts in the Financial Statements. Deferred tax assets are recognised to the extent that it is probable that future taxable profits will be available against which the temporary differences can be utilised. Deferred tax is not recognised for temporary differences relating to: • initial recognition of goodwill • initial recognition of assets or liabilities in a transaction that is not a business combination and that affects neither accounting nor taxable profit • investment in subsidiaries, associates and jointly controlled entities where the Group is able to control the timing of the reversal of the temporary difference and it is probable that they will not reverse in the foreseeable future Deferred tax is measured at the tax rates that are expected to be applied when the asset is realised or the liability is settled, based on the laws that have been enacted or substantively enacted at the reporting date. Current and deferred tax assets and liabilities are offset when the Group has a legally enforceable right to offset and when the tax balances are related to taxes levied by the same tax authority and the Group intends to settle on a net basis, or realise the asset and settle the liability simultaneously. The carrying amount of deferred tax assets is reviewed at each reporting date and reduced to the extent that it is no longer probable that sufficient taxable profits will be available to allow all or part of the asset to be recovered. |
Royalties are treated as taxation arrangements (impacting income tax expense/(benefit)) when they are imposed under government authority and the amount payable is calculated by reference to revenue derived (net of any allowable deductions) after adjustment for temporary differences. Obligations arising from royalty arrangements that do not satisfy these criteria are recognised as current liabilities and included in expenses. |
| Key judgements and estimates |
| Income tax classification |
| Judgements |
| Deferred tax |
| Judgements: |
| Estimates: |
2022 |
2021 | 2020 | ||||||||||
| Restated | Restated | |||||||||||
| Earnings attributable to BHP shareholders (US$M) |
||||||||||||
| - Continuing operations |
||||||||||||
| - Total |
||||||||||||
| Weighted average number of shares (Million) |
||||||||||||
| - Basic |
||||||||||||
| - Diluted |
||||||||||||
| Basic earnings per ordinary share (US cents) |
||||||||||||
| - Continuing operations |
||||||||||||
| - Total |
||||||||||||
| Diluted earnings per ordinary share (US cents) |
||||||||||||
| - Continuing operations |
||||||||||||
| - Total |
||||||||||||
| Headline earnings per ordinary share (US cents) |
||||||||||||
| - Basic |
||||||||||||
| - Diluted |
||||||||||||
2022 |
2021 | 2020 | ||||||||||
US$M |
US$M | US$M | ||||||||||
| Earnings attributable to BHP shareholders |
||||||||||||
| Adjusted for: |
||||||||||||
| (Gain)/loss on sales of PP&E, Investments and Operations 1 |
( |
) |
( |
) | ||||||||
| Impairments of property, plant and equipment, financial assets and intangibles |
||||||||||||
| Samarco impairment expense |
– |
|||||||||||
| Cerrejón impairment expense |
– |
– | ||||||||||
| Gain on disposal of BHP Mitsui Coal |
( |
) |
||||||||||
| Gain on merger of Petroleum |
( |
) |
– | – | ||||||||
| Other 2 |
– |
– | ||||||||||
| Tax effect of above adjustments |
( |
) |
( |
) | ||||||||
| |
|
|
|
|
|
|||||||
| Subtotal of adjustments |
( |
) |
||||||||||
| |
|
|
|
|
|
|||||||
| Headline earnings |
||||||||||||
| |
|
|
|
|
|
|||||||
| Diluted headline earnings |
||||||||||||
| |
|
|
|
|
|
|||||||
1 |
Included in other income. |
2 |
Mainly represent BHP share of impairment embedded in the statutory income statement of the Group’s equity accounted investments. |
2022 |
2021 |
|||||||
US$M |
US$M |
|||||||
Trade receivables |
||||||||
Other receivables 1 |
||||||||
Total |
||||||||
Comprising: |
||||||||
Current |
||||||||
Non-current |
||||||||
1 |
Other receivables mainly relate to indirect tax refunds and receivables from joint venture partners. |
2022 |
2021 |
|||||||
US$M |
US$M |
|||||||
Trade payables |
||||||||
Other payables |
||||||||
Total |
||||||||
Comprising: |
||||||||
Current |
||||||||
Non-current |
||||||||
2022 |
2021 |
Definitions | ||||||||
US$M |
US$M |
|||||||||
Raw materials and consumables |
Spares, consumables and other supplies yet to be utilised in the production process or in the rendering of services. | |||||||||
Work in progress |
Commodities currently in the production process that require further processing by the Group to a saleable form. | |||||||||
Finished goods |
Commodities ready-for-sale and not requiring further processing by the Group. | |||||||||
Total 1 |
||||||||||
Comprising: |
Inve n tories classified as non-current are not expected to b e utilised | |||||||||
Current |
or sold within 12 months after the reporting date or within the | |||||||||
Non-current |
operating cyc le o f the business. | |||||||||
1 |
Inventory write-downs of US$ e reversed during the year (2021: US$ |
Land and buildings |
Plant and equipment |
Other mineral assets |
Assets under construction |
Exploration and evaluation |
Total |
|||||||||||||||||||
US$M |
US$M |
US$M |
US$M |
US$M |
US$M |
|||||||||||||||||||
| Net book value – 30 June 2022 |
||||||||||||||||||||||||
| At the beginning of the financial year |
||||||||||||||||||||||||
| Additions 1 |
||||||||||||||||||||||||
| Remeasurements of index-linked freight contracts 2 |
– |
( |
) |
– |
– |
– |
( |
) | ||||||||||||||||
| Depreciation for the year |
( |
) |
( |
) |
( |
) |
– |
– |
( |
) | ||||||||||||||
| Impairments for the year 3 |
( |
) |
( |
) |
( |
) |
– |
– |
( |
) | ||||||||||||||
| Disposals |
( |
) |
( |
) |
– |
– |
– |
( |
) | |||||||||||||||
| Divestment and demerger of subsidiaries and operations 4 |
( |
) |
( |
) |
( |
) |
( |
) |
( |
) |
( |
) | ||||||||||||
| Transfers and other movements |
( |
) |
( |
) |
( |
) |
( |
) | ||||||||||||||||
| |
|
|
|
|
|
|
|
|
|
|
|
|||||||||||||
| At the end of the financial year 5 |
||||||||||||||||||||||||
| |
|
|
|
|
|
|
|
|
|
|
|
|||||||||||||
| – Cost |
||||||||||||||||||||||||
| – Accumulated depreciation and impairments |
( |
) |
( |
) |
( |
) |
( |
) |
( |
) |
( |
) | ||||||||||||
| |
|
|
|
|
|
|
|
|
|
|
|
|||||||||||||
| Net book value – 30 June 2021 |
||||||||||||||||||||||||
| At the beginning of the financial year |
||||||||||||||||||||||||
| Additions 1 |
||||||||||||||||||||||||
| Acquisition of subsidiaries & operations 6 |
– | – | – | |||||||||||||||||||||
| Remeasurements of index-linked freight contracts 2 |
– | ( |
) | – | – | – | ( |
) | ||||||||||||||||
| Depreciation for the year |
( |
) | ( |
) | ( |
) | – | – | ( |
) | ||||||||||||||
| Impairments for the year 3 |
( |
) | ( |
) | ( |
) | ( |
) | ( |
) | ( |
) | ||||||||||||
| Disposals |
( |
) | ( |
) | – | – | – | ( |
) | |||||||||||||||
| Divestment and demerger of subsidiaries and operations |
– | ( |
) |
– | ( |
) |
– | ( |
) | |||||||||||||||
| Transfers and other movements |
( |
) | ( |
) | ( |
) | ( |
) | ||||||||||||||||
| |
|
|
|
|
|
|
|
|
|
|
|
|||||||||||||
| At the end of the financial year 5 |
||||||||||||||||||||||||
| |
|
|
|
|
|
|
|
|
|
|
|
|||||||||||||
| – Cost |
||||||||||||||||||||||||
| – Accumulated depreciation and impairments |
( |
) | ( |
) | ( |
) | ( |
) | ( |
) | ( |
) | ||||||||||||
| |
|
|
|
|
|
|
|
|
|
|
|
|||||||||||||
1 |
Includes change in estimates and net foreign exchange gains/(losses) related to the closure and rehabilitation provisions for operating sites. Refer to note 15 ‘Closure and rehabilitation provisions’. |
2 |
Relates to remeasurements of index-linked freight contracts including continuous voyage charters (CVCs). Refer to note 21 ‘Leases’. |
3 |
Refer to note 13 ‘Impairment of non-current assets’ for information on impairments. |
4 |
BMC and Petroleum were disposed in May 2022 and June 2022 respectively. Refer to notes 3 ‘Exceptional items’ and 27 ‘Discontinued operations’ for more information. |
5 |
Includes the carrying value of the Group’s right-of-use assets relating to land and buildings and plant and equipment of US$ |
6 |
Relates to the acquisition of an additional |
| • | the exploration and evaluation activity is within an area of interest that was previously acquired as an asset acquisition or in a business combination and measured at fair value on acquisition or |
| • | the existence of a commercially viable mineral deposit has been established |
| • | capitalised exploration, evaluation and development expenditure for assets in production |
| • | mineral rights acquired |
| • | capitalised development and production stripping costs |
Production stripping activity | ||||
Benefits of stripping activity |
Extraction of ore (inventory) in current period. | Improved access to future ore extraction. | ||
Period benefited |
Current period | Future period(s) | ||
Recognition and measurement criteria |
When the benefits of stripping activities are realised in the form of inventory produced; the associated costs are recorded in accordance with the Group’s inventory accounting policy. | When the benefits of stripping activities are improved access to future ore; production costs are capitalised when all the following criteria are met: • the production stripping activity improves access to a specific component of the ore body and it is probable that economic benefits arising from the improved access to future ore production will be realised • the component of the ore body for which access has been improved can be identified • costs associated with that component can be measured reliably | ||
Allocation of costs |
Production stripping costs are allocated between the inventory produced and the production stripping asset using a life-of-component waste-to-ore (or mineral contained) strip ratio. When the current strip ratio is greater than the estimated life-of-component ratio a portion of the stripping costs is capitalised to the production stripping asset. | |||
Asset recognised from stripping activity |
Inventory | Other mineral assets within property, plant and equipment. | ||
Depreciation basis |
Not applicable | On a component-by-component basis using the units of production method based on proven and probable reserves. | ||
Key judgements and estimates |
Judgements: |
Estimates: |
Key estimates | ||||||||
The determination of useful lives, residual values and depreciation methods involves estimates and assumptions and is reviewed annually. Any changes to useful lives or any other estimates or assumptions, including the expected impact of climate change and the transition to a lower carbon economy, may affect prospective depreciation rates and asset carrying values. | ||||||||
Category |
Buildings |
Plant and equipment |
Mineral rights and petroleum interests |
Capitalised exploration, evaluation and development expenditure |
||||||||
Typical depreciation methodology |
||||||||||||
Depreciation rate |
||||||||||||
2022 |
2021 |
|||||||||||||||||||||||
Goodwill |
Other intangibles |
Total |
Goodwill |
Other intangibles |
Total |
|||||||||||||||||||
US$M |
US$M |
US$M |
US$M |
US$M |
US$M |
|||||||||||||||||||
Net book value |
||||||||||||||||||||||||
At the beginning of the financial year |
||||||||||||||||||||||||
Additions |
– |
– | ||||||||||||||||||||||
Amortisation for the year |
– |
( |
) |
( |
) |
– | ( |
) | ( |
) | ||||||||||||||
Impairments for the year 1 |
– |
– |
– |
– | ( |
) | ( |
) | ||||||||||||||||
Disposals |
– |
( |
) |
( |
) |
– | – | – | ||||||||||||||||
Divestment and demerger of subsidiaries and operations 2 |
– |
( |
) |
( |
) |
– | – | – | ||||||||||||||||
Transfers and other movements |
– |
– | ( |
) | ( |
) | ||||||||||||||||||
At the end of the financial year |
||||||||||||||||||||||||
– Cost |
||||||||||||||||||||||||
– Accumulated amortisation and impairments |
– |
( |
) |
( |
) |
– | ( |
) | ( |
) | ||||||||||||||
1 |
Refer to note 13 ‘Impairment of non-current assets’ for information on impairments. |
2 |
Relates to the merger of Petroleum with Woodside. Refer to note 27 ‘Discontinued operations’ for more information. |
2022 |
||||||||||||||||||
Cash generating unit |
Segment |
Property, plant and equipment |
Goodwill and other intangibles |
Equity- accounted investment |
Total |
|||||||||||||
US$M |
US$M |
US$M |
US$M |
|||||||||||||||
Cerro Colorado |
Copper | – |
– |
|||||||||||||||
Other |
Various | – |
– |
|||||||||||||||
Total impairment of non-current assets |
– |
– |
||||||||||||||||
Reversal of impairment |
– |
– |
– |
– |
||||||||||||||
Net impairment of non-current assets – Continuing operations |
– |
– |
||||||||||||||||
Net impairment of non-current assets – Discontinued operations |
– |
– |
– |
– |
||||||||||||||
Net impairment of non-current assets |
– |
– |
||||||||||||||||
| 2021 Restated |
||||||||||||||||||
Cash generating unit |
Segment |
Property, plant and equipment |
Goodwill and other intangibles |
Equity- accounted investment |
Total | |||||||||||||
| US$M | US$M | US$M | US$M | |||||||||||||||
New South Wales Energy Coal |
Coal | – | ||||||||||||||||
Cerrejón |
Coal | – | – | |||||||||||||||
Potash |
G&U | – | – | |||||||||||||||
Other |
Various | – | ||||||||||||||||
Total impairment of non-current assets |
||||||||||||||||||
Reversal of impairment |
– | – | – | – | ||||||||||||||
Net impairment of non-current assets – Continuing operations |
||||||||||||||||||
Net impairment of non-current assets – Discontinued operations |
– | |||||||||||||||||
Net impairment of non-current assets |
||||||||||||||||||
Cash generating unit |
2022 |
2021 |
||||||
US$M |
US$M |
|||||||
Olympic Dam |
||||||||
Other |
||||||||
Total goodwill |
||||||||
Olympic Dam goodwill | ||
Impairment test conclusion |
The Group performed an impairment test of the Olympic Dam CGU, including goodwill, as at 31 December 2021 and an impairment charge was not required. A goodwill impairment test was not required at 30 June 2022 as there were no indicators of impairment. | |
How did the goodwill arise? |
Goodwill arose on the acquisition of WMC Resources Ltd in June 2005. | |
Segment |
Olympic Dam is part of the Copper reportable segment. | |
How were the valuations calculated? |
FVLCD methodology using DCF techniques has been applied in determining the recoverable amount of Olympic Dam. | |
Significant assumptions and sensitivities |
The current valuation of Olympic Dam exceeds its carrying amount by approximately US$ Management consider that there are no reasonably possible changes in copper and gold price forecasts, operating cost estimates or the discount rate that would, in isolation, result in the estimated recoverable amount being equal to the carrying amount. A production volume decrease of Key judgements and estimates that have been applied in the FVLCD valuation are disclosed further below. | |
• |
demand for the Group’s commodities decreasing, due to policy, regulatory (including carbon pricing mechanisms), legal, technological, market or societal responses to climate change, resulting in a proportion of a CGU’s reserves becoming incapable of extraction in an economically viable fashion |
• |
physical impacts related to acute risks resulting from increased frequency or severity of extreme weather events, and those related to chronic risks resulting from longer-term changes in climate patterns |
• |
the Group’s current assumptions relating to demand for commodities and carbon pricing, including their impact on the Group’s long-term price forecasts |
• |
the Group’s operational emissions reduction strategy |
2022 |
2021 |
2020 |
||||||||||
US$M |
US$M |
US$M |
||||||||||
| Net deferred tax (liability)/asset |
||||||||||||
| At the beginning of the financial year |
( |
) |
( |
) | ( |
) | ||||||
| Income tax (charge)/credit recorded in the income statement 1 |
( |
) |
( |
) |
||||||||
| Income tax (charge)/credit recorded directly in equity |
( |
) |
||||||||||
| Divestment and demerger of subsidiaries and operations 2 |
( |
) |
– | – | ||||||||
| Other movements |
( |
) | ||||||||||
| |
|
|
|
|
|
|||||||
| At the end of the financial year |
( |
) |
( |
) | ( |
) | ||||||
| |
|
|
|
|
|
|||||||
1 |
Includes Discontinued operations income tax (charge)/credit to the income statement of US$( |
2 |
Relates to the divestment of BMC and merger of Petroleum with Woodside. Refer to notes 3 ‘Exceptional items’ and 27 ‘Discontinued operations’ for more information. |
Deferred tax assets |
Deferred tax liabilities |
Charged/(credited) to the income statement |
||||||||||||||||||||||||||
2022 |
2021 |
2022 |
2021 |
2022 |
2021 |
2020 |
||||||||||||||||||||||
| US$M |
US$M |
US$M |
US$M |
US$M |
US$M |
US$M |
||||||||||||||||||||||
| Type of temporary difference |
||||||||||||||||||||||||||||
| Depreciation 1 |
( |
) |
( |
) | ||||||||||||||||||||||||
| Exploration expenditure |
– |
– | ||||||||||||||||||||||||||
| Employee benefits |
( |
) |
( |
) | ( |
) | ( |
) | ||||||||||||||||||||
| Closure and rehabilitation |
( |
) |
( |
) | ( |
) | ( |
) | ||||||||||||||||||||
| Resource rent tax |
– |
– |
( |
) |
( |
) | ( |
) | ||||||||||||||||||||
| Other provisions |
( |
) |
( |
) | ( |
) | ||||||||||||||||||||||
| Deferred income |
( |
) |
( |
) | ( |
) |
( |
) | ||||||||||||||||||||
| Deferred charges |
( |
) |
( |
) | ( |
) | ||||||||||||||||||||||
| Investments, including foreign tax credits |
( |
) |
( |
) | ||||||||||||||||||||||||
| Foreign exchange gains and losses |
( |
) |
( |
) | ( |
) | ||||||||||||||||||||||
| Tax losses |
( |
) |
( |
) | ( |
) | ||||||||||||||||||||||
| Lease liability 1 |
( |
) |
( |
) | ( |
) |
( |
) | ||||||||||||||||||||
| Other |
( |
) |
( |
) |
||||||||||||||||||||||||
| |
|
|
|
|
|
|
|
|
|
|
|
|
|
|||||||||||||||
| Total |
( |
) | ||||||||||||||||||||||||||
| |
|
|
|
|
|
|
|
|
|
|
|
|
|
|||||||||||||||
1 |
Includes deferred tax associated with the recognition of right-of-use |
2022 |
2021 | |||||||
US$M |
US$M | |||||||
| Unrecognised deferred tax assets |
||||||||
| Tax losses and tax credits 1 |
||||||||
| Investments in subsidiaries 2 |
||||||||
| Deductible temporary differences relating to PRRT 3 |
– |
|||||||
| Mineral rights 4 |
||||||||
| Other deductible temporary differences 5 |
||||||||
| |
|
|
|
|||||
| Total unrecognised deferred tax assets |
||||||||
| |
|
|
|
|||||
| Unrecognised deferred tax liabilities |
||||||||
| Investments in subsidiaries 2 |
||||||||
| Future taxable temporary differences relating to unrecognised deferred tax asset for PRRT 3 |
– |
|||||||
| |
|
|
|
|||||
| Total unrecognised deferred tax liabilities |
||||||||
| |
|
|
|
|||||
1 |
At 30 June 2022, the Group had income and capital tax losses with a tax benefit of US$ |
| Year of expiry |
2022 |
2021 | ||||||
US$M |
US$M | |||||||
| Income tax losses |
||||||||
| Not later than one year |
– |
|||||||
| Later than one year and not later than two years |
– |
|||||||
| Later than two years and not later than five years |
||||||||
| Later than five years and not later than 10 years |
||||||||
| Later than 10 years and not later than 20 years |
||||||||
| Unlimited |
||||||||
| |
|
|
|
|||||
| |
|
|
|
|||||
| Capital tax losses |
||||||||
| Not later than one year |
||||||||
| Later than two years and not later than five years |
||||||||
| Unlimited |
||||||||
| |
|
|
|
|||||
| Gross amount of tax losses not recognised |
||||||||
| |
|
|
|
|||||
| Tax effect of total losses not recognised |
||||||||
| |
|
|
|
|||||
2 |
The Group had deferred tax assets and deferred tax liabilities associated with undistributed earnings of subsidiaries that have not been recognised because the Group is able to control the timing of the reversal of the temporary differences and it is not probable that these differences will reverse in the foreseeable future. Where the Group has undistributed earnings held by associates and joint interests, the deferred tax liability will be recognised as there is no ability to control the timing of the potential distributions. |
3 |
The Group had unrecognised deferred tax assets relating to Australian Petroleum Resource Rent Tax (PRRT ) in FY2021. The assets giving rise to these deferred tax assets were disposed as part of the merger of Petroleum with Woodside. Refer to note 27 ‘Discontinued operations’ for more information. |
4 |
The Group had deductible temporary differences relating to mineral rights for which deferred tax assets had not been recognised because it is not probable that future capital gains will be available against which the Group can utilise the benefits. The deductible temporary differences do not expire under current tax legislation. |
5 |
The Group had other deductible temporary differences for which deferred tax assets had not been recognised because it is not probable that future taxable profits will be available against which the Group can utilise the benefits. The deductible temporary differences do not expire under current tax legislation. |
2022 |
2021 |
|||||||
US$M |
US$M |
|||||||
| At the beginning of the financial year |
||||||||
| Capitalised amounts for operating sites: |
||||||||
| Change in estimate |
||||||||
| Exchange translation |
( |
) |
||||||
| Adjustments charged/(credited) to the income statement: |
||||||||
| Increases to existing and new provisions |
||||||||
| Exchange translation |
( |
) |
||||||
| Released during the year |
( |
) |
( |
) | ||||
| Other adjustments to the provision: |
||||||||
| Amortisation of discounting impacting net finance costs |
||||||||
| Acquisition of subsidiaries and operations |
– |
|||||||
| Divestment and demerger of subsidiaries and operations |
( |
) |
( |
) | ||||
| Expenditure on closure and rehabilitations activities |
( |
) |
( |
) | ||||
| Exchange variations impacting foreign currency translation reserve |
( |
) |
||||||
| Other movements |
– | |||||||
| |
|
|
|
|||||
| At the end of the financial year |
||||||||
| |
|
|
|
|||||
| Comprising: |
||||||||
| Current |
||||||||
| Non-current |
||||||||
| |
|
|
|
|||||
| Operating sites |
||||||||
| Closed sites |
||||||||
| |
|
|
|
|||||
• |
the removal of all unwanted infrastructure associated with an operation |
• |
the return of disturbed areas to a safe, stable and self-sustaining condition, consistent with the agreed post-closure land use |
• |
it has a present legal or constructive obligation as a result of past events |
• |
it is more likely than not that an outflow of resources will be required to settle the obligation |
• |
the amount can be reliably estimated |
Initial recognition and measurement |
Subsequent measurement | |
Closure and rehabilitation provisions are initially recognised when an environmental disturbance first occurs. The individual site provisions are an estimate of the expected value of future cash flows required to close the relevant site using current standards and techniques and taking into account risks and uncertainties. Individual site provisions are discounted to their present value using currency specific discount rates aligned to the estimated timing of cash outflows. When provisions for closure and rehabilitation are initially recognised, the corresponding cost is capitalised as an asset, representing part of the cost of acquiring the future economic benefits of the operation. |
The closure and rehabilitation asset, recognised within property, plant and equipment, is depreciated over the life of the operations. The value of the provision is progressively increased over time as the effect of discounting unwinds, resulting in an expense recognised in net finance costs. The closure and rehabilitation provision is reviewed at each reporting date to assess if the estimate continues to reflect the best estimate of the obligation. If necessary, the provision is remeasured to account for factors such as: • additional disturbance during the period • revisions to estimated reserves, resources and lives of operations including any changes to expected operating lives arising from the Group’s latest assessment of the potential impacts of climate change and the transition to a low carbon economy • developments in technology • changes to regulatory requirements and environmental management strategies • changes in the estimated extent and costs of anticipated activities, including the effects of inflation and movements in foreign exchange rates • movements in interest rates affecting the discount rate applied | |
Changes to the closure and rehabilitation estimate for operating sites are added to, or deducted from, the related asset and amortised on a prospective basis over the remaining life of the operation, generally applying the units of production method. | ||
Costs arising from unforeseen circumstances, such as the contamination caused by unplanned discharges, are recognised as an expense and liability when the event gives rise to an obligation that is probable and capable of reliable estimation. | ||
• |
the extent (due to legal or constructive obligations) of potential activities required for the removal of infrastructure, decharacterisation of tailings storage facilities and rehabilitation activities |
• |
costs associated with future closure activities |
• |
the extent and period of post-closure monitoring and maintenance, including water management |
• |
applicable discount rates |
• |
the timing of cash flows and ultimate closure of operations |
• |
the significant increase in coal royalties applicable in Queensland from 1 July 2022 |
• |
consideration of the Group’s long term outlook for metallurgical coal commodity prices, which reflects a range of drivers of commodity demand and supply, for example, the latest climate-related announcements from key market countries |
BHP Group Limited |
BHP Group Plc |
|||||||||||||||||||||||
2022 shares |
2021 shares |
2020 shares |
2022 shares |
2021 shares |
2020 shares |
|||||||||||||||||||
| Share capital issued |
||||||||||||||||||||||||
| Opening number of shares |
||||||||||||||||||||||||
| Issue of shares |
– | – | – |
– | – | |||||||||||||||||||
| Corporate structure unification |
– | – | ( |
) |
– | – | ||||||||||||||||||
| Purchase of shares by ESOP Trusts |
( |
) |
( |
) |
( |
) |
( |
) |
( |
) |
( |
) | ||||||||||||
| Employee share awards exercised following vesting |
||||||||||||||||||||||||
| Movement in treasury shares under Employee Share Plans |
( |
) | ( |
) |
( |
) | ||||||||||||||||||
| |
|
|
|
|
|
|
|
|
|
|
|
|||||||||||||
| Closing number of shares |
– |
|||||||||||||||||||||||
| |
|
|
|
|
|
|
|
|
|
|
|
|||||||||||||
| Comprising: |
||||||||||||||||||||||||
| Shares held by the public |
– |
|||||||||||||||||||||||
| Treasury shares |
– |
|||||||||||||||||||||||
| Other share classes |
||||||||||||||||||||||||
| |
– |
– | – | – |
||||||||||||||||||||
| Special Voting share of no par value |
– |
– |
– | – | ||||||||||||||||||||
| Special Voting share of US$ value |
– |
– | – | – |
||||||||||||||||||||
| DLC Dividend share |
– |
– |
– | – | ||||||||||||||||||||
| Ordinary shares fully paid |
Treasury shares | |
Each fully paid ordinary share of BHP Group Limited carries the right to one vote at a meeting of the Company. |
Treasury shares are shares of BHP Group Limited that are held by the ESOP Trusts for the purpose of issuing shares to employees under the Group’s Employee Share Plans. Treasury shares are recognised at cost and deducted from equity, net of any income tax effects. When the treasury shares are subsequently sold or reissued, any consideration received, net of any directly attributable costs and income tax effects, is recognised as an increase in equity. Any difference between the carrying amount and the consideration, if reissued, is recognised in retained earnings. |
| Special Voting shares |
Preference shares |
DLC Dividend share | ||
| Each of BHP Group Limited and BHP Group Plc issued |
Preference shares have the right to repayment of the amount paid up on the nominal value and any unpaid dividends in priority to the holders of any other class of shares in BHP Group Plc on a return of capital or winding up. The holders of preference shares have limited voting rights if payment of the preference dividends are six months or more in arrears or a resolution is passed changing the rights of the preference shareholders. | The DLC Dividend share supported the Dual Listed Company (DLC) equalisation principles in place since the merger in 2001, including the requirement that ordinary shareholders of BHP Group Plc and BHP Group Limited are paid equal cash dividends per share. This share enabled efficient and flexible capital management across the DLC and was issued on 23 February 2016 at par value of US$ |
2022 |
2021 |
2020 |
Recognition and measurement | |||||||||||
| US$M |
US$M |
US$M |
||||||||||||
| Share premium account |
The share premium account represented the premium paid on the issue of BHP Group Plc shares recognised in accordance with the UK Companies Act 2006. It was transferred to the common control reserve as part of the unification of the Group’s corporate structure. | |||||||||||||
| Capital redemption reserve |
The capital redemption reserve represented the par value of BHP Group Plc shares that were purchased and subsequently cancelled. It was transferred to the common control reserve as part of unification of the Group’s corporatestructure. | |||||||||||||
| Common control reserves |
( |
) |
– | – | The common control reserve arose on unification of the Group’s corporate structure and represents the residual on consolidation between BHP Group Ltd’s investment in BHP Group Plc’s and BHP Group Plc’s share capital, share premium and capital redemption reserve at the time of unification. | |||||||||
| Employee share awards reserve |
The employee share awards reserve represents the accrued employee entitlements to share awards that have been charged to the income statement and have not yet been exercised. Once exercised, the difference between the accumulated fair value of the awards and their historical on-market purchase price is recognised in retainedearnings. | |||||||||||||
| Cash flow hedge reserve |
The cash flow hedge reserve represents hedging gains and losses recognised on the effective portion of cash flow hedges. The cumulative deferred gain or loss on the hedge is recognised in the income statement when the hedged transaction impacts the income statement, or is recognised as an adjustment to the cost of non-financial hedged items. The hedging reserve records the portion of the gain or loss on a hedging instrument in a cash flow hedge that isdetermined to be an effective hedge relationship. | |||||||||||||
| Cost of hedging reserve |
( |
) |
( |
) | ( |
) | The cost of hedging reserve represents the recognition of certain costs of hedging for example, basis adjustments, which have been excluded from the hedging relationship and deferred in other comprehensive income until the hedged transaction impacts the income statement. | |||||||
| Foreign currency translation reserve |
( |
) |
The foreign currency translation reserve represents exchange differences arising from the translation of non-US dollar functional currency operationswithin the Group into US dollars. | |||||||||||
| Equity investments reserve |
( |
) |
The equity investment reserve represents the revaluation of investments in shares recognised through other comprehensive income. Where a revalued financial asset is sold, the relevant portion of the reserve is transferred to retained earnings. | |||||||||||
| Non-controlling interest contribution reserve |
The non-controlling interest contribution reserve represents the excess of consideration received over the book value of net assets attributable to equity instruments when acquired by non-controlling interests. | |||||||||||||
| |
|
|
|
|
|
|||||||||
| Total reserves |
||||||||||||||
| |
|
|
|
|
|
|||||||||
2022 |
2021 |
|||||||||||||||||||||||
| US$M |
Minera Escondida Limitada |
Other individually immaterial subsidiaries (incl. intra -group eliminations) |
Total |
Minera Escondida Limitada |
Other individually immaterial subsidiaries (incl. intra -group eliminations) |
Total |
||||||||||||||||||
| Group share (per cent) |
||||||||||||||||||||||||
| |
|
|
|
|||||||||||||||||||||
| Current assets |
||||||||||||||||||||||||
| Non-current assets |
||||||||||||||||||||||||
| Current liabilities |
( |
) |
( |
) | ||||||||||||||||||||
| Non-current liabilities |
( |
) |
( |
) | ||||||||||||||||||||
| |
|
|
|
|
|
|
|
|
|
|
|
|||||||||||||
| Net assets |
||||||||||||||||||||||||
| |
|
|
|
|
|
|
|
|
|
|
|
|||||||||||||
| Net assets attributable to NCI |
||||||||||||||||||||||||
| |
|
|
|
|
|
|
|
|
|
|
|
|||||||||||||
| Revenue |
||||||||||||||||||||||||
| Profit after taxation |
||||||||||||||||||||||||
| Other comprehensive income |
||||||||||||||||||||||||
| |
|
|
|
|
|
|
|
|
|
|
|
|||||||||||||
| Total comprehensive income |
||||||||||||||||||||||||
| |
|
|
|
|
|
|
|
|
|
|
|
|||||||||||||
| Profit after taxation attributable to NCI |
||||||||||||||||||||||||
| Other comprehensive income attributable to NCI |
– |
– | ||||||||||||||||||||||
| |
|
|
|
|
|
|
|
|
|
|
|
|||||||||||||
| Net operating cash flow |
||||||||||||||||||||||||
| Net investing cash flow |
( |
) |
( |
) | ||||||||||||||||||||
| Net financing cash flow |
( |
) |
( |
) | ||||||||||||||||||||
| |
|
|
|
|
|
|
|
|
|
|
|
|||||||||||||
| Dividends paid to NCI |
||||||||||||||||||||||||
| |
|
|
|
|
|
|
|
|
|
|
|
|||||||||||||
Year ended 30 June 2022 |
Year ended 30 June 2021 |
Year ended 30 June 2020 |
||||||||||||||||||||||
Per share |
Total |
Per share |
Total |
Per share |
Total |
|||||||||||||||||||
US cents |
US$M |
US cents |
US$M |
US cents |
US$M |
|||||||||||||||||||
| Dividends paid during the period 1 |
||||||||||||||||||||||||
| Prior year final dividend |
5 | 8 | ||||||||||||||||||||||
| Interim dividend |
0 |
1 | 5 | |||||||||||||||||||||
| |
|
|
|
|
|
|
|
|
|
|
|
|||||||||||||
0 |
6 | 3 | ||||||||||||||||||||||
| |
|
|
|
|
|
|
|
|
|
|
|
|||||||||||||
1 |
financial years 2021 and 2020. |
2022 |
2021 |
2020 |
||||||||||
| US$M |
US$M |
US$M |
||||||||||
| Franking credits as at 30 June |
||||||||||||
| Franking credits arising from the payment of current tax |
||||||||||||
| |
|
|
|
|
|
|||||||
| Total franking credits available 1 |
||||||||||||
| |
|
|
|
|
|
|||||||
1 |
The payment of the final 2022 dividend determined after 30 June 2022 will reduce the franking account balance by US$ |
2022 |
2021 |
|||||||
| US$M |
US$M |
|||||||
| Movement in provision for dividends and other liabilities |
||||||||
| At the beginning of the financial year |
||||||||
| Dividends determined |
||||||||
| Charge/(credit) for the year: |
||||||||
| Underlying |
||||||||
| Discounting |
||||||||
| Exchange variations |
||||||||
| Released during the year |
( |
) |
( |
) | ||||
| Utilisation |
( |
) |
( |
) | ||||
| Dividends paid |
( |
) |
( |
) | ||||
| Divestment and demerger of subsidiaries and operations |
( |
) |
– | |||||
| Transfers and other movements |
( |
) |
( |
) | ||||
| |
|
|
|
|||||
| At the end of the financial year |
||||||||
| |
|
|
|
|||||
| Comprising: |
||||||||
| Current |
||||||||
| Non-current |
||||||||
| |
|
|
|
|||||
2022 |
2021 |
|||||||||||||||
| US$M |
Current |
Non-current |
Current |
Non-current |
||||||||||||
| Interest bearing liabilities |
||||||||||||||||
| Bank loans |
||||||||||||||||
| Notes and debentures |
||||||||||||||||
| Lease liabilities |
||||||||||||||||
| Bank overdraft and short-term borrowings |
– |
– |
– | – | ||||||||||||
| Other |
– | |||||||||||||||
| |
|
|
|
|
|
|
|
|||||||||
| Total interest bearing liabilities |
||||||||||||||||
| |
|
|
|
|
|
|
|
|||||||||
| Less: Lease liability associated with index-linked freight contracts |
||||||||||||||||
| |
|
|
|
|
|
|
|
|||||||||
| Less: Cash and cash equivalents |
||||||||||||||||
| Cash |
– |
– | ||||||||||||||
| Short-term deposits |
– |
– | ||||||||||||||
| |
|
|
|
|
|
|
|
|||||||||
| Less: Total cash and cash equivalents |
– |
– | ||||||||||||||
| |
|
|
|
|
|
|
|
|||||||||
| Less: Derivatives included in net debt |
||||||||||||||||
| Net debt management related instruments 1 |
( |
) |
( |
) |
||||||||||||
| Net cash management related instruments 2 |
– |
– | ||||||||||||||
| |
|
|
|
|
|
|
|
|||||||||
| Less: Total derivatives included in net debt |
( |
) |
( |
) |
||||||||||||
| |
|
|
|
|
|
|
|
|||||||||
| Net debt |
||||||||||||||||
| |
|
|||||||||||||||
| Net assets |
||||||||||||||||
| |
|
|
|
|||||||||||||
| Gearing |
% |
% | ||||||||||||||
| |
|
|
|
|||||||||||||
1 |
Represents the net cross currency and interest rate swaps designated as effective hedging instruments included within current and non-current other financial assets and liabilities. |
2 |
Represents the net forward exchange contracts included within current and non-current other financial assets and liabilities. |
2022 |
2021 | 2020 | ||||||||||
US$M |
US$M | US$M | ||||||||||
| Total cash and cash equivalents |
||||||||||||
| Bank overdrafts and short-term borrowings |
– | – | ||||||||||
| |
|
|
|
|
|
|||||||
| Total cash and cash equivalents, net of overdrafts |
||||||||||||
| |
|
|
|
|
|
|||||||
Interest bearing liabilities |
Cash and cash equivalents |
|||||||||||||||
2022 |
2021 |
2022 |
2021 |
|||||||||||||
US$M |
US$M |
US$M |
US$M |
|||||||||||||
USD |
||||||||||||||||
EUR |
||||||||||||||||
GBP |
||||||||||||||||
AUD |
||||||||||||||||
CAD |
||||||||||||||||
Other |
||||||||||||||||
Total |
||||||||||||||||
2022 US$M |
Bank loans, debentures and other loans |
Expected future interest payments |
Derivatives related to debentures |
Other derivatives |
Obligations under lease liabilities |
Trade and other payables 1 |
Total |
|||||||||||||||||||||
Due for payment: |
||||||||||||||||||||||||||||
In one year or less or on demand |
||||||||||||||||||||||||||||
In more than one year but not more than two years |
– |
|||||||||||||||||||||||||||
In more than two years but not more than five years |
– |
|||||||||||||||||||||||||||
In more than five years |
– |
|||||||||||||||||||||||||||
Total |
||||||||||||||||||||||||||||
Carrying amount |
– |
|||||||||||||||||||||||||||
2021 US$M |
Bank loans, debentures and other loans |
Expected future interest payments |
Derivatives related to debentures |
Other derivatives |
Obligations under lease liabilities |
Trade and other payables 1 |
Total |
|||||||||||||||||||||
Due for payment: |
||||||||||||||||||||||||||||
In one year or less or on demand |
||||||||||||||||||||||||||||
In more than one year but not more than two years |
– | |||||||||||||||||||||||||||
In more than two years but not more than five years |
– | |||||||||||||||||||||||||||
In more than five years |
– | |||||||||||||||||||||||||||
Total |
||||||||||||||||||||||||||||
Carrying amount |
– | |||||||||||||||||||||||||||
1 |
Excludes input taxes of US$ |
2022 |
2021 |
|||||||
US$M |
US$M |
|||||||
At the beginning of the financial year |
||||||||
Additions |
||||||||
Remeasurements of index-linked freight contracts |
( |
) |
( |
) | ||||
Lease payments 1 |
( |
) |
( |
) | ||||
Foreign exchange movement |
( |
) |
||||||
Amortisation of discounting |
||||||||
Divestment and demerger of subsidiaries and operations 2 |
( |
) |
– | |||||
Transfers and other movements |
( |
) |
( |
) | ||||
At the end of the financial year |
||||||||
Comprising: |
||||||||
Current liabilities |
||||||||
Non-current liabilities |
||||||||
1 |
Includes US$ |
2 |
Relates to the divestment of BMC and merger of Petroleum with Woodside. Refer to notes 3 ‘Exceptional items’ and 27 ‘Discontinued operations’ for more information. |
| Lease liability |
2022 |
2021 |
||||||
US$M |
US$M |
|||||||
| Due for payment: |
||||||||
| In one year or less or on demand |
||||||||
| In more than one year but not more than two years |
||||||||
| In more than two years but not more than five years |
||||||||
| In more than five years 1 |
||||||||
| |
|
|
|
|||||
| Total |
||||||||
| |
|
|
|
|||||
| Carrying amount |
||||||||
| |
|
|
|
|||||
1 |
Includes US$ |
2022 |
2021 |
|||||||||||||||||||||||
Land and buildings |
Plant and equipment |
Total |
Land and buildings |
Plant and equipment |
Total |
|||||||||||||||||||
US$M |
US$M |
US$M |
US$M |
US$M |
US$M |
|||||||||||||||||||
| Net book value |
||||||||||||||||||||||||
| At the beginning of the financial year |
||||||||||||||||||||||||
| Additions |
||||||||||||||||||||||||
| Remeasurements of index-linked freight contracts |
– |
( |
) |
( |
) |
– | ( |
) | ( |
) | ||||||||||||||
| Depreciation expensed during the period |
( |
) | ( |
) |
( |
) |
( |
) | ( |
) | ( |
) | ||||||||||||
| Depreciation classified as exploration |
– |
( |
) |
( |
) |
– | ( |
) | ( |
) | ||||||||||||||
| Impairments for the year |
( |
) |
– |
( |
) |
( |
) | ( |
) | ( |
) | |||||||||||||
| Divestment and demerger of subsidiaries and operations 1 |
( |
) |
( |
) |
( |
) |
– | – | – | |||||||||||||||
| Transfers and other movements |
( |
) |
( |
) |
( |
) |
( |
) | ( |
) | ||||||||||||||
| |
|
|
|
|
|
|
|
|
|
|
|
|||||||||||||
| At the end of the financial year |
||||||||||||||||||||||||
| |
|
|
|
|
|
|
|
|
|
|
|
|||||||||||||
| – Cost |
||||||||||||||||||||||||
| – Accumulated depreciation and impairments |
( |
) |
( |
) |
( |
) |
( |
) | ( |
) | ( |
) | ||||||||||||
| |
|
|
|
|
|
|
|
|
|
|
|
|||||||||||||
1 |
Relates to the divestment of BMC and merger of Petroleum with Woodside. Refer to notes 3 ‘Exceptional items’ and 27 ‘Discontinued operations’ for more information. |
2022 |
2021 |
2020 |
||||||||||||
| US$M |
US$M Restated |
US$M Restated |
Included within | |||||||||||
| Income statement |
||||||||||||||
| Depreciation of right-of-use |
Profit from operations | |||||||||||||
| Short-term, low-value and variable lease costs1 |
Profit from operations | |||||||||||||
| Interest on lease liabilities |
Financial expenses | |||||||||||||
| Cash flow statement |
||||||||||||||
| Principal lease payments |
Cash flows from financing activities | |||||||||||||
| Lease interest payments |
Cash flows from operating activities | |||||||||||||
1 |
Relates to US$ low-value lease costs (2021: US$ |
| Key judgements and estimates Judgements: |
| Where a contract includes the provision of non-lease services, judgement is required to identify the lease and non-lease components. |
| Estimates: right-of-use |
| The Group estimates stand-alone prices, where such prices are not readily observable, in order to allocate the contractual payments between lease and non-lease components. |
2022 |
2021 |
2020 |
||||||||||
US$M |
US$M Restated |
US$M Restated |
||||||||||
Financial expenses |
||||||||||||
Interest expense using the effective interest rate method: |
||||||||||||
Interest on bank loans, overdrafts and all other borrowings |
||||||||||||
Interest capitalised at 1 |
( |
) |
( |
) | ( |
) | ||||||
Interest on lease liabilities |
||||||||||||
Discounting on provisions and other liabilities |
||||||||||||
Other gains and losses: |
||||||||||||
Fair value change on hedged loans |
( |
) |
( |
) | ||||||||
Fair value change on hedging derivatives |
( |
) | ||||||||||
Loss on bond repurchase 2 |
– |
– | ||||||||||
Exchange variations on net debt |
( |
) |
( |
) | ||||||||
Other |
||||||||||||
Total financial expenses |
||||||||||||
Financial income |
||||||||||||
Interest income |
( |
) |
( |
) | ( |
) | ||||||
Net finance costs |
||||||||||||
1 |
Interest has been capitalised at the rate of interest applicable to the specific borrowings financing the assets under construction or, where financed through general borrowings, at a capitalisation rate representing the average interest rate on such borrowings. Tax relief for capitalised interest is approximately US$ |
2 |
Relates to the additional cost on settlement of |
Activity |
Key risk management processes | |
1 Risk mitigation On an exception basis, hedging for the purposes of mitigating risk related to specific and significant expenditure on investments or capital projects will be executed if necessary to support the Group’s strategic objectives. |
Execution of transactions within approved mandates. | |
2 Economic hedging of commodity sales, operating costs, short-term cash deposits, other monetary items and debt instruments |
||
| Where Group commodity production is sold to customers on pricing terms that deviate from the relevant index target and where a relevant derivatives market exists, financial instruments may be executed as an economic hedge to align the revenue price exposure with the index target and US dollars. | Measuring and reporting the exposure in customer commodity contracts and issued debt instruments. | |
| Where debt is issued in a currency other than the US dollar and/or at a fixed interest rate, fair value and cash flow hedges may be executed to align the debt exposure with the Group’s functional currency of US dollars and/or to swap to a floating interest rate. | Executing hedging derivatives to align the total group exposure to the index target. | |
| Where short-term cash deposits and other monetary items are denominated in a currency other than US dollars, derivative financial instruments may be executed to align the foreign exchange exposure to the Group’s functional currency of US dollars. | Execution of transactions within approved mandates. | |
3 Strategic financial transactions |
||
| Opportunistic transactions may be executed with financial instruments to capture value from perceived market over/under valuations. | Execution of transactions within approved mandates. | |
| • | translational exposure in respect of non-functional currency monetary items |
| • | transactional exposure in respect of non-functional currency expenditure and revenues |
Net financial (liabilities)/assets - by currency of denomination |
2022 |
2021 |
||||||
US$M |
US$M |
|||||||
AUD |
( |
) |
( |
) | ||||
CLP |
( |
) |
( |
) | ||||
GBP |
||||||||
EUR |
||||||||
Other |
||||||||
Total |
( |
) |
( |
) | ||||
| • | the Group’s purpose, or business model, for holding the financial asset |
| • | whether the financial asset’s contractual terms give rise to cash flows that are solely payments of principal and interest |
Contractual cash flows |
Business model |
Category | ||
| Solely principal and interest | Hold in order to collect contractual cash flows | Amortised cost | ||
| Solely principal and interest | Hold in order to collect contractual cash flows and sell | Fair value through other comprehensive income | ||
| Solely principal and interest | Hold in order to sell | Fair value through profit or loss | ||
| Other | Any of those mentioned above | Fair value through profit or loss | ||
IFRS 13 Fair value hierarchy |
Level 1 |
Level 2 |
Level 3 | |||
| Valuation inputs | Based on quoted prices (unadjusted) in active markets for identical financial assets and liabilities. | Based on inputs other than quoted prices included within Level 1 that are observable for the financial asset or liability, either directly (i.e. as unquoted prices) or indirectly (i.e. derived from prices). | Based on inputs not observable in the market using appropriate valuation models, including discounted cash flow modelling. |
IFRS 13 Fair value hierarchy Level 1 |
IFRS 9 Classification |
2022 US$M |
2021 US$M |
|||||||||||
Current cross currency and interest rate swaps 2 |
2 | Fair value through profit or loss | – |
|||||||||||
Current other derivative contracts 3 |
2,3 | Fair value through profit or loss | ||||||||||||
Current other financial assets |
Amortised cost |
– | ||||||||||||
Current other investments 5 |
1,2 | Fair value through profit or loss | ||||||||||||
Non-current cross currency and interest rate swaps2 |
2 | Fair value through profit or loss | ||||||||||||
Non-current other derivative contracts3 |
2,3 | Fair value through profit or loss | ||||||||||||
Non-current other financial assets4 |
3 | Fair value through profit or loss | – | |||||||||||
Non-current investment in shares |
1,3 |
Fair value through other comprehensive income | ||||||||||||
Non-current other investments5 |
1,2 | Fair value through profit or loss | ||||||||||||
Total other financial assets |
||||||||||||||
Cash and cash equivalents |
Amortised cost | |||||||||||||
Trade and other receivables 6 |
Amortised cost | |||||||||||||
Provisionally priced trade receivables |
2 | Fair value through profit or loss | ||||||||||||
Total financial assets |
||||||||||||||
Non-financial assets |
||||||||||||||
Total assets |
||||||||||||||
Current cross currency and interest rate swaps 2 |
2 | Fair value through profit or loss | – | |||||||||||
Current other derivative contracts 3 |
2,3 | Fair value through profit or loss | ||||||||||||
Current other financial liabilities 7 |
Amortised cost | |||||||||||||
Non-current cross currency and interest rate swaps2 |
2 | Fair value through profit or loss | ||||||||||||
Non-current other derivative contracts3 |
2,3 | Fair value through profit or loss | – | |||||||||||
Non-current other financial liabilities7 |
Amortised cost | |||||||||||||
Total other financial liabilities |
||||||||||||||
Trade and other payables 8 |
Amortised cost | |||||||||||||
Provisionally priced trade payables |
2 | Fair value through profit or loss | ||||||||||||
Bank loans 9 |
Amortised cost | |||||||||||||
Notes and debentures 9 |
Amortised cost | |||||||||||||
Lease liabilities |
||||||||||||||
Other 9 |
Amortised cost | |||||||||||||
Total financial liabilities |
||||||||||||||
Non-financial liabilities |
||||||||||||||
Total liabilities |
||||||||||||||
1 |
All of the Group’s financial assets and financial liabilities recognised at fair value were valued using market observable inputs categorised as Level 2 unless specified otherwise in the following footnotes. |
2 |
Cross currency and interest rate swaps are valued using market data including interest rate curves (which include the base LIBOR rate and swap rates) and foreign exchange rates. A discounted cash flow approach is used to derive the fair value of cross currency and interest rate swaps at the reporting date. |
3 |
Includes other derivative contracts of US$ |
4 |
Includes receivables contingent on outcome of future events relating to mining , and regulatory approvals of US$ |
5 |
Includes investments held by BHP Billiton Foundation which are restricted and not available for general use by the Group of US$ mainly US Treasury Notes) of US$ |
6 |
Excludes input taxes of US$ |
7 |
Includes the discounted settlement liability in relation to the cancellation of power contracts at the Group’s Escondida operations. |
8 |
Excludes input taxes of US$ |
9 |
All interest bearing liabilities, excluding lease liabilities, are unsecured. |
| • | Fair value hedges – the fair value gain or loss on interest rate and cross currency swaps relating to interest rate risk, together with the change in the fair value of the hedged fixed rate borrowings attributable to interest rate risk are recognised immediately in the income statement. If the hedge no longer meets the criteria for hedge accounting, the fair value adjustment on the note or debenture is amortised to the income statement over the period to maturity using a recalculated effective interest rate. |
| • | Cash flow hedges – changes in the fair value of cross currency interest rate swaps which hedge foreign currency cash flows on the notes and debentures are recognised directly in other comprehensive income and accumulated in the cash flow hedging reserve. To the extent a hedge is ineffective, changes in fair value are recognised immediately in the income statement. |
| • | The carrying amount of the notes and debentures includes foreign exchange remeasurement to period-end rates and fair value adjustments when included in a fair value hedge. |
| • | The breakdown of the hedging derivatives includes remeasurement of foreign currency notional values at period-end rates, fair value movements due to interest rate risk, foreign currency cash flows designated into cash flow hedges, costs of hedging recognised in other comprehensive income, ineffectiveness recognised in the income statement and accruals or prepayments. |
| • | The hedged value of notes and debentures includes their carrying amounts adjusted for the offsetting derivative fair value movements due to foreign currency and interest rate risk remeasurement. |
Fair value of derivatives |
||||||||||||||||||||||||||||||||||||
2022 US$M |
Carrying amount of notes and debentures |
Foreign exchange notional at spot rates |
Interest rate risk |
Recognised in cash flow hedging reserve |
Recognised in cost of hedging reserve |
Recognised in the income statement 1 |
Accrued cash flows |
Total |
Hedged value of notes and debentures 2 |
|||||||||||||||||||||||||||
A |
B |
C |
D |
E |
F |
G |
B to G |
A + B + C |
||||||||||||||||||||||||||||
USD |
– |
( |
) | – |
– |
( |
) | |||||||||||||||||||||||||||||
GBP |
( |
) | ( |
) | ||||||||||||||||||||||||||||||||
EUR |
( |
) | ( |
) | ||||||||||||||||||||||||||||||||
CAD |
( |
) | ( |
) | ||||||||||||||||||||||||||||||||
Total |
( |
) | ( |
) | ||||||||||||||||||||||||||||||||
Fair value of derivatives |
||||||||||||||||||||||||||||||||||||
2021 US$M |
Carrying amount of notes and debentures |
Foreign exchange notional at spot rates |
Interest rate risk |
Recognised in cash flow hedging reserve |
Recognised in cost of hedging reserve |
Recognised in the income statement 1 |
Accrued cash flows |
Total |
Hedged value of notes and debentures 2 |
|||||||||||||||||||||||||||
A |
B |
C |
D |
E |
F |
G |
B to G |
A + B + C |
||||||||||||||||||||||||||||
USD |
– | ( |
) | – | – | ( |
) | |||||||||||||||||||||||||||||
GBP |
( |
) | ( |
) | ( |
) | ( |
) | ||||||||||||||||||||||||||||
EUR |
( |
) | ( |
) | ( |
) | ||||||||||||||||||||||||||||||
CAD |
( |
) | ( |
) | ( |
) | ( |
) | ||||||||||||||||||||||||||||
Total |
( |
) | ( |
) | ( |
) | ( |
) | ||||||||||||||||||||||||||||
1 |
Predominantly related to ineffectiveness. |
2 |
Includes US$ million) of fixed rate debt not swapped to floating rate that is not in a hedging relationship. |
Hedging instrument |
Notional currency |
Notional value US$M |
Notional value to mature before LIBOR expires FY2023 US$M |
|||||||
Interest rate swaps |
USD | |||||||||
Cross-currency interest rate swaps |
EUR | |||||||||
| GBP | ||||||||||
Total |
||||||||||
2022 US$M |
Cash flow hedging reserve |
Cost of hedging reserve |
Total |
|||||||||||||||||||||||||
Gross |
Tax |
Net |
Gross |
Tax |
Net |
|||||||||||||||||||||||
At the beginning of the financial year |
( |
) |
( |
) |
( |
) |
||||||||||||||||||||||
Add: Change in fair value of hedging instrument recognised in OCI |
( |
) |
( |
) |
– |
– |
– |
( |
) | |||||||||||||||||||
Less: Reclassified from reserves to interest expense – recognised through OCI |
( |
) |
( |
) |
||||||||||||||||||||||||
At the end of the financial year |
( |
) |
( |
) |
( |
) |
||||||||||||||||||||||
2021 US$M |
Cash flow hedging reserve |
Cost of hedging reserve |
Total | |||||||||||||||||||||||||
| Gross | Tax | Net | Gross | Tax | Net | |||||||||||||||||||||||
At the beginning of the financial year |
( |
) | ( |
) | ( |
) | ||||||||||||||||||||||
Add: Change in fair value of hedging instrument recognised in OCI |
( |
) | – | – | – | |||||||||||||||||||||||
Less: Reclassified from reserves to interest expense – recognised through OCI |
( |
) | ( |
) | ( |
) | ( |
) | ( |
) | ||||||||||||||||||
At the end of the financial year |
( |
) | ( |
) | ( |
) | ||||||||||||||||||||||
Interest bearing liabilities |
Derivatives (assets)/ liabilities |
|||||||||||||||||||||||||||
2022 US$M |
Bank loans |
Notes and debentures |
Lease liabilities |
Bank overdraft and short-term borrowings |
Other |
Cross currency a n dinterest rate swaps |
Total |
|||||||||||||||||||||
At the beginning of the financial year |
– |
( |
) |
|||||||||||||||||||||||||
Proceeds from interest bearing liabilities |
– |
– |
– |
– |
||||||||||||||||||||||||
Settlements of debt related instruments |
– |
– |
– |
– |
– |
– |
– |
|||||||||||||||||||||
Repayment of interest bearing liabilities 1 |
( |
) |
( |
) |
( |
) |
– |
( |
) |
– |
( |
) | ||||||||||||||||
Change from Net financing cash flows |
( |
) |
( |
) |
– |
( |
) |
– |
( |
) | ||||||||||||||||||
Other movements: |
||||||||||||||||||||||||||||
Divestment and demerger of subsidiaries and operations |
– |
– |
( |
) |
– |
– |
– |
|||||||||||||||||||||
Interest rate impacts |
– |
( |
) |
– |
– |
– |
||||||||||||||||||||||
Foreign exchange impacts |
( |
) |
( |
) |
– |
( |
) | |||||||||||||||||||||
Lease additions |
– |
– |
– |
– |
– |
|||||||||||||||||||||||
Remeasurement of index-linked freight contracts |
– |
– |
( |
) |
– |
– |
– |
|||||||||||||||||||||
Other interest bearing liabilities/derivative related changes |
– |
( |
) |
– |
||||||||||||||||||||||||
At the end of the financial year |
– |
|||||||||||||||||||||||||||
| Interest bearing liabilities | Derivatives (assets)/ liabilities |
|||||||||||||||||||||||||||
2021 US$M |
Bank loans |
Notes and debentures |
Lease liabilities |
Bank overdraft and short-term borrowings |
Other | Cross currency and interest rate swaps |
Total | |||||||||||||||||||||
At the beginning of the financial year |
– | ( |
) | |||||||||||||||||||||||||
Proceeds from interest bearing liabilities |
– | – | – | – | ||||||||||||||||||||||||
Settlements of debt related instruments |
– | – | – | – | – | |||||||||||||||||||||||
Repayment of interest bearing liabilities 1 |
( |
) | ( |
) | ( |
) | – | – | – | ( |
) | |||||||||||||||||
Change from Net financing cash flows |
( |
) | ( |
) | ( |
) | – | ( |
) | |||||||||||||||||||
Other movements: |
||||||||||||||||||||||||||||
Loss on bond repurchase |
– | – | – | – | ( |
) | ||||||||||||||||||||||
Interest rate impacts |
– | ( |
) | – | – | – | ||||||||||||||||||||||
Foreign exchange impacts |
( |
) | – | ( |
) | ( |
) | |||||||||||||||||||||
Lease additions |
– | – | – | – | – | |||||||||||||||||||||||
Remeasurement of index-linked freight contracts |
– | – | ( |
) | – | – | – | |||||||||||||||||||||
Other interest bearing liabilities/derivative related changes |
( |
) | ( |
) | – | ( |
) | ( |
) | |||||||||||||||||||
At the end of the financial year |
– | ( |
) | |||||||||||||||||||||||||
1 |
Includes US$ |
2022 |
2021 |
2020 |
||||||||||
US$ |
US$ |
US$ |
||||||||||
Short-term employee benefits |
||||||||||||
Post-employment benefits |
||||||||||||
Share-based payments |
||||||||||||
Total |
||||||||||||
| Plan |
CDP and STIP |
LTIP and MAP |
Transitional and Commencement KMP awards |
Shareplus | ||||
| Type |
||||||||
| |
|
|
|
| ||||
| Overview |
The CDP was implemented in FY2020 as a replacement for the STIP, both of which are generally plans for Executive KMP and members of the Executive Leadership Team who are not Executive KMP. Under the CDP, two thirds of the value of a participant’s short-term incentive amount is awarded as rights to receive BHP Group Limited shares at the end of the vesting period (and the remaining one third is delivered in cash). Two awards of deferred shares are granted, each of the equivalent value to the cash award, vesting in two and five years respectively. Under STIP, half of the value of a participant’s short-term incentive amount is awarded as rights to receive BHP Group Limited shares at the end of the two-year vesting period. |
The LTIP is a plan for Executive KMP and members of the Executive Leadership Team who are not Executive KMP, and awards are granted annually. The MAP is a plan for BHP senior management who are not KMP. The number of share rights awarded is determined by a participant’s role and grade. |
non-KMP roles or to replace awards foregone from a previous company. |
|||||
| |
|
|
| |||||
Vesting conditions |
CDP: Service conditions only for the two-year award. Vesting of the five-year award is subject to service conditions and also to holistic review of performance at the end of the five-year vesting period, including a five-year view on HSEC performance, profitability, cash flow, balance sheet health, returns to shareholders, corporate governance and conduct.STIP: Service conditions only. |
LTIP: Service and performance conditions. BHP’s Total Shareholder Return 1 (TSR) performance relative to the Peer Group TSR over a five-year performance period determines the vesting of For awards granted from December 2017 onwards, MAP: Service conditions only. |
Service and performance conditions. The Remuneration Committee has absolute discretion to determine if the performance condition has been met and whether any, all or part of the award will vest (or otherwise lapse), having regard to personal performance and the underlying financial performance of the Group during the performance period. To the extent the performance condition is not achieved, awards will lapse. There is no retesting of the performance condition. Vested awards may be subject to a holding lock. |
|||||
| |
|
|
|
| ||||
| Plan |
CDP and STIP |
LTIP and MAP |
Transitional and Commencement KMP awards |
Shareplus | ||||
Vesting period |
CDP – STIP – |
LTIP – MAP – |
||||||
| |
|
|
|
| ||||
Dividend Equivalent Payment |
CDP – Yes STIP – Yes |
LTIP – Yes MAP – Varies |
||||||
| |
|
|
|
| ||||
Exercise period |
||||||||
1 |
For LTIP awards granted prior to unification and where the five-year performance period ends after unification, the TSR at the start of the performance period is based on the weighted average of the TSRs of BHP Group Limited and BHP Group Plc and the TSR at the end of the performance period is based on the TSR of BHP Group Limited. |
| 2022 |
Number of awards at the beginning of the financial year |
Number of awards issued during the year |
Number of awards vested and exercised |
Number of awards lapsed |
Number of BHP Group Plc awards transferred to BHP Group Limited on unification 1 |
Number of awards at the end of the financial year |
Weighted average remaining contractual life (years) |
Weighted average share price at exercise date |
||||||||||||||||||||||||
| BHP Group Limited |
||||||||||||||||||||||||||||||||
| CDP awards |
– |
– |
– |
n/a |
||||||||||||||||||||||||||||
| STIP awards |
– |
– |
A$ |
|||||||||||||||||||||||||||||
| LTIP awards |
– |
– |
A$ |
|||||||||||||||||||||||||||||
| MAP awards 2 |
A$ |
|||||||||||||||||||||||||||||||
| Transitional and Commencement KMP awards |
– |
– |
– |
n/a |
||||||||||||||||||||||||||||
| Shareplus |
A$ |
|||||||||||||||||||||||||||||||
| |
|
|
|
|
|
|
|
|
|
|
|
|
|
|||||||||||||||||||
| BHP Group Plc |
|
|||||||||||||||||||||||||||||||
| MAP awards |
– |
n/a |
£ |
|||||||||||||||||||||||||||||
| Shareplus |
– |
n/a |
£ |
|||||||||||||||||||||||||||||
1 |
On unification of the Group’s corporate structure on 31 January 2022 (refer note 16 ‘Share capital’ for details) |
2 |
There were |
2022 |
Weighted average fair value of awards granted during the year US$ |
Risk-free interest rate |
Estimated life of awards |
Share price at grant date |
Estimated volatility of share price |
Dividend yield |
||||||||||||||||||
BHP Group Limited |
||||||||||||||||||||||||
CDP awards |
n/a |
A$ |
n/a |
n/a |
||||||||||||||||||||
LTIP awards |
A$ |
n/a |
||||||||||||||||||||||
MAP awards 1 |
n/a |
A$ A$ / A$ |
n/a |
2022 and annum thereafter |
||||||||||||||||||||
Shareplus |
A$ |
n/a |
% |
|||||||||||||||||||||
BHP Group Plc |
||||||||||||||||||||||||
MAP awards |
n/a |
£ |
n/a |
2022 and annum thereafter |
||||||||||||||||||||
Shareplus |
£ |
n/a |
% |
|||||||||||||||||||||
1 |
Includes MAP awards granted on 17 August 2021, 29 September 2021, 1 March 2022, 30 March 2022 and 17 June 2022. |
| • | exercise price |
| • | expected life of the award |
| • | current market price of the underlying shares |
| • | expected volatility using an analysis of historic volatility over different rolling periods. For the LTIP, it is calculated for all sector comparators and the published MSCI World index |
| • | expected dividends |
| • | risk-free interest rate, which is an applicable government bond rate |
| • | market-based performance hurdles |
| • | non-vesting conditions |
2022 |
2021 |
|||||||
US$M |
US$M |
|||||||
Employee benefits 1 |
||||||||
Restructuring 2 |
||||||||
Post-retirement employee benefits 3 |
||||||||
Total provisions |
||||||||
Comprising: |
||||||||
Current |
||||||||
Non-current |
||||||||
2022 |
Employee benefits |
Restructuring |
Post- retirement employee benefits 3 |
Total |
||||||||||||
US$M |
US$M |
US$M |
US$M |
|||||||||||||
At the beginning of the financial year |
||||||||||||||||
Charge/(credit) for the year: |
||||||||||||||||
Underlying |
||||||||||||||||
Discounting |
– |
– |
||||||||||||||
Net interest expense |
– |
– |
( |
) |
( |
) | ||||||||||
Exchange variations |
( |
) |
( |
) |
( |
) |
( |
) | ||||||||
Released during the year |
( |
) |
( |
) |
( |
) |
( |
) | ||||||||
Remeasurement gains taken to retained earnings |
– |
– |
( |
) |
( |
) | ||||||||||
Utilisation |
( |
) |
( |
) |
( |
) |
( |
) | ||||||||
Divestment and demerger of subsidiaries and operations |
( |
) |
( |
) |
( |
) |
( |
) | ||||||||
Transfers and other movements |
– |
|||||||||||||||
At the end of the financial year |
||||||||||||||||
1 |
The expenditure associated with total employee benefits will occur in a pattern consistent with when employees choose to exercise their entitlement to benefits. |
2 |
Total restructuring provisions include provisions for terminations and office closures. |
3 |
The net liability recognised in the Consolidated Balance Sheet includes US$ |
| • | there is a present legal or constructive obligation as a result of past events |
| • | it is more likely than not that a permanent outflow of resources will be required to settle the obligation |
| • | the amount can be reliably estimated and measured at the present value of management’s best estimate of the cash outflow required to settle the obligation at the reporting date |
Provision |
Description | |
Employee benefits |
Liabilities for benefits accruing to employees up until the reporting date in respect of wages and salaries, annual leave and any accumulating sick leave are recognised in the period the related service is rendered. Liabilities recognised in respect of short-term employee benefits expected to be settled within 12 months are measured at the amounts expected to be paid when the liabilities are settled. Liabilities for other long-term employee benefits, including long service leave are measured as the present value of estimated future payments for the services provided by employees up to the reporting date. Liabilities that are not expected to be settled within 12 months are discounted at the reporting date using market yields of high-quality corporate bonds or government bonds for countries where there is no deep market for corporate bonds. The rates used reflect the terms to maturity and currency that match, as closely as possible, the estimated future cash outflows. In relation to industry-based long service leave funds, the Group’s liability, including obligations for funding shortfalls, is determined after deducting the fair value of dedicated assets of such funds. Liabilities for short and long-term employee benefits (other than unpaid wages and salaries) are disclosed within employee benefits. Liabilities for unpaid wages and salaries are recognised in other creditors. |
Provision |
Description | |
Restructuring |
Restructuring provisions are recognised when: • the Group has developed a detailed formal plan identifying the business or part of the business concerned, the location and approximate number of employees affected, a detailed estimate of the associated costs, and an appropriate timeline • the restructuring has either commenced or been publicly announced and can no longer be withdrawn Payments that are not expected to be settled within 12 months of the reporting date are measured at the present value of the estimated future cash payments expected to be made by the Group. | |
Post-retirement employee benefits |
Defined contribution pension schemes and multi-employer pension schemes For defined contribution schemes or schemes operated on an industry-wide basis where it is not possible to identify assets attributable to the participation by the Group’s employees, the pension charge is calculated on the basis of contributions payable. The Group contributed US$ Defined benefit pension and post-retirement medical schemes The Group operates or participates in a number of defined benefit pension schemes throughout the world, all of which are closed to new entrants. The funding of the schemes complies with local regulations. The assets of the schemes are generally held separately from those of the Group and are administered by trustees or management boards. The Group also operates a number of unfunded post-retirement medical schemes in the United States, Canada and Europe. For defined benefit schemes, an asset or liability is recognised in the balance sheet based at the present value of defined benefit obligations less, where funded, the fair value of plan assets, except that any such asset cannot exceed the present value of expected refunds from and reductions in future contributions to the plan. Full actuarial valuations are prepared by local actuaries for all schemes, using discount rates based on market yields at the reporting date on high-quality corporate bonds or by reference to national government bonds if high-quality corporate bonds are not available. Where funded, scheme assets are invested in a diversified range of asset classes, predominantly comprising bonds and equities. | |
2022 |
2021 |
2020 |
||||||||||
US$M |
US$M |
US$M |
||||||||||
Revenue |
||||||||||||
Other income |
||||||||||||
Expenses excluding net finance costs |
( |
) |
( |
) | ( |
) | ||||||
Loss from equity accounted investments, related impairments and expenses |
( |
) |
( |
) | ( |
) | ||||||
Profit from operations |
||||||||||||
Financial expenses |
( |
) |
( |
) | ( |
) | ||||||
Financial income |
||||||||||||
Net finance costs |
( |
) |
( |
) | ( |
) | ||||||
Profit before taxation |
||||||||||||
Income tax expense |
( |
) |
( |
) | ( |
) | ||||||
Royalty-related taxation (net of income tax benefit) |
( |
) |
( |
) | ||||||||
Total taxation expense |
( |
) |
( |
) | ( |
) | ||||||
Profit/(loss) after taxation from operating activities |
( |
) | ||||||||||
Net gain on Petroleum merger with Woodside (after tax) |
||||||||||||
Profit/(loss) after taxation |
( |
) | ||||||||||
Attributable to non-controlling interests |
||||||||||||
Attributable to BHP shareholders |
( |
) | ||||||||||
Basic earnings/(loss) per ordinary share (cents) |
5 |
5 | ) | 1 | ||||||||
Diluted earnings/(loss) per ordinary share (cents) |
1 |
5 | ) | |||||||||
2022 |
2021 |
2020 |
||||||||||
US$M |
US$M |
US$M |
||||||||||
Net operating cash flows |
||||||||||||
Net investing cash flows 1 |
( |
) |
( |
) | ( |
) | ||||||
Net financing cash flows 2 |
( |
) |
( |
) | ( |
) | ||||||
Net increase/(decrease) in cash and cash equivalents from Discontinued operations |
( |
) | ( |
) | ||||||||
Net cash completion payment on merger of Petroleum with Woodside |
( |
) |
||||||||||
Cash and cash equivalents disposed |
( |
) |
||||||||||
Total cash impact |
( |
) |
( |
) | ||||||||
1 |
Includes purchases of property, plant and equipment and capitalised exploration of US$ proceeds from sale of subsidiaries, operations and joint operations, net of cash of US$million (30 June 2021: investment of US$outflow of US$outflow of US$ |
2 |
Represents net repayment of interest bearing liabilities of US$ |
| Year ended 30 June 2022 |
Gross |
Tax |
Net |
|||||||||
US$M |
US$M |
US$M |
||||||||||
| Exceptional items by category |
||||||||||||
| Net gain on Petroleum merger with Woodside 1 |
( |
) |
||||||||||
| |
|
|
|
|
|
|||||||
| Total |
( |
) |
||||||||||
| |
|
|
|
|
|
|||||||
| Attributable to non-controlling interests |
– |
– |
– |
|||||||||
| Attributable to BHP shareholders |
( |
) |
||||||||||
| |
|
|
|
|
|
|||||||
1 |
The tax expense associated with the exceptional item reflects the tax impact of transaction costs and other restructuring related activities undertaken pre-merger. There are no further tax impacts arising on the net gain on merger of our Petroleum business with Woodside as generated tax losses were either offset with capital gains in other entities in the Group, or not recognised on the basis that it is not probable that future capital gains will be available against which the Group can utilise the tax losses. |
2022 |
||||
US$M |
||||
| Assets |
||||
| Cash and cash equivalents |
||||
| Trade and other receivables |
||||
| Other financial assets |
||||
| Inventories |
||||
| Property, plant and equipment |
||||
| Intangible assets |
||||
| Investments accounted for using the equity method |
||||
| Deferred tax assets |
||||
| Other |
||||
| |
|
|||
| Total assets |
||||
| |
|
|||
| Liabilities |
||||
| Trade and other payables |
||||
| Interest bearing liabilities |
||||
| Tax payables |
||||
| Provisions |
||||
| Deferred income |
||||
| |
|
|||
| Total liabilities |
||||
| |
|
|||
| Net assets |
||||
| |
|
|||
| Fair value of Woodside shares 1 |
||||
| Net cash completion payment on merger of Petroleum with Woodside 2 |
( |
) | ||
| Foreign currency translation reserve transferred to the income statement |
||||
| Other provisions and related indemnities recognised at completion |
( |
) | ||
| Transaction and other directly attributable costs |
( |
) | ||
| Income tax expense |
( |
) | ||
| |
|
|||
| Net gain on Petroleum merger with Woodside |
||||
| |
|
|||
1 |
Represents the consideration received being the fair value of |
2 |
Reflects the net cash flows generated by BHP Petroleum between 1 July 2021 and Completion Date adjusted for dividends Woodside would have paid on the newly issued Woodside ordinary shares, had the m erger completed on 1 July 2021. |
| Year ended 30 June 2021 |
Gross |
Tax |
Net |
|||||||||
US$M |
US$M |
US$M |
||||||||||
| Exceptional items by category |
||||||||||||
| Impairment of Potash assets 1 |
– | ( |
) | ( |
) | |||||||
| COVID-19 related costs |
( |
) | ( |
) | ||||||||
| |
|
|
|
|
|
|||||||
| Total |
( |
) | ( |
) | ( |
) | ||||||
| |
|
|
|
|
|
|||||||
| Attributable to non-controlling interests |
– | – | – | |||||||||
| Attributable to BHP shareholders |
( |
) | ( |
) | ( |
) | ||||||
| |
|
|
|
|
|
|||||||
1 |
The exceptional item reflects the impairment of tax losses originally expected to be recoverable against taxable profits from the Group’s Potash assets. The impairment is included in Discontinued operations as the entity with the losses transferred to Woodside and therefore the losses are no longer available to the Group. |
| Year ended 30 June 2020 |
Gross |
Tax |
Net |
|||||||||
US$M |
US$M |
US$M |
||||||||||
| Exceptional items by category |
||||||||||||
| COVID-19 related costs |
( |
) | ( |
) | ||||||||
| |
|
|
|
|
|
|||||||
| Total |
( |
) | ( |
) | ||||||||
| |
|
|
|
|
|
|||||||
| Attributable to non-controlling interests |
– | – | – | |||||||||
| Attributable to BHP shareholders |
( |
) | ( |
) | ||||||||
| |
|
|
|
|
|
|||||||
| Country of incorporation |
Principal activity |
Group’s interest |
||||||||||
| Significant subsidiaries |
2022 % |
2021 % |
||||||||||
| Coal |
||||||||||||
| BHP Mitsui Coal Pty Ltd 1 |
– |
|||||||||||
| Hunter Valley Energy Coal Pty Ltd |
||||||||||||
| Copper |
||||||||||||
| BHP Olympic Dam Corporation Pty Ltd |
||||||||||||
| Compañia Minera Cerro Colorado Limitada |
||||||||||||
| Minera Escondida Ltda 2 |
||||||||||||
| Minera Spence SA |
||||||||||||
| Iron Ore |
||||||||||||
| BHP Iron Ore (Jimblebar) Pty Ltd 3 |
||||||||||||
| BHP Iron Ore Pty Ltd |
||||||||||||
| BHP (Towage Service) Pty Ltd |
||||||||||||
| Marketing |
||||||||||||
| BHP Billiton Freight Singapore Pte Limited |
||||||||||||
| BHP Billiton Marketing AG |
||||||||||||
| BHP Billiton Marketing Asia Pte Ltd |
||||||||||||
| Group and Unallocated |
||||||||||||
| BHP Billiton Finance B.V. |
||||||||||||
| BHP Billiton Finance Limited |
||||||||||||
| BHP Billiton Finance (USA) Limited |
||||||||||||
| BHP Canada Inc. |
||||||||||||
| BHP Group Operations Pty Ltd |
||||||||||||
| BHP Nickel West Pty Ltd |
||||||||||||
| WMC Finance (USA) Limited |
||||||||||||
1 |
The divestment of BHP’s |
2 |
As the Group has the ability to direct the relevant activities at Minera Escondida Ltda, it has control over the entity. The assessment of the most relevant activity in this contractual arrangement is subject to judgement. The Group establishes the mine plan and the operating budget and has the ability to appoint the key management personnel, demonstrating that the Group has the existing rights to direct the relevant activities of Minera Escondida Ltda. |
3 |
The Group has an effective interest of |
Significant associates and joint ventures |
Country of incorporation/ principal place of business |
Associate or joint venture |
Principal activity |
Reporting date |
Ownership interest |
|||||||||||
2022 % |
2021 % |
|||||||||||||||
Cerrejón 1 |
Associate | Colombia |
December | – |
||||||||||||
Compañía Minera Antamina S.A. (Antamina) |
Associate | mining |
December | |||||||||||||
Samarco Mineração S.A. (Samarco) |
Joint venture | December | ||||||||||||||
1 |
At 30 June 2021, the Group’s investment in Cerrejón was classified as ‘Assets held for sale’ and payables owed to Cerrejón was classified as ‘Liabilities directly associated with the assets held for sale’. During FY2022 the Group received dividends of US$ |
Year ended 30 June 2022 US$M |
Investment in associates |
Investment in joint ventures |
Total equity accounted investments |
|||||||||
At the beginning of the financial year |
– |
|||||||||||
Loss from equity accounted investments, related impairments and expenses 1,2 |
( |
) |
( |
) | ||||||||
Investment in equity accounted investments |
– |
|||||||||||
Dividends received from equity accounted investments 3 |
( |
) |
– |
( |
) | |||||||
Divestment and demerger of equity accounted investments |
( |
) |
– |
( |
) | |||||||
Other |
– |
|||||||||||
At the end of the financial year |
– |
|||||||||||
1 |
US$( |
2 |
Includes share of operating losses of equity accounted investments from Discontinued operations of US$ |
3 |
Includes dividends received from equity accounted investments from Discontinued operations of US$ |
Associates |
Joint ventures |
|||||||||||||||||||
2022 US$M |
Antamina |
Individually immaterial 1 |
Samarco 2 |
Individually immaterial |
Total |
|||||||||||||||
Current assets |
3 |
|||||||||||||||||||
Non-current assets |
||||||||||||||||||||
Current liabilities |
( |
) |
( |
) 4 |
||||||||||||||||
Non-current liabilities |
( |
) |
( |
) |
||||||||||||||||
Net assets/(liabilities) – 100% |
( |
) |
||||||||||||||||||
Net assets/(liabilities) – Group share |
( |
) |
||||||||||||||||||
Adjustments to net assets related to accounting policy adjustments |
– |
5 |
||||||||||||||||||
Investment in Samarco |
– |
6 |
||||||||||||||||||
Impairment of the carrying value of the investment in Samarco |
– |
( |
) 7 |
|||||||||||||||||
Additional share of Samarco losses |
– |
8 |
||||||||||||||||||
Unrecognised losses |
– |
9 |
||||||||||||||||||
Carrying amount of investments accounted for using the equity method |
– |
– |
||||||||||||||||||
Revenue – 100% |
||||||||||||||||||||
Profit/(loss) from Continuing operations – 100% |
( |
) 10 |
||||||||||||||||||
Share of profit/(loss) of equity accounted investments |
( |
) 11 |
||||||||||||||||||
Impairment of the carrying value of the investment in Samarco |
– |
|||||||||||||||||||
Additional share of Samarco losses |
– |
|||||||||||||||||||
Fair value change on forward exchange derivatives |
– |
( |
) |
|||||||||||||||||
Unrecognised losses |
– |
( |
) 9 |
|||||||||||||||||
Profit/(loss) from equity accounted investments, related impairments and expenses |
( |
) |
( |
) |
– |
( |
) | |||||||||||||
Comprehensive income – 100% |
( |
) |
||||||||||||||||||
Share of comprehensive income/(loss) – Group share in equity accounted investments |
( |
) | ( |
) |
– |
( |
) | |||||||||||||
Dividends received from equity accounted investments |
– |
– |
||||||||||||||||||
Associates |
Joint ventures |
|||||||||||||||||||||||
| 2021 US$M Restated |
Antamina |
Cerrejón |
Individually immaterial 1 |
Samarco 2 |
Individually immaterial |
Total |
||||||||||||||||||
| Current assets |
– | 3 |
||||||||||||||||||||||
| Non-current assets |
– | |||||||||||||||||||||||
| Current liabilities |
( |
) | – | ( |
) 4 |
|||||||||||||||||||
| Non-current liabilities |
( |
) | – | ( |
) | |||||||||||||||||||
| |
|
|
|
|
|
|||||||||||||||||||
| Net assets/(liabilities) – 100% |
– | ( |
) | |||||||||||||||||||||
| |
|
|
|
|
|
|||||||||||||||||||
| Net assets/(liabilities) – Group share |
– | ( |
) | |||||||||||||||||||||
| Adjustments to net assets related to accounting policy adjustments |
– | – | 5 |
|||||||||||||||||||||
| Investment in Samarco |
– | – | 6 |
|||||||||||||||||||||
| Impairment of the carrying value of the investment in Samarco |
– | – | ( |
) 7 |
||||||||||||||||||||
| Additional share of Samarco losses |
– | – | 8 |
|||||||||||||||||||||
| Unrecognised losses |
– | – | 9 |
|||||||||||||||||||||
| |
|
|
|
|
|
|
|
|
|
|
|
|||||||||||||
| Carrying amount of investments accounted for using the equity method |
– | – | – | |||||||||||||||||||||
| |
|
|
|
|
|
|
|
|
|
|
|
|||||||||||||
| Revenue – 100% |
||||||||||||||||||||||||
| Profit/(loss) from Continuing operations – 100% |
( |
) | ( |
) 10 |
||||||||||||||||||||
| |
|
|
|
|
|
|
|
|
|
|
|
|||||||||||||
| Share of profit/(loss) of equity accounted investments |
( |
) | ( |
) 11 |
||||||||||||||||||||
| Impairment of the carrying value of the investment in Cerrejón |
– | ( |
) | – | ||||||||||||||||||||
| Impairment of the carrying value of the investment in Samarco |
– | – | ( |
) 7 |
||||||||||||||||||||
| Additional share of Samarco losses |
– | – | ||||||||||||||||||||||
| Fair value change on forward exchange derivatives |
– | – | ||||||||||||||||||||||
| Unrecognised losses |
– | – | ( |
) 9 |
||||||||||||||||||||
| |
|
|
|
|
|
|
|
|
|
|
|
|||||||||||||
| Profit/(loss) from equity accounted investments, related impairments and expenses |
( |
) | ( |
) | ( |
) | – | ( |
) | |||||||||||||||
| |
|
|
|
|
|
|
|
|
|
|
|
|||||||||||||
| Comprehensive income/(loss) – 100% |
( |
) | ( |
) | ||||||||||||||||||||
| |
|
|
|
|
|
|
|
|
|
|
|
|||||||||||||
| Share of comprehensive income/(loss) – Group share in equity accounted investments |
( |
) | ( |
) | ( |
) | – | ( |
) | |||||||||||||||
| |
|
|
|
|
|
|
|
|
|
|
|
|||||||||||||
| Dividends received from equity accounted investments |
– | – | ||||||||||||||||||||||
| |
|
|
|
|
|
|
|
|
|
|
|
|||||||||||||
Associates |
Joint ventures |
|||||||||||||||||||||||
| 2020 US$M Restated |
Antamina |
Cerrejón |
Individually immaterial |
Samarco 2 |
Individually immaterial |
Total |
||||||||||||||||||
| Revenue – 100% |
|
|||||||||||||||||||||||
| Profit/(loss) from Continuing operations – 100% |
( |
) | ( |
) 10 |
||||||||||||||||||||
| |
|
|
|
|
|
|
|
|
|
|
|
|||||||||||||
| Share of profit/(loss) of equity accounted investments |
( |
) | ( |
) 11 |
||||||||||||||||||||
| Impairment of the carrying value of the investment in Samarco |
– | – | ( |
) 7 |
||||||||||||||||||||
| Additional share of Samarco losses |
– | – | ||||||||||||||||||||||
| Unrecognised losses |
– | – | 9 |
|||||||||||||||||||||
| |
|
|
|
|
|
|
|
|
|
|
|
|||||||||||||
| Profit/(loss) from equity accounted investments, related impairments and expenses |
( |
) | ( |
) | ( |
) | – | ( |
) | |||||||||||||||
| |
|
|
|
|
|
|
|
|
|
|
|
|||||||||||||
| Comprehensive income/(loss) – 100% |
( |
) | ( |
) | ||||||||||||||||||||
| |
|
|
|
|
|
|
|
|
|
|
|
|||||||||||||
| Share of comprehensive income/(loss) – Group share in equity accounted investments |
( |
) | ( |
) | ( |
) | – | ( |
) | |||||||||||||||
| |
|
|
|
|
|
|
|
|
|
|
|
|||||||||||||
| Dividends received from equity accounted investments |
– | – | ||||||||||||||||||||||
| |
|
|
|
|
|
|
|
|
|
|
|
|||||||||||||
1 |
The unrecognised share of gain for the period was US$ million), which decreased the cumulative losses to US$ |
2 |
Refer to note 4 ‘Significant events – Samarco dam failure’ for further information regarding the financial impact of the Samarco dam failure in November 2015 on BHP Brasil’s share of Samarco’s losses. |
3 |
Includes cash and cash equivalents of US$ |
4 |
Includes current financial liabilities (excluding trade and other payables and provisions) of US$ |
5 |
Relates mainly to dividends declared by Samarco that remain unpaid at balance date and which, in accordance with the Group’s accounting policy, are recognised when received not receivable. |
6 |
Working capital funding provided to Samarco during the period is capitalised as part of the Group’s investments in joint ventures and disclosed as an impairment included within the Samarco impairment expense line item. |
7 |
In the year ended 30 June 2016 BHP Brasil adjusted its investment in Samarco to US$ |
8 |
BHP Brasil has recognised accumulated additional share of Samarco losses of US$( |
9 |
Share of Samarco’s losses for which BHP Brasil does not have an obligation to fund. |
10 |
Includes depreciation and amortisation of US$ 2020 : US$US$ ( |
11 |
Includes accounting policy adjustments mainly related to the removal of foreign exchange gains on excluded dividends payable. |
Group’s interest |
||||||||||||
Significant joint operations |
Country of operation |
Principal activity |
2022 % |
2021 % |
||||||||
Mt Goldsworthy 1 |
||||||||||||
Mt Newman 1 |
||||||||||||
Yandi 1 |
||||||||||||
Central Queensland Coal Associates |
||||||||||||
Atlantis 2 |
– |
|||||||||||
Bass Strait 2 |
– |
|||||||||||
Macedon 2 |
– |
|||||||||||
Mad Dog 2 |
– |
|||||||||||
North West Shelf 2 |
– |
|||||||||||
Pyrenees 2 |
– |
|||||||||||
ROD Integrated Development 2 |
– |
|||||||||||
Shenzi 2 |
– |
|||||||||||
Trinidad/Tobago 2 |
– |
|||||||||||
1 |
These contractual arrangements are controlled by the Group and do not meet the definition of joint operations. However, as they are formed by contractual arrangement and are not entities, the Group recognises its share of assets, liabilities, revenue and expenses arising from these arrangements. |
2 |
These joint operations formed part of the Group’s oil and gas portfolio that merged with Woodside on 1 June 2022. Refer to note 27 ‘Discontinued operations’ for details. |
Group’s share |
||||||||
2022 |
2021 |
|||||||
US$M |
US$M |
|||||||
Current assets |
||||||||
Non-current assets |
||||||||
Total assets 1 |
||||||||
| 1 |
While the Group is unrestricted in its ability to sell a share of its interest in these joint operations, it does not have the right to sell individual assets that are used in these joint operations without the unanimous consent of the other participants. The assets in these joint operations are also restricted to the extent that they are only available to be used by the joint operation itself and not by other operations of the Group. |
| • | All transactions to/from related parties are made at arm’s length, i.e. at normal market prices and rates and on normal commercial terms. |
| • | Outstanding balances at year-end are unsecured and settlement occurs in cash. Loan amounts owing from related parties represent secured loans made to associates and joint ventures under co-funding arrangements. Such loans are made on an arm’s length basis. |
| • |
| • |
| • | There were |
| • | Related party transactions with Samarco are described in note 4 ‘Significant events – Samarco dam failure’. |
Joint ventures |
Associates |
|||||||||||||||
2022 |
2021 |
2022 |
2021 |
|||||||||||||
US$M |
US$M |
US$M |
US$M |
|||||||||||||
Sales of goods/services |
– |
– | – |
– | ||||||||||||
Purchases of goods/services |
– |
– | ||||||||||||||
Interest income |
– |
– | ||||||||||||||
Interest expense |
– |
– | – | |||||||||||||
Dividends received |
– |
– | ||||||||||||||
Net loans made to/(repayments from) related parties |
– |
– | ( |
) |
( |
) | ||||||||||
Outstanding balances with related parties |
||||||||||||||||
Joint ventures |
Associates |
|||||||||||||||
2022 |
2021 |
2022 |
2021 |
|||||||||||||
US$M |
US$M |
US$M |
US$M |
|||||||||||||
Trade amounts owing to related parties |
– |
– | ||||||||||||||
Loan amounts owing to related parties |
– |
– | – |
|||||||||||||
Trade amounts owing from related parties |
– |
– | ||||||||||||||
Loan amounts owing from related parties |
– |
– | – |
|||||||||||||
2022 |
2021 |
|||||||
US$M |
US$M |
|||||||
| Associates and joint ventures 1 |
||||||||
| Subsidiaries and joint operations 1 |
||||||||
| |
|
|
|
|||||
| Total |
||||||||
| |
|
|
|
|||||
1 |
There are a number of matters, for which it is not possible at this time to provide a range of possible outcomes or a reliable estimate of potential future exposures, and for which no amounts have been included in the table above. |
Uncertain tax and royalty matters |
The Group is subject to a range of taxes and royalties across many jurisdictions, the application of which is uncertain in some regards. Changes in tax law, changes in interpretation of tax law, periodic challenges and disagreements with tax authorities, and legal proceedings result in uncertainty of the outcome of the application of taxes and royalties to the Group’s business. Areas of uncertainty at reporting date include the application of taxes and royalties to the Group’s cross-border operations and transactions. To the extent uncertain tax and royalty matters give rise to a contingent liability, an estimate of the potential liability is included within the table above, where it is capable of reliable measurement. | |
Samarco contingent liabilities |
The table above includes contingent liabilities related to the Group’s equity accounted investment in Samarco to the extent they are capable of reliable measurement. Details of contingent liabilities related to Samarco are disclosed in note 4 ‘Significant events – Samarco dam failure’. | |
| Divestments and demergers |
Where the Group divests or demerges entities, it is generally agreed to provide certain indemnities to the acquiring or demerged entity. Such indemnities include those provided as part of the demerger of South 32 Ltd in May 2015, divestment of Group’s Onshore US assets in September 2018 and October 2018, divestment of BMC in May 2022 and the merger of the Group’s Petroleum business with Woodside in June 2022. No material claims have been made pursuant to these indemnities as at 30 June 2022. | |
2022 |
2021 |
2020 |
||||||||||
US$M |
US$M |
US$M |
||||||||||
| Fees payable to the Group’s auditors for assurance services |
||||||||||||
| Audit of the Group’s Annual Report |
||||||||||||
| Audit of the accounts of subsidiaries, joint ventures and associates |
||||||||||||
| Audit-related assurance services required by legislation to be provided by the auditor |
||||||||||||
| Other assurance and agreed-upon procedures under legislation or contractual arrangements |
||||||||||||
| |
|
|
|
|
|
|||||||
| Total assurance services |
||||||||||||
| |
|
|
|
|
|
|||||||
| Fees payable to the Group’s auditors for non-assurance services |
||||||||||||
| Other services |
– | |||||||||||
| |
|
|
|
|
|
|||||||
| Total other services |
– | |||||||||||
| |
|
|
|
|
|
|||||||
| Total fees |
||||||||||||
| |
|
|
|
|
|
|||||||
Carrying value of property, plant and equipment | ||
Description of the Matter |
As disclosed in Note 11 to the consolidated financial statements the Company recorded US$61,295 million in property plant and equipment as of 30 June 2022. The Company performs an assessment of indicators of impairment and impairment reversal for all cash generating units (CGU) at the end of each reporting period. Auditing management’s assessment of indicators of impairment and impairment reversal was complex due to the high degree of estimation uncertainty in forecasting the future cash flows for each CGU. Specifically, the indicators of impairment or impairment reversal and forecasted cash flows are sensitive to changes in significant assumptions, such as forecast commodity prices, reserve quantities, discount rates and the possible impacts related to climate change and the transition to a low carbon economy, which includes carbon price assumptions and the Company’s operational emissions reduction strategy. | |
How We Addressed the Matter in Our Audit |
We obtained an understanding, evaluated the design, and tested the operating effectiveness of the controls over the Company’s process to identify indicators of impairment or impairment reversal. We performed an analysis for indicators of impairment and impairment reversal. Our procedures involved assessing the key inputs such as forecast commodity prices, reserve quantities, discount rates and the impact of climate change and the transition to a low carbon economy used in the assessment of indicators of impairment or impairment reversal. We involved our valuation and climate change specialists to assist in assessing the reasonableness of commodity prices by comparing the forecasted commodity and carbon price assumptions to analyst and broker forecasts and those used by other market participants. In addition, our valuation specialists assisted in testing the discount rates used, including a comparison to external market data and evaluating whether the valuation methodology used was consistent with industry practice. To test the reserve quantities, we examined the information provided by the Company’s experts and we involved our mining reserve specialists to assist in the assessment of the reserve estimation methodology against the relevant industry and regulatory guidance. With the assistance of our climate change specialists, we tested that the Company’s forecast cash flows incorporated the Company’s operational emissions reduction strategy. In addition, we assessed the competence, qualifications, and objectivity of management’s internal and external specialists. Finally, we assessed the adequacy of the disclosures within Notes 11 and 13 of the consolidated financial statements. | |
Closure and rehabilitation provisions | ||
Description of the Matter |
As disclosed in Note 15 to the consolidated financial statements, the Company recorded US$8,689 million in closure and rehabilitation provisions as at 30 June 2022. Provisions for closure and rehabilitation are recognised by the Company when there is a present legal or constructive obligation, it is more likely than not that an outflow of resources will be required to settle the obligation, and the amount can be reliably estimated. The Company estimates the individual site provisions using the expected value of future cash flows required to close and rehabilitate the relevant site using current restoration standards and techniques and taking into account risks and uncertainties. Individual site provisions are discounted to the present value using currency specific risk-free discount rates aligned to the estimated timing of cash outflows. Auditing management’s closure and rehabilitation provisions was complex and highly judgemental due to the significant estimation uncertainty within the key assumptions. Specifically, there was significant judgement in determining the expected life of sites including the impact of the Company’s climate related strategies, estimated cost and extent of rehabilitation activities, timing of activities, and the discount rates used. As a result of these inputs the provisions have a significant estimation uncertainty and a wide range of potential outcomes. | |
How We Addressed the Matter in Our Audit |
We obtained an understanding, evaluated the design and tested the operating effectiveness of controls over the Company’s closure and rehabilitation provision estimate process. Specifically, our procedures involved testing the controls around the significant assumptions used within the estimate, such as the estimated cost and extent of rehabilitation activities, in addition to the timing of activities. Our procedures included evaluation of the Company’s process for identifying legal and regulatory obligations for closure and rehabilitation, and the completeness and accuracy of data used within management’s estimate. We tested that the future rehabilitation costs were consistent with the closure plans prepared by management’s internal specialists. We compared the expected life of sites and resulting timing of closure activities used in the provision to the life of asset plans prepared by management’s internal specialists. With the assistance of our environmental specialists, we evaluated a sample of closure and rehabilitation provisions for operating and closed sites. Our testing included evaluating the closure and rehabilitation plan based on the relevant legal and regulatory requirements. In addition, we compared the timing of future cash flows and cost estimates against the closure and rehabilitation plan, environmental studies, and industrial practices. We evaluated the discount rates used against market data. With the assistance of our climate change and environmental specialists, we evaluated the Company’s consideration of physical risks, estimates related to post closure monitoring and maintenance and the timing of closure activities impacted by mine operating lives within the closure and rehabilitation provision. We tested the mathematical accuracy of the closure and rehabilitation provision calculations and assessed the competence, qualifications, and objectivity of management’s internal and external specialists. Finally, we assessed the adequacy of the disclosures within Note 15 to the consolidated financial statements. | |
Samarco dam failure provisions recognised, including the Germano dam decommissioning and contingent liabilities disclosed | ||
Description of the Matter |
As described in Notes 3, 4, and 32 to the consolidated financial statements, the Company recorded a loss of US$1,032 million (pre-tax) for the year ended 30 June 2022 and recognised provisions of US$3,237 million for the Samarco dam failure and US$184 million for the Germano dam decommissioning as of 30 June 2022. The Company recognises a provision when it has a present obligation, and an outflow of economic resources is probable, and the obligation can be reliably measured. Auditing management’s estimate of the Samarco dam failure provisions and contingent liabilities disclosure was complex and highly judgemental due to the significant estimation uncertainty in determining the measurement and completeness of future cash outflows, as well as the extent of the Company’s legal obligations to fund the costs under the Framework and Governance Agreements. There was significant judgement in determining the nature and extent of remediation activities, the cost estimates for remediation and the number and categorisation of impacted people entitled to compensation. As a result of these inputs the provision has a significant estimation uncertainty and a wide range of potential outcomes. | |
How We Addressed the Matter in Our Audit |
We obtained an understanding, evaluated the design and tested the operating effectiveness of the Company’s controls in determining the Samarco dam failure provisions. Specifically, we tested management’s controls over the significant assumptions as described above and the completeness and accuracy of data used within management’s estimates. To test the provisions, we performed audit procedures that included, amongst others, assessing methodologies and testing the significant assumptions discussed above and underlying data used by the Company in its analysis. We tested a sample of cost estimates used to source documents such as court decisions outlining compensation levels. We compared the nature and extent of activities included in the forecasted cash flows to the Framework Agreement. We also tested the mathematical accuracy of the models used to calculate the provisions. To assess management’s ability to forecast, we compared the prior years forecasted cash flows to actual results and understood key differences. To assess the status of claims we held discussions with internal and external legal counsel regarding ongoing Samarco dam failure litigation matters. In addition, we obtained legal confirmations and inspected communications with the Company’s external legal counsel. We evaluated the competence, qualifications and objectivity of the Company’s experts who assisted management in estimating the provision by considering the scope of work, their professional qualifications and remuneration structure. We also assessed the adequacy and completeness of the disclosures within Note 4 and 32 to the consolidated financial statements. | |
(a) |
in the Directors’ opinion the Financial Statements and notes are in accordance with the Australian Corporations Act 2001 (Cth), including: |
(i) |
complying with the applicable Accounting Standards and the Australian Corporations Regulations 2001 (Cth); and |
(ii) |
giving a true and fair view of the assets, liabilities, financial position and profit or loss of BHP Group Limited and the Group as at 30 June 2022 and of their performance for the year ended 30 June 2022 |
(b) |
the Financial Statements also comply with International Financial Reporting Standards, as disclosed in the Basis of preparation to the Financial Statements |
(c) |
to the best of the Directors’ knowledge, the management report (comprising the Operating and Financial Review and Directors’ Report) includes a fair review of the development and performance of the business and the position of the Group and the undertakings included in the consolidation taken as a whole, together with a description of the principal risks and uncertainties that the Group faces |
(d) |
in the Directors’ opinion there are reasonable grounds to believe that BHP Group Limited will be able to pay its debts as and when they become due and payable |
(e) |
as at the date of this declaration, there are reasonable grounds to believe that BHP Group Limited and each of the Closed Group entities identified in Exhibit 8.1 – List of Subsidiaries will be able to meet any liabilities to which they are, or may become, subject because of the Deed of Cross Guarantee between BHP Group Limited and those group entities pursuant to ASIC Corporations (Wholly-owned Companies) Instrument 2016/785 |
(f) |
the Directors have been given the declarations required by Section 295A of the Australian Corporations Act 2001 (Cth) from the Chief Executive Officer and Chief Financial Officer for the financial year ended 30 June 2022 |