EXHIBIT 13
Annual Report 2021 Moving forward… together First First Financial Bancorp
2017 2018 2019 20212020 Net Income (dollars in millions) $172.6 $155.8 $96.8 $198.1 $205.2 2018 $8.8 2017 $6.0 2019 $9.2 2020 $9.9Total Loans (dollars in billions) 2021 $9.3 2018 $10.1 2017 $6.9 2019 $10.2 2020 $12.2 Total Deposits (dollars in billions) 2021 $12.9 2018 $14.0 2017 $8.9 2019 $14.5 2020 $16.0 Total Assets (dollars in billions) 2021 $16.3 2017 $1.56 2020 $1.59 2018 $1.93 2019 $2.00 Diluted Earnings Per Share 2021 $2.14 9.08% 20212017 2018 2019 2020 7.02% 10.78% 9.85% 9.11% Return On Equity 1.00% 20202017 1.12% 2018 1.37% 2019 1.39% Return On Assets 1.28% 2021 Archie M. Brown President & Chief Executive Officer
Dear Fellow Shareholders, As I look back on 2020, I recall how routinely the year began, as we prepared the previous year’s annual report to shareholders. We were coming off a strong 2019 performance and had developed solid strategic and execution plans that would set the direction for the coming 12 months. Or so we thought. At that same time, a novel coronavirus was migrating from country to country. Over the course of weeks, a health crisis became a pandemic, and economic disruption evolved into a global recession. By March, we launched our crisis management procedures, unaware that those conditions would remain the standard for the balance of the year. Everything that we once took for granted seemed to vanish overnight – daily commutes, the workplace, personal interactions, even handshakes and casual conversations. Everything seemed to change, except First Financial Bank’s commitment to our clients, communities, and each other. The pandemic forced us to limit access to our banking centers, so we adapted to serve our clients in creative ways, with a combination of in-person, remote, and digital solutions. We made tens of thousands of calls to check on the personal and financial wellbeing of our clients, and created relief programs to help those impacted by sudden financial challenges. These efforts complemented the swift action taken by the Federal Reserve and our national, state, and local governments. Although the impact of this health crisis was felt throughout the economy, our financial systems were strong and moved quickly to lessen the immediate impact of the pandemic. Much needed stimulus came in the form of a reduction in interest rates, the passing of the CARES Act, and the establishment of the Small Business Administration’s Payroll Protection Program, to name a few. Implementing these programs was challenging, complicated by the fact that we shifted 90 percent of our associates to remote work arrangements. This tested the mettle of our technology teams, our networks, and the ability of our associates to reimagine and redesign everyday tasks and processes on the fly. Not surprisingly, our teams demonstrated their innovation and implemented new programs without sacrificing the quality of their work and our commitment to customer service. Throughout 2020, First Financial produced solid earnings as a result of record revenue, disciplined credit and expense management, historic production from key lines of business like our Mortgage and Bannockburn Global Forex divisions, record Commercial and Industrial loan production, and assets under management in our Wealth Management division. Despite pandemic-related headwinds, our careful management of resources positions us well as we rebound from this historic event. Looking to 2021, we will focus on leveraging the goodwill we established over the past year, growing core client relationships, building greater confidence and trust with our clients, and becoming a more integral part of their day-to-day financial activities. We want our associates to thrive in all aspects of their lives, promoting positive outcomes for themselves and our company. To accomplish this, we are creating a more engaged workplace, one that celebrates our diversity and addresses the complete wellbeing of our associates. As always, we will continue to advocate for our clients, make a difference in our communities, break traditional industry norms, improve functionality, be good corporate stewards, and diligently manage credit. Great challenges reveal true character. Many of the individual acts of adaptation, commitment, and selflessness on the part of our First Financial associates will never be known. However, the willingness to work long hours at night, on weekends, under incredible deadlines and during unparalleled times is, to me, the epitome of leadership. Our associates gave their all for those in need. This is what makes me so proud of the First Financial team, and so honored to present you with the results of this incomparable year. Archie M. Brown President & Chief Executive Officer “ Despite pandemic-related headwinds, our careful management of resources positions us well as we rebound from this historic event.
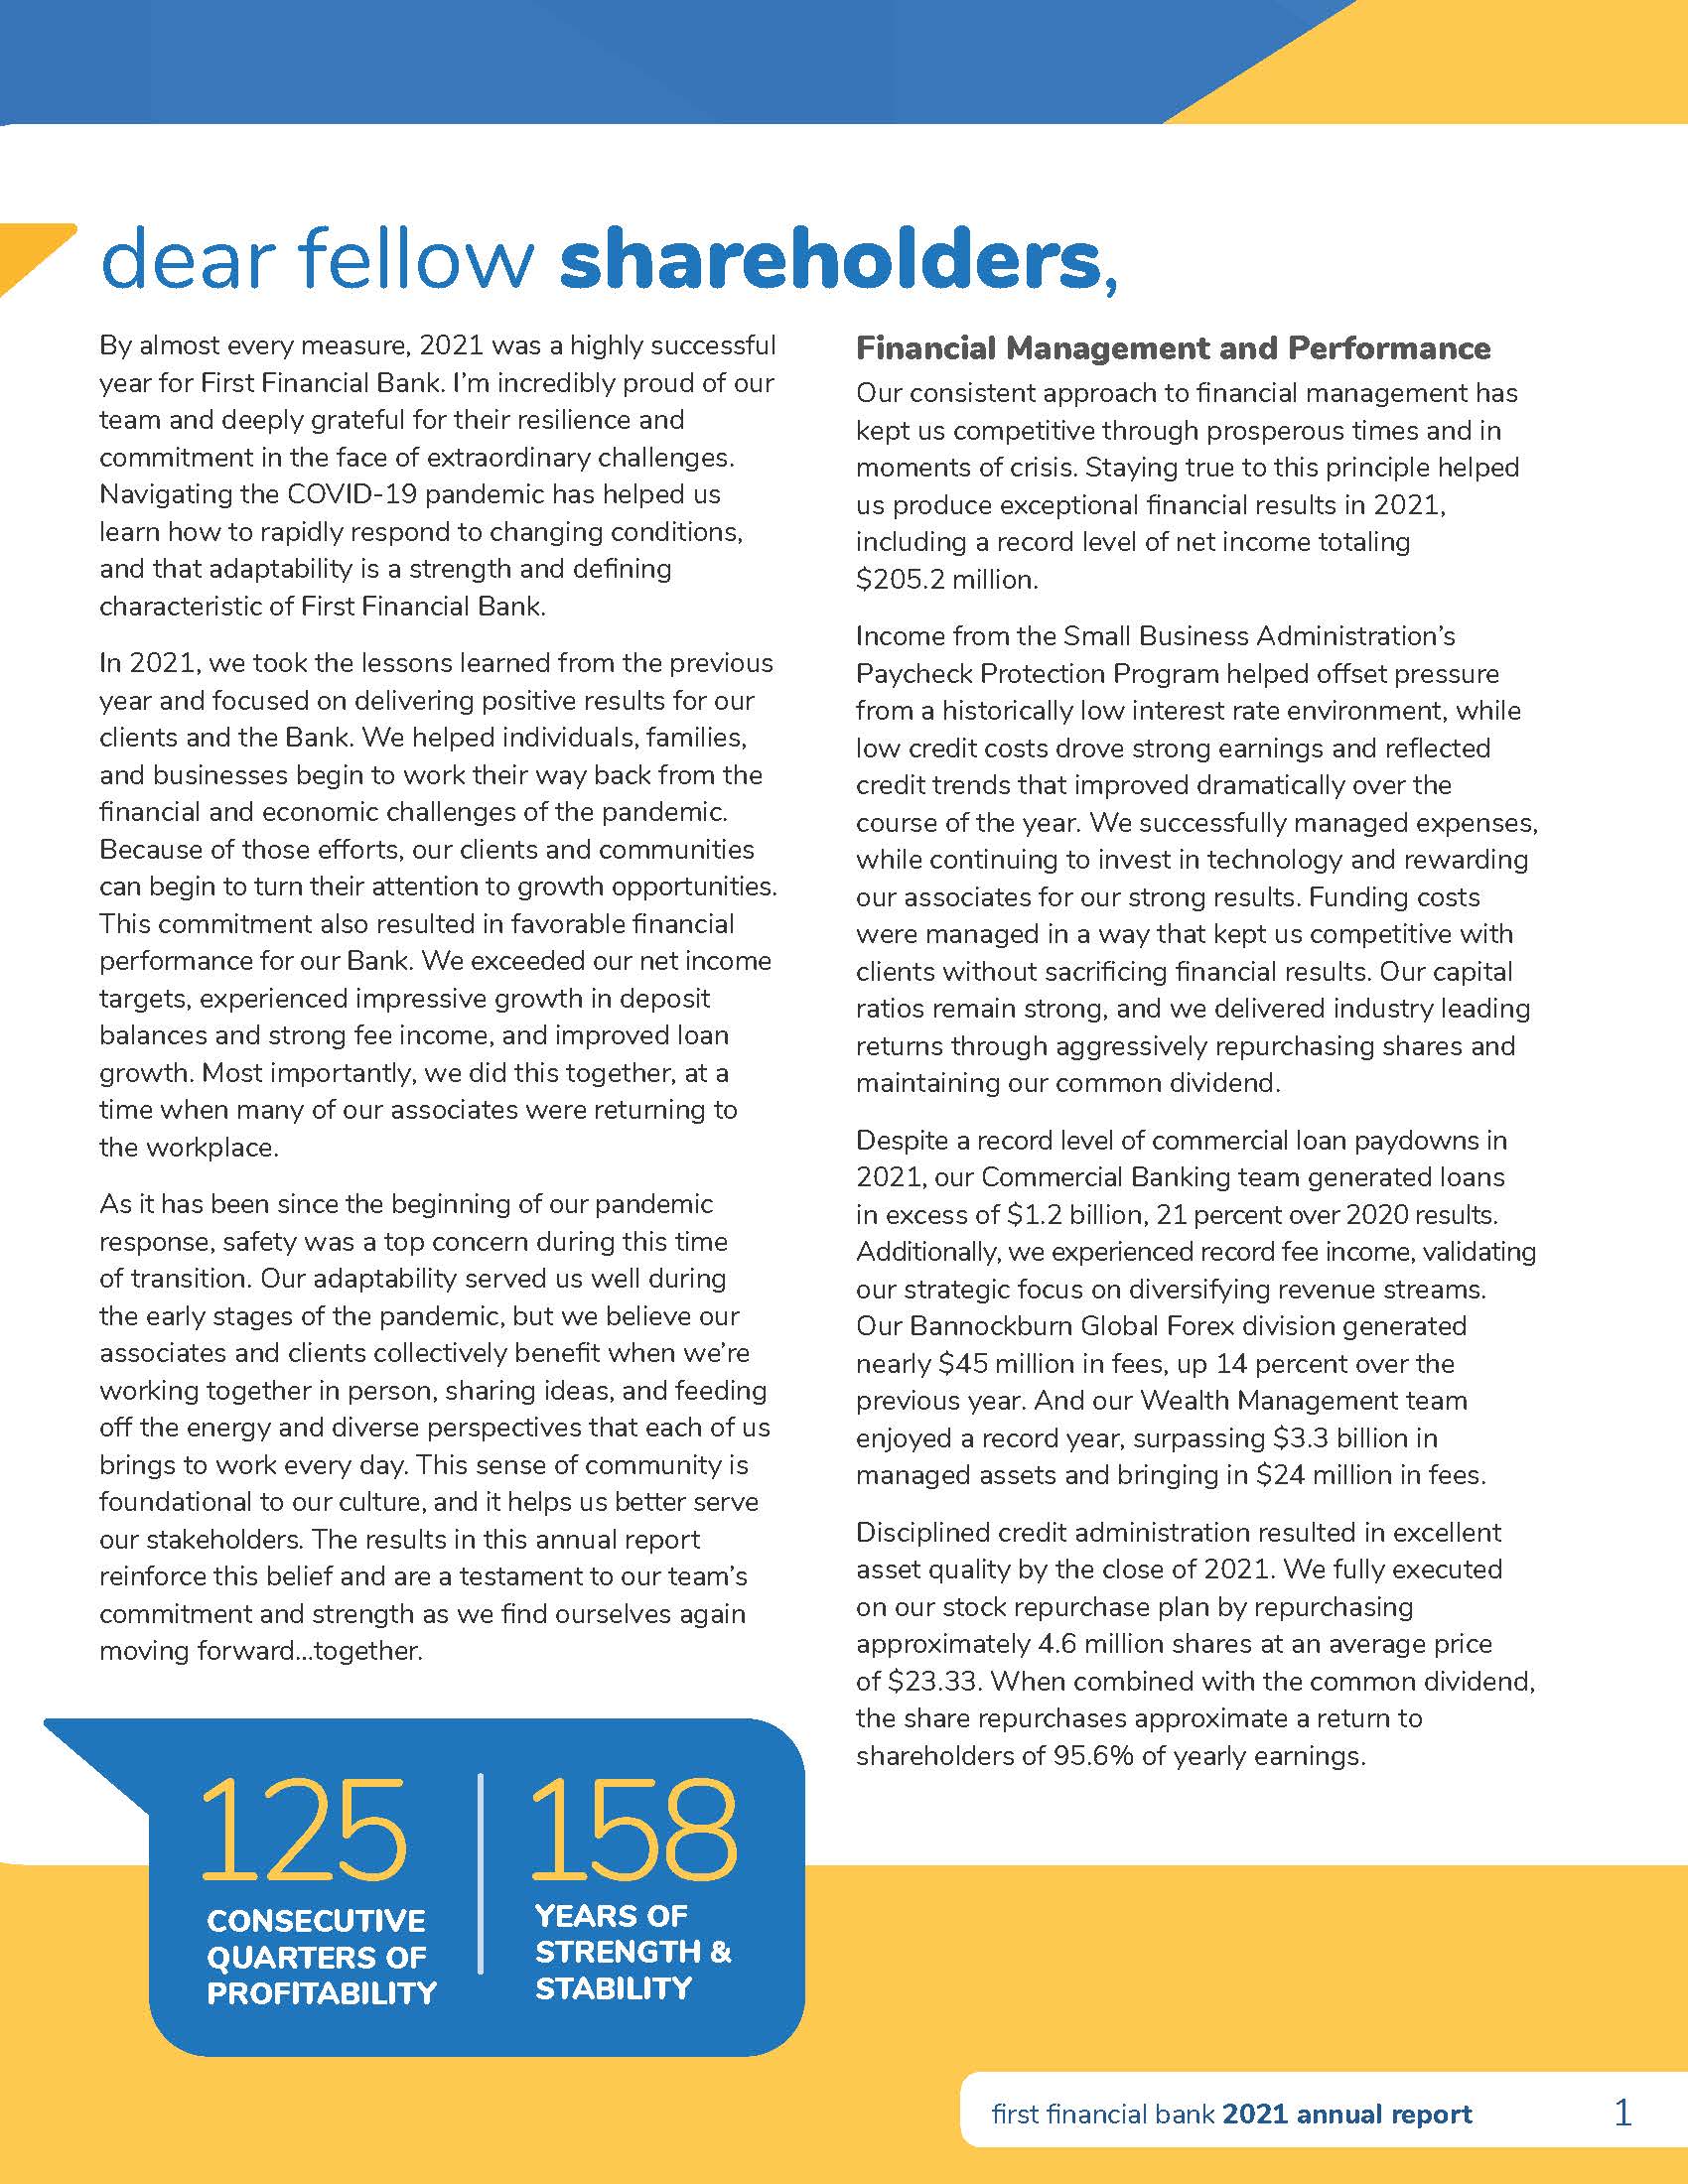
dear fellow shareholders, By almost every measure, 2021 was a highly successful year for First Financial Bank. I’m incredibly proud of our team and deeply grateful for their resilience and commitment in the face of extraordinary challenges. Navigating the COVID-19 pandemic has helped us learn how to rapidly respond to changing conditions, and that adaptability is a strength and defining characteristic of First Financial Bank. In 2021, we took the lessons learned from the previous year and focused on delivering positive results for our clients and the Bank. We helped individuals, families, and businesses begin to work their way back from the financial and economic challenges of the pandemic. Because of those efforts, our clients and communities can begin to turn their attention to growth opportunities. This commitment also resulted in favorable financial performance for our Bank. We exceeded our net income targets, experienced impressive growth in deposit balances and strong fee income, and improved loan growth. Most importantly, we did this together, at a time when many of our associates were returning to the workplace. As it has been since the beginning of our pandemic response, safety was a top concern during this time of transition. Our adaptability served us well during the early stages of the pandemic, but we believe our associates and clients collectively benefit when we’re working together in person, sharing ideas, and feeding off the energy and diverse perspectives that each of us brings to work every day. This sense of community is foundational to our culture, and it helps us better serve our stakeholders. The results in this annual report reinforce this belief and are a testament to our team’s commitment and strength as we find ourselves again moving forward…together. Financial Management and Performance Our consistent approach to financial management has kept us competitive through prosperous times and in moments of crisis. Staying true to this principle helped us produce exceptional financial results in 2021, including a record level of net income totaling $205.2 million. Income from the Small Business Administration’s Paycheck Protection Program helped offset pressure from a historically low interest rate environment, while low credit costs drove strong earnings and reflected credit trends that improved dramatically over the course of the year. We successfully managed expenses, while continuing to invest in technology and rewarding our associates for our strong results. Funding costs were managed in a way that kept us competitive with clients without sacrificing financial results. Our capital ratios remain strong, and we delivered industry leading returns through aggressively repurchasing shares and maintaining our common dividend. Despite a record level of commercial loan paydowns in 2021, our Commercial Banking team generated loans in excess of $1.2 billion, 21 percent over 2020 results. Additionally, we experienced record fee income, validating our strategic focus on diversifying revenue streams. Our Bannockburn Global Forex division generated nearly $45 million in fees, up 14 percent over the previous year. And our Wealth Management team enjoyed a record year, surpassing $3.3 billion in managed assets and bringing in $24 million in fees. Disciplined credit administration resulted in excellent asset quality by the close of 2021. We fully executed on our stock repurchase plan by repurchasing approximately 4.6 million shares at an average price of $23.33. When combined with the common dividend, the share repurchases approximate a return to shareholders of 95.6% of yearly earnings. 125 CONSECUTIVE QUARTERS OF PROFITABILITY 158 YEARS OF STRENGTH & STABILITY 1first financial bank 2021 annual report
First Financial Bancorp 2021 Annual Report 1
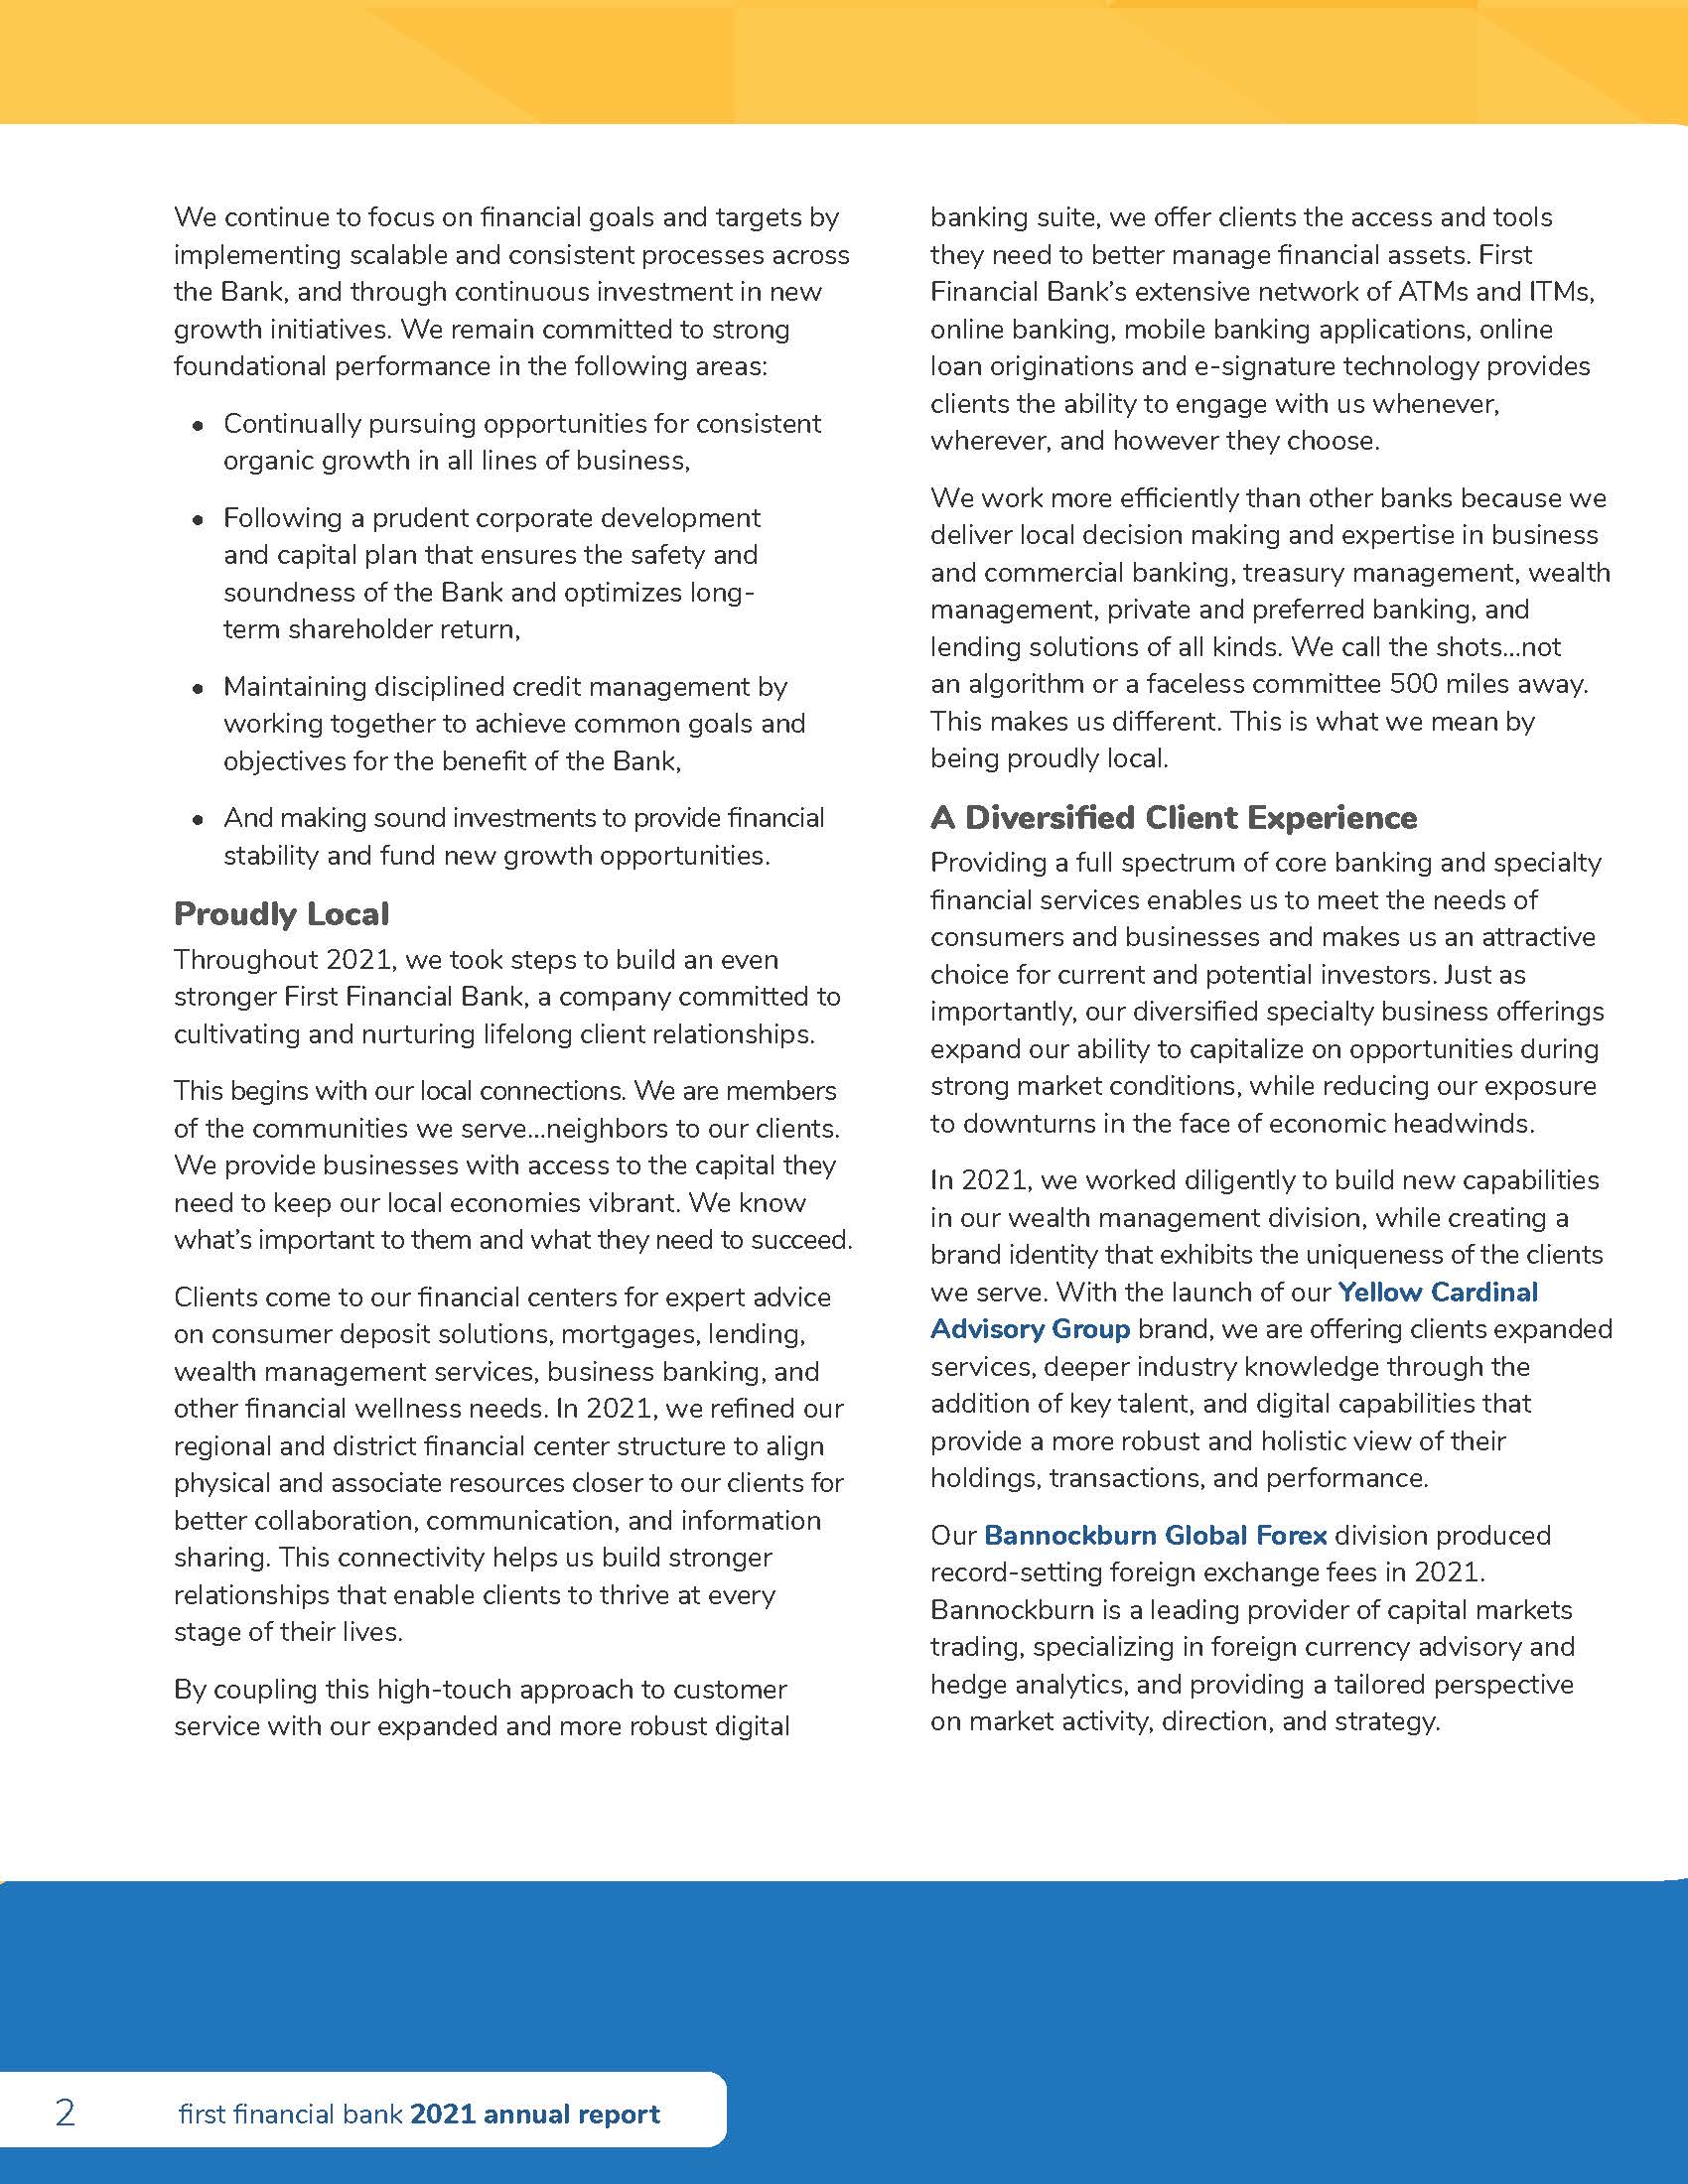
We continue to focus on financial goals and targets by implementing scalable and consistent processes across the Bank, and through continuous investment in new growth initiatives. We remain committed to strong foundational performance in the following areas: • Continually pursuing opportunities for consistent organic growth in all lines of business, • Following a prudent corporate development and capital plan that ensures the safety and soundness of the Bank and optimizes long- term shareholder return, • Maintaining disciplined credit management by working together to achieve common goals and objectives for the benefit of the Bank, • And making sound investments to provide financial stability and fund new growth opportunities. Proudly Local Throughout 2021, we took steps to build an even stronger First Financial Bank, a company committed to cultivating and nurturing lifelong client relationships. This begins with our local connections. We are members of the communities we serve…neighbors to our clients. We provide businesses with access to the capital they need to keep our local economies vibrant. We know what’s important to them and what they need to succeed. Clients come to our financial centers for expert advice on consumer deposit solutions, mortgages, lending, wealth management services, business banking, and other financial wellness needs. In 2021, we refined our regional and district financial center structure to align physical and associate resources closer to our clients for better collaboration, communication, and information sharing. This connectivity helps us build stronger relationships that enable clients to thrive at every stage of their lives. By coupling this high-touch approach to customer service with our expanded and more robust digital banking suite, we offer clients the access and tools they need to better manage financial assets. First Financial Bank’s extensive network of ATMs and ITMs, online banking, mobile banking applications, online loan originations and e-signature technology provides clients the ability to engage with us whenever, wherever, and however they choose. We work more efficiently than other banks because we deliver local decision making and expertise in business and commercial banking, treasury management, wealth management, private and preferred banking, and lending solutions of all kinds. We call the shots…not an algorithm or a faceless committee 500 miles away. This makes us different. This is what we mean by being proudly local. A Diversified Client Experience Providing a full spectrum of core banking and specialty financial services enables us to meet the needs of consumers and businesses and makes us an attractive choice for current and potential investors. Just as importantly, our diversified specialty business offerings expand our ability to capitalize on opportunities during strong market conditions, while reducing our exposure to downturns in the face of economic headwinds. In 2021, we worked diligently to build new capabilities in our wealth management division, while creating a brand identity that exhibits the uniqueness of the clients we serve. With the launch of our Yellow Cardinal Advisory Group brand, we are offering clients expanded services, deeper industry knowledge through the addition of key talent, and digital capabilities that provide a more robust and holistic view of their holdings, transactions, and performance. Our Bannockburn Global Forex division produced record-setting foreign exchange fees in 2021. Bannockburn is a leading provider of capital markets trading, specializing in foreign currency advisory and hedge analytics, and providing a tailored perspective on market activity, direction, and strategy. 2 first financial bank 2021 annual report
2 First Financial Bancorp 2021 Annual Report

access to capital for businesses financial centers extensive network local connections deposit solutions expert advice mortgages & lending wealth management business banking ATMs & ITMs online banking mobile banking online loan origination Yellow Cardinal Advisory Group A Yellow Cardinal is one of the rarest occurrences in nature – literally one-in-a-million. Unique, just like you. With comprehensive wealth solutions for you, your family, and your business, we’re here to support the goals that set you apart. From the big picture to the most subtle detail – let us help you live your one-in-a-million life. Upstart Referral Network FFB joined the Upstart Referral Network to help deepen our knowledge of digital lending, and to increase lending opportunities for borrowers in the unsecured lending market. Upstart has been introduced throughout our Ohio, Kentucky, Indiana, and Illinois footprint, resulting in nearly $44 million in loan originations in 2021. 3
First Financial Bancorp 2021 Annual Report 3
FFB earned the highest overall rating of Outstanding from the Federal Reserve Board for our performance under the Community Reinvestment Act, based on our lending, investment and service levels from 2017-2020. Summit Funding Group • Fourth largest independent U.S. equipment leasing firm • Operates in all 50 states and in Canada • Exceptional industry reputation and brand recognition 4
4 First Financial Bancorp 2021 Annual Report

We also continue to explore opportunities to add market share and depth of services through mergers and strategic acquisitions. These opportunities could drive immediate growth in market share, financial resources and expertise, product and service capabilities, and geographic expansion while staying true to our corporate values. We took advantage of one such opportunity in December of 2021 with the acquisition of Summit Funding Group, the fourth largest independent equipment financing platform in the United States. As an independent subsidiary of First Financial, Summit Funding offers high-quality full payout and residual- based equipment leases through its two operating divisions – Middle Market and Vendor Finance. First Financial’s scale and product breadth, combined with Summit’s extensive leasing capabilities and leading nationwide position in the equipment finance sector, will enable both organizations to capitalize on significant growth opportunities. Committed to Our Associates The past year has underscored the importance of creating a workplace environment well suited to attract and retain talented people. There is a direct correlation between a person’s sense of wellbeing and their level of engagement in the workplace. We believe that when you bring “your best self” to work and experience support and respect from peers, you are more likely to succeed and remain engaged. As a result, we’ve made investments in leadership and development programs to provide our managers and associates with the tools and insights to help everyone on our team reach new levels of success and happiness. We’ve placed a premium on the development of our associates by helping them sharpen their existing abilities while providing access to career training and guidance to grow personally and professionally. By offering insightful learning and development resources, along with manager and leader training programs, we’re helping our team build skills and relationships to guide each associate along their respective career paths. We have established a Mentoring Program that is designed to empower associates of all experience levels to network across our organization and work in a mentor/mentee partnership to foster additional development goals. By connecting associates with internal career professionals who provide direction, development, coaching and feedback, we’re tapping into the diverse talents and expertise of our leaders to help create a stronger workforce. Committed to Our Communities First Financial exists to be a positive influence on our clients and communities alike. This is demonstrated by our commitment to serving all customers across the income spectrum, and by the generosity our associates display through the gifts of their time and treasure. We received the highest overall rating of Outstanding in 2021 from the Federal Reserve Board for our performance under the Community Reinvestment Act. We take great pride in this rating and the attributes for which we were recognized: • Our excellent record of serving the credit needs of low-income individuals and areas and very small businesses, • Acting as a leader in providing an excellent level of qualified community development investments and donations, • And for providing Retail Banking services that are accessible to neighborhoods and people from all income levels and businesses of different revenue sizes. We developed Your Money, Own It – a financial education program featuring webinars and in-person classes presented by First Financial associates. Through classes and self-guided learning tools, we help our communities better understand the fundamentals of personal money management, with topics on budgeting, home ownership, maximizing credit scores, paying down debt, protecting your identity, and retirement to name a few. The best part? All Your Money, Own It webinars and classes are totally free. 5first financial bank 2021 annual report
Our 2021 Fir
First Financial Bancorp 2021 Annual Report 5
The First Financial Foundation was established to help support programs and organizations that enhance and develop the communities in which we do business. In 2021, the First Financial Foundation contributed more than $2.2 million to our communities, with a particular focus on neighborhood development, workforce development and education, and culture and the arts. And our associates stepped up in heroic fashion in 2021 with direct support of our communities and neighbors. Our United Way Associate Giving Campaign was our most successful to date. More than 95 percent of First Financial associates pledged nearly $742,000 in support of United Way and its agencies throughout our communities. And, despite pandemic limitations, we logged nearly 12,000 volunteer hours this year, proving that we are truly woven into the communities we serve. Details of these efforts are chronicled in our 2020 Community Development report, which can be found on our website at www.bankatfirst.com. Corporate Responsibility Effective corporate social responsibility requires focused attention to an organization’s impact on its stakeholders. This year, we announced the appointment of Roddell McCullough to the newly created role of Chief Corporate Responsibility Officer. Roddell is the first person to serve in this position for the Bank and will lead our corporate responsibility strategy, focusing on community development; corporate governance; diversity, equity and inclusion; and sustainability. First Financial’s Diversity, Equity and Inclusion Program was developed in 2020 to further our goal of serving our communities, understanding needs, and making lives better. In 2021, 10 associates were selected as members of our first Diversity Council, which is responsible for bring our DEI plans to life. One highly successful initiative developed by the Diversity Council was our Unconscious Bias Training program, which had more than 90 percent participation from our associates. First Financial’s Supplier Diversity Program continues to provide greater opportunities for businesses that are owned by women, veterans, disabled persons, and minority members of our communities. We exceeded our goal of achieving 10 percent of our sourceable spending with diverse vendors in every quarter during 2021. As I reflect on these accomplishments, I am both proud and profoundly humbled by the level of commitment that was necessary to deliver these results. Behind this list of accomplishments are incredible efforts that were made by individuals and teams from every part of our company. Together, we moved First Financial Bank in a positive direction during 2021. I’m looking forward to the opportunities that are ahead of us as we build on these successes in 2022. Bank On Certification First Financial’s NoWorry Checking has received national Bank On certification from the Cities for Financial Empowerment (CFE) Fund for meeting Bank On National Account Standards for 2021- 2022. These standards require over 25 features for safe and affordable consumer transaction accounts. Archie M. Brown President & Chief Executive Officer 6 first financial bank 2021 annual report
6 First Financial Bancorp 2021 Annual Report
First Financial Bancorp 2021 Annual Report 7

leadership Board of Directors Claude E. Davis Board Chair, First Financial Bancorp President, Brixey and Meyer Capital William G. Barron Past Chairman and President William G. Barron Enterprises Vincent A. Berta Lead Independent Director Board of Directors of First Financial Bancorp President and Managing Director Covington Capital, LLC Cynthia O. Booth President and Chief Executive Officer COBCO Enterprises, LLC Archie M. Brown President and Chief Executive Officer First Financial Bancorp and First Financial Bank Corinne R. Finnerty Principal McConnell Finnerty PC Susan L. Knust Owner and President Omega Warehouse Services K.P. Properties William J. Kramer Vice President of Operations Valco Industries, Inc. John T. Neighbours Senior Advisor Celerant Capital Thomas M. O’Brien Founder of Simpactful Consulting Maribeth S. Rahe President and Chief Executive Officer Fort Washington Investment Advisors, Inc. Senior Management Archie M. Brown President and Chief Executive Officer James M. Anderson Chief Financial Officer Richard S. Dennen Chief Corporate Banking Officer John M. Gavigan Chief Operating Officer Gregory A. Harris President, Wealth Management & Affluent Banking William R. Harrod Chief Credit Officer Amanda N. Neeley Chief Consumer Banking & Strategy Officer James R. Shank Chief Internal Auditor Karen B. Woods General Counsel and Chief Risk Officer 8
8 First Financial Bancorp 2021 Annual Report
| | | | | | | | | | | | | | | | | | | | |
| FINANCIAL HIGHLIGHTS |
| | | | | | |
| (Dollars in thousands, except per share data) | | 2021 | | 2020 | | % Change |
| Earnings | | | | | | |
| Net interest income | | $ | 452,118 | | | $ | 456,511 | | | (1.0) | % |
| Net income | | 205,160 | | | 155,810 | | | 31.7 | % |
| | | | | | |
| Per Share | | | | | | |
| Net income per common share-basic | | $ | 2.16 | | | $ | 1.60 | | | 35.0 | % |
| Net income per common share-diluted | | 2.14 | | | 1.59 | | | 34.6 | % |
| Cash dividends declared per common share | | 0.92 | | | 0.92 | | | 0.0 | % |
| Tangible book value per common share (end of year) | | 12.26 | | | 12.93 | | | (5.2) | % |
| Market price (end of year) | | 24.38 | | | 17.53 | | | 39.1 | % |
| | | | | | |
| Balance Sheet - End of Year | | | | | | |
| Total assets | | $ | 16,329,141 | | | $ | 15,973,134 | | | 2.2 | % |
| Loans | | 9,288,299 | | | 9,900,970 | | | (6.2) | % |
| Investment securities | | 4,409,237 | | | 3,689,465 | | | 19.5 | % |
| Deposits | | 12,871,954 | | | 12,232,003 | | | 5.2 | % |
| Shareholders' equity | | 2,258,942 | | | 2,282,070 | | | (1.0) | % |
| | | | | | |
| Ratios | | | | | | |
| Return on average assets | | 1.28 | % | | 1.00 | % | | |
| Return on average shareholders' equity | | 9.08 | % | | 7.02 | % | | |
| Return on average tangible shareholders' equity | | 16.43 | % | | 12.97 | % | | |
| Net interest margin | | 3.27 | % | | 3.46 | % | | |
| Net interest margin (fully tax equivalent) | | 3.31 | % | | 3.51 | % | | |
First Financial Bancorp 2021 Annual Report 9
| | | | | |
| 2021 Financial Highlights |
10 First Financial Bancorp 2021 Annual Report
Glossary of Abbreviations and Acronyms
First Financial Bancorp has identified the following list of abbreviations and acronyms that are used in the Notes to Consolidated Financial Statements and the Management's Discussion and Analysis of Financial Condition and Results of Operations.
| | | | | | | | | | | | | | |
| ABL | Asset backed loans | | Form 10-K | First Financial Bancorp. Annual Report on Form 10-K |
| ACL | Allowance for credit losses | | FRB | Federal Reserve Bank |
| AFS | Available-for-sale | | GAAP | U.S. Generally Accepted Accounting Principles |
| ALLL | Allowance for loan and lease losses | | GNMA | Government National Mortgage Association |
| Allowance | Collectively or individually, Allowance for credit losses and Allowance for loan and lease losses | | HTC | Historic tax credit |
| AOCI | Accumulated other comprehensive income | | HTM | Held-to-maturity |
| ASC | Accounting standards codification | | Insignificant | Less than $0.1 million |
| ASU | Accounting standards update | | IRLC | Interest Rate Lock Commitment |
| ATM | Automated teller machine | | LIHTC | Low income housing tax credit |
| Bank | First Financial Bank | | MBSs | Mortgage-backed securities |
| Basel III | Basel Committee regulatory capital reforms, Third Basel Accord | | MSFG | MainSource Financial Group, Inc. |
| BGF or Bannockburn | Bannockburn Global Forex, LLC | | N/A | Not applicable |
| Bp/bps | Basis point(s) | | NII | Net interest income |
| BOLI | Bank owned life insurance | | NMTC | New markets tax credit |
| CDs | Certificates of deposit | | N/M | Not meaningful |
| CARES Act | Coronavirus Aid, Relief, and Economic Security Act | | Oak Street | Oak Street Holdings Corporation |
| CECL | Current Expected Credit Loss | | ODFI | Ohio Department of Financial Institutions |
| C&I | Commercial & industrial | | OREO | Other real estate owned |
| CMOs | Collateralized mortgage obligations | | PCA | Prompt corrective action |
| CRE | Commercial real estate | | PCD | Purchase credit deteriorated |
| Company | First Financial Bancorp. | | PCI | Prompt corrective action |
| DDA | Demand deposit account | | PD | Probability of default |
| Dodd-Frank | Dodd-Frank Wall Street Reform and Consumer Protection Act | | PPP | Paycheck Protection Program |
| EAD | Exposure at Default | | PPPLF | Paycheck Protection Program Liquidity Facility |
| ERISA | Employee Retirement Income Security Act | | R&S | Reasonable and supportable |
| ERM | Enterprise Risk Management | | ROU | Right-of-use |
| EVE | Economic value of equity | | SEC | United States Securities and Exchange Commission |
| Fair Value Topic | FASB ASC Topic 825, Financial Instruments | | SFG or Summit | Summit Funding Group, Inc |
| FASB | Financial Accounting Standards Board | | SOFR | Secured Overnight Financing Rate |
| FDIC | Federal Deposit Insurance Corporation | | Topic 842 | FASB ASC Topic 842, Leasing |
| FHLB | Federal Home Loan Bank | | Special Assets | Special Assets Division |
| FHLMC | Federal Home Loan Mortgage Corporation | | TDR | Troubled debt restructuring |
| First Financial | First Financial Bancorp. | | TTC | Through the cycle |
| FNMA | Federal National Mortgage Association | | USD | United States dollars |
First Financial Bancorp 2021 Annual Report 11
Management’s Discussion and Analysis of Financial Condition and Results of Operations
| | | | | | | | | | | | | | | | | | | | | | | | |
| Table 1 • Financial Summary | | | | |
| | December 31, |
| (Dollars in thousands, except per share data) | | 2021 | | 2020 | | 2019 | | | | |
| Summary of operations | | | | | | | | | | |
| Interest income | | $ | 483,217 | | | $ | 524,963 | | | $ | 607,578 | | | | | |
Tax equivalent adjustment (1) | | 6,091 | | | 6,529 | | | 6,328 | | | | | |
Interest income tax – equivalent (1) | | 489,308 | | | 531,492 | | | 613,906 | | | | | |
| Interest expense | | 31,099 | | | 68,452 | | | 123,324 | | | | | |
Net interest income tax – equivalent (1) | | $ | 458,209 | | | $ | 463,040 | | | $ | 490,582 | | | | | |
| Interest income | | $ | 483,217 | | | $ | 524,963 | | | $ | 607,578 | | | | | |
| Interest expense | | 31,099 | | | 68,452 | | | 123,324 | | | | | |
| Net interest income | | 452,118 | | | 456,511 | | | 484,254 | | | | | |
| Provision for credit losses | | (18,121) | | | 70,559 | | | 30,433 | | | | | |
| Noninterest income | | 171,506 | | | 189,123 | | | 131,373 | | | | | |
| Noninterest expenses | | 400,812 | | | 390,664 | | | 342,332 | | | | | |
| Income before income taxes | | 240,933 | | | 184,411 | | | 242,862 | | | | | |
| Income tax expense | | 35,773 | | | 28,601 | | | 44,787 | | | | | |
| | | | | | | | | | |
| | | | | | | | | | |
| Net income | | $ | 205,160 | | | $ | 155,810 | | | $ | 198,075 | | | | | |
| | | | | | | | | | |
| Per share data | | | | | | | | | | |
| Earnings per common share | | | | | | | | | | |
| Basic | | $ | 2.16 | | | $ | 1.60 | | | $ | 2.01 | | | | | |
| Diluted | | $ | 2.14 | | | $ | 1.59 | | | $ | 2.00 | | | | | |
| Cash dividends declared per common share | | $ | 0.92 | | | $ | 0.92 | | | $ | 0.90 | | | | | |
| Average common shares outstanding–basic (in thousands) | | 95,035 | | | 97,364 | | | 98,306 | | | | | |
| Average common shares outstanding–diluted (in thousands) | | 95,897 | | | 98,093 | | | 98,851 | | | | | |
| | | | | | | | | | |
| Selected year-end balances | | | | | | | | | | |
| Total assets | | $ | 16,329,141 | | | $ | 15,973,134 | | | $ | 14,511,625 | | | | | |
| Earning assets | | 13,941,829 | | | 13,651,843 | | | 12,392,259 | | | | | |
| Investment securities | | 4,409,237 | | | 3,689,465 | | | 3,119,966 | | | | | |
| Total loans and leases | | 9,288,299 | | | 9,900,970 | | | 9,201,665 | | | | | |
| | | | | | | | | | |
| Interest-bearing demand deposits | | 3,198,745 | | | 2,914,787 | | | 2,364,881 | | | | | |
| Savings deposits | | 4,157,374 | | | 3,680,774 | | | 2,960,979 | | | | | |
| Time deposits | | 1,330,263 | | | 1,872,733 | | | 2,240,441 | | | | | |
| Noninterest-bearing demand deposits | | 4,185,572 | | | 3,763,709 | | | 2,643,928 | | | | | |
| Total deposits | | 12,871,954 | | | 12,232,003 | | | 10,210,229 | | | | | |
| Short-term borrowings | | 296,203 | | | 166,594 | | | 1,316,181 | | | | | |
| Long-term debt | | 409,832 | | | 776,202 | | | 414,376 | | | | | |
| | | | | | | | | | |
| Shareholders’ equity | | 2,258,942 | | | 2,282,070 | | | 2,247,705 | | | | | |
| | | | | | | | | | |
| Select Financial Ratios | | | | | | | | | | |
Average loans to average deposits (2) | | 76.15 | % | | 87.13 | % | | 88.59 | % | | | | |
| Net charge-offs to average loans and leases | | 0.26 | % | | 0.14 | % | | 0.33 | % | | | | |
| Average shareholders’ equity to average total assets | | 14.06 | % | | 14.30 | % | | 15.30 | % | | | | |
| | | | | | | | | | |
| Return on average assets | | 1.28 | % | | 1.00 | % | | 1.39 | % | | | | |
| | | | | | | | | | |
| Return on average equity | | 9.08 | % | | 7.02 | % | | 9.11 | % | | | | |
| Net interest margin | | 3.27 | % | | 3.46 | % | | 3.95 | % | | | | |
Net interest margin (tax equivalent basis) (1) | | 3.31 | % | | 3.51 | % | | 4.00 | % | | | | |
| Dividend payout | | 42.59 | % | | 57.50 | % | | 44.78 | % | | | | |
(1) Tax equivalent basis was calculated using a 21.0% tax rate.
(2) Includes loans held for sale.
12 First Financial Bancorp 2021 Annual Report
This annual report contains forward-looking statements. See the Forward-Looking Statements section that follows for further information on the risks and uncertainties associated with forward-looking statements.
The following discussion and analysis is presented by management to facilitate the understanding of the financial condition, cash flows, other changes in financial condition and results of operations of First Financial Bancorp. Management's discussion and analysis identifies trends and material changes that occurred during the reporting periods presented and should be read in conjunction with the Statistical Data, Consolidated Financial Statements and accompanying Notes.
Certain reclassifications of prior years' amounts have been made to conform to current year presentation. Such reclassifications had no effect on net earnings, total assets, liabilities and shareholders' equity.
EXECUTIVE SUMMARY
First Financial Bancorp. is a $16.3 billion financial holding company headquartered in Cincinnati, Ohio, which operates through its subsidiaries primarily in Ohio, Indiana, Kentucky and Illinois. These subsidiaries include First Financial Bank, an
Ohio-chartered commercial bank, which operated 139 full service banking centers as of December 31, 2021. First Financial
provides banking and financial services products to business and retail clients through its six lines of business: Commercial,
Retail Banking, Mortgage Banking, Wealth Management, Investment Commercial Real Estate and Commercial Finance.
The Commercial Finance business lends into targeted industry verticals on a nationwide basis. Wealth Management had $3.4 billion in assets under management as of December 31, 2021 and provides the following services: financial planning, investment management, trust administration, estate settlement, brokerage services and retirement planning.
Additional information about First Financial, including its products, services and banking locations, is available on the Company's website at www.bankatfirst.com.
The major components of First Financial’s operating results for the previous three years are summarized in Table 1 – Financial Summary and are discussed in greater detail in the sections that follow.
MARKET STRATEGY
First Financial develops a competitive advantage by utilizing a local market focus to provide superior service and build long-term relationships with clients while helping them achieve greater financial success. First Financial serves a combination of
metropolitan and community markets in Ohio, Indiana, Kentucky and Illinois through its full-service banking centers, and
provides financing to franchise owners and clients within the financial services industry throughout the United States. First
Financial's investment in community markets is an important part of the Bank's core funding base and has historically provided
stable, low-cost funding sources.
First Financial’s market selection process includes multiple factors, but markets are primarily chosen for their potential for
long-term profitability and growth. First Financial intends to concentrate plans for future growth and capital investment within
its current markets, and will continue to evaluate additional growth opportunities in metropolitan markets located within, or in
close proximity to, the Company's current geographic footprint. Additionally, First Financial may assess strategic acquisitions
that provide product line extensions or additional industry verticals that complement its existing business and diversify its
product suite and revenue streams.
BUSINESS COMBINATIONS
The transactions discussed in this section were accounted for using the acquisition method of accounting. Accordingly, assets acquired, liabilities assumed and consideration exchanged were recorded at estimated fair value on the acquisition date, in accordance with FASB ASC Topic 805, Business Combinations.
In December 2021, the Company completed its acquisition of Summit Funding Group, Inc. and its subsidiaries. Summit was a privately held, full service, equipment financing company that originates, purchases, sells and services equipment leases to commercial businesses in the United States and Canada. Upon completion of the transaction, Summit became a subsidiary of the Bank and continues to operate as Summit Funding Group, taking advantage of its existing brand recognition within the equipment financing industry.
First Financial Bancorp 2021 Annual Report 13
Pursuant to the purchase agreement, First Financial agreed to acquire all of the issued and outstanding equity securities of Summit for aggregate consideration of approximately $127.1 million consisting of $113.5 million in cash and $10.0 million of First Financial common stock, and a $3.6 million earn-out payment. Pursuant to the purchase agreement, the “earn-out” payments are payable annually for each of the five years following the closing of the acquisition, contingent upon the results of Summit's operations. First Financial incurred expenses related to the Summit acquisition of $2.6 million during the year ended December 31, 2021.
The fair value measurements of assets acquired and liabilities assumed in the SFG acquisition were $185.8 million and $125.9 million, respectively, and included $42.3 million of financing leases and $73.9 million of operating leases. Given the timing of the transaction closing, acquisition accounting adjustments are considered preliminary at December 31, 2021. These fair value measurements are subject to refinement for up to one year after the closing date of the acquisition as additional information relative to closing date fair values become available, and the measurement period ends in December 2022. Goodwill arising from the Summit acquisition was $63.0 million and reflects the business’s high growth potential and the expectation that the acquisition will provide additional revenue growth with the expansion of the Bank's leasing business. The goodwill is not deductible for income tax purposes as the transaction was accounted for as a tax-free exchange. For further detail, see Note 9 – Goodwill and Other Intangible Assets.
In August 2019, the Company acquired Bannockburn Global Forex, LLC, an industry-leading capital markets firm. The
Cincinnati-based company provides transactional currency payments, foreign exchange hedging and other advisory products to
closely held enterprises, financial sponsors and financial institutions across the United States. Bannockburn became a division of the Bank and continues to operate as Bannockburn Global Forex, taking advantage of its existing brand recognition within the foreign exchange industry. The total purchase consideration was $114.6 million, consisting of $53.7 million in cash and $60.9 million of First Financial common stock. The transaction resulted in First Financial recording $57.5 million of goodwill on the Consolidated Balance Sheet, which reflects BGF's high growth potential and the expectation that the acquisition will provide additional revenue growth and diversification. The goodwill is deductible for income tax purposes as the transaction is considered a taxable exchange.
See Note 23 – Business Combinations in the Notes to Consolidated Financial Statements, for further discussion of these transactions.
COVID-19 CONSIDERATIONS
The Company's operations and financial results for the majority of 2021 and 2020 were substantially influenced by the
COVID-19 pandemic. At the onset of the pandemic, the Company updated operating protocols to continuously provide
essential banking services, while prioritizing the health and safety of both its clients and associates. Banking centers offered
drive through services without interruption, while lobbies were fully open or accessible to clients via appointment, conditional
to virus trends at any point in time. Sales associates, support teams and management largely worked remotely.
The Company continued to prioritize the health and safety of clients and associates in 2021, although without the significant disruptions to our workforce that occurred in 2020. Banking centers offered drive through services without interruption, while lobbies were fully open and accessible to clients. Sales associates, support teams and management returned to corporate offices and operations centers in the second and third quarters of 2021.
To assist clients during the pandemic, the Company implemented distinct COVID-19 relief programs to provide payment
deferrals and fee waivers, in addition to temporarily suspending vehicle repossessions and residential property foreclosures.
Further, the Company continuously monitored the actions of federal and state governments to proactively assist clients and
ensure awareness of each financial assistance program available to them, while focusing internally on enhancing remote, mobile
and online processes to better support a bank anytime, anywhere environment.
The Bank underwent a significant level of cross training and redeployment of associate resources to rapidly meet the influx of
client requests in response to the passage of the CARES Act, the establishment of the Paycheck Protection Program and the
approval of the Consolidated Appropriations Act. The Company's response to the PPP resulted in successes in providing
customer relief, although the program and assistance had substantially wound down by the end of 2021. As such, the Company had outstanding PPP loans totaling $55.6 million in balances, net of $2.6 million of unearned fees, as of of December 31, 2021, compared to $594.6 million of PPP loans, net of $13.7 million of unearned fees, as of December 31, 2020.
14 First Financial Bancorp 2021 Annual Report
Further, as of December 31, 2021, the Company had $16.5 million in loans that were still in a payment deferral to provide relief to borrowers adversely impacted by the pandemic, compared to $320.2 million as of December 31, 2020. As provided in the CARES Act and subsequently amended by the Consolidated Appropriations Act, loan modifications in response to COVID-19 that were executed on a loan that was not more than 30 days past due as of December 31, 2019 and executed between March 1, 2020 and January 1, 2022 are not required to be reported as TDR.
OVERVIEW OF OPERATIONS
Net income for the year ended December 31, 2021 was $205.2 million, resulting in earnings per diluted common share of $2.14. This compares to net income of $155.8 million and earnings per diluted common share of $1.59 in 2020. First Financial’s return on average shareholders’ equity for 2021 was 9.08%, compared to 7.02% for 2020, and First Financial’s return on average assets was 1.28% and 1.00% for 2021 and 2020, respectively.
Net interest income in 2021 decreased $4.4 million, or 1.0%, from 2020, to $452.1 million, primarily driven by lower yields earned on the loan and investment portfolios resulting from a lower interest rate environment. The net interest margin on a fully tax equivalent basis was 3.31% for 2021 compared to 3.51% in 2020.
Noninterest income decreased $17.6 million, or 9.3%, to $171.5 million during 2021 from $189.1 million in 2020. The decrease in 2021 was primarily driven by a decline in gains on sales of mortgage loans following record production in 2020.
Noninterest expense increased $10.1 million, or 2.6%, from $390.7 million in 2020 to $400.8 million in 2021. This increase was impacted by higher salaries and benefits directly related to the Company's financial performance, as well as higher data processing expenses, tax credit investment write-downs and legal settlement costs.
Income tax expense increased $7.2 million, or 25.1%, to $35.8 million in 2021 from $28.6 million in 2020, with the effective tax rate decreasing to 14.8% in 2021 from 15.5% in 2020. The lower effective tax rate in 2021 was primarily related to tax credit investments realized during the period.
Total loans decreased $612.7 million, or 6.2%, to $9.3 billion at December 31, 2021 from $9.9 billion at December 31, 2020, primarily driven by the runoff of PPP balances. Total deposits increased $640.0 million, or 5.2%, to $12.9 billion as of December 31, 2021 from $12.2 billion at December 31, 2020. This increase is attributed to an increase in consumer savings rates resulting from retaining stimulus payments, PPP loan proceeds and tax refunds.
The ACL was $132.0 million, or 1.42% of total loans at December 31, 2021, compared to $175.7 million, and 1.77% of total loans at December 31, 2020. In addition, First Financial recorded $19.0 million in provision recapture during 2021, compared to $70.8 million of provision expense in 2020, as the Company's classified asset balances declined $37.2 million, or 26.2%, and economic forecasts improved.
First Financial’s operational results may be influenced by certain economic factors and conditions, such as market interest rates, industry competition, household and business spending levels, consumer confidence and the regulatory environment. For a more detailed discussion of the Company's operations, please refer to the sections that follow.
NET INCOME
2021 vs. 2020. First Financial’s net income increased $49.4 million, or 31.7%, to $205.2 million in 2021, compared to net income of $155.8 million in 2020. The increase in 2021 was primarily related to a $89.8 million, or 126.9%, decrease in provision expense, which was partially offset by a $17.6 million, or 9.3%, decline in noninterest income, a $10.1 million, or 2.6%, increase in noninterest expenses, a $7.2 million, or 25.1%, increase in income tax expense, and a $4.4 million, or 1.0%, decrease in net interest income.
2020 vs. 2019. First Financial’s net income decreased $42.3 million, or 21.3%, to $155.8 million in 2020, compared to net
income of $198.1 million in 2019. The decrease was primarily related to a $27.7 million, or 5.7%, decrease in net interest
income as well as a $40.1 million, or 131.9%, increase in provision expense and a $48.3 million, or 14.1%, increase in
noninterest expenses, which was partially offset by a $57.8 million, or 44.0%, increase in noninterest income and a $16.2
million, or 36.1%, decrease in income tax expense during 2020.
First Financial Bancorp 2021 Annual Report 15
Management’s Discussion and Analysis of Financial Condition and Results of Operations
For more detail, refer to the Net interest income, Noninterest income, Noninterest expenses, Income taxes and Asset quality and credit risk sections that follow.
NET INTEREST INCOME
First Financial’s net interest income for the years 2019 through 2021 is shown in Table 1 – Financial Summary.
First Financial’s principal source of income is net interest income, which is the excess of interest received from earning assets, including loan-related fees and purchase accounting accretion, less interest paid on interest-bearing liabilities. The amount of net interest income is determined by the volume and mix of earning assets, the rates earned on such assets and the volume, mix and rates paid for the deposits and borrowed money that support the earning assets. Earning assets consist of interest-bearing loans to customers as well as marketable investment securities.
For analytical purposes, net interest income is also presented in Table 1 – Financial Summary on a tax equivalent basis assuming a 21% marginal tax rate. Net interest income on a taxable equivalent basis adjusts for the tax-favored status of income from certain loans and securities held by First Financial that are not taxable for federal income tax purposes in order to facilitate a comparison between taxable and tax-exempt amounts. Management believes it is a standard practice in the banking industry to present net interest margin and net interest income on a fully tax equivalent basis as these measures provide useful information to make peer comparisons. First Financial's tax equivalent net interest margin was 3.31%, 3.51% and 4.00% for 2021, 2020 and 2019, respectively.
Table 2 – Volume/Rate Analysis - Tax Equivalent Basis describes the extent to which changes in interest rates as well as changes in the volume of earning assets and interest-bearing liabilities have affected First Financial’s net interest income on a tax equivalent basis during the years presented. Nonaccrual loans and loans held for sale were included in the average loan balances used to determine the yields in Table 2 – Volume/Rate Analysis - Tax Equivalent Basis, which should be read in conjunction with the Statistical Information table.
Loan fees included in the interest income computation for 2021, 2020 and 2019 were $46.8 million, $32.8 million and $15.9 million, respectively. Interest income also included purchase accounting accretion of $12.3 million, $20.0 million and $26.8 million for 2021, 2020 and 2019, respectively.
2021 vs. 2020. Net interest income decreased $4.4 million, or 1.0%, from $456.5 million in 2020 to $452.1 million in 2021, as interest rates declined and purchase accounting accretion moderated during 2021. The tax equivalent yield on earning assets declined due to lower interest rates and more than offset an increase in average earning asset balances during the period. Additionally, PPP fees increased $12.6 million, or 73.3%, in 2021, partially offsetting the impact from a challenging interest rate environment.
Net interest margin on a fully tax equivalent basis decreased 20 bps to 3.31% for 2021 compared to 3.51% in 2020 as a decline in interest rates drove a 49 bp decline in asset yields. These lower rates more than offset higher earning asset balances and a 39 bp decline in funding costs.
Interest income declined $41.7 million, or 8.0%, in 2021 when compared to the prior year as the yield on earning assets declined to 3.54% from 4.03%, which more than offset the impact of higher earning asset balances. Average earning assets increased to $13.8 billion as of December 31, 2021 from $13.2 billion in 2020 as the Company invested excess liquidity into investment securities.
Interest expense decreased due to a 35 basis point decline in the cost of interest-bearing deposits and lower borrowing balances. The low interest rate environment drove the decline in the cost of interest-bearing deposits, which was 0.17% in 2021 compared to 0.52% for the same period in the prior year. Average borrowed funds declined $811.5 million in 2021, while the cost of these borrowed funds increased to 2.57% in 2021 from 1.82% during 2020. Both the decline in balances and the increase in rate were attributable to the repayment of PPPLF borrowings in 2021, which were used to fund PPP activity and carried a relatively modest interest rate of 0.35%.
2020 vs. 2019. Net interest income decreased $27.7 million, or 5.7%, from $484.3 million in 2019 to $456.5 million in 2020,
as interest rates declined and purchase accounting accretion moderated during 2020. Average earning assets increased from
$12.3 billion in 2019 to $13.2 billion in 2020 primarily due to PPP activity, while the tax equivalent yield on earning assets
decreased from 5.00% in 2019 to 4.03% in 2020.
16 First Financial Bancorp 2021 Annual Report
Net interest margin on a fully tax equivalent basis decreased 49 bps to 3.51% for 2020 compared to 4.00% in 2019 as a decline
in interest rates drove a 97 bp decline in asset yields, which combined with higher earning asset balances to more than offset a
61 bp decline in funding costs.
Interest income decreased $82.6 million, or 13.6%, in 2020 when compared to 2019 as the yield on earning assets
declined to 4.03% from 5.00%, which more than offset the impact of higher earning asset balances. The declining yield on
earning assets resulted from an approximate 150 bp reduction in the fed funds target rate from December 31, 2019. Average
earning assets increased to $13.2 billion as of December 31, 2020 from $12.3 billion in 2019 as loan balances grew largely due
to PPP activity.
Interest expense decreased due to lower rates paid on deposits, the Company's aggressive and deliberate management of
funding costs and lower borrowing balances. Lower interest rates led to a 52 bp decline in the cost of interest-bearing deposits,
which was 0.52% in 2020 compared to 1.04% for the same period in the prior year. The cost of borrowed funds decreased to
1.82% in 2020 from 2.65% during 2019, reflecting the decline in interest rates and a shift to FRB long-term borrowings, which
were used to fund PPP activity and carried an interest rate of 0.35%.
| | | | | | | | | | | | | | | | | | | | | | | | | | | | | | | | | | | | | | |
Table 2 • Volume/Rate Analysis - Tax Equivalent Basis (1) | | | | |
| | 2021 change from 2020 due to | | 2020 change from 2019 due to |
| (Dollars in thousands) | | Volume | Rate | | Total | | Volume | Rate | | Total |
| Interest income | | | | | | | | | | | | |
Loans (2) | | $ | (10,528) | | | $ | (35,788) | | | $ | (46,316) | | | $ | 41,726 | | | $ | (109,315) | | | $ | (67,589) | |
| | | | | | | | | | | | |
Investment securities (3) | | | | | | | | | | | | |
| Taxable | | 19,634 | | | (14,210) | | | 5,424 | | | (6,725) | | | (9,654) | | | (16,379) | |
| Tax-exempt | | 2,488 | | | (3,652) | | | (1,164) | | | 4,780 | | | (2,696) | | | 2,084 | |
Total investment securities interest (3) | | 22,122 | | | (17,862) | | | 4,260 | | | (1,945) | | | (12,350) | | | (14,295) | |
| Interest-bearing deposits with other banks | | (12) | | | (116) | | | (128) | | | 150 | | | (680) | | | (530) | |
| Total | | 11,582 | | | (53,766) | | | (42,184) | | | 39,931 | | | (122,345) | | | (82,414) | |
| | | | | | | | | | | | |
| Interest expense | | | | | | | | | | | | |
| Interest-bearing demand deposits | | 234 | | | (2,838) | | | (2,604) | | | 518 | | | (8,732) | | | (8,214) | |
| Savings deposits | | 816 | | | (3,926) | | | (3,110) | | | 517 | | | (14,668) | | | (14,151) | |
| Time deposits | | (2,964) | | | (18,809) | | | (21,773) | | | (777) | | | (13,968) | | | (14,745) | |
| Short-term borrowings | | (374) | | | (5,870) | | | (6,244) | | | (6,059) | | | (12,734) | | | (18,793) | |
| Long-term debt | | (15,810) | | | 12,188 | | | (3,622) | | | 7,997 | | | (6,966) | | | 1,031 | |
| Total | | (18,098) | | | (19,255) | | | (37,353) | | | 2,196 | | | (57,068) | | | (54,872) | |
| Net interest income | | $ | 29,680 | | | $ | (34,511) | | | $ | (4,831) | | | $ | 37,735 | | | $ | (65,277) | | | $ | (27,542) | |
(1) Tax equivalent basis was calculated using a 21.00% tax rate.
(2) Includes nonaccrual loans and loans held-for-sale.
(3) Includes HTM securities, AFS securities and other investments.
NONINTEREST INCOME AND NONINTEREST EXPENSES
Noninterest income and noninterest expenses for 2021, 2020 and 2019 are shown in Table 3 – Noninterest Income and Noninterest Expenses.
NONINTEREST INCOME
2021 vs. 2020. Noninterest income decreased $17.6 million, or 9.3%, from $189.1 million in 2020 to $171.5 million in 2021. The decline was attributed to an $18.2 million, or 35.5%, decrease in Gain on sale of loans, an $8.3 million, or 92.2%, decrease in Unrealized gain (loss) on equity securities, a $5.3 million, or 116.6%, decrease on Sales of investment securities and a $2.4 million, or 23.1%, decrease in Client derivative fees. These declines were partially offset by a $5.4 million, or 13.8%, increase in Foreign exchange income, a $3.7 million, or 30.1%, increase in Other noninterest income, a $2.6 million, or 22.0%, increase in Bankcard income, a $2.5 million, or 11.7%, increase in Trust and wealth management fees, and a $2.4 million, or 8.3%, increase in Service charges on deposit accounts.
First Financial Bancorp 2021 Annual Report 17
Management’s Discussion and Analysis of Financial Condition and Results of Operations
Gains on the sales of retail mortgage loans declined from record levels in the prior year, as loan demand softened and premiums moderated in 2021. Gains from sales of investment securities and unrealized gains on equity securities both declined in 2021 due to sales of Visa Class B shares and recording the remaining shares at fair value during 2020. Client derivatives fees declined from prior year as demand moderated in 2021 in line with a decrease in loan balances.
Partially offsetting those declines, Bannockburn produced record foreign exchange income in 2021 due to an increased demand for currency transactions, while other noninterest income increased due to an increase in limited partnership income and syndication fees during the period. In addition, wealth management, bankcard and service charge income all increased in 2021 as the economy began to recover from pandemic-related uncertainty.
2020 vs. 2019. Noninterest income increased $57.8 million, or 44.0%, from $131.4 million in 2019 to $189.1 million in 2020.
The increase was primarily related to a $36.3 million, or 244.6%, increase in Gain on sale of loans, a $31.6 million, or 408.8%,
increase in Foreign exchange income, a $5.0 million increase on Sales of investment securities and an $8.5 million increase in
Unrealized gain (loss) on equity securities. These increases were partially offset by an $8.5 million, or 22.4%, decrease in
Service charges on deposit accounts, a $7.1 million, or 37.6%, decrease in Bankcard income and a $5.3 million, or 34.2%,
decrease in Client derivative fees.
Higher gain on sale of loans in 2020 was a result of record mortgage banking origination activity driven by historically low interest rates, while foreign exchange income was attributable to the full-year impact of the BGF acquisition, which closed in August of 2019 and generated record income in the back half 2020. The Company recorded net realized gain on sale of Visa Class B shares of $4.5 million during the year, driving the increase in gain on sale of investment securities, while the Company recorded unrealized gains on its remaining investment in Visa Class B shares of $8.8 million in noninterest income when recording those shares on the Consolidated Balance Sheet at their estimated fair value, resulting in the increase in unrealized gain on equity securities.
Service charges on deposit accounts declined during 2020 due to pandemic related fee waivers and lower transaction activity,
while the decline in bankcard income was due to the full-year impact of the Durbin Amendment cap on interchange fees, which
became applicable to First Financial in the third quarter of 2019, along with lower transaction volumes due to the pandemic.
Demand for back to back swaps slowed as loan growth moderated, resulting in lower client derivative fees during the year.
18 First Financial Bancorp 2021 Annual Report
| | | | | | | | | | | | | | | | | | | | | | | | | | | | | | | | | | | | | | |
| Table 3 • Noninterest Income and Noninterest Expenses |
| | 2021 | | 2020 | | 2019 |
| (Dollars in thousands) | | Total | | % Change | | Total | | % Change | | Total | | % Change |
| Noninterest income | | | | | | | | | | | | |
| Service charges on deposit accounts | | $ | 31,876 | | | 8.3 | % | | $ | 29,446 | | | (22.4) | % | | $ | 37,939 | | | 8.1 | % |
| Trust and wealth management fees | | 23,780 | | | 11.7 | % | | 21,286 | | | 2.7 | % | | 20,728 | | | 3.7 | % |
| Bankcard income | | 14,300 | | | 22.0 | % | | 11,726 | | | (37.6) | % | | 18,804 | | | (7.1) | % |
| Client derivative fees | | 7,927 | | | (23.1) | % | | 10,313 | | | (34.2) | % | | 15,662 | | | 103.9 | % |
| Foreign exchange income | | 44,793 | | | 13.8 | % | | 39,377 | | | 408.8 | % | | 7,739 | | | N/M |
| Net gains from sales of loans | | 33,021 | | | (35.5) | % | | 51,176 | | | 244.6 | % | | 14,851 | | | 144.6 | % |
| | | | | | | | | | | | |
| Unrealized gain (loss) on equity securities | | 702 | | | (92.2) | % | | 9,045 | | | N/M | | 575 | | | 376.4 | % |
| Other | | 15,866 | | | 30.1 | % | | 12,191 | | | (21.3) | % | | 15,481 | | | 5.6 | % |
| Subtotal | | 172,265 | | | (6.7) | % | | 184,560 | | | 40.1 | % | | 131,779 | | | 27.3 | % |
| Net gain (loss) on sales/transfers of investment securities | | (759) | | | (116.6) | % | | 4,563 | | | N/M | | (406) | | | N/M |
| Total | | $ | 171,506 | | | (9.3) | % | | $ | 189,123 | | | 44.0 | % | | $ | 131,373 | | | 27.1 | % |
| | | | | | | | | | | | |
| Noninterest expenses | | | | | | | | | | | | |
| Salaries and employee benefits | | $ | 245,924 | | | 3.9 | % | | $ | 236,779 | | | 13.3 | % | | $ | 209,061 | | | 10.6 | % |
| | | | | | | | | | | | |
| Net occupancy | | 22,142 | | | (4.8) | % | | 23,266 | | | (3.3) | % | | 24,069 | | | (0.6) | % |
| Furniture and equipment | | 13,819 | | | (7.7) | % | | 14,968 | | | (5.9) | % | | 15,903 | | | 6.7 | % |
| Data processing | | 31,363 | | | 14.0 | % | | 27,514 | | | 25.7 | % | | 21,881 | | | (22.1) | % |
| Marketing | | 7,983 | | | 24.5 | % | | 6,414 | | | (7.2) | % | | 6,908 | | | (9.1) | % |
| Communication | | 2,930 | | | (16.1) | % | | 3,492 | | | 6.9 | % | | 3,267 | | | 3.2 | % |
| Professional services | | 11,676 | | | 17.2 | % | | 9,961 | | | (11.5) | % | | 11,254 | | | (8.3) | % |
| Debt extinguishment | | 0 | | | (100.0) | % | | 7,257 | | | N/M | | 0 | | | N/M |
| State intangible tax | | 4,256 | | | (29.7) | % | | 6,058 | | | 3.9 | % | | 5,829 | | | 40.4 | % |
| FDIC assessments | | 5,630 | | | 10.2 | % | | 5,110 | | | 159.0 | % | | 1,973 | | | (50.3) | % |
| Intangible assets amortization | | 9,839 | | | (11.6) | % | | 11,126 | | | 15.0 | % | | 9,671 | | | 31.4 | % |
| Other | | 45,250 | | | 16.9 | % | | 38,719 | | | 19.1 | % | | 32,516 | | | 12.8 | % |
| Total | | $ | 400,812 | | | 2.6 | % | | $ | 390,664 | | | 14.1 | % | | $ | 342,332 | | | 5.8 | % |
NONINTEREST EXPENSES
2021 vs. 2020. Noninterest expenses increased $10.1 million, or 2.6%, in 2021 compared to 2020, primarily due to a $9.1 million, or 3.9%, increase in Salaries and employee benefits, a $3.8 million, or 14.0%, increase in Data processing expenses, a $1.7 million, or 17.2%, increase in Professional services, a $1.6 million, or 24.5%, increase in Marketing expenses, and a $6.5 million, or 16.9%, increase in Other noninterest expenses. These increases were partially offset by a $7.3 million, or 100.0% decrease in Debt extinguishment costs, a $1.8 million, or 29.7%, decrease in State intangible taxes, a $1.3 million, or 11.6%, decrease in Intangible asset amortization expense, a $1.1 million, or 7.7%, decrease in Furniture and equipment expenses and $1.1 million, or 4.8%, decrease in Net occupancy expenses.
Higher salaries and employee benefits in 2021 were driven by annual compensation adjustments and performance related incentives tied to the Company's financial results. Data processing and professional services increased in 2021 due to Company's continued investment in technology and expenses associated with the Summit acquisition, respectively, while marketing expenses increased due to an increase in events sponsored in 2021 compared to 2020, which was impacted by the pandemic.
Other noninterest expenses rose primarily as a result of an increase in tax credit investment write-downs in 2021, as well as $7.1 million of costs related to overdraft litigation settled during the year. Like many banks, First Financial has been the subject of lawsuits relating to overdraft fees. This type of litigation is time consuming and expensive in large part due to the amount of data to be sorted and disclosed, in some cases going back multiple years. During 2021, First Financial determined
First Financial Bancorp 2021 Annual Report 19
Management’s Discussion and Analysis of Financial Condition and Results of Operations
that it was in its best interest to settle lawsuits in the states of Indiana and Ohio and have signed settlement agreements that are being presented to the court for approval, resulting in higher litigation settlement expense in the year.
Debt extinguishment costs declined in 2021 as 2020 included $7.3 million of charges that did not recur in 2021 related to the prepayment of $120.0 million of higher cost long-term FHLB debt. The decline in net occupancy expenses in 2021 was primarily a result of branch consolidation efforts, while state intangible taxes decreased during the current year due to the state of Kentucky changing their taxation method from a franchise tax to an income tax. Additionally, intangible asset amortization declined in 2021 due to accelerated amortization on intangible assets associated with the MSFG merger in prior years, while furniture and equipment expenses declined in 2021 as certain assets became fully depreciated.
2020 vs. 2019. Noninterest expenses increased $48.3 million, or 14.1%, in 2020 compared to 2019, primarily due to a $27.7
million, or 13.3%, increase in Salaries and employee benefits, $7.3 million of Debt extinguishment expenses, a $6.2 million, or
19.1%, increase in Other noninterest expenses, a $5.6 million, or 25.7%, increase in Data processing expenses and a $3.1
million, or 159.0% increase in FDIC assessments.
Higher salaries and employee benefits in 2020 were driven by performance related incentives and commissions, as well as
higher healthcare costs and annual compensation adjustments. Noninterest expenses also increased as the Company incurred
$7.3 million of debt extinguishment costs related to the prepayment of $120.0 million of higher cost long-term FHLB debt as
the Company strategically repositioned its funding mix to take advantage of its liquidity position. The increase in other
noninterest expenses was primarily due to a $5.3 million increase in contributions made to the First Financial Foundation
during 2020 as well higher write downs of tax credit investments, while data processing expenses increased as the Company continued to make strategic investments to enhance its digital capabilities and establish required PPP lending processes. FDIC
assessments increased in 2020 due to the recognition of a $3.4 million small bank assessment credit from the FDIC in 2019.
INCOME TAXES
2021 vs. 2020. First Financial’s income tax expense in 2021 totaled $35.8 million compared to $28.6 million in 2020, resulting in effective tax rates of 14.8% and 15.5% for 2021 and 2020, respectively. The lower effective tax rate in 2021 was primarily related to an increase in tax credit activity during the year, partially offset by higher pre-tax income.
2020 vs. 2019. First Financial’s income tax expense in 2020 totaled $28.6 million compared to $44.8 million in 2019, resulting
in effective tax rates of 15.5% and 18.4% for 2020 and 2019, respectively. The lower effective tax rate in 2020 was primarily
related to lower pre-tax income, coupled with stable non-taxable revenue sources, as well as an increase in tax credit activity during the year.
For further information on income taxes, see Note 15 – Income Taxes in the Notes to Consolidated Financial Statements.
INVESTMENTS
First Financial utilizes its investment portfolio as a source of liquidity and interest income, as well as a tool for managing the Company's interest rate risk profile. As such, the Company's primary investment strategy is to invest in debt securities with low credit risk, such as treasury and agency-backed residential MBS. The investment portfolio is also managed with consideration to prepayment, extension and maturity risk. First Financial invests primarily in MBS issued by U.S. government agencies and corporations, such GNMA, FHLMC and FNMA, as these securities are considered to have a low credit risk and high liquidity profile due to government agency guarantees. Government and agency backed securities comprised 55.5% and 52.9% of First Financial's investment securities portfolio as of December 31, 2021 and 2020, respectively.
The Company also invests in certain securities that are not supported by government or agency guarantees and whose realization is dependent on future principal and interest repayments. Prior to purchase, First Financial performs a detailed collateral and structural analysis on these securities and strategically invests in asset classes in which First Financial has expertise and experience, as well as a senior position in the capital structure. First Financial continuously monitors credit risk and geographic concentration risk in its evaluation of market opportunities that would enhance the overall performance of the portfolio. Securities not supported by government or agency guarantees represented 44.5% and 47.1% of First Financial's investment securities portfolio as of December 31, 2021 and 2020, respectively.
The other investments category in the Consolidated Balance Sheets consists primarily of First Financial’s investments in FRB stock, FHLB stock and class B Visa shares.
20 First Financial Bancorp 2021 Annual Report
2021 vs. 2020. First Financial’s investment portfolio at December 31, 2021 totaled $4.3 billion, compared to $3.6 billion at December 31, 2020, and represented 26.4% of total assets at December 31, 2021. The $750.0 million, or 21.1%, increase in the investment portfolio during 2021 was primarily related to Company's strategic redeployment of balance sheet liquidity resulting from an increase in deposits.
First Financial classified $4.2 billion, or 97.7%, and $3.4 billion, or 96.3%, of investment securities as AFS at December 31, 2021 and 2020, respectively. First Financial classified $98.4 million, or 2.3%, and $131.7 million, or 3.7%, of investment securities as HTM at December 31, 2021 and 2020, respectively.
First Financial recorded a $21.0 million unrealized after-tax gain on the investment portfolio as a component of equity in AOCI resulting from changes in the fair value of AFS securities at December 31, 2021. This unrealized after-tax gain decreased $52.5 million in 2021 from a $73.6 million unrealized after-tax gain at December 31, 2020.
Debt securities issued by the U.S. government and U.S. government agencies and corporations, including the FHLB, FHLMC, FNMA and the U.S. Export/Import Bank was not meaningful as a percentage of the portfolio at either December 31, 2021 or December 31, 2020.
Investments in MBS securities, which include CMOs, represented 51.4% and 57.9% of First Financial's total investment portfolio at December 31, 2021 and 2020, respectively. MBS are participations in pools of loans secured by mortgages under which payments of principal and interest are passed through to the security holders. These securities are subject to prepayment risk, particularly during periods of falling interest rates, and extension risk during periods of rising interest rates. Prepayments of the underlying residential real estate loans may shorten the lives of the securities, thereby affecting yields to maturity and market values.
Tax-exempt securities of states, municipalities and other political subdivisions totaled $1.1 billion as of December 31, 2021 and $912.4 million as of December 31, 2020, comprising 25.4% and 25.7% of the investment portfolio at December 31, 2021 and 2020, respectively. The securities are diversified to include states as well as issuing authorities within states, thereby decreasing geographic portfolio risk. First Financial continuously monitors the risk associated with this investment type and reviews underlying ratings for possible downgrades. First Financial does not own any state or other political subdivision securities that are currently impaired.
Asset-backed securities were $719.6 million, or 16.7% of the investment portfolio at December 31, 2021 and $481.9 million, or 13.5% of the investment portfolio at December 31, 2020. First Financial considers these investment securities to have lower credit risk and a high liquidity profile as a result of explicit guarantees on the collateral.
Other securities, consisting primarily of taxable securities of states, municipalities and other political subdivisions, in addition to debt securities issued by corporations, were $166.1 million, or 3.9% of the investment portfolio, at December 31, 2021 and $104.0 million, or 2.9% of the investment portfolio, at December 31, 2020.
The overall duration of the investment portfolio increased to 3.8 years as of December 31, 2021 from 3.2 years as of December 31, 2020. First Financial has avoided adding to its portfolio any particular securities that would materially increase credit risk or geographic concentration risk and the Company continuously monitors and considers these risks in its evaluation of current market opportunities that would enhance the overall performance of the portfolio.
First Financial Bancorp 2021 Annual Report 21
Management’s Discussion and Analysis of Financial Condition and Results of Operations
| | | | | | | | | | | | | | | | | | | | | | | | | | |
| Table 4 • Investment Securities as of December 31 | | | | | | | | |
| | 2021 | | 2020 |
| | | | Percent of | | | | Percent of |
| (Dollars in thousands) | | Amount | | Portfolio | | Amount | | Portfolio |
| U.S. Treasuries | | $ | 34,776 | | | 0.8 | % | | $ | 103 | | | 0.0 | % |
| Securities of U.S. government agencies and corporations | | 79,117 | | | 1.8 | % | | 60 | | | 0.0 | % |
| Mortgage-backed securities-residential | | 724,137 | | | 16.8 | % | | 734,173 | | | 20.7 | % |
| Mortgage-backed securities-commercial | | 778,252 | | | 18.1 | % | | 662,673 | | | 18.6 | % |
| Collateralized mortgage obligations | | 709,622 | | | 16.5 | % | | 660,920 | | | 18.6 | % |
| Obligations of state and other political subdivisions | | 1,094,658 | | | 25.4 | % | | 912,429 | | | 25.7 | % |
| Asset-backed securities | | 719,581 | | | 16.7 | % | | 481,871 | | | 13.5 | % |
| Other securities | | 166,123 | | | 3.9 | % | | 104,038 | | | 2.9 | % |
| Total | | $ | 4,306,266 | | | 100.0 | % | | $ | 3,556,267 | | | 100.0 | % |
The estimated maturities and weighted-average yields of HTM and AFS investment securities as of December 31, 2021 are shown in Table 5 – Investment Securities. Tax-equivalent adjustments using a rate of 21% were included in calculating yields on tax-exempt obligations of state and other political subdivisions.
First Financial held cash on deposit with the Federal Reserve of $214.8 million and $20.3 million at December 31, 2021 and 2020, respectively. First Financial continually monitors its liquidity position as part of its ERM framework, specifically through its asset/liability management process.
First Financial will continue to monitor loan and deposit demand, balance sheet composition, capital sensitivity and the interest rate environment as it manages investment strategies in future periods. See Note 4 – Investment Securities in the Notes to Consolidated Financial Statements for additional information on the Company's investment portfolio and Note 22 – Fair Value Disclosures for additional information on how First Financial determines the fair value of investment securities.
22 First Financial Bancorp 2021 Annual Report
| | | | | | | | | | | | | | | | | | | | | | | | | | | | | | | | | | | | | | | | | | | | | | | | | | |
| Table 5 • Investment Securities as of December 31, 2021 |
| | Maturity (2) |
| | Within one year | | After one but within five years | | After five but within ten years | | After ten years |
| (Dollars in thousands) | | Amount | | Yield(1) | | Amount | | Yield(1) | | Amount | | Yield(1) | | Amount | | Yield(1) |
| Held-to-Maturity | | | | | | | | | | | | | | | | |
| Securities of other U.S. government agencies and corporations | | $ | 0 | | | 0.00 | % | | $ | 0 | | | 0.00 | % | | $ | 0 | | | 0.00 | % | | $ | 0 | | | 0.00 | % |
| Mortgage-backed securities-residential | | 0 | | | 0.00 | % | | 0 | | | 0.00 | % | | 0 | | | 0.00 | % | | 0 | | | 0.00 | % |
| Mortgage-backed securities-commercial | | 0 | | | 0.00 | % | | 46,362 | | | 2.34 | % | | 0 | | | 0.00 | % | | 0 | | | 0.00 | % |
| Collateralized mortgage obligations | | 1,967 | | | 1.75 | % | | 9,915 | | | 2.14 | % | | 0 | | | 0.00 | % | | 0 | | | 0.00 | % |
| Obligations of state and other political subdivisions | | 0 | | | 0.00 | % | | 639 | | | 3.02 | % | | 5,401 | | | 3.58 | % | | 2,886 | | | 2.23 | % |
| Other securities | | 0 | | | 0.00 | % | | 15,250 | | | 4.42 | % | | 16,000 | | | 4.95 | % | | 0 | | | 0.00 | % |
| Total | | $ | 1,967 | | | 1.75 | % | | $ | 72,166 | | | 2.76 | % | | $ | 21,401 | | | 4.60 | % | | $ | 2,886 | | | 2.23 | % |
| | | | | | | | | | | | | | | | |
| Available-for-Sale | | | | | | | | | | | | | | | | |
| U.S. treasuries | | $ | 101 | | | 1.97 | % | | $ | 0 | | | 0.00 | % | | $ | 34,675 | | | 1.32 | % | | $ | 0 | | | 0.00 | % |
| Securities of other U.S. government agencies and corporations | | 0 | | | 0.00 | % | | 0 | | | 0.00 | % | | 79,117 | | | 1.74 | % | | 0 | | | 0.00 | % |
| Mortgage-backed securities-residential | | 9,744 | | | 0.62 | % | | 288,657 | | | 2.00 | % | | 336,948 | | | 1.66 | % | | 88,788 | | | 1.71 | % |
| Mortgage-backed securities-commercial | | 138,074 | | | 3.94 | % | | 436,556 | | | 3.52 | % | | 144,267 | | | 1.81 | % | | 12,993 | | | 2.04 | % |
| Collateralized mortgage obligations | | 127,494 | | | 2.39 | % | | 380,609 | | | 2.21 | % | | 137,581 | | | 2.07 | % | | 52,056 | | | 1.91 | % |
| Obligations of state and other political subdivisions | | 57,012 | | | 3.26 | % | | 276,695 | | | 2.84 | % | | 493,123 | | | 2.11 | % | | 258,902 | | | 2.00 | % |
| Asset-backed securities | | 43,901 | | | 2.93 | % | | 414,834 | | | 2.21 | % | | 249,443 | | | 2.07 | % | | 11,403 | | | 2.14 | % |
| Other securities | | 24,925 | | | 5.46 | % | | 87,793 | | | 5.42 | % | | 17,659 | | | 4.47 | % | | 4,496 | | | 4.08 | % |
| Total | | $ | 401,251 | | | 3.26 | % | | $ | 1,885,144 | | | 2.71 | % | | $ | 1,492,813 | | | 1.96 | % | | $ | 428,638 | | | 1.95 | % |
(1) Tax equivalent basis was calculated using a 21% tax rate and yields were based on amortized cost.
(2) Maturity represents estimated life of investment securities.
LENDING PRACTICES
First Financial remains dedicated to meeting the financial needs of individuals and businesses through its client-focused business model. The loan portfolio is comprised of a broad range of borrowers primarily located in the Ohio, Indiana and Kentucky markets; however, the commercial finance line of business serves a national client base.
First Financial’s loan portfolio consists of commercial loan types, including C&I, lease financing (equipment leasing), construction real estate and commercial real estate, as well as consumer loan types, such as residential real estate, home equity, installment and credit card loans. First Financial's lending portfolios are managed to avoid the creation of inappropriate industry, geographic, franchise concept or borrower concentration risk.
Credit Management. Subject to First Financial’s credit policy and guidelines, credit underwriting and approval occur within the market and/or the centralized line of business originating the loan. First Financial has delegated a lending limit sufficient to address the majority of client requests in a timely manner to each market president and line of business manager. Loan requests for amounts greater than those limits require the approval of a designated credit officer or senior credit committee and may require additional approvals from the chief credit officer, the chief executive officer and the board of directors. This allows First Financial to manage the initial credit risk exposure through a standardized, strategic and disciplined approval process, but with an increasingly higher level of authority. Plans to purchase or sell a participation in a loan, or a group of loans, requires the approval of certain senior lending and administrative officers, and in some cases could include the board of directors.
Credit management practices are dependent on the type and nature of the loan. First Financial monitors all significant
First Financial Bancorp 2021 Annual Report 23
Management’s Discussion and Analysis of Financial Condition and Results of Operations
exposures on an ongoing basis. Commercial loans are assigned internal risk ratings reflecting the risk of loss inherent in the loan. These internal risk ratings are assigned upon initial approval of credit and are updated periodically thereafter. First Financial reviews and adjusts its risk ratings based on actual experience, which is the basis for determining an appropriate ACL. First Financial's commercial risk ratings of pass, special mention, substandard and doubtful are derived from standard regulatory rating definitions and facilitate the monitoring of credit quality across the commercial loan portfolio. For further information regarding these risk ratings, see Note 5 – Loans and Leases in the Notes to the Consolidated Financial Statements.
Commercial loans rated as special mention, substandard or doubtful are considered criticized, while loans rated as substandard or doubtful are considered classified. Commercial loans may be designated as criticized/classified based on individual borrower performance or industry and environmental factors. Criticized/classified loans are subject to more frequent internal reviews to assess the borrower’s credit status and develop appropriate action plans.
Classified loans are considered to be the leading indicator of credit losses, and are typically managed by the Special Assets Department. Special Assets is a commercial credit group whose primary focus is to handle the day-to-day management of commercial workouts, recoveries and problem loan resolutions. Special Assets ensures that First Financial has appropriate oversight, improved communication and timely resolution of issues throughout the loan portfolio. Additionally, the Credit Risk Management group within First Financial's Risk Management function provides independent, objective oversight and assessment of commercial credit quality and processes.
Consumer lending credit approvals are based on, among other factors, the financial strength and payment history of the borrower, type of exposure and the transaction structure. Consumer loans are generally smaller dollar amounts than other types of lending and are made to a large number of customers, providing diversification within the portfolio. Credit risk in the consumer loan portfolio is managed by loan type, and consumer loan asset quality indicators, including delinquency, are continuously monitored. The Credit Risk Management group performs product-level performance reviews and assesses credit quality and compliance with underwriting and loan administration guidelines across the consumer loan portfolio.
LOANS AND LEASES
2021 vs. 2020. Loans, excluding loans held for sale, totaled $9.3 billion at December 31, 2021, decreasing $612.7 million, or 6.2%, compared to December 31, 2020. C&I loans decreased $287.5 million, or 9.6%, largely due to the forgiveness of PPP loans originated in response to COVID-19. Construction real estate loans decreased $180.2 million, or 28.3%, while Commercial real estate loans decreased $81.2 million, or 1.9%. The decline in CRE loans was driven by the sale of $143.5 million of loans in the fourth quarter of 2021 in order to address various portfolio concentrations. Residential real estate loans declined $107.0 million, or 10.7%, and Home equity loans decreased $34.7 million, or 4.7%, as demand for these loans moderated in 2021. Partially offsetting these declines were increases in both installment loans and lease financing. Finance lease balances increased $36.6 million, or 50.2%, primarily due to the acquisition of $42.3 million of leases in the Summit acquisition. Installment loans increased $37.6 million, or 45.9%, during 2021 as a result of First Financial's partnership with Upstart lending, which sourced $43.8 million of loans during the year. Average loan balances, including loans held for sale, were $9.6 billion at December 31, 2021, a decrease of $262.4 million, or 2.7%, compared to December 31, 2020.
Table 6 – Loan Maturity/Rate Sensitivity indicates the contractual maturity of all loans outstanding at December 31, 2021 as well as their sensitivity to changes in interest rates.
For discussion of risks associated with the loan portfolio and First Financial's ACL, see the Asset Quality and Credit Risk section included in Management’s Discussion and Analysis.
24 First Financial Bancorp 2021 Annual Report
| | | | | | | | | | | | | | | | | | | | | | | | | | | | | | | | |
| Table 6 • Loan Maturity/Rate Sensitivity |
| | December 31, 2021 |
| | Maturity |
| | | | After one | | After five | | | | |
| | Within | | but within | | but within | | After | | |
| (Dollars in thousands) | | one year | | five years | | fifteen years | | fifteen years | | Total |
| Commercial & industrial | | $ | 704,058 | | | $ | 1,626,372 | | | $ | 386,415 | | | $ | 3,183 | | | $ | 2,720,028 | |
| Lease financing | | 30,133 | | | 74,467 | | | 5,024 | | | 0 | | | 109,624 | |
| Construction real estate | | 163,587 | | | 203,477 | | | 38,701 | | | 50,129 | | | 455,894 | |
| Commercial real estate | | 687,329 | | | 2,063,317 | | | 1,431,225 | | | 44,743 | | | 4,226,614 | |
| Residential real estate | | 35,639 | | | 117,635 | | | 313,007 | | | 429,788 | | | 896,069 | |
| Home equity | | 24,883 | | | 119,239 | | | 191,635 | | | 372,642 | | | 708,399 | |
| Installment | | 27,205 | | | 75,122 | | | 15,396 | | | 1,731 | | | 119,454 | |
| Credit card | | 0 | | | 0 | | | 0 | | | 52,217 | | | 52,217 | |
| Total | | $ | 1,672,834 | | | $ | 4,279,629 | | | $ | 2,381,403 | | | $ | 954,433 | | | $ | 9,288,299 | |
| | | | | | | | | | |
| | | | After one | | After five | | | | |
| | Within | | but within | | but within | | After | | |
| (Dollars in thousands) | | one year | | five years | | fifteen years | | fifteen years | | Total |
| Fixed rate | | | | | | | | | | |
| Commercial & industrial | | $ | 153,461 | | | $ | 252,689 | | | $ | 99,564 | | | $ | 1,265 | | | $ | 506,979 | |
| Lease financing | | 30,133 | | | 74,467 | | | 5,024 | | | 0 | | | 109,624 | |
| Construction real estate | | 6,805 | | | 566 | | | 3,436 | | | 41,900 | | | 52,707 | |
| Commercial real estate | | 105,840 | | | 289,597 | | | 75,303 | | | 1,847 | | | 472,587 | |
| Residential real estate | | 27,418 | | | 82,227 | | | 222,022 | | | 331,931 | | | 663,598 | |
| Home equity | | 13,070 | | | 51,688 | | | 72,346 | | | 22,671 | | | 159,775 | |
| Installment | | 23,480 | | | 73,602 | | | 15,270 | | | 1,625 | | | 113,977 | |
| Credit card | | 0 | | | 0 | | | 0 | | | 374 | | | 374 | |
| Total | | $ | 360,207 | | | $ | 824,836 | | | $ | 492,965 | | | $ | 401,613 | | | $ | 2,079,621 | |
| | | | | | | | | | |
| Variable rate | | | | | | | | | | |
| Commercial & industrial | | $ | 550,597 | | | $ | 1,373,683 | | | $ | 286,851 | | | $ | 1,918 | | | $ | 2,213,049 | |
| Lease financing | | 0 | | | 0 | | | 0 | | | 0 | | | 0 | |
| Construction real estate | | 156,782 | | | 202,911 | | | 35,265 | | | 8,229 | | | 403,187 | |
| Commercial real estate | | 581,489 | | | 1,773,720 | | | 1,355,922 | | | 42,896 | | | 3,754,027 | |
| Residential real estate | | 8,221 | | | 35,408 | | | 90,985 | | | 97,857 | | | 232,471 | |
| Home equity | | 11,813 | | | 67,551 | | | 119,289 | | | 349,971 | | | 548,624 | |
| Installment | | 3,725 | | | 1,520 | | | 126 | | | 106 | | | 5,477 | |
| Credit card | | 0 | | | 0 | | | 0 | | | 51,843 | | | 51,843 | |
| Total | | $ | 1,312,627 | | | $ | 3,454,793 | | | $ | 1,888,438 | | | $ | 552,820 | | | $ | 7,208,678 | |
COMMITMENTS AND CONTINGENCIES
Off-balance sheet arrangements include commitments to extend credit and financial guarantees. Loan commitments are agreements to extend credit to a client absent any violation of any condition established in the commitment agreement. Commitments generally have fixed expiration dates or other termination clauses and may require payment of a fee. First Financial had commitments outstanding to extend credit totaling $4.0 billion and $3.4 billion at December 31, 2021 and 2020, respectively. This increase in commitments was driven by the Company's strong origination efforts during the year. As of December 31, 2021, loan commitments with a fixed interest rate totaled $129.2 million while commitments with variable interest rates totaled $3.8 billion. The fixed rate loan commitments have interest rates ranging from 0% to 21% for both
First Financial Bancorp 2021 Annual Report 25
December 31, 2021 and 2020 and have maturities ranging from less than 1 year to 30.9 years at December 31, 2021 and less than 1 year to 30.8 years at December 31, 2020.
Letters of credit are conditional commitments issued by First Financial to guarantee the performance of a client to a third party. First Financial’s portfolio of letters of credit consists primarily of performance assurances made on behalf of clients who have a contractual commitment to produce or deliver goods or services. First Financial has issued letters of credit aggregating $41.1 million and $36.1 million at December 31, 2021, and 2020, respectively. Management conducts regular reviews of these instruments on an individual client basis.
First Financial is a party in risk participation transactions of interest rate swaps, which had total notional amount of $362.8 million and $242.4 million at December 31, 2021 and 2020, respectively.
First Financial is a limited partner in several tax-advantaged limited partnerships whose purpose is to invest in approved qualified affordable housing, renewable energy, or other renovation or community revitalization projects. These investments are included in Accrued interest and other assets in the Consolidated Balance Sheets, with any unfunded commitments included in Accrued interest and other liabilities in the Consolidated Balance Sheets. As of December 31, 2021, First Financial expects to recover its remaining investments through the use of the tax credits that are generated by the investments. First Financial had unfunded commitments related to tax credit investments of $72.5 million and $55.6 million at December 31, 2021 and 2020, respectively.
Additionally, as part of the ordinary course of business, First Financial and its subsidiaries are parties to other litigation, including claims to the ownership of funds in particular accounts, the collection of delinquent accounts, challenges to security interests in collateral, foreclosure interests that are incidental to our regular business activities and other matters. While the ultimate liability with respect to these litigation matters and claims cannot be determined at this time, First Financial believes that damages, if any, and other amounts relating to pending matters are not probable or cannot be reasonably estimated as of December 31, 2021. Reserves are established for these various matters of litigation, when appropriate, under FASB ASC Topic 450, Contingencies, based in part upon the advice of legal counsel. First Financial had no reserves related to litigation matters as of December 31, 2021 or December 31, 2020.
ASSET QUALITY AND ALLOWANCE FOR CREDIT LOSSES
Loans are classified as nonaccrual when, in the opinion of management, collection of principal or interest is doubtful or when principal or interest payments are 90 days or more past due. Generally, loans are classified as nonaccrual due to a borrower's continued failure to adhere to contractual payment terms, coupled with other pertinent factors. When a loan is classified as nonaccrual, the accrual of interest income is discontinued and previously accrued but unpaid interest is reversed.
Loans are classified as TDRs when borrowers are experiencing financial difficulties and concessions are made by the Company that would not otherwise be considered for a borrower with similar credit characteristics. TDRs are generally classified as nonaccrual for a minimum period of six months and may qualify for return to accrual status once they have demonstrated performance with the restructured terms of the loan agreement.
Nonperforming assets consist of nonaccrual loans, accruing TDRs (collectively, nonperforming loans) and OREO.
See Table 7 – Summary of the ACL and Selected Statistics for a summary of First Financial’s nonaccrual loans, TDRs and OREO.
2021 vs. 2020. Nonaccrual loans were $48.4 million, or 0.52% of total loans as of December 31, 2021. This represents a $32.4 million, or 40.1%, decline from $80.8 million as of December 31, 2020. The decline in nonaccrual loans was a result of strong resolution efforts during the year, in addition to risk rating upgrades as borrower performance improved since the beginning of the pandemic. Total nonperforming assets declined $29.0 million, or 32.6%, to $60.1 million at December 31, 2021 from $89.1 million at December 31, 2020. The decline in nonperforming assets was driven by the decline in nonaccrual loans as well as a $1.2 million decline in OREO balances, which was partially offset by a $4.5 million increase in accruing TDRs.
Classified asset balances declined $37.2 million, or 26.2%, to $104.8 million at December 31, 2021 from $142.0 million at December 31, 2020. The improvement in classified asset balances during 2021 was driven by strong resolution efforts during the year, including the loan sales, as well as an improvement in general economic conditions.
26 First Financial Bancorp 2021 Annual Report
Allowance for credit losses. The ACL is a reserve accumulated on the Consolidated Balance Sheets through the recognition of the provision for loan and lease losses. First Financial records provision expense in the Consolidated Statements of Income to maintain the ACL at a level considered sufficient to absorb expected credit losses for financial assets in the portfolio over their expected remaining lives with consideration given to current and forward-looking information.
The recorded values of the loans and leases actually removed from the Consolidated Balance Sheets due to credit deterioration are referred to as charge-offs. First Financial's policy is to charge-off all or a portion of a loan when, in management's opinion, it is unlikely to collect the principal amount owed in full either through payments from the borrower or from the liquidation of collateral. All loans charged-off are subject to continuous review and concerted efforts are made to maximize any recovery. In most cases, the borrower’s debt obligation is not canceled even though the balance may have been charged-off. Actual losses on loans and leases are charged against the ACL. Any subsequent recovery of a previously charged-off loan is credited back to the ACL.
Management estimates the allowance using relevant available information from both internal and external sources, relating to past events, current conditions and reasonable and supportable forecasts. Historical credit loss experience paired with economic forecasts provide the basis for the quantitatively modeled estimation of expected credit losses. First Financial adjusts its quantitative model, as necessary, to reflect conditions not already considered therein. These adjustments are commonly known as the Qualitative Framework. The evaluation of these factors is the responsibility of the ACL committee, which is comprised of senior officers from the risk management, credit administration, finance and lending areas.
See Table 7 – Summary of the ACL and Selected Statistics for a summary of activity impacting the ACL and Table 13 – Allocation of the ACL for detail on its composition.
2021 vs. 2020. The ACL at December 31, 2021 was $132.0 million, or 1.42% of loans, which was a $43.7 million, or 24.9%, decrease from $175.7 million, and 1.77% of loans at December 31, 2020. Provision expense decreased $89.8 million, or 126.9%, to $19.0 million of provision recapture in 2021 from $70.8 million of provision expense in 2020. The ACL and corresponding provision expense was elevated in 2020 due to the adverse economic impact of COVID-19, however, the ACL declined in 2021 as the Company's economic outlook and credit trends improved.
The Company utilized the Moody's December baseline forecast as its R&S forecast in the quantitative model as of December 31, 2021. For reasonableness, the Company also considered the impact to the model from alternative, more adverse economic forecasts, slower prepayment speeds and increased default rates. These alternative analyses were utilized to inform the Company's qualitative adjustments. Additionally, First Financial considered its credit exposure to certain industries believed to be at risk for future credit stress related to the COVID-19 pandemic, such as franchise, hotel and investor commercial real estate lending when making qualitative adjustments to the ACL model.
Net charge-offs increased $10.4 million, or 72.9%, to $24.7 million for 2021 compared to $14.3 million for 2020, while the ratio of net charge-offs as a percentage of average loans outstanding increased to 0.26% in 2021 from 0.14% in 2020. This increase in net charge-offs was primarily driven by the sale of $133.8 million of hotel loans in 2021, which resulted in $9.2 million of additional net charge-offs. This loan sale was executed to address various portfolio concentrations.
The ACL as a percentage of nonaccrual loans was 272.8% at December 31, 2021 and 217.6% at December 31, 2020. The increase in this ratio was attributed to the decline in nonaccrual loans during the period, which more than offset the decrease in the ACL. The ACL as a percentage of nonperforming loans, including accruing TDRs was 220.0% at December 31, 2021 compared with 200.0% at December 31, 2020.
Provision expense is a product of the Company's ACL model combined with net charge-off activity during the period. Provision expense decreased $89.8 million during 2021 as the Company recorded $19.0 million of provision recapture during the period compared to $70.8 million of provision expense in 2020.
The ACL on unfunded commitments was $13.4 million as of December 31, 2021 and $12.5 million as of December 31, 2020.
Additionally, First Financial recorded $0.9 million of provision expense on unfunded commitments for the year ended
December 31, 2021 compared to $0.2 million of provision recapture for the same period of 2020. The increases in both the ACL and provision expense on unfunded commitments were driven by an increase in the volume of outstanding commitments due to strong origination efforts during 2021.
See Note 6 – Allowance for Credit Losses in the Notes to Consolidated Financial Statements for further discussion of First
First Financial Bancorp 2021 Annual Report 27
Management’s Discussion and Analysis of Financial Condition and Results of Operations
Financial's ACL.
28 First Financial Bancorp 2021 Annual Report
For further discussion of First Financial's ACL, see Note 6 – Allowance for Credit Losses in the Notes to Consolidated Financial Statements.
| | | | | | | | | | | | | | | | | | | | | | | | | | | | | | | | |
| Table 7 • Summary of the ACL and Selected Statistics |
| (Dollars in thousands) | | 2021 | | 2020 | | 2019 | | 2018 | | 2017 |
| Transactions in the allowance for credit losses: | | | | | | | | | | |
| Balance at January 1 | | $ | 175,679 | | | $ | 57,650 | | | $ | 56,542 | | | $ | 54,021 | | | $ | 57,961 | |
| Day one adoption impact of ASC 326 | | 0 | | | 61,505 | | | 0 | | | 0 | | | 0 | |
| Purchase accounting ACL for PCD | | 17 | | | 0 | | | 0 | | | 0 | | | 0 | |
| Provision for credit losses | | (19,024) | | | 70,796 | | | 30,598 | | | 14,586 | | | 3,582 | |
| Loans charged-off: | | | | | | | | | | |
| Commercial & industrial | | 15,620 | | | 5,345 | | | 26,676 | | | 11,533 | | | 10,194 | |
| Lease financing | | 0 | | | 852 | | | 162 | | | 0 | | | 0 | |
| Construction real estate | | 1,498 | | | 0 | | | 0 | | | 0 | | | 1 | |
| Commercial real estate | | 13,471 | | | 12,100 | | | 3,689 | | | 4,835 | | | 1,038 | |
| Real estate-residential | | 127 | | | 488 | | | 677 | | | 422 | | | 435 | |
| Home equity | | 1,073 | | | 1,541 | | | 2,591 | | | 1,725 | | | 913 | |
| Installment | | 334 | | | 148 | | | 223 | | | 435 | | | 225 | |
| Credit card | | 780 | | | 885 | | | 1,547 | | | 1,720 | | | 857 | |
| Total loans charged-off | | 32,903 | | | 21,359 | | | 35,565 | | | 20,670 | | | 13,663 | |
| | | | | | | | | | |
| Recoveries of loans previously charged-off: | | | | | | | | | | |
| Commercial & industrial | | 1,612 | | | 2,907 | | | 2,883 | | | 2,066 | | | 1,650 | |
| Lease financing | | 0 | | | 0 | | | 0 | | | 1 | | | 1 | |
| Construction real estate | | 3 | | | 17 | | | 68 | | | 146 | | | 89 | |
| Commercial real estate | | 4,785 | | | 2,262 | | | 1,113 | | | 4,106 | | | 2,719 | |
| Real estate-residential | | 228 | | | 381 | | | 273 | | | 211 | | | 215 | |
| Home equity | | 1,223 | | | 1,132 | | | 1,335 | | | 1,309 | | | 1,027 | |
| Installment | | 151 | | | 158 | | | 251 | | | 575 | | | 234 | |
| Credit card | | 221 | | | 230 | | | 152 | | | 191 | | | 206 | |
| Total recoveries | | 8,223 | | | 7,087 | | | 6,075 | | | 8,605 | | | 6,141 | |
| Net charge-offs | | 24,680 | | | 14,272 | | | 29,490 | | | 12,065 | | | 7,522 | |
| Balance at December 31 | | $ | 131,992 | | | $ | 175,679 | | | $ | 57,650 | | | $ | 56,542 | | | $ | 54,021 | |
| | | | | | | | | | |
| Net charge-offs to average loans and leases | | | | | | | | | | |
| Commercial & industrial | | 0.50 | % | | 0.08 | % | | 0.95 | % | | 0.38 | % | | 0.47 | % |
| Lease financing | | 0.00 | % | | 1.07 | % | | 0.17 | % | | 0.00 | % | | 0.00 | % |
| Construction real estate | | 0.26 | % | | 0.00 | % | | (0.01) | % | | (0.03) | % | | (0.02) | % |
| Commercial real estate | | 0.20 | % | | 0.23 | % | | 0.07 | % | | 0.02 | % | | (0.07) | % |
| Real estate-residential | | (0.01) | % | | 0.01 | % | | 0.04 | % | | 0.03 | % | | 0.05 | % |
| Home equity | | (0.02) | % | | 0.05 | % | | 0.16 | % | | 0.06 | % | | (0.02) | % |
| Installment | | 0.20 | % | | (0.01) | % | | (0.03) | % | | (0.15) | % | | (0.02) | % |
| Credit card | | 1.13 | % | | 1.39 | % | | 2.81 | % | | 3.19 | % | | 1.44 | % |
| Total net charge-offs | | 0.26 | % | | 0.14 | % | | 0.33 | % | | 0.15 | % | | 0.13 | % |
| | | | | | | | | | |
| | | | | | | | | | |
| | | | | | | | | | |
| Nonperforming assets | | | | | | | | | | |
Nonaccrual loans (2) | | $ | 48,392 | | | $ | 80,752 | | | $ | 48,165 | | | $ | 70,700 | | | $ | 24,082 | |
Accruing troubled debt restructurings | | 11,616 | | | 7,099 | | | 11,435 | | | 16,109 | | | 17,545 | |
| Total nonperforming loans | | 60,008 | | | 87,851 | | | 59,600 | | | 86,809 | | | 41,627 | |
| Other real estate owned (OREO) | | 98 | | | 1,287 | | | 2,033 | | | 1,401 | | | 2,781 | |
| Total nonperforming assets | | 60,106 | | | 89,138 | | | 61,633 | | | 88,210 | | | 44,408 | |
| Accruing loans past due 90 days or more | | 137 | | | 169 | | | 201 | | | 63 | | | 61 | |
| Total underperforming assets | | $ | 60,243 | | | $ | 89,307 | | | $ | 61,834 | | | $ | 88,273 | | | $ | 44,469 | |
| Total classified assets | | $ | 104,815 | | | $ | 142,021 | | | $ | 89,250 | | | $ | 131,668 | | | $ | 87,293 | |
| | | | | | | | | | |
| Credit quality ratios: | | | | | | | | | | |
| As a percent of year-end loans, net of unearned income: | | | | | | | | | | |
| Allowance for credit losses | | 1.42 | % | | 1.77 | % | | 0.63 | % | | 0.64 | % | | 0.90 | % |
| Nonaccrual loans | | 0.52 | % | | 0.82 | % | | 0.52 | % | | 0.80 | % | | 0.40 | % |
Nonperforming loans (1) | | 0.65 | % | | 0.89 | % | | 0.65 | % | | 0.98 | % | | 0.69 | % |
| Allowance for credit losses to nonaccrual loans | | 272.76 | % | | 217.55 | % | | 119.69 | % | | 79.97 | % | | 224.32 | % |
| Allowance for credit losses to nonperforming loans | | 219.96 | % | | 199.97 | % | | 96.73 | % | | 65.13 | % | | 129.77 | % |
(1) Includes loans classified as nonaccrual and troubled debt restructurings.
(2) Nonaccrual loans include nonaccrual TDRs of $16.0 million, $14.7 million, $18.5 million, $22.4 million, and $6.4 million, as of December 31, 2021, 2020, 2019, 2018, and 2017, respectively.
First Financial Bancorp 2021 Annual Report 29
Management’s Discussion and Analysis of Financial Condition and Results of Operations
| | | | | | | | | | | | | | | | | | | | | | | | | | | | | | | | | | | | | | | | | | | | | | | | | | | | | | | | | | | | | | |
Table 8 • Allocation of the ACL |
| | December 31, |
| | 2021 | | 2020 | | 2019 | | 2018 | | 2017 |
| (Dollars in thousands) | | Allowance | | Percent of Loans to Total Loans | | Allowance | | Percent of Loans to Total Loans | | Allowance | | Percent of Loans to Total Loans | | Allowance | | Percent of Loans to Total Loans | | Allowance | | Percent of Loans to Total Loans |
| Balance at End of Period Applicable to: | | | | | | | | | | | | | | | | | | | | |
| Commercial and industrial | | $ | 44,052 | | | 29.3 | % | | $ | 51,454 | | | 30.4 | % | | $ | 18,584 | | | 32.6 | % | | $ | 18,746 | | | 28.5 | % | | $ | 17,598 | | | 31.8 | % |
| Lease financing | | 1,633 | | | 1.2 | % | | 995 | | | 0.8 | % | | 971 | | | 0.8 | % | | 1,130 | | | 1.1 | % | | 675 | | | 1.5 | % |
| Real estate – construction | | 11,874 | | | 4.9 | % | | 21,736 | | | 6.4 | % | | 2,381 | | | 5.0 | % | | 3,413 | | | 6.2 | % | | 3,577 | | | 7.8 | % |
| Real estate – commercial | | 53,420 | | | 45.5 | % | | 76,795 | | | 43.5 | % | | 23,579 | | | 42.6 | % | | 21,048 | | | 42.5 | % | | 20,930 | | | 41.4 | % |
| Real estate – residential | | 6,225 | | | 9.6 | % | | 8,560 | | | 10.1 | % | | 5,299 | | | 10.3 | % | | 4,964 | | | 10.8 | % | | 4,683 | | | 7.8 | % |
| Installment, home equity & credit card | | 14,788 | | | 9.5 | % | | 16,139 | | | 8.8 | % | | 6,836 | | | 8.7 | % | | 7,241 | | | 10.9 | % | | 6,558 | | | 9.7 | % |
| Total | | $ | 131,992 | | | 100.0 | % | | $ | 175,679 | | | 100.0 | % | | $ | 57,650 | | | 100.0 | % | | $ | 56,542 | | | 100.0 | % | | $ | 54,021 | | | 100.0 | % |
DERIVATIVES
First Financial is authorized to use certain derivative instruments including interest rate caps, floors, swaps and foreign exchange contracts to meet the needs of its clients while managing interest rate risk associated with certain transactions. The Company does not use derivatives for speculative purposes.
First Financial primarily utilizes interest rate swaps, which generally involve the receipt by First Financial of floating rate amounts from swap counterparties in exchange for payments to these counterparties by First Financial of fixed rate amounts received from borrowers. This results in the Company's loan customers receiving fixed rate funding while providing First Financial with a floating rate asset.
In conjunction with participating interests in commercial loans, First Financial periodically enters into risk participation agreements with counterparties whereby First Financial assumes a portion of the credit exposure associated with an interest rate swap on the participated loan in exchange for a fee. Under these agreements, First Financial will make payments to the counterparty if the loan customer defaults on its obligation to perform under the interest rate swap contract with the counterparty.
First Financial enters into IRLCs and forward commitments for the future delivery of mortgage loans to third party investors, which are considered derivatives. When borrowers secure an IRLC with First Financial and the loan is intended to be sold, First Financial will enter into forward commitments for the future delivery of the loans to third party investors in order to hedge against the effect of changes in interest rates impacting IRLCs and loans held for sale.
First Financial may enter into foreign exchange derivative contracts for the benefit of commercial customers to hedge their exposure to foreign currency fluctuations. Similar to the hedging of interest rate risk from interest rate derivative contracts, First Financial also enters into foreign exchange contracts with major financial institutions to economically hedge the exposure from client driven foreign exchange activity.
See Note 12 – Derivatives in the Notes to Consolidated Financial Statements for additional information regarding First Financial's use of derivative instruments.
DEPOSITS
First Financial solicits deposits by offering commercial and consumer clients a wide variety of transaction and savings accounts, including checking, savings, money-market and time deposits of various maturities and rates.
2021 vs. 2020. First Financial's total deposits increased $640.0 million, or 5.2%, to $12.9 billion as of December 31, 2021 from $12.2 billion at December 31, 2020. This increase was driven by an increase in noninterest bearing deposits of $421.9 million, or 11.2%, an increase in savings deposits of $476.6 million, or 12.9%, and an increase in interest-bearing checking deposits of $284.0 million, or 9.7%. These increases were partially offset by a $542.5 million, or 29.0%, decline in time deposits. Total non-time deposit balances were $11.5 billion as of December 31, 2021 and $10.4 billion as of December 31, 2020.
30 First Financial Bancorp 2021 Annual Report
Total average deposits for 2021 increased $1.3 billion, or 11.4%, from 2020 primarily due to an increase in average noninterest bearing deposits of $694.6 million, or 21.0%, an increase in average interest-bearing demand deposits of $362.1 million, or 13.8%, and an increase in average savings deposits $804.8 million, or 24.7%, partially offset by a decrease in average time deposits of $566.3 million, or 26.1%. The year-over-year growth in average deposits was largely attributable to customers retaining stimulus payments, PPP loan proceeds and tax refunds.
Table 9 – Uninsured Deposits-Maturities of Time Deposits Greater Than or Equal to $250,000 details the contractual maturity of deposits that are not FDIC insured. Time Deposits Greater Than or Equal to $250,000 represent 1.5% and 1.8% of total deposits outstanding at December 31, 2021 and 2020 respectively.
| | | | | | | | | | | | | | | | | | | | | | |
| Table 9 • Uninsured Deposits-Maturities of Time Deposits Greater than or Equal to $250,000 |
| | |
| (Dollars in thousands) | | CDs | | IRAs | | | | Total |
| December 31, 2021 | | | | | | | | |
| Maturing in | | | | | | | | |
| 3 months or less | | $ | 37,198 | | | $ | 2,274 | | | | | $ | 39,472 | |
| 3 months to 6 months | | 46,053 | | | 1,215 | | | | | 47,268 | |
| 6 months to 12 months | | 51,377 | | | 4,571 | | | | | 55,948 | |
| over 12 months | | 49,945 | | | 2,993 | | | | | 52,938 | |
| Total | | $ | 184,573 | | | $ | 11,053 | | | | | $ | 195,626 | |
| | | | | | | | |
| December 31, 2020 | | | | | | | | |
| Maturing in | | | | | | | | |
| 3 months or less | | 59,960 | | | 2,610 | | | | | $ | 62,570 | |
| 3 months to 6 months | | 37,064 | | | 851 | | | | | 37,915 | |
| 6 months to 12 months | | 49,996 | | | 3,912 | | | | | 53,908 | |
| over 12 months | | 60,691 | | | 5,371 | | | | | 66,062 | |
| Total | | $ | 207,711 | | | $ | 12,744 | | | | | $ | 220,455 | |
BORROWINGS
First Financial's short-term borrowings are utilized to manage the Company's normal liquidity needs. These borrowings include repurchase agreements utilized for corporate sweep accounts with cash management account agreements in place, as well as overnight advances from the FHLB. The Company's long-term borrowings consist of subordinated debt, FRB borrowings, FHLB long-term advances, repurchase agreements utilizing investment securities pledged as collateral and a capital loan from a municipality.
2021 vs. 2020. Short-term borrowings increased $129.6 million, or 77.8%, to $296.2 million at December 31, 2021, from $166.6 million at December 31, 2020.
First Financial utilizes short-term borrowings and long-term advances from the FHLB as wholesale funding sources. First Financial had $225.0 million of short-term borrowings from the FHLB at December 31, 2021 compared to none at December 31, 2020. Short term borrowings also included repurchase agreements of $51.2 million and $126.6 million at December 31, 2021 and 2020, respectively. The Company had no federal funds purchased as of December 31, 2021 compared to $40.0 million at December 31, 2020.
Total long-term debt was $409.8 million and $776.2 million at December 31, 2021 and 2020, respectively. Outstanding subordinated debt totaled $313.2 million and $321.4 million as of December 31, 2021 and 2020, respectively. The Company issued $150.0 million of fixed to floating rate subordinated notes in the second quarter of 2020. The subordinated debt is treated as Tier 2 capital for regulatory capital purposes and also included unamortized valuation and debt issuance costs of $8.6 million and $9.3 million as of December 31, 2021 and 2020, respectively.
Additionally, in conjunction with the acquisition of Summit, First Financial assumed $96.4 million in outstanding long-term borrowings at December 31, 2021. These outstanding long-term borrowings consisted of $23.0 million of lines of credit with
First Financial Bancorp 2021 Annual Report 31
Management’s Discussion and Analysis of Financial Condition and Results of Operations
other banks utilized to operate the business and carried an average interest rate of 2.77%. Additionally, acquired long term borrowings included $73.4 million of term notes, both with and without recourse, with an average interest rate of 4.09%, that were used to finance Summit's equity investment in the purchase of equipment to be leased to customers. Shortly after year-end, First Financial paid off and terminated the outstanding bank lines of credit acquired in the Summit transaction and anticipates paydowns of the existing term loans in 2022.
The Company had no FRB advances from the PPPLF included in long-term borrowings as of December 31, 2021 compared to $435.0 million as of December 31, 2020. The PPPLF was established by the Federal Reserve to supply a source of liquidity and term financing to financial institutions participating in the PPP. These borrowings carried an interest rate of 0.35% and were secured by the Company's PPP loans.
The Company also had no FHLB long-term advances as of December 31, 2021, compared to $20.0 million at December 31, 2020. First Financial's total remaining borrowing capacity from the FHLB was $1.4 billion at December 31, 2021. For ease of borrowing execution, First Financial utilizes a blanket collateral agreement with the FHLB. First Financial pledged $5.8 billion of certain eligible residential, commercial and agricultural real estate loans, home equity lines of credit and certain agency CMOs, municipals and CMBS securities as collateral for borrowings from the FHLB as of December 31, 2021.
See Note 11 – Borrowings in the Notes to Consolidated Financial Statements for additional information on First Financial's borrowings.
LIQUIDITY
Liquidity management is the process by which First Financial manages the continuing flow of funds necessary to meet its financial commitments on a timely basis and at a reasonable cost. These funding commitments include withdrawals by depositors, credit commitments to borrowers, shareholder dividends, share repurchases, operating expenses and capital expenditures. Liquidity is derived primarily from deposit growth, principal and interest payments on loans and investment securities, maturing loans and investment securities and access to wholesale funding sources.
First Financial’s most stable source of liability-funded liquidity for both long and short-term needs is deposit growth and retention of the core deposit base. In addition to core deposit funding, First Financial also utilizes a variety of short and long-term funding sources, which include subordinated notes, longer-term advances from the FHLB and its short-term line of credit. For further information regarding the company's liability-funded liquidity, see Note 10 - Deposits and Note 11 - Borrowings.
First Financial has a $40.0 million short-term credit facility with an unaffiliated bank that matures in December, 2022. This facility has a variable interest rate and provides First Financial additional liquidity, if needed, for various corporate activities including the repurchase of First Financial common stock and the payment of dividends to shareholders. As of December 31, 2021, First Financial had an outstanding balance of $20.0 million. The credit agreement requires First Financial to comply with certain covenants including those related to asset quality and capital levels, and First Financial was in compliance with all covenants associated with this facility as of December 31, 2021.
Both First Financial and the Bank received investment grade credit ratings from Kroll Bond Rating Agency, Inc., an independent rating agency. These credit ratings impact the cost and availability of financing to First Financial, and a downgrade to these credit ratings could affect First Financial's or the Bank’s abilities to access the credit markets and potentially increase borrowing costs, negatively impacting financial condition and liquidity. Key factors in maintaining high credit ratings include consistent and diverse earnings, strong credit quality and capital ratios, diverse funding sources and disciplined liquidity monitoring procedures. The ratings of First Financial and the Bank at December 31, 2021 were as follows:
| | | | | | | | |
| First Financial Bancorp | First Financial Bank |
| Senior Unsecured Debt | BBB+ | A- |
| Subordinated Debt | BBB | BBB+ |
| Short-Term Debt | K2 | K2 |
| Deposit | N/A | A- |
| Short-Term Deposit | N/A | K2 |
For ease of borrowing execution, First Financial utilizes a blanket collateral agreement with the FHLB. First Financial pledged $5.8 billion of certain eligible residential, commercial and farm real estate loans, home equity lines of credit and government, agency and CMBS investments as collateral for borrowings from the FHLB as of December 31, 2021.
32 First Financial Bancorp 2021 Annual Report
First Financial's principal source of asset-funded liquidity is marketable investment securities, particularly those of shorter maturities. The market value of investment securities classified as AFS totaled $4.2 billion and $3.4 billion at December 31, 2021 and 2020, respectively. HTM securities that are maturing within a short period of time can be an additional source of liquidity. As of December 31, 2021 and 2020, the Company had no HTM securities maturing within one year.
Other sources of liquidity include cash and due from banks and interest-bearing deposits with other banks. At December 31, 2021, these balances totaled $434.8 million, and First Financial had unused and available overnight wholesale funding sources of $4.8 billion, or 29.5% of total assets, to fund loan and deposit activities in addition to general corporate requirements.
Certain restrictions exist regarding the Bank's ability to transfer funds to First Financial in the form of cash dividends, loans, other assets or advances and the approval of the Bank's primary federal regulator is required to pay dividends in excess of regulatory limitations. Dividends paid to First Financial from the Bank totaled $200.0 million, $80.0 million and $196.8 million for 2021, 2020 and 2019, respectively. As of December 31, 2021, the bank had retained earnings of $722.2 million, of which $166.2 million was available for distribution to First Financial without prior regulatory approval. As an additional source of liquidity, First Financial had $49.7 million in cash at the parent company as of December 31, 2021.
Share repurchases also impact First Financial's liquidity. For further information regarding share repurchases, see the Capital section that follows.
Capital expenditures, such as banking center expansion, remodeling and technology investments, were $15.3 million for 2021, $16.5 million for 2020 and $20.9 million for 2019. Material commitments for capital expenditures as of December 31, 2021, were $33.7 million. Management believes that sufficient liquidity exists to fund its future capital expenditure commitments.
Management is not aware of any other trends, events or regulatory requirements that, if implemented, are likely to have a material effect on First Financial’s liquidity.
CAPITAL
Risk-Based Capital. First Financial and its subsidiary, First Financial Bank, are subject to regulatory capital requirements administered by federal banking agencies. Capital adequacy guidelines and, additionally for banks, prompt corrective action regulations involve quantitative measures of assets, liabilities and certain off-balance sheet items calculated under regulatory guidelines. Capital amounts and classifications are also subject to qualitative judgments by regulators. Failure to meet minimum capital requirements can initiate regulatory action.
The Board of Governors of the Federal Reserve System approved Basel III in order to strengthen the regulatory capital framework for all banking organizations, subject to a phase-in period for certain provisions. Basel III established and defined quantitative measures to ensure capital adequacy. These measures require First Financial to maintain minimum amounts and ratios of Common Equity Tier 1 capital, Total and Tier 1 capital to risk-weighted assets and Tier 1 capital to average assets (leverage ratio).
Basel III includes a minimum ratio of Common equity Tier 1 capital to risk-weighted assets of 7.0% and a fully phased-in capital conservation buffer of 2.5% of risk-weighted assets. Further, the minimum ratio of Tier 1 capital to risk-weighted assets is 8.5% and all banks are subject to a 4.0% minimum leverage ratio, while the minimum Total risk-based capital ratio is 10.5%. Failure to maintain the required Common equity Tier 1 capital will result in potential restrictions on a bank’s ability to pay dividends, repurchase stock and pay discretionary compensation to its employees. The capital requirements also provide strict eligibility criteria for regulatory capital instruments and change the method for calculating risk-weighted assets in an effort to better identify riskier assets, such as highly volatile commercial real estate and nonaccrual loans.
First Financial's tier 1 capital decreased to 11.22% at December 31, 2021 from 12.20% at December 31, 2020, while the total capital ratio decreased to 14.10% from 15.55% during the same period. The leverage ratio decreased to 8.70% at December 31, 2021,compared to 9.55% at December 31, 2020, while the Company’s tangible common equity ratio decreased to 7.58% at December 31, 2021 from 8.47% at December 31, 2020. The decline in the Company's capital ratios during 2021 was primarily driven by the acquisition of Summit and share repurchases during the year.
As of December 31, 2021, First Financial met all capital adequacy requirements to which it was subject. At December 31, 2021 and 2020, regulatory notifications categorized First Financial Bank as well-capitalized under the regulatory framework for
First Financial Bancorp 2021 Annual Report 33
Management’s Discussion and Analysis of Financial Condition and Results of Operations
prompt corrective action. There have been no conditions or events that management believes has changed the Company’s capital categorization.
For further detail on First Financial's capital ratios at December 31, 2021, see Note 19 – Capital in the Notes to Consolidated Financial Statements.
| | | | | | | | | | | | | | | | | |
| Table 10 • Capital Adequacy | | |
| | | December 31, |
| (Dollars in thousands) | | 2021 | | 2020 |
| Consolidated capital calculations | | |
| Common stock | | $ | 1,640,358 | | | $ | 1,638,947 | |
| Retained earnings | | 837,473 | | | 720,429 | |
| Accumulated other comprehensive loss | | (433) | | | 48,664 | |
| Treasury stock, at cost | | (218,456) | | | (125,970) | |
| Total shareholders' equity | | 2,258,942 | | | 2,282,070 | |
| Common equity tier 1 capital adjustments | | | | |
| Goodwill and other intangibles | | (1,105,116) | | | (1,015,132) | |
| Total tangible equity | | $ | 1,153,826 | | | $ | 1,266,938 | |
| Total assets | | $ | 16,329,141 | | | $ | 15,973,134 | |
| Goodwill and other intangibles | | (1,105,116) | | | (1,015,132) | |
| Total tangible assets | | $ | 15,224,025 | | | $ | 14,958,002 | |
| Common tier 1 capital | | $ | 1,262,789 | | | $ | 1,325,922 | |
| Tier 1 capital | | 1,306,571 | | | 1,368,818 | |
| Total capital | | 1,642,549 | | | 1,744,802 | |
| Total risk-weighted assets | | 11,645,666 | | | 11,219,114 | |
Average assets (1) | | 15,010,256 | | | 14,338,156 | |
| | | | | |
| Regulatory capital | | | | |
| Common tier 1 ratio | | 10.84 | % | | 11.82 | % |
| Tier 1 ratio | | 11.22 | % | | 12.20 | % |
| Total capital ratio | | 14.10 | % | | 15.55 | % |
| Leverage ratio | | 8.70 | % | | 9.55 | % |
| | | | | |
| Other capital ratios | | | | |
| Total shareholders' equity to ending assets | | 13.83 | % | | 14.29 | % |
| Total tangible shareholders' equity to ending tangible assets | | 7.58 | % | | 8.47 | % |
| | | | | |
(1) For purposes of calculating the Leverage ratio, certain intangible assets are excluded from average assets. |
First Financial generally seeks to balance the return of earnings to shareholders through shareholder dividends and share repurchases with capital retention in order to maintain adequate levels of capital and support the Company's growth plans.
Shareholder Dividends. First Financial’s dividend payout ratio, or total dividends paid divided by net income available to common shareholders, was 42.6%, 57.5% and 44.8% for the years 2021, 2020 and 2019, respectively. The dividend payout ratio is continually reviewed by management and the board of directors for consistency with First Financial’s overall capital planning activities and compliance with applicable regulatory limitations. In January 2022, the board of directors authorized a dividend of $0.23 per common share, payable on March 15, 2022 to all shareholders of record as of March 1, 2022.
Share Repurchases. Effective January 2022, First Financial's board of directors approved a stock repurchase plan (the 2022 Repurchase Plan), replacing the 2020 Repurchase Plan which became effective in January 2021. The 2022 Repurchase Plan continues for two years and authorizes the purchase of up to 5,000,000 shares of the Company's common stock and will expire in December 2023.
34 First Financial Bancorp 2021 Annual Report
The 2020 Repurchase Plan was authorized in December of 2020, and replaced the 2019 Repurchase Plan, which expired on December 31, 2020. The 2020 Repurchase Plan authorized the repurchase of up to 5,000,000 shares of the Company's common stock. In 2021, First Financial repurchased 4,633,355 shares at an average market price of $23.33 under the 2020 Plan.
Under the 2019 Repurchase Plan, First Financial repurchased 880,000 shares at an average market price of $18.96 during 2020 and 2,753,272 shares at an average market price of $24.05 during 2019.
Shareholders' Equity. Total shareholders’ equity at both December 31, 2021 and December 31, 2020 was $2.3 billion.
For further detail, see the Consolidated Statements of Changes in Shareholders’ Equity.
PENSION PLAN
First Financial sponsors a non-contributory defined-benefit pension plan covering substantially all employees. The significant assumptions used in the valuation and accounting for the pension plan include the discount rate, expected return on plan assets and the rate of employee compensation increase. The discount rate assumption was determined based on highly rated corporate bonds, weighted to adjust for their relative size, projected plan cash flows using the annuity substitution method as well as comparisons to external industry surveys. The expected return on plan assets was 7.25% for both 2021 and 2020, and was based on the composition of plan assets, actual returns, economic forecasts and economic trends. The assumed rate of compensation increase was 3.50% and was compared to historical increases for plan participants for reasonableness.
Presented below is the estimated impact on First Financial’s projected benefit obligation and pension expense as of December 31, 2021, assuming shifts in the significant assumptions:
| | | | | | | | | | | | | | | | | | | | | | | | | | | | | | | | | | | | | | |
| Discount rate | | Expected return on
plan assets | | Rate of compensation increase |
| (Dollars in thousands) | | -100 BP | | +100 BP | | -100 BP | | +100 BP | | -100 BP | | +100 BP |
| Change in Projected Benefit Obligation | | $ | 6,532 | | | $ | (4,731) | | | N/A | | N/A | | $ | (639) | | | $ | 1,379 | |
| Change in Pension Expense | | 231 | | | (222) | | | $ | 1,396 | | | $ | (1,396) | | | (450) | | | 585 | |
Based upon the plan’s current funding status and updated actuarial projections for 2021, First Financial recorded expense related to its pension plan of $3.4 million for 2021, $2.5 million for 2020 and $1.0 million for 2019 in the Consolidated Statements of Income. First Financial will make contributions to the plan if plan assets do not meet or exceed ERISA’s minimum funding standards. Given the plan's over-funded status, First Financial made no cash contributions to fund the pension plan in 2021, 2020 or 2019 nor does it expect to make a cash contribution in 2022.
See Note 16 – Employee Benefit Plans in the Notes to Consolidated Financial Statements for additional information on First Financial's pension plan.
ENTERPRISE RISK MANAGEMENT
First Financial considers risk to be any issue that could have an adverse impact on the Company's capital or earnings, or negatively impact the Company's ability to meet its objectives. First Financial manages risks through a structured ERM approach that routinely assesses the overall level of risk, identifies specific risks and evaluates the steps being taken to mitigate those risks. First Financial continues to enhance its risk management capabilities and has, over time, embedded risk awareness into the Company's culture. ERM allows First Financial to align a variety of risk management activities within the Company into a cohesive, enterprise-wide approach and focus on process-level risk management activities and strategic objectives within the risk management culture. Additionally, ERM allows the Company to deliberately develop risk responses and evaluate the effectiveness of mitigation compared to established thresholds for risk appetite and tolerance, in addition to facilitating the consideration of significant organizational changes and consolidation of information through a common process for management and the board of directors.
First Financial has identified nine types of risk that it monitors in its ERM framework. These risks include credit, market (composed of interest rate, liquidity, capital, foreign exchange and financial risk), operational, compliance, strategic, reputation, information technology, cyber and legal.
First Financial Bancorp 2021 Annual Report 35
Management’s Discussion and Analysis of Financial Condition and Results of Operations
First Financial uses a robust regulatory risk framework as one of the foundational components of its ERM framework. This allows for a common categorization across the Company and provides a consistent and complete risk framework that can be summarized and assessed enterprise-wide. Additionally, the risk framework utilized is consistent with that used by the Company’s regulators, which results in additional feedback on First Financial’s ability to assess and measure risk across the organization as well as the ability for management and the board of directors to identify and understand differences in assessed risk profiles.
ERM helps ensure that First Financial continues to identify and adequately address risks that emerge from a combination of new customers, products and associates, changing markets, new lines of business and processes and new or evolving systems.
The goals of First Financial’s ERM framework are to:
•focus on the Company at both the enterprise and line of business levels;
•align the Company's risk appetite with its strategic, operational, compliance and reporting objectives;
•enhance risk response decisions;
•reduce operational deficiencies and possible losses;
•identify and manage interrelated risks;
•provide integrated responses to multiple risks;
•improve the deployment and allocation of capital; and
•improve overall business performance.
Specific enterprise-level objectives include:
•creating a holistic view of risk in which risk is comprehensively considered, consistently communicated and documented in decision making;
•centralizing the oversight of risk management activities;
•defining the risks that will be addressed by the enterprise and each functional area or business unit to create an awareness of risks affecting the Company;
•establishing and maintaining systems and mechanisms to identify, assess, monitor and measure risks that may impact First Financial’s ability to achieve its business objectives;
•creating a process which ensures that, for all new lines of business and new product decisions, management evaluates the expertise needed and assesses the risks involved;
•establishing and maintaining systems and mechanisms to monitor risk responses;
•developing risk occurrence information systems to provide early warning of events or situations that create risk for the Company;
•maintaining a compliance culture and framework that ensures adherence to laws, rules and regulations, fair treatment and privacy of customers and prevention of money laundering and terrorist financing;
•implementing and reviewing risk measurement techniques that management may use to establish the Company’s risk tolerance, assess risk likelihood and impact, main effective controls and analyze risk and control monitoring processes; and
•establishing appropriate management reporting systems regarding the enterprise-wide risk exposures and allocation of capital.
Line of business-level objectives focus on why and where the particular business or business unit risk exists; how the business unit’s management of its risks affects the Company’s strategy, earnings, reputation and other key success factors; whether the line of business objectives are aligned with enterprise objectives, how effective internal procedures are integral to successful
business operations , and whether internal controls and their maintenance are reliable.
Board of Directors and Board Risk & Compliance Committees. First Financial’s board of directors is responsible for understanding the Company’s compliance and risk management objectives and risk tolerance, and as such, board oversight of the Company’s compliance and risk management activities is a key component to an effective risk management process. Responsibilities of the board of directors include:
•establishing and guiding the Company’s strategic direction and tolerance for risk, including the determination of the aggregate risk appetite and identifying the senior managers who have the responsibility for managing risk;
•monitoring the Company’s performance and overall risk profile, ensuring that the level of risk is maintained at prudent levels and is supported by adequate capital;
36 First Financial Bancorp 2021 Annual Report
•ensuring that the Company implements sound fundamental principles that facilitate the identification, measurement, monitoring and control of risk;
•ensuring that adequate resources are dedicated to compliance and risk management; and
•ensuring that awareness of risk management activities is evident throughout the organization.
The board of directors has defined broad risk tolerance levels, or limits, to guide management in the decision-making process, and is responsible for establishing information and communication requirements to ensure that risk management activities remain within these tolerance limits. The risk and compliance committee, a standing committee of the board of directors, is responsible for carrying out the board’s responsibilities in this regard. Other standing committees of the board (audit, compensation, corporate governance and nominating, and capital markets) oversee particular areas of risk governance assigned specifically to them.
Executive and Senior Management. Members of executive and senior management are responsible for managing risk activities and delegating risk authority and tolerance to the responsible risk owners.
Management must identify which processes and activities are critical to achieving the Company’s business objectives within tolerance levels. Management must then delegate responsibility, authority and accountability to the appropriate risk owners who are responsible for ensuring that the respective processes and activities are designed and implemented to manage the related risks within those delegated tolerance levels. Management analyzes and monitors risk management performance with key risk indicator (KRI) and key performance indicator (KPI) dashboards.
Chief Risk Officer. The chief risk officer is responsible for the oversight of the Company’s ERM processes. The chief risk officer may appoint other officers or establish other management committees as required for effective risk management and governance, including risk identification, risk measurement, risk monitoring, risk control or mitigation and risk reporting and assurance. The chief risk officer is also responsible for the maintenance of procedures, methodologies and guidelines considered necessary to administer the ERM program.
Chief Compliance Officer. The chief compliance officer is responsible for the oversight of the Company’s compliance management function, which includes Bank Secrecy Act/Anti-Money Laundering and all other regulatory compliance. The chief compliance officer is authorized to implement all necessary actions to ensure achievement of the objectives of an effective compliance program and may appoint other officers or establish other management committees as required for effective compliance management. The chief compliance officer reviews and evaluates compliance issues and concerns and is responsible for monitoring and reporting results of the compliance efforts in addition to providing guidance to the board of directors and senior management team on matters relating to compliance.
Committee Chairs. The ERM program utilizes multiple management committees as its primary assessment and communication mechanism for identified risks. Committee chairs play key roles in the execution of risk management activities throughout the enterprise and are responsible for continuous updates and communication among committee members in conjunction with the risk management department regarding changes to risk profiles, changes to risk assessments and the emergence of new risks that could impact the Company.
Internal Audit. Internal audit is responsible for planning audit activities to periodically reassess the design and operation of key risk management processes and to make periodic evaluations of the ongoing accuracy and effectiveness of the communications from risk owners to senior management and from senior management to the board of directors.
Risk Assessment Process. The periodic assessment of risks is a key component of a sound ERM program. Managers, business line leaders and executives are responsible for developing the risk and control assessment for their individual departments, business lines and subsidiaries. The chief risk officer, management and the board risk and compliance committee are responsible for ensuring that risk is viewed and analyzed from an enterprise-level global perspective. Furthermore, interrelated risks are considered, assessing how a single risk or event may create multiple risks.
Risk management programs, in each functional component and in aggregate, accomplish the following:
•identify risks and their respective owners;
•link identified risks and their mitigation to the Company's strategic objectives;
•evaluate the risks and their associated likelihood of occurrence and consequences;
•encourage employees in all units to develop a working understanding of upstream and downstream activities;
First Financial Bancorp 2021 Annual Report 37
Management’s Discussion and Analysis of Financial Condition and Results of Operations
•develop strategies to manage risk, such as avoiding the risk; reducing the negative effect of the risk; transferring the risk to another party; and/or accepting some or all of the consequences of a particular risk;
•prioritize the risk issues with regard to the current residual risk status and trend;
•provide reports to management and risk owners that will assist them in implementing appropriate risk management processes;
•assist management in assessing the alternatives for managing risks;
•assist management in the development of risk management plans; and
•track risk management/mitigation efforts.
Monitoring and Reporting. The board of directors oversees risk reporting and monitoring through the board risk and compliance committee, which meets at least quarterly.
Management continually reviews any risk identified as key, as well as the appropriateness of established tolerance limits and the actions considered as necessary to mitigate key risks. As circumstances warrant, management provides recommendations to the board risk and compliance committee related to changes or adjustments to key risks or tolerance limits.
First Financial believes that communication is fundamental to successful risk management and productive reporting and communication between the risk management department, management and the board of directors is required for collaborative and effective risk management.
CREDIT RISK
Credit risk represents the risk of loss due to failure of a customer or counterparty to meet its financial obligations in accordance with contractual terms. First Financial manages credit risk through its underwriting and ongoing administration practices, periodically reviewing and approving its credit exposures using credit policies and guidelines approved by the board of directors.
MARKET RISK
Market risk is the risk of loss arising from adverse changes in the fair value of financial instruments due to changes in interest rates, foreign exchange rates and equity prices. The primary sources of market risk for First Financial are interest rate risk and liquidity risk.
Interest rate risk is the risk to earnings and the value of the Company's equity arising from changes in market interest rates. Interest rate risk arises in the normal course of business to the extent that there is a divergence between the amount of interest-earning assets and the amount of interest-bearing liabilities that are prepaid, withdrawn, re-priced or mature in specified periods. First Financial seeks to achieve consistent growth in net interest income and equity while managing volatility from shifts in market interest rates.
First Financial monitors its interest rate risk position using income simulation models and EVE sensitivity analyses that capture both short-term and long-term interest rate risk exposure. Income simulation involves forecasting NII under a variety of interest rate scenarios. EVE is calculated by discounting the cash flows for all balance sheet instruments under different interest-rate scenarios. First Financial uses EVE sensitivity analysis to understand the impact of changes in interest rates on long-term cash flows, income and capital. For both NII and EVE modeling, First Financial leverages instantaneous parallel shocks to evaluate interest rate risk exposure across rising and falling rate scenarios. Additional scenarios evaluated include various non-parallel yield curve twists.
First Financial’s interest rate risk models are based on the contractual and assumed cash flows and repricing characteristics for the Company’s assets, liabilities and off-balance sheet exposure. A number of assumptions are also incorporated into the interest rate risk models, including prepayment behaviors and repricing spreads for assets in addition to attrition and repricing rates for liabilities. Assumptions are primarily derived from behavior studies of the Company’s historical client base and are continually refined. Modeling the sensitivity of NII and EVE to changes in market interest rates is highly dependent on the assumptions incorporated into the modeling process.
Non-maturity deposit modeling is particularly dependent on the assumption for repricing sensitivity known as a beta. Beta is the amount by which First Financial’s interest bearing non-maturity deposit rates will increase when short-term interest rates rise. The Company utilized a weighted average deposit beta of 36% in its interest rate risk modeling as of December 31, 2021.
38 First Financial Bancorp 2021 Annual Report
First Financial also includes an assumption for the migration of non-maturity deposit balances into CDs for all upward rate scenarios beginning with the +100 BP scenario, thereby increasing deposit costs and reducing asset sensitivity.
Presented below is the estimated impact on First Financial’s NII and EVE as of December 31, 2021, assuming immediate, parallel shifts in interest rates:
| | | | | | | | | | | | | | | | | | | | |
| | % Change from base case for
immediate parallel changes in rates |
| | -100 BP | | +100 BP | | +200 BP |
| NII - Year 1 | | (4.62)% | | 8.55% | | 16.36% |
| NII - Year 2 | | (6.70)% | | 12.14% | | 22.82% |
| EVE | | (9.10)% | | 6.40% | | 11.60% |
“Risk-neutral” refers to the absence of a strong bias toward either asset or liability sensitivity. “Asset sensitivity” is when a company's interest-earning assets reprice more quickly or in greater quantities than interest-bearing liabilities. Conversely, “liability sensitivity” is when a company's interest-bearing liabilities reprice more quickly or in greater quantities than interest-earning assets. In a rising interest rate environment, asset sensitivity results in higher net interest income while liability sensitivity results in lower net interest income. In a declining interest rate environment, asset sensitivity results in lower net interest income while liability sensitivity results in higher net interest income.
First Financial was within policy limits set for the disclosed interest rate scenarios as of December 31, 2021. The projected
results for NII and EVE reflected an asset sensitive position due to significant growth in low cost transactional deposits, which have replaced wholesale borrowings in the Company's funding mix. First Financial continues to manage its balance sheet with a bias toward modest asset sensitivity while simultaneously balancing the potential earnings impact of this strategy.
First Financial continually evaluates the sensitivity of its interest rate risk position to modeling assumptions. The following table reflects First Financial’s estimated NII sensitivity profile as of December 31, 2021 assuming both a 25% increase and decrease to the beta assumption on managed rate deposit products:
| | | | | | | | | | | | | | | | | | | | | | | | | | |
| | Beta sensitivity (% change from base) |
| | +100 BP | | +200 BP |
| | Beta 25% lower | | Beta 25% higher | | Beta 25% lower | | Beta 25% higher |
| NII-Year 1 | | 9.94 | % | | 7.15 | % | | 17.70 | % | | 15.01 | % |
| NII-Year 2 | | 13.56 | % | | 10.71 | % | | 24.20 | % | | 21.45 | % |
See the Net Interest Income section of Management’s Discussion and Analysis for further discussion.
Table 11 – Market Risk Disclosure projects the principal maturities and yields of First Financial’s interest-bearing financial instruments at December 31, 2021 for the next five years and thereafter, as well as the fair value of the instruments. For loans, securities and liabilities with contractual maturities, the table presents principal cash flows and related weighted-average interest rates by contractual maturities. For investment securities, including MBS and CMO, principal cash flows are based on estimated average lives. For loan instruments without contractual maturities, such as credit card loans, principal payments are allocated based on historical payment activity trends. Maturities for interest-bearing liability accounts with no contractual maturity dates are estimated according to historical experience of cash flows and current expectations of client behaviors when calculating fair value, but are included in the maturing in one year or less category as they can be withdrawn on demand.
First Financial Bancorp 2021 Annual Report 39
Management’s Discussion and Analysis of Financial Condition and Results of Operations
| | | | | | | | | | | | | | | | | | | | | | | | | | | | | | | | | | | | | | | | | | | | | | | | | | |
| Table 11 • Market Risk Disclosure |
| | | | Fair Value |
| | Principal Amount Maturing In | | December 31, |
| (Dollars in thousands) | | 2022 | | 2023 | | 2024 | | 2025 | | 2026 | | Thereafter | | Total | | 2021 |
| Rate sensitive assets | | | | | | | | | | | | | | | | |
Fixed interest rate loans (1) | | $ | 375,759 | | | $ | 245,285 | | | $ | 232,079 | | | $ | 197,991 | | | $ | 152,213 | | | $ | 869,669 | | | $ | 2,072,996 | | | $ | 2,108,197 | |
| Average interest rate | | 4.06 | % | | 4.79 | % | | 4.70 | % | | 4.40 | % | | 4.36 | % | | 3.78 | % | | 4.14 | % | | |
Variable interest rate loans (1) | | 1,323,413 | | | 969,489 | | | 1,041,841 | | | 643,965 | | | 851,411 | | | 2,282,674 | | | 7,112,793 | | | 7,093,396 | |
| Average interest rate | | 3.14 | % | | 3.27 | % | | 3.06 | % | | 2.99 | % | | 3.46 | % | | 3.25 | % | | 3.21 | % | | |
| Fixed interest rate securities | | 198,968 | | | 264,052 | | | 426,054 | | | 308,440 | | | 437,107 | | | 1,798,380 | | | 3,433,001 | | | 3,434,788 | |
| Average interest rate | | 3.01 | % | | 2.64 | % | | 2.40 | % | | 2.40 | % | | 2.42 | % | | 1.94 | % | | 2.22 | % | | |
| Variable interest rate securities | | 204,250 | | | 225,822 | | | 138,540 | | | 44,994 | | | 112,302 | | | 147,357 | | | 873,265 | | | 872,956 | |
| Average interest rate | | 3.48 | % | | 4.00 | % | | 3.25 | % | | 3.54 | % | | 2.45 | % | | 2.52 | % | | 3.29 | % | | |
| Other earning assets | | 214,811 | | | 0 | | | 0 | | | 0 | | | 0 | | | 0 | | | 214,811 | | | 214,811 | |
| Average interest rate | | 0.15 | % | | 0.00 | % | | 0.00 | % | | 0.00 | % | | 0.00 | % | | 0.00 | % | | 0.15 | % | | |
| | | | | | | | | | | | | | | | |
| Rate sensitive liabilities | | | | | | | | | | | | | | | | |
Noninterest-bearing checking (2) | | $ | 4,185,572 | | | $ | 0 | | | $ | 0 | | | $ | 0 | | | $ | 0 | | | $ | 0 | | | $ | 4,185,572 | | | $ | 4,185,572 | |
Savings and interest-bearing checking (2) | | 7,356,119 | | | 0 | | | 0 | | | 0 | | | 0 | | | 0 | | | 7,356,119 | | | 7,356,119 | |
| Average interest rate | | 0.07 | % | | 0.00 | % | | 0.00 | % | | 0.00 | % | | 0.00 | % | | 0.00 | % | | 0.07 | % | | |
| Time deposits | | 1,131,574 | | | 83,589 | | | 50,983 | | | 32,569 | | | 31,352 | | | 196 | | | 1,330,263 | | | 1,327,876 | |
| Average interest rate | | 0.41 | % | | 0.60 | % | | 0.65 | % | | 0.43 | % | | 0.63 | % | | 0.86 | % | | 0.44 | % | | |
| Fixed interest rate borrowings | | 268,714 | | | 12,269 | | | 12,706 | | | 129,346 | | | 13,625 | | | 150,172 | | | 586,832 | | | 589,196 | |
| Average interest rate | | 0.76 | % | | 3.50 | % | | 3.50 | % | | 5.11 | % | | 3.50 | % | | 5.35 | % | | 3.07 | % | | |
| Variable interest rate borrowings | | 71,203 | | | 0 | | | 0 | | | 0 | | | 0 | | | 48,000 | | | 119,203 | | | 118,576 | |
| Average interest rate | | 0.55 | % | | 0.00 | % | | 0.00 | % | | 0.00 | % | | 0.00 | % | | 2.79 | % | | 1.45 | % | | |
| | | | | | | | | | | | | | | | |
| | | | | | | | | | | | | | | | |
| | | | | | | | | | | | | | | | |
| | | | | | | | | | | | | | | | |
| | | | | | | | | | | | | | | | |
| | | | | | | | | | | | | | | | |
(1) Includes loans held for sale.
(2) Deposits without a stated maturity are represented as maturing within one year due to the ability of the client to withdraw deposited amounts on demand.
Liquidity risk is the potential that an entity will be unable to meet its obligations as they come due because of an inability to liquidate assets or obtain funding or that it cannot easily unwind or offset exposures without significantly lowering market prices because of inadequate market depth or market disruptions. Management focuses on maintaining and enhancing liquidity by maximizing collateral-based liquidity availability. First Financial manages liquidity in relation to the trend and stability of deposits; degree and reliance on short-term, volatile sources of funds, including any undue reliance on borrowings or brokered deposits to fund longer-term assets. Management identifies, measures, monitors and manages liquidity while seeking to maintain diversification of funding sources, both on- and off-balance-sheet.
In 2021, the Company continued to update liquidity risk management processes, such as refining the contingency funding plan, proactively meeting more frequently during the pandemic, securing additional contingent borrowing capacity, and developing additional ad-hoc liquidity reporting to monitor funding inflows and outflows related to the PPP funding and forgiveness. Management is closely monitoring the usage of excess business deposits, the balance of personal deposits and the broader macroeconomic environment. For further discussion of the Company's liquidity, please see the Liquidity section within Management's Discussion and Analysis.
OPERATIONAL RISK
Operational risk is the risk of loss due to human behavior, inadequate or failed internal systems and controls and external influences such as market conditions, fraudulent activities, natural disasters and security risks. First Financial continuously strives to strengthen the Company’s system of internal controls and operating processes as well as associates' ability to assess the impact on earnings and capital from operational risk.
40 First Financial Bancorp 2021 Annual Report
COMPLIANCE RISK
Compliance risk represents the risk of regulatory sanctions, reputational impact or financial loss resulting from the Company’s failure to comply with rules and regulations issued by the various banking agencies and standards of good banking practice. Activities which may expose First Financial to compliance risk include, but are not limited to, those dealing with the prevention of money laundering, privacy and data protection, community reinvestment initiatives, fair lending challenges resulting from the Company’s ongoing management of its banking center network and employment and tax matters.
STRATEGIC AND REPUTATION RISK
Strategic risk represents the risk of loss due to failure to fully develop and execute business plans, failure to assess current and new business opportunities, markets and products, inability to effectively manage human capital risk factors such as satisfaction, engagement, attrition, retention, and diversity, equity and, inclusion (DEI) and any other event not identified in the defined risk types previously mentioned. Strategic risk focuses on analyzing factors that affect the direction of the institution or improper implementation of decisions
Reputation risk represents the risk of loss or impairment of earnings and capital from negative publicity. This affects the ability of First Financial to establish new relationships or services or to continue servicing existing relationships. Reputation risk is recognized by the effect that public opinion could have on First Financial's franchise value and has evolved in recent years with the growth in social media. First Financial also seeks to build social responsibility into its brand and has formed a corporate responsibility working group to develop an initial corporate social responsibility (CSR) report, which will highlight First Financial’s efforts, goals, and plans to help the environment and our communities.
Mitigation of strategic and reputation risk elements is achieved through initiatives that help First Financial better understand and report on the various risks it faces each day, including those related to the development of new products and business initiatives and client feedback response and mitigation routines that analyze and share feedback data with business lines for client experience and process improvements.
INFORMATION TECHNOLOGY RISK
Information technology risk is the risk that the information technologies utilized by FFB are not efficiently and effectively supporting the current and future needs of the business, operating as intended or compromise the availability, integrity and reliability of data and information. This risk also considers whether or not the Company’s information technology exposes the Company's assets to potential loss or misuse, or threatens the Company’s ability to sustain the operation of critical business processes.
CYBERSECURITY RISK
Cyber risk is differentiated from information technology risk by threat interactions that yield high impact consequences and ever-increasing probability. First Financial continues to be the target of various evolving and adaptive cyber attacks, including malware, phishing and distributed denial-of-service, in order to disrupt the operations of financial institutions, potentially test their cybersecurity capabilities, commit fraud, or obtain confidential, proprietary or other information. While standard security operations address most day-to-day incidents, cyber risk includes threats and attacks that often use advanced tools, techniques and processes to evade detection or inflict maximum damage to an organization's information assets. Cyber threats and attacks adapt and evolve rapidly, so First Financial works to continuously enhance controls and processes to protect its networks and applications from attack, damage or unauthorized access. Critical components to the Company’s cyber risk control structure include corporate governance, threat intelligence, security awareness training and patch management programs. Cybersecurity risk mitigation includes effectively identifying, protecting against, detecting, responding to and recovering from cyber threats.
In 2021, there were multiple high-profile, highly successful supply chain attacks across multiple industries. In December, the Cybersecurity and Infrastructure Security Agency announced a critical vulnerability in the logging utility maintained by the Apache Software Foundation which affects Log4j, which is part of the Java programming language and is widely used by well-known software vendors and manufacturers to operate enterprise applications and cloud services. Successful exploitation of the vulnerability can be used to deploy malicious software (e.g. ransomware), steal data and disrupt operations. First Financial has assessed the risk to internal operations, customers and consumers based upon the evolving information and has taken action to mitigate the risk from this vulnerability.
First Financial Bancorp 2021 Annual Report 41
Management’s Discussion and Analysis of Financial Condition and Results of Operations
LEGAL RISK
Legal risk encompasses the impact of unenforceable contracts, lawsuits or adverse judgments, which can disrupt or otherwise negatively affect the Company’s operations or condition. Legal risk also includes the exposure from litigation, fiduciary relationships and contractual obligations from both traditional and nontraditional financial institution activities. Legal risk is present in all areas of the Company and its activities.
FOURTH QUARTER REVIEW
For the three months ended December 31, 2021, the Company reported net income of $46.9 million, or $0.50 per diluted common share. These results compare to net income of $60.0 million, or $0.63 per diluted common share, for the third quarter of 2021 and $48.3 million, or $0.49 per diluted common share, for the fourth quarter of 2020. Return on average assets for the fourth quarter of 2021 was 1.16% compared to a return on assets of 1.49% in the third quarter of 2021 and 1.20% in the fourth quarter of 2020.
Loan balances declined $72.6 million from the third quarter of 2021 primarily due to declines in PPP and ICRE loans. Loan balances increased $148.8 million, or 6.3% on an annualized basis, excluding PPP forgiveness of $120.2 million, $143.5 million of CRE loan sales, and $42.3 million in Summit finance leases acquired during the quarter.
Net interest margin for the fourth quarter of 2021 was 3.19% or 3.23% on a fully tax-equivalent basis. This was a 9 basis point decrease from the third quarter of 2021, and was driven by a decline in PPP forgiveness fees and lower asset yields. Asset yields declined modestly during the quarter due to continued pressure from the low interest rate environment and the growth of the investment securities portfolio. The impact on the net interest margin from these changes was partially offset by an increase in other non-PPP loan fees during the quarter.
Noninterest income was $45.7 million and included record Bannockburn income of $12.8 million, as well as elevated Wealth management fees of $6.0 million. In addition, Other noninterest income increased 23.9% during the period due to a $1.2 million increase in syndication fees.
Noninterest expenses of $109.6 million, increased $10.5 million, or 10.6% during the quarter, primarily driven by incentive compensation tied to the Company's strong financial performance, Summit acquisition expenses, tax credit investment write-downs and legal settlements.
The ACL, including both funded and unfunded reserves, was $145.4 million at December 31, 2021, and the Company recorded $7.7 million in total provision recapture during the fourth quarter. The provision recapture was driven by a 36.7% decline in classified asset balances and improved economic forecasts. Net charge-offs as a percentage of loans increased to 32 basis points on an annualized basis for the fourth quarter. Higher net charge-offs were driven by $9.2 million of net charge-offs resulting from a $133.8 million hotel loan loan sale during the period, which was executed in order to address various portfolio concentrations.
CRITICAL ACCOUNTING ESTIMATES
First Financial’s Consolidated Financial Statements are prepared based on the application of accounting policies, the most significant of which are described in Note 1 – Summary of Significant Accounting Policies in the Notes to Consolidated Financial Statements. These policies require the reliance on estimates and assumptions which are inherently subjective and may be susceptible to significant change. Changes in underlying factors, assumptions or estimates could have a material impact on First Financial’s future financial condition and results of operations. In management’s opinion, some of these estimates and assumptions have a more significant impact than others on First Financial’s financial reporting.
For First Financial, these estimates and assumptions include accounting for the ACL - loans and leases, goodwill, pension and income taxes. The estimates and assumptions made are based upon historical experience, future forecasts, or other factors that management believes to be reasonable under the circumstances. Because of the nature of the judgment and assumptions, actual results could differ from estimates, which could have a material effect on our financial condition and results of operations.
42 First Financial Bancorp 2021 Annual Report
FORWARD-LOOKING STATEMENTS
Certain statements contained in this report which are not statements of historical fact constitute forward-looking statements within the meaning of the Private Securities Litigation Reform Act of 1995. Words such as ‘‘believes,’’ ‘‘anticipates,’’ “likely,” “expected,” “estimated,” ‘‘intends’’ and other similar expressions are intended to identify forward-looking statements but are not the exclusive means of identifying such statements. Examples of forward-looking statements include, but are not limited to, statements we make about (i) our future operating or financial performance, including revenues, income or loss and earnings or loss per share, (ii) future common stock dividends, (iii) our capital structure, including future capital levels, (iv) our plans, objectives and strategies, and (v) the assumptions that underlie our forward-looking statements.
As with any forecast or projection, forward-looking statements are subject to inherent uncertainties, risks and changes in circumstances that may cause actual results to differ materially from those set forth in the forward-looking statements. Forward-looking statements are not historical facts but instead express only management’s beliefs regarding future results or events, many of which, by their nature, are inherently uncertain and outside of management’s control. It is possible that actual results and outcomes may differ, possibly materially, from the anticipated results or outcomes indicated in these forward-looking statements. Important factors that could cause actual results to differ materially from those in our forward-looking statements include the following, without limitation:
•economic, market, liquidity, credit, interest rate, operational and technological risks associated with the Company’s business;
•future credit quality and performance, including our expectations regarding future loan losses and our allowance for credit losses;
•the effect of and changes in policies and laws or regulatory agencies, including the Dodd-Frank Wall Street Reform and Consumer Protection Act and other legislation and regulation relating to the banking industry; (iv) management’s ability to effectively execute its business plans;
•mergers and acquisitions, including costs or difficulties related to the integration of acquired companies;
•the possibility that any of the anticipated benefits of the Company’s acquisitions will not be realized or will not be realized within the expected time period;
•the effect of changes in accounting policies and practices;
•changes in consumer spending, borrowing and saving and changes in unemployment;
•changes in customers’ performance and creditworthiness;
•the costs and effects of litigation and of unexpected or adverse outcomes in such litigation;
•current and future economic and market conditions, including the effects of declines in housing prices, high unemployment rates, U.S. fiscal debt, budget and tax matters, geopolitical matters, and any slowdown in global economic growth;
•the adverse impact on the U.S. economy, including the markets in which we operate, of the novel coronavirus, which causes the Coronavirus disease 2019 (“COVID-19”), global pandemic, and the impact of a slowing U.S. economy and increased unemployment on the performance of our loan and lease portfolio, the market value of our investment securities, the availability of sources of funding and the demand for our products;
•our capital and liquidity requirements (including under regulatory capital standards, such as the Basel III capital standards) and our ability to generate capital internally or raise capital on favorable terms;
•financial services reform and other current, pending or future legislation or regulation that could have a negative effect on our revenue and businesses, including the Dodd-Frank Act and other legislation and regulation relating to bank products and services;
First Financial Bancorp 2021 Annual Report 43
Management’s Discussion and Analysis of Financial Condition and Results of Operations
•the effect of the current interest rate environment or changes in interest rates or in the level or composition of our assets or liabilities on our net interest income, net interest margin and our mortgage originations, mortgage servicing rights and mortgage loans held for sale;
•the effect of a fall in stock market prices on our brokerage, asset and wealth management businesses;
•a failure in or breach of our operational or security systems or infrastructure, or those of our third-party vendors or other service providers, including as a result of cyber attacks;
•the effect of changes in the level of checking or savings account deposits on our funding costs and net interest margin; and
•our ability to develop and execute effective business plans and strategies.
These and other risk factors are more fully described in First Financial's Annual Report on Form 10-K for the year ended December 31, 2021 under the section entitled “Item 1A. Risk Factors” and from time to time, in other filings with the SEC. Readers are cautioned not to place undue reliance on these forward-looking statements, which speak only as of the date of this report. Actual results may differ materially from those expressed in or implied by any forward-looking statements. Except to the extent required by applicable law or regulation, First Financial undertakes no obligation to revise or update publicly any forward-looking statements for any reason.
44 First Financial Bancorp 2021 Annual Report
| | | | | | | | | | | | | | | | | | | | | | | | | | | | | | | | | | | | | | | | | | | | | | | | | | | | | | | | |
Statistical Information | | | | | | | | | | | | | | |
| | | | | | | | | | | | | | | | | | |
| | 2021 | | 2020 | | 2019 |
| (Dollars in thousands) | | Average Balance | | Interest | | Average Yield | | Average Balance | | Interest | | Average Yield | | Average Balance | | Interest | | Average Yield |
| Earning assets | | | | | | | | | | | | | | | | | | |
Loans and leases (1), (4) | | | | | | | | | | | | | | | | | | |
Commercial and industrial (2) | | $ | 2,790,733 | | | $ | 137,841 | | | 4.94 | % | | $ | 2,999,223 | | | $ | 143,720 | | | 4.79 | % | | $ | 2,505,615 | | | $ | 153,128 | | | 6.11 | % |
Lease financing (2) | | 67,822 | | | 2,739 | | | 4.04 | % | | 79,882 | | | 3,769 | | | 4.72 | % | | 92,902 | | | 3,964 | | | 4.27 | % |
| Construction-real estate | | 575,883 | | | 18,743 | | | 3.25 | % | | 535,740 | | | 20,497 | | | 3.83 | % | | 491,503 | | | 26,637 | | | 5.42 | % |
Commercial-real estate (2) | | 4,379,325 | | | 152,251 | | | 3.48 | % | | 4,317,396 | | | 177,038 | | | 4.10 | % | | 3,906,992 | | | 216,757 | | | 5.55 | % |
| Residential-real estate | | 971,692 | | | 40,275 | | | 4.14 | % | | 1,077,430 | | | 48,001 | | | 4.46 | % | | 1,025,394 | | | 47,635 | | | 4.65 | % |
| Installment and other consumer | | 854,780 | | | 34,906 | | | 4.08 | % | | 892,985 | | | 40,046 | | | 4.48 | % | | 926,129 | | | 52,539 | | | 5.67 | % |
| Total loans and leases | | 9,640,235 | | | 386,755 | | | 4.01 | % | | 9,902,656 | | | 433,071 | | | 4.37 | % | | 8,948,535 | | | 500,660 | | | 5.59 | % |
| | | | | | | | | | | | | | | | | | |
Investment securities (3) | | | | | | | | | | | | | | | | | | |
| Taxable | | 3,271,601 | | | 79,213 | | | 2.42 | % | | 2,460,707 | | | 73,789 | | | 3.00 | % | | 2,684,973 | | | 90,168 | | | 3.36 | % |
Tax-exempt (2) | | 841,639 | | | 23,193 | | | 2.76 | % | | 751,344 | | | 24,357 | | | 3.24 | % | | 603,902 | | | 22,273 | | | 3.69 | % |
Total investment securities (3) | | 4,113,240 | | | 102,406 | | | 2.49 | % | | 3,212,051 | | | 98,146 | | | 3.06 | % | | 3,288,875 | | | 112,441 | | | 3.42 | % |
| Interest-bearing deposits with other banks | | 73,170 | | | 147 | | | 0.20 | % | | 78,943 | | | 275 | | | 0.35 | % | | 35,814 | | | 805 | | | 2.25 | % |
| Total earning assets | | 13,826,645 | | | 489,308 | | | 3.54 | % | | 13,193,650 | | | 531,492 | | | 4.03 | % | | 12,273,224 | | | 613,906 | | | 5.00 | % |
| | | | | | | | | | | | | | | | | | |
| Nonearning assets | | | | | | | | | | | | | | | | | | |
| Allowance for credit losses | | (162,477) | | | | | | | (153,596) | | | | | | | (58,504) | | | | | |
| Cash and due from banks | | 242,201 | | | | | | | 245,436 | | | | | | | 191,864 | | | | | |
| Accrued interest and other assets | | 2,165,991 | | | | | | | 2,243,654 | | | | | | | 1,804,135 | | | | | |
| Total assets | | $ | 16,072,360 | | | | | | | $ | 15,529,144 | | | | | | | $ | 14,210,719 | | | | | |
| | | | | | | | | | | | | | | | | | |
| Interest-bearing liabilities | | | | | | | | | | | | | | | | | | |
| Deposits | | | | | | | | | | | | | | | | | | |
| Interest-bearing demand | | $ | 2,988,359 | | | $ | 1,930 | | | 0.06 | % | | $ | 2,626,252 | | | $ | 4,534 | | | 0.17 | % | | $ | 2,326,193 | | | $ | 12,748 | | | 0.55 | % |
| Savings | | 4,065,654 | | | 4,122 | | | 0.10 | % | | 3,260,882 | | | 7,232 | | | 0.22 | % | | 3,027,725 | | | 21,383 | | | 0.71 | % |
| Time | | 1,601,295 | | | 8,383 | | | 0.52 | % | | 2,167,553 | | | 30,156 | | | 1.39 | % | | 2,223,429 | | | 44,901 | | | 2.02 | % |
| Total interest-bearing deposits | | 8,655,308 | | | 14,435 | | | 0.17 | % | | 8,054,687 | | | 41,922 | | | 0.52 | % | | 7,577,347 | | | 79,032 | | | 1.04 | % |
| Borrowed funds | | | | | | | | | | | | | | | | | | |
| Short-term borrowings | | 204,503 | | | 198 | | | 0.10 | % | | 590,903 | | | 6,442 | | | 1.09 | % | | 1,146,719 | | | 25,235 | | | 2.20 | % |
| Long-term debt | | 442,720 | | | 16,466 | | | 3.72 | % | | 867,798 | | | 20,088 | | | 2.31 | % | | 522,340 | | | 19,057 | | | 3.65 | % |
| | | | | | | | | | | | | | | | | | |
| Total borrowed funds | | 647,223 | | | 16,664 | | | 2.57 | % | | 1,458,701 | | | 26,530 | | | 1.82 | % | | 1,669,059 | | | 44,292 | | | 2.65 | % |
| Total interest-bearing liabilities | | 9,302,531 | | | 31,099 | | | 0.33 | % | | 9,513,388 | | | 68,452 | | | 0.72 | % | | 9,246,406 | | | 123,324 | | | 1.33 | % |
| Noninterest-bearing liabilities | | | | | | | | | | | | | | | | | | |
| Noninterest-bearing demand deposits | | 4,005,034 | | | | | | | 3,310,483 | | | | | | | 2,524,011 | | | | | |
| Other liabilities | | 504,988 | | | | | | | 484,628 | | | | | | | 265,623 | | | | | |
| Shareholders' equity | | 2,259,807 | | | | | | | 2,220,645 | | | | | | | 2,174,679 | | | | | |
| Total liabilities and shareholders' equity | | $ | 16,072,360 | | | | | | | $ | 15,529,144 | | | | | | | $ | 14,210,719 | | | | | |
| Net interest income and interest rate spread (fully tax equivalent) | | | | $ | 458,209 | | | 3.21 | % | | | | $ | 463,040 | | | 3.31 | % | | | | $ | 490,582 | | | 3.67 | % |
| Net interest margin (fully tax equivalent) | | | | | | 3.31 | % | | | | | | 3.51 | % | | | | | | 4.00 | % |
| Interest income and yield | | | | $ | 483,217 | | | 3.49 | % | | | | $ | 524,963 | | | 3.98 | % | | | | $ | 607,578 | | | 4.95 | % |
| Interest expense and rate | | | | 31,099 | | | 0.33 | % | | | | 68,452 | | | 0.72 | % | | | | 123,324 | | | 1.33 | % |
| Net interest income and spread | | | | $ | 452,118 | | | 3.16 | % | | | | $ | 456,511 | | | 3.26 | % | | | | $ | 484,254 | | | 3.62 | % |
| Net interest margin | | | | | | 3.27 | % | | | | | | 3.46 | % | | | | | | 3.95 | % |
| | | | | | | | | | | | | | | | | | |
(1) Nonaccrual loans are included in average loan balance and loan fees are included in interest income. | | | | | | |
(2) Interest income on tax-exempt investments and on certain tax-exempt loans and leases has been adjusted to a tax equivalent basis using a 21% tax rate for 2020, 2019 and 2018. |
(3) Includes HTM securities, AFS securities and other investments. |
(4) Includes loans held-for-sale. | | | | | | | | | | | | | | | | | | |
| N/M = not meaningful | | | | | | | | | | | | | | | | | | |
| | | | | | | | | | | | | | | | | | |
First Financial Bancorp 2021 Annual Report 45
Management’s Report on Internal Control over Financial Reporting
First Financial’s management is responsible for establishing and maintaining adequate internal control over financial reporting. First Financial’s internal control over financial reporting is a process designed under the supervision of First Financial’s chief executive officer and chief financial officer to provide reasonable assurance regarding the reliability of financial reporting and the preparation of financial statements for external purposes in accordance with generally accepted accounting principles. Any system of internal control, no matter how well designed, has inherent limitations, including the possibility that a control can be circumvented or overridden and misstatements due to error or fraud may occur and not be detected. Also, because of changes in conditions, internal control effectiveness may vary over time. Accordingly, even an effective system of internal control will provide only reasonable assurance with respect to financial statement preparation. As of December 31, 2021, First Financial’s management, including the chief executive officer and the chief financial officer, evaluated the effectiveness of First Financial’s internal controls over financial reporting, using as its framework for that evaluation the Internal Control – Integrated Framework published by the Committee of Sponsoring Organizations (COSO) of the Treadway Commission (2013 framework). Based on the evaluation, we believe that, as of December 31, 2021, our internal control over financial reporting is effective based on those criteria.
As permitted, First Financial has excluded the operations of Summit Funding Group, Inc. acquired during 2021, which is described in Note 23 of the consolidated financial statements, from the scope of management’s report on internal control over financial reporting.
Crowe LLP, the independent registered public accounting firm that audited the consolidated financial statements included in this Form 10-K, has issued an attestation report on First Financial’s internal control over financial reporting as of December 31, 2021. The report, which expresses an unqualified opinion on First Financial’s internal control over financial reporting as of December 31, 2021, is included in the information that follows under the heading “Report of Independent Registered Public Accounting Firm."
| | | | | | | | | | | |
| /s/ Archie M. Brown | | /s/ James M. Anderson | |
| President and Chief Executive Officer | | Executive Vice President and Chief Financial Officer | |
| February 18, 2022 | | February 18, 2022 | |
46 First Financial Bancorp 2021 Annual Report
| | | | | | | | |
| | Crowe LLP Independent Member Crowe Global
|
| | |
| Report of Independent Registered Public Accounting Firm |
Shareholders and the Board of Directors of First Financial Bancorp
Cincinnati, Ohio
Opinions on the Financial Statements and Internal Control over Financial Reporting
We have audited the accompanying consolidated balance sheets of First Financial Bancorp (the "Company") as of December 31, 2021 and 2020, the related consolidated statements of income, comprehensive income, changes in shareholders’ equity, and cash flows for each of the years in the three-year period ended December 31, 2021, and the related notes (collectively referred to as the "financial statements"). We also have audited the Company’s internal control over financial reporting as of December 31, 2021, based on criteria established in Internal Control - Integrated Framework: (2013) issued by the Committee of Sponsoring Organizations of the Treadway Commission (COSO).
In our opinion, the financial statements referred to above present fairly, in all material respects, the financial position of the Company as of December 31, 2021 and 2020, and the results of its operations and its cash flows for each of the years in the three-year period ended December 31, 2021 in conformity with accounting principles generally accepted in the United States of America. Also in our opinion, the Company maintained, in all material respects, effective internal control over financial reporting as of December 31, 2021, based on criteria established in Internal Control - Integrated Framework: (2013) issued by COSO.
Change in Accounting Principle
As discussed in Note 2 to the financial statements, the Company has changed its method of accounting for credit losses effective January 1, 2020 due to the adoption of Financial Accounting Standards Board (FASB) Accounting Standards Codification No. 326, Financial Instruments – Credit Losses (ASC 326). The Company adopted the credit loss standard using the modified retrospective method such that prior period amounts are not adjusted and continue to be reported in accordance with previously applicable generally accepted accounting principles.
Basis for Opinions
The Company’s management is responsible for these financial statements, for maintaining effective internal control over financial reporting, and for its assessment of the effectiveness of internal control over financial reporting, included in the accompanying Management’s Report on Internal Control Over Financial Reporting. Our responsibility is to express an opinion on the Company’s financial statements and an opinion on the Company’s internal control over financial reporting based on our audits. We are a public accounting firm registered with the Public Company Accounting Oversight Board (United States) ("PCAOB") and are required to be independent with respect to the Company in accordance with the U.S. federal securities laws and the applicable rules and regulations of the Securities and Exchange Commission and the PCAOB. We conducted our audits in accordance with the standards of the PCAOB. Those standards require that we plan and perform the audits to obtain reasonable assurance about whether the financial statements are free of material misstatement, whether due to error or fraud, and whether effective internal control over financial reporting was maintained in all material respects.
Our audits of the financial statements included performing procedures to assess the risks of material misstatement of the financial statements, whether due to error or fraud, and performing procedures that respond to those risks. Such procedures included examining, on a test basis, evidence regarding the amounts and disclosures in the financial statements. Our audits also included evaluating the accounting principles used and significant estimates made by management, as well as evaluating the overall presentation of the financial statements. Our audit of internal control over financial reporting included obtaining an understanding of internal control over financial reporting, assessing the risk that a material weakness exists, and testing and
First Financial Bancorp 2021 Annual Report 47
evaluating the design and operating effectiveness of internal control based on the assessed risk. As permitted, the Company has excluded the operations of Summit Funding Group, Inc. acquired during 2021, which is described in Note 23 of the consolidated financial statements, from the scope of management’s report on internal control over financial reporting. As such, it has also been excluded from the scope of our audit of internal control over financial reporting. Our audits also included performing such other procedures as we considered necessary in the circumstances. We believe that our audits provide a reasonable basis for our opinions.
Definition and Limitations of Internal Control Over Financial Reporting
A company’s internal control over financial reporting is a process designed to provide reasonable assurance regarding the reliability of financial reporting and the preparation of financial statements for external purposes in accordance with generally accepted accounting principles. A company’s internal control over financial reporting includes those policies and procedures that (1) pertain to the maintenance of records that, in reasonable detail, accurately and fairly reflect the transactions and dispositions of the assets of the company; (2) provide reasonable assurance that transactions are recorded as necessary to permit preparation of financial statements in accordance with generally accepted accounting principles, and that receipts and expenditures of the company are being made only in accordance with authorizations of management and directors of the company; and (3) provide reasonable assurance regarding prevention or timely detection of unauthorized acquisition, use, or disposition of the company’s assets that could have a material effect on the financial statements.
Because of its inherent limitations, internal control over financial reporting may not prevent or detect misstatements. Also, projections of any evaluation of effectiveness to future periods are subject to the risk that controls may become inadequate because of changes in conditions, or that the degree of compliance with the policies or procedures may deteriorate.
Critical Audit Matter
The critical audit matter communicated below is a matter arising from the current-period audit of the financial statements that was communicated or required to be communicated to the audit committee and that (1) relates to accounts or disclosures that are material to the financial statements and (2) involved our especially challenging, subjective, or complex judgments. The communication of the critical audit matter does not alter in any way our opinion on the financial statements, taken as a whole, and we are not, by communicating the critical audit matter below, providing a separate opinion on the critical audit matter or on the accounts or disclosures to which it relates.
Allowance for Credit Losses - Refer to Notes 1, 2 and 6 to the financial statements
The allowance for credit losses (the “ACL”) is an accounting estimate of expected credit losses over the estimated life of financial assets carried at amortized cost and off-balance-sheet credit exposures in accordance with ASC 326. The standard requires a financial asset (or a group of financial assets), including the Company's loan portfolio, measured at amortized cost, to be presented at the net amount expected to be collected. Estimates of expected credit losses for loans are based on historical experience, current conditions and reasonable and supportable forecasts over the estimated life of the loans. In order to estimate the expected credit losses, the Company utilizes a loss estimation model.
Management quantitatively models expected credit loss using Probability of Default (“PD”), Loss Given Default (“LGD”), and Exposure at Default (“EAD”) over the Reasonable and Supportable (“R&S”) forecast, reversion and post-reversion periods. Utilizing third-party software, the Company forecasts PD by using transition matrices to evaluate when events are more or less likely to occur based on previous events. The transition matrices are adjusted under forward-looking macroeconomic expectations to obtain R&S forecasts. Management utilizes third-party software for estimating LGD. The PD multiplied by LGD produces an expected loss rate that, when calculating the ACL, is applied to contractual loan cash flows, adjusted for expected future rates of principal prepayments. The Company adjusts its quantitative model for certain qualitative factors to reflect the extent to which management expects current conditions and R&S forecasts to differ from the conditions that existed for the period over which historical information was evaluated. The qualitative framework reflects changes related to relevant data, such as changes in asset quality trends, portfolio growth and composition, national and local economic factors, credit policy and administration and other factors not considered in the base model. The ACL is measured on a collective (pool) basis when similar risk characteristics exist. The ACL is influenced by loan volumes, risk rating migration, delinquency status and other conditions influencing loss expectations, such as reasonable and supportable forecasts of economic conditions.
The Allowance for Credit Losses for Loans was identified by us as a critical audit matter because of the extent of auditor judgment applied and significant audit effort to evaluate the significant subjective and complex judgments made by management. The principal considerations resulting in our determination included the following:
•Significant auditor judgment and effort were used in evaluating the qualitative factors used in the calculation.
48 First Financial Bancorp 2021 Annual Report
•Significant audit effort related to the completeness and accuracy of the high volume of data used in the model computation.
The primary procedures performed to address the critical audit matter included:
•Testing the effectiveness of management’s internal controls over the preparation and evaluation of the ACL calculation, significant model assumptions, development and reasonableness of qualitative factors, completeness and accuracy of data used in the calculation, systems used in the development of the estimate, and the appropriateness of the overall calculation.
•Substantively testing management’s process for developing qualitative factors and assessing relevance, and reliability of data used to develop factors, including evaluating management’s judgments and assumptions for reasonableness.
•Substantively testing the mathematical accuracy of the EAD model including the completeness and accuracy of loan data used in the model to estimate ACL.
Crowe LLP
We have served as the Company's auditor since 2015, which is the year the engagement letter was signed for the audit of the 2016 financial statements.
| | | | | |
| Louisville, Kentucky | |
| February 18, 2022 |
First Financial Bancorp 2021 Annual Report 49
Consolidated Balance Sheets
| | | | | | | | | | | | | | |
| | December 31, |
| (Dollars in thousands) | | 2021 | | 2020 |
| Assets | | | | |
| Cash and due from banks | | $ | 220,031 | | | $ | 231,054 | |
| Interest-bearing deposits with other banks | | 214,811 | | | 20,305 | |
| Investment securities available-for-sale, at fair value (amortized cost $4,180,589 at December 31, 2021 and $3,330,029 at December 31, 2020) | | 4,207,846 | | | 3,424,580 | |
| Investment securities held-to-maturity (fair value $99,898 at December 31, 2021 and $136,698 at December 31, 2020) | | 98,420 | | | 131,687 | |
| Other investments, at fair value | | 102,971 | | | 133,198 | |
| Loans held for sale, at fair value | | 29,482 | | | 41,103 | |
| Loans and leases | | | | |
| Commercial & industrial | | 2,720,028 | | | 3,007,509 | |
| Lease financing | | 109,624 | | | 72,987 | |
| Construction real estate | | 455,894 | | | 636,096 | |
| Commercial real estate | | 4,226,614 | | | 4,307,858 | |
| Residential real estate | | 896,069 | | | 1,003,086 | |
| Home equity | | 708,399 | | | 743,099 | |
| Installment | | 119,454 | | | 81,850 | |
| Credit card | | 52,217 | | | 48,485 | |
| Total loans and leases | | 9,288,299 | | | 9,900,970 | |
| Less: Allowance for credit losses | | (131,992) | | | (175,679) | |
| Net loans and leases | | 9,156,307 | | | 9,725,291 | |
| Premises and equipment | | 193,040 | | | 207,211 | |
| Operating leases | | 73,857 | | | 0 | |
| Goodwill | | 1,000,749 | | | 937,771 | |
| Other intangibles | | 88,898 | | | 64,552 | |
| Accrued interest and other assets | | 942,729 | | | 1,056,382 | |
| Total assets | | $ | 16,329,141 | | | $ | 15,973,134 | |
| | | | |
| Liabilities | | | | |
| Deposits | | | | |
| Interest-bearing demand | | $ | 3,198,745 | | | $ | 2,914,787 | |
| Savings | | 4,157,374 | | | 3,680,774 | |
| Time | | 1,330,263 | | | 1,872,733 | |
| Total interest-bearing deposits | | 8,686,382 | | | 8,468,294 | |
| Noninterest-bearing | | 4,185,572 | | | 3,763,709 | |
| Total deposits | | 12,871,954 | | | 12,232,003 | |
| Federal funds purchased and securities sold under agreements to repurchase | | 51,203 | | | 166,594 | |
| FHLB short-term borrowings | | 225,000 | | | 0 | |
| Other short-term borrowings | | 20,000 | | | 0 | |
| Total short-term borrowings | | 296,203 | | | 166,594 | |
| Long-term debt | | 409,832 | | | 776,202 | |
| Total borrowed funds | | 706,035 | | | 942,796 | |
| Accrued interest and other liabilities | | 492,210 | | | 516,265 | |
| Total liabilities | | 14,070,199 | | | 13,691,064 | |
| | | | |
| Shareholders' equity | | | | |
| Common stock - no par value | | | | |
| Authorized - 160,000,000 shares; Issued - 104,281,794 shares in 2021 and in 2020 | | 1,640,358 | | | 1,638,947 | |
| Retained earnings | | 837,473 | | | 720,429 | |
| Accumulated other comprehensive income (loss) | | (433) | | | 48,664 | |
| Treasury stock, at cost,10,132,554 shares in 2021 and 6,259,865 shares in 2020 | | (218,456) | | | (125,970) | |
| Total shareholders' equity | | 2,258,942 | | | 2,282,070 | |
| Total liabilities and shareholders' equity | | $ | 16,329,141 | | | $ | 15,973,134 | |
See Notes to Consolidated Financial Statements.
50 First Financial Bancorp 2021 Annual Report
Consolidated Statements of Income
| | | | | | | | | | | | | | | | | | | | |
| | Years ended December 31, |
| (Dollars in thousands except per share data) | | 2021 | | 2020 | | 2019 |
| Interest income | | | | | | |
| Loans and leases, including fees | | $ | 385,535 | | | $ | 431,657 | | | $ | 499,009 | |
| Investment securities | | | | | | |
| Taxable | | 79,212 | | | 73,789 | | | 90,168 | |
| Tax-exempt | | 18,323 | | | 19,242 | | | 17,596 | |
| Total interest on investment securities | | 97,535 | | | 93,031 | | | 107,764 | |
| Other earning assets | | 147 | | | 275 | | | 805 | |
| Total interest income | | 483,217 | | | 524,963 | | | 607,578 | |
| Interest expense | | | | | | |
| Deposits | | 14,435 | | | 41,922 | | | 79,032 | |
| Short-term borrowings | | 198 | | | 6,442 | | | 25,235 | |
| Long-term borrowings | | 16,466 | | | 20,088 | | | 19,057 | |
| Total interest expense | | 31,099 | | | 68,452 | | | 123,324 | |
| Net interest income | | 452,118 | | | 456,511 | | | 484,254 | |
| Provision for credit losses- loan and lease losses | | (19,024) | | | 70,796 | | | 30,598 | |
| Provision for credit losses- unfunded commitments | | 903 | | | (237) | | | (165) | |
| Net interest income after provision for credit losses | | 470,239 | | | 385,952 | | | 453,821 | |
| | | | | | |
| Noninterest income | | | | | | |
| Service charges on deposit accounts | | 31,876 | | | 29,446 | | | 37,939 | |
| Trust and wealth management fees | | 23,780 | | | 21,286 | | | 20,728 | |
| Bankcard income | | 14,300 | | | 11,726 | | | 18,804 | |
| Client derivative fees | | 7,927 | | | 10,313 | | | 15,662 | |
| Foreign exchange income | | 44,793 | | | 39,377 | | | 7,739 | |
| Net gain from sales of loans | | 33,021 | | | 51,176 | | | 14,851 | |
| Net gain (loss) on sales/transfers of investment securities | | (759) | | | 4,563 | | | (406) | |
| Unrealized gain (loss) on equity securities | | 702 | | | 9,045 | | | 575 | |
| Other | | 15,866 | | | 12,191 | | | 15,481 | |
| Total noninterest income | | 171,506 | | | 189,123 | | | 131,373 | |
| | | | | | |
| Noninterest expenses | | | | | | |
| Salaries and employee benefits | | 245,924 | | | 236,779 | | | 209,061 | |
| Net occupancy | | 22,142 | | | 23,266 | | | 24,069 | |
| Furniture and equipment | | 13,819 | | | 14,968 | | | 15,903 | |
| Data processing | | 31,363 | | | 27,514 | | | 21,881 | |
| Marketing | | 7,983 | | | 6,414 | | | 6,908 | |
| Communication | | 2,930 | | | 3,492 | | | 3,267 | |
| Professional services | | 11,676 | | | 9,961 | | | 11,254 | |
| Debt extinguishment | | 0 | | | 7,257 | | | 0 | |
| State intangible tax | | 4,256 | | | 6,058 | | | 5,829 | |
| FDIC assessments | | 5,630 | | | 5,110 | | | 1,973 | |
| Intangible assets amortization | | 9,839 | | | 11,126 | | | 9,671 | |
| Other | | 45,250 | | | 38,719 | | | 32,516 | |
| Total noninterest expenses | | 400,812 | | | 390,664 | | | 342,332 | |
| Income before income taxes | | 240,933 | | | 184,411 | | | 242,862 | |
| Income tax expense | | 35,773 | | | 28,601 | | | 44,787 | |
| Net income | | $ | 205,160 | | | $ | 155,810 | | | $ | 198,075 | |
| | | | | | |
| Earnings per common share | | | | | | |
| Basic | | $ | 2.16 | | | $ | 1.60 | | | $ | 2.01 | |
| Diluted | | $ | 2.14 | | | $ | 1.59 | | | $ | 2.00 | |
| Average common shares outstanding - basic | | 95,034,690 | | | 97,363,952 | | | 98,305,570 | |
| Average common shares outstanding - diluted | | 95,897,385 | | | 98,093,098 | | | 98,851,471 | |
See Notes to Consolidated Financial Statements.
First Financial Bancorp 2021 Annual Report 51
Consolidated Statements of Comprehensive Income
| | | | | | | | | | | | | | | | | | | | |
| | Years ended December 31, |
| (Dollars in thousands) | | 2021 | | 2020 | | 2019 |
| Net income | | $ | 205,160 | | | $ | 155,810 | | | $ | 198,075 | |
| Other comprehensive income (loss), net of tax: | | | | | | |
| Unrealized gain (loss) on debt securities arising during the period | | (52,538) | | | 32,312 | | | 51,959 | |
| Change in retirement obligation | | 4,066 | | | 3,029 | | | 4,649 | |
| Unrealized gain (loss) on derivatives | | 0 | | | 0 | | | 217 | |
| Unrealized gain (loss) on foreign currency exchange | | (625) | | | 0 | | | 0 | |
| Other comprehensive income (loss) | | (49,097) | | | 35,341 | | | 56,825 | |
| Comprehensive income | | $ | 156,063 | | | $ | 191,151 | | | $ | 254,900 | |
See Notes to Consolidated Financial Statements.
First Financial Bancorp 2021 Annual Report 52
Consolidated Statements of Changes in Shareholders' Equity
| | | | | | | | | | | | | | | | | | | | | | | | | | | | | | | | | | | | | | | | | | | | |
| | | | | | | | Accumulated | | | | | | |
| | Common | | Common | | | | other | | | | |
| | stock | | stock | | Retained | | comprehensive | | Treasury stock | | |
| (Dollars in thousands, except share amounts) | | shares | | amount | | earnings | | income (loss) | | Shares | | Amount | | Total |
| Balance at January 1, 2019 | | 104,281,794 | | | $ | 1,633,256 | | | $ | 600,014 | | | $ | (44,408) | | | (6,387,508) | | | $ | (110,613) | | | $ | 2,078,249 | |
| | | | | | | | | | | | | | |
| Impact of cumulative effect of adoption of new accounting principles | | | | | | 2,636 | | | 906 | | | | | | | 3,542 | |
| Net income | | | | | | 198,075 | | | | | | | | | 198,075 | |
| Other comprehensive income (loss) | | | | | | | | 56,825 | | | | | | | 56,825 | |
| Cash dividends declared: | | | | | | | | | | | | | | |
| Common stock at $0.90 per share | | | | | | (89,476) | | | | | | | | | (89,476) | |
| Purchase of common stock | | | | | | | | | | (2,753,272) | | | (66,218) | | | (66,218) | |
| Common stock issued in connection with business combinations | | | | 13,658 | | | | | | | 2,601,823 | | | 47,276 | | | 60,934 | |
| | | | | | | | | | | | | | |
| Warrant exercises | | | | (7,830) | | | | | | | 452,134 | | | 7,830 | | | 0 | |
| Exercise of stock options, net of shares purchased | | | | (264) | | | | | | | 20,424 | | | 354 | | | 90 | |
| Restricted stock awards, net of forfeitures | | | | (6,018) | | | | | | | 275,603 | | | 3,733 | | | (2,285) | |
| Share-based compensation expense | | | | 7,969 | | | | | | | | | | | 7,969 | |
| Balance at December 31, 2019 | | 104,281,794 | | | 1,640,771 | | | 711,249 | | | 13,323 | | | (5,790,796) | | | (117,638) | | | 2,247,705 | |
| | | | | | | | | | | | | | |
| Impact of cumulative effect of adoption of new accounting principles | | | | | | (56,882) | | | | | | | | | (56,882) | |
| Net income | | | | | | 155,810 | | | | | | | | | 155,810 | |
| Other comprehensive income (loss) | | | | | | | | 35,341 | | | | | | | 35,341 | |
| Cash dividends declared: | | | | | | | | | | | | | | |
| Common stock at $0.92 per share | | | | | | (89,748) | | | | | | | | | (89,748) | |
| Purchase of common stock | | | | | | | | | | (880,000) | | | (16,686) | | | (16,686) | |
| | | | | | | | | | | | | | |
| | | | | | | | | | | | | | |
| | | | | | | | | | | | | | |
| Exercise of stock options, net of shares purchased | | | | (140) | | | | | | | 10,405 | | | 212 | | | 72 | |
| Restricted stock awards, net of forfeitures | | | | (9,362) | | | | | | | 400,526 | | | 8,142 | | | (1,220) | |
| Share-based compensation expense | | | | 7,678 | | | | | | | | | | | 7,678 | |
| Balance at December 31, 2020 | | 104,281,794 | | | 1,638,947 | | | 720,429 | | | 48,664 | | | (6,259,865) | | | (125,970) | | | 2,282,070 | |
| | | | | | | | | | | | | | |
| | | | | | | | | | | | | | |
| Net income | | | | | | 205,160 | | | | | | | | | 205,160 | |
| Other comprehensive income (loss) | | | | | | | | (49,097) | | | | | | | (49,097) | |
| Cash dividends declared: | | | | | | | | | | | | | | |
| Common stock at $0.92 per share | | | | | | (88,116) | | | | | | | | | (88,116) | |
| Purchase of common stock | | | | | | | | | | (4,633,355) | | | (108,077) | | | (108,077) | |
| Common stock issued in connection with business combinations | | | | 1,251 | | | | | | | 405,805 | | | 8,749 | | | 10,000 | |
| Exercise of stock options, net of shares purchased | | | | (81) | | | | | | | 6,936 | | | 145 | | | 64 | |
| Restricted stock awards, net of forfeitures | | | | (9,394) | | | | | | | 347,925 | | | 6,697 | | | (2,697) | |
| Share-based compensation expense | | | | 9,635 | | | | | | | | | | | 9,635 | |
| Balance at December 31, 2021 | | 104,281,794 | | | $ | 1,640,358 | | | $ | 837,473 | | | $ | (433) | | | (10,132,554) | | | $ | (218,456) | | | $ | 2,258,942 | |
See Notes to Consolidated Financial Statements.
First Financial Bancorp 2021 Annual Report 53
Consolidated Statements of Cash Flows
| | | | | | | | | | | | | | | | | | | | |
| | Year ended December 31, |
| (Dollars in thousands) | | 2021 | | 2020 | | 2019 |
| Operating activities | | | | | | |
| Net income | | $ | 205,160 | | | $ | 155,810 | | | $ | 198,075 | |
| Adjustments to reconcile net income to net cash provided by (used in) operating activities: | | | | |
| Provision for credit losses | | (18,121) | | | 70,559 | | | 30,598 | |
| Depreciation and amortization | | 32,136 | | | 33,337 | | | 28,138 | |
| Stock-based compensation expense | | 9,635 | | | 7,678 | | | 7,969 | |
| Pension expense (income) | | 3,365 | | | 2,484 | | | 1,041 | |
| Net amortization (accretion) on investment securities | | 28,987 | | | 21,053 | | | 11,430 | |
| Net (gain) loss on sales/transfers of investments securities | | 759 | | | (4,563) | | | 406 | |
| Net (gain) loss on equity securities | | (702) | | | (9,045) | | | (575) | |
| Originations of loans held for sale | | (794,524) | | | (942,207) | | | (390,578) | |
| Net (gains) losses on sales of loans held for sale | | (33,021) | | | (51,176) | | | (14,851) | |
| Proceeds from sales of loans held for sale | | 825,102 | | | 965,960 | | | 396,121 | |
| Deferred income taxes | | 12,087 | | | (8,380) | | | 12,590 | |
| Amortization of operating leases | | 7,425 | | | 7,897 | | | 7,324 | |
| Payment of operating lease liability | | (6,860) | | | (8,196) | | | (7,335) | |
| Decrease (increase) cash surrender value of life insurance | | 472 | | | (1,506) | | | (3,748) | |
| Decrease (increase) in interest receivable | | 6,463 | | | (9,697) | | | 2,117 | |
| (Decrease) increase in interest payable | | (1,889) | | | (7,431) | | | 1,545 | |
| Decrease (increase) in other assets | | 138,225 | | | (288,857) | | | (165,902) | |
| (Decrease) increase in other liabilities | | (24,237) | | | 176,168 | | | 71,964 | |
| Net cash provided by (used in) operating activities | | 390,462 | | | 109,888 | | | 186,329 | |
| Investing activities | | | | | | |
| Proceeds from sales of investment securities available-for-sale | | 375,276 | | | 122,248 | | | 519,136 | |
| Proceeds from calls, paydowns and maturities of securities available-for-sale | | 1,139,498 | | | 904,821 | | | 557,034 | |
| Purchases of securities available-for-sale | | (2,418,290) | | | (1,551,952) | | | (834,743) | |
| | | | | | |
| Proceeds from calls, paydowns and maturities of securities held-to-maturity | | 34,563 | | | 41,736 | | | 18,062 | |
| Purchases of securities held-to-maturity | | (1,000) | | | (30,250) | | | 0 | |
| Proceeds from calls, paydowns and maturities of other securities | | 42,403 | | | 29,526 | | | 0 | |
| Purchases of other investment securities | | (11,474) | | | (28,659) | | | (12,120) | |
| Net decrease (increase) in interest-bearing deposits with other banks | | (194,506) | | | 36,643 | | | (19,210) | |
| Proceeds from sales of loans and leases held for investment | | 141,072 | | | 0 | | | 0 | |
| Net decrease (increase) in loans and leases | | 503,203 | | | (714,594) | | | (409,557) | |
| Proceeds from disposal of other real estate owned | | 1,278 | | | 2,076 | | | 1,453 | |
| Purchases of premises and equipment | | (15,333) | | | (16,466) | | | (20,934) | |
| | | | | | |
| | | | | | |
| Net cash acquired (paid) from business combinations | | (109,024) | | | 0 | | | (51,663) | |
| Net cash (paid) received for branch divestitures | | 0 | | | 0 | | | 118 | |
| Net cash provided by (used in) investing activities | | (512,334) | | | (1,204,871) | | | (252,424) | |
| Financing activities | | | | | | |
| Net (decrease) increase in total deposits | | 639,951 | | | 2,021,774 | | | 69,953 | |
| Net (decrease) increase in short-term borrowings | | 129,609 | | | (1,149,587) | | | 275,490 | |
| Payments on long-term borrowings | | (463,382) | | | (681,511) | | | (159,653) | |
| Proceeds from long-term borrowings | | 0 | | | 1,040,975 | | | 0 | |
| | | | | | |
| Cash dividends paid on common stock | | (87,316) | | | (89,691) | | | (89,097) | |
| Purchases of common stock | | (108,077) | | | (16,686) | | | (66,218) | |
| Proceeds from exercise of stock options | | 64 | | | 72 | | | 90 | |
| Net cash provided by (used in) financing activities | | 110,849 | | | 1,125,346 | | | 30,565 | |
| | | | | | |
| Cash and due from banks | | | | | | |
| Net (decrease) increase in Cash and due from banks | | (11,023) | | | 30,363 | | | (35,530) | |
| Cash and due from banks at beginning of year | | 231,054 | | | 200,691 | | | 236,221 | |
| Cash and due from banks at end of year | | $ | 220,031 | | | $ | 231,054 | | | $ | 200,691 | |
54 First Financial Bancorp 2021 Annual Report
| | | | | | | | | | | | | | | | | | | | |
| | | | | | |
| Supplemental disclosures | | | | | | |
| Interest paid | | $ | 32,841 | | | $ | 75,884 | | | $ | 121,779 | |
| Income taxes paid | | $ | 17,689 | | | $ | 32,579 | | | $ | 27,497 | |
| Acquisition of other real estate owned through foreclosure | | $ | 98 | | | $ | 1,017 | | | $ | 2,448 | |
| Issuance of restricted stock awards | | $ | 12,231 | | | $ | 9,370 | | | $ | 10,488 | |
| Securities transferred from HTM to AFS | | $ | 0 | | | $ | 0 | | | $ | 268,703 | |
| Common stock issued in acquisitions | | $ | 10,000 | | | $ | 0 | | | $ | 60,934 | |
| Initial recognition of operating lease right of use asset | | $ | 0 | | | $ | 0 | | | $ | 60,249 | |
| Initial recognition of operating lease liabilities | | $ | 0 | | | $ | 0 | | | $ | 65,799 | |
| | | | | | |
| Supplemental schedule for investing activities | | | | | | |
| Business combinations | | | | | | |
| Assets acquired, net of purchase consideration | | $ | 62,916 | | | $ | 0 | | | (39,140) | |
| Liabilities assumed | | 125,894 | | | 0 | | | 18,380 | |
| Goodwill | | $ | 62,978 | | | $ | 0 | | | $ | 57,520 | |
See Notes to Consolidated Financial Statements.
First Financial Bancorp 2021 Annual Report 55
Notes to Consolidated Financial Statements
1. Summary of Significant Accounting Policies
Basis of presentation. The Consolidated Financial Statements of First Financial Bancorp., a financial holding company, principally serving Ohio, Indiana, Kentucky and Illinois, include the accounts and operations of First Financial and its wholly owned subsidiary, First Financial Bank. All significant intercompany transactions and accounts have been eliminated in consolidation. Certain reclassifications of prior years' amounts have been made to conform to current year presentation. Such reclassifications had no effect on net earnings.
Use of estimates. The preparation of financial statements in conformity with GAAP requires management to make estimates, assumptions and judgments that affect the amounts reported in the Consolidated Financial Statements and accompanying Notes. Actual realized amounts could differ materially from those estimates.
COVID-19. First Financial's operations and financial results were significantly impacted by the COVID-19 pandemic in both 2020 and 2021. The spread of COVID-19 caused significant economic disruption throughout the United States as state and local governments issued stay at home orders and temporarily closed non-essential businesses. The full financial impact from the pandemic is unknown at this time, however prolonged disruption may adversely impact several industries within the Company's geographic footprint and impair the ability of First Financial's customers to fulfill their contractual obligations to the Company. This could cause First Financial to experience a material adverse effect on business operations, asset valuations, financial condition and results of operations. Material adverse impacts may include all or a combination of valuation impairments on First Financial's intangible assets, investments, loans, mortgage servicing rights or counter-party risk derivatives.
Cash and due from banks. Cash and due from banks consist of currency, coin and cash items due from banks. Cash items due from banks include noninterest-bearing balances that are on deposit at other depository institutions.
Investment securities. First Financial classifies debt securities into three categories: HTM, trading and AFS. Management classifies investment securities into the appropriate category at the time of purchase and re-evaluates that classification as deemed appropriate.
Investment securities are classified as HTM when First Financial has the positive intent and ability to hold the securities to maturity. HTM securities are recorded at amortized cost.
Investment securities classified as trading are held principally for resale in the near-term and are recorded at fair value. Fair value is determined using quoted market prices. Gains or losses on trading securities, both realized and unrealized, are reported in noninterest income.
Investment securities not classified as either HTM or trading are classified as AFS. AFS securities are recorded at fair value, with the unrealized gains and losses, net of tax, reported as a separate component of accumulated other comprehensive income (loss) in shareholders' equity.
The amortized cost of investment securities classified as either HTM or AFS on purchased callable debt securities is adjusted for amortization of premiums to the earliest call date if the call feature meets certain criteria. Otherwise, premiums are amortized to maturity similar to discounts on callable debt securities, or in the case of mortgage-backed securities, over the estimated life of the security. Such amortization and accretion are considered an adjustment to the yield on the security and included in interest income from investments. Interest and dividends are also included in interest income from investment securities in the Consolidated Statements of Income. Realized gains and losses are based on the amortized cost of the security sold using the specific identification method.
Other investments. Other investments include holdings in FRB and FHLB stock, which are both carried at cost as well as equity securities, including class B Visa shares which are carried at fair value. Changes in the fair value of equity securities are recorded in Unrealized gain (loss) on securities in the Consolidated Statements of Income.
Loans held for sale. Loans held for sale consist of residential real estate loans newly originated for the purpose of sale to third parties, and in certain circumstances, loans previously originated that have been specifically identified by management for sale based on predetermined criteria. Loans held for sale are carried at fair value. Any subsequent change in the carrying value of
56 First Financial Bancorp 2021 Annual Report
transferred loans, not to exceed original cost, is recorded in the Consolidated Statements of Income. First Financial sells loans with servicing retained or released depending on pricing and market conditions.
Loans and leases. Loans and leases for which First Financial has the intent and ability to hold for the foreseeable future, or until maturity or payoff, are classified in the Consolidated Balance Sheets as loans and leases. Loans and leases are carried at the principal amount outstanding, net of unamortized deferred loan origination fees and costs, and net of unearned income. Loan origination and commitment fees received, as well as certain direct loan origination costs paid, are deferred, and the net amount is amortized as an adjustment to the related loan's yield.
Interest income on loans and leases is recorded on an accrual basis. When a loan is classified as nonaccrual, the accrual of interest income is discontinued and previously accrued, but unpaid interest is reversed. Any payments received while a loan is classified as nonaccrual are applied as a reduction to the carrying value of the loan. A loan may return to accrual status if collection of future principal and interest payments is no longer doubtful.
Allowance for credit losses - held-to-maturity securities. Management measures expected credit losses on held-to-maturity debt securities on a collective basis by security type. The estimate of expected credit losses considers historical credit loss information that is adjusted for current conditions and reasonable and supportable forecasts. Management classifies the held-to-maturity portfolio into the following major security types: Mortgage-backed, CMOs, Obligations of state and other political subdivisions and Other.
Nearly all of the HTM securities held by the Company are issued by U.S. government entities and agencies. These securities are either explicitly or implicitly guaranteed by the U.S. government, are highly rated by major rating agencies and have a long history of no credit losses. The remainder of the Company's HTM securities are non-agency collateralized mortgage obligations and obligations of state and other political subdivisions which currently carry ratings no lower than A+. Accrued interest receivable on held-to maturity debt securities, which totaled $0.2 million and $0.3 million as of December 31, 2021 and 2020, respectively, is excluded by policy election from the estimate of credit losses.
Allowance for credit losses - available-for-sale securities. For available-for-sale debt securities in an unrealized loss position, the Company first assesses whether it intends to sell, or it is more likely than not that it will be required to sell the security before recovery of its amortized cost basis. If either of the criteria regarding intent or requirement to sell is met, the security’s amortized cost basis is written down to fair value through income. For debt securities available-for-sale that do not meet the aforementioned criteria, the Company evaluates whether the decline in fair value has resulted from credit losses or other factors. In making this assessment, management considers the extent to which fair value is less than amortized cost, any changes to the rating of the security by a rating agency and adverse conditions specifically related to the security, among other factors. If this assessment indicates that a credit loss exists, the present value of cash flows expected to be collected from the security are compared to the amortized cost basis of the security.
If the present value of cash flows expected to be collected is less than the amortized cost basis, a credit loss exists and an allowance for credit losses is recorded, limited by the amount that the fair value is less than the amortized cost basis. Any impairment that has not been recorded through an allowance for credit loss is recognized in other comprehensive income. Changes in the allowance for credit losses are recorded as provision for credit loss expense. Losses are charged against the allowance when management believes the uncollectibility of an available-for-sale security is confirmed or when either of the criteria regarding intent or requirement to sell is met. Accrued interest receivable on available-for-sale debt securities, which totaled $14.9 million and $12.9 million as of December 31, 2021 and 2020, respectively, is excluded from the estimate of credit losses.
Allowance for credit losses - loans and leases. The allowance for credit losses is a valuation account that is deducted from the loans’ amortized cost basis to present the net amount expected to be collected on the loans. Management's determination of the adequacy of the ACL is based on an assessment of the expected credit losses on loan and leases over their expected life. The ACL is increased by provision expense and decreased by charge-offs, net of recoveries of amounts previously charged-off. Loans are charged off when management believes that the collection of the principal amount owed in full, either through payments from the borrower or a guarantor or from the liquidation of collateral is unlikely. Expected recoveries do not exceed the aggregate of amounts previously charged-off and expected to be charged-off. Any interest that is accrued but not collected is reversed against interest income when a loan is placed on nonaccrual status, which typically occurs prior to charging off all, or a portion, of a loan. The Company made the policy election to exclude accrued interest receivable on loans and leases from the estimate of credit losses.
First Financial Bancorp 2021 Annual Report 57
Notes to Consolidated Financial Statements
Management estimates the allowance using relevant available information from both internal and external sources, relating to past events, current conditions and reasonable and supportable forecasts. Historical credit loss experience paired with economic forecasts provide the basis for the quantitatively modeled estimation of expected credit losses. First Financial adjusts its quantitative model, as necessary, to reflect conditions not already considered therein. These adjustments are commonly known as the Qualitative Framework.
First Financial quantitatively models expected credit loss using PD, LGD and EAD over the R&S forecast period, reversion and post-reversion periods.
Utilizing third-party software, the Bank forecasts PD by using a parameterized transition matrix approach. Average transition matrices are calculated over the TTC period, which was defined as the period from December 2007 to December 2016. TTC transition matrices are adjusted under forward-looking macroeconomic expectations to obtain R&S forecasts.
First Financial is not required to develop forecasts over the full contractual term of the financial asset or group of financial assets. Rather, for periods beyond which the entity is able to make or obtain R&S forecasts of expected credit losses, the Company reverts in a straight line manner over a one year period to an average TTC loss level that is reflective of the prepayment adjusted contractual term of the financial asset or group of financial assets. The R&S period, elected by the bank to be two years, is forecasted using econometric data sourced from Moody's, an industry-leading independent third party.
FFB utilizes a non-parametric loss curve approach embedded within a third-party software for estimating LGD. The PD multiplied by LGD produces an expected loss rate that, when calculating the ACL, is applied to contractual loan cash flows, adjusted for expected future rates of principal prepayments.
The Company adjusts its quantitative model for certain qualitative factors to reflect the extent to which management expects current conditions and R&S forecasts to differ from the conditions that existed for the period over which historical information was evaluated. The Qualitative Framework reflects changes related to relevant data, such as changes in asset quality trends, portfolio growth and composition, national and local economic factors, credit policy and administration and other factors not considered in the base quantitative model.
Loans that do not share risk characteristics are evaluated on an individual basis. First Financial will typically evaluate on an individual basis any loans that are on nonaccrual, designated as a TDR, or reasonably expected to be designated as a TDR that are greater than $250,000. When management determines that foreclosure is probable or when repayment is expected to be provided substantially through the operation or sale of underlying collateral, expected credit losses are based on the fair value of the collateral at the reporting date, adjusted for selling costs. For loans evaluated on an individual basis that are not determined to be collateral dependent, a discounted cash flow analysis is performed to determine expected credit losses.
Expected credit losses are estimated over the contractual term of the loans, adjusted for expected prepayments when appropriate. The contractual term excludes expected extensions, renewals and modifications unless either of the following applies: management has a reasonable expectation at the reporting date that a troubled debt restructuring will be executed with an individual borrower or the extension or renewal options are included in the original or modified contract at the reporting date and are not unconditionally cancellable by the Company.
Credit card receivables do not have stated maturities. In determining the estimated life of a credit card receivable, management first estimates the future cash flows expected to be received and then applies those expected future cash flows to the credit card balance.
Significant downturns in circumstances relating to loan quality and economic conditions could result in a requirement for additional allowance. Likewise, an upturn in loan quality and improved economic conditions may allow a reduction in the required allowance. In either instance, unanticipated changes could have a significant impact on results of operations.
Allowance for credit losses - unfunded commitments. First Financial estimates expected credit losses over the contractual period in which the Company is exposed to credit risk via a contractual obligation to extend credit, unless that obligation is unconditionally cancellable by the Company. The estimate includes consideration of the likelihood that funding will occur and an estimate of expected credit losses on commitments expected to be funded over its estimated life consistent with the Company's ACL methodology for loans and leases. Adjustments to the reserve for unfunded commitments are recorded in Provision for credit losses - unfunded commitments in the Consolidated Statements of Income. The reserve for unfunded commitments is included in Accrued interest and other liabilities on the Consolidated Balance Sheets.
58 First Financial Bancorp 2021 Annual Report
Premises and equipment. Premises and equipment are stated at cost, less accumulated depreciation and amortization. Depreciation and amortization are principally computed on the straight-line method over the estimated useful lives of the assets. Useful lives generally range from 10 to 40 years for building and building improvements; 3 to 10 years for furniture, fixtures and equipment; and 3 to 5 years for software, hardware and data handling equipment. Land improvements are depreciated over 20 years and leasehold improvements are depreciated over the lesser of the term of the respective lease or the useful life of the asset. Premises and equipment are evaluated for impairment whenever events or changes in circumstances indicate that the carrying amount of an asset may not be recoverable. Maintenance and repairs are expensed as incurred.
Operating Leases. First Financial provides financing for various types of equipment through a variety of leasing arrangements. Operating leases are carried at the aggregate of lease payments plus estimated residual value of the leased equipment, less unearned income. The Company recognizes income over the term of the lease using the constant effective yield method. Lease residual values are reviewed for impairment at least annually.
Bank-owned life insurance. First Financial purchases and is the owner and beneficiary of the life insurance policies on the lives of certain employees . The Bank invests in these policies to provide an efficient form of funding for long-term retirement and other employee benefits costs. The policies are included within Accrued interest and other assets in the Consolidated Balance Sheets at each policy’s respective cash surrender value. Changes in the cash surrender value of these policies are recorded in Other noninterest income in the Consolidated Statements of Income.
Goodwill. Under accounting for business combinations, the net assets of entities acquired by First Financial are recorded at their estimated fair value at the date of acquisition. The excess cost of the acquisition over the fair value of net assets acquired is recorded as goodwill. Goodwill and other intangible assets deemed to have indefinite lives are not amortized, but are subject to annual impairment tests. The Company is required to evaluate goodwill for impairment on an annual basis or whenever events or changes in circumstances indicate that the carrying value may not be recoverable. First Financial performs its annual impairment test effective October 1, absent events or changes in circumstances that indicate the carrying value of goodwill may not be recoverable.
The Company’s goodwill is accounted for in a single reporting unit representing the consolidated entity. Our quantitative impairment analysis utilized the discounted cash flow model for the income approach and the market multiple methodology and comparable transaction methodology as the market approach. These valuation methodologies utilize key assumptions that include forecasts of revenues and expenses derived from internal management projections for a period of five years, changes in working capital estimates, company specific discount rate derived from a rate build up approach, externally sourced bank peer group market multiples and externally sourced bank peer group change in control premium, all of which are highly subjective and require significant management judgment. Changes in these key assumptions, as well as downturns in economic or business conditions, could materially affect our estimate of the reporting unit fair value and could affect our conclusion regarding the existence of potential impairment.
In 2020, First Financial engaged a third-party to perform a quantitative analysis of its goodwill to determine whether any impairment existed for its annual impairment test. This third-party quantitative analysis was performed due to the on-going economic market disruption, the movement of the Company’s stock price in relation to other bank indexes and the length of time that the market value of the reporting unit has been below its book value. This analysis indicated that no impairment existed as of the issue date.
Additionally, in response to the COVID-19 pandemic and the related deterioration in general economic conditions, First Financial performed an interim qualitative impairment test as of the end of each quarter in 2020. Likewise, the results of these interim qualitative tests did not indicate that the Company's goodwill was impaired.
Other intangible assets. Other intangible assets consist primarily of core deposit, customer list and other miscellaneous intangibles.
CDI represent the estimated value of acquired customer deposit relationships. CDI are recorded at fair value at the date of acquisition and are based on a discounted cash flow methodology that gives appropriate consideration to expected customer attrition rates, cost of the deposit base, reserve requirements and the net maintenance cost attributable to customer deposits. Core deposit intangibles are amortized on an accelerated basis over their estimated useful lives.
First Financial recorded a customer list intangible asset in conjunction with the Bannockburn and Summit mergers to account for the obligation or advantage on the part of either the Company or the customer to continue pre-existing relationships
First Financial Bancorp 2021 Annual Report 59
Notes to Consolidated Financial Statements
subsequent to the mergers. Customer list intangible assets are amortized on a straight-line basis over their estimated useful lives.
Other intangible assets also include purchase commissions, non-compete agreements and trade name intangibles.
Other real estate owned. OREO consists of properties acquired by the Company primarily through the loan foreclosure or repossession process, or other resolution activity that results in partial or total satisfaction of problem loans. OREO properties are recorded at fair value, less estimated disposal costs (net realizable value). Physical possession of residential real estate property collateralizing a consumer mortgage loan occurs when legal title is obtained upon completion of foreclosure or when the borrower conveys all interest in the property to satisfy the loan through completion of a deed in lieu of foreclosure or through a similar legal agreement. Losses arising at the time of acquisition of such properties are charged against the ACL. Management performs periodic valuations to assess the adequacy of recorded OREO balances and subsequent changes in the carrying value of OREO properties are recorded in the Consolidated Statements of Income. Improvements to OREO properties may be capitalized if the improvements contribute to the overall value of the property, but may not be capitalized in excess of the net realizable value of the property. When management disposes of an OREO property, any gains or losses realized at the time of disposal are reflected in the Consolidated Statements of Income.
Affordable housing projects. First Financial has investments in certain qualified affordable housing projects. These projects are indirect federal subsidies that provide tax incentives to encourage investment in the development, acquisition and rehabilitation of affordable rental housing, and allow investors to claim tax credits and other tax benefits (such as deductions from taxable income for operating losses) on their federal income tax returns. The principal risk associated with qualified affordable housing investments is the potential for noncompliance with the tax code requirements, such as failure to rent properties to qualified tenants, resulting in unavailability or recapture of the tax credits and other tax benefits. Investments in affordable housing projects are included in Accrued interest and other assets in the Consolidated Balance Sheets while any unfunded commitment is recorded with Accrued interest and other liabilities. These investments are accounted for under the proportional amortization method. Under the proportional amortization method, the initial cost of the investment is amortized in proportion to the tax credits and other benefits received and recognized as a component of Income tax expense in the Consolidated Statements of Income.
Investments in historic tax credits. First Financial has noncontrolling financial investments in private investment funds and partnerships that finance the rehabilitation and re-use of historic buildings. These unconsolidated investments may generate a return through the realization of federal and state income tax credits, as well as other tax benefits, such as tax deductions from net operating losses of the investments over a period of time. Investments in historic tax credits are accounted for under the equity method of accounting and the Company’s recorded investment in these entities is carried in Accrued interest and other assets on the Consolidated Balance Sheets with any unfunded commitment recorded in Accrued interest and other liabilities. Impairment of these investments is recorded in Other noninterest expense, while the tax credits and other net tax benefits received are recognized as a component of income tax expense in the Consolidated Statements of Income.
Investments in renewable energy credits. First Financial has investments in renewable energy projects where it has noncontrolling interest which is not consolidated. This investment may generate a return through the realization of federal and state income tax credits, as well as other tax benefits, such as tax deductions from net operating losses of the investments over a period of time. Investments in renewable energy tax credits are accounted for under the equity method of accounting and are included in Accrued interest and other assets on the Consolidated Balance Sheets with any unfunded commitment recorded in Accrued interest and other liabilities. These tax credits and other net tax benefits received are recognized as a component of income tax expense in the Consolidated Statements of Income and is evaluated for impairment at the end of each reporting period.
Income taxes. First Financial and its subsidiaries file a consolidated federal income tax return. Each subsidiary provides for income taxes on a separate return basis, and remits to First Financial amounts determined to be currently payable.
First Financial evaluates and assesses the relative risks and appropriate tax treatment of transactions after considering statutes, regulations, judicial precedent and other information, and maintains tax accruals consistent with its evaluation of these relative risks. Changes to the estimate of accrued taxes occur periodically due to changes in tax rates, interpretations of tax laws, the status of examinations being conducted by taxing authorities and changes to statutory, judicial and regulatory guidance that impact the relative risks of tax positions. These changes, when they occur, can affect deferred taxes and accrued taxes as well as the current period’s income tax expense and can be material to the Company's operating results.
60 First Financial Bancorp 2021 Annual Report
Deferred tax assets and liabilities are measured using enacted tax rates expected to apply to taxable income in the years in which temporary differences are expected to be recovered or settled. The effect on deferred tax assets and liabilities of a change in tax rates is recognized in income in the period that includes the enactment date. Interest and penalties on income tax assessments or income tax refunds are recorded in Other noninterest expense in the Consolidated Statements of Income.
In establishing a provision for income tax expense, we must make judgments and interpretations about the application of complex tax laws as well as make estimates about when in the future certain items will affect taxable income. First Financial regularly reviews its tax positions and establishes reserves for income tax-related uncertainties based on estimates of whether it is more likely than not that the tax uncertainty would be sustained upon challenge by the appropriate tax authorities which would then result in additional taxes, penalties and interest due. Reserves for uncertain tax positions, if any, are included in income tax expense in the Consolidated Financial Statements.
Pension. First Financial sponsors a non-contributory defined-benefit pension plan covering substantially all employees. Accounting for the pension plan involves material estimates regarding future plan obligations and investment returns on plan assets. Significant assumptions used in the pension plan include the discount rate, expected return on plan assets and the rate of compensation increase. First Financial determines the discount rate assumption using published corporate bond indices and the projected cash flows of the pension plan. First Financial also utilizes external surveys for industry comparisons to assess the discount rate for reasonableness. The expected long-term return on plan assets is determined based on the composition of plan assets, actual returns and economic forecasts, while the rate of compensation increase is compared to historical increases for plan participants. Changes in these assumptions can have a material impact on the amount of First Financial’s future pension obligations, on the funded status of the plan and on the Company's operating results
Derivative instruments. First Financial accounts for its derivative financial instruments in accordance with FASB ASC Topic 815, Derivatives and Hedging. FASB ASC Topic 815 requires all derivative instruments to be carried at fair value on the balance sheet.
The accounting for changes in the fair value of derivatives is based on the intended use of the derivative and the resulting designation. Derivatives used to hedge the exposure to changes in the fair value of an asset, liability or firm commitment attributable to a particular risk, such as interest rate risk, are considered fair value hedges. Derivatives used to hedge the exposure to variability in expected future cash flows, or other types of forecasted transactions, are considered cash flow hedges.
Client derivatives - First Financial utilizes matched interest rate swaps as a means to offer commercial borrowers fixed rate funding while providing the Company with floating rate assets. Upon entering into an interest rate swap with a borrower, the Bank simultaneously enters into an offsetting swap agreement with an institutional counterparty, with substantially matching terms. These matched interest rate swap agreements generally involve the receipt by First Financial of floating rate amounts from the counterparties in exchange for payments to these counterparties by First Financial of fixed rate amounts received from commercial borrowers over the life of the agreements.
First Financial's matched interest rate swaps qualify as derivatives, but are not designated as hedging instruments. The net interest receivable or payable on matched interest rate swaps is accrued and recognized as an adjustment to interest income. The fair values of client derivatives are included within Accrued interest and other assets and Accrued interest and other liabilities in the Consolidated Balance Sheets.
Foreign exchange contracts - First Financial may enter into foreign exchange derivative contracts for the benefit of commercial customers to hedge their exposure to foreign currency fluctuations. Similar to the hedging of interest rate risk from interest rate derivative contracts, First Financial also enters into foreign exchange contracts with major financial institutions to economically hedge a substantial portion of the exposure from client driven foreign exchange activity. These derivatives are classified as free-standing instruments with the revaluation gain or loss recorded in Foreign exchange income in the Consolidated Statements of Income.
Credit derivatives - In conjunction with participating interests in commercial loans, First Financial periodically enters into risk participation agreements with counterparties whereby First Financial assumes a portion of the credit exposure associated with an interest rate swap on the participated loan in exchange for a fee. Under these agreements, First Financial will make payments to the counterparty if the loan customer defaults on its obligation to perform under the interest rate swap contract with the counterparty. The fair value of these agreements is recorded in the Consolidated Balance Sheets in Accrued interest and other liabilities.
First Financial Bancorp 2021 Annual Report 61
Notes to Consolidated Financial Statements
Mortgage derivatives - First Financial enters into IRLCs and forward commitments for the future delivery of mortgage loans to third party investors, which are considered derivatives. When borrowers secure an IRLC with First Financial and the loan is intended to be sold, First Financial will enter into forward commitments for the future delivery of the loans to third party investors in order to hedge against the effect of changes in interest rates impacting IRLCs and and Loans held for sale. The fair value of these agreements is recorded in the Consolidated Balance Sheets in Accrued interest and other assets.
Stock-based compensation. First Financial grants stock-based awards, including restricted stock awards and options to purchase the Company’s common stock. Stock option grants are for a fixed number of shares to employees and directors with an exercise price equal to the fair value of the shares at the date of grant. Stock-based compensation expense is recognized in the Consolidated Statements of Income on a straight-line basis over the vesting period. As compensation expense is recognized, a deferred tax asset is recorded that represents an estimate of the future tax deduction from exercise. At the time stock-based awards are exercised, canceled or expire, First Financial may be required to recognize an adjustment to tax expense.
Earnings per share. Basic earnings per common share is computed by dividing net income available to common shareholders by the weighted average number of shares of common stock outstanding during the period. Diluted earnings per common share is computed by dividing net income available to common shareholders by the weighted average number of common shares outstanding, unvested shares and dilutive common stock equivalents outstanding during the period. Common stock equivalents, which consist of common stock issuable under the assumed exercise of stock options granted under First Financial's stock-based compensation plans and the assumed conversion of common stock warrants, are calculated using the treasury stock method.
Segments and related information. While the Company monitors the operating results of its six lines of business, operations are managed and financial performance is evaluated on a consolidated basis. Accordingly, and consistent with prior years, all of the Company's operations are considered by management to be aggregated in one reportable operating segment.
2. Accounting Standards Recently Adopted or Issued
Standards Adopted in 2021
During the first quarter of 2021, the Company adopted ASU 2019-12 - Income Taxes (Topic 740): Simplifying the Accounting
for Income Taxes. This standard simplified the accounting for income taxes by removing certain exceptions to the general
principles in Topic 740 and added new requirements with the intention of simplifying and clarifying existing guidance. This
update did not have a material impact on the Company’s Consolidated Financial Statements.
Standards Adopted in 2020
On January 1, 2020, the Company adopted ASU 2016-13 Financial Instruments - Credit Losses (Topic 326): Measurement of
Credit Losses on Financial Instruments, which replaced the previously required incurred loss methodology with an expected
loss methodology that is referred to as the current expected credit loss (CECL) methodology. The measurement of expected
credit losses under the CECL methodology is applicable to financial assets measured at amortized cost, including loan
receivables and held-to-maturity debt securities. It also applies to off-balance sheet credit exposures not accounted for as
insurance (loan commitments, standby letters of credit, financial guarantees, and other similar instruments) and net investments
in leases recognized by a lessor in accordance with Topic 842 on leases. In addition, ASC 326 made changes to the accounting
for available-for-sale debt securities. One such change is to require credit losses to be presented as an allowance rather than as
a write-down on available-for-sale debt securities that management does not intend to sell or believes that it is more likely than
not they will be required to sell. The Company adopted ASC 326 using the modified retrospective method for all financial assets measured at amortized cost and OBS credit exposures. Results for reporting periods beginning after January 1, 2020 are presented under ASC 326 while prior period amounts continue to be reported in accordance with previously applicable GAAP. The Company recorded a net decrease to retained earnings of $56.9 million as of January 1, 2020 for the cumulative effect of adopting ASC 326. As detailed in the following table, the transition adjustment included a $61.5 million increase to the ACL, a $12.2 million increase in the ACL for unfunded commitments and a $16.8 million decrease in Deferred tax liability.
The Company adopted CECL using the prospective transition approach for financial assets purchased with credit deterioration that were previously classified as purchased credit impaired and accounted for under ASC 310-30. In accordance with the standard, First Financial did not reassess whether PCI assets met the definition of PCD assets as of the date of adoption.
62 First Financial Bancorp 2021 Annual Report
In March 2020, the OCC, the Board of Governors of the Federal Reserve System, and the FDIC announced an interim final rule
to delay the estimated impact on regulatory capital stemming from the implementation of CECL. The interim final rule
maintains the three-year transition option in the previous rule and provides banks the option to delay for two years an estimate
of CECL’s effect on regulatory capital, relative to the incurred loss methodology’s effect on regulatory capital, followed by a
three-year transition period. First Financial is adopting the capital transition relief over the five year permissible period.
The impact of adopting ASC 326 was as follows:
| | | | | | | | | | | | | | | | | | | | |
| | January 1, 2020 |
| (dollars in thousands) | | As Reported under ASC 326 | | Pre-ASC 326 | | Impact of ASC 326 Adoption |
| Assets | | | | | | |
| Loans | | | | | | |
| Commercial and industrial | | $ | 28,485 | | | $ | 18,584 | | | $ | 9,901 | |
| Lease financing | | 1,089 | | 971 | | 118 |
| Construction real estate | | 13,960 | | 2,381 | | 11,579 |
| Commercial real estate | | 47,697 | | 23,579 | | 24,118 |
| Residential real estate | | 10,789 | | 5,299 | | 5,490 |
| Home equity | | 13,217 | | 4,787 | | 8,430 |
| Installment | | 1,193 | | 392 | | 801 |
| Credit card | | 2,725 | | 1,657 | | 1,068 |
| Allowance for credit losses on loans | | $ | 119,155 | | | $ | 57,650 | | | $ | 61,505 | |
| | | | | | |
| Liabilities | | | | | | |
| Deferred tax liability | | $ | 16,252 | | | $ | 33,030 | | | $ | (16,778) | |
| Allowance for credit losses on OBS credit exposures | | 12,740 | | 585 | | 12,155 |
For more information on the calculation of the ACL, please refer to Note 1 - Summary of Significant Accounting Policies and Note 5 - Allowance for Credit Losses.
3. Restrictions on Cash and Dividends
As of December 31, 2021 and 2020, First Financial had $34.0 million and $38.0 million, respectively, in cash restricted for withdrawal and usage due to the centrally cleared derivative initial margin requirement. Additionally, First Financial had no required reserves with the FRB as of December 31, 2021 and 2020.
Dividends paid by First Financial to its shareholders are principally funded through dividends paid to the Company by its subsidiaries; however, certain restrictions exist regarding the ability of the Bank to transfer funds to First Financial in the form of cash dividends, loans or advances. The approval of the Federal Reserve Board and the ODFI is required for the Bank to pay dividends in excess of the regulatory limit, which is equal to the net income of the current year through the dividend date combined with the Bank's retained net income from the two preceding years. As of December 31, 2021, First Financial's subsidiaries had retained earnings of $727.9 million, of which $166.2 million was available for distribution to First Financial without prior regulatory approval.
4. Investment Securities
During the year ended December 31, 2021, proceeds on the sale of $375.3 million of AFS securities resulted in gains of $6.8 million and losses of $7.6 million. During the year ended December 31, 2020, proceeds on the sale of $117.8 million of AFS securities resulted in gains of $0.9 million and losses of $0.8 million. During the year ended December 31, 2019, proceeds on the sale of $519.1 million of AFS securities resulted in gains of $2.1 million and losses of $2.1 million. The impact to income tax expense from these sales was insignificant in all three years.
First Financial Bancorp 2021 Annual Report 63
Notes to Consolidated Financial Statements
In 2021 and 2020, there were no reclassifications of HTM securities to AFS securities. However, in the first quarter of 2019, in addition to the sale of certain securities, First Financial reclassified $268.7 million of HTM securities to AFS in conjunction with the adoption of ASU 2017-12, resulting in a $0.2 million realized loss recorded in the Consolidated Statement of Income.
The carrying value of investment securities pledged as collateral to secure public deposits, repurchase agreements and for other purposes as required by law totaled $1.5 billion at both December 31, 2021 and December 31, 2020.
The following is a summary of HTM and AFS investment securities as of December 31, 2021:
| | | | | | | | | | | | | | | | | | | | | | | | | | | | | | | | | | | | | | | | | | | | | | | | | | |
| | Held-to-maturity | | Available-for-sale |
| (Dollars in thousands) | | Amortized
cost | | Unrecognized
gain | | Unrecognized
loss | | Fair
value | | Amortized
cost | | Unrealized
gain | | Unrealized
loss | | Fair
value |
| U.S. Treasuries | | $ | 0 | | | $ | 0 | | | $ | 0 | | | $ | 0 | | | $ | 34,961 | | | $ | 4 | | | $ | (189) | | | $ | 34,776 | |
| Securities of U.S. government agencies and corporations | | 0 | | | 0 | | | 0 | | | 0 | | | 78,998 | | | 248 | | | (129) | | | 79,117 | |
| Mortgage-backed securities - residential | | 0 | | | 0 | | | 0 | | | 0 | | | 728,050 | | | 6,635 | | | (10,548) | | | 724,137 | |
| Mortgage-backed securities - commercial | | 46,362 | | | 651 | | | 0 | | | 47,013 | | | 729,948 | | | 4,294 | | | (2,352) | | | 731,890 | |
| Collateralized mortgage obligations | | 11,882 | | | 221 | | | 0 | | | 12,103 | | | 696,258 | | | 7,979 | | | (6,497) | | | 697,740 | |
| Obligations of state and other political subdivisions | | 8,926 | | | 915 | | | 0 | | | 9,841 | | | 1,058,735 | | | 35,591 | | | (8,594) | | | 1,085,732 | |
| Asset-backed securities | | 0 | | | 0 | | | 0 | | | 0 | | | 720,638 | | | 1,521 | | | (2,578) | | | 719,581 | |
| Other securities | | 31,250 | | | 176 | | | (485) | | | 30,941 | | | 133,001 | | | 2,114 | | | (242) | | | 134,873 | |
| Total | | $ | 98,420 | | | $ | 1,963 | | | $ | (485) | | | $ | 99,898 | | | $ | 4,180,589 | | | $ | 58,386 | | | $ | (31,129) | | | $ | 4,207,846 | |
The following is a summary of HTM and AFS investment securities as of December 31, 2020:
| | | | | | | | | | | | | | | | | | | | | | | | | | | | | | | | | | | | | | | | | | | | | | | | | | |
| | Held-to-maturity | | Available-for-sale |
| (Dollars in thousands) | | Amortized
cost | | Unrecognized
gain | | Unrecognized
loss | | Fair
value | | Amortized
cost | | Unrealized
gain | | Unrealized
loss | | Fair
value |
| U.S. Treasuries | | $ | 0 | | | $ | 0 | | | $ | 0 | | | $ | 0 | | | $ | 99 | | | $ | 4 | | | $ | 0 | | | $ | 103 | |
| Securities of U.S. government agencies and corporations | | 0 | | | 0 | | | 0 | | | 0 | | | 60 | | | 0 | | | 0 | | | 60 | |
| Mortgage-backed securities - residential | | 13,990 | | | 197 | | | 0 | | | 14,187 | | | 704,482 | | | 15,938 | | | (237) | | | 720,183 | |
| Mortgage-backed securities - commercial | | 71,737 | | | 3,485 | | | 0 | | | 75,222 | | | 584,125 | | | 10,395 | | | (3,584) | | | 590,936 | |
| Collateralized mortgage obligations | | 5,799 | | | 79 | | | 0 | | | 5,878 | | | 634,418 | | | 21,148 | | | (445) | | | 655,121 | |
| Obligations of state and other political subdivisions | | 9,911 | | | 1,239 | | | 0 | | | 11,150 | | | 856,054 | | | 46,755 | | | (291) | | | 902,518 | |
| Asset-backed securities | | 0 | | | 0 | | | 0 | | | 0 | | | 478,539 | | | 4,158 | | | (826) | | | 481,871 | |
| Other securities | | 30,250 | | | 11 | | | 0 | | | 30,261 | | | 72,252 | | | 1,544 | | | (8) | | | 73,788 | |
| Total | | $ | 131,687 | | | $ | 5,011 | | | $ | 0 | | | $ | 136,698 | | | $ | 3,330,029 | | | $ | 99,942 | | | $ | (5,391) | | | $ | 3,424,580 | |
64 First Financial Bancorp 2021 Annual Report
The following table provides a summary of investment securities by contractual maturity as of December 31, 2021, except for residential and commercial mortgage-backed securities, collateralized mortgage obligations and asset-backed securities, which are shown as single totals, due to the unpredictability of the timing in principal repayments:
| | | | | | | | | | | | | | | | | | | | | | | | | | |
| | | Held-to-maturity | | Available-for-sale |
| (Dollars in thousands) | | Amortized
cost | | Fair
value | | Amortized
cost | | Fair
value |
| Due in one year or less | | $ | 0 | | | $ | 0 | | | $ | 18,824 | | | $ | 18,910 | |
| Due after one year through five years | | 639 | | | 699 | | | 84,773 | | | 86,693 | |
| Due after five years through ten years | | 36,651 | | | 37,166 | | | 355,693 | | | 364,968 | |
| Due after ten years | | 2,886 | | | 2,917 | | | 846,405 | | | 863,927 | |
| Mortgage-backed securities - residential | | 0 | | | 0 | | | 728,050 | | | 724,137 | |
| Mortgage-backed securities - commercial | | 46,362 | | | 47,013 | | | 729,948 | | | 731,890 | |
| Collateralized mortgage obligations | | 11,882 | | | 12,103 | | | 696,258 | | | 697,740 | |
| Asset-backed securities | | 0 | | | 0 | | | 720,638 | | | 719,581 | |
| Total | | $ | 98,420 | | | $ | 99,898 | | | $ | 4,180,589 | | | $ | 4,207,846 | |
Unrealized gains and losses on debt securities are generally due to fluctuations in current market yields relative to the yields of the debt securities at their amortized cost. All securities with unrealized losses are reviewed quarterly to determine if any impairment exists, requiring a write-down to fair value through income. For securities in an unrealized loss position, the Company first assesses whether it intends to sell or it is more likely than not that it will be required to sell the security before recovery of its amortized cost basis. If either of the criteria regarding intent or requirement to sell is met, the security’s amortized cost basis is written down to fair value through income. For debt securities available-for-sale that do not meet the aforementioned criteria, the Company evaluates whether the decline in fair value has resulted from credit losses or other factors. In making this assessment, management considers the extent to which fair value is less than amortized cost, any changes to the rating of the security by a rating agency and adverse conditions specifically related to the security, among other factors. If this assessment indicates that a credit loss exists, the present value of cash flows expected to be collected from the security are compared to the amortized cost basis of the security. If the present value of cash flows expected to be collected is less than the amortized cost basis for the security, a credit loss exists and an allowance for credit losses is recorded, limited to the amount that the fair value of the security is less than its amortized cost basis.
First Financial does not intend to sell, and it is not more likely than not that the Company will be required to sell, debt securities temporarily impaired prior to maturity or recovery of the recorded value. The Company recorded no reserves on investment securities for the twelve months ended December 31, 2021 or 2020.
As of December 31, 2021, the Company's investment securities portfolio consisted of 1,418 securities, of which 327 were in an unrealized loss position. As of December 31, 2020, the Company's investment securities portfolio consisted of 1,351 securities, of which 94 were in an unrealized loss position.
Primarily all of First Financial’s HTM debt securities are issued by U.S. government-sponsored enterprises. These securities carry the explicit and/or implicit guarantee of the U.S. government, are widely recognized as “risk free,” and have a long history of zero credit loss. The remainder of the Company's HTM securities are non-agency collateralized mortgage obligations and obligations of state and other political subdivisions which currently carry ratings no lower than A+. There were no HTM securities on nonaccrual status or past due as of December 31, 2021, however, there were $0.5 million of other HTM securities in a loss position as of December 31, 2021. There were no HTM securities on nonaccrual status, past due or in a loss position as of December 31, 2020. The Company did not record an allowance for credit losses for these securities as of December 31, 2021 or 2020.
First Financial Bancorp 2021 Annual Report 65
Notes to Consolidated Financial Statements
The following tables provide the fair value and gross unrealized losses on investment securities in an unrealized loss position for which an allowance for credit losses was not recorded, aggregated by investment category and the length of time the individual securities have been in a continuous loss position:
| | | | | | | | | | | | | | | | | | | | | | | | | | | | | | | | | | | | | | |
| | | December 31, 2021 |
| | | Less than 12 months | | 12 months or more | | Total |
| (Dollars in thousands) | | Fair
value | | Unrealized
loss | | Fair
value | | Unrealized
loss | | Fair
value | | Unrealized
loss |
| U.S. Treasuries | | $ | 24,755 | | | $ | (190) | | | $ | 0 | | | $ | 0 | | | $ | 24,755 | | | $ | (190) | |
| Securities of U.S. government agencies and corporations | | 17,382 | | | (128) | | | 0 | | | 0 | | | 17,382 | | | (128) | |
| Mortgage-backed securities - residential | | 459,098 | | | (8,375) | | | 78,090 | | | (2,173) | | | 537,188 | | | (10,548) | |
| Mortgage-backed securities - commercial | | 205,520 | | | (2,149) | | | 13,818 | | | (203) | | | 219,338 | | | (2,352) | |
| Collateralized mortgage obligations | | 369,318 | | | (6,110) | | | 12,485 | | | (387) | | | 381,803 | | | (6,497) | |
| Obligations of state and other political subdivisions | | 380,735 | | | (7,543) | | | 55,568 | | | (1,051) | | | 436,303 | | | (8,594) | |
| Asset-backed securities | | 482,118 | | | (2,578) | | | 0 | | | 0 | | | 482,118 | | | (2,578) | |
| Other securities | | 31,896 | | | (354) | | | 11,877 | | | (373) | | | 43,773 | | | (727) | |
| Total | | $ | 1,970,822 | | | $ | (27,427) | | | $ | 171,838 | | | $ | (4,187) | | | $ | 2,142,660 | | | $ | (31,614) | |
| | | | | | | | | | | | | | | | | | | | | | | | | | | | | | | | | | | | | | |
| | | December 31, 2020 |
| | | Less than 12 months | | 12 months or more | | Total |
| (Dollars in thousands) | | Fair
value | | Unrealized
loss | | Fair
value | | Unrealized
loss | | Fair
value | | Unrealized
loss |
| U.S. Treasuries | | $ | 0 | | | $ | 0 | | | $ | 0 | | | $ | 0 | | | $ | 0 | | | $ | 0 | |
| Securities of U.S. Government agencies and corporations | | 0 | | | 0 | | | 0 | | | 0 | | | 0 | | | 0 | |
| Mortgage-backed securities - residential | | 57,872 | | | (237) | | | 0 | | | 0 | | | 57,872 | | | (237) | |
| Mortgage-backed securities - commercial | | 169,825 | | | (986) | | | 48,158 | | | (2,598) | | | 217,983 | | | (3,584) | |
| Collateralized mortgage obligations | | 49,161 | | | (445) | | | 1 | | | 0 | | | 49,162 | | | (445) | |
| Obligations of state and other political subdivisions | | 60,008 | | | (291) | | | 0 | | | 0 | | | 60,008 | | | (291) | |
| Asset-backed securities | | 84,749 | | | (435) | | | 68,967 | | | (391) | | | 153,716 | | | (826) | |
| Other securities | | 4,992 | | | (8) | | | 0 | | | 0 | | | 4,992 | | | (8) | |
| Total | | $ | 426,607 | | | $ | (2,402) | | | $ | 117,126 | | | $ | (2,989) | | | $ | 543,733 | | | $ | (5,391) | |
For further detail on the fair value of investment securities, see Note 22 – Fair Value Disclosures.
66 First Financial Bancorp 2021 Annual Report
5. Loans and Leases
First Financial offers clients a variety of commercial and consumer loan and lease products with various interest rates and payment terms. Commercial loan categories include C&I, CRE, construction real estate and lease financing. Consumer loan categories include residential real estate, home equity, installment and credit card.
Lending activities are primarily concentrated in states where the Bank operates banking centers (Ohio, Indiana, Kentucky and Illinois). First Financial also offers two nationwide lending platforms, one that provides equipment and leasehold improvement financing for franchisees in the quick service and casual dining restaurant sector and another that provides loans that are secured by commissions and cash collateral accounts to insurance agents and brokers.
In accordance with the CARES Act and the 2021 Consolidated Appropriations Act, First Financial participated in offering PPP loans to its customers. These loans provide a direct incentive for small businesses to keep their workers on the payroll and to maintain their operations during the COVID-19 pandemic. PPP loans are eligible to be forgiven provided certain conditions are met. As of December 31, 2021, First Financial had $55.6 million in PPP loans, net of unearned fees of $2.6 million. As of December 31, 2020, First Financial had $594.6 million in PPP loans, net of unearned income of $13.7 million.
Credit quality. To facilitate the monitoring of credit quality for commercial loans, First Financial utilizes the following categories of credit grades:
Pass - Higher quality loans that do not fit any of the other categories described below.
Special Mention - First Financial assigns a special mention rating to loans and leases with potential weaknesses that deserve management's close attention. If left uncorrected, these potential weaknesses may result in deterioration of the repayment prospects for the loan or lease or in First Financial's credit position at some future date.
Substandard - First Financial assigns a substandard rating to loans or leases that are inadequately protected by the current sound financial worth and paying capacity of the borrower or the collateral pledged, if any. Substandard loans and leases have well-defined weaknesses that jeopardize repayment of the debt. Substandard loans and leases are characterized by the distinct possibility that the Company will sustain some loss if the deficiencies are not addressed.
Doubtful - First Financial assigns a doubtful rating to loans and leases with all of the attributes of a substandard rating with the added characteristic that the weaknesses make collection or liquidation in full highly questionable and improbable, on the basis of currently existing facts, conditions and values. The possibility of loss is extremely high, but because of certain important and reasonably specific pending factors that may work to the advantage and strengthening of the credit quality of the loan or lease, its classification as an estimated loss is deferred until its more exact status may be determined. Pending factors include proposed merger, acquisition or liquidation procedures, capital injection, perfecting liens on additional collateral and refinancing plans.
The credit grades previously described are derived from standard regulatory rating definitions and are assigned upon initial approval of credit to borrowers and updated periodically thereafter.
First Financial considers repayment performance to be the best indicator of credit quality for consumer loans. Consumer loans that have principal and interest payments that are past due by 90 days or more are generally classified as nonperforming. Additionally, consumer loans that have been modified in a TDR are classified as nonperforming.
First Financial Bancorp 2021 Annual Report 67
Notes to Consolidated Financial Statements
The following table sets forth the Company's loan portfolio at December 31, 2021 by risk attribute and origination date:
| | | | | | | | | | | | | | | | | | | | | | | | | | | | | | | | | | | | | | | | | | | | | | | | | | | | | | | | |
| (Dollars in thousands) | | 2021 | | 2020 | | 2019 | | 2018 | | 2017 | | Prior | | Term Total | | Revolving | | Total |
| Commercial & industrial | | | | | | | | | | | | | | | | |
| Pass | | $ | 711,198 | | | $ | 442,064 | | | $ | 339,507 | | | $ | 164,273 | | | $ | 119,580 | | | $ | 154,835 | | | $ | 1,931,457 | | | $ | 700,246 | | | $ | 2,631,703 | |
| Special mention | | 389 | | | 4,867 | | | 5,993 | | | 16,057 | | | 6,511 | | | 4,918 | | | 38,735 | | | 21,505 | | | 60,240 | |
| Substandard | | 2,220 | | | 434 | | | 2,843 | | | 1,224 | | | 12,640 | | | 1,465 | | | 20,826 | | | 7,259 | | | 28,085 | |
| Doubtful | | 0 | | | 0 | | | 0 | | | 0 | | | 0 | | | 0 | | | 0 | | | 0 | | | 0 | |
| Total | | $ | 713,807 | | | $ | 447,365 | | | $ | 348,343 | | | $ | 181,554 | | | $ | 138,731 | | | $ | 161,218 | | | $ | 1,991,018 | | | $ | 729,010 | | | $ | 2,720,028 | |
| Lease financing | | | | | | | | | | | | | | | | | | |
| Pass | | $ | 31,697 | | | $ | 21,536 | | | $ | 19,095 | | | $ | 15,494 | | | $ | 6,821 | | | $ | 4,765 | | | $ | 99,408 | | | $ | 0 | | | $ | 99,408 | |
| Special mention | | 0 | | 10,216 | | 0 | | 0 | | 0 | | 0 | | 10,216 | | 0 | | 10,216 |
| Substandard | | 0 | | 0 | | 0 | | 0 | | 0 | | 0 | | 0 | | 0 | | 0 |
| Doubtful | | 0 | | 0 | | 0 | | 0 | | 0 | | 0 | | 0 | | 0 | | 0 |
| Total | | $ | 31,697 | | | $ | 31,752 | | | $ | 19,095 | | | $ | 15,494 | | | $ | 6,821 | | | $ | 4,765 | | | $ | 109,624 | | | $ | 0 | | | $ | 109,624 | |
| Construction real estate | | | | | | | | | | | | | | | | | | |
| Pass | | $ | 95,991 | | | $ | 200,421 | | | $ | 96,726 | | | $ | 15,886 | | | $ | 317 | | | $ | 12,719 | | | $ | 422,060 | | | $ | 18,299 | | | $ | 440,359 | |
| Special mention | | 0 | | | 6,531 | | | 0 | | | 9,004 | | | 0 | | | 0 | | | 15,535 | | | 0 | | | 15,535 | |
| Substandard | | 0 | | | 0 | | | 0 | | | 0 | | | 0 | | | 0 | | | 0 | | | 0 | | | 0 | |
| Doubtful | | 0 | | | 0 | | | 0 | | | 0 | | | 0 | | | 0 | | | 0 | | | 0 | | | 0 | |
| Total | | $ | 95,991 | | | $ | 206,952 | | | $ | 96,726 | | | $ | 24,890 | | | $ | 317 | | | $ | 12,719 | | | $ | 437,595 | | | $ | 18,299 | | | $ | 455,894 | |
| Commercial real estate - investor | | | | | | | | | | | | | | | | |
| Pass | | $ | 537,183 | | | $ | 379,217 | | | $ | 944,915 | | | $ | 367,946 | | | $ | 294,147 | | | $ | 434,641 | | | $ | 2,958,049 | | | $ | 66,579 | | | $ | 3,024,628 | |
| Special mention | | 0 | | | 7,479 | | | 18,136 | | | 18,006 | | | 15,566 | | | 34,153 | | | 93,340 | | | 0 | | | 93,340 | |
| Substandard | | 1,616 | | | 6 | | | 21,312 | | | 6,628 | | | 6,918 | | | 307 | | | 36,787 | | | 0 | | | 36,787 | |
| Doubtful | | 0 | | | 0 | | | 0 | | | 0 | | | 0 | | | 0 | | | 0 | | | 0 | | | 0 | |
| Total | | $ | 538,799 | | | $ | 386,702 | | | $ | 984,363 | | | $ | 392,580 | | | $ | 316,631 | | | $ | 469,101 | | | $ | 3,088,176 | | | $ | 66,579 | | | $ | 3,154,755 | |
| Commercial real estate - owner | | | | | | | | | | | | | | | | |
| Pass | | $ | 204,291 | | | $ | 184,564 | | | $ | 121,150 | | | $ | 135,463 | | | $ | 119,489 | | | $ | 259,504 | | | $ | 1,024,461 | | | $ | 7,565 | | | $ | 1,032,026 | |
| Special mention | | 970 | | | 2,283 | | | 2,262 | | | 3,751 | | | 1,381 | | | 5,512 | | | 16,159 | | | 0 | | | 16,159 | |
| Substandard | | 162 | | | 727 | | | 6,541 | | | 12,513 | | | 1,730 | | | 1,963 | | | 23,636 | | | 38 | | | 23,674 | |
| Doubtful | | 0 | | | 0 | | | 0 | | | 0 | | | 0 | | | 0 | | | 0 | | | 0 | | | 0 | |
| Total | | $ | 205,423 | | | $ | 187,574 | | | $ | 129,953 | | | $ | 151,727 | | | $ | 122,600 | | | $ | 266,979 | | | $ | 1,064,256 | | | $ | 7,603 | | | $ | 1,071,859 | |
| Residential real estate | | | | | | | | | | | | | | | | | | |
| Performing | | $ | 258,537 | | | $ | 230,699 | | | $ | 138,239 | | | $ | 64,310 | | | $ | 34,606 | | | $ | 162,924 | | | $ | 889,315 | | | $ | 0 | | | $ | 889,315 | |
| Nonperforming | | 236 | | | 970 | | | 1,193 | | | 598 | | | 339 | | | 3,418 | | | 6,754 | | | 0 | | | 6,754 | |
| Total | | $ | 258,773 | | | $ | 231,669 | | | $ | 139,432 | | | $ | 64,908 | | | $ | 34,945 | | | $ | 166,342 | | | $ | 896,069 | | | $ | 0 | | | $ | 896,069 | |
| Home equity | | | | | | | | | | | | | | | | | | |
| Performing | | $ | 42,298 | | | $ | 45,638 | | | $ | 14,713 | | | $ | 11,221 | | | $ | 7,603 | | | $ | 30,588 | | | $ | 152,061 | | | $ | 553,245 | | | $ | 705,306 | |
| Nonperforming | | 72 | | | 161 | | | 44 | | | 67 | | | 56 | | | 234 | | | 634 | | | 2,459 | | | 3,093 | |
| Total | | $ | 42,370 | | | $ | 45,799 | | | $ | 14,757 | | | $ | 11,288 | | | $ | 7,659 | | | $ | 30,822 | | | $ | 152,695 | | | $ | 555,704 | | | $ | 708,399 | |
| Installment | | | | | | | | | | | | | | | | | | |
| Performing | | $ | 58,209 | | | $ | 12,768 | | | $ | 8,213 | | | $ | 5,541 | | | $ | 3,925 | | | $ | 2,201 | | | $ | 90,857 | | | $ | 28,353 | | | $ | 119,210 | |
| Nonperforming | | 6 | | | 61 | | | 32 | | | 9 | | | 1 | | | 56 | | | 165 | | | 79 | | | 244 | |
| Total | | $ | 58,215 | | | $ | 12,829 | | | $ | 8,245 | | | $ | 5,550 | | | $ | 3,926 | | | $ | 2,257 | | | $ | 91,022 | | | $ | 28,432 | | | $ | 119,454 | |
| Credit cards | | | | | | | | | | | | | | | | | | |
| Performing | | $ | 0 | | | $ | 0 | | | $ | 0 | | | $ | 0 | | | $ | 0 | | | $ | 0 | | | $ | 0 | | | $ | 51,772 | | | $ | 51,772 | |
| Nonperforming | | 0 | | | 0 | | | 0 | | | 0 | | | 0 | | | 0 | | | 0 | | | 445 | | | 445 | |
| Total | | $ | 0 | | | $ | 0 | | | $ | 0 | | | $ | 0 | | | $ | 0 | | | $ | 0 | | | $ | 0 | | | $ | 52,217 | | | $ | 52,217 | |
| Grand Total | | $ | 1,945,075 | | | $ | 1,550,642 | | | $ | 1,740,914 | | | $ | 847,991 | | | $ | 631,630 | | | $ | 1,114,203 | | | $ | 7,830,455 | | | $ | 1,457,844 | | | $ | 9,288,299 | |
68 First Financial Bancorp 2021 Annual Report
The following table sets forth the Company's loan portfolio at December 31, 2020 by risk attribute and origination date:
| | | | | | | | | | | | | | | | | | | | | | | | | | | | | | | | | | | | | | | | | | | | | | | | | | | | | | | | |
| (Dollars in thousands) | | 2020 | | 2019 | | 2018 | | 2017 | | 2016 | | Prior | | Term Total | | Revolving | | Total |
| Commercial & industrial | | | | | | | | | | | | | | | | |
| Pass | | $ | 1,141,163 | | | $ | 460,210 | | | $ | 296,221 | | | $ | 208,077 | | | $ | 122,686 | | | $ | 138,307 | | | $ | 2,366,664 | | | $ | 502,286 | | | $ | 2,868,950 | |
| Special mention | | 24,668 | | | 10,281 | | | 18,118 | | | 6,893 | | | 6,668 | | | 6,090 | | | 72,718 | | | 10,470 | | | 83,188 | |
| Substandard | | 6,709 | | | 2,370 | | | 8,022 | | | 26,565 | | | 5,124 | | | 1,192 | | | 49,982 | | | 5,389 | | | 55,371 | |
| Doubtful | | 0 | | | 0 | | | 0 | | | 0 | | | 0 | | | 0 | | | 0 | | | 0 | | | 0 | |
| Total | | $ | 1,172,540 | | | $ | 472,861 | | | $ | 322,361 | | | $ | 241,535 | | | $ | 134,478 | | | $ | 145,589 | | | $ | 2,489,364 | | | $ | 518,145 | | | $ | 3,007,509 | |
| Lease financing | | | | | | | | | | | | | | | | | | |
| Pass | | $ | 22,916 | | | $ | 22,397 | | | $ | 12,942 | | | $ | 6,967 | | | $ | 4,802 | | | $ | 2,368 | | | $ | 72,392 | | | $ | 0 | | | $ | 72,392 | |
| Special mention | | 290 | | 0 | | 0 | | 0 | | 0 | | 0 | | 290 | | 0 | | 290 | |
| Substandard | | 5 | | 0 | | 0 | | 180 | | 120 | | 0 | | 305 | | 0 | | 305 | |
| Doubtful | | 0 | | 0 | | 0 | | 0 | | 0 | | 0 | | 0 | | 0 | | 0 | |
| Total | | $ | 23,211 | | | $ | 22,397 | | | $ | 12,942 | | | $ | 7,147 | | | $ | 4,922 | | | $ | 2,368 | | | $ | 72,987 | | | $ | 0 | | | $ | 72,987 | |
| Construction real estate | | | | | | | | | | | | | | | | |
| Pass | | $ | 96,410 | | | $ | 259,524 | | | $ | 182,625 | | | $ | 23,185 | | | $ | 24,786 | | | $ | 426 | | | $ | 586,956 | | | $ | 19,671 | | | $ | 606,627 | |
| Special mention | | 0 | | | 621 | | | 18,203 | | | 9,984 | | | 661 | | | 0 | | | 29,469 | | | 0 | | | 29,469 | |
| Substandard | | 0 | | | 0 | | | 0 | | | 0 | | | 0 | | | 0 | | | 0 | | | 0 | | | 0 | |
| Doubtful | | 0 | | | 0 | | | 0 | | | 0 | | | 0 | | | 0 | | | 0 | | | 0 | | | 0 | |
| Total | | $ | 96,410 | | | $ | 260,145 | | | $ | 200,828 | | | $ | 33,169 | | | $ | 25,447 | | | $ | 426 | | | $ | 616,425 | | | $ | 19,671 | | | $ | 636,096 | |
| Commercial real estate - investor | | | | | | | | | | | | | | | | |
| Pass | | $ | 515,950 | | | $ | 1,011,898 | | | $ | 427,077 | | | $ | 378,536 | | | $ | 286,587 | | | $ | 361,403 | | | $ | 2,981,451 | | | $ | 56,398 | | | $ | 3,037,849 | |
| Special mention | | 0 | | | 17,463 | | | 15,534 | | | 44,426 | | | 32,408 | | | 43,704 | | | 153,535 | | | 559 | | | 154,094 | |
| Substandard | | 6,198 | | | 2,043 | | | 22,497 | | | 7,067 | | | 68 | | | 14,724 | | | 52,597 | | | 0 | | | 52,597 | |
| Doubtful | | 0 | | | 0 | | | 0 | | | 0 | | | 0 | | | 0 | | | 0 | | | 0 | | | 0 | |
| Total | | $ | 522,148 | | | $ | 1,031,404 | | | $ | 465,108 | | | $ | 430,029 | | | $ | 319,063 | | | $ | 419,831 | | | $ | 3,187,583 | | | $ | 56,957 | | | $ | 3,244,540 | |
| Commercial real estate - owner | | | | | | | | | | | | | | | | |
| Pass | | $ | 185,692 | | | $ | 162,480 | | | $ | 147,236 | | | $ | 125,275 | | | $ | 128,755 | | | $ | 211,519 | | | $ | 960,957 | | | $ | 36,721 | | | $ | 997,678 | |
| Special mention | | 4,292 | | | 11,380 | | | 2,891 | | | 8,230 | | | 3,017 | | | 19,384 | | | 49,194 | | | 59 | | | 49,253 | |
| Substandard | | 668 | | | 504 | | | 7,054 | | | 5,496 | | | 306 | | | 2,321 | | | 16,349 | | | 38 | | | 16,387 | |
| Doubtful | | 0 | | | 0 | | | 0 | | | 0 | | | 0 | | | 0 | | | 0 | | | 0 | | | 0 | |
| Total | | $ | 190,652 | | | $ | 174,364 | | | $ | 157,181 | | | $ | 139,001 | | | $ | 132,078 | | | $ | 233,224 | | | $ | 1,026,500 | | | $ | 36,818 | | | $ | 1,063,318 | |
| Residential real estate | | | | | | | | | | | | | | | | | | |
| Performing | | $ | 290,277 | | | $ | 241,601 | | | $ | 115,747 | | | $ | 64,220 | | | $ | 60,094 | | | $ | 224,281 | | | $ | 996,220 | | | $ | 0 | | | $ | 996,220 | |
| Nonperforming | | 321 | | | 429 | | | 673 | | | 643 | | | 87 | | | 4,713 | | | 6,866 | | | 0 | | | 6,866 | |
| Total | | $ | 290,598 | | | $ | 242,030 | | | $ | 116,420 | | | $ | 64,863 | | | $ | 60,181 | | | $ | 228,994 | | | $ | 1,003,086 | | | $ | 0 | | | $ | 1,003,086 | |
| Home equity | | | | | | | | | | | | | | | | | | |
| Performing | | $ | 60,967 | | | $ | 20,200 | | | $ | 17,445 | | | $ | 11,308 | | | $ | 9,744 | | | $ | 41,571 | | | $ | 161,235 | | | $ | 577,609 | | | $ | 738,844 | |
| Nonperforming | | 0 | | | 0 | | | 0 | | | 39 | | | 28 | | | 138 | | | 205 | | | 4,050 | | | 4,255 | |
| Total | | $ | 60,967 | | | $ | 20,200 | | | $ | 17,445 | | | $ | 11,347 | | | $ | 9,772 | | | $ | 41,709 | | | $ | 161,440 | | | $ | 581,659 | | | $ | 743,099 | |
| Installment | | | | | | | | | | | | | | | | | | |
| Performing | | $ | 21,584 | | | $ | 15,614 | | | $ | 11,041 | | | $ | 8,812 | | | $ | 1,954 | | | $ | 3,185 | | | $ | 62,190 | | | $ | 19,479 | | | $ | 81,669 | |
| Nonperforming | | 15 | | | 53 | | | 23 | | | 35 | | | 17 | | | 36 | | | 179 | | | 2 | | | 181 | |
| Total | | $ | 21,599 | | | $ | 15,667 | | | $ | 11,064 | | | $ | 8,847 | | | $ | 1,971 | | | $ | 3,221 | | | $ | 62,369 | | | $ | 19,481 | | | $ | 81,850 | |
| Credit cards | | | | | | | | | | | | | | | | | | |
| Performing | | $ | 0 | | | $ | 0 | | | $ | 0 | | | $ | 0 | | | $ | 0 | | | $ | 0 | | | $ | 0 | | | $ | 47,845 | | | $ | 47,845 | |
| Nonperforming | | 0 | | | 0 | | | 0 | | | 0 | | | 0 | | | 0 | | | 0 | | | 640 | | | 640 | |
| Total | | $ | 0 | | | $ | 0 | | | $ | 0 | | | $ | 0 | | | $ | 0 | | | $ | 0 | | | $ | 0 | | | $ | 48,485 | | | $ | 48,485 | |
| Grand Total | | $ | 2,378,125 | | | $ | 2,239,068 | | | $ | 1,303,349 | | | $ | 935,938 | | | $ | 687,912 | | | $ | 1,075,362 | | | $ | 8,619,754 | | | $ | 1,281,216 | | | $ | 9,900,970 | |
Delinquency. Loans are considered past due or delinquent when the contractual principal or interest due in accordance with the terms of the loan agreement or any portion thereof remains unpaid after the due date of the scheduled payment.
First Financial Bancorp 2021 Annual Report 69
Notes to Consolidated Financial Statements
Loan delinquency, including nonaccrual loans, was as follows:
| | | | | | | | | | | | | | | | | | | | | | | | | | | | | | | | | | | | | | | | | | | | |
| | | As of December 31, 2021 |
| (Dollars in thousands) | | 30 – 59
days
past due | | 60 – 89
days
past due | | > 90 days
past due | | Total
past
due | | Current | | Total | | > 90 days
past due
and still
accruing |
| Loans | | | | | | | | | | | | | | |
| Commercial & industrial | | $ | 303 | | | $ | 2,006 | | | $ | 2,775 | | | $ | 5,084 | | | $ | 2,714,944 | | | $ | 2,720,028 | | | $ | 0 | |
| Lease financing | | 93 | | | 0 | | | 0 | | | 93 | | | 109,531 | | | 109,624 | | | 0 | |
| Construction real estate | | 0 | | | 0 | | | 0 | | | 0 | | | 455,894 | | | 455,894 | | | 0 | |
| Commercial real estate-investor | | 89 | | | 42 | | | 6,409 | | | 6,540 | | | 3,148,215 | | | 3,154,755 | | | 0 | |
| Commercial real estate-owner | | 56 | | | 2,207 | | | 637 | | | 2,900 | | | 1,068,959 | | | 1,071,859 | | | 0 | |
| Residential real estate | | 4,379 | | | 262 | | | 2,114 | | | 6,755 | | | 889,314 | | | 896,069 | | | 0 | |
| Home equity | | 1,214 | | | 692 | | | 1,186 | | | 3,092 | | | 705,307 | | | 708,399 | | | 0 | |
| Installment | | 162 | | | 37 | | | 45 | | | 244 | | | 119,210 | | | 119,454 | | | 0 | |
| Credit card | | 223 | | | 134 | | | 137 | | | 494 | | | 51,723 | | | 52,217 | | | 137 | |
| Total | | $ | 6,519 | | | $ | 5,380 | | | $ | 13,303 | | | $ | 25,202 | | | $ | 9,263,097 | | | $ | 9,288,299 | | | $ | 137 | |
| | | | | | | | | | | | | | | | | | | | | | | | | | | | | | | | | | | | | | | | | | | | |
| | | As of December 31, 2020 |
| (Dollars in thousands) | | 30 - 59
days
past due | | 60 - 89
days
past due | | > 90 days
past due | | Total
past
due | | Current | | Total | | > 90 days
past due and still accruing |
| Loans | | | | | | | | | | | | | | |
| Commercial & industrial | | $ | 6,532 | | | $ | 0 | | | $ | 1,861 | | | $ | 8,393 | | | $ | 2,999,116 | | | $ | 3,007,509 | | | $ | 0 | |
| Lease financing | | 0 | | | 0 | | | 0 | | | 0 | | | 72,987 | | | 72,987 | | | 0 | |
| Construction real estate | | 0 | | | 0 | | | 0 | | | 0 | | | 636,096 | | | 636,096 | | | 0 | |
| Commercial real estate-investor | | 136 | | | 0 | | | 24,422 | | | 24,558 | | | 3,219,982 | | | 3,244,540 | | | 0 | |
| Commercial real estate-owner | | 6,480 | | | 174 | | | 400 | | | 7,054 | | | 1,056,264 | | | 1,063,318 | | | 0 | |
| Residential real estate | | 2,809 | | | 370 | | | 3,687 | | | 6,866 | | | 996,220 | | | 1,003,086 | | | 0 | |
| Home equity | | 1,483 | | | 835 | | | 1,937 | | | 4,255 | | | 738,844 | | | 743,099 | | | 0 | |
| Installment | | 94 | | | 35 | | | 51 | | | 180 | | | 81,670 | | | 81,850 | | | 0 | |
| Credit card | | 303 | | | 163 | | | 174 | | | 640 | | | 47,845 | | | 48,485 | | | 169 | |
| Total | | $ | 17,837 | | | $ | 1,577 | | | $ | 32,532 | | | $ | 51,946 | | | $ | 9,849,024 | | | $ | 9,900,970 | | | $ | 169 | |
Nonaccrual. Loans are classified as nonaccrual when, in the opinion of management, collection of principal or interest is doubtful or when principal or interest payments are 90 days or more past due. Generally, loans are classified as nonaccrual due to the continued failure to adhere to contractual payment terms by the borrower, coupled with other pertinent factors. When a loan is classified as nonaccrual, the accrual of interest income is discontinued and previously accrued but unpaid interest is reversed. Any payments received while a loan is on nonaccrual status are applied as a reduction to the carrying value of the loan. A loan classified as nonaccrual may return to accrual status if none of the principal and interest is due and unpaid, and the Bank expects repayment of the remaining contractual principal and interest.
Troubled debt restructurings. A loan modification is considered a TDR when the borrower is experiencing financial difficulty and concessions are made by the Company that would not otherwise be considered for a borrower with similar credit characteristics. The most common types of modifications include interest rate reductions, bankruptcies, maturity extensions and modifications to principal amortization, including interest-only structures. Modified terms are dependent upon the financial position and needs of the individual borrower. If the modification agreement is violated, the loan is managed by the Company’s credit administration group for resolution, which may result in foreclosure in the case of real estate. In accordance with the CARES Act, performing loans that demonstrated limited signs of credit deterioration, but were modified to provide borrowers relief during the COVID-19 pandemic were not considered to be TDR as of December 31, 2021 or 2020.
TDRs are generally classified as nonaccrual for a minimum period of six months and may qualify for return to accrual status once they have demonstrated performance with the restructured terms of the loan agreement.
70 First Financial Bancorp 2021 Annual Report
First Financial had 150 TDRs totaling $27.6 million at December 31, 2021, including $11.6 million of loans on accrual status and $16.0 million of loans classified as nonaccrual. First Financial had $0.2 million of commitments outstanding to lend additional funds to borrowers whose loan terms had been modified through TDRs, and the ACL included reserves of $6.3 million related to TDRs as of December 31, 2021. For the year ended December 31, 2021, First Financial charged off $1.7 million for the portion of TDRs determined to be uncollectible. Additionally, as of December 31, 2021, approximately $5.0 million of the accruing TDRs have been performing in accordance with the restructured terms for more than one year.
First Financial had 155 TDRs totaling $21.8 million at December 31, 2020, including $7.1 million of loans on accrual status and $14.7 million of loans classified as nonaccrual. First Financial had $0.3 million of commitments outstanding to lend additional funds to borrowers whose loan terms had been modified through TDRs and the ACL included reserves of $8.8 million related to TDRs as of December 31, 2020. For the year ended December 31, 2020, First Financial charged off $1.7 million for the portion of TDRs determined to be uncollectible. Additionally, as of December 31, 2020, approximately $5.0 million of the accruing TDRs have been performing in accordance with the restructured terms for more than one year.
First Financial had 157 TDRs totaling $30.0 million at December 31, 2019, including $11.4 million of loans on accrual status and $18.5 million of loans classified as nonaccrual. First Financial had $2.5 million of commitments outstanding to lend additional funds to borrowers whose loan terms had been modified through TDRs. Additionally, First Financial charged off $2.6 million for the portion of TDRs determined to be uncollectible for the year ended December 31, 2019.
The following table provides information on loan modifications classified as TDRs during the years ended December 31, 2021, 2020 and 2019:
| | | | | | | | | | | | | | | | | | | | | | | | | | | | | | | | | | | | | | | | | | | | | | | | | | | | | | | | |
| | Years ended December 31, |
| | 2021 | | 2020 | | 2019 |
| (Dollars in thousands) | | Number of loans | | Pre-modification loan balance | | Period end balance | | Number of loans | | Pre-modification loan balance | | Period end balance | | Number of loans | | Pre-modification loan balance | | Period end balance |
| Commercial & industrial | | 7 | | | $ | 9,311 | | | $ | 8,039 | | | 8 | | $ | 14,984 | | | $ | 14,984 | | | 8 | | $ | 25,009 | | | $ | 25,071 | |
Construction
real estate | | 0 | | | 0 | | | 0 | | | 0 | | 0 | | | 0 | | | 0 | | 0 | | | 0 | |
Commercial
real estate | | 8 | | | 16,850 | | | 9,807 | | | 0 | | 0 | | | 0 | | | 9 | | 3,024 | | | 2,932 | |
Residential
real estate | | 17 | | | 1,585 | | | 1,553 | | | 24 | | 1,953 | | | 1,847 | | | 30 | | 3,415 | | | 3,062 | |
| Home equity | | 2 | | | 30 | | | 30 | | | 11 | | 351 | | | 349 | | | 14 | | 395 | | | 366 | |
| Installment | | 1 | | | 0 | | | 0 | | | 2 | | 35 | | | 22 | | | 2 | | 41 | | | 39 | |
| Total | | 35 | | | $ | 27,776 | | | $ | 19,429 | | | 45 | | | $ | 17,323 | | | $ | 17,202 | | | 63 | | | $ | 31,884 | | | $ | 31,470 | |
The following table provides information on how TDRs were modified during the years ended December 31, 2021, 2020 and 2019:
| | | | | | | | | | | | | | | | | | | | |
| | Years Ended December 31, |
| (Dollars in thousands) | | 2021 | | 2020 | | 2019 |
| Extended maturities | | $ | 0 | | | $ | 0 | | | $ | 2,877 | |
| Adjusted interest rates | | 0 | | 0 | | 5,284 |
| Combination of rate and maturity changes | | 0 | | 0 | | | 516 | |
| Forbearance | | 7,328 | | 4,759 | | | 20,320 | |
Other (1) | | 12,101 | | 12,443 | | | 2,473 | |
| Total | | $ | 19,429 | | | $ | 17,202 | | | $ | 31,470 | |
(1) Other includes covenant modifications and other concessions or combination of concessions that do not consist of interest rate adjustments, forbearance and maturity extensions.
First Financial considers repayment performance as an indication of the effectiveness of the Company's loan modifications. Borrowers that are 90 days or more past due on any principal or interest payments, or who prematurely terminate a restructured loan agreement without paying off the contractual principal balance, are considered to be in payment default of the terms of the TDR agreement.
First Financial Bancorp 2021 Annual Report 71
Notes to Consolidated Financial Statements
For the twelve months ended December 31, 2021 and 2020, there was one TDR with an insignificant balance for which there was a payment default during the period that occurred within twelve months of the loan modification. For the twelve months ended December 31, 2019, there were three TDRs with a balance of $7.0 million for which there was a payment default during the period that occurred within twelve months of the loan modification.
As stated in the CARES Act and subsequently modified by the Consolidated Appropriations Act, loan modifications in response to COVID-19 executed on loans that were not more than 30 days past due as of December 31, 2019 and executed between March 1, 2020, and the earlier of 60 days after the date of termination of the National Emergency or January 1, 2022 are not required to be reported as a TDR.
As of December 31, 2021, the Company's loan portfolio included $16.5 million of active loan modifications made under the guidance of the CARES Act that were not classified as TDR. These modifications were comprised of two commercial loans making interest only payments.
As of December 31, 2020, the Company's loan portfolio included $320.2 million of active loan modifications made under the guidance of the CARES Act that were not classified as TDR. These modifications included $291.5 million of borrowers making interest only payments at year end, and full principal and interest deferrals of $28.7 million. Active modifications as of December 31, 2020 were primarily hotel and franchise loans, which were $186.2 million and $44.3 million respectively as of December 31, 2020, or 58.2% and 13.8% of the total active modifications at December 31, 2020. As of December 31, 2020, the Company's loan portfolio included 90 commercial loans with balances of $312.5 million and 53 consumer loans with balances of $7.7 million that were modified in response to COVID-19 that were not considered TDRs.
Nonperforming loans. Loans classified as nonaccrual and loans modified as TDRs are considered nonperforming. The following table provides information on nonperforming loans as of December 31:
| | | | | | | | | | | | | | | | | | | | | | | | | | | | | | | | | | | | | | | | | | | | |
| | 2021 | | 2020 | | 2019 |
| (Dollars in thousands) | | Nonaccrual loans with a related ACL | | Nonaccrual loans with no related ACL | | Total nonaccrual | | Nonaccrual loans with a related ACL | | Nonaccrual loans with no related ACL | | Total nonaccrual | | Total nonaccrual |
Nonaccrual loans (1) | | | | | | | | | | | | | | |
| Commercial & industrial | | $ | 11,077 | | | $ | 6,285 | | | $ | 17,362 | | | $ | 18,711 | | | $ | 10,519 | | | $ | 29,230 | | | $ | 24,346 | |
| Lease financing | | 0 | | | 203 | | | 203 | | | 0 | | | 0 | | | 0 | | | 223 | |
| Construction real estate | | 0 | | | 0 | | | 0 | | | 0 | | | 0 | | | 0 | | | 0 | |
| Commercial real estate | | 17,716 | | | 1,796 | | | 19,512 | | | 6,957 | | | 27,725 | | | 34,682 | | | 7,295 | |
| Residential real estate | | 0 | | | 8,305 | | | 8,305 | | | 251 | | | 11,350 | | | 11,601 | | | 10,892 | |
| Home equity | | 0 | | | 2,922 | | | 2,922 | | | 0 | | | 5,076 | | | 5,076 | | | 5,242 | |
| Installment | | 0 | | | 88 | | | 88 | | | 0 | | | 163 | | | 163 | | | 167 | |
| Total nonaccrual loans | | $ | 28,793 | | | $ | 19,599 | | | $ | 48,392 | | | $ | 25,919 | | | $ | 54,833 | | | $ | 80,752 | | | $ | 48,165 | |
| | | | | | | | | | | | | | |
| | | | | | | | | | | | | | |
| | | | | | | | | | | | | | |
| | | | | | | | | | | | | | |
| | | | | | | | | | | | | | |
| Interest income effect | | | | | | | | | | 2021 | | 2020 | | 2019 |
| Gross amount of interest that would have been recorded under original terms | | | | | | | | $ | 5,132 | | | $ | 5,892 | | | $ | 5,813 | |
| Interest included in income | | | | | | | | | | | | | | |
| Nonaccrual loans | | | | | | | | | | 1,618 | | | 1,636 | | | 1,042 | |
| Troubled debt restructurings | | | | | | | | 314 | | | 426 | | | 801 | |
| Total interest included in income | | | | | | | | 1,932 | | | 2,062 | | | 1,843 | |
| Net impact on interest income | | | | | | | | $ | 3,200 | | | $ | 3,830 | | | $ | 3,970 | |
| | | | | | | | | | | | | | |
| Commitments outstanding to borrowers with nonaccrual loans | | | | | | | | $ | 0 | | | $ | 0 | | | $ | 3 | |
(1) Nonaccrual loans include nonaccrual TDRs of $16.0 million, $14.7 million and $18.5 million as of December 31, 2021, 2020 and 2019, respectively.
First Financial individually reviews all nonperforming loan relationships greater than $250,000 to determine if an individually evaluated allowance is necessary based on the borrower’s overall financial condition, resources and payment record, support
72 First Financial Bancorp 2021 Annual Report
from guarantors and the realizable value of any collateral. Individually evaluated allowances are based on discounted cash flows using the loan's initial effective interest rate or the fair value of the collateral for certain collateral dependent loans.
| | | | | | | | | | | | | | |
| First Financial's investment in impaired loans was as follows: | | | | |
| | Year ended December 31, |
| | | 2019 |
| (Dollars in thousands) | | Average
balance | | Interest
income
recognized |
| Loans with no related allowance recorded | | | | |
| Commercial & industrial | | $ | 31,846 | | | $ | 926 | |
| Lease financing | | 168 | | | 0 | |
| Construction real estate | | 6 | | | 0 | |
| Commercial real estate | | 18,757 | | | 357 | |
| Residential real estate | | 15,915 | | | 307 | |
| Home equity | | 5,893 | | | 121 | |
| Installment | | 170 | | | 2 | |
| Total | | 72,755 | | | 1,713 | |
| | | | |
| Loans with an allowance recorded | | | |
| Commercial & industrial | | 4,721 | | | 87 | |
| Lease financing | | 57 | | | 0 | |
| Construction real estate | | 0 | | | 0 | |
| Commercial real estate | | 1,339 | | | 31 | |
| Residential real estate | | 446 | | | 12 | |
| Home equity | | 0 | | | 0 | |
| Installment | | 0 | | | 0 | |
| Total | | 6,563 | | | 130 | |
| | | | |
| Total | | | | |
| Commercial & industrial | | 36,567 | | | 1,013 | |
| Lease financing | | 225 | | | 0 | |
| Construction real estate | | 6 | | | 0 | |
| Commercial real estate | | 20,096 | | | 388 | |
| Residential real estate | | 16,361 | | | 319 | |
| Home equity | | 5,893 | | | 121 | |
| Installment | | 170 | | | 2 | |
| Total | | $ | 79,318 | | | $ | 1,843 | |
First Financial Bancorp 2021 Annual Report 73
Notes to Consolidated Financial Statements
A loan is considered to be collateral dependent when the borrower is experiencing financial difficulty and the repayment is expected to be provided substantially through the operation or sale of collateral. The following table presents the amortized cost basis of collateral dependent loans by class of loan.
| | | | | | | | | | | | | | | | | | | | | | | | | | | | | | | | | | | | | | | | | | | | |
| | December 31, 2021 |
| | Type of Collateral |
| (Dollar in thousands) | | Business assets | | Commercial real estate | | Equipment | | Land | | Residential real estate | | Other | | Total |
| Class of loan | | | | | | | | | | | | | | |
| Commercial & industrial | | $ | 13,171 | | | $ | 15 | | | $ | 833 | | | $ | 0 | | | $ | 0 | | | $ | 3,343 | | | $ | 17,362 | |
| Leasing | | 0 | | 0 | | | 203 | | | 0 | | | 0 | | | 0 | | | 203 | |
| Commercial real estate-investor | | 0 | | 6,362 | | | 0 | | | 0 | | | 422 | | | 0 | | | 6,784 | |
| Commercial real estate-owner | | 0 | | 6,673 | | | 5,937 | | | 38 | | | 80 | | | 0 | | | 12,728 | |
| Residential real estate | | 0 | | 0 | | | 0 | | | 0 | | | 8,305 | | | 0 | | | 8,305 | |
| Home equity | | 0 | | 0 | | 0 | | 0 | | 2,922 | | | 0 | | 2,922 | |
| Installment | | 0 | | 0 | | 0 | | 0 | | 0 | | 88 | | 88 | |
| Total | | $ | 13,171 | | 13171000 | $ | 13,050 | | | $ | 6,973 | | | $ | 38 | | | $ | 11,729 | | | $ | 3,431 | | | $ | 48,392 | |
| | | | | | | | | | | | | | |
| | | | | | | | | | | | | | |
| | December 31, 2020 |
| | Type of Collateral |
| (Dollar in thousands) | | Business assets | | Commercial real estate | | Equipment | | Land | | Residential real estate | | Other | | Total |
| Class of loan | | | | | | | | | | | | | | |
| Commercial & industrial | | $ | 30,961 | | | $ | 6,130 | | | $ | 2,608 | | | $ | 865 | | | $ | 0 | | | $ | 4,892 | | | $ | 45,456 | |
| Commercial real estate-investor | | 0 | | 20,212 | | 661 | | 5,537 | | 872 | | 0 | | 27,282 | |
| Commercial real estate-owner | | 5,842 | | 3,495 | | 0 | | 42 | | 344 | | 0 | | 9,723 | |
| Residential real estate | | 0 | | 0 | | 0 | | 0 | | 11,601 | | 0 | | 11,601 | |
| Home equity | | 0 | | 0 | | 0 | | 0 | | 5,076 | | 0 | | 5,076 | |
| Installment | | 0 | | 0 | | 0 | | 0 | | 0 | | 163 | | 163 | |
| Total | | $ | 36,803 | | | $ | 29,837 | | | $ | 3,269 | | | $ | 6,444 | | | $ | 17,893 | | | $ | 5,055 | | | $ | 99,301 | |
Lease financing. First Financial originates both sales-type and direct financing leases, and the Company manages and reviews lease residuals in accordance with its credit policies. Sales-type lease contracts contain the ability to purchase the underlying equipment at lease maturity and profit or loss is recognized at lease commencement. Direct financing leases are generally three to five years in length and may be extended at maturity, however, early cancellation may result in a fee to the borrower. For direct financing leases, the net unearned income is deferred and amortized over the life of the lease. Effective December 31, 2021, First Financial acquired Summit Funding Group, Inc., which is a full-service equipment leasing company. In conjunction with this acquisition, First Financial acquired $42.3 million of financing leases, which were included in Loans and leases on the Consolidated Balance Sheets. For further detail on the acquisition, see Note 23 - Business Combinations.
74 First Financial Bancorp 2021 Annual Report
OREO. OREO is comprised of properties acquired by the Company primarily through the loan foreclosure or repossession process, that result in partial or total satisfaction of problem loans.
Changes in OREO were as follows:
| | | | | | | | | | | | | | | | | | | | |
| | | Years ended December 31, |
| (Dollars in thousands) | | 2021 | | 2020 | | 2019 |
| Balance at beginning of year | | $ | 1,287 | | | $ | 2,033 | | | $ | 1,401 | |
| Additions | | | | | | |
| Commercial | | 98 | | | 510 | | | 415 | |
| Residential | | 0 | | | 507 | | | 2,033 | |
| Total additions | | 98 | | | 1,017 | | | 2,448 | |
| Disposals | | | | | | |
| Commercial | | (947) | | | (217) | | | (541) | |
| Residential | | (331) | | | (1,859) | | | (912) | |
| Total disposals | | (1,278) | | | (2,076) | | | (1,453) | |
| Valuation adjustments | | | | | | |
| Commercial | | (9) | | | 448 | | | (112) | |
| Residential | | 0 | | | (135) | | | (251) | |
| Total valuation adjustments | | (9) | | | 313 | | | (363) | |
| Balance at end of year | | $ | 98 | | | $ | 1,287 | | | $ | 2,033 | |
6. Allowance for Credit Losses
Allowance for credit losses - loans and leases. The allowance for credit losses is a valuation account that is deducted from the loans’ amortized cost basis to present the net amount expected to be collected on the loans. The ACL is increased by provision expense and decreased by charge-offs, net of recoveries of amounts previously charged-off. First Financial's policy is to charge-off all or a portion of a loan when, in management's opinion, it is unlikely to collect the principal amount owed in full either through payments from the borrower or a guarantor or from the liquidation of collateral. Expected recoveries do not exceed the aggregate of amounts previously charged-off and expected to be charged-off. Accrued interest receivable on loans and leases, which totaled $29.5 million and $37.7 million as of December 31, 2021 and December 31, 2020, respectively, is excluded from the estimate of credit losses.
Management estimates the allowance using relevant available information from both internal and external sources, relating to past events, current conditions and reasonable and supportable forecasts. Historical credit loss experience paired with economic forecasts provide the basis for the quantitatively modeled estimation of expected credit losses. First Financial adjusts its quantitative model, as necessary, to reflect conditions not already considered by the quantitative model. These adjustments are commonly known as the Qualitative Framework.
The ACL is measured on a collective (pool) basis when similar risk characteristics exist. The Company has identified the following portfolio segments and measures the ACL using the following methods:
Commercial and industrial – C&I loans include revolving lines of credit and term loans to commercial customers for use in normal business operations to finance working capital needs, equipment purchases, leasehold improvements or other projects. C&I loans are generally underwritten individually and secured with the assets of the Company and/or the personal guarantee of the business owners. C&I loans also include ABL, equipment and leasehold improvement financing for franchisees in the quick service and casual dining restaurant sector and commission-based loans to insurance agents and brokers. ABL transactions typically involve larger commercial clients and are secured by specific assets, such as inventory, accounts receivable, machinery and equipment. In the franchise lending space, First Financial focuses on a limited number of restaurant concepts that have sound economics, low closure rates and strong brand awareness within specified local, regional or national markets. Within the insurance lending platform, First Financial serves insurance agents and brokers that are looking to maximize their book-of-business value and grow their agency business.
First Financial Bancorp 2021 Annual Report 75
Notes to Consolidated Financial Statements
Current period default rates are utilized in the modeling of the ACL for C&I loans, and are adjusted for forecasted changes in the treasury term spread and market volatility index. Changes in current period defaults or forecasted expectations for these economic variables could result in volatility in the Company's ACL in future periods.
Lease financing – Lease financing consists of lease transactions for the acquisition of both new and used business equipment for commercial clients. Lease products may include tax leases, finance leases, lease lines of credit and interim funding. The credit underwriting for lease transactions includes detailed analysis of the lessee's industry and business model, nature of the equipment, equipment resale values, historical and projected cash flow analysis, secondary sources of repayment and guarantor, in addition to other considerations.
The ACL model for leases sources expected default rates from the C&I portfolio model. Therefore, changes in forecasted expectations for the treasury term spread and market volatility index could result in volatility in the Company's ACL in future periods.
Construction real estate – Real estate construction loans are term loans to individuals, companies or developers used for the construction or development of a commercial or residential property for which repayment will be generated by the sale or permanent financing of the property. Generally, these loans are for construction projects that have been pre-sold, pre-leased or have secured permanent financing, as well as loans to real estate companies with significant equity invested in the project. An independent credit team underwrites construction real estate loans, which are managed by experienced lending officers and monitored through the construction phase by a centralized funding desk that manages loan disbursements.
The construction ACL model is adjusted for forecasted changes in rental vacancy rates in the Bank's geographic footprint and the housing price index. Changes in forecasted expectations for these economic variables could result in volatility in the Company's ACL in future periods.
Commercial real estate - owner & investor – Commercial real estate loans consist of term loans secured by a mortgage lien on real estate properties such as apartment buildings, office and industrial buildings and retail shopping centers. Additionally, the Company's franchise lending activities discussed in the "Commercial and Industrial" section often include the financing of real estate in addition to equipment. The credit underwriting for both owner-occupied and investor income producing real estate loans includes detailed market analysis, historical and projected cash flow analysis, appropriate equity margins, assessment of lessees and lessors, environmental risks and the type, age, condition and location of real estate, among other factors.
First Financial models owner-occupied and investor CRE separately when determining the ACL. For owner occupied CRE, current period default rates are utilized in the modeling, and are adjusted for forecasted changes in the BAA bond spread, national rental vacancy rates and the consumer confidence index. Current period default rates are also utilized in the modeling of investor CRE loans, and are adjusted for forecasted changes in the BAA bond spread, multifamily building permits within the Bank’s geographic footprint, and national rental vacancy rates. Changes in current period defaults and forecasted expectations for these economic variables could result in volatility in the Company's ACL in future periods.
Residential real estate – Residential real estate loans represent loans to consumers for the financing of a residence. These loans generally have a 15 to 30 year term and a fixed interest rate, but may have a shorter term to maturity with an adjustable interest rate. In most cases, these loans are extended to borrowers to finance their primary residence. First Financial sells residential real estate loan originations into the secondary market on both servicing retained and servicing released bases. Residential real estate loans are generally underwritten to secondary market lending standards, utilizing underwriting processes that rely on empirical data to assess credit risk as well as analysis of the borrower's ability to repay their obligations, credit history, the amount of any down payment and the market value or other characteristics of the property. First Financial also offers a residential mortgage product that features similar borrower credit characteristics but a more streamlined underwriting process than typically required to sell to government-sponsored enterprises and thus is retained on the Consolidated Balance Sheets.
The residential real estate ACL model is adjusted for forecasted changes in the housing price index, housing starts within the Bank’s geographic footprint and national single-family existing home sales. Changes in forecasted expectations for these economic variables could result in volatility in the Company's ACL in future periods.
Home equity – Home equity lending includes both home equity loans and revolving lines of credit secured by a first or second lien on the borrower’s residence. Home equity lending underwriting considerations include the borrower's credit history as well as to debt-to-income and loan-to-value policy limits.
76 First Financial Bancorp 2021 Annual Report
The home equity ACL model is adjusted for forecasted changes in the consumer credit growth rate within the Bank’s geographic footprint and the working-age labor participation rate. Changes in forecasted expectations for these economic variables could result in volatility in the Company's ACL in future periods.
Installment – Installment lending consists of consumer loans not secured by real estate, including loans secured by automobiles and unsecured personal loans.
The ACL model for installment loans sources expected default rates from the residential real estate and home equity portfolio models and is paired with installment specific LGD rates. Changes in forecasted expectations for the consumer credit growth rate within the Bank’s geographic footprint, the working-age labor participation rate, the housing price index, housing starts within the Bank’s geographic footprint and national existing single-family existing home sales could result in volatility in the Company's ACL in future periods.
Credit card – Credit card lending consists of secured and unsecured revolving lines of credit to consumer and business customers. Credit card lines are generally available for an indefinite period of time as long as the borrower's credit characteristics do not materially or adversely change, but lines are unconditionally cancellable by the Company at any time.
The ACL model for credit card loans sources expected default rates from the residential real estate and home equity portfolio models and is paired with credit card specific LGD rates. Changes in forecasted expectations for the consumer credit growth rate within the Bank’s geographic footprint, the working-age labor participation rate, the housing price index, housing starts within the Bank’s geographic footprint and national existing single-family existing home sales could result in volatility in the Company's ACL in future periods.
The Company utilized the Moody's December baseline forecast as its R&S forecast in the quantitative model, which included consideration of the impact from both the COVID-19 pandemic and the related government stimulus response at the time. For reasonableness, the Company also considered the impact to the model from alternative, more adverse economic forecasts, slower prepayment speeds and increased default rates. These alternative analyses were utilized to inform the Company's qualitative adjustments. Additionally, First Financial considered its credit exposure to certain industries believed to be at risk for future credit stress related to the COVID-19 pandemic, such as franchise, hotel and investor commercial real estate lending when making qualitative adjustments to the ACL model.
First Financial's ACL is influenced by loan volumes, risk rating migration or delinquency status, and other conditions impacting loss expectations, such as reasonable and supportable forecasts of economic conditions. For the twelve months ended December 31, 2021, the ACL declined due to improvements in economic forecasts and the Company's improved credit outlook. Over the course of 2021, Moody's economic forecasts gradually improved as the economy showed significant signs of recovery from the beginning of the pandemic. The Company's improved credit outlook considered the impact from loan sales that addressed various portfolio concentrations, a significant decline in classified asset balances and relatively stable net charge-offs, excluding the impact from loan sales. For the twelve months ended, December 31, 2020, the ACL increased due to First Financial's adoption of ASC 326 and management's expectation of higher credit losses resulting from the COVID-19 pandemic.
First Financial Bancorp 2021 Annual Report 77
Notes to Consolidated Financial Statements
Changes in the allowance by loan category as of December 31 were as follows:
| | | | | | | | | | | | | | | | | | | | | | | | | | | | | | | | | | | | | | | | | | | | | | | | | | | | | | | | |
| | 2021 |
| (Dollars in thousands) | | Commercial & industrial | | Lease financing | | Construction real estate | | Commercial real estate | | Residential real estate | | Home equity | | Installment | | Credit card | | Total |
| Allowance for credit losses | | | | | | | | | | | | | | | | | | |
| Balance at beginning of year | | $ | 51,454 | | | $ | 995 | | | $ | 21,736 | | | $ | 76,795 | | | $ | 8,560 | | | $ | 11,869 | | | $ | 1,215 | | | $ | 3,055 | | | $ | 175,679 | |
| Purchase accounting ACL for PCD | | 0 | | | 17 | | | 0 | | | 0 | | | 0 | | | 0 | | | 0 | | | 0 | | | 17 | |
| Provision for credit losses | | 6,606 | | | 621 | | | (8,367) | | | (14,689) | | | (2,436) | | | (2,376) | | | 65 | | | 1,552 | | | (19,024) | |
| Gross charge-offs | | (15,620) | | | 0 | | | (1,498) | | | (13,471) | | | (127) | | | (1,073) | | | (334) | | | (780) | | | (32,903) | |
| Recoveries | | 1,612 | | | 0 | | | 3 | | | 4,785 | | | 228 | | | 1,223 | | | 151 | | | 221 | | | 8,223 | |
| Total net charge-offs | | (14,008) | | | 0 | | | (1,495) | | | (8,686) | | | 101 | | | 150 | | | (183) | | | (559) | | | (24,680) | |
| Ending allowance for credit losses | | $ | 44,052 | | | $ | 1,633 | | | $ | 11,874 | | | $ | 53,420 | | | $ | 6,225 | | | $ | 9,643 | | | $ | 1,097 | | | $ | 4,048 | | | $ | 131,992 | |
| | | | | | | | | | | | | | | | | | | | | | | | | | | | | | | | | | | | | | | | | | | | | | | | | | | | | | | | |
| | | 2020 |
| (Dollars in thousands) | | Commercial & industrial | | Lease financing | | Construction real estate | | Commercial real estate | | Residential real estate | | Home equity | | Installment | | Credit card | | Total |
| Allowance for credit losses | | | | | | | | | | | | | | | | | | |
| Beginning balance, prior to adoption of ASC 326 | | $ | 18,584 | | | $ | 971 | | | $ | 2,381 | | | $ | 23,579 | | | $ | 5,299 | | | $ | 4,787 | | | $ | 392 | | | $ | 1,657 | | | $ | 57,650 | |
| Impact of adopting ASC 326 | | 9,901 | | | 118 | | | 11,579 | | | 24,118 | | | 5,490 | | | 8,430 | | | 801 | | | 1,068 | | | $ | 61,505 | |
| Provision for credit losses | | 25,407 | | | 758 | | | 7,759 | | | 38,936 | | | (2,122) | | | (939) | | | 12 | | | 985 | | | 70,796 | |
| Gross charge-offs | | (5,345) | | | (852) | | | 0 | | | (12,100) | | | (488) | | | (1,541) | | | (148) | | | (885) | | | (21,359) | |
| Recoveries | | 2,907 | | | 0 | | | 17 | | | 2,262 | | | 381 | | | 1,132 | | | 158 | | | 230 | | | 7,087 | |
| Total net charge-offs | | (2,438) | | | (852) | | | 17 | | | (9,838) | | | (107) | | | (409) | | | 10 | | | (655) | | | (14,272) | |
| Ending allowance for credit losses | | $ | 51,454 | | | $ | 995 | | | $ | 21,736 | | | $ | 76,795 | | | $ | 8,560 | | | $ | 11,869 | | | $ | 1,215 | | | $ | 3,055 | | | $ | 175,679 | |
| | | | | | | | | | | | | | | | | | | | | | | | | | | | | | | | | | | | | | | | | | | | | | | | | | | | | | | | |
| | | 2019 |
| (Dollars in thousands) | | Commercial & industrial | | Lease financing | | Construction real estate | | Commercial real estate | | Residential real estate | | Home equity | | Installment | | Credit card | | Total |
| Allowance for credit losses | | | | | | | | | | | | | | | | | | |
| Balance at beginning of year | | $ | 18,746 | | | $ | 1,130 | | | $ | 3,413 | | | $ | 21,048 | | | $ | 4,964 | | | $ | 5,348 | | | $ | 362 | | | $ | 1,531 | | | $ | 56,542 | |
| Provision for credit losses | | 23,631 | | | 3 | | | (1,100) | | | 5,107 | | | 739 | | | 695 | | | 2 | | | 1,521 | | | 30,598 | |
| Gross charge-offs | | (26,676) | | | (162) | | | 0 | | | (3,689) | | | (677) | | | (2,591) | | | (223) | | | (1,547) | | | (35,565) | |
| Recoveries | | 2,883 | | | 0 | | | 68 | | | 1,113 | | | 273 | | | 1,335 | | | 251 | | | 152 | | | 6,075 | |
| Total net charge-offs | | (23,793) | | | (162) | | | 68 | | | (2,576) | | | (404) | | | (1,256) | | | 28 | | | (1,395) | | | (29,490) | |
| Ending allowance for credit losses | | $ | 18,584 | | | $ | 971 | | | $ | 2,381 | | | $ | 23,579 | | | $ | 5,299 | | | $ | 4,787 | | | $ | 392 | | | $ | 1,657 | | | $ | 57,650 | |
Allowance for credit losses - unfunded commitments. First Financial estimates expected credit losses over the contractual period in which the Company is exposed to credit risk via a contractual obligation to extend credit, unless that obligation is unconditionally cancellable by the Company. The estimate includes consideration of the likelihood that funding will occur and an estimate of expected credit losses on commitments expected to be funded over its estimated life consistent with the Company's ACL methodology for loans and leases.
Prior to the adoption of ASC 326, First Financial maintained its reserve to absorb probable losses incurred in standby letters of credit and outstanding loan commitments. First Financial determined the adequacy of this reserve based upon an evaluation of the unfunded credit facilities, which included consideration of historical commitment utilization experience, credit risk ratings and historical loss rates, consistent with the Company's ALLL methodology at the time.
The ACL on unfunded commitments was $13.4 million as of December 31, 2021 and $12.5 million as of December 31, 2020. Due to the adoption of ASC 326, First Financial recorded $12.2 million in the ACL on unfunded commitments effective January 1, 2020. Additionally, First Financial recorded $0.9 million of provision expense related to the ACL on unfunded commitments for the twelve months ended December 31, 2021 and a provision recapture of $0.2 million for both December 31, 2020 and December 31, 2019.
78 First Financial Bancorp 2021 Annual Report
7. Premises and Equipment
Premises and equipment at December 31 were as follows:
| | | | | | | | | | | | | | |
| (Dollars in thousands) | | 2021 | | 2020 |
| Land and land improvements | | $ | 49,402 | | | $ | 52,373 | |
| Buildings | | 155,337 | | | 161,371 | |
| Furniture and fixtures | | 70,847 | | | 70,177 | |
| Leasehold improvements | | 30,190 | | | 29,525 | |
| Construction in progress | | 8,145 | | | 8,434 | |
| | 313,921 | | | 321,880 | |
| | | | |
| Less: Accumulated depreciation and amortization | | 120,881 | | | 114,669 | |
| Total | | $ | 193,040 | | | $ | 207,211 | |
Depreciation expense recorded in 2021, 2020 and 2019 was $14.1 million, $15.4 million and $16.1 million, respectively.
8. Leases - Lessees
A lease is defined as a contract, or part of a contract, that conveys the right to control the use of identified property, plant or equipment for a period of time in exchange for consideration. First Financial is primarily the lessee in its leasing agreements, and substantially all of those agreements are for real estate property for branches, ATM locations and office space.
On January 1, 2019, the Company adopted Topic 842 and all subsequent modifications. For First Financial, this adoption primarily affected the accounting treatment for operating lease agreements in which the Company is the lessee. Substantially all of the Company's leases are classified as operating leases, and therefore, were previously not recognized on the Company’s Consolidated Balance Sheets.
With the adoption of Topic 842, operating lease agreements were required to be recognized on the Consolidated Balance Sheets as an ROU asset and a corresponding lease liability. The Company's right to use an asset over the life of a lease is recorded as a "right of use" asset in Accrued interest and other assets on the Consolidated Balance Sheet and was $57.2 million and $63.9 million at December 31, 2021 and 2020, respectively. Certain adjustments to the ROU asset may be required for items such as initial direct costs paid or incentives received. First Financial recorded a $67.6 million and $71.7 million lease liability in Accrued interest and other liabilities on the Consolidated Balance Sheet at December 31, 2021 and 2020, respectively.
The calculated amount of the ROU assets and lease liabilities are impacted by the length of the lease term and the discount rate used to calculate the present value of minimum lease payments. Regarding the discount rate, Topic 842 requires the use of the rate implicit in the lease whenever this rate is readily determinable. As this rate is rarely determinable, the Company utilizes its incremental borrowing rate at lease inception, on a collateralized basis, over a similar term. For operating leases existing prior to January 1, 2019, the rate was based upon the remaining lease term as of that date.
Leases with an initial term of 12 months or less are not recorded on the balance sheet and First Financial recognizes lease expense for these leases on a straight-line basis over the term of the lease. Most leases include one or more options to renew, with renewal terms that can extend the lease term from one to 20 years or more. The exercise of renewal options on operating leases is at the Company's sole discretion, and certain leases may include options to purchase the leased property. If at lease inception, the Company considers the exercising of a renewal option to be reasonably certain, the Company will include the extended term in the calculation of the ROU asset and lease liability. First Financial does not enter into lease agreements which contain material residual value guarantees or material restrictive covenants.
Certain leases provide for increases in future minimum annual rental payments as defined in the lease agreements and leases generally also include real estate taxes and common area maintenance charges in the annual rental payments.
The components of lease expense for the years ended December 31, 2021, 2020 and 2019 were as follows:
First Financial Bancorp 2021 Annual Report 79
| | | | | | | | | | | | | | | | | | | | |
| (Dollars in thousands) | | December 31, 2021 | | December 31, 2020 | | December 31, 2019 |
| Operating lease cost | | $ | 7,425 | | | $ | 7,897 | | | $ | 7,324 | |
| | | | | | |
| | | | | | |
| | | | | | |
| Short-term lease cost | | 108 | | | 142 | | | 55 | |
| Variable lease cost | | 2,621 | | | 2,532 | | | 2,553 | |
| Total operating lease cost | | $ | 10,154 | | | $ | 10,571 | | | $ | 9,932 | |
Future minimum commitments due under these lease agreements as of December 31, 2021 are as follows:
| | | | | | | | | | | | |
| (Dollars in thousands) | | Operating leases | | | | |
| 2022 | | $ | 7,784 | | | | | |
| 2023 | | 7,683 | | | | | |
| 2024 | | 7,288 | | | | | |
| 2025 | | 6,673 | | | | | |
| 2026 | | 6,269 | | | | | |
| Thereafter | | 50,311 | | | | | |
| Total lease payments | | 86,008 | | | | | |
| Less imputed interest | | 18,456 | | | | | |
| Total | | $ | 67,552 | | | | | |
The weighted average lease term and discount rate for the Company's operating leases were as follows:
| | | | | | | | | | | | | | | | | | | | |
| | December 31, 2021 | | December 31, 2020 | | December 31, 2019 |
| Operating leases | | | | | | |
| Weighted-average remaining lease term | | 13.9 years | | 15.1 years | | 15.6 years |
| | | | | | |
| | | | | | |
| | | | | | |
| Weighted-average discount rate | | 3.25 | % | | 3.07 | % | | 3.43 | % |
| | | | | | |
Supplemental cash information at year end related to leases was as follows:
| | | | | | | | | | | | | | | | | | | | |
| (Dollars in thousands) | | December 31, 2021 | | December 31, 2020 | | December 31, 2019 |
| Cash paid for amounts included in the measurement of lease liabilities | | | | |
| Operating cash flows from operating leases | | $ | 6,860 | | | $ | 8,196 | | | $ | 7,335 | |
| | | | | | |
| | | | | | |
| ROU assets obtained in exchange for lease obligations | | | | |
| Operating leases | | 6,076 | | | 9,725 | | | 64,902 | |
| | | | | | |
80 First Financial Bancorp 2021 Annual Report
9. Goodwill and Other Intangible Assets
Goodwill. Assets and liabilities acquired in a business combination are recorded at their estimated fair values as of the acquisition date. The excess of the purchase price of the acquisition over the fair value of net assets acquired is recorded as goodwill.
Changes in the carrying amount of goodwill for the years ended December 31, 2021, 2020 and 2019 are shown below.
| | | | | | | | | | | | | | | | | | | | |
| (Dollars in thousands) | | 2021 | | 2020 | | 2019 |
| Balance at beginning of year | | $ | 937,771 | | | $ | 937,771 | | | $ | 880,251 | |
| Goodwill resulting from business combinations | | 62,978 | | | 0 | | | 57,520 | |
| Balance at end of year | | $ | 1,000,749 | | | $ | 937,771 | | | $ | 937,771 | |
In December 2021, First Financial recorded $63.0 million of goodwill resulting from the acquisition of Summit Funding Group, Inc. During 2019, First Financial recorded $57.5 million of goodwill resulting from the Bannockburn acquisition, in addition to its final adjustments to goodwill resulting from the MSFG merger. For further detail on various mergers or acquisitions, see Note 23 - Business Combinations.
Goodwill is evaluated for impairment on an annual basis as of October 1 of each year, or whenever events or changes in circumstances indicate that the fair value of a reporting unit may be below its carrying value. First Financial performed its most recent annual qualitative impairment test as of October 1, 2021 and no impairment was indicated. As of December 31, 2021, no events or changes in circumstances indicated that the fair value of the reporting unit was below its carrying value.
Other intangible assets. Other intangible assets consist primarily of core deposit, customer list and other miscellaneous intangibles, such as purchase commissions, non-compete agreements and trade name intangibles.
Core deposit intangibles represent the estimated fair value of acquired customer deposit relationships on the date of acquisition and are amortized on an accelerated basis over their estimated useful lives. First Financial's core deposit intangibles have an estimated weighted average remaining life of 6.2 years.
First Financial recorded a $30.1 million customer list intangible asset in conjunction with the Summit acquisition to account for the obligation or advantage on the part of either the Company or the customer to continue the pre-existing relationship subsequent to the merger. The customer list intangible asset is being amortized on a straight-line basis over its estimated useful life of 12 years. Additionally, First Financial recorded a $39.4 million customer list intangible asset in conjunction with the Bannockburn acquisition which is being amortized on a straight-line basis over its estimated useful life of 11 years.
The gross carrying amount and accumulated amortization of other intangible assets were as follows:
| | | | | | | | | | | | | | | | | | | | | | | | | | |
| (Dollars in thousands) | | December 31, 2021 | | December 31, 2020 |
| Amortized intangible assets | | | | | | | | |
| Core deposit intangibles | | $ | 45,256 | | | $ | (26,911) | | | $ | 51,031 | | | $ | (27,524) | |
| Customer list | | 69,563 | | | (8,362) | | | 39,420 | | | (4,778) | |
| Other | | 14,589 | | | (5,237) | | | 10,113 | | | (3,710) | |
| | | | | | | | |
| | | | | | | | |
| Total | | $ | 129,408 | | | $ | (40,510) | | | $ | 100,564 | | | $ | (36,012) | |
Amortization expense recognized on intangible assets for 2021, 2020 and 2019 was $9.8 million, $11.1 million and $9.7 million, respectively. The estimated amortization expense of intangible assets for the next five years is as follows:
First Financial Bancorp 2021 Annual Report 81
Notes to Consolidated Financial Statements
| | | | | | | | |
| (Dollars in thousands) | | Intangible amortization |
| 2022 | | $ | 11,515 | |
| 2023 | | 10,536 | |
| 2024 | | 9,193 | |
| 2025 | | 9,145 | |
| 2026 | | 9,092 | |
10. Deposits
Time deposits that meet or exceed the FDIC insurance limit of $250,000 at December 31, 2021 and 2020 were $195.6 million and $220.5 million, respectively.
Scheduled maturities of all time deposits for the next five years were as follows:
| | | | | | | | |
| (Dollars in thousands) | | Time deposits |
| 2022 | | $ | 1,131,574 | |
| 2023 | | 83,589 | |
| 2024 | | 50,983 | |
| 2025 | | 32,569 | |
| 2026 | | 31,352 | |
| Thereafter | | 196 | |
| Total | | $ | 1,330,263 | |
11. Borrowings
Short-term borrowings on the Consolidated Balance Sheets include repurchase agreements utilized for corporate sweep accounts with cash management account agreements in place, federal funds purchased, overnight advances from the FHLB and a short-term line of credit. All repurchase agreements are subject to terms and conditions agreed to by the Bank and the client. To secure its liability to the client, the Bank is authorized to sell or repurchase U.S. Treasury, government agency and mortgage-backed securities.
The following is a summary of short-term borrowings for the last three years:
| | | | | | | | | | | | | | | | | | | | | | | | | | | | | | | | | | | | | | |
| | 2021 | | 2020 | | 2019 |
| (Dollars in thousands) | | Amount | | Rate | | Amount | | Rate | | Amount | | Rate |
| At December 31, | | | | | | | | | | | | |
| Federal funds purchased and securities sold under agreements to repurchase | | $ | 51,203 | | | 0.01 | % | | $ | 166,594 | | | 0.05 | % | | $ | 165,181 | | | 0.85 | % |
| FHLB borrowings | | 225,000 | | | 0.18 | % | | 0 | | | 0.00 | % | | 1,151,000 | | | 1.73 | % |
| Other short-term borrowings | | 20,000 | | | 1.90 | % | | 0 | | | 0.00 | % | | 0 | | | 0.00 | % |
| Total | | $ | 296,203 | | | 0.27 | % | | $ | 166,594 | | | 0.05 | % | | $ | 1,316,181 | | | 1.62 | % |
| | | | | | | | | | | | |
| Average for the year | | | | | | | | | | | | |
| Federal funds purchased and securities sold under agreements to repurchase | | $ | 160,967 | | | 0.07 | % | | $ | 149,036 | | | 0.26 | % | | $ | 155,859 | | | 1.15 | % |
| FHLB borrowings | | 43,371 | | | 0.20 | % | | 441,867 | | | 1.37 | % | | 990,860 | | | 2.37 | % |
| Other short-term borrowings | | 165 | | | 1.92 | % | | 0 | | | 0.00 | % | | 0 | | | 0.00 | % |
| Total | | $ | 204,503 | | | 0.10 | % | | $ | 590,903 | | | 1.09 | % | | $ | 1,146,719 | | | 1.90 | % |
| | | | | | | | | | | | |
| | | | | | | | | | | | |
| | | | | | | | | | | | |
| | | | | | | | | | | | |
| | | | | | | | | | | | |
82 First Financial Bancorp 2021 Annual Report
Securities sold under agreements to repurchase are secured by securities with a carrying amount of $51.3 million and $126.7 million, as of December 31, 2021 and 2020, respectively.
The following shows the remaining contractual maturity of repurchase agreements by collateral pledged:
| | | | | | | | |
| (Dollars in thousands) | | Overnight and Continuous |
| Repurchase agreements | | |
| Mortgage-backed securities | | $ | 48,370 | |
| Collateralized mortgage obligations | | 2,833 | |
| Total | | $ | 51,203 | |
First Financial had outstanding FHLB advances included in short-term borrowings of $225.0 million as of December 31, 2021 and no outstanding short-term FHLB advances as of December 31, 2020.
First Financial also has a $40.0 million short-term credit facility with an unaffiliated bank that matures in December, 2022, which is included in short-term borrowings. This facility has a variable interest rate and provides First Financial additional liquidity, if needed, for various corporate activities including the repurchase of First Financial common stock and the payment of dividends to shareholders. As of December 31, 2021, First Financial had an outstanding balance of $20.0 million. The credit agreement requires First Financial to comply with certain covenants including those related to asset quality and capital levels, and First Financial was in compliance with all covenants associated with this facility as of December 31, 2021. This credit facility also required First Financial to pledge as collateral the Bank's common stock where the lender is granted a security interest in this collateral.
The following is a summary of First Financial's long-term debt:
| | | | | | | | | | | | | | | | | | | | | | | | | | |
| | 2021 | | 2020 |
(Dollars in thousands) | | Amount | | Average Rate | | Amount | | Average Rate |
| FRB borrowings | | $ | 0 | | | 0.00 | % | | $ | 434,982 | | | 0.35 | % |
| FHLB borrowings | | 0 | | | 0.00 | % | | 19,971 | | | 1.43 | % |
| Subordinated debt | | 313,248 | | | 4.86 | % | | 321,384 | | | 4.86 | % |
| Unamortized debt issuance costs | | (2,384) | | | n/a | | (2,770) | | | n/a |
| Capital lease liability | | 1,781 | | | 3.81 | % | | 1,860 | | | 3.81 | % |
| Capital loan with municipality | | 775 | | | 0.00 | % | | 775 | | | 0.00 | % |
| Subtotal | | 313,420 | | | 4.88 | % | | 776,202 | | | 2.25 | % |
| | | | | | | | |
| Acquired in Summit acquisition | | | | | | | | |
| Bank lines of credit | | 23,030 | | | 2.77 | % | | 0 | | | 0.00 | % |
| Notes issued in conjunction with acquisition of property and equipment | | 73,382 | | | 4.09 | % | | 0 | | | 0.00 | % |
| Total notes payable acquired in Summit acquisition | | 96,412 | | | 3.77 | % | | 0 | | | 0.00 | % |
| Total long-term debt | | $ | 409,832 | | | 4.62 | % | | $ | 776,202 | | | 2.25 | % |
First Financial Bancorp 2021 Annual Report 83
Notes to Consolidated Financial Statements
As of December 31, 2021, First Financial's long-term debt matures as follows:
| | | | | | | | | | |
(Dollars in thousands) | | Long-term debt | | |
| 2022 | | $ | 28,091 | | | |
| 2023 | | 15,086 | | | |
| 2024 | | 23,091 | | | |
| 2025 | | 12,301 | | | |
| 2026 | | 16,765 | | | |
| Thereafter | | 314,498 | | | |
| Total | | $ | 409,832 | | | |
First Financial participated in the PPPLF, which is a program created by the FRB to extend credit to eligible financial institutions that originate PPP loans. As of December 31, 2021, the bank had no outstanding PPPLF advances. As of December 31, 2020, the bank had oustanding PPPLF advances of $435.0 million with an average interest rate of 35 basis points. These borrowings were secured by pledged PPP loans and prepay in conjunction with reductions in the principal balances of those loans.
In April 2020, First Financial issued $150.0 million of fixed to floating rate subordinated notes. The subordinated notes have an initial fixed interest rate of 5.25% to, but excluding, May 15, 2025, payable semi-annually in arrears. From, and including, May 15, 2025, the interest rate on the subordinated notes will reset quarterly to a floating rate per annum equal to a benchmark rate, which is expected to be the then-current three-month term SOFR, plus 509 basis points, payable quarterly in arrears. The subordinated notes mature on May 15, 2030. These notes are redeemable by the Company in whole or in part beginning with the interest payment date of May 15, 2025.
In 2015, First Financial issued $120.0 million of subordinated notes, which have a fixed interest rate of 5.13% payable semiannually and mature in August 2025. These notes are not redeemable by the Company or callable by the holders of the notes prior to maturity. In addition, First Financial acquired $49.5 million of variable rate subordinated notes in the MSFG merger that were issued to previously formed trusts in exchange for the trust proceeds. Interest on the acquired subordinated notes is payable quarterly, in arrears, and the Company has the option to defer interest payments for a period not to exceed 20 consecutive quarters. These acquired subordinated notes mature 30 years after the date of original issuance and may be called at par following the 5 year anniversary of issuance. First Financial also acquired $8.4 million of 6.00% fixed rate private placement subordinated debt in conjunction with the MSFG merger that was issued in 2015 and matured in 2025. These notes were redeemable by the Company at par following the 5 year anniversary of issuance. These subordinated notes were redeemed by the Company in the first quarter of 2021. The subordinated notes are treated as Tier 2 capital for regulatory capital purposes and are included in Long-term debt on the Consolidated Balance Sheets.
Additionally, in conjunction with the acquisition of Summit, First Financial assumed $96.4 million in outstanding long-term borrowings at December 31, 2021. These outstanding long-term borrowings consisted of $23.0 million of lines of credit with other banks utilized to operate the business and carried an average interest rate of 2.77%. Additionally, acquired long term borrowings included $73.4 million of term notes, both with and without recourse, with an average interest rate of 4.09%. These term notes were used to finance Summit's equity investment in the purchase of equipment to be leased to customers.
FHLB advances, both short-term and long-term, must be collateralized with qualifying assets, typically certain commercial and residential real estate loans, as well as certain government and agency securities. For ease of borrowing execution, First Financial utilizes a blanket collateral agreement with the FHLB, and at December 31, 2021, had collateral pledged with a book value of $5.8 billion.
84 First Financial Bancorp 2021 Annual Report
12. Derivatives
First Financial uses certain derivative instruments, including rate caps, floors, swaps and foreign exchange contracts, to meet the operating needs of its clients while managing the interest and currency rate risk associated with certain transactions. First Financial may also utilize interest rate swaps to manage the interest rate risk profile of the Company. Interest rate payments are exchanged with counterparties, based on the notional amount as established in the interest rate agreement. As only interest rate payments are exchanged, the cash requirements and credit risk associated with interest rate swaps are significantly less than the notional amount and the Company’s credit risk exposure is limited to the market value of the instruments. First Financial does not use derivatives for speculative purposes.
First Financial manages this market value credit risk through counterparty credit policies including a review of total derivative notional position to total assets, total credit exposure to total capital and counterparty credit exposure risk.
For discussion of First Financial's accounting for derivative instruments, see Note 1 – Summary of Significant Accounting Policies.
Client derivatives. First Financial utilizes interest rate swaps as a means to offer commercial borrowers fixed rate funding while providing the Company with floating rate assets.
At December 31, 2021, for interest rate derivatives, the Company had a total counterparty notional amount outstanding of $2.4 billion, spread among six counterparties, with an estimated fair value of $74.2 million. At December 31, 2020, the Company had interest rate derivatives with a total counterparty notional amount outstanding of $2.3 billion, spread among twenty counterparties, with an estimated fair value of $182.3 million.
First Financial monitors its derivative credit exposure to borrowers by monitoring the creditworthiness of the related loan
customers through the Company's normal credit review processes. Additionally, the Company's ACL Committee monitors
derivative credit risk exposure associated with problem loans through the Company's ACL committee. First Financial considers the market value of a derivative instrument to be part of the carrying value of the related loan for these purposes as the borrower is contractually obligated to pay First Financial this amount in the event the derivative contract is terminated.
In connection with its use of derivative instruments, First Financial and its counterparties may be required to post cash collateral to offset the market position of the derivative instruments. First Financial maintains the right to offset these derivative positions with the collateral posted against them by or with the relevant counterparties.
Foreign Exchange Contracts. First Financial may enter into foreign exchange derivative contracts for the benefit of commercial customers to hedge their exposure to foreign currency fluctuations. Similar to the hedging of interest rate risk from interest rate derivative contracts, First Financial also enters into foreign exchange contracts with major financial institutions to economically hedge a substantial portion of the exposure from client driven foreign exchange activity. These derivatives are classified as free-standing instruments with the revaluation gain or loss recorded in Foreign exchange income in the Consolidated Statements of Income. The Company has risk limits and internal controls in place to help ensure excessive risk is not being taken in providing this service to customers. At December 31, 2021, the Company had total counterparty notional amount outstanding of $6.4 billion spread among four counterparties, with an estimated fair value of $15.2 million at December 31, 2021 related to foreign exchange contracts, which is included in Accrued interest and other liabilities in the Consolidated Balance Sheets. At December 31, 2020, the Company had total counterparty notional amounts outstanding of $3.6 billion spread among six counterparties, with an estimated fair value of $33.1 million.
In connection with its use of foreign exchange contracts, First Financial and its counterparties may be required to post cash collateral to offset the market position of the derivative instruments. First Financial maintains the right to offset these derivative positions with the collateral posted against them by or with the relevant counterparties.
First Financial Bancorp 2021 Annual Report 85
Notes to Consolidated Financial Statements
The following table details the location and amounts of client derivatives and foreign exchange contracts recognized in the Consolidated Balance Sheets:
| | | | | | | | | | | | | | | | | | | | | | | | | | | | | | | | | | | | | | | | | | | | |
| | | | | December 31, 2021 | | December 31, 2020 |
| | | | | | | Estimated fair value | | | | Estimated fair value |
| (Dollars in thousands) | | Balance
Sheet Classification | | Notional
amount | | Gain | | Loss | | Notional
amount | | Gain | | Loss |
| Client derivatives-instruments associated with loans | | | | | | | | | | | | |
| Matched interest rate swaps with borrower | | Accrued interest and other assets and other liabilities | | $ | 2,430,587 | | | $ | 84,694 | | | $ | (7,508) | | | $ | 2,300,336 | | | $ | 184,777 | | | $ | (107) | |
| Matched interest rate swaps with counterparty | | Accrued interest and other liabilities | | 2,430,587 | | | 7,508 | | | (84,701) | | | 2,300,336 | | | 107 | | | (184,884) | |
| Foreign exchange contracts | | | | | | | | | | | | | | |
| Matched foreign exchange contracts with customers | | Accrued interest and other assets | | 6,423,085 | | | 67,988 | | | (52,780) | | | 3,637,509 | | | 60,366 | | | (27,249) | |
| Match foreign exchange contracts with counterparty | | Accrued interest and other liabilities | | 6,399,432 | | | 52,780 | | | (67,988) | | | 3,637,509 | | | 27,249 | | | (60,366) | |
| Total | | | | $ | 17,683,691 | | | $ | 212,970 | | | $ | (212,977) | | | $ | 11,875,690 | | | $ | 272,499 | | | $ | (272,606) | |
The following table discloses the gross and net amounts of client derivatives and foreign exchange contracts recognized in the Consolidated Balance Sheets:
| | | | | | | | | | | | | | | | | | | | | | | | | | | | | | | | | | | | | | |
| | December 31, 2021 | | December 31, 2020 |
| (Dollars in thousands) | | Gross amounts of recognized liabilities | | Gross amounts offset in the Consolidated Balance Sheets | | Net amounts of (assets)/liabilities presented in the Consolidated Balance Sheets | | Gross amounts of recognized liabilities | | Gross amounts offset in the Consolidated Balance Sheets | | Net amounts of (assets)/liabilities presented in the Consolidated Balance Sheets |
| Client derivatives | | | | | | | | | | | | |
| | | | | | | | | | | | |
| Matched interest rate swaps | | $ | 92,209 | | | $ | (149,647) | | | $ | (57,438) | | | $ | 184,991 | | | $ | (385,088) | | | $ | (200,097) | |
Foreign exchange contracts with counterparty | | 120,768 | | | (56,443) | | | 64,325 | | | 87,615 | | | (17,392) | | | 70,223 | |
| Total | | $ | 212,977 | | | $ | (206,090) | | | $ | 6,887 | | | $ | 272,606 | | | $ | (402,480) | | | $ | (129,874) | |
The following table details the derivative financial instruments, the average remaining maturities and the weighted-average interest rates being paid and received by First Financial at December 31, 2021:
| | | | | | | | | | | | | | | | | | | | | | | | |
| (Dollars in thousands) | | Notional
amount | | Average
maturity
(years) | | Fair
value | | | | |
| Client derivatives-interest rate contracts | | | | | | | | | | |
| Receive fixed, matched interest rate swaps with borrower | | $ | 2,430,587 | | | 5.7 | | $ | 77,186 | | | | | |
| Pay fixed, matched interest rate swaps with counterparty | | 2,430,587 | | | 5.7 | | (77,193) | | | | | |
| Client derivatives-foreign exchange contracts | | | | | | | | | | |
| Foreign exchange contracts - pay USD | | 6,423,085 | | | 0.6 | | 15,208 | | | | | |
| Foreign exchange contracts - receive USD | | 6,399,432 | | | 0.6 | | (15,208) | | | | | |
| Total client derivatives | | $ | 17,683,691 | | | 2.0 | | $ | (7) | | | | | |
Credit derivatives. In conjunction with participating interests in commercial loans, First Financial periodically enters into risk participation agreements with counterparties whereby First Financial assumes a portion of the credit exposure associated with an interest rate swap on the participated loan in exchange for a fee. Under these agreements, First Financial will make payments to the counterparty if the loan customer defaults on its obligation to perform under the interest rate swap contract with the counterparty. The total notional value of these agreements totaled $362.8 million as of December 31, 2021 and $242.4 million as of December 31, 2020. The fair value of these agreements were recorded in Accrued interest and other liabilities on the Consolidated Balance Sheets was $0.1 million at December 31, 2021 and $0.3 million at December 31, 2020.
86 First Financial Bancorp 2021 Annual Report
Mortgage Derivatives. First Financial enters into IRLCs and forward commitments for the future delivery of mortgage loans to third party investors, which are considered derivatives. When borrowers secure an IRLC with First Financial and the loans are intended to be sold, First Financial will enter into forward commitments for the future delivery of the loans to third party investors in order to hedge against the effect of changes in interest rates impacting IRLCs and and loans held for sale. At December 31, 2021, the notional amount of the IRLCs was $45.0 million and the notional amount of forward commitments was $62.5 million. As of December 31, 2020, the notional amount of IRLCs was $114.2 million and the notional amount of forward commitments was $112.6 million. The fair value of these agreements was $3.3 million at December 31, 2021 and was $2.7 million at December 31, 2020 and was recorded in Accrued interest and other assets on the Consolidated Balance Sheets.
13. Commitments and Contingencies
First Financial offers a variety of financial instruments including letters of credit and outstanding commitments to extend credit to assist clients in meeting their requirement for liquidity and credit enhancement. GAAP does not require these financial instruments to be recorded in the Consolidated Financial Statements.
First Financial utilizes the same credit policies in issuing commitments and conditional obligations as it does for credit instruments recorded on the Consolidated Balance Sheets. First Financial’s exposure to credit loss in the event of nonperformance by the counterparty was represented by the contractual amounts of those instruments. Effective January 1, 2020, First Financial adopted ASC 326, at which time First Financial estimated credit losses over the contractual period in which the Company is exposed to credit risk via a contractual obligation to extend credit, unless that obligation is unconditionally cancellable by the Company. The estimate includes consideration of the likelihood that funding will occur and an estimate of expected credit losses on commitments expected to be funded over its estimated useful life consistent with the Company's ACL methodology for loans and leases. Adjustments to the reserve for unfunded commitments are recorded in Provision for credit losses - unfunded commitments in the Consolidated Statements of Income. First Financial had $13.4 million and $12.5 million of reserves for unfunded commitments recorded in Accrued interest and other liabilities on the Consolidated Balance Sheets as of December 31, 2021 and 2020.
Loan commitments. Loan commitments are agreements to extend credit to a client absent any violation of conditions established in the commitment agreement. Commitments generally have fixed expiration dates or other termination clauses and may require payment of a fee. Since many of the commitments are expected to expire without being drawn upon, the total commitment amounts do not necessarily represent future cash requirements. The amount of collateral obtained, if deemed necessary by First Financial upon extension of credit, is based on management’s credit evaluation of the client. The collateral held varies, but may include securities, real estate, inventory, plant or equipment. First Financial had commitments outstanding to extend credit, totaling $4.0 billion and $3.4 billion at December 31, 2021 and 2020, respectively. As of December 31, 2021, loan commitments with a fixed interest rate totaled $129.2 million while commitments with variable interest rates totaled $3.8 billion. At December 31, 2020, loan commitments with a fixed interest rate totaled $123.6 million while commitments with variable interest rates totaled $3.3 billion. The fixed rate loan commitments have interest rates ranging from 0.00% to 21.00% for both December 31, 2021 and 2020 and have maturities ranging from less than 1 year to 30.9 years for December 31, 2021 and less than 1 year to 30.8 years for December 31, 2020.
First Financial Bancorp 2021 Annual Report 87
Notes to Consolidated Financial Statements
The following table presents by type First Financial's loan balances and contractual obligations to extend credit:
| | | | | | | | | | | | | | | | | | | | | | | | | | |
| | December 31, 2021 | | December 31, 2020 |
| (dollars in thousands) | | Unfunded commitment | | Loan balance | | Unfunded commitment | | Loan balance |
| Commercial & industrial | | $ | 1,545,995 | | | $ | 2,720,028 | | | $ | 1,270,765 | | | $ | 3,007,509 | |
| Lease financing | | 18,037 | | 109,624 | | 0 | | 72,987 |
| Construction real estate | | 484,038 | | 455,894 | | 374,008 | | 636,096 |
| Commercial real estate-investor | | 65,660 | | 3,154,755 | | 139,754 | | 3,244,540 |
| Commercial real estate-owner | | 29,824 | | 1,071,859 | | 51,637 | | 1,063,318 |
| Residential real estate | | 50,043 | | 896,069 | | 28,895 | | 1,003,086 |
| Home equity | | 822,343 | | 708,399 | | 762,406 | | 743,099 |
| Installment | | 15,985 | | 119,454 | | 18,229 | | 81,850 |
| Credit card | | 217,006 | | 52,217 | | 207,365 | | 48,485 |
| Total | | $ | 3,248,931 | | | $ | 9,288,299 | | | $ | 2,853,059 | | | $ | 9,900,970 | |
Letters of credit. Letters of credit are conditional commitments issued by First Financial to guarantee the performance of a client to a third party. First Financial’s letters of credit consist of performance assurances made on behalf of clients who have a contractual commitment to produce or deliver goods or services. The risk to First Financial arises from its obligation to make payment in the event of the client's contractual default to produce the contracted good or service to a third party. First Financial has issued letters of credit aggregating $41.1 million and $36.1 million at December 31, 2021, and 2020, respectively. Management conducts regular reviews of these instruments on an individual client basis.
Risk participation agreements. First Financial is a party in risk participation transactions of interest rate swaps, which had total notional amount of $362.8 million and $242.4 million at December 31, 2021 and 2020, respectively.
Affordable housing projects and other tax credit investments. First Financial is a limited partner in several tax-advantaged limited partnerships whose purpose is to invest in approved qualified affordable housing, renewable energy, or other renovation or community revitalization projects. These investments are included in Accrued interest and other assets in the Consolidated Balance Sheets, with any unfunded commitments included in Accrued interest and other liabilities in the Consolidated Balance Sheets. As of December 31, 2021, First Financial expects to recover its remaining investments through the use of the tax credits that are generated by the investments.
The following table summarizes First Financial's investments in affordable housing projects and other tax credit investments.
| | | | | | | | | | | | | | | | | | | | | | | | | | | | | | | | |
| (Dollars in thousands) | | December 31, 2021 | | December 31, 2020 |
| Investment | | Accounting Method | | Investment | | Unfunded commitment | | Investment | | Unfunded commitment |
| LIHTC | | Proportional amortization | | $ | 108,974 | | | $ | 57,341 | | | $ | 90,401 | | | $ | 47,531 | |
| HTC | | Equity | | 2,581 | | | 56 | | | 3,607 | | | 364 | |
| NMTC | | Equity | | 3,895 | | | 0 | | | 1,165 | | | 0 | |
| Renewable energy | | Equity | | 18,585 | | | 15,114 | | | 5,244 | | | 7,661 | |
| Total | | | | $ | 134,035 | | | $ | 72,511 | | | $ | 100,417 | | | $ | 55,556 | |
The following tables summarize First Financial's amortization expense and tax benefit recognized in affordable housing projects and other tax credit investments.
88 First Financial Bancorp 2021 Annual Report
| | | | | | | | | | | | | | | | | | | | | | | | | | | | | | | | | | | | | | |
| | Twelve months ended |
| | December 31, 2021 | | December 31, 2020 | | December 31, 2019 |
| (Dollars in thousands) | | Amortization expense (1) | | Tax expense (benefit) recognized (2) | | Amortization expense (1) | | Tax expense (benefit) recognized (2) | | Amortization expense (1) | | Tax expense (benefit) recognized (2) |
| LIHTC | | $ | 8,894 | | | $ | (8,581) | | | $ | 8,076 | | | $ | (7,629) | | | $ | 6,931 | | | $ | (6,397) | |
| HTC | | 1,116 | | | (263) | | | 474 | | | (563) | | | 2,862 | | | (3,342) | |
| NMTC | | 210 | | | (210) | | | 175 | | | (175) | | | 350 | | | (350) | |
| Renewable energy | | 11,467 | | | (12,216) | | | 4,756 | | | (4,777) | | | 0 | | | 0 | |
| Total | | $ | 21,687 | | | $ | (21,270) | | | $ | 13,481 | | | $ | (13,144) | | | $ | 10,143 | | | $ | (10,089) | |
| | | | | | | | | | | | |
| (1) The amortization expense for the LIHTC investments is included in income tax expense. The amortization expense for the HTC, NMTC, and Renewable energy tax credits is included in other noninterest expense. |
| (2) All of the tax benefits recognized are included in Income tax expense. The tax benefit recognized for the HTC, NMTC, and Renewable energy investments primarily reflects the tax credits generated from the investments and excludes the net tax expense (benefit) and deferred tax liability of the investments’ income (loss). |
Contingencies/Litigation. First Financial and its subsidiaries are engaged in various matters of litigation from time to time, and have a number of unresolved claims pending.
Like many banks, First Financial has been the subject of lawsuits relating to overdraft fees. This type of litigation is time consuming and expensive in large part due to the amount of data to be sorted and disclosed, in some cases going back multiple years. During the second and fourth quarters of 2021, First Financial determined that it was in its best interest to settle lawsuits in the states of Indiana and Ohio and have signed settlement agreements that are being presented to the court for approval. As such, First Financial recorded legal settlement expenses of $7.1 million, which were recorded in Other noninterest expenses in the Consolidated statement of income.
Additionally, as part of the ordinary course of business, First Financial and its subsidiaries are parties to other litigation, including claims to the ownership of funds in particular accounts, the collection of delinquent accounts, challenges to security interests in collateral, foreclosure interests that are incidental to our regular business activities and other matters. While the ultimate liability with respect to these litigation matters and claims cannot be determined at this time, First Financial believes that damages, if any, and other amounts relating to pending matters are not probable or cannot be reasonably estimated as of December 31, 2021. Reserves are established for these various matters of litigation, when appropriate, under FASB ASC Topic 450, Contingencies, based in part upon the advice of legal counsel. First Financial had no reserves related to litigation matters as of December 31, 2021 or December 31, 2020.
14. Related Party Transactions
Outstanding balance of loans to directors, executive officers, principal holders of First Financial’s common stock and certain related persons were as follows:
| | | | | | | | |
| (Dollars in thousands) | | 2021 |
| Beginning balance | | $ | 5,097 | |
| Additions | | 1,463 | |
| Deductions | | (3,078) | |
| Ending balance | | $ | 3,482 | |
| Loans 90 days or more past due | | $ | 0 | |
Related parties of First Financial, as defined for inclusion in the table above, were clients of, and had transactions with, subsidiaries of First Financial during the periods noted. Similar transactions with related parties may be expected in future periods.
First Financial Bancorp 2021 Annual Report 89
Notes to Consolidated Financial Statements
15. Income Taxes
Income tax expense consisted of the following components:
| | | | | | | | | | | | | | | | | | | | |
| (Dollars in thousands) | | 2021 | | 2020 | | 2019 |
| Current expense | | | | | | |
| Federal | | $ | 21,397 | | | $ | 34,632 | | | $ | 31,343 | |
| State | | 2,289 | | | 2,349 | | | 854 | |
| Total current expense | | 23,686 | | | 36,981 | | | 32,197 | |
| Deferred expense (benefit) | | | | | | |
| Federal | | 10,944 | | | (8,624) | | | 10,946 | |
| State | | 1,143 | | | 244 | | | 1,644 | |
| Total deferred expense (benefit) | | 12,087 | | | (8,380) | | | 12,590 | |
| Income tax expense | | $ | 35,773 | | | $ | 28,601 | | | $ | 44,787 | |
The difference between the federal income tax rates applied to income before income taxes and the effective rates were due to the following:
| | | | | | | | | | | | | | | | | | | | |
| (Dollars in thousands) | | 2021 | | 2020 | | 2019 |
| Income taxes computed at federal statutory rate (21%) on income before income taxes | | $ | 50,596 | | | $ | 38,726 | | | $ | 51,001 | |
| Benefit from tax-exempt income | | (5,613) | | | (5,901) | | | (5,964) | |
| Tax credits | | (21,561) | | | (13,064) | | | (10,075) | |
| | | | | | |
| Basis reduction on tax credit | | 1,346 | | | 657 | | | 738 | |
| Tax expense (benefit) of equity compensation | | (243) | | | 340 | | | (140) | |
| State income taxes, net of federal tax benefit | | 2,711 | | | 2,049 | | | 1,973 | |
| Affordable housing investments | | 7,194 | | | 6,635 | | | 5,825 | |
| Other | | 1,343 | | | (841) | | | 1,429 | |
| Income tax expense | | $ | 35,773 | | | $ | 28,601 | | | $ | 44,787 | |
90 First Financial Bancorp 2021 Annual Report
The major components of the temporary differences that gave rise to deferred tax assets and liabilities at December 31, 2021, and 2020, were as follows:
| | | | | | | | | | | | | | |
| (Dollars in thousands) | | 2021 | | 2020 |
| Deferred tax assets | | | | |
| Allowance for credit losses | | $ | 29,754 | | | $ | 39,671 | |
| Fair value adjustments on business combinations | | 0 | | | 3,870 | |
| Deferred compensation | | 292 | | | 235 | |
| Postretirement benefits other than pension liability | | 652 | | | 684 | |
| Accrued stock-based compensation | | 1,836 | | | 1,654 | |
| OREO write-downs | | 0 | | | 8 | |
| Interest on nonaccrual loans | | 442 | | | 1,712 | |
| Accrued expenses | | 7,286 | | | 5,647 | |
| State net operating loss | | 1,746 | | | 1,959 | |
| Leasing liability | | 15,794 | | | 16,947 | |
| Reserve for unfunded commitments | | 3,049 | | | 2,854 | |
| Deferred loan fees and costs | | 0 | | | 1,691 | |
| Other | | 565 | | | 577 | |
| Total deferred tax assets | | 61,416 | | | 77,509 | |
| | | | |
| Deferred tax liabilities | | | | |
| Tax depreciation in excess of book depreciation | | (9,117) | | | (11,923) | |
| FHLB and FRB stock | | (3,836) | | | (4,043) | |
| Mortgage-servicing rights | | (3,518) | | | (2,925) | |
| Leasing activities | | (10,860) | | | (6,661) | |
| Retirement obligation | | (13,754) | | | (10,984) | |
| Intangible assets | | (16,081) | | | (13,942) | |
| Deferred loan fees and costs | | (933) | | | 0 | |
| Prepaid expenses | | (680) | | | (619) | |
| Limited partnership investments | | (2,957) | | | (2,471) | |
| Fair value adjustments on business combinations | | (6,900) | | | 0 | |
| Net unrealized gains on investment securities | | (5,791) | | | (20,253) | |
| Foreign exchange deferred income | | (428) | | | (2,080) | |
| ASU 2016-01 unrealized gain/loss-equity securities | | (2,339) | | | (2,179) | |
| Right of use assets | | (13,390) | | | (15,053) | |
| Other | | (2,426) | | | (2,035) | |
| Total deferred tax liabilities | | (93,010) | | | (95,168) | |
| Total net deferred tax liability | | $ | (31,594) | | | $ | (17,659) | |
At December 31, 2021 and 2020, the Company had a state net operating loss carryforward from MSFG of $2.3 million and $2.5 million. This carryforward begins to expire in 2025. The Company expects to fully utilize this net operating loss and, therefore, a valuation allowance was not required at December 31, 2021 and 2020. The acquired MSFG state net operating loss is subject to IRC Section 382 and is limited annually.
The realization of the Company’s deferred tax assets is dependent upon the Company’s ability to generate taxable income in future periods and the reversal of deferred tax liabilities during the same period. The Company has evaluated the available evidence supporting the realization of its deferred tax assets and determined it is more likely than not that the assets will be realized and thus no valuation allowance was recorded at December 31, 2021 and 2020.
The Bank’s retained earnings at December 31, 2021 and 2020 included base-year bad debt reserves of $16.1 million. Base-year reserves are subject to recapture in the event the Bank redeems its stock, makes distributions in excess of current and
First Financial Bancorp 2021 Annual Report 91
Notes to Consolidated Financial Statements
accumulated earnings and profits (as calculated for federal income tax purposes), loses its “bank” status or liquidates. The Bank has no intention of meeting any of the criteria for recapture. Accordingly, a deferred income tax liability of $3.4 million has not been recorded.
At both December 31, 2021 and 2020, First Financial had $1.9 million of unrecognized tax benefits, as determined in FASB ASC Topic 740-10, Income Taxes, that, if recognized, would favorably affect the effective income tax rate in future periods. A progression of gross unrecognized tax benefits as of December 31, 2021 and 2020 is as follows:
| | | | | | | | | | | | | | |
| (Dollars in thousands) | | 2021 | | 2020 |
| Balance at beginning of year | | $ | 2,386 | | | $ | 3,006 | |
| | | | |
| | | | |
| | | | |
| | | | |
| Settlements | | 0 | | | (620) | |
| Balance at end of year | | $ | 2,386 | | | $ | 2,386 | |
The unrecognized tax benefits relate to state income tax exposures where First Financial believes it is likely that, upon examination, a state may take a position contrary to the position taken by the Company. The Company believes that resolution regarding our uncertain tax positions is reasonably possible within the next twelve months and could result in full, partial or no recognition of the benefit. First Financial recognizes interest accrued related to unrecognized tax benefits and penalties as income tax expense. At December 31, 2021 and 2020, the Company had no interest or penalties recorded.
First Financial and its subsidiaries are subject to U.S. federal income tax as well as state and local income tax in several jurisdictions. Tax years prior to 2018 have been closed and are no longer subject to U.S. federal income tax examinations. Tax years 2018 through 2021 remain open to examination by the federal taxing authority. With limited exception, First Financial is no longer subject to state and local income tax examinations for years prior to 2017.
16. Employee Benefit Plans
Pension plan. First Financial sponsors a non-contributory defined benefit pension plan covering substantially all employees and uses a December 31 measurement date for the plan. Plan assets were primarily invested in fixed income and equity mutual funds. The pension plan does not directly own any shares of First Financial common stock or any other First Financial security or product.
The investment objective of the Plan is to structure the assets to mirror the liabilities of the Plan, with the fixed income component matching the identified near and long-term plan distributions and the equity component generating growth of capital to meet other future Plan liabilities. The determination of the overall expected long-term return on plan assets was based on the composition of plan assets and long-term asset class return estimates developed by the Plan advisor, as well as a consensus of estimates from similarly managed portfolios of expected future returns.
First Financial recorded expense related to its pension plan of $3.4 million for 2021, $2.5 million for 2020 and $1.0 million for 2019. The components of net periodic benefit cost other than the service cost component are included in Other noninterest expense while service costs are recorded as a component Salaries and employee benefits in the Consolidated Statements of Income.
First Financial made no cash contributions to the pension plan in 2021, 2020 or 2019 and does not expect to make any contributions in 2022.
92 First Financial Bancorp 2021 Annual Report
The following tables set forth information concerning amounts recognized in First Financial's Consolidated Balance Sheets and Consolidated Statements of Income related to the Company's pension plan:
| | | | | | | | | | | | | | |
| | December 31, |
| (Dollars in thousands) | | 2021 | | 2020 |
| Change in benefit obligation | | | | |
| Benefit obligation at beginning of year | | $ | 87,494 | | | $ | 75,044 | |
| Service cost | | 9,128 | | | 7,932 | |
| Interest cost | | 2,157 | | | 2,455 | |
| Actuarial (gain) loss | | 2,588 | | | 9,171 | |
| Benefits paid, excluding settlement | | (8,096) | | | (7,108) | |
| Benefit obligation at end of year | | 93,271 | | | 87,494 | |
| | | | |
| Change in plan assets | | | | |
| Fair value of plan assets at beginning of year | | 155,704 | | | 141,816 | |
| Actual return on plan assets | | 15,774 | | | 20,996 | |
| Benefits paid, excluding settlement | | (8,096) | | | (7,108) | |
| Fair value of plan assets at end of year | | 163,382 | | | 155,704 | |
| | | | |
| Amounts recognized in the Consolidated Balance Sheets | | | | |
| Assets | | 70,111 | | | 68,210 | |
| Liabilities | | 0 | | 0 |
| Net amount recognized | | $ | 70,111 | | | $ | 68,210 | |
| | | | |
| Amounts recognized in accumulated other comprehensive income (loss) | | | | |
| Net actuarial loss | | $ | 27,264 | | | $ | 32,943 | |
| Net prior service cost | | (270) | | | (682) | |
| Deferred tax assets | | (6,148) | | | (7,349) | |
| Net amount recognized | | $ | 20,846 | | | $ | 24,912 | |
| | | | |
| Change in accumulated other comprehensive income (loss) | | $ | (4,066) | | | $ | (3,029) | |
| | | | |
| Accumulated benefit obligation | | $ | 92,316 | | | $ | 86,327 | |
The change in the defined benefit obligations for the period was driven primarily by an update to the interest crediting rate to reflect the known rate used at year-end 2021, which increased the liability, partially offset by a 34 bp increase in the discount rate from the prior year.
First Financial Bancorp 2021 Annual Report 93
Notes to Consolidated Financial Statements
The components of net periodic benefit cost are shown in the table that follows:
| | | | | | | | | | | | | | | | | | | | |
| | December 31, |
| (Dollars in thousands) | | 2021 | | 2020 | | 2019 |
| Service cost | | $ | 9,128 | | | $ | 7,932 | | | $ | 6,591 | |
| Interest cost | | 2,157 | | | 2,455 | | | 2,778 | |
| Expected return on assets | | (10,118) | | | (9,824) | | | (9,718) | |
| Amortization of prior service cost | | (413) | | | (413) | | | (413) | |
| Recognized net actuarial loss | | 2,611 | | | 2,334 | | | 1,803 | |
| Net periodic benefit (income) cost | | 3,365 | | | 2,484 | | | 1,041 | |
| | | | | | |
| Other changes recognized in accumulated other comprehensive income (loss) | | | | |
| Net actuarial (gain) loss | | (3,068) | | | (2,001) | | | (4,630) | |
| Prior service cost | | 0 | | | 0 | | | 0 | |
| Amortization of prior service cost | | 413 | | | 413 | | | 413 | |
| Amortization of gain | | (2,611) | | | (2,334) | | | (1,803) | |
| Total recognized in accumulated other comprehensive income (loss) | | (5,266) | | | (3,922) | | | (6,020) | |
| Total recognized in net periodic benefit cost and accumulated other comprehensive income (loss) | | $ | (1,901) | | | $ | (1,438) | | | $ | (4,979) | |
| | | | | | |
| | | | |
| | | | | | |
| | | | | | |
The pension plan assumptions are shown in the table that follows:
| | | | | | | | | | | | | | | | | | | | |
| | December 31, |
| | 2021 | | 2020 | | 2019 |
| Benefit obligations | | | | | | |
| Discount rate | | 2.89 | % | | 2.55 | % | | 3.33 | % |
| Rate of compensation increase | | 3.50 | % | | 3.50 | % | | 3.50 | % |
| Weighted average interest crediting rate | | 2.58 | % | | 2.14 | % | | 2.82 | % |
| | | | | | |
| Net periodic benefit cost | | | | | | |
| Discount rate | | 2.55 | % | | 3.33 | % | | 4.31 | % |
| Expected return on plan assets | | 7.25 | % | | 7.25 | % | | 7.25 | % |
| Rate of compensation increase | | 3.50 | % | | 3.50 | % | | 3.50 | % |
| Weighted average interest crediting rate | | 2.14 | % | | 2.82 | % | | 3.61 | % |
The fair value of the plan assets as of December 31, 2021 by asset category is shown in the table that follows:
| | | | | | | | | | | | | | | | | | | | | | | | | | | | | | | | |
| | Fair Value Measurements | | |
| (Dollars in thousands) | | Total | | Quoted Prices in
Active Markets
for
Identical Assets
(Level 1) | | Significant
Observable
Inputs
(Level 2) | | Significant
Unobservable
Inputs
(Level 3) | | |
| Asset Category | | | | | | | | | | |
| Cash | | $ | 122 | | | $ | 122 | | | $ | 0 | | | $ | 0 | | | |
| U. S. Government agencies | | 3,535 | | | 0 | | | 3,535 | | | 0 | | | |
| Fixed income mutual funds | | 63,526 | | | 63,526 | | | 0 | | | 0 | | | |
| Equity mutual funds | | 83,000 | | | 83,000 | | | 0 | | | 0 | | | |
| Other assets | | 13,199 | | | 0 | | | 13,199 | | | 0 | | | |
| Total | | $ | 163,382 | | | $ | 146,648 | | | $ | 16,734 | | | $ | 0 | | | |
94 First Financial Bancorp 2021 Annual Report
The fair value of the plan assets as of December 31, 2020 by asset category is shown in the table that follows:
| | | | | | | | | | | | | | | | | | | | | | | | | | |
| | Fair Value Measurements |
| (Dollars in thousands) | | Total | | Quoted Prices in
Active Markets
for
Identical Assets
(Level 1) | | Significant
Observable
Inputs
(Level 2) | | Significant
Unobservable
Inputs
(Level 3) |
| Asset Category | | | | | | | | |
| Cash | | $ | 129 | | | $ | 129 | | | $ | 0 | | | $ | 0 | |
| U. S. Government agencies | | 4,193 | | | 0 | | | 4,193 | | | 0 | |
| Fixed income mutual funds | | 65,443 | | | 65,443 | | | 0 | | | 0 | |
| Equity mutual funds | | 85,939 | | | 85,939 | | | 0 | | | 0 | |
| Total | | $ | 155,704 | | | $ | 151,511 | | | $ | 4,193 | | | $ | 0 | |
The level within the fair value hierarchy is based on the lowest level of input that is significant in the fair value measurement. See Note 22 – Fair Value Disclosures for further information related to the framework for measuring fair value and the fair value hierarchy.
The following benefit payments, which reflect expected future service, are expected to be paid:
| | | | | | | | |
| (Dollars in thousands) | | Expected benefit payments |
| 2022 | | $ | 5,753 | |
| 2023 | | 5,848 | |
| 2024 | | 6,664 | |
| 2025 | | 6,931 | |
| 2026 | | 7,099 | |
| Thereafter | | 41,728 | |
401(k) plan. First Financial sponsors a defined contribution 401(k) plan which covers substantially all employees. Employees may contribute up to 50.0% of their earnings into the plan, not to exceed applicable limitations prescribed by the Internal Revenue Service. First Financial's contributions to the 401(k) plan are discretionary. The Company made no contributions to the 401(k) plan during the years ended December 31, 2021, 2020 or 2019.
17. Revenue Recognition
The majority of the Company's revenues come from sources that are outside of the scope of ASU 2014-09, Revenue from Contracts with Customers. Income sources that are outside of this standard include income earned on loans, leases, securities, derivatives and foreign exchange. The Company's services that fall within the scope of ASU 2019-09 are presented within Noninterest income and are recognized as revenue when the Company satisfies its obligation to the customer. Services within the scope of this guidance include service charges on deposits, trust and wealth management fees, bankcard income, gain/loss on the sale of OREO and investment brokerage fees.
Service charges on deposit accounts. The Company earns revenues from its deposit customers for transaction-based fees, account maintenance fees and overdraft fees. Transaction-based fees, which include services such as ATM use fees, stop payment charges, statement rendering and ACH fees, are recognized at the time the transaction is executed as that is the point in time the Company fulfills the customer's request. Account maintenance fees, which relate primarily to monthly maintenance, are earned over the course of a month, representing the period over which the Company satisfies the performance obligation. Similarly, overdraft fees are recognized at the point in time that the overdraft occurs as this corresponds with the Company's performance obligation. Service charges on deposit accounts are withdrawn from the customer's deposit account.
Trust and wealth management fees. Trust and wealth management fees are primarily asset-based, but can also include flat fees based upon a specific service rendered, such as tax preparation services. The Company’s performance obligation is
First Financial Bancorp 2021 Annual Report 95
generally satisfied over time and the resulting fees are recognized monthly, based upon the month-end market value of the assets under management and the applicable fees. The Company does not earn performance-based incentives. Optional services such as real estate sales and tax return preparation services are also available to existing trust and wealth management customers. The Company’s performance obligation for these transactional-based services is generally satisfied, and related revenue recognized, as incurred.
Trust and wealth management fees also includes brokerage revenue. Brokerage revenue represents fees from investment brokerage services provided to customers by a third party provider. The Company receives commissions from the third-party service provider on a monthly basis based upon customer activity for the month. The fees are recognized monthly and a receivable is recorded until commissions are paid the following month. Because the Company (i) acts as an agent in arranging the relationship between the customer and the third-party service provider and (ii) does not control the services rendered to the customers, investment brokerage fees are presented net of related costs.
Bankcard income. The Company earns interchange fees from cardholder transactions conducted through the Visa payment network. Interchange fees from cardholder transactions represent a percentage of the underlying transaction value and are recognized concurrent with the transaction processing services provided to the cardholder. Interchange income is presented on the Consolidated Statements of Income net of expenses. Gross interchange income for 2021 was $27.9 million, and was partially offset by $13.6 million of expenses within Noninterest income. Gross interchange income for 2020 was $23.9 million, and was partially offset by $12.2 million of expenses within Noninterest income, while gross interchange income for 2019 was $30.4 million, and was partially offset by $11.9 million of expenses within Noninterest income.
Other. Other noninterest income includes other recurring revenue streams such as transaction fees, safe deposit rental income, insurance commissions, merchant referral income and gain (loss) on sale of OREO. Transaction fees primarily include check printing sales commissions, collection fees and wire transfer fees which arise from in-branch transactions. Safe deposit rental income arises from fees charged to the customer on an annual basis and recognized upon receipt of payment. Insurance commissions are agent commissions earned by the Company and earned upon the effective date of the bound coverage. Merchant referral income is associated with a program whereby the Company receives a share of processing revenue that is generated from clients that were referred by First Financial to the service provider. Revenue is recognized at the point in time when the transaction occurs.
The Company records a gain or loss from the sale of OREO when control of the property transfers to the buyer, which generally occurs at the time of the executed deed. When the Company finances the sale of OREO to the buyer, the Company assesses whether the buyer is committed to perform their obligations under the contract and whether collectibility of the transaction price is probable. Once these criteria are met, the OREO asset is removed and the gain or loss on sale is recorded upon the transfer of control of the property to the buyer.
96 First Financial Bancorp 2021 Annual Report
18. Accumulated Other Comprehensive Income (Loss)
Shareholders’ equity is affected by transactions and valuations of asset and liability positions that require adjustments to accumulated other comprehensive income (loss). The related tax effects allocated to other comprehensive income and accumulated other comprehensive income (loss) are as follows:
| | | | | | | | | | | | | | | | | | | | | | | | | | | | | | | | | | | | | | | | | | | | | | | | | | | | |
| | | December 31, 2021 |
| | | Total other comprehensive income (loss) | | Total accumulated
other comprehensive income (loss) |
| (Dollars in thousands) | | Prior to
reclass | | Reclass
from | | Pre-tax | | Tax effect | | Net of tax | | Beginning balance | | Net activity | | | | Ending balance |
| Unrealized gain (loss) on debt securities | | $ | (67,759) | | | $ | (759) | | | $ | (67,000) | | | $ | 14,462 | | | $ | (52,538) | | | $ | 73,576 | | | $ | (52,538) | | | | | $ | 21,038 | |
| | | | | | | | | | | | | | | | | | |
| Retirement obligation | | 3,068 | | | (2,198) | | | 5,266 | | | (1,200) | | | 4,066 | | | (24,912) | | | 4,066 | | | | | (20,846) | |
| Foreign currency translation | | (625) | | | 0 | | | (625) | | | 0 | | | (625) | | | 0 | | | (625) | | | | | (625) | |
| Total | | $ | (65,316) | | | $ | (2,957) | | | $ | (62,359) | | | $ | 13,262 | | | $ | (49,097) | | | $ | 48,664 | | | $ | (49,097) | | | | | $ | (433) | |
| | | | | | | | | | | | | | | | | | | | | | | | | | | | | | | | | | | | | | | | | | | | | | | | | | | | |
| | | December 31, 2020 |
| | | Total other comprehensive income (loss) | | Total accumulated other
comprehensive income (loss) |
| (Dollars in thousands) | | Prior to
reclass | | Reclass
from | | Pre-tax | | Tax-effect | | Net of tax | | Beginning Balance | | Net Activity | | | | Ending Balance |
| Unrealized gain (loss) on debt securities | | $ | 36,643 | | | $ | (4,563) | | | $ | 41,206 | | | $ | (8,894) | | | $ | 32,312 | | | $ | 41,264 | | | $ | 32,312 | | | | | $ | 73,576 | |
| | | | | | | | | | | | | | | | | | |
| Retirement obligation | | 2,001 | | | (1,921) | | | 3,922 | | | (893) | | | 3,029 | | | (27,941) | | | 3,029 | | | | | (24,912) | |
| | | | | | | | | | | | | | | | | | |
| Total | | $ | 38,644 | | | $ | (6,484) | | | $ | 45,128 | | | $ | (9,787) | | | $ | 35,341 | | | $ | 13,323 | | | $ | 35,341 | | | | | $ | 48,664 | |
| | | | | | | | | | | | | | | | | | | | | | | | | | | | | | | | | | | | | | | | | | | | | | | | | | | | | | | | |
| | | December 31, 2019 |
| | | Total other comprehensive income (loss) | | Total accumulated other
comprehensive income (loss) |
| (Dollars in thousands) | | Prior to
reclass | | Reclass
from | | Pre-tax | | Tax-effect | | Net of tax | | Beginning Balance | | Net Activity | | Cumulative effect of new standard | | Ending Balance |
| Unrealized gain (loss) on debt securities | | $ | 65,858 | | | $ | (370) | | | $ | 66,228 | | | $ | (14,269) | | | $ | 51,959 | | | $ | (11,601) | | | $ | 51,959 | | | $ | 906 | | | $ | 41,264 | |
| Unrealized gain (loss) on derivatives | | 281 | | | 0 | | | 281 | | | (64) | | | 217 | | | (217) | | | 217 | | | 0 | | | 0 | |
| Retirement obligation | | 4,630 | | | (1,390) | | | 6,020 | | | (1,371) | | | 4,649 | | | (32,590) | | | 4,649 | | | 0 | | | (27,941) | |
| Total | | $ | 70,769 | | | $ | (1,760) | | | $ | 72,529 | | | $ | (15,704) | | | $ | 56,825 | | | $ | (44,408) | | | $ | 56,825 | | | $ | 906 | | | $ | 13,323 | |
First Financial Bancorp 2021 Annual Report 97
Notes to Consolidated Financial Statements
The following table details the activity reclassified from accumulated other comprehensive income into income during the period:
| | | | | | | | | | | | | | | | | | | | | | | | | | |
| | Amount Reclassified from Accumulated Other Comprehensive Income (1) | | |
| | December 31, | | |
| (Dollars in thousands) | | 2021 | | 2020 | | 2019 | | Affected Line Item in the Consolidated Statements of Income |
| | | | | | | | |
| | | | | | | | |
| Realized gains and losses on securities available-for-sale | | $ | (759) | | | $ | (4,563) | | | $ | (370) | | | Net gain (loss) on sales of investment securities |
| Defined benefit pension plan | | | | | | | | |
Amortization of prior service cost (2) | | 413 | | | 413 | | | 413 | | | Other noninterest expense |
Recognized net actuarial loss (2) | | (2,611) | | | (2,334) | | | (1,803) | | | Other noninterest expense |
| Amortization and settlement charges of defined benefit pension items | | (2,198) | | | (1,921) | | | (1,390) | | | |
| Total reclassifications for the period, before tax | | $ | (2,957) | | | $ | (6,484) | | | $ | (1,760) | | | |
(1) Negative amounts are debits to profit/loss.
(2) Included in the computation of net periodic pension cost (see Note 16 - Employee Benefit Plans for additional details).
19. Capital
Risk-based capital. First Financial and its subsidiary, First Financial Bank, are subject to regulatory capital requirements administered by federal banking agencies. Capital adequacy guidelines and, additionally for banks, prompt corrective action regulations involve quantitative measures of assets, liabilities and certain off-balance sheet items calculated under regulatory accounting practices. Capital amounts and classifications are also subject to qualitative judgments by regulators. Failure to meet minimum capital requirements can initiate regulatory action.
The Board of Governors of the Federal Reserve System approved Basel III in order to strengthen the regulatory capital framework for all banking organizations, subject to a phase-in period for certain provisions. Basel III established and defined quantitative measures to ensure capital adequacy. These measures require First Financial to maintain minimum amounts and ratios of Common equity Tier 1 capital, Total and Tier 1 capital to risk-weighted assets and Tier 1 capital to average assets (Leverage ratio).
Basel III includes a minimum ratio of Common equity Tier 1 capital to risk-weighted assets of 7.0% and a fully phased-in capital conservation buffer of 2.5% of risk-weighted assets. Further, the minimum ratio of Tier 1 capital to risk-weighted assets is 8.5% and all banks are subject to a 4.0% minimum leverage ratio, while the required Total risk-based capital ratio is 10.50%. Failure to maintain the required Common equity Tier 1 capital will result in potential restrictions on a bank’s ability to pay dividends, repurchase stock and pay discretionary compensation to its employees. The capital requirements also provide strict eligibility criteria for regulatory capital instruments and change the method for calculating risk-weighted assets in an effort to better identify riskier assets, such as highly volatile commercial real estate and nonaccrual loans.
As of December 31, 2021, First Financial met all capital adequacy requirements to which it was subject. To be categorized as well-capitalized, First Financial must maintain minimum Total risk-based capital, Tier 1 risk-based capital and Tier 1 leverage ratios as set forth in the table that follows. The Company's most recent regulatory notifications categorized First Financial as "well-capitalized" under the regulatory framework for prompt corrective action. There have been no conditions or events since those notifications that management believes have changed the Company's categorization. Total regulatory capital exceeded the minimum requirement by $419.8 million on a consolidated basis at December 31, 2021.
98 First Financial Bancorp 2021 Annual Report
The following tables present the actual and required capital amounts and ratios as of December 31, 2021 and 2020 under the Basel III Capital Rules. Capital levels required to be considered "well capitalized" are based upon prompt corrective action regulations, as reflected in the Basel III Capital Rules.
| | | | | | | | | | | | | | | | | | | | | | | | | | | | | | | | | | | | | | | | | | |
| | Actual | | Minimum capital
required - Basel III | | PCA requirement to be
considered well
capitalized | | |
| (Dollars in thousands) | | Capital
amount | | Ratio | | Capital
amount | | Ratio | | Capital
amount | | Ratio | | | | |
| December 31, 2021 | | | | | | | | | | | | | | | | |
| Common equity tier 1 capital to risk-weighted assets | | | | | | | | | | | | |
| Consolidated | | $ | 1,262,789 | | | 10.84 | % | | $ | 815,197 | | | 7.00 | % | | N/A | | N/A | | | | |
| First Financial Bank | | 1,513,175 | | | 13.01 | % | | 813,974 | | | 7.00 | % | | $ | 755,833 | | | 6.50 | % | | | | |
| | | | | | | | | | | | | | | | |
| Tier 1 capital to risk-weighted assets | | | | | | | | | | | | | | |
| Consolidated | | 1,306,571 | | | 11.22 | % | | 989,882 | | | 8.50 | % | | N/A | | N/A | | | | |
| First Financial Bank | | 1,513,708 | | | 13.02 | % | | 988,397 | | | 8.50 | % | | 930,256 | | | 8.00 | % | | | | |
| | | | | | | | | | | | | | | | |
| Total capital to risk-weighted assets | | | | | | | | | | | | | | |
| Consolidated | | 1,642,549 | | | 14.10 | % | | 1,222,795 | | | 10.50 | % | | N/A | | N/A | | | | |
| First Financial Bank | | 1,589,570 | | | 13.67 | % | | 1,220,960 | | | 10.50 | % | | 1,162,820 | | | 10.00 | % | | | | |
| | | | | | | | | | | | | | | | |
| Leverage | | | | | | | | | | | | | | | | |
| Consolidated | | 1,306,571 | | | 8.70 | % | | 600,410 | | | 4.00 | % | | N/A | | N/A | | | | |
| First Financial Bank | | 1,513,708 | | | 10.10 | % | | 599,578 | | | 4.00 | % | | 749,472 | | | 5.00 | % | | | | |
| | | | | | | | | | | | | | | | | | | | | | | | | | | | | | | | | | | | | | |
| | Actual | | Minimum capital
required - Basel III | | PCA requirement to be
considered well
capitalized |
| (Dollars in thousands) | | Capital
amount | | Ratio | | Capital
amount | | Ratio | | Capital
amount | | Ratio |
| December 31, 2020 | | | | | | | | | | | | |
| Common equity tier 1 capital to risk-weighted assets | | | | | | | | |
| Consolidated | | $ | 1,325,922 | | | 11.82 | % | | $ | 785,338 | | | 7.00 | % | | N/A | | N/A |
| First Financial Bank | | 1,452,403 | | | 12.95 | % | | 784,807 | | | 7.00 | % | | $ | 728,749 | | | 6.50 | % |
| | | | | | | | | | | | |
| Tier 1 capital to risk-weighted assets | | | | | | | | | | |
| Consolidated | | 1,368,818 | | | 12.20 | % | | 953,625 | | | 8.50 | % | | N/A | | N/A |
| First Financial Bank | | 1,452,507 | | | 12.96 | % | | 952,980 | | | 8.50 | % | | 896,922 | | | 8.00 | % |
| | | | | | | | | | | | |
| Total capital to risk-weighted assets | | | | | | | | | | |
| Consolidated | | 1,744,802 | | | 15.55 | % | | 1,178,007 | | | 10.50 | % | | N/A | | N/A |
| First Financial Bank | | 1,560,457 | | | 13.92 | % | | 1,177,211 | | | 10.50 | % | | 1,121,153 | | | 10.00 | % |
| | | | | | | | | | | | |
| Leverage | | | | | | | | | | | | |
| Consolidated | | 1,368,818 | | | 9.55 | % | | 573,526 | | | 4.00 | % | | N/A | | N/A |
| First Financial Bank | | 1,452,507 | | | 10.14 | % | | 573,094 | | | 4.00 | % | | 716,367 | | | 5.00 | % |
Share repurchases. Effective January 2022, First Financial's board of directors approved a stock repurchase plan (the 2021 Repurchase Plan), replacing the 2020 Repurchase Plan which became effective in January 2021 (the 2020 Repurchase Plan). The 2021 Repurchase Plan continues for two years and authorizes the purchase of up to 5,000,000 shares of the Company's common stock and will expire in December 2023. Under the 2020 Repurchase Plan, First Financial repurchased 4,633,355 shares at an average market price of $23.33 during 2021.
First Financial Bancorp 2021 Annual Report 99
Notes to Consolidated Financial Statements
The 2020 Repurchase Plan replaced the plan that expired on December 31, 2020 (the 2019 Repurchase Plan). Under the 2019 Repurchase Plan, First Financial repurchased 880,000 shares at an average market price of $18.96 during 2020 and repurchased 2,753,272 shares at an average market price of $24.05 during 2019.
20. Stock Options and Awards
First Financial follows the provisions of FASB ASC Topic 718, Compensation-Stock Compensation, which requires measurement of compensation cost for all stock-based awards at fair value on the date of grant and recognition of compensation expense over the service period for all awards expected to vest. First Financial recorded share-based compensation expense within salaries and employee benefits on the Consolidated Statements of Income of $9.6 million, $7.7 million and $8.0 million for the years ended December 31, 2021, 2020 and 2019, respectively, related to stock options and restricted stock awards. Total unrecognized compensation cost related to non-vested share-based compensation was $10.2 million at December 31, 2021 and is expected to be recognized over a weighted average period of 1.93 years.
As of December 31, 2021, First Financial had two active stock-based compensation plans, the Amended and Restated 2012 Stock Plan and the 2020 Stock Plan. New awards may only be granted from the 2020 Stock Plan. At December 31, 2021, there were 3,803,798 shares available for issuance under the 2020 Stock Plan.
In April 2018, in conjunction with the MSFG merger, First Financial assumed existing MSFG stock options, which were converted into options to purchase 83,551 shares of First Financial common stock. The converted MSFG options remain subject to all of the terms and conditions of the plan and grant agreements under which the MSFG Stock Options were originally issued. The assumed options were exercisable at the time of the merger and remain outstanding for 10 years after the initial grant date with all options expiring at the end of the exercise period. At December 31, 2021, 20,515 options were outstanding under the Plan, all of which expire on or before February 3, 2024.
First Financial utilizes the Black-Scholes valuation model to determine the fair value of stock options granted. In addition to the stock option strike price, the Black-Scholes valuation model incorporates the following assumptions: the expected dividend yield based on historical dividend payouts; the expected stock price volatility based on the historical volatility of Company stock for a period approximating the expected life of the options; the risk-free rate based on the U.S. Treasury yield curve in effect at the time of grant for periods corresponding with the expected life of the option; and the expected option life represented by the period of time the options are expected to be outstanding, and is based on historical trends. No new options were granted in 2021, 2020 or 2019.
Stock option activity for the year ended December 31, 2021, is summarized as follows:
| | | | | | | | | | | | | | | | | | | | | | | | | | |
| (Dollars in thousands, except share and per share data) | | Number of shares | | Weighted
average exercise price | | Weighted average
remaining contractual life | | Aggregate intrinsic value |
| Outstanding at beginning of year | | 27,451 | | | $ | 10.53 | | | | | |
| Granted | | 0 | | 0.00 | | | | | |
| | | | | | | | |
| Exercised | | (6,936) | | | 9.21 | | | | | |
| Forfeited or expired | | 0 | | | 0.00 | | | | | |
| Outstanding at end of year | | 20,515 | | | $ | 10.98 | | | 1.78 years | | $ | 275 | |
| Exercisable at end of year | | 20,515 | | | $ | 10.98 | | | 1.78 years | | $ | 275 | |
The intrinsic value of stock options is defined as the difference between the current market value and the exercise price. First Financial uses treasury shares purchased under the Company's share repurchase program to satisfy share-based exercises.
| | | | | | | | | | | | | | | | | | | | |
| | 2021 | | 2020 | | 2019 |
| Total intrinsic value of options exercised | | $ | 114 | | | $ | 86 | | | $ | 462 | |
| Cash received from exercises | | $ | 64 | | | $ | 72 | | | $ | 90 | |
| Tax benefit from exercises | | $ | 2,229 | | | $ | 1,776 | | | $ | 1,844 | |
100 First Financial Bancorp 2021 Annual Report
Restricted stock awards are recorded at fair value as of the grant date as a component of shareholders' equity and amortized on a straight-line basis to salaries and benefits expense over the specified vesting periods, which is currently three years for employees and one year for non-employee directors. The vesting of these awards for employees and non-employee directors may require a service period to be met, and certain awards may also require performance measures to be met.
Activity in restricted stock for the previous three years ended December 31 is summarized as follows:
| | | | | | | | | | | | | | | | | | | | | | | | | | | | | | | | | | | | | | |
| | 2021 | | 2020 | | 2019 |
| | Number of shares | | Weighted
average
grant date
fair value | | Number of shares | | Weighted
average
grant date
fair value | | Number of shares | | Weighted
average
grant date
fair value |
| Nonvested at beginning of year | | 763,283 | | | $ | 22.04 | | | 530,569 | | | $ | 27.19 | | | 462,446 | | | $ | 26.39 | |
| Granted | | 539,020 | | | 22.69 | | | 503,311 | | | 18.62 | | | 395,023 | | | 26.55 | |
| Vested | | (386,848) | | | 22.24 | | | (233,828) | | | 26.07 | | | (295,633) | | | 24.94 | |
| Forfeited | | (75,722) | | | 22.86 | | | (36,769) | | | 23.79 | | | (31,267) | | | 28.63 | |
| Nonvested at end of year | | 839,733 | | | $ | 22.30 | | | 763,283 | | | $ | 22.04 | | | 530,569 | | | $ | 27.19 | |
The fair value of restricted stock is determined based on the number of shares granted and the quoted price of First Financial's common stock. The fair value of restricted stock vested during 2021, 2020 and 2019 was $8.6 million, $6.1 million and $7.4 million, respectively.
21. Earnings per Common Share
The following table sets forth the computation of basic and diluted earnings per share:
| | | | | | | | | | | | | | | | | | | | |
| (Dollars in thousands, except share and per share data) | | 2021 | | 2020 | | 2019 |
| Numerator | | | | | | |
| Net income | | $ | 205,160 | | | $ | 155,810 | | | $ | 198,075 | |
| | | | | | |
| Denominator | | | | | | |
| Basic earnings per common share - weighted average shares | | 95,034,690 | | | 97,363,952 | | | 98,305,570 | |
| Effect of dilutive securities | | | | | | |
| Employee stock awards | | 862,695 | | | 729,146 | | | 545,901 | |
| | | | | | |
| Diluted earnings per common share - adjusted weighted average shares | | 95,897,385 | | | 98,093,098 | | | 98,851,471 | |
| | | | | | |
| Earnings per share available to common shareholders | | | | | | |
| Basic | | $ | 2.16 | | | $ | 1.60 | | | $ | 2.01 | |
| Diluted | | $ | 2.14 | | | $ | 1.59 | | | $ | 2.00 | |
Stock options and warrants with exercise prices greater than the average market price of the common shares are excluded from the computation of net income per diluted share, as they would be antidilutive. Using the end of period price of the Company's common shares, there were no antidilutive options at December 31, 2021, 2020, or 2019.
As of December 31, 2021, 2020, and 2019, First Financial was authorized to issue 10,000,000 preferred shares; however, no preferred shares were issued or outstanding.
22. Fair Value Disclosures
The fair value framework as disclosed in the Fair Value Topic includes a hierarchy which focuses on prioritizing the inputs used in valuation techniques. The fair value hierarchy gives the highest priority to quoted prices in active markets for identical assets or liabilities (Level 1), a lower priority to observable inputs other than quoted prices in active markets for identical assets
and liabilities (Level 2) and the lowest priority to unobservable inputs (Level 3). When determining the fair value measurements for assets and liabilities, First Financial looks to active markets to price identical assets or liabilities whenever possible and classifies such items in Level 1. When identical assets and liabilities are not traded in active markets, First Financial looks to observable market data for similar assets and liabilities and classifies such items as Level 2. Certain assets and liabilities are not actively traded in observable markets and First Financial must use alternative techniques, based on unobservable inputs, to determine the fair value and classifies such items as Level 3. The level within the fair value hierarchy is based on the lowest level of input that is significant in the fair value measurement.
The estimated fair values of First Financial's financial instruments not measured at fair value on a recurring or nonrecurring basis in the consolidated financial statements were as follows:
| | | | | | | | | | | | | | | | | | | | | | | | | | | | | | | | | | | | |
| | Carrying | | Estimated fair value | | | | |
| (Dollars in thousands) | | value | | Total | | Level 1 | | Level 2 | | Level 3 | | | | |
| December 31, 2021 | | | | | | | | | | | | | | |
| Financial assets | | | | | | | | | | | | | | |
| Cash and short-term investments | | $ | 434,842 | | | $ | 434,842 | | | $ | 434,842 | | | $ | 0 | | | $ | 0 | | | | | |
| Investment securities held-to-maturity | | 98,420 | | | 99,898 | | | 0 | | | 99,898 | | | 0 | | | | | |
| Other investments | | 102,971 | | | 102,971 | | | 1,331 | | | 92,025 | | | 9,615 | | | | | |
| | | | | | | | | | | | | | |
| Loans and leases | | 9,156,307 | | | 9,172,111 | | | 0 | | | 0 | | | 9,172,111 | | | | | |
| Accrued interest receivable | | 44,627 | | | 44,627 | | | 0 | | | 15,170 | | | 29,457 | | | | | |
| | | | | | | | | | | | | | |
| Financial liabilities | | | | | | | | | | | | | | |
| | | | | | | | | | | | | | |
| | | | | | | | | | | | | | |
| | | | | | | | | | | | | | |
| | | | | | | | | | | | | | |
| Deposits | | 12,871,954 | | | 12,869,567 | | | 0 | | | 12,869,567 | | | 0 | | | | | |
| Short-term borrowings | | 296,203 | | | 296,203 | | | 296,203 | | | 0 | | | 0 | | | | | |
| Long-term debt | | 409,832 | | | 411,569 | | | 0 | | | 411,569 | | | 0 | | | | | |
| Accrued interest payable | | 4,498 | | | 4,498 | | | 0 | | | 4,498 | | | 0 | | | | | |
| | | | | | | | | | | | | | | | | | | | | | | | | | | | | | | | |
| | Carrying | | Estimated Fair Value |
| (Dollars in thousands) | | Value | | Total | | Level 1 | | Level 2 | | Level 3 |
| December 31, 2020 | | | | | | | | | | |
| Financial assets | | | | | | | | | | |
| Cash and short-term investments | | $ | 251,359 | | | $ | 251,359 | | | $ | 251,359 | | | $ | 0 | | | $ | 0 | |
| Investment securities held-to-maturity | | 131,687 | | | 136,698 | | | 0 | | | 136,698 | | | 0 | |
| Other investments | | 133,198 | | | 133,198 | | | 837 | | | 122,953 | | | 9,408 | |
| | | | | | | | | | |
| Loans and leases | | 9,725,291 | | | 9,743,497 | | | 0 | | | 0 | | | 9,743,497 | |
| Accrued interest receivable | | 50,903 | | | 50,903 | | | 0 | | | 13,221 | | | 37,682 | |
| | | | | | | | | | |
| Financial liabilities | | | | | | | | | | |
| | | | | | | | | | |
| | | | | | | | | | |
| | | | | | | | | | |
| | | | | | | | | | |
| Deposits | | 12,232,003 | | | 12,238,058 | | | 0 | | | 12,238,058 | | | 0 | |
| Short-term borrowings | | 166,594 | | | 166,594 | | | 166,594 | | | 0 | | | 0 | |
| Long-term debt | | 776,202 | | | 774,674 | | | 0 | | | 774,674 | | | 0 | |
| Accrued interest payable | | 6,240 | | | 6,240 | | | 14 | | | 6,226 | | | 0 | |
The following methods, assumptions and valuation techniques were used by First Financial to measure different financial assets and liabilities at fair value on a recurring or nonrecurring basis.
Investment securities. Investment securities classified as available-for-sale are recorded at fair value on a recurring basis. Fair value measurement is based upon quoted market prices, when available (Level 1). If quoted market prices are not available, fair values are measured utilizing independent valuation techniques of identical or similar investment securities. First Financial compiles prices from various sources who may apply such techniques as matrix pricing to determine the value of identical or similar investment securities (Level 2). Matrix pricing is a mathematical technique widely used in the banking industry to value
investment securities without relying exclusively on quoted prices for the specific investment securities but rather relying on the investment securities’ relationship to other benchmark quoted investment securities. Any investment securities not valued based upon the methods previously described are considered Level 3.
First Financial utilizes values provided by third-party pricing vendors to price the investment securities portfolio in accordance with the fair value hierarchy of the Fair Value Topic and reviews the pricing methodologies utilized by the pricing vendors to ensure that the fair value determination is consistent with the applicable accounting guidance. First Financial’s pricing process includes a series of quality assurance activities where prices are compared to recent market conditions, historical prices and other independent pricing services. Further, the Company periodically validates the fair value of a sample of securities in the portfolio by comparing the fair values to prices from other independent sources for the same or similar securities. First Financial analyzes unusual or significant variances, conducts additional research with the pricing vendor, and if necessary, takes appropriate action based on its findings. The results of the quality assurance process are incorporated into the selection of pricing providers by the portfolio manager.
Loans held for sale. The fair value of the Company’s residential mortgage loans held for sale is determined on a recurring basis based on quoted prices for similar loans in active markets, and therefore, is classified as a Level 2 measurement.
Derivatives. The fair values of derivative instruments are based primarily on a net present value calculation of the cash flows related to the interest rate swaps and foreign exchange contracts at the reporting date, using primarily observable market inputs such as interest rate yield curves and currency exchange rates, which represents the cost to terminate the swap if First Financial should choose to do so. Additionally, First Financial utilizes an internally-developed model to value the credit risk component of derivative assets and liabilities, which is recorded as an adjustment to the fair value of the derivative asset or liability on the reporting date. Derivative instruments are classified as Level 2 in the fair value hierarchy.
Collateral dependent loans. Collateral dependent loans carried at fair value have been partially charged-off or receive specific allocations of the allowance for credit losses. For collateral dependent loans, fair value is generally based on real estate appraisals, a calculation of enterprise value or a valuation of business assets including equipment, inventory and accounts receivable. These loans had a principal amount of $28.8 million and $45.3 million at December 31, 2021 and December 31, 2020, respectively, with a valuation allowance of $9.7 million and $13.5 million at December 31, 2021 and December 31, 2020, respectively.
The value of real estate collateral is determined utilizing an income or market valuation approach based on an appraisal conducted by an independent, licensed third-party appraiser (Level 3). These appraisals may utilize a single valuation approach or a combination of approaches including the comparable sales approach and the income approach. Adjustments are routinely made in the appraisal process by the independent appraisers to adjust for differences between the comparable sales and income data available. Collateral is then adjusted or discounted based on management’s historical knowledge, changes in market conditions from the time of the valuation, and management’s expertise and knowledge of the client and the client’s business, resulting in a Level 3 fair value classification. Collateral dependent loans are evaluated on a quarterly basis for additional write-downs and are adjusted accordingly.
Enterprise value is defined as imputed value for the entire underlying business. To determine an appropriate range of enterprise value, FFB relies on a standardized set of valuation methodologies that take into account future projected cash flows, market based multiples as well as asset values. Valuations involve both quantitative and qualitative considerations and professional judgments concerning differences in financial and operating characteristics in addition to other factors that may impact values over time (Level 3).
The value of business equipment is based on an outside appraisal, if deemed significant, or the net book value on the applicable borrower financial statements. Likewise, values for inventory and accounts receivable collateral are based on borrower financial statement balances or aging reports on a discounted basis as appropriate (Level 3).
The fair value of collateral dependent loans is measured at fair value on a nonrecurring basis. Any fair value adjustments are recorded in the period incurred as provision for credit losses on the Consolidated Statements of Income.
OREO. Assets acquired through loan foreclosure are recorded at fair value less costs to sell, with any difference between the fair value of the property and the carrying value of the loan recorded as a charge-off establishing a new cost basis. Subsequent changes in value are reported as adjustments to the carrying amount and are recorded in noninterest expense. The carrying value of OREO is not re-measured to fair value on a recurring basis, but is subject to fair value adjustments when the carrying value differs from the fair value, less estimated selling costs. Fair value is based on recent real estate appraisals and is updated at least annually. The Company classifies OREO in level 3 of the fair value hierarchy.
The financial assets and liabilities measured at fair value on a recurring basis in the consolidated financial statements, were as follows:
| | | | | | | | | | | | | | | | | | | | | | | | | | |
| | | Fair Value Measurements Using | | Assets/Liabilities |
| (Dollars in thousands) | | Level 1 | | Level 2 | | Level 3 | | at Fair Value |
| December 31, 2021 | | | | | | | | |
| Assets | | | | | | | | |
| Investment securities available-for-sale | | $ | 34,776 | | | $ | 4,134,889 | | | $ | 38,181 | | | $ | 4,207,846 | |
| Loans held for sale | | 0 | | | 29,482 | | | 0 | | | 29,482 | |
| Interest rate derivative contracts | | 0 | | | 92,328 | | | 0 | | | 92,328 | |
| Foreign exchange derivative contracts | | 0 | | | 120,768 | | | 0 | | | 120,768 | |
| Total | | $ | 34,776 | | | $ | 4,377,467 | | | $ | 38,181 | | | $ | 4,450,424 | |
| | | | | | | | |
| Liabilities | | | | | | | | |
| Interest rate derivative contracts | | $ | 0 | | | $ | 92,444 | | | $ | 0 | | | $ | 92,444 | |
| Foreign exchange derivative contracts | | 0 | | | 120,768 | | | 0 | | | 120,768 | |
| Total | | $ | 0 | | | $ | 213,212 | | | $ | 0 | | | $ | 213,212 | |
| | | | | | | | | | | | | | | | | | | | | | | | | | |
| | | Fair Value Measurements Using | | Assets/Liabilities |
| (Dollars in thousands) | | Level 1 | | Level 2 | | Level 3 | | at Fair Value |
| December 31, 2020 | | | | | | | | |
| Assets | | | | | | | | |
| Investment securities available-for-sale | | $ | 103 | | | $ | 3,383,902 | | | $ | 40,575 | | | $ | 3,424,580 | |
| Loans held for sale | | 0 | | | 41,103 | | | 0 | | | 41,103 | |
| Interest rate derivative contracts | | 0 | | | 185,032 | | | 0 | | | 185,032 | |
| Foreign exchange derivative contracts | | 0 | | | 87,615 | | | 0 | | | 87,615 | |
| Total | | $ | 103 | | | $ | 3,697,652 | | | $ | 40,575 | | | $ | 3,738,330 | |
| | | | | | | | |
| Liabilities | | | | | | | | |
| Interest rate derivative contracts | | $ | 0 | | | $ | 186,124 | | | $ | 0 | | | $ | 186,124 | |
| Foreign exchange derivative contracts | | 0 | | | 87,615 | | | 0 | | | 87,615 | |
| Total | | $ | 0 | | | $ | 273,739 | | | $ | 0 | | | $ | 273,739 | |
The following table presents a reconciliation for certain AFS securities measured at fair value on a recurring basis using significant unobservable inputs (Level 3) for the years ended December 31, 2021 and 2020.
| | | | | | | | | | | | | | |
| (dollars in thousands) | | December 31, 2021 | | December 31, 2020 |
| Beginning balance | | $ | 40,575 | | | $ | 9,190 | |
| Accretion (amortization) | | (38) | | | 1 | |
| Increase (decrease) in fair value | | 44 | | | (17) | |
| Purchases (settlements) | | (2,400) | | | 31,401 | |
| Ending balance | | $ | 38,181 | | | $ | 40,575 | |
Certain financial assets and liabilities are measured at fair value on a nonrecurring basis. Adjustments to the fair market value of these assets usually result from the application of fair value accounting or write-downs of individual assets. The following table summarizes financial assets and liabilities measured at fair value on a nonrecurring basis:
| | | | | | | | | | | | | | | | | | | | |
| | | Fair Value Measurements Using |
| (Dollars in thousands) | | Level 1 | | Level 2 | | Level 3 |
| December 31, 2021 | | | | | | |
| Assets | | | | | | |
| Collateral dependent loans | | | | | | |
| Commercial | | $ | 0 | | | $ | 0 | | | $ | 4,449 | |
| Commercial real estate | | 0 | | | 0 | | | 14,618 | |
| | | | | | |
| OREO | | 0 | | | 0 | | | 0 | |
| | | | | | | | | | | | | | | | | | | | |
| | | Fair Value Measurements Using |
| (Dollars in thousands) | | Level 1 | | Level 2 | | Level 3 |
| December 31, 2020 | | | | | | |
| Assets | | | | | | |
| Collateral dependent loans | | | | | | |
| Commercial | | $ | 0 | | | $ | 0 | | | $ | 25,367 | |
| Commercial real estate | | 0 | | | 0 | | | 6,432 | |
| | | | | | |
| OREO | | 0 | | | 0 | | | 54 | |
Fair value option. First Financial may elect to report most financial instruments and certain other items at fair value on an instrument-by instrument basis with changes in fair value reported in net income. After the initial adoption, the election is made at the acquisition of an eligible financial asset, financial liability, or firm commitment or when certain specified reconsideration events occur. The fair value election may not be revoked once an election is made.
The Company elected the fair value option for residential mortgage loans held for sale. This election allows for a more effective offset of the changes in fair values of the loans held for sale and the derivative financial instruments used to financially hedge them without having to apply complex hedge accounting requirements. The fair value of the Company’s residential mortgage loans held for sale was determined based on quoted prices for similar loans in active markets.
The aggregate fair value of the Company’s residential mortgage loans held for sale as of December 31, 2021 and 2020 was $29.5 million and $41.1 million, respectively. The aggregate unpaid principal balance of the Company’s residential mortgage loans held for sale as of December 31, 2021 and 2020 was $27.2 million and $35.5 million, respectively. The resulting difference between the aggregate fair value and the aggregate remaining principal balance for loans for which the fair value option has been elected was $2.3 million and $5.6 million as of December 31, 2021 and 2020, respectively.
Changes in the estimated fair value of residential mortgage loans held for sale are reported as a component of Net gain from sales of loans in the Company’s consolidated statements of income. For the year ended December 31, 2021, the change in fair value of the Company’s residential mortgage loans held for sale was a net loss of $3.3 million. For the year ended December 31, 2020, the change in fair value of the Company’s residential mortgage loans held for sale was a net gain of $4.6 million.
First Financial Bancorp 2021 Annual Report 101
Notes to Consolidated Financial Statements
23. Business Combination
On December 31, 2021, the Company completed its acquisition of Summit Funding Group, Inc. and its subsidiaries. Summit is a privately held, full service, equipment financing company that originates, purchases, sells and services equipment leases to commercial businesses in the United States and Canada. Upon completion of the transaction, Summit became a subsidiary of the Bank and continues to operate as Summit Funding Group, taking advantage of its existing brand recognition within the equipment financing industry. Operating results related to the Summit acquisition were immaterial to 2021 consolidated financial statements.
Pursuant to the purchase agreement, First Financial agreed to acquire all of the issued and outstanding equity securities of Summit for aggregate consideration of approximately $127.1 million consisting of $113.5 million in cash and $10.0 million of First Financial common stock, and a $3.6 million earn-out payment. Pursuant to the purchase agreement, the “earn-out” payments are payable annually for each of the five years following the closing of the acquisition, contingent upon the results of Summit's operations. First Financial incurred expenses related to the Summit acquisition of $2.6 million during the year ended December 31, 2021.
The Summit transaction was accounted for using the acquisition method of accounting and accordingly, assets acquired, liabilities assumed and consideration exchanged were recorded at estimated fair value on the acquisition date in accordance with FASB ASC Topic 805, Business Combinations. The fair value measurements of assets acquired and liabilities assumed were $185.8 million and $125.9 million, respectively, and included $42.3 million of financing leases and $73.9 million of operating leases. Given the timing of the transaction closing, acquisition accounting adjustments are considered preliminary at December 31, 2021. These present value measurements are subject to refinement for up to one year after the closing date of the acquisition as additional information relative to closing date fair values become available, and the measurement period ends in December 2022. Goodwill arising from the Summit acquisition was $63.0 million and reflects the business’s high growth potential and the expectation that the acquisition will provide additional revenue growth with the expansion of the Bank's leasing business. The goodwill is not deductible for income tax purposes as the transaction was accounted for as a tax-free exchange. For further detail, see Note 9 – Goodwill and Other Intangible Assets.
In August, 2019, the Company completed its acquisition of Bannockburn Global Forex, LLC. Pursuant to the acquisition agreement, First Financial agreed to acquire all of the issued and outstanding membership interests of BGF for aggregate consideration of approximately $114.6 million consisting of $53.7 million in cash and $60.9 million of First Financial common stock. BGF was a privately held capital markets trading firm specializing in foreign currency advisory, hedge analytics and transaction processing for closely held enterprises. Upon completion of the transaction, Bannockburn became a division of the Bank, but continues to operate as Bannockburn Global Forex, taking advantage of its existing brand recognition within the foreign exchange industry.
The Bannockburn transaction was accounted for using the acquisition method of accounting and accordingly, assets acquired, liabilities assumed and consideration exchanged were recorded at estimated fair value on the acquisition date in accordance with FASB ASC Topic 805, Business Combinations. The fair value measurements of assets acquired and liabilities assumed were $74.9 million and $18.4 million, respectively, and were subject to refinement for up to one year after the closing date of the acquisition as additional information relative to closing date fair values became available. The fair value of assets acquired and liabilities assumed were considered final as of August 2020. Goodwill arising from the BGF acquisition was $57.5 million and reflects the business’s high growth potential and the expectation that the acquisition will provide additional revenue growth and diversification. The goodwill is deductible for income tax purposes as the transaction is considered a taxable exchange. For further detail, see Note 9 – Goodwill and Other Intangible Assets.
102 First Financial Bancorp 2021 Annual Report
24. First Financial Bancorp. (Parent Company Only) Financial Information
Balance Sheets
| | | | | | | | | | | | | | |
| | December 31, |
| (Dollars in thousands) | | 2021 | | 2020 |
| Assets | | | | |
| Cash | | $ | 49,746 | | | $ | 172,902 | |
| Investment securities | | 1,836 | | | 1,388 | |
| Subordinated notes from subsidiaries | | 7,500 | | | 7,500 | |
| Investment in subsidiaries | | | | |
| Commercial bank | | 2,447,095 | | | 2,346,009 | |
| Non-banks | | 10,417 | | | 9,559 | |
| Total investment in subsidiaries | | 2,457,512 | | | 2,355,568 | |
| Premises and equipment | | 1,311 | | | 1,328 | |
| Other assets | | 77,132 | | | 68,812 | |
| Total assets | | $ | 2,595,037 | | | $ | 2,607,498 | |
| | | | |
| Liabilities | | | | |
| Short-term borrowings | | $ | 20,000 | | | $ | 0 | |
| Subordinated notes | | 310,864 | | | 320,615 | |
| Dividends payable | | 1,042 | | | 674 | |
| Other liabilities | | 4,189 | | | 4,139 | |
| Total liabilities | | 336,095 | | | 325,428 | |
| Shareholders’ equity | | 2,258,942 | | | 2,282,070 | |
| Total liabilities and shareholders’ equity | | $ | 2,595,037 | | | $ | 2,607,498 | |
First Financial Bancorp 2021 Annual Report 103
Notes to Consolidated Financial Statements
Statements of Income and Comprehensive Income
| | | | | | | | | | | | | | | | | | | | |
| | Years Ended December 31, |
| (Dollars in thousands) | | 2021 | | 2020 | | 2019 |
| Income | | | | | | |
| Interest income | | $ | 34 | | | $ | 27 | | | $ | 30 | |
| Noninterest income | | 663 | | | 272 | | | 191 | |
| Dividends from subsidiaries | | 202,000 | | | 81,725 | | | 196,800 | |
| Total income | | 202,697 | | | 82,024 | | | 197,021 | |
| | | | | | |
| Expenses | | | | | | |
| Interest expense | | 15,900 | | | 14,172 | | | 9,552 | |
| Salaries and employee benefits | | 9,784 | | | 8,004 | | | 8,169 | |
| Professional services | | 2,343 | | | 1,160 | | | 1,040 | |
| Other | | 5,186 | | | 5,163 | | | 6,599 | |
| Total expenses | | 33,213 | | | 28,499 | | | 25,360 | |
Income before income taxes and equity in undistributed net earnings of subsidiaries | | 169,484 | | | 53,525 | | | 171,661 | |
| Income tax expense (benefit) | | (7,787) | | | (6,145) | | | (5,975) | |
| Equity in undistributed earnings (loss) of subsidiaries | | 27,889 | | | 96,140 | | | 20,439 | |
| Net income | | $ | 205,160 | | | $ | 155,810 | | | $ | 198,075 | |
| | | | | | |
| Comprehensive income | | $ | 156,063 | | | $ | 191,151 | | | $ | 254,900 | |
104 First Financial Bancorp 2021 Annual Report
Statements of Cash Flows
| | | | | | | | | | | | | | | | | | | | |
| | Years Ended December 31, |
| (Dollars in thousands) | | 2021 | | 2020 | | 2019 |
| Operating activities | | | | | | |
| Net income | | $ | 205,160 | | | $ | 155,810 | | | $ | 198,075 | |
| Adjustments to reconcile net income to net cash provided by operating activities | | | | |
| Equity in undistributed (earnings) loss of subsidiaries | | (27,889) | | | (96,140) | | | (20,439) | |
| Depreciation and amortization | | 859 | | | 712 | | | 584 | |
| Stock-based compensation expense | | 9,635 | | | 7,678 | | | 7,969 | |
| Unrealized (gain) loss on equity securities | | (448) | | | (272) | | | (191) | |
| Deferred income taxes | | (224) | | | (158) | | | 1,255 | |
| (Decrease) increase in dividends payable | | 368 | | | (175) | | | 384 | |
| (Decrease) increase in other liabilities | | (751) | | | (22) | | | (244) | |
| Decrease (increase) in other assets | | (8,096) | | | 8,907 | | | (6,996) | |
| Net cash provided by (used in) operating activities | | 178,614 | | | 76,340 | | | 180,397 | |
| | | | | | |
| Investing activities | | | | | | |
| Capital contributions to subsidiaries | | (113,152) | | | 0 | | | 0 | |
| Net cash acquired (paid) in business combinations | | 0 | | | 0 | | | (53,660) | |
| | | | | | |
| Proceeds from sales and maturities of investment securities | | 0 | | | 0 | | | 264 | |
| Purchases of investment securities | | 0 | | | 0 | | | (500) | |
| | | | | | |
| Net cash (used in) provided by investing activities | | (113,152) | | | 0 | | | (53,896) | |
| | | | | | |
| Financing activities | | | | | | |
| (Decrease) increase in short-term borrowings | | 20,000 | | | 0 | | | 0 | |
| Proceeds from long-term borrowings | | (10,592) | | | 150,000 | | | 0 | |
| Cash dividends paid on common stock | | (87,316) | | | (89,691) | | | (89,097) | |
| Purchases of common stock | | (108,077) | | | (16,686) | | | (66,218) | |
| Proceeds from exercise of stock options, net of shares purchased | | 64 | | | 72 | | | 90 | |
| Other | | (2,697) | | | (3,002) | | | (2,285) | |
| Net cash provided by (used in) financing activities | | (188,618) | | | 40,693 | | | (157,510) | |
| Net increase (decrease) in cash | | (123,156) | | | 117,033 | | | (31,009) | |
| Cash at beginning of year | | 172,902 | | | 55,869 | | | 86,878 | |
| Cash at end of year | | $ | 49,746 | | | $ | 172,902 | | | $ | 55,869 | |
First Financial Bancorp 2021 Annual Report 105
Total Return to Shareholders
The following graph compares the five-year cumulative total return to shareholders of First Financial Bancorp common stock with that of companies that comprise the Nasdaq Composite Index and the KBW Regional Bank Index. The KBW Regional Bank Index is comprised of 50 banks headquartered throughout the country and is used frequently by investors when comparing First Financial Bancorp's stock performance to that of other similarly sized institutions. First Financial Bancorp is included in the KBW Regional Bank Index.
The following table assumes $100 invested on December 31, 2016 in First Financial Bancorp, the Nasdaq Composite Index and the KBW Regional Bank Index, and assumes that dividends are reinvested.
COMPARISON OF FIVE-YEAR CUMULATIVE TOTAL RETURN
AMONG FIRST FINANCIAL BANCORP, NASDAQ COMPOSITE INDEX
AND KBW REGIONAL BANK INDEX
| | | | | | | | | | | | | | | | | | | | |
| 2016 | 2017 | 2018 | 2019 | 2020 | 2021 |
| First Financial Bancorp | 100.00 | | 95.05 | | 87.87 | | 97.79 | | 71.49 | | 103.36 | |
| Nasdaq Composite Index | 100.00 | | 129.73 | | 126.08 | | 172.40 | | 250.06 | | 305.60 | |
| KBW Regional Bank Index | 100.00 | | 101.81 | | 84.00 | | 104.05 | | 95.02 | | 129.84 | |
106 First Financial Bancorp 2021 Annual Report

shareholder information Annual Meeting of Shareholders The annual meeting of shareholders will be held on Tuesday, May 24, 2022, at 10:00 AM (EDT) via a virtual shareholder meeting. Common Stock Listing First Financial Bancorp’s common stock trades on the Nasdaq Stock Market (NASDAQ) under the symbol FFBC. Registrar and Transfer Agent Computershare Shareholder Services serves as the registrar and transfer agent for First Financial Bancorp common stock for registered shareholders. Shareholder account inquiries, including changes of address or ownership, transferring stock and replacing lost certificates or dividend checks should be directed to Computershare Shareholder Services at: Transfer Agent Computershare Shareholder Services P.O. Box 505000 Louisville, KY 40233 (800) 368-5948 Shareholders of record can also access their shareholder account records and request information related to their shareholder account via the internet. To register for online account access, go to: www.computershare.com/investor. Dividend Reinvestment and Stock Purchase Plan Shareholders of record holding 25 shares or more are eligible to participate in our Dividend Reinvestment Plan. Shareholders of record may elect to have cash dividends automatically reinvested in additional common shares and can also purchase additional common shares by making optional cash payments. To obtain a prospectus, enroll in the plan, or to contact Investor Relations, please visit the Investor Relations section of our website at www.bankatfirst.com. Investor Relations Corporate and investor information, including news releases, webcasts, investor presentations, annual reports, proxy statements and SEC filings, as well as information on the Company’s corporate governance practices are available within the Investor Relations section of our website at www.bankatfirst.com. Shareholders, analysts and other investment professionals who would like corporate and financial information on First Financial Bancorp should contact: James M. Anderson Chief Financial Officer First Financial Bancorp 255 East Fifth Street, 29th Floor Cincinnati, OH 45202 (513) 887-5400 Email: InvestorRelations@bankatfirst.com Securities and Exchange Commission Filings All reports filed electronically by First Financial Bancorp with the United States Securities and Exchange Commission (SEC), including the Annual Report on Form 10-K, quarterly reports on Form 10-Q, and current reports on Form 8-K, as well as any amendments to those reports, are accessible at no cost within the Investor Relations section of our website at www.bankatfirst.com, or by contacting Investor Relations. These filings are also accessible on the SEC’s website at www.sec.gov.
First Financial Bancorp 2021 Annual Report 107
First Financial Bank First Financial Center 255 East Fifth Street Cincinnati, OH 45202-4248 bankatfirst.com ©2022 First Financial Bancorp