
bp Annual Report
and Form 20-F 2024

| REGISTRATION STATEMENT PURSUANT TO SECTION 12(b) or (g) OF THE SECURITIES EXCHANGE ACT OF 1934 | |||||
| ANNUAL REPORT PURSUANT TO SECTION 13 OR 15(d) OF THE SECURITIES EXCHANGE ACT OF 1934 | |||||
| TRANSITION REPORT PURSUANT TO SECTION 13 OR 15(d) OF THE SECURITIES EXCHANGE ACT OF 1934 | |||||
| SHELL COMPANY REPORT PURSUANT TO SECTION 13 OR 15(d) OF THE SECURITIES EXCHANGE ACT OF 1934 | |||||
| Title of each class | Trading Symbol(s) | Name of each exchange on which registered | |||||||||
| * | |||||||||||
BP/27C | |||||||||||
| * | Not for trading, but only in connection with the registration of American Depositary Shares, pursuant to the requirements of the Securities and Exchange Commission | ||||
| Ordinary Shares of 25c each | |||||
| Cumulative First Preference Shares of £1 each | |||||
| Cumulative Second Preference Shares of £1 each | |||||
U.S. GAAP ☐ | by the International Accounting Standards Board ☒ | Other ☐ | ||||||||||||
Navigating this report | More information | |||
 | Online quick read A concise summary of the bp Annual Report and Form 20-F 2024, highlighting strategy, performance and sustainability information. | |||
Read more on another page of this report | ||||
 | ||||
Read more online | ||||
| ||||
Task Force on Climate-related Financial Disclosures (TCFD) Information that supports TCFD Recommendations and Recommended Disclosures in relation to Metrics and Targets is indicated with TCFD. Glossary Words and terms marked with « | bp.com/annualreport | |||
Online reporting centre All our bp corporate reports, including the bp Sustainability Report and the bp Energy Outlook. | ||||
| ||||
bp.com/reportingcentre | ||||
bp Annual Report and Form 20-F 2024 | 1 |
Strategic report |
100,500a | 61 | |
employees | countries of operation | |
(2023 87,800) | (2023 61) |
2.4 | >39,000 | |||
million barrels of oil equivalent – upstream« production | electric vehicle charge points« | |||
(2023 >29,000) | ||||
(2023 2.3mmboe/d) | ||||
21,200 | ||
retail sites« | ||
(2023 21,100) |
$0.4bn | $8.9bn | l | ||
profit for the year attributable to bp shareholders | underlying replacement cost (RC) profit« | |||
(2023 $15.2bn) | (2023 $13.8bn) | |||
95.2% | l | 94.3% | l | |
bp-operated upstream plant reliability« | bp-operated refining availability« | |||
(2023 95.0%) | (2023 96.1%) | |||
2,950 | 8.2GW | |||
strategic convenience sites« | developed renewables to FID« (net) | |||
(2023 2,850) | ||||
(2023 6.2GW) | ||||
$6.17/boe | l | |||
upstream unit production costs« | ||||
(2023 $5.78/boe) | ||||
38 | l | 33.6MtCO2e | l | |
tier 1 and 2 process safety events« | GHG emissions – operational control | |||
(2023 39) | (2023 32.1MtCO2e) | |||
Key | |
l | |
Strategic report | |
2024 at a glance | |
About bp | |
Chair’s letter | |
Chief executive officer’s letter | |
The operating environment | |
Energy outlook | |
Our strategy | |
2024 performance | |
Consistency with the Paris goals | |
Our business model | |
Key performance indicators | |
Our financial frame | |
Our investment process | |
Group performance | |
Gas & low carbon energy | |
Oil production & operations | |
Customers & products | |
Other businesses & corporate | |
Sustainability | |
Climate-related financial disclosures (TCFD) | |
Our approach to sustainability | |
How we manage risk | |
Risk factors | |
Compliance information | |
Non-financial and sustainability information statement | |
Section 172 statement | |
Corporate governance | |
Introduction from the chair | |
Board of directors | |
Leadership team | |
Governance framework | |
Board activities | |
Our stakeholders | |
Key decisions | |
Safety and sustainability committee | |
Audit committee | |
People, culture and governance committee | |
Remuneration committee | |
Directors’ remuneration report | |
Other disclosures | |
Financial statements | |
Consolidated financial statements of the bp group | |
Notes on the financial statements | |
Supplementary information on oil and natural gas (unaudited) | |
Additional disclosures | |
Shareholder information | |
Glossary | |
Non-IFRS measure reconciliations | |
Signatures | |
Cross-reference to Form 20-F | |
Information about this report | |
Exhibits |
2 | bp Annual Report and Form 20-F 2024 |
About bp | ||


Block 61 Khazzan gas field in Oman | |||
 | |||
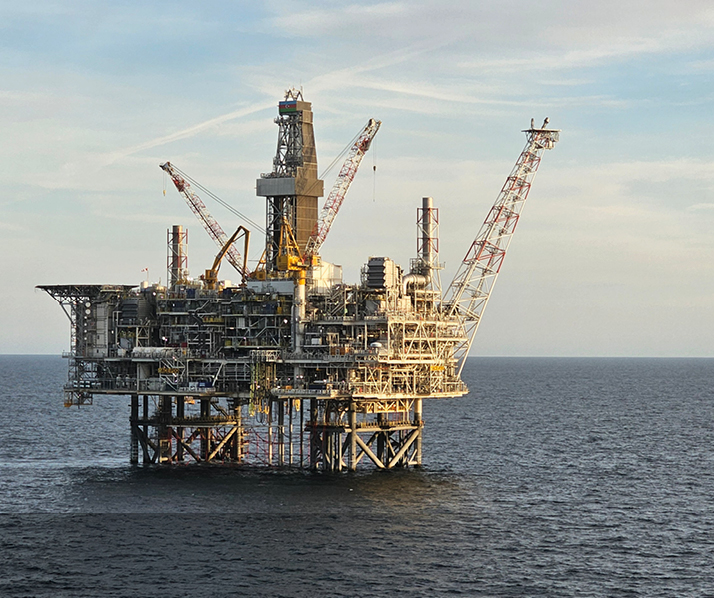
Valaris DS-12 drillship at bp’s Raven gas field, offshore Egypt | |||
| |||

| |
bp.com/ourbeliefs |
bp Annual Report and Form 20-F 2024 | 3 |
Strategic report | ||
$3.6bn | $6.8bn | |
replacement cost (RC) profit before interest and taxb | underlying RC profit before interest and tax« | |
(2023 $14.1bn) | (2023 $8.7bn) |
| |||
$10.8bn | $11.9bn | |
RC profit before interest and taxb | underlying RC profit before interest and tax | |
(2023 $11.2bn) | (2023 $12.8bn) |
| |||
$(1.6)bn | $2.5bn | |
RC loss before interest and taxb | underlying RC profit before interest and tax | |
(2023 profit $4.2bn) | (2023 $6.4bn) |
| |||
$(1.0)bn | $(0.6)bn | |
RC loss before interest and taxb | underlying RC loss before interest and tax | |
(2023 loss $(0.9)bn) | (2023 loss $(0.9)bn) |
| |||


The Gigahub EV charging hub at the NEC in Birmingham, UK | |||
| |||
bp’s Xazar Centre office in Baku, Azerbaijan | |||
| |||
4 | bp Annual Report and Form 20-F 2024 |
Chair’s letter | ||


bp Annual Report and Form 20-F 2024 | 5 |
Strategic report | ||
Chief executive officer’s letter | ||


Nearest IFRS-equivalent measures |
$1.2bn |
profit for 2024a |
0.5% |
profit for 2024 attributable to bp shareholders divided by total equity at 31 December 2024b |
$59.5bn |
finance debt at the end of 2024c |
6 | bp Annual Report and Form 20-F 2024 |
Energy markets | ||
Market activity | 2024 | 2023 | a IMF World Economic Outlook, October 2024, measured on a Purchasing Power Parity basis. b IMF World Economic Outlook Update, January 2024. c Refinitiv Data Service (Dated Brent spot price). d IEA Oil Market Report, January 2025. e Platts Dutch TTF Day Ahead price. f IEA Gas Market Report, Q1 2025. g Platts Henry Hub cash price. h Weekly Natural Gas Storage Report, EIA. i EIA Short Term Energy Outlook, Appalachia and Haynesville regions. j The RMM may not be representative of the margin achieved by bp in any period because of bp’s particular refinery configurations and crude and product slates. In addition, the RMM does not include estimates of energy or other variable costs. k bp Energy Outlook 2024; IRENA Stats; Wood Mackenzie Global Solar Forecasts. PV capacity additions are converted from DC to AC basis by dividing by ~1.2. l WoodMac Lens; Hydrogen Project Pipeline data, October 2024. m WoodMac Lens; CCUS Project Pipeline data, October 2024. n Projects include capture projects either on a standalone basis or as part of a hub (sharing transport and storage facilities). o Refinitiv Data Service (West Texas Intermediate). p Platts JKM spot price. q This number is restated from the bp Annual Report and Form 20-F 2023 to reflect revisions made in the IEA Oil Market Report, January 2025. r This number is restated from the bp Annual Report and Form 20-F 2023 to reflect revisions made in the IEA Gas Market Report, Q1 2025. | ||
Global oil consumptiond | 102.9mmb/d | 102.0mmb/dq | |||
Global oil productiond | 102.9mmb/d | 102.3mmb/dq | |||
Natural gas consumptionf | 4,212bcm | 4,097bcmr | |||
Natural gas productionf | 4,190bcm | 4,134bcmr | |||
Dated Brent averagec | $80.76/bbl | $82.64/bbl | |||
West Texas Intermediate (WTI)« averageo | $75.87/bbl | $77.67/bbl | |||
Henry Hub averageg | $2.19/mmBtu | $2.53/mmBtu | |||
Dutch Title Transfer Facility (TTF)« averagee | 34.4 euros per MWh ($10.9/ mmBtu) | 40.5 euros per MWh ($12.8/ mmBtu) | |||
Japan-Korea (Asian) LNG averagep | $11.9/mmBtu | $13.8/mmBtu | |||
Refining marker marginj | $17.7/bbl | $25.8/bbl | |||
bp Annual Report and Form 20-F 2024 | 7 |
Strategic report | ||
| |
Read the bp Energy Outlook 2024 bp.com/energyoutlook |
Two scenarios to explore the energy transition | ||||
Carbon emissions Gt of CO2ea | ||||
Current Trajectory  | Net Zero  | |||
is designed to capture the broad pathway along which the global energy system is currently travelling. It places weight on climate policies already in force and on global aims and pledges for future decarbonization. At the same time, it also recognizes the myriad challenges associated with meeting these aims. CO2 equivalent (CO2e) emissions in Current Trajectory peak in the mid-2020s and by 2050 are around 25% below 2022 levels. | explores how different elements of the energy system might change to achieve a substantial reduction in carbon emissions. In that sense, Net Zero can be viewed as a ‘what if’ scenario: what elements of the energy system might change, and how, if the world collectively acts for CO2e emissions to fall by around 95% by 2050. | |||
History  | ||||
a Carbon emissions include CO2 emissions from energy use, industrial processes, natural gas flaring and methane emissions from energy production. | ||||

8 | bp Annual Report and Form 20-F 2024 |
Our strategy | ||
Growing upstream | Focusing downstream | |||||
Disciplined investment in transition | ||||||

Adjusted free cash flow« growth | Net debt« | |||||
>20%b | $14-18bnc | |||||
adjusted free cash flow compound annual growth rate (CAGR)« from 2024-27 | by end 2027 | |||||
Structural cost reduction« | Return on average capital employed (ROACE)« | |||||
$4-5bn | >16%b | |||||
by end 2027 | in 2027 |
bp Annual Report and Form 20-F 2024 | 9 |
Strategic report | ||
2024 performance | ||
Metrics TCFD | 2024 | 2023 | |
Upstream« production | 2.4mmboe/d | 2.3mmboe/d | |
bp-operated upstream plant reliability« | 95.2% | 95.0% | |
Upstream unit production costs« | $6.17/boe | $5.78/boe | |
bp-operated refining availability« | 94.3% | 96.1% | |
Biofuels production« | 35kb/d | 32kb/d | |
Biogas supply volumes«b | 23mboe/d | 22mboe/d | |
LNG portfolio« | 23Mtpa | 23Mtpa | |
Strategic convenience sites« | 2,950 | 2,850 | |
Electric vehicle charge points« | >39,000 | >29,000 | |
Hydrogen production (net) | – | – | |
Developed renewables to final investment decision« (net) | 8.2GW | 6.2GW | |
Installed renewables capacity« (net) | 4.0GW | 2.7GW |
Key | |
TCFD | TCFD Recommendations and Recommended Disclosures |
10 | bp Annual Report and Form 20-F 2024 |
Consistency with the Paris goals | ||
| |
bp.com/energyoutlook |
bp Annual Report and Form 20-F 2024 | 11 |
Strategic report | ||
Responding to increased shareholder interest in Paris consistency In 2019 the board recommended that shareholders support a special resolution requisitioned by Climate Action 100+ (CA100+) on climate change disclosures. The CA100+ resolution passed with more than 99% of votes cast. This is the sixth year we have included responses throughout the annual report and we have adopted a similar approach to previous years. The CA100+ resolution, which includes safeguards such as protections for commercially confidential and competitively sensitive information, is on page 352. Key terms related to this resolution response following information: | |||
Element of the CA100+ resolution | Related content | Where | |
Strategy that the board considers in good faith to be consistent with the Paris goals. | Our strategy and business model | ||
Pursuing a strategy that is consistent with the Paris goals | |||
How bp evaluates each new material capex investment« for consistency with the Paris goals and other outcomes relevant to bp strategy. | Our investment process | ||
Disclosure of bp’s principal metrics and relevant targets or goals over the short, medium and long term, consistent with the Paris goals. | Key performance indicators | ||
Sustainability: net zero aims and targets | |||
See ‘TCFD Metrics & Targets’ for an overview | |||
Anticipated levels of investment in: (i) Oil and gas resources and reserves. (ii) Other energy sources and technologies. | Our strategy | ||
Financial frame: disciplined investment allocation | |||
Investment in non-oil and gas | |||
Transition investment | |||
bp’s targets to promote operational GHG reductions. | Sustainability: net zero« aims | ||
Estimated carbon intensity of bp’s energy products and progress over time. | Sustainability: net zero sales aim« | ||
Any linkage between above targets and executive pay remuneration. | Directors’ remuneration report | ||
2024 annual bonus outcome | |||
2025 remuneration policy | |||
12 | bp Annual Report and Form 20-F 2024 |
Our business model | ||

| |
Incumbent capability | |||
~11,600 | ~1,100 | ||
engineers | employees on graduate schemes | ||
| |||
Research and development | |||
$301m | ~2,200 | ||
invested in research and development | granted and pending patent applications held by bp and its subsidiaries | ||
| |||
page 171 | |||
Energy sector experience | |||
>110 years | ~15 years | ||
in energy | of bp Energy Outlook publications | ||
| |||
Financial resources | |||
$16.2bn | $27.3bn | ||
capital expenditure« | operating cash flow« | ||
| |||
bp Annual Report and Form 20-F 2024 | 13 |
Strategic report | ||

Gas & low carbon energy | Production & operations | Customers & products | |||||
Integrating our existing natural gas capabilities with power trading and growth in low carbon businesses and markets, including wind, solar, hydrogen and carbon capture and storage. | The operational heart of bp, producing the hydrocarbon energy and products the world wants and needs – safely and efficiently. | Focusing on customers as the driving force for innovating new business models and service platforms to deliver the convenience, mobility and energy products and services of today and the future. | |||||
| | | |||||
page 28 | page 31 | page 33 | |||||
Investors and shareholders | |
Includes our institutional and retail investors. | |
$5.0bn | |
total dividends distributed to bp shareholders (2023 $4.8bn) | |
Customers | |
Including end-use consumers, B2B customers, and distributors. | |
2,950 | |
strategic convenience sites« (2023 2,850) | |
Employees | |
Our 100,500c people worldwide. | |
70% | |
employee engagement score from the Pulse annual employee survey (2023 73%) | |
| |
page 58 | |
Governments and regulators | |
In the countries where we have existing or planned activities. | |
$10.6bn | |
corporate income tax and production tax paid (2023 $11.9bn) | |
| |
bp.com/tax | |
Society | |
The people, businesses and environment in the communities where we work. | |
$76m | |
supporting additional initiatives to benefit communities (2023 $117m) | |
Partners and suppliers | |
Includes relationships with academia, industry and cities. | |
$146.6bn | |
in payments to suppliers for goods and services (2023 $151.7bn) | |
| |
bp.com/sustainability | |
14 | bp Annual Report and Form 20-F 2024 |
l | |||
Tier 1 and 2 process safety events«ab | |||
2024 | 38 | ||
2023 | 39 | ||
2022 | 50 | ||
2021 | 62 | ||
2020 | 70 | ||
Tier 1 process safety events | Tier 2 process safety events | ||
Refining availability (%) | |||
2024 | 94.3 | ||
2023 | 96.1 | ||
2022 | 94.5 | ||
2021 | 94.8 | ||
2020 | 96.0 | ||

Remuneration | l |
| |
Key | |
l | Used for remuneration policy |
TCFD | TCFD Recommendations and Recommended Disclosures |
Reported recordable injury frequency«ab | |||
2024 | 0.297 | ||
2023 | 0.274 | ||
2022 | 0.187 | ||
2021 | 0.164 | ||
2020 | 0.132 | ||
Upstream« plant reliability (%) | |||
2024 | 95.2 | ||
2023 | 95.0 | ||
2022 | 96.0 | ||
2021 | 94.0 | ||
2020 | 94.0 | ||

bp Annual Report and Form 20-F 2024 | 15 |
Strategic report |
Major project delivery | |||
2024 | 1 | ||
2023 | 4 | ||
2022 | 2 | ||
2021 | 7 | ||
2020 | 4 | ||

Underlying replacement cost (RC) profit ($ billion) | |||
2024 | 0.4 8.9 | ||
2023 | 15.2 13.8 | ||
2022 | (2.5) 27.7 | ||
2021 | 7.6 12.8 | ||
2020 | (20.3) (5.7) | ||

Profit (loss) for the year attributable to bp shareholders | Underlying RC profit for the year (non-IFRS) | ||
Operating cash flow ($ billion) | |||
2024 | 27.3 | ||
2023 | 32.0 | ||
2022 | 40.9 | ||
2021 | 23.6 | ||
2020 | 12.2 | ||

Upstream unit production costs ($/boe) | |||
2024 | 6.17 | ||
2023 | 5.78 | ||
2022 | 6.07 | ||
2021 | 6.82 | ||
2020 | 6.39 | ||

l | |||
Total shareholder return (%) | |||
2024 | (11.9) (11.0) | ||
2023 | 5.9 2.6 | ||
2022 | 36.9 50.1 | ||
2021 | 36.4 36.4 | ||
2020 | (41.4) (41.7) | ||

ADS basis | Ordinary share basis | ||
l | |||
Return on average capital employed (ROACE) (%) | |||
2024 | 0.5 14.2 | ||
2023 | 17.8 18.1 | ||
2022 | (3.0) 30.5 | ||
2021 | 8.4 13.3 | ||
2020 | (23.7) (3.8) | ||

Profit (loss) for the period attributable to bp shareholders divided by total equity | ROACE (non-IFRS) | ||
16 | bp Annual Report and Form 20-F 2024 |
Key | |
l | Used for remuneration policy |
TCFD | TCFD Recommendations and Recommended Disclosures |
TCFDl | |||
Greenhouse gas emissionsabcde – operational control (MtCO2e) | TCFD l | ||
2024 | 33.6 | ||
2023 | 32.1 | ||
2022 | 31.8 | ||
2021 | 35.6 | ||
2020 | 45.5 | ||
Scope 1 (direct) emissions | Scope 2 (indirect) emissions | ||
Methane intensityaf (%) | TCFD | ||
2024 | 0.07 | ||
2023 | 0.05 | ||
2022 | 0.05 | ||
2021 | 0.07 | ||
2020 | 0.12 | ||

bp Annual Report and Form 20-F 2024 | 17 |
Strategic report |
Diversity and inclusiong (%) | |||
2024 | 35 35 | ||
2023 | 34 33 | ||
2022 | 33 33 | ||
2021 | 32 31 | ||
2020 | 29 30 | ||

Women in group leadership | People from beyond the UK and US in group leadership | ||
Employee engagement (%) | |||
2024 | 70 | ||
2023 | 73 | ||
2022 | 70 | ||
2021 | 64 | ||
2020 | 64 | ||

| |
18 | bp Annual Report and Form 20-F 2024 |
Our financial frame | ||
Our financial frame | ||||||||||||||
Balance sheet | Shareholder distributions | Capital expenditure | ||||||||||||
Resilient dividend | Share buybacks | |||||||||||||
$14-18bn Net debt« target by end 2027a | Expect annual increase of the dividend per ordinary share of at least 4%b | Excess cash shared through buybacks over time | ~$15bn in 2025 $13-15bn in 2026-27 | |||||||||||
‘A’ range credit metrics through cycle | 30-40% of operating cash flow« distributed as dividends and share buybacksbc | Disciplined investment allocation, assessed against a set of balanced criteria | ||||||||||||
bp Annual Report and Form 20-F 2024 | 19 |
Strategic report | ||
Our investor proposition |
Resetting strategy •Growing upstream •Disciplined transition investment | Reallocating capital •Reallocating and reducing capital expenditure« •Significant divestment programme | Driving performance •Improving downstream •Cost efficiency | ||||||||
Compelling adjusted free cash flow growth | Strong returns growth | |||||
>20% | >16% | |||||
Compound annual growth rate (CAGR)« from 2024-27a | ROACE« in 2027a | |||||
Resilient distributions | Stronger balance sheet | Lower operational emissions | ||
30-40% | $14-18bn | 45-50% | ||
Total distribution of operating cash flowbc | Net debt target by end 2027d | Reduction aim across Scope 1 and 2 by 2030e |
2025 guidance |
2024 actual | 2025 guidance | ||
Upstream reported production (guidance is both reported and underlying production«) | 2.4mmboe/d | Reported production to be lower/underlying production to be slightly lower than 2024 | |
Total capital expenditure« | $16.2bn | Around $15bn | |
Depreciation, depletion and amortization | $16.6bn | Broadly flat compared with 2024 | |
Divestments and other proceedsf | $4.2bn | Around $3bn, weighted towards the second half | |
Gulf of America oil spill paymentsg (pre-tax) | $1.2bn | Around $1.2bn including $1.1bn pre-tax to be paid during the second quarter | |
Other businesses & corporate underlying annual charge | $0.6bn | Around $1.0bn | |
Underlying effective tax rate« | 41%h | Around 40%i |
20 | bp Annual Report and Form 20-F 2024 |
Our investment process | ||
Investment process price assumptions | ||||
All investments are evaluated against relevant price assumptions for oil, natural gas, refining margins or other commodities across a range of alternative price or margin series (typically a central, upper and lower series). In addition, all investment cases with anticipated annual operational GHG emissions (Scope 1 and 2) above 20,000 tonnes of CO2 equivalent (bp net), must estimate those anticipated GHG emissions and include an associated carbon cost in the investment economics, using the carbon prices above. Our investment price assumptions place some weight on scenarios in which the transition to a low carbon energy system is sufficiently rapid to meet the goals of the Paris Agreement, as well as scenarios in which the transition may not be sufficiently rapid. They also place some weight on a range of other factors that can drive prices, and which are not directly related to the Paris goals. | These price assumptions do not link to specific scenarios or outcomes, but instead try to capture the range of different possibilities surrounding the future path of the global energy system. The nature of the uncertainty means that the price ranges inevitably reflect considerable judgement. The ranges are reviewed and updated as necessary, as our understanding of and judgements about the energy transition evolve. In addition to consideration of a range of price assumptions, investment cases also assess the impact of alternative assumptions covering other selected variables relevant to the economics of the investment. These variables may include cost, schedule, resources, policy changes, or other areas of uncertainty, to assess the robustness of investment cases to a range of other factors. | |||
Key investment appraisal assumptionsa TCFD | ||||
2023 $ real | up to 2030 | 2040 | 2050 | |
Brent oil ($/bbl) | 70 | 63 | 50 | |
Henry Hub gas ($/mmBtu) | 4.0 | 4.0 | 4.0 | |
Refining marker margin (RMM)b« ($/bbl) | 14 | 12 | 9 | |
In addition to the prices shown we also test whether investments meet our return expectations (see page 22) using $60/bbl Brent oil price series. | ||||
Carbon price TCFD | ||||
2023 $ real | 2030 | 2040 | 2050 | |
Carbon ($/tCO2e) | 135 | 175 | 200 | |
a The values in the table represent the central case. b The disclosed RMM assumption in the table excludes carbon pricing impacts and assumes a normalized cost of renewable identification numbers (RINs). | ||||
Key | |
TCFD | Information that supports TCFD Recommendations and Recommended Disclosures in relation to Metrics and Targets |
bp Annual Report and Form 20-F 2024 | 21 |
Strategic report | ||
bp board Reviews and approves investment cases of more than $3 billion for resilient hydrocarbons, more than $1 billion for all transition or low carbon investments« and any significant inorganic acquisition that is exceptional or unique in nature. | ||
Resource commitment meeting Forum for executive management’s review and approval of investments related to existing and new lines of business above $250 million, or $25 million for acquisitions, or which exceed the relevant EVP’s financial authority, and any project considered strategically important such as a new market entry. | ||
Investment allocation committees EVP-level forums to review and approve investment cases within a business group as per individual EVP financial authority (up to $250 million, or typically $25 million for acquisitions). | ||
Business group investment governance meetings SVP-level forums that review and approve investment cases within a business group or function, up to the individual SVP’s financial authority. | ||
Cross-group meetings Forums that facilitate discussions across businesses and functions, to support project development, sensitivity analysis, integration opportunities and risk assessment ahead of investment committee meetings. | ||


22 | bp Annual Report and Form 20-F 2024 |
Our investment process continued | ||
bp Annual Report and Form 20-F 2024 | 23 |
Strategic report | ||
Evaluation of investment performance against quantitative guide levelsb | |||||||||||||
Seven of the eight investments exceeded the relevant IRR guide level as shown in the chart. The IRR of the remaining investment was slightly below its central price IRR hurdle. | |||||||||||||
Three of the four upstream hydrocarbon projects had emissions intensities below the relevant upstream intensity guide level. The other upstream investment had an emissions intensity above the guide level, but was expected to reduce our operational emissions intensity in the region. The four other investments were in businesses for which there was no applicable carbon intensity guide. These latter investments are shown as ‘n/a’ in the operational carbon intensity chart. | |||||||||||||
Investment economics | Sustainability | ||||||||||||
Against IRR guide level | Against operational carbon intensity | ||||||||||||
Investments with intensity guide level | No intensity guide level | ||||||||||||
Guide | Guide | ||||||||||||


24 | bp Annual Report and Form 20-F 2024 |
Group performance | ||


$0.4bn | $8.9bn | $27.3bn | ||
profit attributable to bp shareholders (2023 profit $15.2bn) | underlying replacement cost (RC) profit« (2023 profit $13.8bn) | operating cash flow« (2023 $32.0bn) |
Financial and operating performance | ||||
$ million except per share amounts | ||||
2024 | 2023 | 2022 | ||
Sales and other operating revenues | 189,185 | 210,130 | 241,392 | |
Profit before interest and tax | 11,297 | 27,348 | 18,039 | |
Finance costs and net finance income/expense relating to pensions and other post-employment benefits | (4,515) | (3,599) | (2,634) | |
Taxation | (5,553) | (7,869) | (16,762) | |
Profit (loss) for the year | 1,229 | 15,880 | (1,357) | |
Non-controlling interest | (848) | (641) | (1,130) | |
Profit (loss) for the year attributable to bp shareholders | 381 | 15,239 | (2,487) | |
Inventory holding (gains) losses«, before tax | 488 | 1,236 | (1,351) | |
Taxation charge (credit) on inventory holding gains and losses | (119) | (292) | 332 | |
Replacement cost (RC) profit (loss)« | 750 | 16,183 | (3,506) | |
Net (favourable) adverse impact of adjusting items«a, before tax | 9,344 | (1,143) | 29,781 | |
Total taxation charge (credit) on adjusting items | (1,179) | (1,204) | 1,378 | |
Underlying RC profit | 8,915 | 13,836 | 27,653 | |
Adjusted EBIDA« | 31,161 | 34,345 | 45,695 | |
Adjusted EBITDA« | 38,012 | 43,710 | 60,747 | |
Dividend paid per ordinary share (cents) | 30.540 | 27.760 | 22.932 | |
Dividend paid per ordinary share (pence) | 23.720 | 22.328 | 18.624 | |
Profit (loss) per ordinary share (cents) | 2.38 | 87.78 | (13.10) | |
Profit (loss) per ADS (dollars) | 0.14 | 5.27 | (0.79) | |
Underlying RC profit per ordinary share« (cents) | 54.40 | 79.69 | 145.63 | |
Underlying RC profit per ADS« (dollars) | 3.26 | 4.78 | 8.74 | |
Adjusting itemsa | ||||
Gains on sale of businesses and fixed assets | 670 | 361 | 3,866 | |
Net impairment and losses on sale of businesses and fixed assets | (6,930) | (5,838) | (5,920) | |
Environmental and related provisions | (181) | (647) | 325 | |
Restructuring, integration and rationalization costs | (222) | 37 | 34 | |
Fair value accounting effects (FVAEs)b | (1,852) | 9,403 | (3,501) | |
Rosneft | — | — | (24,033) | |
Gulf of America oil spill | (51) | (57) | (84) | |
Other | (273) | (1,711) | (43) | |
Total before interest and taxation | (8,839) | 1,548 | (29,356) | |
Finance costs | (505) | (405) | (425) | |
(9,344) | 1,143 | (29,781) | ||
Adjusting items total taxation | 1,179 | 1,204 | (1,378) | |
(8,165) | 2,347 | (31,159) | ||
aSee page 313 for more information. bSee page 314 for information on the cumulative impact of FVAEs. | ||||

 |
bp delivered operating cash flow of $27.3 billion. During the year, we made strong progress on cost savings, achieving $0.8 billion of structural cost reduction«. We raised the dividend per ordinary share by 10% and delivered $7 billion of share buybacks. Our focus on capital discipline and strengthening the balance sheet continues into 2025. |
Kate Thomson Chief financial officer |
bp Annual Report and Form 20-F 2024 | 25 |
Strategic report | ||
26 | bp Annual Report and Form 20-F 2024 |
Group performance continued | ||
Cash flow and debt information | ||||
$ million | ||||
2024 | 2023 | 2022 | ||
Cash flow | ||||
Operating cash flow« | 27,297 | 32,039 | 40,932 | |
Net cash used in investing activities | (13,250) | (14,872) | (13,713) | |
Net cash provided by (used in) financing activities | (7,297) | (13,359) | (28,021) | |
Cash and cash equivalents at end of yeara | 39,269 | 33,030 | 29,195 | |
Capital expenditure«b | (16,237) | (16,253) | (16,330) | |
Divestment and other proceedsc | 4,224 | 1,843 | 3,123 | |
Debt | ||||
Finance debt | 59,547 | 51,954 | 46,944 | |
Net debt« | 22,997 | 20,912 | 21,422 | |
Net debt including leases« | 34,909 | 31,902 | 29,990 | |
Finance debt ratio« (%) | 43.2% | 37.8% | 36.1% | |
Gearing« (%) | 22.7% | 19.7% | 20.5% | |
Gearing including leases« (%) | 30.8% | 27.2% | 26.5% | |
a2024 includes $65 million of cash and cash equivalents classified as assets held for sale in the group balance sheet. cDivestment proceeds are disposal proceeds as per the group cash flow statement. See below for more information on divestment and other proceeds. | ||||
bp Annual Report and Form 20-F 2024 | 27 |
Strategic report | ||
Group reserves and productiona | ||||
2024 | 2023 | 2022 | ||
Estimated net proved reserves (net of royalties) | ||||
Liquids (mmb) | 3,699 | 3,747 | 3,997 | |
Natural gas (bcf) | 14,786 | 17,471 | 18,481 | |
Total hydrocarbonsb (mmboe) | 6,248 | 6,759 | 7,183 | |
Of which: | ||||
Equity-accounted entitiesb | 1,377 | 1,437 | 1,381 | |
Production (net of royalties) | ||||
Liquids (mb/d) | 1,166 | 1,115 | 1,214 | |
Natural gas (mmcf/d) | 6,914 | 6,944 | 7,101 | |
Total hydrocarbonsc (mboe/d) | 2,358 | 2,313 | 2,438 | |
Of which: | ||||
Subsidiaries | 2,008 | 1,967 | 2,000 | |
Equity-accounted entitiesc | 350 | 345 | 439 | |
aBecause of rounding, some totals may not agree exactly with the sum of their component parts. bSee Supplementary information on oil and natural gas on page 223 for further information. See page 322 for more information on bp’s oil and gas reserves including the impact of events occurring after the end of the reporting period. c2022 includes bp’s share of Rosneft and Russia joint ventures (193mboe/d). See Oil and gas disclosures for the group on page 324 for further information. | ||||
28 | bp Annual Report and Form 20-F 2024 |
Gas & low carbon energy | ||
Financial and operating performance | ||||
$ million | ||||
2024 | 2023 | 2022b | ||
Sales and other operating revenuesc | 32,628 | 50,297 | 56,255 | |
Profit before interest and tax | 3,569 | 14,081 | 14,688 | |
Inventory holding (gains) losses« | — | (1) | 8 | |
RC profit before interest and tax | 3,569 | 14,080 | 14,696 | |
Net (favourable) adverse impact of adjusting items«d | 3,234 | (5,358) | 1,367 | |
Underlying RC profit before interest and tax« | 6,803 | 8,722 | 16,063 | |
Taxation on an underlying RC basis | (2,137) | (2,730) | (4,367) | |
Underlying RC profit before interest | 4,666 | 5,992 | 11,696 | |
Depreciation, depletion and amortization | 4,835 | 5,680 | 5,008 | |
Exploration write-offs | 222 | 362 | 2 | |
Adjusted EBITDA«e | 11,860 | 14,764 | 21,073 | |
Capital expenditure« | ||||
Gas | 3,615 | 3,025 | 3,227 | |
Low carbon energy | 1,596 | 1,256 | 1,024 | |
5,211 | 4,281 | 4,251 | ||
aThe AGT and Middle East regions have been further subdivided by asset to allow reporting in either gas & low carbon or oil production & operations as appropriate. b2022 includes bp Bunge Bioenergia. From the first quarter of 2023, bp Bunge Bioenergia is reported within customers & products. cIncludes sales to other segments. dSee page 314 for information on the cumulative impact of FVAEs. eA reconciliation to RC profit before interest and tax is provided on page 362. | ||||
bp Annual Report and Form 20-F 2024 | 29 |
Strategic report | ||

LiDAR buoys help inform offshore wind farm development, Liverpool, UK | ||
Partnering for offshore wind bp and JERA Co., Inc., Japan’s largest power generation company, have agreed to set up a new 50:50 joint venture, JERA Nex bp, that will become one of the largest global offshore wind developers, owners and operators. The joint venture aims to create a strategic platform for growth by combining a balanced mix of operating assets and development projects with total 13GW potential net generating capacity. Subject to regulatory and other approvals, we aim to complete the formation of JERA Nex bp by the end of the third quarter of 2025. | ||
Green hydrogen in Germany In December 2024 bp announced the final investment decision for its 100MW Lingen Green Hydrogen (LGH2) project in Germany. It is expected to be bp’s largest industrial green hydrogen plant and the first that we will fully own and operate. The project is expected to produce around 11,000 tonnes of green hydrogen annually, with commissioning expected in 2027. | ||
bp’s Lingen refinery, Germany | ||
30 | bp Annual Report and Form 20-F 2024 |
Gas & low carbon energy continued | ||
Estimated net proved reserves and productiona (net of royalties) | ||||
2024 | 2023 | 2022 | ||
Estimated net proved reserves (net of royalties) | ||||
Crude oilb (mmb) | 113 | 128 | 151 | |
Natural gas liquids (mmb) | 1 | 1 | 9 | |
Total liquids«c | 115 | 129 | 160 | |
Natural gasc (bcf) | 6,965 | 8,635 | 9,708 | |
Total hydrocarbons«c (mmboe) | 1,316 | 1,618 | 1,834 | |
Of which equity-accounted entitiesd: | ||||
Liquids (mmb) | 1 | — | — | |
Natural gas (bcf) | 196 | — | — | |
Total hydrocarbons (mmboe) | 35 | — | — | |
Production (net of royalties) | ||||
Crude oilbe (mb/d) | 88 | 96 | 103 | |
Natural gas liquids (mb/d) | 8 | 9 | 15 | |
Total liquids (mb/d) | 96 | 105 | 118 | |
Natural gas (mmcf/d) | 4,596 | 4,778 | 4,866 | |
Total hydrocarbons (mboe/d) | 888 | 929 | 957 | |
Of which equity-accounted entitiesf: | ||||
Liquids (mb/d) | 2 | 2 | 2 | |
Natural gas (mmcf/d) | 9 | — | — | |
Total hydrocarbons (mboe/d) | 4 | 2 | 2 | |
Average realizations«g | ||||
Liquids ($/bbl) | 75.37 | 77.03 | 89.86 | |
Natural gas ($/mcf) | 5.90 | 6.13 | 8.91 | |
Total hydrocarbons ($/boe) | 38.57 | 40.21 | 56.34 | |
aBecause of rounding, some totals may not agree exactly with the sum of their component parts. bIncludes condensate and bitumen. cIncludes 1.7 million barrels of total liquids (2.2 million barrels at 31 December 2023 and 3 million barrels at 31 December 2022) and 219 billion cubic feet of natural gas (430 billion cubic feet at 31 December 2023 and 547 billion cubic feet at 31 December 2022) in respect of the 30% non-controlling interest in BP Trinidad and Tobago LLC. dbp’s share of reserves of equity-accounted entities in the gas & low carbon energy segment. e2023 restated, 4mb/d previously reported in NGLs. fbp’s share of production of equity-accounted entities in the gas & low carbon energy segment. gRealizations are based on sales by consolidated subsidiaries only – this excludes equity-accounted entities. | ||||
2024 | 2023 | 2022 | ||
Renewables (bp net, GW) | ||||
Installed renewables capacity« | 4.0 | 2.7 | 2.2 | |
Developed renewables to FID« | 8.2 | 6.2 | 5.8 | |
Renewables pipeline | 60.6 | 58.3 | 37.2 | |
of which by geographical area: | ||||
Renewables pipeline – Americas | 21.2 | 18.8 | 17.0 | |
Renewables pipeline – Asia Pacific | 15.1 | 21.3 | 11.8 | |
Renewables pipeline – Europe | 23.6 | 14.6 | 8.3 | |
Renewables pipeline – Other | 0.7 | 3.5 | 0.1 | |
of which by technology: | ||||
Renewables pipeline – offshore wind | 9.7 | 9.3 | 5.2 | |
Renewables pipeline – onshore wind | 6.6 | 12.7 | 6.3 | |
Renewables pipeline – solar | 44.3 | 36.3 | 25.7 | |
Total developed renewables to FID and renewables pipeline | 68.8 | 64.5 | 43.0 |
The potential site of NZT Power, UK | ||
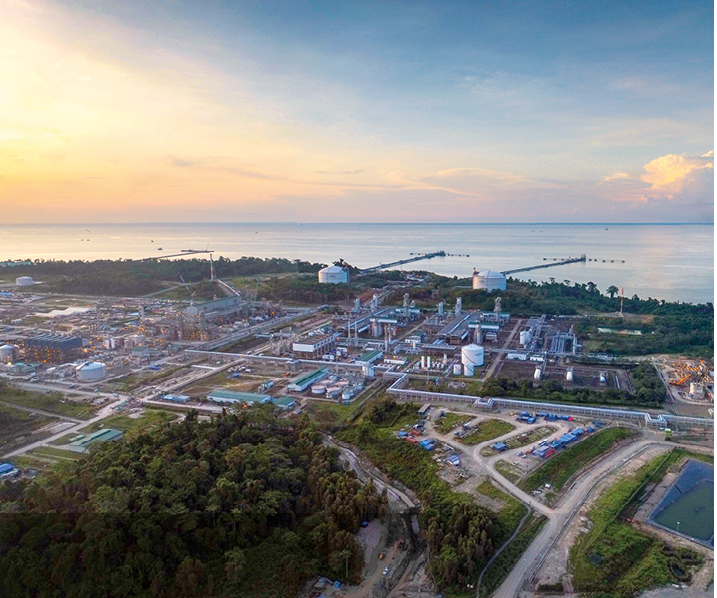
Natural gas in Indonesia bp and its partners approved the $7 billion Tangguh UCC project in Papua Barat, Indonesia. This initiative will help unlock around 3 trillion cubic feet of natural gas and help meet growing energy demand in Asia. Through the use of CCUS for enhanced gas recovery, the project has the potential to sequester around 15MtCO2 in its initial phase, reducing overall CO2 emissions intensity from operations at Tangguh. | ||
Tangguh LNG facility, Papua Barat, Indonesia | ||
Teesside carbon capture milestone In December 2024, bp and partners reached financial close on the Net Zero Teesside Power (NZT Power) and Northern Endurance Partnership (NEP) projects. NZT Power aims to be one of the world’s first gas-fired power stations with carbon capture, and could generate up to 742MW of flexible, dispatchable low carbon power and could capture up to 2MtCO2 annually. NEP will develop the infrastructure to transport and store up to an initial 4MtCO2 annually from three Teesside-based carbon capture projects within the East Coast Cluster, with the ability to expand in the future. Both projects are expected to support thousands of jobs and help advance the UK's journey to net zero. | ||
bp Annual Report and Form 20-F 2024 | 31 |
Strategic report | ||
Oil production & operations | ||
Oil production & operations segment comprises regionsa with upstream activities that predominantly produce crude oil, including bpx energy. | ||||
Financial and operating performance | ||||
$ million | ||||
2024 | 2023 | 2022 | ||
Sales and other operating revenuesb | 25,637 | 24,904 | 33,193 | |
Profit before interest and tax | 10,780 | 11,191 | 19,714 | |
Inventory holding (gains) losses« | 9 | — | 7 | |
RC profit before interest and tax | 10,789 | 11,191 | 19,721 | |
Net (favourable) adverse impact of adjusting items« | 1,148 | 1,590 | 503 | |
Underlying RC profit before interest and tax« | 11,937 | 12,781 | 20,224 | |
Taxation on an underlying RC basis | (5,165) | (5,998) | (9,143) | |
Underlying RC profit before interest | 6,772 | 6,783 | 11,081 | |
Depreciation, depletion and amortization | 6,797 | 5,692 | 5,564 | |
Exploration write-offs | 544 | 384 | 383 | |
Adjusted EBITDA«c | 19,278 | 18,857 | 26,171 | |
Capital expenditure« | 6,198 | 6,278 | 5,278 | |
aThe AGT and Middle East regions have been further subdivided by asset to allow reporting in either gas & low carbon or oil production & operations as appropriate. bIncludes sales to other segments. cA reconciliation to RC profit before interest and tax is provided on page 362. | ||||
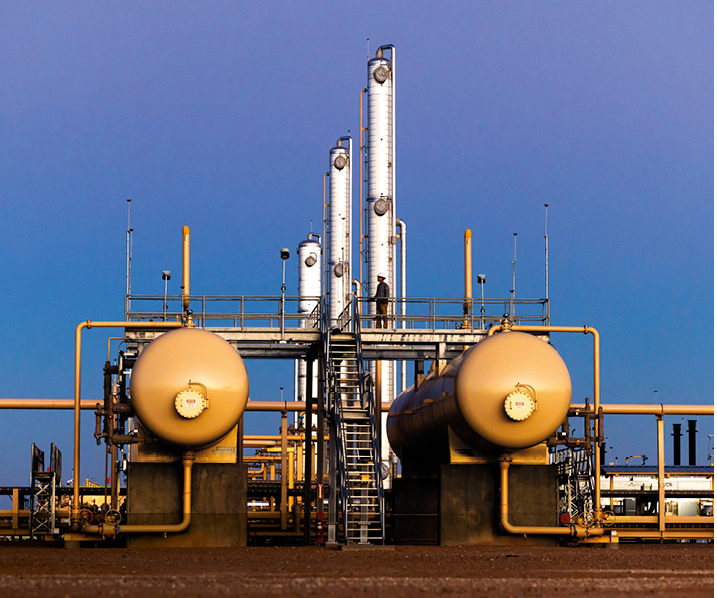
Growth in the Permian In 2024, bp’s US onshore oil and gas business, bpx energy, achieved its 30-40% growth target, set for 2025, a year early. And it brought online Checkmate, its third central processing facility in the Permian Basin in April. The electrified facility is designed to support further production growth for bpx energy in the basin. | ||
bpx energy, Permian Basin processing facility in Texas, US | ||
32 | bp Annual Report and Form 20-F 2024 |
Oil production & operations continued | ||
Estimated net proved reserves and productiona (net of royalties) | ||||
2024 | 2023 | 2022 | ||
Estimated net proved reserves (net of royalties) | ||||
Crude oilb (mmb) | 3,112 | 3,193 | 3,380 | |
Natural gas liquids (mmb) | 472 | 426 | 457 | |
Total liquids | 3,584 | 3,618 | 3,836 | |
Natural gas (bcf) | 7,821 | 8,836 | 8,774 | |
Total hydrocarbons« (mmboe) | 4,932 | 5,142 | 5,349 | |
Of which equity-accounted entitiesc: | ||||
Liquids (mmb) | 917 | 1,001 | 968 | |
Natural gas (bcf) | 2,467 | 2,527 | 2,394 | |
Total hydrocarbons (mmboe) | 1,342 | 1,437 | 1,381 | |
Production (net of royalties) | ||||
Crude oilb (mb/d) | 953 | 910 | 866 | |
Natural gas liquids (mb/d) | 117 | 100 | 86 | |
Total liquids (mb/d) | 1,070 | 1,010 | 952 | |
Natural gas (mmcf/d) | 2,318 | 2,165 | 1,998 | |
Total hydrocarbons (mboe/d) | 1,470 | 1,383 | 1,297 | |
Of which equity-accounted entitiesd: | ||||
Liquids (mb/d) | 272 | 269 | 176 | |
Natural gas (mmcf/d) | 431 | 432 | 436 | |
Total hydrocarbons (mboe/d) | 346 | 343 | 251 | |
Average realizations«e | ||||
Liquids ($/bbl) | 69.85 | 72.09 | 89.62 | |
Natural gas ($/mcf) | 2.55 | 4.17 | 10.46 | |
Total hydrocarbons ($/boe) | 53.96 | 58.34 | 82.23 | |
aBecause of rounding, some totals may not agree exactly with the sum of their component parts. bIncludes condensate and bitumen. cbp’s share of reserves of equity-accounted entities in the oil production & operations segment. During 2024 gas operations in Angola, Argentina, Bolivia, Mexico and Norway were conducted through equity-accounted entities. dbp’s share of production of equity-accounted entities in the oil production & operations segment. 2022 includes bp’s share of production of Russia joint ventures. eRealizations are based on sales by consolidated subsidiaries only – this excludes equity-accounted entities. | ||||
Expansion in the Gulf We took a final investment decision on the Kaskida project in the US Gulf of America in July. The floating production platform is expected to have a capacity of 80,000 barrels of oil per day from six wells in its first phase. Kaskida will be bp’s sixth hub in the Gulf of America and production is expected to start in 2029. | ||
Progress in Azerbaijan In April we started up oil production from the Azeri Central East (ACE) platform, as part of the Azeri-Chirag-Gunashli development in the Caspian Sea. ACE is bp’s first fully remotely operated offshore platform. Its innovative engineering helps automate labour-intensive processes, supporting safer and more efficient operations as well as helping lower operational emissions. | ||
Redevelopment of Kirkuk On 25 February 2025 bp reached agreement on all contractual terms with the government of the Republic of Iraq to invest in several giant oil fields in Kirkuk providing for the rehabilitation and redevelopment of the fields, spanning oil, gas, power and water with potential for investment in exploration. The agreement is subject to final governmental ratification. | ||
ACE platform in the Caspian Sea, Azerbaijan | ||
bp Annual Report and Form 20-F 2024 | 33 |
Strategic report | ||
Customers & products | ||
Scaling up biofuels We took full ownership of bp bioenergy, one of Brazil’s leading biofuels-producing companies, in October. The acquisition means bp now has the capacity to produce around 50,000 barrels a day of ethanol equivalent from sugar cane through the business’s 11 agro-industrial units across five Brazilian states. | ||
Epic expansion In 2024 we launched our own line of private label consumer-packaged products in the US – epic goods. Initially featuring a few products, the range expanded to over 50 SKUs by the end of 2024. epic goods is available in 1,500 locations across our ampm, TravelCenters of America, Thorntons brands and many of our franchised locations, offering a range of nuts, juices and bottled water. | ||
bp bioenergy, Brazil | ||
Financial and operating performance | ||||
$ million | ||||
2024 | 2023 | 2022 | ||
Sales and other operating revenuesa | 155,401 | 160,215 | 188,623 | |
Profit (loss) before interest and tax | (2,039) | 2,993 | 10,235 | |
Inventory holding (gains) losses« | 479 | 1,237 | (1,366) | |
Replacement cost (RC) profit (loss) before interest and tax | (1,560) | 4,230 | 8,869 | |
Net (favourable) adverse impact of adjusting items«b | 4,077 | 2,183 | 1,920 | |
Underlying RC profit before interest and tax« | 2,517 | 6,413 | 10,789 | |
Of which: | ||||
customers – convenience & mobility | 2,584 | 2,644 | 2,966 | |
Castrol – included in customers | 831 | 730 | 700 | |
products – refining & trading | (67) | 3,769 | 7,823 | |
Taxation on an underlying RC basis | (452) | (1,454) | (2,308) | |
Underlying RC profit before interest | 2,065 | 4,959 | 8,481 | |
Depreciation, depletion and amortization | 3,957 | 3,548 | 2,870 | |
Of which: | ||||
customers – convenience & mobility | 2,135 | 1,736 | 1,286 | |
Castrol – included in customers | 176 | 167 | 153 | |
products – refining & trading | 1,822 | 1,812 | 1,584 | |
Adjusted EBITDA«c | 6,474 | 9,961 | 13,659 | |
Of which: | ||||
customers – convenience & mobility | 4,719 | 4,380 | 4,252 | |
Castrol – included in customers | 1,007 | 897 | 853 | |
products – refining & trading | 1,755 | 5,581 | 9,407 | |
Capital expenditure« | 4,420 | 5,253 | 6,252 | |
Of which: | ||||
customers – convenience & mobility | 2,059 | 3,135 | 1,779 | |
Castrol – included in customers | 227 | 262 | 235 | |
products – refining & trading | 2,361 | 2,118 | 4,473 | |
aIncludes sales to other segments. bSee page 314 for information on the cumulative impact of FVAEs. cA reconciliation to RC profit before interest and tax by business is provided on page 327. | ||||

34 | bp Annual Report and Form 20-F 2024 |
Customers & products continued | ||

Fuelling innovation In July we announced a new strategic partnership with Audi for Formula 1. Through the partnership, we plan to develop the FIA- specified advanced sustainable fuela for Audi's 2026 entry into Formula 1 and through Castrol, we plan to develop lubricants and EV fluids for Audi's V6 turbo engine and electric motor and battery. The collaboration also includes long-term sponsorship, making bp the first official partner of Audi's future Formula 1 factory team. | ||
Charging ahead ADAC, Germany’s leading automobile association with over 20 million members, announced Aral pulse, bp’s EV charging brand in Germany, as their new exclusive EV charging partner from 1 August. The partnership supports Aral pulse’s aim to expand its existing network. Additionally, bp opened our first standalone Aral EV charging Gigahub in Mönchengladbach in November 2024, featuring 28 charge points and a 24/7 smart store. | ||
Audi bp partnership | ||
bp Annual Report and Form 20-F 2024 | 35 |
Strategic report | ||
36 | bp Annual Report and Form 20-F 2024 |
Other businesses & corporate | ||
Financial and operating performance | ||||
$ million | ||||
2024 | 2023 | 2022 | ||
Sales and other operating revenuesa | 2,290 | 2,657 | 2,299 | |
Profit (loss) before interest and tax | (988) | (903) | (26,737) | |
Inventory holding (gains) losses« | — | — | — | |
Replacement cost (RC) profit (loss) before interest and tax | (988) | (903) | (26,737) | |
Net (favourable) adverse impact of adjusting items«b | 380 | 37 | 25,566 | |
Underlying RC profit (loss) before interest and tax« | (608) | (866) | (1,171) | |
Taxation on an underlying RC basis | 292 | 322 | 439 | |
Underlying RC profit (loss) before interest | (316) | (544) | (732) | |
Depreciation, depletion and amortization | 1,033 | 1,008 | 876 | |
Capital expenditure« | 408 | 441 | 549 | |
aIncludes sales to other segments. bSee page 314 for information on the cumulative impact of FVAEs. | ||||
bp Annual Report and Form 20-F 2024 | 37 |
Strategic report | ||
Other businesses & corporate excluding Rosneft | ||||
$ million | ||||
2024 | 2023 | 2022 | ||
Profit (loss) before interest and tax | (988) | (903) | (2,704) | |
Inventory holding (gains) losses | — | — | — | |
Replacement cost (RC) profit (loss) before interest and tax | (988) | (903) | (2,704) | |
Net (favourable) adverse impact of adjusting items | 380 | 37 | 1,533 | |
Underlying RC profit (loss) before interest and tax | (608) | (866) | (1,171) | |
Taxation on an underlying RC basis | 292 | 322 | 439 | |
Underlying RC profit (loss) before interest | (316) | (544) | (732) | |
Rosneft | ||||
$ million | ||||
2024 | 2023 | 2022 | ||
Profit (loss) before interest and tax | — | — | (24,033) | |
Inventory holding (gains) losses | — | — | — | |
Replacement cost (RC) profit (loss) before interest and tax | — | — | (24,033) | |
Net (favourable) adverse impact of adjusting items | — | — | 24,033 | |
Underlying RC profit (loss) before interest and tax | — | — | — | |
Taxation on an underlying RC basis | — | — | — | |
Underlying RC profit (loss) before interest | — | — | — | |
2024 | 2023 | 2022 | ||
Estimated net proved reserves (net of royalties) (bp share) | ||||
Crude oila (mmb) | — | — | — | |
Natural gas liquids (mmb) | — | — | — | |
Total liquids« | — | — | — | |
Natural gas (bcf) | — | — | — | |
Total hydrocarbons« (mmboe) | — | — | — | |
Productionb (net of royalties) | ||||
Crude oila (mb/d) | — | — | 144 | |
Natural gas liquids (mb/d) | — | — | — | |
Total liquids (mb/d) | — | — | 144 | |
Natural gas (mmcf/d) | — | — | 238 | |
Total hydrocarbons (mboe/d) | — | — | 185 | |
aIncludes condensate. b2022 reflects bp's estimated share of Rosneft production for the period 1 January to 27 February only. The estimated share of production for that period has been averaged over the full year. | ||||
38 | bp Annual Report and Form 20-F 2024 |
Sustainability | ||
Net zero operations | Net zero sales | People | Biodiversity | Water | |||||||||||||||
Our aim is to reach net zero« by 2050 or sooner for Scope 1 and 2 emissions within bp’s operational controla, including by maintaining ‘near-zero’ methane intensity« across our operated producing assets, enabled by supportive government policies. | Our aim is to reduce to net zero the average lifecycle carbon intensity of the energy products« we sell by 2050 or sooner, enabled by supportive government policies and the decarbonization of energy demand. | Our aim is to support our employees and local communities through the energy transition. | Our aim is to support biodiversity where we operateb. | Our aim is to reduce our net freshwater use in stressed catchments where we operate. | |||||||||||||||
| | | | | |||||||||||||||
See below | |||||||||||||||||||
bp Annual Report and Form 20-F 2024 | 39 |
Strategic report | ||
Average carbon intensity of sold energy products (gCO2e/MJ)cd | |||||||
2024 | 2023 | 2022 | 2021 | 2020 | 2019 | ||
Average carbon intensity of sold energy products | 79 | 80 | 81 | 81 | 81 | 84 | |
Oil/refined products | 91 | 91 | 92 | 92 | 93 | 95 | |
Gas/NGLs | 67 | 67 | 67 | 67 | 67 | 68 | |
Bioproductse | 41 | 44 | 43 | 44 | 44 | 47 | |
Power/heatf | 50 | 56 | 29 | 27 | 33 | 28 | |
| |
bp.com/ESGdata |

Khazzan gas field, Oman |
Key | |
TCFD | TCFD Recommendations and Recommended Disclosures |
40 | bp Annual Report and Form 20-F 2024 |
Sustainability continued | ||
Aims | Measure/coverage | 2024 performance | 2025 targets | 2030 aims | Aims for 2050 or sooner | ||||||
Net zero operations« | Scope 1 and 2« | 38%a | 20%a | 45-50%a | Net zero« | ||||||
Net zero production« | Scope 3« | 11%a | – | ||||||||
Net zero sales« | Average lifecycle carbon intensityb | 6%cd | 5%d | 8-10%d | Net zero« | ||||||
Reducing methane | Methane intensity« | 0.07%e | 0.20% | Now embedded into net zero operations | |||||||
More $ into transition | Transition growth investment« | $3.7bn | – | ||||||||
Streamlined energy and carbon reporting (SECR) information | ||||||
Further information on our greenhouse gas (GHG) emissions, energy consumption and energy efficiency is set out here and on the following page. It includes disclosures in respect of the SECR requirements. Further breakdown of our GHG and energy data is available in the bp ESG Datasheet 2024 at bp.com/ESG. | ||||||
Operational controlab | Unit | 2024 | 2023 | 2022 | ||
Scope 1 (direct) emissions | MtCO2e | 32.8 | 31.1 | 30.4 | ||
UK and offshore | MtCO2e | 1.0 | 1.0 | 1.0 | ||
Global (excluding UK and offshore) | MtCO2e | 31.8 | 30.1 | 29.4 | ||
Scope 2 (indirect) emissions – location-based | MtCO2e | 2.4 | 2.0 | 2.1 | ||
UK and offshore | MtCO2e | 0.02 | 0.02 | 0.02 | ||
Global (excluding UK and offshore)c | MtCO2e | 2.4 | 1.9 | 2.0 | ||
Scope 2 (indirect) emissions – market-based | MtCO2e | 0.8 | 1.0 | 1.4 | ||
UK and offshorede | MtCO2e | 0.02 | 0.0 | 0.0 | ||
Global (excluding UK and offshore)f | MtCO2e | 0.8 | 1.0 | 1.4 | ||
Energy consumptiongb | GWh | 129,872 | 124,770 | 121,697 | ||
UK and offshore | GWh | 4,526 | 4,688 | 4,376 | ||
Global (excluding UK and offshore) | GWh | 125,347 | 120,082 | 117,321 | ||
Ratio of Scope 1 (direct) and Scope 2 (indirect) emissions to gross productionh | teCO2e/te | 0.16 | 0.16 | 0.15 | ||
UK and offshore | teCO2e/te | 0.13 | 0.13 | 0.12 | ||
Global (excluding UK and offshore) | teCO2e/te | 0.16 | 0.16 | 0.15 | ||
a Operational control data comprises 100% of emissions from activities operated by bp, going beyond the Ipieca guidelines by including emissions from certain other activities such as contracted drilling activities. Read more at bp.com/basisofreporting. b Due to rounding, some totals may not agree exactly to the sum of their component parts. c 2022 restated due to IEA emission factor library update. d 2023 reflects REGOs that had not been retired at the time of publication but are expected to be retired subject to business decisions at the end of the compliance period 31 July 2024. e 2024 reflects REGOs that had not been retired at the time of publication but are expected to be retired subject to business decisions at the end of the compliance period 31 July 2025. f 2022 restated due to consistency of rounding. g Energy content of flared or vented gas is excluded from energy consumption reported as although it reflects loss of energy resources, it does not reflect energy use required for production or manufacturing of products. h Gross production comprises upstream production, refining throughput and petrochemicals produced. | ||||||
bp Annual Report and Form 20-F 2024 | 41 |
Strategic report | ||
Streamlined energy and carbon reporting (SECR) information | ||||||||||
Energy efficiency measures Operational efficiency We take a portfolio view of our project improvement activities at individual sites. This allows us to prioritize the most effective projects, supporting energy efficiency, reduced carbon emissions, and lower costs. During 2024 we completed energy efficiency reviews in three production regions: Azerbaijan, Georgia and Türkiye, Trinidad and Tobago, and the Gulf of America, US. We started an energy efficiency programme in our refining business, and two refineries, Whiting, US and Rotterdam, Netherlands, have completed it. We expect to complete reviews for the remaining production regions and refineries in 2025. Identified opportunities will be advanced through our existing business processes and plans that support our net zero ambition. In 2024, a total of 27 new emission reduction projects contributed to reductions of 0.42MtCO2e. This is in addition to the 172 emissions reduction projects and the associated reduction of 0.9MtCO2e in 2023. These projects are tracked based on GHG reductions and include energy efficiency improvements. Emission reduction projects implemented by our businesses in 2024, included low carbon energy consumption projects, which delivered 102ktCO2e in emissions savings. These reductions were primarily delivered in bpx energy, US and included electrification projects and installation of solar pumps. Emission savings of ~262ktCO2e were achieved through energy efficiency improvements in production processes and flaring process optimization projects during 2024. These included: •Our Gelsenkirchen refinery replaced imported steam from a coal-fired power plant with steam produced in our own gas- fired boilers, reducing emissions by 19ktCO2e. •bpx energy’s central distribution projects, Karnes and Bingo, enabled decommissioning of legacy natural gas- driven equipment, resulting in reduced flare volumes and the switch from natural gas to instrument air in pneumatic devices. •Restoration of cooling water infrastructure at Cherry Point to reliably meet refinery needs and improve the efficiency of compressor operations. | Other types of reduction projects delivered a total reduction of 56ktCO2e, including the hydrocracker improvement project at Cherry Point, US, which saved 26ktCO2e of emissions. As part of managing energy efficiency, we take a portfolio-wide approach to assessing and prioritizing spinning reserve reduction opportunities. Spinning reserve involves running additional power generation machines to provide an excess of energy supply. This can help to protect production from plant vulnerabilities, including power generation reliability. Reducing spinning reserve can increase exposure to power fluctuations for production. We take a risk- based approach when considering reducing the number of running machines. This allows bp to realize emissions and maintenance cost reductions from fewer running machines, while managing the associated production risk. bp is involved in several external groups working on energy efficiency, including the Oil & Gas Climate Initiative (OGCI), the International Association of Oil & Gas Producers (IOGP) and Energy Star. We continue to run an annual training course for new chemical engineers, which includes energy efficiency upskilling, and we offer GHG emissions and energy efficiency training for more experienced engineers and practitioners. Reporting methodology Our approach to reporting GHG emissions broadly follows the Ipieca, API, IOGP Petroleum Industry Guidelines and the GHG Protocol for Reporting GHG Emissions. We calculate GHG emissions based on fuel consumption and fuel properties for major sources, such as flares. We report CO2 and methane. We do not include nitrous oxide, hydrofluorocarbons, perfluorocarbons and sulphur hexafluoride as they are not material to our operations. Energy consumption is monitored and reported centrally from all operated sites by fuel type. This includes all energy, both imported and self-produced, used to run our operations and aligned with our GHG reporting boundary, but excludes energy content of flared or vented gas. Although flaring and venting reflects loss of energy resources, it does not reflect energy use required for production or manufacturing of products. | Ratio of Scope 1 and Scope 2 emissions to gross production bp reports a ratio of Scope 1 and Scope 2 emissions to gross production, see the our Scope 1 and Scope 2 emissions on an operational control boundary basis and uses gross operated sales from our operated oil and gas facilities, refinery throughput and petrochemicals produced. The denominator uses output from production businesses, refineries and petrochemical facilities, which account for 96% of total operated emissions. The intensity ratio has remained the same as 2023. The ratio provided in the SECR table uses production and throughput from our operated upstream, refining and chemicals businesses as a measure of output which can be consistently reported against. We report data on a consolidated basis in the Annual Report and Form 20-F and this differs to the production and throughput used for the ratio in the SECR table, which aligns with the operational control boundary basis. | ||||||||
42 | bp Annual Report and Form 20-F 2024 |
Climate-related financial disclosuresa | ||
TCFD Recommendation: Disclose the organization’s governance around climate-related issues and opportunities. | ||
Recommended Disclosure: a. Describe the board’s oversight of climate-related risks and opportunities. b. Describe management’s role in assessing and managing climate- related risks and opportunities. | ||
bp Annual Report and Form 20-F 2024 | 43 |
Strategic report | ||
Renewables and power update | Included recent progress on, and plans for, offshore wind. Update provided to assist the board in remaining abreast of key energy transition risks and opportunities. | |
Hydrogen and carbon capture and storage transition growth« engine update | Update provided on bp-led projects including the Northern Endurance Partnership, Net Zero Teesside Power and H2Teesside. Assisted the board in remaining abreast of key energy transition risks and opportunities. | |
Energy and economic update | The briefing was given by our chief economist on developments shaping the key political and societal trends currently affecting the energy transition, in advance of publication of the bp Energy Outlook 2024 in July 2024. Briefing assisted the board in remaining abreast of key developments. |
44 | bp Annual Report and Form 20-F 2024 |
Climate-related financial disclosures continued | ||
Resource commitment meeting | Forum for approval of investments related to existing and new lines of business above $250 million or $25 million for acquisitions, or which exceed the relevant EVP financial authority, and any project | |
Group sustainability committee | Provides oversight, challenge and support in the implementation of bp’s sustainability frame and the management of potentially significant non-operational sustainability (including climate-related) risks and opportunities. It met four times in 2024. During 2024 the committee considered progress embedding sustainability, performance against targets and bp’s position on certain strategic sustainability issues that present risks or opportunities to delivery. This committee is chaired by the EVP strategy, sustainability & ventures (SS&V) and comprises members of the bp leadership team. The outputs from the committee are shared with the board and its committees, including the safety and sustainability committee, as appropriate. | |
Group operational risk committee | Provides oversight of safety and operational risk management performance for the group, where appropriate. Climate-related factors may affect certain sources of safety and operational risk, such as severe weather events. | |
Group financial risk committee | Monitors the effectiveness of bp’s financial reporting, systems of internal control and financial risk management, namely material group financial risks. Where appropriate, it considers the planned approach to assurance and verification of non-financial reporting ahead of updating the audit committee. |
Acquired businesses | ||
Integration plans are developed to transition acquired businesses into bp’s system of internal control, over an appropriate timeframe. | ||
bp Annual Report and Form 20-F 2024 | 45 |
Strategic report | ||
Climate governance: management of climate-related matters | ||||||||||||||
As at 1 January 2025 | ||||||||||||||
bp board level | ||||||||||||||
Board | Safety and sustainability committee | Audit committee | People, culture and governance committee | Remuneration committee | ||||||||||
EVP level | ||||||||||||||
CEO | Group sustainability committee Chair: EVP SS&V | Resource commitment meeting Chair: CEO | Group operational risk committee Chair: CEO | Group financial risk committee Chair: CFO | ||||||||||
bp leadership team | ||||||||||||||
SVP level | ||||||||||||||
Sustainability forum Chair: SVP sustainability Focuses on sustainability plans and progress. | Production & operations carbon table Chair: SVP HSE & carbon, P&O Focuses on the delivery of lower carbon plans in P&O – particularly in relation to net zero aims. | Issues and advocacy meeting Chair: SVP external affairs, C&EA Focuses on policy and advocacy issues, including those related to climate matters. | ||||||||||||
Cross bp forums and meetings | ||||||||||||||
Meetings and forums to allow cross-group discussions, integration and implementation. | ||||||||||||||
TCFD Recommendation: Disclose how the organization identifies, assesses and manages climate-related risks. | ||
Recommended Disclosure: a. Describe the organization’s processes for identifying and assessing climate-related risks. | ||
46 | bp Annual Report and Form 20-F 2024 |
Climate-related financial disclosures continued | ||
Recommended Disclosure: b. Describe the organization’s processes for managing climate-related risks. c. Describe how processes for identifying, assessing and managing climate-related risks are integrated into the organization’s overall Risk Management. | ||
bp Annual Report and Form 20-F 2024 | 47 |
Strategic report | ||
TCFD Recommendation: Disclose the actual and potential impacts of climate-related risks and opportunities on the organization’s business, strategy and financial planning where such information is material. | ||
Recommended Disclosure: a. Describe the climate-related risk and opportunities that the organization has identified over the short, medium, and long term. | ||
Offshore facilities | ||
In the case of our offshore facilities, climate change could create greater uncertainty around frequency and/or intensity of severe weather events, such as extreme waves, loop currents, and storms, particularly in the medium to long term. These factors could affect the future risk profile of an asset over its lifetime, and could also impact production or costs. | ||
Water resources | ||
Water resources are increasingly under pressure from various factors, including climate change, and this poses a potential risk to some of our operations that depend on the availability of freshwater. Based on analysis using the World Resources Institute (WRI) Aqueduct Global Water Risk Atlas, and in certain cases review of site-specific local data sources, six of our 16 major operating sites in 2024 were located in regions with high to extremely high water stress. Using WRI data, we have identified the potential for this risk to increase in the medium term. For more on | ||
Recommended Disclosure: b. Describe the impact of climate- related risks and opportunities on the organization’s businesses, strategy, and financial planning. | ||
bp’s plans for the energy transition | ||
In this section we talk about some of our plans for the transition across bp’s business areas and where we do so we have identified these with TP.b We describe below how we believe our strategy and net zero ambition are both good for business and support society’s drive towards the Paris goals. Throughout the strategic report we set out bp’s strategy and plans for the energy transition. This includes our progress against Our progress against our net zero aims are | ||
48 | bp Annual Report and Form 20-F 2024 |
Climate-related financial disclosures continued | ||
#1 The value of our hydrocarbon business could be impacted by climate change and the energy transition. | Changes in policy, legislation, consumer preferences or markets as a result of growing concerns about climate change and the energy transition could reduce demand for fossil fuels or lower their price relative to our financial planning assumptions, particularly in the medium to long term, negatively impacting returns from or the value of our hydrocarbon businesses. Changes in regulations, including carbon pricing and fossil fuel policies, could also impact compliance and operating costs in our oil and natural gas production and refining businesses. Alternatively, demand and/or prices for oil and natural gas and refined products during the next decade could be higher than our financial planning assumptions under certain transition pathways, including those aligned with the Paris Agreement. This could strengthen returns from our hydrocarbon businesses (including securing higher proceeds from assets we choose to divest) which may enable us to deliver enhanced shareholder value, further strengthen our balance sheet and grow investment in the transition, in line with our financial frame. | |
#2 Our ability to grow or deliver expected returns from our transition businesses« could be impacted by the energy transition. | Several factors could restrict the growth of our transition businesses« or returns from them. These factors include: lack of, or insufficient development and application of, policies, regulations and frameworks that support low carbon businesses; insufficient consumer demand for our low carbon offering; strong competition in the market; or the insufficiently rapid development of supporting technologies and infrastructure or constraints on supply chains for low carbon energies. This could particularly impact bp in the short to medium term as we seek to grow our low carbon businesses but could also represent a longer-term risk. Alternatively, demand, policy support or enabling technology and supply chain growth for renewables could support a more rapid portfolio shift with expansion of our low carbon businesses and higher returns from them. Some low carbon businesses, including renewable power, bioenergy and emerging technologies such as hydrogen and carbon capture and storage (CCS), rely on policy support to promote growth. We aim to Changes in customer preferences, pace of technology and infrastructure development and deployment and costs could impact the markets for low carbon products and services. For example, the pace of adoption of electric vehicles (EV) could impact utilization rates, and consequently returns, from our EV charging networks. We recognize that the pace of our transition relative to our core low carbon target sectors and regions is important. If we move more slowly than those markets, we may miss investment opportunities and customers may prefer different suppliers with potential negative consequences to demand for our products and to our reputation. If we move faster than these markets, we risk investing in technologies or low carbon products that are unsuccessful because there is insufficient demand for them. However, our investment may also help to stimulate demand and provide us with a leading position in growth markets. | |
#3 Our ability to implement our strategy could be impacted by changing stakeholder attitudes towards the energy sector, climate change and the energy transition. | Negative perceptions of the energy sector, or bp, could have a number of consequences, for example: adverse litigation; reputational impacts, including our ability to attract and retain talent; and shareholder action. These consequences could affect us in the short, medium or long term. Alternatively, increased support from our stakeholders could enable access to additional capital and new investors, strengthening our ability to deliver our strategy and enabling faster growth of our low carbon businesses. The world is in an ‘energy addition’ phase of the energy transition in which it is consuming increasing amounts of both low carbon energy and fossil fuels. The bp Energy Outlook 2024 (as described on page 7) highlights that, although the structure of energy demand will likely change over the long term, with the importance of fossil fuels declining, replaced by a growing share of low carbon energy, led by wind and solar power, oil and natural gas continue to play a significant role in the global energy system for the next 10-15 years. This requires continuing investment in upstream oil and natural gas. The insights from the bp Energy Outlook 2024 support our view that investment into oil and gas will be needed for decades to come and also that, while the pace and shape of the transition in the long run is uncertain, we continue to see the energy transition as a significant opportunity to grow value. Perceived inconsistencies between the pace of bp’s transition and societal expectations could have reputational and commercial impacts that might impair our ability to deliver our strategy. However, we also see potential to positively differentiate bp, by delivering against our strategy, net zero ambition and sustainability aims. |
bp Annual Report and Form 20-F 2024 | 49 |
Strategic report | ||
50 | bp Annual Report and Form 20-F 2024 |
Climate-related financial disclosures continued | ||
Recommended Disclosure: c. Describe the resilience of the organization’s strategy, taking into consideration different climate-related scenarios, including a 2°C or lower scenario. | ||
bp Annual Report and Form 20-F 2024 | 51 |
Strategic report | ||
52 | bp Annual Report and Form 20-F 2024 |
Climate-related financial disclosures continued | ||
bp Annual Report and Form 20-F 2024 | 53 |
Strategic report | ||
Our approach to testing resilience to transition risk | ||||||||||
Most of our analysis focused on our medium-term time horizon (2030) – far enough ahead to provide a divergent range of scenarios, while not so far ahead that it is unrealistic to attempt to generate credible financial metrics for bp, or an individual business area within bp. For the variable(s) considered most significant (see below), we also assessed resilience over the period 2026-30. Our analysis sought to quantify the potential impact of a range of scenarios, including those consistent with 1.5°C, on bp’s currently held (at the time the analysis was completed) internal reference group business outlook to 2030. This outlook is used for internal corporate planning and holds a current deterministic view of our portfolio, activity set, cost and capital frame. The outlook used in our analysis aligned to the strategic direction shared at the 26 February 2025 Capital Markets Update, and the financials are assessed against the financial priorities set out in that announcement. The steps we took as part of our scenario analysis approach are outlined here at a high level. 1.Whole company assessment: We defined, through quantitative analysis, which business areas could have both the financial scale and clear transition exposures to potentially impact bp’s strategic resilience. a.We assessed the business areas in our portfolio by i) quantitatively evaluating each business area’s ‘potential significance’ by its expected contribution to bp group adjusted EBITDA« in 2030 and therefore the quantum of financial impact that might be put at risk by transition uncertainty (including pathways consistent with 1.5°C); and ii) by identifying, for each, whether there were primary potential value driver(s) that different transition pathways might impact (‘transition risk driver(s)’). This was performed to allocate the most appropriate analysis technique to that business (see 1b and 1c). b.Eleven business areas (see table on expected 2030 adjusted EBITDA, were identified as both providing a potentially significant financial contribution and facing primary transition risk drivers, and accordingly were subjected to the driver- based scenario analysis set out in steps 2a-2c below. c.The remaining business areas were taken forward to a simplified scenario analysis, per step 2d below. | 2.Scenario analysis: We tested the financial impact of transition on all of bp’s business areas in 2030 through either specific ‘driver-based’ scenario modelling (that includes 1.5°C and current policies), or by ’simplified’ conservative scenario analysis, that modelled cases likely to be beyond these ranges. a.For the driver-based scenario analysis, we selected the primary transition risk driver(s) for each business area – the variable(s) from the WBCSD Scenario Catalogue representing what we consider to be the primary driver(s) of that business area’s exposure to the energy transition. For each transition risk driver, we extracted the full range of 2030 outcomes within each scenario ’family’. Given the global nature of the transition risks and opportunities we have identified, we used the ‘world’ values in the Catalogue except for gas b.By calibrating the WBCSD Scenario Catalogue 2030 scenarios to relevant business metrics underpinning our strategic planning (for example, oil price or EV demand/utilization), we modelled the impact of each variable, across the full range of scenarios and each scenario family, on the 2030 expected earnings (adjusted EBITDA) for the associated business area(s). For example, we applied an earnings rule of thumb deemed appropriate to the period in question to the deviation of oil prices in WBCSD versus our reference case price. This analysis was unmitigated (see ’Other key considerations’). c.This enabled us to assess the potential for each scenario to materially impact group adjusted EBITDA in 2030 (and by implication associated cash flows), against the reference group business outlook. By modelling the specific business area within the reference group business outlook (described in step 1b above), its exposure to the most extreme range of the respective scenario could be assessed to identify which (if any) variables(s) and scenario(s) could have the potential to impact strategic resilience (as defined below) most materially, and as such, which business areas should be carried forward into a multi-year resilience assessment. d.For the simplified scenario analysis, we took a simpler conservative approach, by evaluating whether a scenario in which each business area’s expected 2030 adjusted EBITDA is assumed to be reduced to zero – an outcome at least | as detrimental to that business area’s adjusted EBITDA as could reasonably be expected to result from ranges associated with the trajectory of each of the 1.5°C, 2°C or BAU scenario families – could have the potential to impact strategic resilience (as defined below) materially. 3.Multi-year resilience test: This step tested bp’s resilience to the exposure of any sufficiently material business areas to downside scenarios that may have the potential to jeopardize the ability to generate surplus cash flow« and a strong cash cover ratio and gearing level – financial metrics that were treated for the purposes of the analysis as representing financial evidence of delivery of bp’s strategic financial priorities (see below). From step 2, in 2024, only the exposure to oil price was assessed as sufficiently material in this sense, and hence carried forward for multi-year resilience analysis. Our multi- year (2026-30) oil price resilience test considered sustained low oil prices consistent with the most extreme WBCSD Scenario Catalogue scenarios – interpolating between the minimum price for 2025 (the UN PRI Inevitable Policy Response Forecast Policy Scenario) at $55.0/bbl, and the minimum for 2030 (the UN PRI Inevitable Policy Response Required Policy Scenario) at $34.2/bbl (both 2022 $ real). Other scenarios, from providers such as IEA and NGFS, formed part of the WBCSD data set, but indicated higher prices than the UN PRI cases used. Other key considerations •For the purposes of steps 2 and 3, we considered the resilience of our strategy to climate-related transition risk through We defined the following as proxy indicators for these lenses: –Positive group surplus cash flow, to demonstrate whether after funding, among other things, capital spend within our disclosed capital frame (26 February 2025 Capital Markets Update) and a resilient dividend per ordinary share, sufficient surplus cash flow remains to maintain or reduce net debt and such that excess cash can be shared with investors through share buybacks over the period. –Healthy cash cover ratio and gearing« as indicators of the ability to maintain a strong investment grade credit rating. | ||||||||
54 | bp Annual Report and Form 20-F 2024 |
Climate-related financial disclosures continued | ||
•For steps 2 and 3, we made the simplifying assumption that, aside from the driver being modelled, our strategy, operating model, cost basis, volumes, margins, sales proceeds and tax rates would remain unchanged out to 2030a. •There are a range of mitigations or actions that we might naturally be expected to experience (e.g. through deflation) or to take in response to external market, price and demand trends, including cost reductions, portfolio adjustments, distributions, capital reallocation or capital reductions within the frames set out in our strategy. •For step 3, given we would seek to make use of opportunities to maintain our strategic flexibility in the face of the many uncertainties of the energy transition, our methodology retains the optionality in downside scenario modelling to apply some or all of these mitigations. | •The design of a strategic resilience analysis involves numerous methodological choices and assumptions – any one of which could reasonably have been different, leading to different outcomes. We have found value in conducting this analysis; however, we are mindful of the limitations to any such exercise and the highly qualified nature of any conclusions which may be drawn from it. The disclosures provided here should be read in conjunction with the rest of our strategic report, where we discuss how we have developed, and continue to evolve, our approach to strategy. •As outlined above, we utilized our latest internal reference group business outlook as the basis against which resilience has been tested, as this is our latest deterministic view against which to model the transition sensitivities to 2030 and aligns to the strategic update provided to investors in February 2025. Alongside disclosed elements such as the capital frame range to 2030, this includes shaping assumptions such as future distribution and net debt management. | •Through conducting this analysis, we do not intend to imply or commit to a specific forward trajectory of usage of cash, beyond any disclosed in the investor update in February 2025 or other published strategy updates. While we cannot disclose, for confidentiality reasons, the detail of the deterministic case, the test assesses whether the resilience indicators in our reference group business outlook are impacted by the transition uncertainties tested. Further, by the nature of the timeframes considered, a variety of uncertainties exist around this deterministic case (including transition risk itself). •Where rules of thumb have been applied, to convert variance in hydrocarbon price to variance in adjusted EBITDA, these are deemed appropriate to the period in question – i.e. they reflect the portfolio’s price leverage over the period to 2030. Due to the evolution of bp’s portfolio, these rules of thumb may diverge from any short-term rule of thumb that we publish. | ||||||||
WBCSD Scenario Catalogue family ranges for 2030 key transition variables | ||||||||
BAU | Below 2°C | 1.5°C | ||||||
Business area | TCFD/WBCSD variable | Min | Max | Min | Max | Min | Max | |
Oil and natural gas production | Oil priceb ($2022/bbl) | 63.67 | 85.00 | 50.00 | 77.34 | 34.2 | 71.12 | |
Natural gas pricec ($2022/mmbtu) | 3.77 | 4.38 | 2.50 | 4.38 | 2.40 | 5.24 | ||
Refining | – refined oil demand | Primary energy demand for oil (% vs 2020) | -0.2 | 14.2 | 1.6 | 6.4 | -18 | -1 |
– biojet demand | Final demand for liquid biofuels in aviation (EJ/yr) | 0.16 | 0.5 | 0.16 | 1.01 | 0.25 | 1.51 | |
Biogas | Biogas demand in road transport (EJ/yr) | 0.00 | 0.19 | 0.01 | 0.29 | 0.00 | 0.35 | |
bp bioenergy | Biofuel consumption in transport (EJ/yr) | 0.84 | 6.05 | 0.84 | 7.08 | 1.45 | 7.12 | |
EV charging | Final energy demand for electricity in road transport (EJ/yr) | 3.02 | 6.97 | 3.86 | 6.90 | 3.64 | 7.08 | |
Aviation fuel sales | Liquid fuel consumption in aviation (EJ/yr) | 14.67 | 16.99 | 13.85 | 16.91 | 11.94 | 14.61 | |
Conventional fuels retail | Final energy demand for liquid oil in road transport (EJ/yr) | 75.09 | 81.65 | 74.35 | 76.82 | 59.00 | 73.41 | |
Conventional fuels midstream | ||||||||
Conventional road lubricants | ||||||||
Renewables | Renewable capacity additions (GW vs 2020) | 3,969 | 7,217 | 3,024 | 8,223 | 4,002 | 10,473 | |
Hydrogen production | Hydrogen consumption (Mt/yr) | 3.97 | 12.67 | 4.18 | 25.45 | 5.68 | 70.00 | |
bp Annual Report and Form 20-F 2024 | 55 |
Strategic report | ||
TCFD Recommendation: Disclose the metrics and targets used to assess and manage relevant climate- related risks and opportunities where such information is material. | ||
TCFD recommended disclosures – metrics and associated targets/goals | ||||
a) Disclose the metrics used by the organization to assess material climate-related risks and opportunities in line with its strategy and risk management process. | c) Describe the targets used by the organization to manage climate-related risks and opportunities and performance against targets. | |||
Transition risks | ||||
•Oil and natural gas prices used for value-in-use impairment testing and recoverability of asset | ||||
Physical risks | ||||
Climate-related opportunities | ||||
Capital deployment | ||||
Internal carbon prices | ||||
Remuneration | ||||
b) Disclose Scope 1, Scope 2, and, if appropriate, Scope 3 greenhouse gas (GHG) emissions, and the related risks | ||||
GHG emissions | ||||
•A further breakdown of our GHG and energy data by business group is available in the bp ESG Datasheet 2024 at bp.com/ESG. | ||||
56 | bp Annual Report and Form 20-F 2024 |
Sustainability continued | ||
| |
2024 | 2023 | 2022 | ||
Severe vehicle accident rate per million km driven | 0.022 | 0.023 | 0.037 |
2024 | 2023 | 2022 | ||
Tier 1 and tier 2 process safety events« | 38 | 39 | 50 | |
Oil spills – number | 96 | 100 | 108 | |
Oil spills – contained | 49 | 52 | 57 |
bp Annual Report and Form 20-F 2024 | 57 |
Strategic report | ||
As at 31 December 2024 | Male | Female | Female % | ||||
2024 | 2023 | 2024 | 2023 | 2024 | 2023 | ||
Board directors | 5 | 6 | 6 | 6 | 55 | 50 | |
Leadership team | 5 | 4 | 5 | 7 | 50 | 64 | |
Group leaders | 186 | 193 | 100 | 102 | 35 | 34 | |
Subsidiary« directors | 519 | 384 | 253 | 174 | 33 | 31 | |
All employeesa | 62,000 | 51,800 | 38,300 | 35,900 | 38 | 41 | |
As at 31 December 2024 | 2024 | 2023 | 2022 | |
Gas & low carbon energy | 6,500 | 4,800 | 4,200 | |
Oil production & operations | 9,200 | 8,800 | 8,600 | |
Customers & productsb | 73,100 | 63,400 | 44,700 | |
Other businesses & corporate | 11,700 | 10,800 | 10,100 | |
Totalc | 100,500 | 87,800 | 67,600 | |
a Some employees have not disclosed gender, therefore are not included in this total. b This figure includes bp bioenergy, which bp took full ownership of in 2024. c For 2024, this figure reflects new acquisitions and companies we have taken full ownership of including bp bioenergy and Lightsource bp. | ||||
| |
People, culture and governance committee |
58 | bp Annual Report and Form 20-F 2024 |
Sustainability continued | ||
| |
bp Gender and Ethnicity Pay Gap Report, bp.com/ukgenderpaygap |
bp Annual Report and Form 20-F 2024 | 59 |
Strategic report | ||
| |
| |
bp.com/codeofconduct |
| |
bp Tax Report, bp.com/tax |
Key | |
TCFD | TCFD Recommendations and Recommended Disclosures |
60 | bp Annual Report and Form 20-F 2024 |
Sustainability continued | ||
| |
bp.com/tradeassociations |
People |
| |
bp.com/humanrights |
Biodiversity |
| |
bp.com/biodiversity |
Water |
| |
bp.com/ESGdata |
bp Annual Report and Form 20-F 2024 | 61 |
Strategic report | ||
How we manage risk and risk factors | ||
Our risk management activities | ||||||
The board and committees | Oversight and governance Set policy and monitor principal risks | |||||
Leadership team and committees | ||||||
Business and strategic risk management Plan, manage performance and assure | ||||||
Businesses and functions | ||||||
Day-to-day risk management Identify, manage and report risks | ||||||
Facilities, assets and operations | ||||||


Board and committees | |||
•bp board. •Audit committee. •Safety and sustainability committee. •Remuneration committee. •People, culture and governance committee. | |||
Leadership team and committees | |||
•Leadership team meeting – for oversight and for strategic and commercial risks. •Group operations risk committee – for health, safety, security, environment and operations integrity risks. •Group financial risk committee – for finance, treasury, trading and cyber risks. •Group disclosure committee – for financial and non-financial reporting risks. •People and culture committee – for employee risks. •Group ethics and compliance committee – for legal and regulatory compliance and ethics risks. •Group sustainability committee – for non-operational sustainability risks. •Resource commitment meeting – for investment decision risks. •bp quarterly internal audit meeting – for assurance on the oversight of bp’s principal risks. | |||
| |||
Acquired businesses | ||
Integration plans are developed to transition acquired businesses into bp’s system of internal control and risk management framework, over an appropriate timeframe. | ||
62 | bp Annual Report and Form 20-F 2024 |
How we manage risk and risk factors continued | ||
bp Annual Report and Form 20-F 2024 | 63 |
Strategic report | ||
64 | bp Annual Report and Form 20-F 2024 |
How we manage risk and risk factors continued | ||
bp Annual Report and Form 20-F 2024 | 65 |
Strategic report | ||
| |
| |
Financial statements – Note 29 |
66 | bp Annual Report and Form 20-F 2024 |
How we manage risk and risk factors continued | ||
| |
| |
bp Annual Report and Form 20-F 2024 | 67 |
Strategic report | ||
| |
| |
Financial statements – Note 29 |
68 | bp Annual Report and Form 20-F 2024 |
Compliance information | ||
bp non-financial and sustainability information statement Produced in compliance with Sections 414CA and 414CB of the Companies Act. Information incorporated by cross reference. | ||||||
Requirement | Relevant policies and standards | Information related to policies and any due diligence processes | ||||
a Environmental matters | •Net zero aims •TCFD •Sustainability frame •Biodiversity position (online) | |||||
b Employees | •bp values and code of conduct (online) | |||||
c Social matters | •Sustainability frame | |||||
d Respect for human rights | •Business and human rights policy (online) •Modern slavery statement (online) •Labour rights and modern slavery principles (online) •Code of conduct (online) | |||||
e Anti-corruption and anti-bribery | •Anti-bribery and corruption policy •Code of conduct (online) | |||||
Description of principal risks relating to matters (a-e above) | ||||||
Relevant information | ||||||
Business model description | ||||||
Description of non-financial KPIs | ||||||
TCFD index tablea Our TCFD disclosures can be found on the following pages. | ||||||
TCFD Recommendation | TCFD Recommended Disclosure | Where reported | ||||
Governance Disclose the organization’s governance around climate-related issues and opportunities. | a Describe the board’s oversight of climate-related risks and opportunities. | |||||
b Describe management’s role in assessing and managing climate-related risks and opportunities. | ||||||
Strategy Disclose the actual and potential impacts of climate-related risks and opportunities on the organization’s business, strategy and financial planning where such information is material. | a Describe the climate-related risks and opportunities the organization has identified over the short, medium, and long term. | |||||
b Describe the impact of climate-related risks and opportunities on the organization’s businesses, strategy, and financial planning. | ||||||
c Describe the resilience of the organization’s strategy, taking into consideration different climate-related scenarios, including a 2°C or lower scenario. | ||||||
Risk management Disclose how the organization identifies, assesses and manages climate-related risks. | a Describe the organization’s processes for identifying and assessing climate-related risks. | |||||
b Describe the organization’s processes for managing climate-related risks. | ||||||
c Describe how processes for identifying, assessing, and managing climate-related risks are integrated into the organization’s overall risk management. | ||||||
Metrics and targets Disclose the metrics and targets used to assess and manage relevant climate-related risks and opportunities where such information is material. | a Disclose the metrics used by the organization to assess climate-related risks and opportunities in line with its strategy and risk management process. | |||||
b Disclose Scope 1, Scope 2, and, if appropriate, Scope 3 GHG emissions, and the related risks. | ||||||
c Describe the targets used by the organization to manage climate-related risks and opportunities and performance against targets. | ||||||
Section 172 statement In accordance with the requirements of Section 172 of the Companies Act 2006 (the Act), the directors consider that, during the financial year ended 31 December 2024, they have acted in a way that they consider, in good faith, would most likely promote the success of the company for the benefit of its members as a whole, having regard to the likely consequences of any decision in the long term and the broader interests of other stakeholders, as required by the Act. | ||||||
| ||||||
bp Annual Report and Form 20-F 2024 | 69 |
Corporate governance | ||

Thunderhorse, US Gulf of America |
Introduction from the chair | |
Board at a glance | 71 |
Board of directors | |
Leadership team | |
Governance framework | |
Board activities | |
Our stakeholders | |
Key decisions | |
Safety and sustainability committee | |
Audit committee | |
People, culture and governance committee | |
Remuneration committee | |
Directors’ remuneration report | |
Other disclosures | |
70 | bp Annual Report and Form 20-F 2024 |
Introduction from the chair | ||
 | |
| |
Our governance framework is designed to be dynamic, flexible and robust. | |
bp Annual Report and Form 20-F 2024 | 71 |
Corporate governance |
Board at a glance | ||||||||||||||||||
Board meeting attendance | Committee membership | Skills and experience | ||||||||||||||||
8 scheduled | 2 ad hoc | Audit | Remuneration | People, culture and governance | Safety and sustainability | Society, politics and geopolitics | Technology, digital and innovation | People leadership and organizational transformation | Operational excellence and risk management | Global business leadership and governance | Finance, risk and trading | Energy markets | Climate change and sustainability | |||||
Non-executive directorsa | ||||||||||||||||||
Helge Lund (Chair) | 8/8 | 2/2 | ò | ò | ò | ò | ò | ò | ò | |||||||||
Dame Amanda Blanc | 8/8 | 2/2 | ò | ò | ò | ò | ò | ò | ò | ò | ||||||||
Tushar Morzaria | 8/8 | 2/2 | ò | ò | ò | ò | ò | ò | ||||||||||
Melody Meyerb | 8/8 | 1/2 | ò | ò | ò | ò | ò | ò | ||||||||||
Pamela Daley | 8/8 | 2/2 | ò | ò | ò | ò | ò | |||||||||||
Hina Nagarajan | 8/8 | 2/2 | ò | ò | ò | ò | ò | ò | ò | |||||||||
Satish Paic | 7/8 | 2/2 | ò | ò | ò | ò | ò | ò | ò | |||||||||
Karen Richardsonc | 7/8 | 2/2 | ò | ò | ò | ò | ò | ò | ||||||||||
Dr Johannes Teyssen | 8/8 | 2/2 | ò | ò | ò | ò | ò | ò | ò | ò | ||||||||
Executive directors | ||||||||||||||||||
Murray Auchincloss (CEO) | 8/8 | 2/2 | ||||||||||||||||
Kate Thomson (CFO)d | 7/7 | 1/1 | ||||||||||||||||
ò Chair of the committee | ||||||||||||||||||
ò Member of the committee | ||||||||||||||||||
Non-executive directors’ tenure | Board ethnic diversity | Board gender diversity | ||||||||||
March 2025 | March 2024 | March 2025 | March 2024 | March 2025 | March 2024 | |||||||
¢ 1. 1-3 years | 3 | 6 | ¢ 1. White British or other white (including minority-white groups) | 8 | 10 | ¢ 1. Female | 6 | 7 | ||||
¢ 2. 4-6 years | 5 | 3 | ¢ 2. Asian/Asian British | 3 | 3 | ¢ 2. Male | 5 | 6 | ||||
¢ 3. 7-9 years | 1 | 2 | ||||||||||
3 | 55% | |||||||||||
directors who identify as from a minority ethnic background | of directors are female | |||||||||||
a Paula Rosput Reynolds and Sir John Sawers stepped down from the board on 25 April 2024 and attended all meetings held prior to this date. b Melody was unable to attend the ad hoc meeting in June due to an existing external commitment. c Satish and Karen were unable to attend the scheduled meeting in June due to existing external commitments. d Kate was appointed to the board on 2 February 2024 and attended all meetings held after this date. | ||||||||||||


72 | bp Annual Report and Form 20-F 2024 |
Board of directors | ||
Helge Lund Chair |
 |
Appointed Board: 26 July 2018; chair: 1 January 2019 |
Nationality Norwegian |
External appointments |
•Chair of Novo Nordisk AS. •Operating advisor to Clayton Dubilier & Rice. •Member of the Board of Trustees of the International Crisis Group. •Member of the European Round Table for Industry. |
Significant past appointments |
•Chief executive of BG Group. •President and chief executive officer of Equinor and Aker Kvaerner. •Executive of Aker RGI and Hafslund Nycomed. •Non-executive director of Schlumberger and Nokia. •Consultant at McKinsey & Company. •Parliamentary group political advisor of the Conservative party, Norway. |
Key skills and experience |
•Distinguished career as a leader in the energy sector with deep industry knowledge and global business experience. •Drives cohesion, constructive challenge and oversight of bp’s strategy through forward looking leadership of the board. |

Dame Amanda Blanc Senior independent director |
  |
Appointed 1 September 2022 |
Nationality British |
External appointments |
•CEO of Aviva plc. •Member of the Association of British Insurers Board. |
Significant past appointments |
•Began career as a graduate at Commercial Union, one of Aviva’s ancestor companies, and held several senior executive roles across the insurance industry. •Group CEO at AXA UK, PPP & Ireland. •CEO of Europe, Middle East, Africa & Global Banking at Zurich Insurance Group. •Leadership positions at Groupama Insurance Company and Commercial Union. •Member of the Prime Minister’s Business Council. |
Key skills and experience |
•Experience leading insurance businesses in the UK and across Europe. •Wide-ranging board, industry and regulatory experience. |
Committee members key | |||||||||
Chair | Audit committee | Safety and sustainability committee | Remuneration committee | People, culture and governance committee | |||||
 |  |  | | | |||||

Murry Auchincloss Chief executive officer |
Appointed Executive director: 1 July 2020; chief executive officer: 17 January 2024 |
Nationality Canadian and British |
Significant past appointments |
•Joined Amoco in 1992 and then bp when the two companies merged in 1998. •Senior roles in finance and management at bp, across tax, business development, mergers and acquisitions and performance management. •Chief of staff to bp chief executive officer. •CFO BP p.l.c. |
Key skills and experience |
•Drives bp’s strategy as an integrated energy company and has extensive experience and knowledge of the energy sector. •Provides deep insight into bp’s assets and businesses through broad experience across the group, extensive financial expertise and experience. |

Tushar Morzaria Independent non-executive director |
  |
Appointed 1 September 2020 |
Nationality British |
External appointments |
•Non-executive director of Legal & General Group plc. •Non-executive director of BT Group plc. |
Significant past appointments |
•Various senior roles at JP Morgan, including CFO of its Corporate & Investment Bank. •Group finance director and member of the board of Barclays PLC 2013 to 2022. •Non-executive chairman of EMEA Investment Banking, Barclays until 2024. |
Key skills and experience |
•Over 25 years of strategic financial management, investment banking, operational and regulatory experience. •Breadth of knowledge and insight into financial, tax, treasury, investor relations and strategic matters and strong experience in delivering corporate change programmes while maintaining a focus on performance. |

Kate Thomson Chief financial officer |
Appointed 2 February 2024 |
Nationality British |
External appointments |
•Board member of Aker BP ASA. •Member of the European Round Table for CFOs. •Member of the 100 Group Main Committee. |
Significant past appointments |
•Joined bp in 2004. •Group head of tax, BP p.l.c. •Group treasurer, BP p.l.c. •SVP finance for production & operations, BP p.l.c. |
Key skills and experience |
•Has a detailed understanding and experience of the energy sector and provides deep technical insight from her broad experience of leading teams across the group in tax, treasury and commercial finance. |

Melody Meyer Independent non-executive director |
 |
Appointed 17 May 2017 |
Nationality American |
External appointments |
•Non-executive director of AbbVie Inc. •Non-executive director of Airswift Parent LLC. |
Significant past appointments |
•President of Chevron Asia Pacific E&P until 2016 after 37 years of service in key leadership roles in global exploration and production. |
Key skills and experience |
•Deep understanding of the factors influencing safe, efficient and commercially high-performing projects in a global organization. •Expertise in the execution of major capital projects, technology, R&D, creation of businesses in new countries, strategic business planning, merger integration, leading change, and safe and reliable operations. |

bp Annual Report and Form 20-F 2024 | 73 |
Corporate governance | ||
Pamela Daley Independent non-executive director |
|
Appointed 26 July 2018 |
Nationality American |
External appointments |
•Director of BlackRock, Inc. |
Significant past appointments |
•Various senior executive roles at General Electric Company (GE), including senior vice president of business development 2004 to 2013. •Senior vice president and senior advisor to the chair at GE in 2013. •Director of BG Group plc 2014 to 2016. •Director of Patheon N.V. 2016 to 2017. •Partner at Morgan, Lewis & Bockius. •Director of SecureWorks, Inc. 2016 to 2025. |
Key skills and experience |
•Board-level experience of the UK oil and gas industry and executive experience in highly regulated industries. •Qualified lawyer with a wealth of global business and strategic experience. |

Hina Nagarajan Independent non-executive director |
|
Appointed 1 March 2023 |
Nationality Indian |
External appointments |
•Managing director and CEO of United Spirits Limited (Diageo India). •Member of the global executive committee of Diageo plc. •Board member of The Advertising Standards Council of India. •Director and co-chair of International Spirits and Wines Association of India. |
Significant past appointments |
•Leadership positions at Reckitt, Mary Kay India and Nestlé India with over 30 years in the fast-moving consumer goods (FMCG) industry. •Non-executive director at two companies which were publicly quoted at the time: Guinness Ghana Breweries Plc and Seychelles Breweries Limited. |
Key skills and experience |
•Deep and wide-ranging experience in customer-focused FMCG businesses in complex emerging markets. •Extensive experience in assessing climate-related risks and opportunities. |

Karen Richardson Independent non-executive director |
|
Appointed 1 January 2021 |
Nationality American |
External appointments |
•Partner at Artius Capital Partners. •Non-executive director of Artius II Acquisition Inc. •Non-executive director (lead independent director) of Exponent, Inc. |
Significant past appointments |
•Senior operating roles in the public and private technology sector. •Vice president of sales at Netscape Communications Corporation 1995 to 1998. •Senior executive roles at E.piphany from 1998, including CEO 2003 to 2006. •Non-executive director of BT plc 2011 to 2018. •Director of Worldpay Inc. (Worldpay Group plc) 2016 to 2019. •Chair of Origin Materials Inc. 2021 to 2024. |
Key skills and experience |
•Extensive knowledge of digital, technology, cyber and IT security matters. •30 years’ technology industry experience including working with innovative Silicon Valley companies. |

Dr Johannes Teyssen Independent non-executive director |
|
Appointed 1 January 2021 |
Nationality German |
External appointments |
•Senior advisor to Kohlberg Kravis Roberts. •President of Alpiq Holding Ltd. •Senior advisor to Viridor Limited. |
Significant past appointments |
•Several leadership positions at VEBA AG (merged with VIAG AG in 2000 and renamed to E.ON AG and later to E.ON SE). •Member of the board of management of the E.ON Group’s central management company in Munich in 2001 and E.ON SE in 2004. •Vice-chair of E.ON SE, 2008 and CEO, 2010 to 2021. •President of Eurelectric 2013 to 2015. •Vice-chair of the World Energy Council, responsible for Europe, 2006 to 2012. •Member of the supervisory board of Salzgitter AG 2006 to 2016 and Deutsche Bank AG 2008 to 2018. |
Key skills and experience |
•Extensive experience and deep knowledge of the energy sector and its continuing transformation. •Considerable knowledge and experience of climate-related risk oversight. |

Satish Pai Independent non-executive director |
|
Appointed 1 March 2023 |
Nationality Indian |
External appointments |
•Managing director of Hindalco Industries Limited. •Director of Novelis Inc. •Non-executive director, Aditya Birla Management Corporation Ltd. •Director, Indian Institute of Metals. |
Significant past appointments |
•Executive vice president, worldwide operations and other engineering and management roles at Schlumberger across 28 years of service. |
Key skills and experience |
•Accomplished and transformative executive with operations and technology experience in the resources and energy industries. •Strong digital capability and experience. |

Ben J S Mathews Company secretary |
Appointed 7 May 2019 |
Role and career summary |
Ben joined bp as company secretary in May 2019. He is the co-chair of the Corporate Governance Council of the Conference Board and is a Fellow of the Chartered Governance Institute. Ben serves on the executive committee of the Association of General Counsel and Company Secretaries of the FTSE 100 (GC100), having previously served as its chair for four years. Ben’s global company secretary team is responsible for providing advice and support to the plc board and the boards of other legal entities in the bp group. The team’s vision is to enhance stakeholder value through dynamic corporate governance. Former appointments include Group Company Secretary of HSBC Holdings plc and Rio Tinto plc. |

For further detail on the directors’ climate change and sustainability experience, see biographical information for each director is available online at bp.com/whoweare. | ||
74 | bp Annual Report and Form 20-F 2024 |
Leadership team | ||
William Lin EVP gas & low carbon energy |
Leadership team tenure Appointed on 1 July 2020 |
Nationality American |
Board memberships |
William is a non-executive director of Pan American Energy Group, the largest independent energy company in Argentina. He is also a member of the supervisory board for Corbion, a Dutch-listed global food ingredients and biochemicals company. He chairs Corbion’s Sustainability & Safety Committee and is a member of the Audit Committee. |
Career summary |
William has worked at bp for 29 years and now leads the group’s global natural gas and low carbon businesses and markets. Prior to this role, he held other senior management positions including the chief operating officer for upstream regions, regional president for Asia Pacific, and vice president for gas developments and operations for Egypt. |

Gordon Birrell EVP production & operations |
Leadership team tenure Appointed on 1 July 2020 |
Gordon previously served on bp’s executive team starting on 12 February 2020. |
Nationality British |
Board memberships |
Gordon is a non-executive director of Azule Energy Holdings Ltd. |
Career summary |
Before being appointed to his new role, Gordon was chief operating officer for production, transformation and carbon. In his bp career, Gordon has spent time in various leadership, technical, safety and operational risk roles, including four years as bp president Azerbaijan, Georgia and Türkiye. Gordon is a Fellow of the Royal Academy of Engineering. |

Kerry Dryburgh EVP people, culture & communications |
Leadership team tenure Appointed on 1 July 2020 |
Nationality British |
Board memberships |
None |
Career summary |
Kerry leads people, culture & communications at bp. Kerry previously headed HR for bp’s upstream business while also serving as group chief talent officer. She has held a series of senior HR positions across the company, including running HR for bp’s shipping, integrated supply and trading, and corporate functions. She brings vast experience from other sectors in Europe and Asia, having worked at both BT and Honeywell. |

Emma Delaney EVP customers & products |
Leadership team tenure Appointed on 1 July 2020 |
Emma previously served on bp’s executive team starting on 1 April 2020 |
Nationality Irish |
Board memberships |
None |
Career summary |
Emma has spent 28 years working in bp, both in the upstream and the downstream. Prior to joining bp’s executive team on 1 April 2020, she was regional president for West Africa. She has held a variety of senior roles including upstream chief financial officer for Asia Pacific and head of business development for gas value chains. In downstream she held roles in retail and commercial fuels and planning. |

Emeka Emembolu EVP technology |
Leadership team tenure Appointed on 18 April 2024 |
Nationality British |
Board memberships |
None |
Career summary |
Emeka started his career working offshore as an engineer and has spent 25 years with bp. Prior to being appointed EVP technology, Emeka spent two years as chief of staff to the CEO. Before joining the executive office, he led bp's North Sea business as region SVP spearheading improvements in operational safety, driving efficiencies and growing the value of the business. Prior to that, he held a range of senior technical leadership roles in the Gulf of America, Canada, North Africa and Alaska and in the subsurface function. |

Mike Sosso EVP legal |
Leadership team tenure Appointed on 1 January 2024 |
Nationality American |
Board memberships |
None |
Career summary |
Mike took on the role of EVP legal in January 2024. In his role, Mike is accountable for leading the legal function and executing the legal strategy for the group. Mike joined bp in 2011 and has held a number of leadership positions across legal. He also previously held the role of VP ethics and compliance. Prior to joining bp, Mike practised law in the Washington, DC office of Skadden, Arps, Slate, Meagher & Flom. |

Giulia Chierchia EVP strategy, sustainability & ventures |
Leadership team tenure Appointed on 1 July 2020 |
Nationality Belgian and Italian |
Board memberships |
Giulia is a non-executive director of Schneider Electric. |
Career summary |
Giulia joined bp in April 2020 as EVP strategy, sustainability & ventures. In her role, Giulia drives bp’s strategy and sustainability agenda and embeds the group’s ethics and compliance within the organization. She oversees bp’s venturing investments business, which supports bp’s transition and net zero ambition. Prior to bp, she worked for McKinsey, where she was a senior partner. She led the global downstream oil and gas practice and was a key member of the chemicals, and electricity, power and natural gas practices, helping companies shape their strategies for the energy transition. |

Carol Howle EVP supply, trading & shipping |
Leadership team tenure Appointed on 1 July 2020 |
Nationality British |
Board memberships |
None |
Career summary |
Before taking on her current role, Carol ran bp shipping and was the chief operating officer for integrated supply and trading, oil. She has more than 20 years’ experience in the energy industry, and many in integrated supply and trading. Her previous roles include chief operating officer for natural gas liquids, regional leader of global oil Europe and finance. Carol also served as the head of the group chief executive’s office. |

bp Annual Report and Form 20-F 2024 | 75 |
Corporate governance | ||
Governance framework | ||
Board of directors | ||||||||||||||||
Non-executive directors | Executive directors | |||||||||||||||
Chair | Senior independent director | Independent non-executive directors | Chief executive officer | Chief financial officer | Company secretary | |||||||||||
76 | bp Annual Report and Form 20-F 2024 |
Board activities: promoting long-term sustainable success | ||
In 2024 the board and its committees held regular meetings as needed to address business requirements. Agendas were set in advance by the chair, CEO, and company secretary, focusing on four pillars of strategy, performance, people, and governance. The board's activities, supported by its committees, spanned these pillars. Notably, overseas trips to both Houston, US, and across India allowed the board to engage directly with a range of stakeholders. Highlights of the board’s activities, discussions and approvals during the year are provided below. | |||||||
Strategy | Performance | ||||||
Strategic direction TCFD •Worked closely with the CEO and his leadership team to establish a new purpose and strategy reset for bp. •Discussed strategic progress and options at every board meeting, including deep-dives into our transition businesses«. Macroeconomics TCFD •The review of our strategic direction was informed by regular updates on macroeconomic and geopolitical factors affecting our strategy, plan and performance. Mergers and acquisitions pipeline •Regular reviews of potential merger, acquisition and divestment opportunities, including transition and low carbon. TCFD •Approved the acquisition of transition business, bp Bunge •Approved the final investment decision for Kaskida which will be bp’s sixth hub in the Gulf of America. Offsites •The board's site visits this year included: –Permian Basin, Gulf of America. –bp Houston in the US. –The Castellón refinery in Spain. –Castrol Patalganga plant and bp’s business and technology centers in Pune, in India. –Our Reliance-operated KG D6 gas facility in India. Technology •Received an update on digital, including its functional reorganization, the development of new strategic partnerships (Palantir, Infosys) and priorities for 2025. •Participated in a deep-dive session on the potential deployment of generative artificial intelligence solutions across bp businesses. Safety and sustainability TCFD •Reviewed ongoing updates on safety measures and performance. •Focused its sustainability aims on those most relevant to the long- term success of its businesses and to its net zero ambition | Annual plan •Reviewed and approved the 2024 annual plan that considered capital allocation (including transition businesses) to improve the balance sheet. TCFD •Reviewed full-year delivery against the 2023 plan, and monitored progress against 2024 objectives. Financial frame and distributions •Evaluated potential enhancements and simplifications to the financial frame. •Regularly reviewed shareholder distribution options in alignment with the financial frame. Capital expenditure •Received an update from the CEO at every board meeting covering projects across all bp’s businesses and, where appropriate, climate-related considerations. TCFD These updates included any inorganic or divestment opportunities of more than $100 million. Acquisition reviews •Evaluated progress on the integration of transition businesses, Archaea Energy and TravelCenters of America. TCFD Principal risks •Analysed trends and themes arising from risk management reports. •Performed mid-year and full-year reviews of bp’s principal and emerging risks, including those related to climate. TCFD Internal controls •Evaluated the group’s internal control and risk management systems as part of the review and approval of the bp Annual Report and Form 20-F. •Received reports from group risk and internal audit, no specific concerns were identified, and the board concluded that the systems remain resilient, fit for purpose, and aligned with external | ||||||
Key | |||||||
TCFD | TCFD Recommendations and Recommended Disclosure | ||||||


Highlights of the year | ||||||||
January – March | April – June | |||||||
February: •Site visit to bpx energy and Archaea, US. •People, culture and governance; remuneration; audit; and safety and sustainability committee meetings, including Q4 results, London. •Board meeting, London. March: •People, culture and governance; remuneration; and audit committee meetings, virtual. •Board meeting, virtual. | April: •People, culture and governance committee meeting, virtual •Remuneration committee meeting, virtual •Annual General Meeting, London May: •Audit committee and board meetings, including Q1 results, virtual. June: •Houston, US, board programme including a safety and sustainability committee site visit to the Permian Basin and Gulf of America and a trading and shipping floor walk with the audit committee. •Ad-hoc board meeting, virtual. | |||||||
Permian Basin, US | Argos platform, US Gulf of America | |||||||
bp Annual Report and Form 20-F 2024 | 77 |
Corporate governance | ||
People | Governance | |||||
Engagement •Participated in the workforce engagement programme (WFEP), bringing employee feedback into the boardroom and therefore allowing board decisions to be better informed of stakeholder views •Met with high-potential employees to help improve the board's visibility of the executive succession pipeline. •Held town halls and undertook site visits to increase director interaction with the workforce in those locations (further information Culture •Received feedback from Pulse employee surveys, agreeing actions and initiatives in response. •Reviewed the annual ethics and compliance report, and the function’s priorities and objectives. •Approved the scope of the newly named people, culture and governance committee. Conflicts of interest •Approved an amended conflicts of interest policy that integrated mandatory disclosure and reporting requirements for relationships at work. Succession planning •Supported by the people, culture and governance committee, the board received updates on succession plans for the board, and undertook a review of leadership development initiatives, including succession plans for the bp leadership team. | Corporate governance framework •Approved changes to the terms of reference for the board and committees to align with regulatory changes under the revised UK Corporate Governance Code and to reflect evolving governance practices at bp. Board composition / director changes •Following a comprehensive selection process, appointed Murray Auchincloss as the permanent chief executive officer with effect from 17 January 2024, and Kate Thomson as chief financial officer and board member on 2 February 2024. •Appointed Dame Amanda Blanc as senior independent director (SID) with effect from 25 April 2024. •Appointed Tushar Morzaria as interim remuneration committee chair with effect from 25 April 2024. •Appointed Hina Nagarajan and Johannes Teyssen as additional members of the people, culture and governance committee with effect from 6 May 2024. Director training and knowledge sessions •Completed online training on topics including the code of conduct and cyber security. •Participated in a number of deep-dive sessions during the year on relevant topics such as artificial intelligence. Board effectiveness review •Conducted an externally facilitated board and committee performance review led by the chair and company secretary (see Investor engagement •The chair, senior independent director, remuneration committee chair, SVP investor relations and company secretary held a number of investor meetings with shareholders representing around 30% of the share capital. | |||||
July – September | October – December | |||||||
July: •People, culture and governance; remuneration, audit; and safety and sustainability committee meetings, including Q2 results, London. •Board meeting, London. •Safety and sustainability committee site visit to Castellón refinery, Spain. September: •India board programme, including safety and sustainability committee site visit to Castrol Patalganga and audit committee site visit to Pune. | October: •Audit committee; board; and results committee meetings, including Q3 results. November: •People, culture and governance; remuneration; audit and safety and sustainability committee meetings, London. •Board meeting, London. December: •Audit committee meeting, virtual | |||||||
bp office in Pune, India | Castrol, Pangbourne, UK | |||||||


78 | bp Annual Report and Form 20-F 2024 |
Our stakeholders | ||
| |
Our Section 172(1) statement describes how the directors have had regard to the matters set out in Section 172(1)(a) to (f) Further information on the board’s activities and key decisions, including how stakeholder interests have been | ||
bp office in Pune, India | ||

Stakeholders key ò Investors and shareholders ò Customers ò Workforce ò Governments and regulators ò Partners and suppliers ò Society | |
bp Annual Report and Form 20-F 2024 | 79 |
Corporate governance | ||
Key decisions | ||
Resetting our strategy | ||||||
The board approved a reset of bp’s strategy and reallocation of capital to drive growth and improved performance, as announced at the Capital Markets Update on 26 February 2025. This announcement followed extended workshops and board discussions with members of the bp leadership team at each board meeting since September 2023, leading to what the board believes is a clear and distinctive strategic direction, an investable financial proposition, with a simpler narrative, sustainability framework, financial frame and metrics. Throughout the process, the board explored what drives valuation growth across three quantitative pillars – growth, profitability, and risk – along with qualitative factors like investor proposition, market confidence, and the company’s performance during the year. | bp’s investors want to see consistent operational and financial performance, together with strategic clarity with less complexity. The board discussed choices on capital allocation and efficiency, balance sheet resilience and share buyback guidance. When looking at the potential strategic options, the board also considered bp’s sustainability framework. Recognizing the feedback to become a simpler and more understandable organization, the board considered the perspectives of various stakeholders including investors and our employees before approving the five focused sustainability aims of net zero operations«, net zero sales«, people, water and biodiversity. | Throughout the process the board explored potential scenarios, opportunities, and risks. This ultimately led to decisions being taken that the board believes will best maximize bp’s prospect of achieving its objectives and fulfilling its purpose. The board believes the strategy remains consistent with the goals of the Paris Agreement. Recognizing that the component parts of this update are important to many stakeholder groups, the board remains committed to the energy transition. Stakeholders considered òòòòòò | ||||
An integrated energy company | ||||||
As an integrated energy company, bp continues to invest with discipline in both the upstream« and low carbon energy. In 2024, the board approved key investment decisions in each of these segments. In July, bp took a final investment decision for a sixth operated hub, Kaskida, in the US Gulf of America. This strategic growth project represents bp’s ongoing commitment to invest in this prolific high-margin basin, and makes up an important element of growing the value of bp. This platform is expected to have production capacity of 80,000 barrels of oil per day and will embrace a more simplified, standardized and cost-efficient platform design that we plan to replicate in future projects, unlocking potential for the development of 10 billion barrels of discovered resources in place in the Paleogene, Gulf of America. | Together with our partners we reached financial close for two major carbon capture and storage (CCS) projects in Teeside in the north-east of England: the Northern Endurance Partnership (NEP) and Net Zero Teesside Power (NZT Power). NEP, through its CO2 transport and storage system, will help develop and underpin a lower carbon future for industry in the region. NZT Power, a gas-fired power station with CCS, will provide flexible low carbon power into the UK national power grid. The two projects will capture and transport millions of tonnes of CO2 and the board noted the potential from these projects to support thousands of jobs through their construction and operation. | The NZT Power and NEP decisions were taken following extensive dialogue with multiple stakeholders, including discussions with governments regarding local policies and with our customers to ensure an accessible market. The board recognized the contribution of the NZT Power and NEP decisions to bp’s strategic priorities, including the high grading of our hydrogen and CCS projects and the role these projects can play in helping advance the UK’s journey to net zero. In the US, the board was supportive of the high-value growth opportunity presented by Kaskida and the contribution it could make to deliver secure, reliable and affordable energy. Stakeholders considered òòòòòò | ||||
80 | bp Annual Report and Form 20-F 2024 |
Safety and sustainability committee | ||
Melody Meyer Safety and sustainability committee chair | ||

|
The committee undertook a number of site visits to engage with employees and observe bp’s safety and sustainability culture and performance in person. |
Meetings and attendance | |
The committee met five times during 2024. Regular attendees included SVP internal audit, EVP production & operations, EVP strategy, sustainability & ventures, SVP HSE and carbon, SVP safety and operational risk assurance, SVP sustainability and VP internal audit – safety and sustainability. | |
Non-executive directors | Five scheduled meetings |
Melody Meyer: member (from May 2017), chair of the committee (from November 2019) | 5/5 |
Satish Pai: membera | 4/5 |
Sir John Sawers: member (until April 2024) | 1/1 |
Johannes Teyssen: member | 5/5 |
a Satish Pai was unable to attend the scheduled meeting in June due to an existing external commitment. | |
bp Annual Report and Form 20-F 2024 | 81 |
Corporate governance | ||

 | Sustainability initiatives at Castrol, India – September 2024 The committee observed first-hand several of Castrol’s innovative sustainability initiatives, including ambient temperature blending, electricity optimization measures and its strategy to use 100% renewable energy from the local grid. The trip was also an opportunity to hear from the local team how it has improved safety performance through digitization, including automated maintenance management. | |||||||||
The local team provided the S&SC with an insight into its implementation of the 5-Point Plan and other PSIPs. | ||||||||||
Castellón refinery, Spain | ||||||||||
Insights from Castellón refinery, Spain – July 2024 During the S&SC’s trip to Castellón refinery the team provided an insight into its implementation of the 5-Point Plan and other PSIPs. The team also briefed the committee on the cascading of learnings following a fatality on-site in 2021, including consequent reinforcement of the Life Saving Rules on-site and piloting of a bespoke safety programme (Safety in Mind) to embed human performance principles of safety on-site. In addition, the committee was briefed on plans to develop the asset’s green hydrogen« operations. | ||||||||||
Castrol plant, India | ||||||||||


82 | bp Annual Report and Form 20-F 2024 |
Audit committee | ||
Tushar Morzaria Audit committee chair | ||

|
The committee oversaw significant change in bp’s reporting processes in the year. |
Meetings and attendance | |
The committee met nine times during 2024. Regular attendees included the chief financial officer (CFO), SVP accounting, reporting and control, SVP internal audit, EVP legal, and the external auditor. | |
Non-executive directors | Nine scheduled meetings |
Tushar Morzaria: member (from September 2020), chair of the committee (from May 2021) | 9/9 |
Pamela Daley: member | 9/9 |
Paula Reynolds: member (until April 2024) | 2/2 |
Karen Richardson: member | 9/9 |
Hina Nagarajan: membera | 8/9 |
Financial expertise | ||
The board is satisfied that •Tushar Morzaria, the chair of the committee, has recent and relevant financial experience as required by the UK Corporate Governance Code and that he is competent in accounting and auditing in accordance with the FCA’s Disclosure Guidance and Transparency Rules. •The committee has an appropriate and experienced blend of commercial, financial and audit expertise to assess the issues it is required to address, as well as competence in the relevant sector in which bp operates. •As a US foreign private issuer, the committee meets the independence criteria provisions of Rule 10A-3 of the US Securities Exchange Act of 1934, and Tushar Morzaria can be regarded as an audit committee financial expert as defined in Item 16A of Form 20-F. | ||
bp Annual Report and Form 20-F 2024 | 83 |
Corporate governance | ||
bp North American headquarters, Houston, US | |||
US site visit – June 2024 The committee engaged with a range of internal stakeholders during the board’s visit to the US in 2024. They toured the supply, trading and shipping activities in Houston, an important part of bp’s portfolio, with a focus on biogas, natural gas and power, and met with the local leadership team. | |||


bp office in Pune, India | |||
India site visit – September 2024 During the committee’s visit to India, the directors met internal stakeholders based in Pune, ending with a session with the local leadership team. As part of their floor walks across bp’s sites, the committee engaged with the finance, business and technology team on their growth story, portfolio and accomplishments. | |||
84 | bp Annual Report and Form 20-F 2024 |
Audit committee continued | ||
Key accounting judgements and estimates | Audit committee activity | Conclusions/outcomes | ||||
Impact of climate change and the energy transition TCFD | ||||||
Climate change and the transition to a lower carbon economy may have significant impacts on the currently reported amounts of the group’s assets and liabilities and on similar assets and liabilities that may be recognized in the future. | •Reviewed management’s best estimate of oil and natural gas price assumptions for value-in-use impairment testing and investment appraisal. •Reviewed management’s determination that its best estimate of oil and natural gas prices is in line with a range of transition paths consistent with the goals of the Paris climate change agreement. | •Management’s revised best estimate of oil and natural gas prices are in line with a range of transition paths consistent with the goals of the Paris climate change agreement. •See Financial Statements – Note 1 for more details on how bp applies carbon pricing in its impairment testing, sensitivity analyses estimating effects of changes in net revenue and changes in the expected timing of decommissioning. | ||||
bp Annual Report and Form 20-F 2024 | 85 |
Corporate governance | ||
Key accounting judgements and estimates | Audit committee activity | Conclusions/outcomes | ||||
Provisions | ||||||
The group holds provisions primarily for decommissioning, environmental remediation and litigation. The most significant provision is for the future decommissioning of oil and natural gas production facilities and pipelines. Estimation uncertainty exists as most of these events are many years in the future. Assumptions are made by bp in relation to cost estimation, settlement dates, technology, legal requirements and discount rates. There is also a risk that decommissioning obligations from previously divested assets revert to bp. | •Received briefings on decommissioning (including the process for managing the risk of decommissioning reversion), environmental, asbestos and litigation provisions. These included the requirements, governance and controls for the development and approval of cost estimates and provisions in the financial statements. •Reviewed and challenged the group’s discount rates for calculating provisions. | •Decommissioning provisions of $11.8 billion were recognized on the balance sheet at 31 December 2024. •The discount rate used by bp to determine the balance sheet obligation at the end of 2024 was a nominal rate of 4.5% based on long-dated US government bonds, an increase of 0.5% from 2023. | ||||
Recoverability of asset carrying values | ||||||
Determination as to whether and how much an asset (including exploration intangibles), cash generating unit (CGU) or group of CGUs containing goodwill is impaired involves management judgement and estimates on uncertain matters such as future commodity prices, discount rates, production profiles, reserves and the impact of inflation on operating expenses. Judgement is required to determine whether it is appropriate to continue to carry intangible assets related to exploration costs on the balance sheet. | •Reviewed policy and guidelines for compliance with oil and gas reserves disclosure regulation, including the group’s reserves governance framework and controls. •Reviewed and challenged the group’s oil and gas price assumptions. •Reviewed and challenged the group’s discount rates for impairment testing purposes. •Impairment charges, reversals and ‘watch-list’ items were reviewed in the quarterly due diligence process. | •The group’s price assumption for Brent oil and for and Financial Statements – Note 1. •Sensitivity analyses estimating the effect of changes in net revenue and discount rate assumptions have been disclosed in Financial Statements – Note 1. •Net impairment charges of $5.2 billion as disclosed in Financial Statements – Note 4. •Exploration intangibles totalled $4.4 billion at 31 December 2024. | ||||
Taxation | ||||||
Computation of the group’s income tax expense and liability, the provisioning for potential tax liabilities and the level of deferred tax asset recognition are underpinned by management judgement and estimation of the amounts which could be payable. Judgement is also required when determining whether a particular tax is an income tax or another tax type. | •Received regular updates on the group’s tax risk exposures and deferred tax asset recognition. •Reviewed the judgements exercised over tax risk provisioning as part of its annual review of key provisions. | •Deferred tax assets of $5.4 billion were recognized on the balance sheet at 31 December 2024. •The calculation of tax risk provisions is consistent with IAS 37 and IFRIC 23. | ||||
Pensions | ||||||
Accounting for pensions and other post-employment benefits involves making estimates when measuring the group’s pension plan surpluses and deficits. These estimates require assumptions to be made about uncertain events, including discount rates, inflation and life expectancy. | •Reviewed and challenged the group’s assumptions used to determine the projected benefit obligation at the year end, including the discount rate, rate of inflation, salary growth and mortality levels. | •At 31 December 2024, surpluses of $7.5 billion and deficits of $4.9 billion were recognized on the balance sheet in relation to pensions and other post- employment benefits. •The method for determining the group’s assumptions remained largely unchanged from 2023. The values of these assumptions and a sensitivity analysis of the impact of possible changes on the benefit expense and obligation are provided in Financial Statements – Note 24. | ||||
Supplier finance arrangements | ||||||
The group’s trade payables include certain supplier finance arrangements that utilize letter of credit facilities and promissory notes. Judgement is required to assess trade payables subject to supplier financing arrangements to determine whether they should continue to be classified as trade payables and give rise to operating cash flows or finance debt and financing cash flows. | •Received a briefing on the group’s supplier finance arrangements. •Reviewed the group’s proposed enhanced disclosures in relation to Amendments to IAS 7 ' Statement of Cash Flows' and IFRS 7 'Financial Instruments: disclosures' relating to supplier finance arrangements. | •bp had liabilities of $7.4 billion, $1.8 billion and $0.4 billion, respectively, in respect of letters of credit, promissory notes and reverse factoring arrangements that are presented within trade and other payables at 31 December 2024. • The disclosures required by the Amendments to IAS 7 ' Statement of Cash Flows' and IFRS 7 'Financial Instruments: disclosures' relating to supplier finance arrangements are included in Financial Statements – Note 29. | ||||
Derivatives | ||||||
For its level 3 derivative financial instruments, bp estimates their fair values using internal models due to the absence of quoted market pricing or other observable, market-corroborated data. Judgement may be required to determine whether contracts to buy or sell commodities meet the definition of a derivative, in particular LNG contracts. | •Received a briefing on the group’s trading risks and reviewed the system of risk management and controls in place. •Reviewed the control process and risks relating to the trading business. •Received updates on accounting judgements on LNG contracts. | •bp has assets and liabilities of $16.0 billion and $14.4 billion, respectively, recognized on the balance sheet for level 3 derivative financial instruments at 31 December 2024, mainly relating to the activities of the trading & shipping function. bp’s use of internal models to value certain of these contracts has been disclosed in Financial Statements – Note 1. •bp considers that contracts to buy or sell LNG do not meet the definition of a derivative under IFRS. | ||||
86 | bp Annual Report and Form 20-F 2024 |
People, culture and governance committee | ||
Helge Lund People, culture and governance committee chair | ||

|
2024 has been a busy year for the committee, with a strong focus on leadership succession and development. |
Meetings and attendance | ||
The committee met seven times during 2024. The CEO and EVP people, culture & communications regularly attend these meetings. | ||
Non-executive directors | Six scheduled meetings | One ad hoc meeting |
Helge Lund: member (from July 2018), chair of the committee (from September 2018) | 6/6 | 1/1 |
Dame Amanda Blanc: membera | 6/6 | 0/1 |
Dr Johannes Teyssen: member (from April 2024) | 3/3 | 1/1 |
Hina Nagarajan: member (from April 2024) | 3/3 | 1/1 |
Paula Rosput Reynolds: member (until April 2024)b | 2/3 | 0/0 |
Sir John Sawers: member (until April 2024) | 3/3 | 0/0 |
a Dame Amanda was unable to attend the ad hoc meeting in October due to an existing external commitment. b Paula was unable to attend the scheduled meeting in February due to an existing external commitment. | ||
bp Annual Report and Form 20-F 2024 | 87 |
Corporate governance | ||
Diversity statistics and outcomes | ||
As at 31 December 2024, 55% of the board were women, two senior board positions were held by women and three directors identified as being from a minority ethnic background, which exceeds the UK Listing Rules targets. For further numerical data on the ethnic background and gender identity or sex of bp's board and executive management, in line with the UK Listing As at 31 December 2024, senior management, defined as the leadership team (being the first layer of management below board level) and the company secretary, in accordance with the UK Corporate Governance Code 2018, and their direct reports comprised 50% women (2023 51%) and 29% Black, Asian and other ethnic minority individuals (2023 26%). bp has an ethnicity ambition to 2025, read |
88 | bp Annual Report and Form 20-F 2024 |
Directors’ remuneration report | ||
Tushar Morzaria Interim remuneration committee chair | |
| |
2024 has been a challenging year operationally but one in which bp has set the foundations for growth as a simpler, more efficient business. | |
Meetings and attendance | ||
The chair and the chief executive officer (CEO) are standing attendees, except for matters relating to their own remuneration. The CEO is consulted on remuneration of the chief financial officer (CFO) and the leadership team, and receives input from the committee on remuneration across the wider workforce. Both the CEO and CFO are consulted on matters relating to the group’s performance and the metrics adopted for each performance cycle. bp’s EVP people, culture & communications, SVP reward, external advisors and other executives may attend where necessary. The committee consults other board committees on the group’s performance and on issues relating to the exercise of judgement or discretion as necessary. The committee met seven times during 2024 and all directors attended each meeting. | ||
Non-executive directors | Six scheduled meetings | One ad-hoc meeting |
Tushar Morzaria: member (September 2020), interim chair of the committee (April 2024)a | 6/6 | 1/1 |
Paula Rosput Reynolds: member (September 2017), chair of the committee (May 2018 to April 2024)a | 2/2 | 1/1 |
Dame Amanda Blanc: member | 6/6 | 1/1 |
Pamela Daley: member | 6/6 | 1/1 |
Melody Meyer: member | 6/6 | 1/1 |
a Paula Rosput Reynolds stepped down from the board at the 2024 AGM. Tushar Morzaria was appointed as interim remuneration committee chair from this date. | ||
Contents | |||
Remuneration at a glance | |||
Engaging with our workforce | |||
Executive directors’ pay for 2024 | |||
2024 annual bonus outcome | |||
2022-24 performance share plan outcome | |||
Policy implementation for 2025 | |||
Stewardship and executive director interests | |||
Chair and non-executive director outcomes and interests | |||
bp Annual Report and Form 20-F 2024 | 89 |
Corporate governance | ||
90 | bp Annual Report and Form 20-F 2024 |
Directors’ remuneration report continued | ||
bp Annual Report and Form 20-F 2024 | 91 |
Corporate governance | ||
Remuneration at a glance | ||
Key performance highlights in 2024 | |||||||||
$27.3bn | $38.0bn | +2% | •Agreed to form offshore wind JV with JERA Co., Inc., divesting non-core assets. •100% ownership of bp bioenergy and Lightsource bp. •Delivered $0.8 billion structural cost reduction«. •Start-up of a major project« and sanctioned a further 10 projects. | ||||||
operating cash flow« Resilient financial performance | adjusted EBITDA« | upstream production 2,358mboe/d 2024 production | |||||||
Total remuneration in 2024 | ||||||
Single figure | ||||||
Chief executive officer | Chief financial officer | |||||
¢ 1. Salary and benefits | £5.4m | £1.9m | ||||
¢ 2. Cash allowance in lieu of pension | 35% Fixed pay | 50% Fixed pay | ||||
¢ 3. Annual bonus | ||||||
¢ 4. Performance shares | ||||||
65% Variable pay | 50% Variable pay | |||||


Pay outcomes in 2024 | |||||||
Annual bonus 2024 | Performance shares 2022-24 | ||||||
22.5% of maximum formulaic outcome | 66.5% of maximum formulaic outcome | ||||||
¢ Safety and sustainability ¢ Operations ¢ Financials | ¢ Strategic progress ¢ rTSR ¢ Financials | ||||||
Alignment with shareholders | ||||
Share ownership Share ownership is a key means by which the interests of executive directors are aligned with those of shareholders. | Murray Auchincloss (CEO) | 6.1 times salary, 1,888,476 shares | ||
Kate Thomson (CFO) | 2.6 times salary, 437,799 shares | |||
¢ Actual Policy requirement | ||||


92 | bp Annual Report and Form 20-F 2024 |
Remuneration at a glance continued | ||
Application of remuneration policy for 2025 | |||||||||
2025 | 2026 | 2027 | 2028 | 2029 | 2030 | 2031 | ||||||
Fixed pay (salary, pension and benefits) | •Upon appointment in 2024, the CEO’s and CFO’s salaries were set at £1.45 million and £0.8 million respectively. Their salaries remained unchanged in respect of 2024. •For 2025, Murray's salary will increase by 4% in line with the wider workforce. Kate’s salary will increase by 8%, reflecting her performance and development in role since appointment. | |||||||||||
Annual bonusa | •CEO’s max opportunity: 225% of salary. •CFO’s max opportunity: 225% of salary. •For 2025, a structural cost reduction measure has been introduced to the bonus scorecard (see below). | |||||||||||
Performance shares | •CEO’s max opportunity: 500% of salary. •CFO’s max opportunity: 450% of salary. •For 2025-27, an adjusted free cash flow CAGR measure has been introduced to the performance shares scorecard (see below). | |||||||||||
Shareholding requirement | •In-employment and post-employment guidelines will continue to apply. |


Alignment of 2025 variable remuneration with strategy | ||||

Net zero by 2050 or sooner | Financial frame | Strategy | ||
Annual bonus | ||||
Safety and sustainability (30%) | ||||
Tier 1 and tier 2 process safety events« | ò | |||
Operated carbon emissions | ò | ò | ||
Financials and operations (70%) | ||||
Modified free cash flow« ($bn) | ò | ò | ||
Structural cost reductions« ($bn) | ò | ò | ||
bp-operated reliability« and availability« | ò | |||
Performance shares | ||||
Cumulative reduction % in operated carbon emissions (15%) | ò | |||
Relative TSR (25%) | ò | |||
ROACE« (20%) | ò | ò | ||
Adjusted free cash flow CAGR« (20%) | ò | ò | ||
Strategic progress (20%) | ò | |||
bp Annual Report and Form 20-F 2024 | 93 |
Corporate governance | ||
Directors’ remuneration report continued | ||
Alignment of executive and workforce remuneration | ||||
All employees | Element of remuneration | Executive directors | ||
Salary is the basis for a competitive total reward package for all employees, and we conduct an annual salary review for all non-unionized employees. In setting pay budgets, we assess how employee pay is currently positioned relative to market rates, wage inflation, forecasts and business context. | Salary | The salaries of our executive directors are reviewed annually, along the same timeline as the wider workforce. The review of salaries will take into account the same factors considered for the wider workforce. Salary increases for executive directors will typically be at or below the workforce rate, other than in specific circumstances. | ||
We operate different pension plans by location and for those parts of our business where market practice is markedly different, e.g. our retail business. For our population of non-retail employees in the UK, we provide a flexible cash benefits allowance of 20% of salary. The benefits available are aligned with competitive market practice in our different jurisdictions. | Pensions and benefits | Executive directors receive a cash allowance in lieu of pension aligned with the wider workforce (currently 20% of salary). Other than the provisions of car, security and tax preparation related benefits, benefit packages are broadly aligned with those of other employees in the UK. | ||
More than half of the eligible workforce participate in an annual cash bonus plan that multiplies a grade-based target bonus amount by a bp performance factor derived from the bonus scorecard. Select participants may be nominated to receive an uplift to their bonus outcome, reflecting their personal contribution and impact. We operate different bonus plans for those distinct parts of our business where market practice is markedly different. | Annual bonus | The annual bonus for the executive directors is linked to the same bp performance factor as for the wider workforce. Executive directors are not entitled to a bonus uplift linked to individual performance. For executive directors, a portion of any award is deferred into shares for three years. The deferral rate depends on whether the executive director has met their minimum shareholding requirement. | ||
We operate share plans with three-year vesting for all our senior leaders. Opportunity varies across two broad tiers: group leaders (approximately 300) and senior-level leaders (approximately 4,500). | Performance shares | Executive directors are eligible for performance share awards, which are subject to stretching performance targets over a three-year period. An additional three-year post-vesting holding period applies for executive directors. | ||
94 | bp Annual Report and Form 20-F 2024 |
Directors’ remuneration report continued | ||

Workforce engagement bp places particular importance on engaging with employees, recognizing that it is critical to have an engaged workforce to deliver our strategy. We aim to have an open dialogue between the board, senior management and the wider workforce and encourage employees to share their views. For example, employees are kept regularly informed of matters of interest to them through bp's intranet, social media channels, town halls, site visits and webinars. During 2024, we continued to actively seek employee views through a variety of discussion groups. We held a number of employee-led forums and consulted our business resource groups, with a board-led session as part of the workforce engagement programme (WFEP) in May 2024 (see right). More detail on bp's WFEP can be found on | | ||||||
We have worked to develop a bp where our people can be themselves and work in a company that cares while also delivering results... | |||||||
Employees at our Cherry Point refinery, US | |||||||
Shareholder views We are committed to ongoing engagement with our shareholders. We believe it is important to meet regularly to understand their views on our remuneration arrangements and their evolving expectations. Feedback received frames our decisions on executive pay and other topics. | Employee forum In May 2024 we held a WFEP session with selected employees from different locations across the globe. The session was led by Dame Amanda Blanc, senior independent director, and Kerry Dryburgh, EVP people, culture & communications. The focus of the session was on performance, reward and employee engagement, with employees taking the opportunity to share their personal views and experiences of working at bp. In the session, individuals commented on the strong sense of culture at bp, referencing how our values are clearly present in day-to-day activities. The recent changes to reward, such as the introduction of a bonus uplift relating to individual performance, were also well received and considered motivational. Key themes of the session were shared with the committee and have provided valuable insight. | ||||||
| |||||||
bp.com/reportingcentre | |||||||
Oak Tree retail site, Surrey, UK | |||||||

bp Annual Report and Form 20-F 2024 | 95 |
Corporate governance | ||
Murray Auchinclossb thousand 2024 | Kate Thomsonc thousand 2024 | Murray Auchinclossb thousand 2023 | ||
Salary | £1,450 | £731 | £1,015 | |
Benefits | £132 | £67 | £338 | |
Cash allowance in lieu of pension | £290 | £146 | £190 | |
Annual bonusd | £734 | £370 | £1,839 | |
Performance sharese,f | £2,750 | £575 | £4,362 | |
Total remuneration | £5,356 | £1,889 | £7,744 | |
Total fixed remuneration | £1,872 | £944 | £1,543 | |
Total variable remuneration | £3,484 | £945 | £6,201 |
96 | bp Annual Report and Form 20-F 2024 |
Directors’ remuneration report continued | ||
 | |  | |||||||
Safety and sustainability | Operations | Financials | Formulaic score | ||||||
22.5% | 0% | 0% | 22.5% out of 100% | ||||||

Categories | Measures | Threshold (0%) | Target (50%) | Maximum (100%) | Weight | Outcome | ||||
Safety and sustainability (30% weight) | Tier 1 process safety events« | 14 | 9 | 5 | 7.5% | 7.5% | ||||
Actual: 3 | ||||||||||
Tier 2 process safety events« | 39 | 33 | 26 | 7.5% | 2.5% | |||||
Actual: 35 | ||||||||||
Operated carbon emissions (MtCO2e) | 38.2 | 35.5 | 32.8 | 15% | 12.5% | |||||
Actual: 33.7a | ||||||||||
Operations (20% weight) | bp-operated reliability« and availability« | 95.1% | 95.9% | 96.7% | 10% | 0% | ||||
Actual: 94.7% | ||||||||||
Transition growth« engine adjusted EBITDA % growth (vs. 2023) | 50% | 100% | 150% | 10% | 0% | |||||
Actual: Below threshold | ||||||||||
Financials (50% weight) | Modified free cash flow« ($bn) | 13.2 | 14.7 | 16.2 | 25% | 0% | ||||
Actual: 12.5 | ||||||||||
Adjusted EBITDA« ($bn) | 39.4 | 40.9 | 42.4 | 25% | 0% | |||||
Actual: 38.0 | ||||||||||
Formulaic outcome (out of 100%) | 22.5% | |||||||||


Formulaic scorecard outcome 22.5% out of 100% | | Application of framework on fatalities No reduction (see page 98) | | Remuneration committee judgement No adjustment | | 22.5% out of 100% |
bp Annual Report and Form 20-F 2024 | 97 |
Corporate governance | ||
98 | bp Annual Report and Form 20-F 2024 |
Directors’ remuneration report continued | ||

| |
bp.com/investors |
Framework on fatalities | ||||
¢ 1. Operations (20%) | ||||
¢ 2. Safety and sustainability (30%) | ||||
¢ 3. Financial (50%) | ||||


Safety and sustainability committee | ||
Influence | Foreseen | Nature of deficiency |
Remuneration committee | ||
Collective responsibility | Meaningful adjustment | Judgement within a frame |
Treatment of new assets | ||

What happened during the year? | How was the framework applied? | |||||||
Our goal is eliminating fatalities, life-changing injuries and tier 1 process safety events. Safety performance in 2024 During the year, we made good progress in reducing the number of tier 1 events with our lowest recorded number on record – continuing the downward trend we have seen in recent years. For tier 2 events, there was an increase compared to 2023. This result is reflective of our efforts to improve process safety at bp. However, this positive performance was overshadowed by the sad news of a fatality in our newly acquired biofuels business (acquired on 1 October 2024) during the year. The incident occurred in mid-October 2024 in Brazil during maintenance activities. While there were no other fatalities during 2024, there were four life-changing injuries. We are taking action to learn from these incidents to help us make further improvements from a personal safety perspective. | The committee consulted the framework in determining the impact of the individual fatality on the 2024 bonus outcome. Treatment of new assets The framework allows for major acquisitions to be excluded for an initial period to enable the embedding of bp’s safety culture, operating systems and practices. While a fatality in an excluded new asset will not impact the group bonus score during this transition period, there will be consideration of safety performance within this business during the year – with any adjustments being made locally. Biofuels incident In September 2024, prior to the completion of the acquisition, the committee determined that the biofuels business should be excluded for three bonus performance years (i.e. up to the 2026 performance year) for bp employees. This is reflective of the complexity of the business, with over 8,800 employees and 5,600 contractors operating in 11 mills across Brazil. The acquisition completed on 1 October 2024. From this date, bp had direct operational accountability and was able to start the process of onboarding our Operating Management System (OMS)«. The fatality occurred mid-October and therefore within the exclusion period for the group scorecard. | |||||||
No adjustment | ||||||||
What was the outcome? | ||||||||
In line with our framework, the committee determined that applying a discretionary adjustment to the formulaic outcome on group-wide bp staff for the fatality in the newly acquired biofuels business would not be appropriate. The incident is, however, expected to have a material impact on local bonus outcomes – with final determinations being made after the business’ year-end in March. | ||||||||
resulting in a final bonus score of 22.5% for executive directors. | ||||||||

Process safety events over past five years | |||||
80 | |||||
60 | |||||
40 | |||||
20 | |||||
0 | |||||
2020 | 2021 | 2022 | 2023 | 2024 | |
¢ Tier 1 process safety events ¢ Tier 2 process safety events | |||||
bp Annual Report and Form 20-F 2024 | 99 |
Corporate governance | ||
| | | | |||||||||
rTSR | ROACE | Adjusted EBIDA per share CAGR | Strategic progress | Formulaic score | ||||||||
0% | 20% | 20% | 26.5% | 66.5% out of 100% | ||||||||
Categories | Measures | Threshold performance | Maximum performance | Weight | Outcome | ||||
rTSR (20% weight) | rTSR | Fourth | First | 20% | 0% | ||||
Actual: Sixth | |||||||||
Financials (40% weight) | ROACE (average 2022-24) | 13.7% | 14.7% | 20% | 20% | ||||
Actual: 20.9% | |||||||||
Adjusted EBIDA per share CAGR | 7.7% | 9.7% | 20% | 20% | |||||
Actual: 11.1% | |||||||||
Strategic progress (40% weight) | Deliver value through resilient hydrocarbon business | 40% | 26.5% | ||||||
Demonstrate track record, scale and value in low carbon energy | |||||||||
Accelerate growth in convenience and mobility | |||||||||
Formulaic outcome (out of 100%) | 66.5% | ||||||||


Formulaic vesting 66.5% out of 100% | | Underpin: Committee review of absolute shareholder returns, long-term safety and environmental performance, low carbon and climate change considerations. No adjustment | | Final vesting after committee judgement 66.5% out of 100% | |
100 | bp Annual Report and Form 20-F 2024 |
Directors’ remuneration report continued | ||
1. Deliver value through a resilient hydrocarbon business KPIs (as set in 2022) |
2022 | 2023 | 2024 | 2025 target |
$6.1/boe | $5.8/boe | $6.2/boe | $6.0/boe |
2022 | 2023 | 2024 | 2025 target |
96.0% | 95.0% | 95.2% | 96.0% |
2022 | 2023 | 2024 | 2025 target |
94.5% | 96.1% | 94.3% | 96.0% |
Overview •Continued high grading of portfolio to drive higher margins. Completed joint venture conversions in Angola and Iraq, extended Indonesia production-sharing contract, completed 10 major projects and increased bpx production by 33%. •Production on track with 2024 progress broadly on plan. 2022 and 2023 production were +2% vs. plan. •The hydrocarbon business performed well against adjusted EBITDA and free cash flow measures – with actual performance ahead of expectations for both measures. | ||
2. Demonstrate track record, scale and value in low carbon energy KPIs (as set in 2022) |
2022 | 2023 | 2024 | 2025 target |
5.8GW | 6.2GW | 8.2GW | 20GW |
2022 | 2023 | 2024 |
37.2GW | 58.3GW | 60.6GW |
Overview •The low carbon energy pillar has materially transformed since the setting of targets in 2022. From a period of volume-driven origination, bp has moved into a stage of consolidation, portfolio reset and focus across all businesses within a more constrained capital frame. •Low carbon energy delivered lower adjusted EBITDA than expected over the period. This was attributable to the challenging solar market in the US in 2023 and rapid ramp-up in hydrogen and offshore wind. | ||
bp Annual Report and Form 20-F 2024 | 101 |
Corporate governance | ||
3. Accelerate growth in convenience and mobility KPIs (as set in 2022) |
2022 | 2023a | 2024 | 2025 targeta |
9% | 9% | 17% | 10% |
2022 | 2023 | 2024 | 2025 target |
2,400 | 2,850 | 2,950 | 3,000 |
2022 | 2023 | 2024 | 2025 targetb |
$6.9bn | $7.0bn | $6.9bn | n/a |
Overview •Performance across the convenience and mobility pillar has been strong versus the targets we set at the beginning of 2022. However, market conditions have been challenging which has impacted financial delivery, leading to mixed performance. •During the period, financial performance was impacted by cost inflation, challenging market environments and prolonged impact of COVID-19 on businesses such as Castrol. | ||
Overall assessment | ||||||||||
In progressing our strategic agenda, we have not only reviewed performance against the three strategic pillars of our previous strategy but also key strategic highlights, many of which culminated in the last year of the performance period, including: | ||||||||||
Low carbon energy •Completed transactions for 100% ownership of bp Bunge Bioenergia and Lightsource bp. •New joint ventures including JERA Nex bp with JERA Co., Inc. Resilient hydrocarbons •Sanctioning 10 higher value major projects – including Kaskida and Tangguh UCC. •Agreeing new access to resources in regions we know well, like the Middle East and India, where we are now technical services providers for the country’s largest offshore oil and gas field. •Gas is now flowing at our Greater Tortue Ahmeyim (GTA) project off the coast of | West Africa. Once fully commissioned, it is set to produce 2.4 million tonnes of LNG annually. Convenience and mobility •In 2024, Castrol grew underlying earnings by 14% and has demonstrated six consecutive quarters of year-on-year underlying earnings growth. Financial •Delivery of structural cost reductions of around $0.8 billion in 2024. This more than offsets significant increases from inflation, foreign exchange and costs associated with growing the business. Overall, we reduced our underlying operating expenditure by | $300 million towards our target of $4-5 billion of structural cost reductions by end-2027. Resulting score Accounting for delivery (volume and value), bp’s evolving strategic context and the above strategic milestones, the committee determined performance against this measure should result in 66% of maximum vesting (2021-23: 75% of maximum). Strategic progress remains a key component of our long-term scorecard for outstanding awards and the committee will continue to apply judgement within the context of broader strategic delivery. | ||||||||
Other vesting considerations |
Shares awarded | Unvested shares following application of performance factor | Value of unvested shares following application of performance factor | Impact of share price changea | |
Murray Auchincloss | 937,500 | 704,790 | £2,749,950 | £-317,649 |
Kate Thomsonb | 89,300 | 147,391 | £575,090 | £15,815 |
102 | bp Annual Report and Form 20-F 2024 |
Directors’ remuneration report continued | ||
Element | Policy feature | 2025 implementation | ||
Salary | To provide fixed remuneration to reflect the scale and complexity of both the business and the role, and to be competitive with the external market. When setting salaries, the committee considers practice in other energy majors as well as European and US companies of a similar size, geographic spread and business dynamic to bp. Percentage increases for executive directors will not exceed that for the wider workforce, other than in specific circumstances identified by the committee (e.g. in response to a substantial change in responsibilities). Salaries are normally set in the home currency of the executive director and are reviewed annually. They may be reviewed at other times where appropriate. | •Murray Auchincloss's salary will increase by 4%, in line with the wider workforce, to £1,508,000 following the 2025 AGM. •Kate Thomson's salary will increase by 8% to £864,000 following the 2025 AGM. This is to reflect her development in role and leadership for the Finance function since appointment in February 2024. •The budgeted increase to our UK salaried staff effective from 1 April 2025, our annual salary review date, will be 4%. | ||
Pensions and benefits | Executive directors normally participate in the company retirement plans that operate in their home country. New appointees from within the bp group retain previously accrued benefits related to service prior to appointment as executive director. For their service as a director, cash allowance in lieu of pension will be up to 20% of base salary. For future appointments, the committee will carefully review any retirement benefits to be granted to a new director, taking account of retirement policies across the wider group and any arrangements currently in place. | •Murray and Kate’s cash allowance in lieu of pension is 20% of base pay (in line with the wider workforce). •Prior to their appointment as executive directors, Murray received a US deferred pension and Kate received a UK deferred pension. No further pension is accrued under either plan. •Benefits will remain unchanged for 2025 and include car- related provisions, security assistance, insurance and medical cover. | ||
Annual bonus | Bonus is measured against an annual scorecard. The committee holds discretion to choose the specific measures and the relative weightings adopted in the annual scorecard, to reflect the annual plan as agreed with the board. Numeric scales are set for each measure, to score outcomes relative to targets. A scorecard outcome of 1.0 reflects the target outcome and 2.0 is the maximum outcome. Target bonus is 112.5% of salary, and maximum bonus is 225% of salary. Half the bonus is paid in cash, and half is deferred into bp shares for three years up until the ’minimum shareholding requirement’ is met. At this point, 67% is paid in cash and 33% is paid in bp shares. Dividends (or equivalents, including the value of any reinvestment) may accrue in respect of any deferred shares. Awards are subject to operationally robust and effective malus and clawback provisions as described below. | •For 2025, our scorecard will be assessed against the following categories: safety and sustainability (30%) and financials and operations (70%). •We intend to make the following changes to performance measures for 2025: –Introduce a structural cost reduction measure that is aligned with our forward-looking commitments. This replaces the earnings measures in the scorecard. –Replace the measure focused on transition growth« engines with increased weighting on modified free cash flow« and bp-operated reliability« and availability«. annual bonus. •The framework on fatalities, which helps guide decisions on adjustments to the bonus outcome in relation to fatalities, will continue to be applied. Further detail has been provided | ||
bp Annual Report and Form 20-F 2024 | 103 |
Corporate governance | ||
Element | Policy feature | 2025 implementation | ||
Performance shares | Performance shares are granted with a three-year performance period, measured against a scorecard. The committee holds discretion to choose the specific measures and the relative weightings adopted in the scorecard, to ensure they are focused on the near-term priorities for delivering the bp strategy in the interests of shareholders. Annual grants are 500% of salary for the CEO, and 450% of salary for any other executive director. Awards will vest in proportion to the outcomes measured through the performance scorecard, subject to any adjustment by the committee, and will be subject to a three-year post-vesting holding period. Awards are subject to operationally robust and effective malus and clawback provisions as described below. | •For our 2025-27 cycle, the scorecard categories will remain unchanged from the 2024-26 cycle and will be assessed against the following: rTSR (25%), financials (40%), environmental, social and governance (15%) and strategic progress (20%). •The only change being made to the chosen performance measures for the 2025-27 cycle is the introduction of an adjusted free cash flow CAGR« measure. This replaces adjusted EBIDA CAGR per share«. All other measures are to remain the same. 2025-27 EDIP. •The award will continue to be subject to an underpin that takes into consideration in-year safety outcomes and long-term trends in safety outcomes over the performance period. •The 2025-27 awards will be granted based on the average closing share price of each calendar day in the 90-day period ending on the date of bp’s 2025 AGM. | ||
Shareholding requirement | CEO to build a shareholding of at least five times salary, and other executive directors four and a half times salary, within five years of appointment. Executive directors are required to maintain that level for at least two years post-employment. | •Murray’s shareholding has reached 6.1 times salary, above his minimum shareholding requirement of 5 times of salary. •Kate’s shareholding has reached 2.6 times salary. Over the next four years, to 2029, Kate will work towards reaching her minimum shareholding requirement of 4.5 times of salary. | ||
Malus and clawback | Operationally robust and effective malus and clawback provisions apply to our incentive awards. Malus provisions may be applied where there is: a material safety or environmental failure; an incorrect award outcome due to miscalculation or incorrect information; a restatement due to financial reporting failure or misstatement of audited results; material misconduct; or other exceptional circumstances that the committee considers similar in nature. Clawback provisions may apply where there is: an incorrect outcome due to miscalculation or incorrect information; a restatement due to financial reporting failure or misstatement of audited results; or material misconduct. | |||
Committee flexibility | The committee has discretion to adjust performance measures and weightings, and to revise the peer group for the rTSR measure. This discretion allows appropriate realignment, throughout the policy term, for changes in the annual plan and for the anticipated evolution of the low carbon business environment. The committee also holds discretion in determining the outcomes for annual bonus and performance shares, allowing them to take broad views on alignment with shareholder experience, environmental, societal and other relevant considerations e.g. portfolio changes. | |||
104 | bp Annual Report and Form 20-F 2024 |
Directors’ remuneration report continued | ||
 | ||||||
Safety and sustainability 30% | Financials and operations 70% | |||||
Measures include | Weighting | Measures include | Weighting | |||
Tier 1 and tier 2 process safety events« (measured separately) | 15% | Modified free cash flow | 30% | |||
Operated carbon emissions | 15% | Structural cost reduction | 25% | |||
bp-operated reliability and availability | 15% | |||||
rTSR | | Financials | | Environmental, social and governance | | Strategic progress | |||||||||||||||||||||||||||||||||||||||||||||
25% | 20% | 20% | 15% | 20% | |||||||||||||||||||||||||||||||||||||||||||||||
Peer group of seven companies: Chevron, Eni, Equinor, ExxonMobil, Repsol, Shell and TotalEnergies (and bp)a | ROACEb« | Adjusted free cash flow CAGRc | Cumulative reduction % in operated carbon emissionsd | Holistic review of progress against strategy set out in the Capital Markets Update in February 2025. Subject to the remuneration committee’s judgement. Consideration may be given to the following measures: •Divestments •Net debt •Structural cost reduction | |||||||||||||||||||||||||||||||||||||||||||||||
Vesting % for each element | 100% | 100% | 100% | 100% | |||||||||||||||||||||||||||||||||||||||||||||||
75% | 75% | 75% | 75% | ||||||||||||||||||||||||||||||||||||||||||||||||
50% | 50% | 50% | 50% | ||||||||||||||||||||||||||||||||||||||||||||||||
25% | 25% | 25% | 25% | ||||||||||||||||||||||||||||||||||||||||||||||||
0% | 0% | 0% | 0% | ||||||||||||||||||||||||||||||||||||||||||||||||
8 | 7 | 6 | 5 | 4 | 3 | 2 | 1 | Below 14% | 15% | 16% | 17% | Above 18% | Below 15% | 17.5% | 20% | 22.5% | Above 25% | Below 36.5% | 37.5% | 38.5% | 39.5% | Above 40.5% | |||||||||||||||||||||||||||||
rTSR ranking | ROACE | Adjusted free cash flow CAGR | Cumulative reduction % in operated carbon emissions | ||||||||||||||||||||||||||||||||||||||||||||||||


bp Annual Report and Form 20-F 2024 | 105 |
Corporate governance | ||
rTSR | | Financials | | Environmental, social and governance | | Strategic progressa | |||||||||||||||||||||||||||||||||||||||||||||
20% | 20% | 20% | 15% | 25% | |||||||||||||||||||||||||||||||||||||||||||||||
Peer group of seven companies: Chevron, Eni, Equinor, ExxonMobil, Repsol, Shell and TotalEnergies (and bp) | ROACE (average 2023-25) | Adjusted EBIDA per share CAGR | Net zero across entire bp operations by 2050 (Scope 1 + 2) | Weighting of measures subject to remuneration committee judgement: •Deliver value through a resilient hydrocarbon business. •Demonstrate track record, scale and value in low carbon energy. •Accelerate growth in convenience and mobility. | |||||||||||||||||||||||||||||||||||||||||||||||
Vesting % for each element | 100% | 100% | 100% | 100% | |||||||||||||||||||||||||||||||||||||||||||||||
75% | 75% | 75% | 75% | ||||||||||||||||||||||||||||||||||||||||||||||||
50% | 50% | 50% | 50% | ||||||||||||||||||||||||||||||||||||||||||||||||
25% | 25% | 25% | 25% | ||||||||||||||||||||||||||||||||||||||||||||||||
0% | 0% | 0% | 0% | ||||||||||||||||||||||||||||||||||||||||||||||||
8 | 7 | 6 | 5 | 4 | 3 | 2 | 1 | Below 20.2% | 20.7% | 21.2% | 21.7% | Above 22.2% | Below 12.5% | 13.0% | 13.5% | 14.0% | Above 14.5% | Below 12% | 13% | 14% | 15% | Above 16% | |||||||||||||||||||||||||||||
rTSR ranking | ROACE | Adjusted EBIDA per share CAGR | Net zero | ||||||||||||||||||||||||||||||||||||||||||||||||
rTSR | | Financials | | Environmental, social and governance | | Strategic progress | |||||||||||||||||||||||||||||||||||||||||||||
25% | 20% | 20% | 15% | 20% | |||||||||||||||||||||||||||||||||||||||||||||||
Peer group of seven companies: Chevron, Eni, Equinor, ExxonMobil, Repsol, Shell and TotalEnergies (and bp) | ROACE (average 2024-26) | Adjusted EBIDA per share CAGR | Cumulative reduction % in operated carbon emissions | Subject to remuneration committee judgement. Following the Capital Markets Update in February 2025, judgement of strategic progress will adopt the same frame as set out for the 2025-27 cycle. | |||||||||||||||||||||||||||||||||||||||||||||||
Vesting % for each element | 100% | 100% | 100% | 100% | |||||||||||||||||||||||||||||||||||||||||||||||
75% | 75% | 75% | 75% | ||||||||||||||||||||||||||||||||||||||||||||||||
50% | 50% | 50% | 50% | ||||||||||||||||||||||||||||||||||||||||||||||||
25% | 25% | 25% | 25% | ||||||||||||||||||||||||||||||||||||||||||||||||
0% | 0% | 0% | 0% | ||||||||||||||||||||||||||||||||||||||||||||||||
8 | 7 | 6 | 5 | 4 | 3 | 2 | 1 | Below 15.7% | 16.2% | 16.7% | 17.2% | Above 17.7% | Below 9.3% | 9.8% | 10.3% | 10.8% | Above 11.3% | Below 39% | 40% | 41% | 42% | Above 43% | |||||||||||||||||||||||||||||
rTSR ranking | ROACE | Adjusted EBIDA per share CAGR | Cumulative reduction % in operated carbon emissions | ||||||||||||||||||||||||||||||||||||||||||||||||
106 | bp Annual Report and Form 20-F 2024 |
Directors’ remuneration report continued | ||
Directors’ ordinary shares or equivalents at 14 Feb 2025 | Aggregated interests at 14 Feb 2025, all plans | Current shareholding for MSRb | Value of current shareholdingc, £ | Multiple of salary achieved | |||||||||
Unvested awards not subject to performance conditions | Unvested awards subject to performance conditions | ||||||||||||
Sharesa | Options | Shares | Options | ||||||||||
Murray Auchinclossd | 1,319,688 | 1,387,250 | 152,301 | 2,200,575 | — | 1,888,476 | 8,838,068 | 6.1 | |||||
Kate Thomson | 230,357 | 350,322 | 500,000 | 808,846 | — | 437,799 | 2,048,899 | 2.6 | |||||
Award | Number of shares granted | Grant date | Face value of the awarda, £ | Vesting date | |
Murray Auchincloss | 2024-26 EDIP Performanceb | 1,482,617 | 7 May 2024 | 7,472,390 | May 2027 |
Kate Thomson | 736,196 | 7 May 2024 | 3,710,428 | May 2027 | |
Murray Auchincloss | 2024 EDIP Deferredc | 124,128 | 7 May 2024 | 625,605 | May 2027 |
bp Annual Report and Form 20-F 2024 | 107 |
Corporate governance | ||
£ thousand per annum | 2025/26 fees | 2024/25 fees |
Chair | 888 | 854 |
Senior independent director | 181.5 | 174.5 |
Board member | 130.5 | 125.5 |
Audit, remuneration and safety and sustainability committees chairship | 35 | 35 |
Committee membership | 20 | 20 |
Fees | Benefits | Total | ||||||
£ thousand | 2024 | 2023 | 2024 | 2023 | 2024 | 2023 | ||
Dame Amanda Blanc | 198 | 159 | 1 | 2 | 198 | 161 | ||
Pamela Daley | 164 | 159 | 17 | 67 | 181 | 226 | ||
Helge Lund (chair) | 845 | 809 | 38 | 66 | 882 | 875 | ||
Melody Meyera | 182 | 184 | 9 | 29 | 191 | 213 | ||
Tushar Morzaria | 189 | 174 | 1 | 3 | 190 | 177 | ||
Hina Nagarajanb | 157 | 116 | 17 | 32 | 174 | 148 | ||
Satish Paib | 144 | 116 | 5 | 39 | 149 | 155 | ||
Paula Rosput Reynoldsb | 72 | 220 | 6 | 20 | 78 | 240 | ||
Karen Richardsonc | 169 | 178 | 16 | 18 | 185 | 196 | ||
Sir John Sawersb | 57 | 174 | 12 | 7 | 68 | 181 | ||
Dr Johannes Teyssena | 160 | 149 | 5 | 15 | 165 | 164 | ||
Ordinary shares or equivalentsa | ||||||
At 1 Jan 2024 | At 31 Dec 2024 | Changes to 14 Feb 2025 | At 14 Feb 2025 | Value of current shareholdingb | % of guideline achieved | |
Dame Amanda Blanc | 23,500 | 23,500 | — | 23,500 | £109,980 | 88% |
Pamela Daley | 40,332 | 40,332 | — | 40,332 | $235,270 | 147% |
Helge Lund (chair) | 600,000 | 600,000 | — | 600,000 | £2,808,000 | 329% |
Melody Meyer | 20,646 | 38,646 | — | 38,646 | $225,435 | 141% |
Tushar Morzaria | 71,972 | 71,972 | — | 71,972 | £336,829 | 268% |
Hina Nagarajan | 10,000 | 25,944 | — | 25,944 | £121,418 | 97% |
Satish Pai | 12,000 | 33,000 | — | 33,000 | $192,500 | 120% |
Paula Rosput Reynoldsc | 78,378 | — | — | — | — | — |
Karen Richardson | 29,316 | 35,316 | — | 35,316 | $206,010 | 128% |
Sir John Sawersc | 24,242 | — | — | — | — | — |
Dr Johannes Teyssen | 35,000 | 35,000 | — | 35,000 | £163,800 | 131% |
108 | bp Annual Report and Form 20-F 2024 |
Directors’ remuneration report continued | ||
Historical TSR performance | Relative importance of spend on pay ($ million) | |||||||||||||||||||||||
£250 | Distribution to bp shareholders | Remuneration paid to all employees | Capital investmenta | |||||||||||||||||||||
£200 | ||||||||||||||||||||||||
£150 | ||||||||||||||||||||||||
£100 | ||||||||||||||||||||||||
£50 | ||||||||||||||||||||||||
£0 | ||||||||||||||||||||||||
2014 | 2015 | 2016 | 2017 | 2018 | 2019 | 2020 | 2021 | 2022 | 2023 | 2024 | 2023 | 2024 | 2023 | 2024 | 2023 | 2024 | ||||||||
¢ BP | a Organic capital expenditure. | |||||||||||||||||||||||
¢ FTSE 100 | ||||||||||||||||||||||||


Year | Chief executive officer | Total remuneration, thousand | Annual bonus % of maximum | Performance shares % of maximum |
2015 | Bob Dudley | $19,376 | 100 | 74.3 |
2016 | Bob Dudley | $11,904 | 61 | 40 |
2017 | Bob Dudley | $15,108 | 71.5 | 70 |
2018 | Bob Dudley | $15,253 | 40.5 | 80 |
2019 | Bob Dudley | $13,234 | 67.5 | 71.2 |
2020a | Bob Dudley | $188 | 0 | 32.5 |
Bernard Looney | £1,735 | 0 | 32.5 | |
2021 | Bernard Looney | £4,457 | 80.5 | 30 |
2022 | Bernard Looney | £10,331 | 75.5 | 54 |
2023a,b | Bernard Looney | £1,175 | n/a | n/a |
Murray Auchincloss | £5,391 | 79.5 | 75 | |
2024c | Murray Auchincloss | £5,356 | 22.5 | 66.5 |
bp Annual Report and Form 20-F 2024 | 109 |
Corporate governance | ||
Year | Method | 25th percentile: pay ratio, total pay and benefits, (salary) | 50th percentile: pay ratio, total pay and benefits, (salary) | 75th percentile: pay ratio, total pay and benefits, (salary) |
2019a | Option A | 543:1 | 188:1 | 82:1 |
2020a | Option A | 99:1 | 40:1 | 19:1 |
2021 | Option A | 208:1 | 87:1 | 35:1 |
2022 | Option A | 421:1 | 172:1 | 69:1 |
2023b | Option A | 268:1 | 103:1 | 45:1 |
2024c | Option A | 196:1 | 74:1 | 37:1 |
£27,343 | £72,678 | £143,202 | ||
(£25,304) | (£54,106) | (£92,900) |
2024 vs. 2023 | 2023 vs. 2022 | 2022 vs. 2021 | 2021 vs. 2020 | 2020 vs. 2019 | |||||||||||||||
Percentage change for: | a | b | c | a | b | c | a | b | c | a | b | c | a | b | c | ||||
Employees | 4% | 0% | -65% | 6% | 1% | 4% | 2% | 1% | 45% | 7% | -9% | 100% | 0% | 0% | -100% | ||||
Murray Auchincloss | 43% | -61% | -60% | 30% | 283% | 31% | 7% | 530% | 3% | 5% | 5% | 100% | — | — | — | ||||
Kate Thomson | — | — | — | — | — | — | — | — | — | — | — | — | — | — | — | ||||
Dame Amanda Blanc | 24% | -72% | n/a | 38% | 100% | n/a | — | — | n/a | — | — | n/a | — | — | n/a | ||||
Pamela Daley | 3% | -75% | n/a | 2% | 2% | n/a | 7% | 43% | n/a | 4% | 1385% | n/a | -15% | -92% | n/a | ||||
Helge Lund (chair) | 4% | -43% | n/a | 3% | 78% | n/a | 0% | 97% | n/a | 0% | -24% | n/a | 0% | -74% | n/a | ||||
Melody Meyer | -1% | -68% | n/a | 2% | -14% | n/a | 13% | 139% | n/a | -4% | 283% | n/a | 9% | -77% | n/a | ||||
Tushar Morzaria | 9% | -73% | n/a | 2% | -46% | n/a | 25% | 100% | n/a | 5% | 0% | n/a | — | — | n/a | ||||
Hina Nagarajan | 13% | -46% | n/a | — | — | n/a | — | — | n/a | — | — | n/a | — | — | n/a | ||||
Satish Pai | 3% | -88% | n/a | — | — | n/a | — | — | n/a | — | — | n/a | — | — | n/a | ||||
Paula Rosput Reynolds | 3% | -70% | n/a | 2% | -14% | n/a | 16% | 145% | n/a | — | 228% | n/a | 2% | -92% | n/a | ||||
Karen Richardson | -5% | -12% | n/a | 11% | -20% | n/a | 30% | 96% | n/a | — | — | n/a | — | — | n/a | ||||
Sir John Sawers | 3% | 63% | n/a | 2% | 105% | n/a | 17% | 1% | n/a | — | 1588% | n/a | — | -83% | n/a | ||||
Johannes Teyssen | 7% | -68% | n/a | 3% | 12% | n/a | 21% | 65% | n/a | — | — | n/a | — | — | n/a | ||||
110 | bp Annual Report and Form 20-F 2024 |
Directors’ remuneration report continued | ||
Year | % vote ‘for’ | % vote ‘against’ | Votes withheld |
2024 – Directors’ remuneration report | 95.88% | 4.12% | 37,229,024 |
2023 – Directors’ remuneration policy | 94.23% | 5.77% | 36,921,641 |
Date of contract | Effective date | |
Murray Auchincloss | 17 Jan 2024 | 17 Jan 2024 |
Kate Thomson | 2 Feb 2024 | 2 Feb 2024 |
Appointee company | Additional position held at appointee company | Total fees, £ | |
Murray Auchinclossa | Aker BP ASAb | Director | 0 |
Kate Thomson | Aker BP ASAb | Director | 0 |
bp Annual Report and Form 20-F 2024 | 111 |
Corporate governance | ||
Other disclosures | ||
Gender identity or sex | Number of board members | Percentage of the board | Number of senior positions on the board (CEO, CFO, SID and chair) | Number in executive management | Percentage of executive management |
Men | 5 | 45% | 2 | 6 | 55% |
Women | 6 | 55% | 2 | 5 | 45% |
Other categories | – | – | – | – | – |
Not specified/prefer not to say | – | – | – | – | – |
Ethnic background | |||||
White British or other white (including minority-white groups) | 8 | 73% | 100% | 9 | 82% |
Mixed/Multiple Ethnic Groups | – | – | – | – | – |
Asian/Asian British | 3 | 27% | – | 1 | 9% |
Black/African/Caribbean/Black British | – | – | – | 1 | 9% |
Other ethnic group | – | – | – | – | – |
Not specified/prefer not to say | – | – | – | – | – |
112 | bp Annual Report and Form 20-F 2024 |
bp Annual Report and Form 20-F 2024 | 113 |
114 | bp Annual Report and Form 20-F 2024 |
bp Annual Report and Form 20-F 2024 | 115 |
Financial statements |
Consolidated financial statements of the bp group | ||||||||
Independent auditor's reports (PCAOB ID | 134 | Group statement of changes in equity | ||||||
Group income statement | Group balance sheet | |||||||
Group statement of comprehensive income | Group cash flow statement | |||||||
Notes on financial statements | ||||||||
1. | Significant accounting policies | 22. | Trade and other payables | |||||
2. | Non-current assets held for sale | 23. | Provisions | |||||
3. | Business combinations | 24. | Pensions and other post-employment benefits | |||||
4. | Disposals and impairment | |||||||
5. | Segmental analysis | 25. | Cash and cash equivalents | |||||
6. | Sales and other operating revenues | 26. | Finance debt | |||||
7. | Income statement analysis | 27. | Capital disclosures and net debt | |||||
8. | Exploration for and evaluation of oil and natural gas resources | 28. | Leases | |||||
29. | Financial instruments and financial risk factors | |||||||
9. | Taxation | |||||||
10. | Dividends | 30. | Derivative financial instruments | |||||
11. | Earnings per share | 31. | Called-up share capital | |||||
12. | Property, plant and equipment | 32. | Capital and reserves | |||||
13. | Capital commitments | 33. | Contingent liabilities and legal proceedings | |||||
14. | Goodwill | 34. | Remuneration of senior management and non-executive directors | |||||
15. | Intangible assets | |||||||
16. | Investments in joint ventures | 35. | Employee costs and numbers | |||||
17. | Investments in associates | 36. | Auditor's remuneration | |||||
18. | Other investments | 37. | Subsidiaries, joint arrangements and associates | |||||
19. | Inventories | |||||||
20. | Trade and other receivables | 38. | Events after the reporting period | |||||
21. | Valuation and qualifying accounts | |||||||
Supplementary information on oil and natural gas (unaudited) | ||||||||
Oil and natural gas exploration and production activities | Standardized measure of discounted future net cash flows and changes therein relating to proved oil and gas reserves | |||||||
Movements in estimated net proved reserves | ||||||||
Operational and statistical information | ||||||||
116 | bp Annual Report and Form 20-F 2024 |
bp Annual Report and Form 20-F 2024 | 117 |
Financial statements |
134 | bp Annual Report and Form 20-F 2024 |
bp Annual Report and Form 20-F 2024 | 135 |
Financial statements |
136 | bp Annual Report and Form 20-F 2024 |
bp Annual Report and Form 20-F 2024 | 137 |
Financial statements |
138 | bp Annual Report and Form 20-F 2024 |
bp Annual Report and Form 20-F 2024 | 139 |
Financial statements |
140 | bp Annual Report and Form 20-F 2024 |
For the year ended 31 December | $ million | ||||
Note | 2024 | 2023 | 2022 | ||
Sales and other operating revenues | 6 | ||||
Earnings from joint ventures – after interest and tax | 16 | ||||
Earnings from associates – after interest and tax | 17 | ||||
Interest and other income | 7 | ||||
Gains on sale of businesses and fixed assets | 4 | ||||
Total revenues and other income | |||||
Purchases | 19 | ||||
Production and manufacturing expenses | |||||
Production and similar taxes | 5 | ||||
Depreciation, depletion and amortization | 5 | ||||
Net impairment and losses on sale of businesses and fixed assets | 4 | ||||
Exploration expense | 8 | ||||
Distribution and administration expenses | |||||
Profit (loss) before interest and taxation | |||||
Finance costs | 7 | ||||
Net finance (income) expense relating to pensions and other post-employment benefits | 24 | ( | ( | ( | |
Profit (loss) before taxation | |||||
Taxation | 9 | ||||
Profit (loss) for the year | ( | ||||
Attributable to | |||||
bp shareholders | ( | ||||
Non-controlling interests | |||||
( | |||||
Earnings per share | |||||
Profit (loss) for the year attributable to bp shareholders | |||||
Per ordinary share (cents) | |||||
Basic | 11 | ( | |||
Diluted | 11 | ( | |||
Per ADS (dollars) | |||||
Basic | 11 | ( | |||
Diluted | 11 | ( |
bp Annual Report and Form 20-F 2024 | 141 |
Financial statements |
For the year ended 31 December | $ million | ||||
Note | 2024 | 2023 | 2022 | ||
Profit (loss) for the year | ( | ||||
Other comprehensive income | |||||
Items that may be reclassified subsequently to profit or loss | |||||
Currency translation differencesa | ( | ( | |||
Exchange (gains) losses on translation of foreign operations reclassified to gain or loss on sale of businesses and fixed assetsa | ( | ||||
Cash flow hedges marked to market | 30 | ( | |||
Cash flow hedges reclassified to the income statement | 30 | ( | ( | ||
Costs of hedging marked to market | 30 | ( | ( | ||
Costs of hedging reclassified to the income statement | 30 | ( | ( | ||
Share of items relating to equity-accounted entities, net of tax | 16, 17 | ( | ( | ||
Income tax relating to items that may be reclassified | 9 | ( | ( | ||
( | |||||
Items that will not be reclassified to profit or loss | |||||
Remeasurements of the net pension and other post-employment benefit liability or asset | 24 | ( | ( | ||
Remeasurements of equity investments | ( | ||||
Cash flow hedges that will subsequently be transferred to the balance sheet | 30 | ( | ( | ||
Income tax relating to items that will not be reclassifieda | 9 | ||||
( | |||||
Other comprehensive income | ( | ( | |||
Total comprehensive income | |||||
Attributable to | |||||
bp shareholders | |||||
Non-controlling interests | |||||
142 | bp Annual Report and Form 20-F 2024 |
$ million | ||||||||||
Share capital and capital reserves | Treasury shares | Foreign currency translation reserve | Fair value reserves | Profit and loss account | bp shareholders' equity | Non-controlling interests | Total equity | |||
Hybrid bonds | Other interest | |||||||||
At 1 January 2024 | ( | ( | ||||||||
Profit for the year | — | — | — | — | ||||||
Other comprehensive income | — | — | ( | ( | ( | — | ( | ( | ||
Total comprehensive income | — | — | ( | ( | ||||||
Dividendsb | — | — | — | — | ( | ( | — | ( | ( | |
Cash flow hedges transferred to the balance sheet, net of tax | — | — | — | ( | — | ( | — | — | ( | |
Repurchase of ordinary share capital | — | — | — | — | ( | ( | — | — | ( | |
Share-based payments, net of tax | — | — | ( | — | — | |||||
Issue of perpetual hybrid bonds | — | — | — | — | ( | ( | — | |||
Redemption of perpetual hybrid bonds, net of tax | — | — | — | — | ( | — | ( | |||
Payments on perpetual hybrid bonds | — | — | — | — | ( | — | ( | |||
Transactions involving non-controlling interests, net of tax | — | — | — | — | — | |||||
At 31 December 2024 | ( | ( | ( | |||||||
At 1 January 2023 | ( | ( | ( | |||||||
Profit for the year | — | — | — | — | ||||||
Other comprehensive income | — | — | ( | ( | — | ( | ||||
Total comprehensive income | — | — | ||||||||
Dividendsb | — | — | — | — | ( | ( | — | ( | ( | |
Cash flow hedges transferred to the balance sheet, net of tax | — | — | — | ( | — | ( | — | — | ( | |
Repurchase of ordinary share capital | — | — | — | — | ( | ( | — | — | ( | |
Share-based payments, net of tax | — | — | ( | — | — | |||||
Share of equity-accounted entities’ changes in equity, net of tax | — | — | — | — | — | — | ||||
Issue of perpetual hybrid bonds | — | — | — | — | ( | ( | — | |||
Payments on perpetual hybrid bonds | — | — | ( | — | — | ( | ( | — | ( | |
Transactions involving non-controlling interests, net of tax | — | — | — | — | — | ( | ||||
At 31 December 2023 | ( | ( | ||||||||
At 1 January 2022 | ( | ( | ( | |||||||
Profit for the year | — | — | — | — | ( | ( | ( | |||
Other comprehensive income | — | — | — | ( | ||||||
Total comprehensive income | — | — | ( | |||||||
Dividendsb | — | — | — | — | ( | ( | — | ( | ( | |
Cash flow hedges transferred to the balance sheet, net of tax | — | — | — | — | — | — | ||||
Issue of ordinary share capital | — | — | — | — | — | — | ||||
Repurchase of ordinary share capital | — | — | — | — | ( | ( | — | — | ( | |
Share-based payments, net of tax | — | — | — | — | ||||||
Issue of perpetual hybrid bonds | — | — | — | — | ( | ( | — | |||
Payments on perpetual hybrid bonds | — | — | — | — | ( | — | ( | |||
Transactions involving non-controlling interests, net of tax | — | — | — | — | ( | ( | — | ( | ( | |
At 31 December 2022 | ( | ( | ( | |||||||
bp Annual Report and Form 20-F 2024 | 143 |
Financial statements |
At 31 December | $ million | |||
Note | 2024 | 2023 | ||
Non-current assets | ||||
Property, plant and equipment | 12 | |||
Goodwill | 14 | |||
Intangible assets | 15 | |||
Investments in joint ventures | 16 | |||
Investments in associates | 17 | |||
Other investments | 18 | |||
Fixed assets | ||||
Loans | ||||
Trade and other receivables | 20 | |||
Derivative financial instruments | 30 | |||
Prepayments | ||||
Deferred tax assets | 9 | |||
Defined benefit pension plan surpluses | 24 | |||
Current assets | ||||
Loans | ||||
Inventories | 19 | |||
Trade and other receivables | 20 | |||
Derivative financial instruments | 30 | |||
Prepayments | ||||
Current tax receivable | ||||
Other investments | 18 | |||
Cash and cash equivalents | 25 | |||
Assets classified as held for sale | 2 | |||
Total assets | ||||
Current liabilities | ||||
Trade and other payables | 22 | |||
Derivative financial instruments | 30 | |||
Accruals | ||||
Lease liabilities | 28 | |||
Finance debt | 26 | |||
Current tax payable | ||||
Provisions | 23 | |||
Liabilities directly associated with assets classified as held for sale | 2 | |||
Non-current liabilities | ||||
Other payables | 22 | |||
Derivative financial instruments | 30 | |||
Accruals | ||||
Lease liabilities | 28 | |||
Finance debt | 26 | |||
Deferred tax liabilities | 9 | |||
Provisions | 23 | |||
Defined benefit pension plan and other post-employment benefit plan deficits | 24 | |||
Total liabilities | ||||
Net assets | ||||
Equity | ||||
bp shareholders’ equity | 32 | |||
Non-controlling interests | 32 | |||
Total equity | 32 |
144 | bp Annual Report and Form 20-F 2024 |
For the year ended 31 December | $ million | ||||
Note | 2024 | 2023 | 2022 | ||
Operating activities | |||||
Profit (loss) before taxation | |||||
Adjustments to reconcile profit before taxation to net cash provided by operating activities | |||||
Exploration expenditure written off | 8 | ||||
Depreciation, depletion and amortization | 5 | ||||
Impairment and (gain) loss on sale of businesses and fixed assets | 4 | ||||
Earnings from joint ventures and associates | ( | ( | ( | ||
Dividends received from joint ventures and associates | |||||
Remeasurement of joint ventures | 3 | ( | |||
Interest receivable | ( | ( | ( | ||
Interest received | |||||
Finance costs | 7 | ||||
Interest paid | ( | ( | ( | ||
Net finance expense relating to pensions and other post-employment benefits | 24 | ( | ( | ( | |
Share-based payments | |||||
Net operating charge for pensions and other post-employment benefits, less contributions and benefit payments for unfunded plans | 24 | ( | ( | ( | |
Net charge for provisions, less payments | ( | ( | |||
(Increase) decrease in inventories | ( | ||||
(Increase) decrease in other current and non-current assets | ( | ||||
Increase (decrease) in other current and non-current liabilities | ( | ( | |||
Income taxes paid | ( | ( | ( | ||
Net cash provided by operating activities | |||||
Investing activities | |||||
Expenditure on property, plant and equipment, intangible and other assets | ( | ( | ( | ||
Acquisitions, net of cash acquired | 3 | ( | ( | ||
Investment in joint ventures | ( | ( | ( | ||
Investment in associates | ( | ( | ( | ||
Total cash capital expenditure | ( | ( | ( | ||
Proceeds from disposals of fixed assets | 4 | ||||
Proceeds from disposals of businesses, net of cash disposed | 4 | ||||
Proceeds from loan repayments | |||||
Net cash used in investing activities | ( | ( | ( | ||
Financing activities | |||||
Repurchase of shares | ( | ( | ( | ||
Lease liability payments | ( | ( | ( | ||
Proceeds from long-term financing | |||||
Repayments of long-term financing | ( | ( | ( | ||
Net increase (decrease) in short-term debt | ( | ( | ( | ||
Issue of perpetual hybrid bonds | |||||
Redemption of perpetual hybrid bonds | 32 | ( | |||
Payments relating to perpetual hybrid bonds | ( | ( | ( | ||
Payments relating to transactions involving non-controlling interests (other) | ( | ( | ( | ||
Receipts relating to transactions involving non-controlling interests (other) | |||||
Dividends paid | |||||
bp shareholders | 10 | ( | ( | ( | |
Non-controlling interests | ( | ( | ( | ||
Net cash provided by (used in) financing activities | ( | ( | ( | ||
Currency translation differences relating to cash and cash equivalents | ( | ( | |||
Increase (decrease) in cash and cash equivalents | ( | ||||
Cash and cash equivalents at beginning of year | |||||
Cash and cash equivalents at end of yeara |
bp Annual Report and Form 20-F 2024 | 145 |
Financial statements |
Judgements and estimates made in assessing the impact of climate change and the transition to a lower carbon economy |
Climate change and the transition to a lower carbon economy were considered in preparing the consolidated financial statements. These may have significant impacts on the currently reported amounts of the group’s assets and liabilities discussed below and on similar assets and liabilities that may be recognized in the future. The group’s assumptions for investment appraisal (see page 20) form part of an investment decision-making framework for currently unsanctioned future capital expenditure on property, plant and equipment, and intangibles including exploration and appraisal assets, that is designed to support the effective and resilient implementation of bp’s strategy. The price assumptions used for investment appraisal include oil and gas price assumptions, which are producer prices and are therefore net of any future carbon prices that the purchaser may be required to pay, and an assumption of a single carbon emissions cost imposed on the producer in respect of operational greenhouse gas (GHG) emissions (carbon dioxide and methane) in order to incentivize engineering solutions to mitigate GHG emissions on projects. The group's oil and gas price assumptions for value-in-use impairment testing are aligned with those investment appraisal assumptions. The assumptions for future carbon emissions costs in value-in-use impairment testing differ from the investment appraisal assumptions and are described below. Management has also not identified any off-balance sheet commodity purchase obligations to be onerous contracts as result of the transition to a lower carbon economy at 31 December 2024. |
Impairment of property, plant and equipment and goodwill |
The energy transition is likely to impact the future prices of commodities such as oil and natural gas which in turn may affect the recoverable amount of property, plant and equipment and goodwill in the oil and gas industry. Management’s best estimate of oil and natural gas price assumptions for value-in- use impairment testing were revised during 2024. The revised price assumptions have been rebased in real 2023 terms and are materially consistent with the disclosed prices in real 2022 terms. The near term Brent oil assumption was held constant at $ before declining after 2030 to $ cause oil prices to decline. The price assumptions for Henry Hub gas up to 2050 were held constant at $ declining domestic demand in the US is offset by higher LNG exports. The revised assumptions for Brent oil and Henry Hub gas sit within the range of external scenarios considered by management and are in line with a range of transition paths consistent with the temperature goal of the Paris climate change agreement, of holding the increase in the global average temperature to well below 2°C above pre-industrial levels and pursuing efforts to limit the temperature increase to 1.5°C above pre-industrial levels. |
146 | bp Annual Report and Form 20-F 2024 |
As noted above, the group’s investment appraisal process includes a carbon emissions price series for the investment economics which is applied to bp's anticipated share of bp's forecast of the investment assets' scope 1 and 2 GHG emissions where they exceed defined thresholds, and is assumed to apply whether or not bp is the asset operator. However, for value-in-use impairment testing on bp's existing cash generating units (CGUs), consistent with all other relevant cash flows estimated, bp is required to reflect management's best estimate of any expected applicable carbon emission costs payable by bp, including where bp is not the operator, in the future for each jurisdiction in which the group has interests. This requires management’s best estimate of how future changes to relevant carbon emission cost policies and/or legislation are likely to affect the future cash flows of the group’s applicable CGUs, whether currently enacted or not. Future potential carbon pricing and/or costs of carbon emissions allowances are included in the value-in-use calculations to the extent management has sufficient information to make such an estimate. Currently this results in limited application of carbon price assumptions in value-in-use impairment tests given that carbon pricing legislation in most impacted jurisdictions where the group has interests is not in place and there is not sufficient information available as to the relevant policy makers' future intentions regarding carbon pricing to support an estimate. A key input into the determination of impairment is the assumption, aligned with bp’s aim to reach net zero greenhouse gas emissions by 2050 or sooner, that the current recognized portfolio of oil and gas properties and refining assets will have an immaterial carrying value by 2050. |
Where we consider that the outcome of a value-in-use impairment test could be significantly affected by a carbon price in place in any jurisdiction, this is incorporated into the value-in use impairment testing cash flows. The most significant instances where a carbon price has been incorporated in the 2024 value-in-use impairment tests is for the UK North Sea and the Gelsenkirchen refinery. The assumptions for UK North Sea were £ gradually increasing to £ However, as bp’s forecast future prices are producer prices, the group considers it reasonable to assume that if, in addition to the costs already in place, further scope 1 and 2 emission costs were partially to be borne directly by oil and gas producers including bp in future and the prevalence of such costs were to become widespread, the gross oil and gas prices realized by producers would be correspondingly higher over the long term, resulting in no expected overall materially negative impacts on the group’s net cash flows. See significant judgements and estimates: recoverability of asset carrying values for further information including sensitivity analysis in relation to reasonably possible changes in the price assumptions and carbon costs. Production assumptions within upstream property, plant and equipment and goodwill value-in-use impairment tests reflect management’s current best estimate of future production of the existing upstream portfolio. See significant judgements and estimates: recoverability of asset carrying values and Note 14 for sensitivity analyses in relation to reasonably possible changes in production for upstream oil and gas properties and goodwill respectively. For the customers & products segment, though the energy transition may impact demand for certain refined products in the future, management anticipates sufficiently robust demand for the remainder of each refinery’s useful life. Management will continue to review price assumptions as the energy transition progresses and this may result in impairment charges or reversals in the future. |
Exploration and appraisal intangible assets |
The energy transition may affect the future development or viability of exploration prospects. The recoverability of the group's exploration and appraisal intangible assets was considered during 2024. No significant write-offs were identified. These assets will continue to be assessed as the energy transition progresses. See significant judgement: exploration and appraisal intangible assets and Note 8 for further information. |
Property, plant and equipment – depreciation and expected useful lives |
The energy transition may curtail the expected useful lives of oil and gas industry assets thereby accelerating depreciation charges. However, a significant majority of bp’s existing upstream oil and natural gas properties are likely to have immaterial carrying values within the next 12 years and, as outlined in bp's strategy, oil and natural gas production will remain an important part of bp’s business activities over that period. The significant majority of refining assets, recognized on the group’s balance sheet at 31 December 2024 that are subject to depreciation, will be depreciated within the next 12 years; demand for refined products is expected to remain sufficient to support the remaining useful lives of existing assets. Therefore, management does not expect the useful lives of bp’s reported property, plant and equipment to change and do not consider this to be a significant accounting judgement or estimate. Significant capital expenditure is still required for ongoing projects as well as renewal and/or replacement of aged assets and therefore the useful lives of future capital expenditure may be different. See material accounting policy: property, plant and equipment for more information. |
bp Annual Report and Form 20-F 2024 | 147 |
Financial statements |
Provisions: decommissioning |
The energy transition may bring forward the decommissioning of oil and gas industry assets thereby increasing the present value of associated decommissioning provisions. The majority of bp’s existing upstream oil and gas properties are expected to start decommissioning within the next two decades. Currently, the expected timing of decommissioning expenditures for the upstream oil and gas assets in the group’s portfolio has not materially been brought forward. Management does not expect a reasonably possible change of two years in the expected timing of all decommissioning to have a material effect on the upstream decommissioning provisions, assuming cost assumptions remain unchanged. Decommissioning cost estimates are based on the known regulatory and external environment. These cost estimates may change in the future, including as a result of the transition to a lower carbon economy. For refineries, decommissioning provisions are generally not recognized as the associated obligations have indeterminate settlement dates, typically driven by the cessation of manufacturing. Management does not expect manufacturing to cease at refineries within a determinate period of time, as existing property, plant and equipment is expected to be renewed or replaced. Management will continue to review facts and circumstances, including where cessation of manufacturing decisions have been made, to assess if decommissioning provisions need to be recognized. Decommissioning provisions relating to refineries at 31 December 2024 are not material. See significant judgements and estimates: provisions for further information. |
Judgements and estimates made in assessing the impact of the geopolitical and economic environment |
In preparing the consolidated financial statements, the following areas involving judgement and estimates were identified as most relevant with regards to the impact of the current geopolitical and economic environment. |
Oil and gas price assumptions |
Oil and gas price assumptions applied in value-in-use impairment testing have been updated for inflation and have been rebased in real 2023 terms. See significant judgements and estimates: recoverability of asset carrying values for further information. |
Discount rate assumptions |
The discount rates used for impairment testing and provisions were reassessed during the year in light of changing economic and geopolitical outlooks. The nominal discount rate applied to provisions was increased during the year to reflect higher US Treasury yields. The principal impact of this rate increase was a $ equipment of $ than renewable power assets remained consistent with 2023 as did the risk premium applied to the majority of countries classified as higher-risk. See significant judgements and estimates: recoverability of asset carrying values and provisions for further information. |
Pensions and other post-employment benefits |
The volatility in the financial markets during 2024 impacted the assumptions used for determining the fair value of plan assets and the present value of defined benefit obligations in the group’s defined benefit pension plans. See significant estimate: pensions and other post-employment benefits and Note 24 for further information. |
148 | bp Annual Report and Form 20-F 2024 |
Significant judgement: investment in Aker BP |
Judgement is required in assessing the level of control or influence over another entity in which the group holds an interest. For bp, the judgement that the group has significant influence over Aker BP, a Norwegian oil and gas company, is significant. As a consequence of this judgement, bp uses the equity method of accounting for its investment and bp's share of Aker BP's oil and natural gas reserves is included in the group's estimated net proved reserves of equity-accounted entities. If significant influence was not present, the investment would be accounted for as an investment in an equity instrument measured at fair value as described under 'Financial assets' below and no share of Aker BP's oil and natural gas reserves would be reported. Significant influence is defined in IFRS as the power to participate in the financial and operating policy decisions of the investee but is not control or joint control of those decisions. Significant influence is presumed when an entity owns 20% or more of the voting power of the investee. Significant influence is presumed not to be present when an entity owns less than 20% of the voting power of the investee. bp owned board during 2024. bp’s other nominated director, group chief financial officer, Kate Thomson, has been a member of the Aker BP board since formation of that company in 2016. She is also a member of the Aker BP board’s Audit and Risk Committee. bp also holds the voting rights at general meetings of shareholders conferred by its stake in Aker BP. bp's management considers, therefore, that the group continues to have significant influence at 31 December 2024. |
Significant judgements and estimate: investment in Rosneft |
Since the first quarter 2022, bp accounts for its interest in Rosneft and its other businesses with Rosneft within Russia, as financial assets measured at fair value within ‘Other investments’. bp is not able to sell its Rosneft shares on the Moscow Stock Exchange and is unable to ascribe probabilities to possible outcomes of any exit process. It is considered by management that any measure of fair value, other than nil, would be subject to such high measurement uncertainty, considering the sanctions and restrictions implemented by Russia on Russian assets held by foreign investors, that no estimate would provide useful information even if it were accompanied by a description of the estimate made in producing it and an explanation of the uncertainties that affect the estimate. Accordingly, it is not currently possible to estimate any carrying value other than measurement of the interest in Rosneft and the other businesses with Rosneft within Russia as at 31 December 2024. Events or outcomes within the next financial year, that are different to those outlined above, could materially change the fair value of the investment. Russia has imposed restrictions on the payments of dividends to certain foreign shareholders, including those based in the UK, requiring such dividends to be paid in roubles into restricted bank accounts and a requirement for approval of the Russian government for transfers from any such bank accounts out of Russia. Given the restrictions applicable to such accounts, management has made the significant judgement that the criteria for recognizing any dividend income from Rosneft and its other businesses with Rosneft within Russia, for the years to 31 December 2022, 31 December 2023 and 31 December 2024 have not been met. |
bp Annual Report and Form 20-F 2024 | 149 |
Financial statements |
150 | bp Annual Report and Form 20-F 2024 |
Significant judgement: exploration and appraisal intangible assets |
Judgement is required to determine whether it is appropriate to continue to carry costs associated with exploration wells and exploratory-type stratigraphic test wells on the balance sheet. This includes costs relating to exploration licences or leasehold property acquisitions. It is not unusual to have such costs remaining suspended on the balance sheet for several years while additional appraisal drilling and seismic work on the potential oil and natural gas field is performed or while the optimum development plans and timing are established. The costs are carried based on the current regulatory and political environment or any known changes to that environment. All such carried costs are subject to regular technical, commercial and management review on at least an annual basis to confirm the continued intent to develop, or otherwise extract value from, the discovery. Where this is no longer the case, the costs are immediately expensed. The carrying amount of capitalized costs are included in Note 8. |
Land improvements | |
Buildings | |
Refineries | |
Pipelines | |
Service stations | |
Office equipment | |
Fixtures and fittings |
bp Annual Report and Form 20-F 2024 | 151 |
Financial statements |
Significant judgements and estimates: recoverability of asset carrying values |
Determination as to whether, and by how much, an asset, CGU, or group of CGUs containing goodwill is impaired involves management estimates on highly uncertain matters such as the effects of inflation and deflation on operating expenses, discount rates, capital expenditure, carbon pricing (where applicable), production profiles, reserves and resources, and future commodity prices, including the outlook for global or regional market supply-and- demand conditions for crude oil, natural gas, power and refined products. Judgement is required when determining the appropriate grouping of assets into a CGU or the appropriate grouping of CGUs for impairment testing purposes. For example, individual oil and gas properties may form separate CGUs whilst certain oil and gas properties with shared infrastructure may be grouped together to form a single CGU. Alternative groupings of assets or CGUs may result in a different outcome from impairment testing. See Note 14 for details on how these groupings have been determined in relation to the impairment testing of goodwill. As described above, the recoverable amount of an asset is the higher of its value in use and its fair value less costs of disposal. Fair value less costs of disposal may be determined based on expected sales proceeds or similar recent market transaction data. Details of impairment charges and reversals recognized in the income statement are provided in Note 4 and details on the carrying amounts of assets are shown in Note 12, Note 14 and Note 15. The estimates for assumptions made in impairment tests in 2024 relating to discount rates and oil and gas properties are discussed below. Changes in the economic environment including as a result of the energy transition or other facts and circumstances may necessitate revisions to these assumptions and could result in a material change to the carrying values of the group's assets within the next financial year. |
152 | bp Annual Report and Form 20-F 2024 |
Discount rates |
For discounted cash flow calculations, future cash flows are adjusted for risks specific to the CGU. Value-in-use calculations are typically discounted using a pre-tax discount rate based upon the cost of funding the group derived from an established model, adjusted to a pre-tax basis and incorporating a market participant capital structure and country risk premiums. Fair value less costs of disposal discounted cash flow calculations use a post-tax discount rate. The discount rates applied in impairment tests are reassessed each year and, in 2024, the post-tax discount rate was renewable power assets. Where the CGU is located in a country that was judged to be higher risk, an additional premium of post-tax discount rate (2023 economic and geopolitical factors. The pre-tax discount rate, other than for renewable power assets, typically ranged from depending on the risk premium and applicable tax rate in the geographic location of the CGU. For renewable power assets, which were tested primarily on a fair-value basis in 2024 (including those in equity accounted entities) tests were performed using a post-tax cost of equity-based discount rate range of |
Oil and natural gas properties |
For oil and natural gas properties in the oil production & operations and gas & low carbon energy segments, expected future cash flows are estimated using management’s best estimate of future oil and natural gas prices, production and reserves and certain resources volumes. Forecast cash flows include the impact of all approved emission reduction projects. The estimated future level of production in all impairment tests is based on assumptions about future commodity prices, production and development costs, field decline rates, current fiscal regimes and other factors. In 2024, the group identified oil and gas properties in these segments with carrying amounts totalling $ headroom, based on the most recent impairment test performed in the year on those assets, was less than or equal to change in the discount rate, reserves, resources or the oil and gas price assumptions in the next financial year may result in a recoverable amount of one or more of these assets above or below the current carrying amount and therefore there is a risk of impairment reversals or charges in that period. Management considers that reasonably possible changes in the discount rate or forecast revenue, arising from a change in oil and natural gas prices and/or production could result in a material change in their carrying amounts within the next financial year, see Sensitivity analyses, below. The recoverability of intangible exploration and appraisal expenditure is covered under Oil and natural gas exploration, appraisal and development expenditure above. |
Oil and natural gas prices |
The price assumptions used for value-in-use impairment testing are based on those used for investment appraisal. bp’s carbon emissions cost assumptions and their interrelationship with oil and gas prices are described in 'Judgements and estimates made in assessing the impact of climate change and the transition to a lower carbon economy' on page 145. The investment appraisal price assumptions are recommended by the senior vice president economic & energy insights after considering a range of external price sets, and supply and demand profiles associated with various energy transition scenarios. They are reviewed and approved by management. As a result of the current uncertainty over the pace of transition to lower-carbon supply and demand and the social, political and environmental actions that will be taken to meet the goals of the Paris climate change agreement, the scenarios considered include those where those goals are met as well as those where they are not met. During the year, bp's price assumptions applied in value-in-use impairment testing were revised. The revised price assumptions have been rebased in real 2023 terms and are materially consistent with the disclosed prices in real 2022 terms. The near term Brent oil assumption was held constant at $ barrel to reflect near term supply constraints before declining after 2030 to $ system decarbonizes, falling oil demand will cause oil prices to decline. The price assumptions for Henry Hub gas up to 2050 were held constant at $ per mmBtu reflecting an assumption that declining domestic demand in the US is offset by higher LNG exports. These price assumptions are derived from the central case investment appraisal assumptions (see page 20). A summary of the group’s revised price assumptions for Brent oil and Henry Hub gas, applied in 2024 and 2023, in real 2023 terms, is provided below. The assumptions represent management’s best estimate of future prices at the balance sheet date, which sit within the range of external scenarios considered as appropriate for the purpose. They are considered by bp to be in line with a range of transition paths consistent with the temperature goal of the Paris climate change agreement, of holding the increase in the global average temperature to well below 2°C above pre-industrial levels and pursuing efforts to limit the temperature increase to 1.5°C above pre-industrial levels. However, they do not correspond to any specific Paris-consistent scenario. Inflation rate of assumptions in nominal terms. |
The majority of bp’s reserves and resources that support the carrying value of the group’s existing oil and gas properties are expected to be produced over the next 12 years. |
The recoverability of deferred tax assets is also affected by the group’s oil and natural gas price assumptions as these could impact the estimate of future taxable profits. See Note 9 for further information. |
2024 price assumptions | 2025 | 2030 | 2040 | 2050 | ||
Brent oil ($/bbl) | ||||||
Henry Hub gas ($/mmBtu) |
2023 price assumptions | 2024 | 2025 | 2030 | 2040 | 2050 | |
Brent oil ($/bbl) | ||||||
Henry Hub gas ($/mmBtu) |
bp Annual Report and Form 20-F 2024 | 153 |
Financial statements |
Global oil production increased by 1.4% in 2024 with this growth predominantly coming from non-OPEC countries as OPEC+ continued its output reductions. Global oil demand growth slowed, increasing by 0.9% in 2024 as we leave the post-Covid recovery period and Chinese demand fell short of forecasts. Brent dropped by nearly $2 per barrel in 2024 in response to lacklustre demand growth and increasing supply. While geopolitical risk (e.g., tariffs, sanctions) may support prices in the short-term, bp's long-term assumption for oil prices is lower than the 2024 average as oil demand is likely to fall such that the price levels needed to encourage sufficient investment to meet global oil demand will also be lower. US Henry Hub spot prices averaged $2.2/mmBtu in 2024 from $2.5/mmBtu in 2023. Prices fell further in order to reduce output and stimulate demand in the power sector. Milder than normal winter weather during winter 2023/2024 left US gas storage levels over 20% above historic average levels at the end of winter 2023/2024, causing prices to fall below $2/mmBtu. Meanwhile, after growing by 4 Bcf/d in 2023, low prices caused natural gas production to fall by 0.4 Bcf/d in 2024, helping to bring the market back into balance. The level of US gas prices in 2024 was below bp’s long term price assumption based on the judgment of the price level required to incentivize new production. |
Oil and natural gas reserves |
In addition to oil and natural gas prices, significant technical and commercial assessments are required to determine the group’s estimated oil and natural gas reserves. Reserves estimates are regularly reviewed and updated. Factors such as the availability of geological and engineering data, reservoir performance data, acquisition and divestment activity and drilling of new wells all impact on the determination of the group’s estimates of its oil and natural gas reserves. bp bases its reserves estimates on the requirement of reasonable certainty with rigorous technical and commercial assessments based on conventional industry practice and regulatory requirements. Reserves assumptions for value-in-use tests reflect the reserves and resources that management currently intend to develop. The recoverable amount of oil and gas properties is determined using a combination of inputs including reserves, resources and production volumes. Risk factors may be applied to reserves and resources which do not meet the criteria to be treated as proved or probable. |
Sensitivity analyses |
Management considers discount rates, oil and natural gas prices and production to be the key sources of estimation uncertainty in determining the recoverable amount of upstream oil and gas assets. The sensitivity analyses below, in addition to covering the key sources of estimation uncertainty, also indicate how the energy transition, potential future carbon emissions costs for operational GHG emissions and/or reduced demand for oil and gas may further impact forecast revenue cash inflows to a greater extent than currently anticipated in the group’s value-in-use estimates for oil and gas CGUs, if carbon emissions costs were to be implemented as a deduction against revenue cash flows. The analyses therefore represent a net revenue sensitivity. A change in net revenue from upstream oil and gas properties can arise either due to changes in oil and natural gas prices, carbon emissions costs/ carbon prices, changes in oil and natural gas production, or a combination of these. Management tested the impact of changes in net revenue cash flows in value-in-use impairment testing under the following sensitivity analyses: an increase in net revenues of 8% in all years up to 2040, and 25% in all remaining years to 2050; and a decrease in net revenues of 20% in all years up to 2030, 35% in all subsequent years to 2040 and 50% in all remaining years to 2050. Net revenue reductions of this magnitude in isolation could indicatively lead to a reduction in the carrying amount of bp’s currently held upstream oil and gas properties in the range of $ December 2024. If this net revenue reduction was due to reductions in prices in isolation, it reflects an indicative decrease in the carrying amount of using price assumptions for Brent oil trending broadly towards the bottom of the range of prices associated with the World Business Council for Sustainable Development (WBCSD) 'family' of scenarios considered to be consistent with limiting global average temperature to 1.5°C above pre-industrial levels. This ‘family’ of scenarios is also used in bp's TCFD scenario analysis (see page 42). Net revenue increases of this magnitude in isolation could indicatively lead to an increase in the carrying amount of bp’s currently held upstream oil and gas properties in the range of $ December 2024. This potential increase in the carrying amount would arise due to reversals of previously recognized impairments and represents approximately one fifth of the total impairment reversal capacity available at 31 December 2024. If this net revenue increase was due to increases in prices in isolation, it reflects an indicative increase in the carrying amount of using price assumptions for Brent oil trending broadly towards the top end until 2040, and then towards the mean average at 2050, of the range of prices associated with the WBCSD 'family' of scenarios considered to be consistent with limiting global average temperature to 1.5°C above pre-industrial levels. This ‘family’ of scenarios is also used in bp's TCFD scenario analysis. |
These sensitivity analyses do not, however, represent management’s best estimate of any impairment charges or reversals that might be recognized as they do not fully incorporate consequential changes that may arise, such as changes in costs and business plans and phasing of development. For example, costs across the industry are more likely to decrease as oil and natural gas prices fall. The analyses also assume the impact of increases in carbon price on operational GHG emissions are fully absorbed as a decrease in net revenue (and vice versa) rather than reflecting how carbon prices or other carbon emissions costs may ultimately be incorporated by the market. The above sensitivity analyses therefore do not reflect a linear relationship between net revenue and value that can be extrapolated. The interdependency of these inputs and factors plus the diverse characteristics of the group's upstream oil and gas properties limits the practicability of estimating the probability or extent to which the overall recoverable amount is impacted by changes to the price assumptions or production volumes. Management also tested the impact of a one percentage point change in the discount rate used for value-in-use impairment testing of upstream oil and gas properties. This level of change reflects past experience of a reasonable change in rate that could arise within the next financial year. If the discount rate was one percentage point higher across all tests performed, the net impairment loss recognized in 2024 would have been approximately $ higher. If the discount rate was one percentage point lower, the net impairment loss recognized would have been approximately $ |
154 | bp Annual Report and Form 20-F 2024 |
Management considers refining margins to be the key source of estimation uncertainty in determining the recoverable amount of refinery assets. The sensitivity analysis below, in addition to covering the key sources of estimation uncertainty, also indicates how the energy transition and/or reduced demand for refined products may further impact forecast cash inflows to a greater extent than currently anticipated in the group’s value-in-use estimates for refinery CGUs. Management tested the impact of a $1/barrel decrease in each refinery’s future margin assumption in all years of the value-in-use estimate. A reduction of this magnitude in isolation could indicatively lead to a reduction in the carrying amount of bp’s currently held refining property, plant and equipment in the range of $ This sensitivity analysis does not, however, represent management’s best estimate of any impairment charges that might be recognized as it does not fully incorporate consequential changes that may arise, such as changes in costs and business plans and crude or product slates. The above sensitivity analysis therefore does not reflect a linear relationship between margins and value that can be extrapolated. The interdependency of these inputs and factors plus the varying configurations of the group's refineries limits the practicability of estimating the probability or extent to which the overall recoverable amount is impacted by changes to the margin assumptions. |
Goodwill |
Irrespective of whether there is any indication of impairment, bp is required to test annually for impairment of goodwill acquired in business combinations. The group carries goodwill of $ Castrol, Devon Energy, Reliance and Lightsource bp transactions. Of this, $ hydrocarbon CGUs within the gas & low carbon energy segment (2023 $ sources of estimation uncertainty. Sensitivities and additional information relating to impairment testing of goodwill in these segments are provided in Note 14. |
bp Annual Report and Form 20-F 2024 | 155 |
Financial statements |
156 | bp Annual Report and Form 20-F 2024 |
Significant judgement: supplier financing arrangements |
The group’s trade payables include some supplier financing arrangements that utilize letter of credit facilities, promissory notes and reverse factoring. Judgement is required to assess the payables subject to these arrangements to determine whether they should continue to be classified as trade payables and give rise to operating cash flows or finance debt and financing cash flows. The criteria used in making this assessment include the payment terms for the amount due relative to terms commonly seen in the markets in which bp operates and whether the arrangements significantly change the nature of the liability. Liabilities subject to these arrangements with payment terms of up to approximately 60 days are generally considered to be trade payables and give rise to operating cash flows. See Note 29 - Liquidity risk for further information. |
bp Annual Report and Form 20-F 2024 | 157 |
Financial statements |
Significant estimate and judgement: derivative financial instruments |
In some cases the fair values of derivatives are estimated using internal models due to the absence of quoted prices or other observable, market- corroborated data. This primarily applies to the group’s longer-term derivative contracts. The majority of these contracts are valued using models with inputs that include price curves for each of the different products that are built up from available active market pricing data (including volatility and correlation) and modelled using the maximum available external information. Additionally, where limited data exists for certain products, prices are determined using historical and long-term pricing relationships. The use of alternative assumptions or valuation methodologies may result in significantly different values for these derivatives. A reasonably possible change in the price assumptions used in the models relating to index price would not have a material impact on net assets and the Group income statement primarily as a result of offsetting movements between derivative assets and liabilities. In some cases, judgement is required to determine whether contracts to buy or sell commodities meet the definition of a derivative or to determine appropriate presentation and classification of transactions in certain cases. In particular, contracts to buy and sell LNG are not considered to meet the definition as they are not considered capable of being net settled due to a lack of liquidity in the LNG market and the inability or lack of history of net settlement and are accounted for on an accruals basis, rather than as a derivative. Under IFRS, bp fair values the derivative financial instruments used to risk-manage the LNG contracts themselves, resulting in a measurement mismatch. For more information, including the carrying amounts of level 3 derivatives, see Note 30. |
158 | bp Annual Report and Form 20-F 2024 |
bp Annual Report and Form 20-F 2024 | 159 |
Financial statements |
Significant judgements and estimates: provisions |
The group holds provisions for the future decommissioning of oil and natural gas production facilities and pipelines at the end of their economic lives. The largest decommissioning obligations facing bp relate to the plugging and abandonment of wells and the removal and disposal of oil and natural gas platforms and pipelines around the world. Most of these decommissioning events are many years in the future and the precise requirements that will have to be met when the removal event occurs are uncertain. Decommissioning technologies and costs are constantly changing, as are political, environmental, safety and public expectations. The timing and amounts of future cash flows are subject to significant uncertainty and estimation is required in determining the amounts of provisions to be recognized. Any changes in the expected future costs are reflected in both the provision and, where still recognized, the asset. If oil and natural gas production facilities and pipelines are sold to third parties, judgement is required to assess whether the new owner will be unable to meet their decommissioning obligations, whether bp would then be responsible for decommissioning, and if so the extent of that responsibility. This typically requires assessment of the local legal requirements and the financial standing of the owner. If the standing deteriorates significantly, for example, bankruptcy of the owner, a provision may be required. The group has $ 2024 (2023 $ 33 for further information. Decommissioning provisions associated with refineries are generally not recognized, as the potential obligations cannot be measured, given their indeterminate settlement dates. Obligations may arise if refineries cease manufacturing operations and any such obligations would be recognized in the period when sufficient information becomes available to determine potential settlement dates. See Note 33 for further information. The group performs periodic reviews of its refineries for any changes in facts and circumstances including those relating to the energy transition, that might require the recognition of a decommissioning provision. Portfolio strength and flexibility are such that the point of cessation of manufacturing at the group’s operating refineries is not yet expected within a determinate time period, as existing property plant and equipment is expected to be renewed or replaced. The provision for environmental liabilities is estimated based on current legal and constructive requirements, technology, price levels and expected plans for remediation. Actual costs and cash outflows can differ from current estimates because of changes in laws and regulations, public expectations, prices, discovery and analysis of site conditions and changes in clean-up technology. The timing and amount of future expenditures relating to decommissioning and environmental liabilities are reviewed annually. The interest rate used in discounting the cash flows is reviewed quarterly. The nominal interest rate used to determine the balance sheet obligations at the end of 2024 was (2023 weighted average period over which decommissioning and environmental costs are generally expected to be incurred is estimated to be approximately (2023 are expected to remain fixed at current or past prices. The estimated phasing of undiscounted cash flows in real terms for upstream decommissioning is approximately $ the next 10 years, $ timing and amount of decommissioning cash flows are inherently uncertain and therefore the phasing is management’s current best estimate but may not be what will ultimately occur. Further information about the group’s provisions is provided in Note 23. Changes in assumptions in relation to the group's provisions could result in a material change in their carrying amounts within the next financial year. A decrease the group’s provision balances by approximately $ credit of approximately $ the next financial year. The discounting impact on the group's decommissioning provisions for oil and gas properties in the oil productions & operations and gas & low carbon energy segments of a two-year change in the timing of expected future decommissioning expenditures is approximately $ Management currently does not consider a change of greater than two years to be reasonably possible in the next financial year and therefore the timing of upstream decommissioning expenditure is not a key source of estimation uncertainty. If all expected future decommissioning expenditures were 10% higher, then these decommissioning provisions would increase by approximately $ billion (2023 $ the inflation rate applied to upstream decommissioning costs to determine the nominal cash flows could increase the decommissioning provision by approximately $ As described in Note 33, the group is subject to claims and actions for which no provisions have been recognized. The facts and circumstances relating to particular cases are evaluated regularly in determining whether a provision relating to a specific litigation should be recognized or revised. Accordingly, significant management judgement relating to provisions and contingent liabilities is required, since the outcome of litigation is difficult to predict. |
160 | bp Annual Report and Form 20-F 2024 |
Significant estimate: pensions and other post-employment benefits |
Accounting for defined benefit pensions and other post-employment benefits involves making significant estimates when measuring the group's pension plan surpluses and deficits. These estimates require assumptions to be made about many uncertainties. Pensions and other post-employment benefit assumptions are reviewed by management at the end of each year. These assumptions are used to determine the projected benefit obligation at the year end and hence the surpluses and deficits recorded on the group's balance sheet and pension and other post-employment benefit expense for the following year. The assumptions that are the most significant to the amounts reported are the discount rate, inflation rate and mortality levels. Assumptions about these variables are based on the environment in each country. The assumptions used vary from year to year, with resultant effects on future net income and net assets. Changes to some of these assumptions, in particular the discount rate and inflation rate, could result in material changes to the carrying amounts of the group's pension and other post-employment benefit obligations within the next financial year. Any differences between these assumptions and the actual outcome will also affect future net income and net assets. The values ascribed to these assumptions and a sensitivity analysis of the impact of changes in the assumptions on the benefit expense and obligation used are provided in Note 24. |
bp Annual Report and Form 20-F 2024 | 161 |
Financial statements |
Significant judgement and estimate: taxation |
The value of deferred tax assets and liabilities is an area involving inherent uncertainty and estimation and balances are therefore subject to risk of material change as a result of underlying assumptions and judgements used, in particular the forecast of future profitability used to determine the recoverability of deferred tax, for example future oil and gas prices, see ‘Significant judgement and estimates - Recoverability of asset carrying values’. It is impracticable to disclose the extent of the possible effects of profitability assumptions on the group’s deferred tax assets. It is reasonably possible that to the extent that actual outcomes differ from management’s estimates, material income tax charges or credits, and material changes in current and deferred tax assets or liabilities, may arise within the next financial year and in future periods. Judgement is required when determining whether a particular tax is an income tax or another type of tax (for example, a production tax). The attributes of the tax, including whether it is calculated on profits or another measure such as production or revenues, the extent of deductibility of costs and the interaction with existing income taxes, are considered in determining the classification of the tax. Accounting for deferred tax is applied to income taxes as described above but is not applied to other types of taxes; rather such taxes are recognized in the income statement in accordance with the applicable accounting policy such as Provisions and contingencies. This judgement is considered significant only in relation to the group’s taxes payable under the fiscal terms of bp’s onshore concession in Abu Dhabi. These are principally reported as income taxes rather than as production taxes. For more information see Note 9 and Note 33. |
162 | bp Annual Report and Form 20-F 2024 |
bp Annual Report and Form 20-F 2024 | 163 |
Financial statements |
$ million | |||
2024 | 2023 | ||
Property, plant and equipment | |||
Intangible assets | |||
Investments in joint ventures | |||
Loans | |||
Cash | |||
Trade and other receivables | |||
Assets classified as held for sale | |||
Trade and other payables | ( | ( | |
Lease liabilities | ( | ( | |
Finance debt | ( | ||
Provisions | ( | ( | |
Defined benefit pension plan and other post-employment benefit plan deficits | ( | ||
Liabilities directly associated with assets classified as held for sale | ( | ( |
164 | bp Annual Report and Form 20-F 2024 |
$ million | ||||
2024 | 2023 | 2022 | ||
Gains on sale of businesses and fixed assets | ||||
gas & low carbon energy | ||||
oil production & operations | ||||
customers & products | ||||
other businesses & corporate | ||||
$ million | ||||
2024 | 2023 | 2022 | ||
Losses on sale of businesses and fixed assets, and closures | ||||
gas & low carbon energy | ||||
oil production & operations | ||||
customers & products | ||||
other businesses & corporate | ( | |||
Impairment losses | ||||
gas & low carbon energy | ||||
oil production & operations | ||||
customers & products | ||||
other businesses & corporate | ||||
Impairment reversals | ||||
gas & low carbon energy | ( | ( | ( | |
oil production & operations | ( | ( | ( | |
customers & products | ( | ( | ||
other businesses & corporate | ( | ( | ||
( | ( | ( | ||
Impairment and losses on sale of businesses and fixed assets, and closures |
bp Annual Report and Form 20-F 2024 | 165 |
Financial statements |
$ million | ||||
2024 | 2023 | 2022 | ||
Proceeds from disposals of fixed assets | ||||
Proceeds from disposals of businesses, net of cash disposed | ||||
By business | ||||
gas & low carbon energy | ||||
oil production & operations | ||||
customers & products | ||||
other businesses & corporate | ||||
166 | bp Annual Report and Form 20-F 2024 |
$ million | ||||
2024 | 2023 | 2022 | ||
Non-current assets | ||||
Current assets | ||||
Non-current liabilities | ( | ( | ( | |
Current liabilities | ( | ( | ( | |
Total carrying amount of net assets disposed | ||||
Recycling of foreign exchange on disposal | ( | |||
Costs on disposal | ||||
Gains (losses) on sale of businesses | ( | |||
Total consideration | ||||
Non-cash consideration | ( | ( | ( | |
Consideration received (receivable) | ( | |||
Proceeds from the sale of businesses, net of cash disposeda |
bp Annual Report and Form 20-F 2024 | 167 |
Financial statements |
168 | bp Annual Report and Form 20-F 2024 |
$ million | |||||||
2024 | |||||||
By business | gas & low carbon energy | oil production & operations | customers & products | other businesses & corporate | Consolidation adjustment and eliminations | Total group | |
Segment revenues | |||||||
Sales and other operating revenues | ( | ||||||
Less: sales and other operating revenues between segments | ( | ( | ( | ( | |||
Third party sales and other operating revenues | |||||||
Earnings from joint ventures and associates – after interest and tax | ( | ||||||
Segment results | |||||||
Replacement cost profit (loss) before interest and taxation | ( | ( | ( | ||||
Inventory holding gains (losses)a | ( | ( | ( | ||||
Profit (loss) before interest and taxation | ( | ( | ( | ||||
Finance costs | ( | ||||||
Net finance income relating to pensions and other post- employment benefits | |||||||
Profit before taxation | |||||||
Other income statement items | |||||||
Depreciation, depletion and amortization | |||||||
US | |||||||
Non-US | |||||||
Charges for provisions, net of write-back of unused provisions, including change in discount rate | |||||||
Segment assets | |||||||
Investments in joint ventures and associates | |||||||
Additions to non-current assetsb |
bp Annual Report and Form 20-F 2024 | 169 |
Financial statements |
$ million | |||||||
2023 | |||||||
By business | gas & low carbon energy | oil production & operations | customers & products | other businesses & corporate | Consolidation adjustment and eliminations | Total group | |
Segment revenues | |||||||
Sales and other operating revenues | ( | ||||||
Less: sales and other operating revenues between segments | ( | ( | ( | ( | |||
Third party sales and other operating revenues | |||||||
Earnings from joint ventures and associates – after interest and tax | ( | ( | |||||
Segment results | |||||||
Replacement cost profit (loss) before interest and taxation | ( | ( | |||||
Inventory holding gains (losses)a | ( | ( | |||||
Profit (loss) before interest and taxation | ( | ( | |||||
Finance costs | ( | ||||||
Net finance income relating to pensions and other post- employment benefits | |||||||
Profit before taxation | |||||||
Other income statement items | |||||||
Depreciation, depletion and amortization | |||||||
US | |||||||
Non-US | |||||||
Charges for provisions, net of write-back of unused provisions, including change in discount rate | |||||||
Segment assets | |||||||
Investments in joint ventures and associates | |||||||
Additions to non-current assetsb |
170 | bp Annual Report and Form 20-F 2024 |
$ million | |||||||
2022 | |||||||
By business | gas & low carbon energy | oil production & operations | customers & products | other businesses & corporate | Consolidation adjustment and eliminations | Total group | |
Segment revenues | |||||||
Sales and other operating revenues | ( | ||||||
Less: sales and other operating revenues between segments | ( | ( | ( | ( | |||
Third party sales and other operating revenues | |||||||
Earnings from joint ventures and associates – after interest and tax | |||||||
Segment results | |||||||
Replacement cost profit (loss) before interest and taxation | ( | ||||||
Inventory holding gains (losses)a | ( | ( | |||||
Profit (loss) before interest and taxation | ( | ||||||
Finance costs | ( | ||||||
Net finance income relating to pensions and other post- employment benefits | |||||||
Profit before taxation | |||||||
Other income statement items | |||||||
Depreciation, depletion and amortization | |||||||
US | |||||||
Non-US | |||||||
Charges for provisions, net of write-back of unused provisions, including change in discount rate | ( | ||||||
Segment assets | |||||||
Investments in joint ventures and associates | |||||||
Additions to non-current assetsb |
$ million | ||||
2024 | ||||
By geographical area | US | Non-US | Total | |
Revenues | ||||
Third party sales and other operating revenuesa | ||||
Other income statement items | ||||
Production and similar taxes | ||||
Non-current assets | ||||
Non-current assetsb c |
$ million | ||||
2023 | ||||
By geographical area | US | Non-US | Total | |
Revenues | ||||
Third party sales and other operating revenuesa | ||||
Other income statement items | ||||
Production and similar taxes | ||||
Non-current assets | ||||
Non-current assetsb c |
bp Annual Report and Form 20-F 2024 | 171 |
Financial statements |
$ million | ||||
2022 | ||||
By geographical area | US | Non-US | Total | |
Revenues | ||||
Third party sales and other operating revenuesa | ||||
Other income statement items | ||||
Production and similar taxes | ||||
Non-current assets | ||||
Non-current assetsb c |
$ million | ||||
2024 | 2023 | 2022 | ||
Crude oil | ||||
Oil products | ||||
Natural gas, LNG and NGLs | ||||
Non-oil products and other revenues from contracts with customers | ||||
Revenue from contracts with customers | ||||
Other operating revenuesa | ||||
Total sales and other operating revenues |
$ million | ||||
2024 | 2023 | 2022 | ||
Interest and other income | ||||
Interest income from | ||||
Financial assets measured at amortized cost | ||||
Financial assets measured at fair value through profit or loss | ||||
Other incomea | ||||
Currency exchange losses charged to the income statementb | ||||
Expenditure on research and development | ||||
Costs relating to the Gulf of America oil spill (pre-interest and tax)c | ||||
Finance costs | ||||
Interest expense on lease liabilities | ||||
Interest expense on other liabilities measured at amortized costd | ||||
Capitalized at | ( | ( | ( | |
Finance debt risk management activitiesf | ( | |||
Unwinding of discount on provisions | ||||
Unwinding of discount on other payables measured at amortized cost | ||||
172 | bp Annual Report and Form 20-F 2024 |
$ million | ||||
2024 | 2023 | 2022 | ||
Exploration and evaluation costs | ||||
Exploration expenditure written off | ||||
Other exploration costs | ||||
Exploration expense for the year | ||||
Impairment losses | ||||
Intangible assets – exploration and appraisal expenditurea | ||||
Liabilities | ||||
Net assets | ||||
Cash used in operating activities | ||||
Cash used in investing activities |
$ million | ||||
2024 | 2023 | 2022 | ||
Current tax | ||||
Charge for the yeara | ||||
Adjustment in respect of prior years | ( | |||
Deferred tax | ||||
Origination and reversal of temporary differences in the current yearb | ( | ( | ||
Adjustment in respect of prior yearsc | ( | ( | ( | |
( | ( | |||
Tax charge on profit |
bp Annual Report and Form 20-F 2024 | 173 |
Financial statements |
$ million | ||||||
2024 | 2023 | 2022 excluding impact of Rosneft | 2022 impact of Rosnefta | 2022 | ||
Profit (loss) before taxation | ( | |||||
Tax charge (credit) on profit or lossb | ( | |||||
Effective tax rate | ||||||
% | ||||||
Tax rate computed at the weighted average statutory ratec | ||||||
Increase (decrease) resulting from | ||||||
Tax reported in equity-accounted entities | ( | ( | ( | ( | ||
Adjustments in respect of prior years | ( | ( | ( | |||
Deferred tax not recognized | ( | ( | ||||
Tax incentives for investment | ( | ( | ||||
Disposal impactsd | ( | ( | ||||
Foreign exchange | ||||||
Items not deductible for tax purposes | ||||||
Impact of bp's decision to exit its shareholding in Rosneft | ( | |||||
Tax rate change effect of UK Energy Profits Levye | ||||||
Otherf | ||||||
Effective tax rate |
$ million | |||
Analysis of movements during the year in the net deferred tax liability | 2024 | 2023 | |
At 1 January | |||
Exchange adjustments | |||
Charge (credit) for the year in the income statement | ( | ( | |
Charge (credit) for the year in other comprehensive income | ( | ( | |
Charge (credit) for the year in equity | |||
Acquisitions and disposals | |||
At 31 December |
174 | bp Annual Report and Form 20-F 2024 |
$ million | ||||||
Income statement | Balance sheet | |||||
2024 | 2023 | 2022 | 2024 | 2023 | ||
Deferred tax liability | ||||||
Depreciation | ( | ( | ||||
Pension plan surplusesa | ||||||
Derivative financial instruments | ( | |||||
Other taxable temporary differencesb | ( | ( | ||||
( | ( | |||||
Deferred tax asset | ||||||
Depreciation | ( | ( | ( | ( | ( | |
Lease liabilities | ( | ( | ( | ( | ( | |
Pension plan and other post-employment benefit plan deficits | ( | ( | ( | |||
Decommissioning, environmental and other provisions | ( | ( | ||||
Derivative financial instruments | ( | ( | ( | ( | ( | |
Tax credits | ( | ( | ( | ( | ||
Loss carry forward | ( | ( | ||||
Other deductible temporary differencesc | ( | ( | ( | ( | ||
( | ( | ( | ||||
Net deferred tax charge (credit) and net deferred tax liability | ( | ( | ||||
Of which – deferred tax liabilities | ||||||
– deferred tax assets | ||||||
$ billion | |||
At 31 December | 2024 | 2023 | |
Unused US state tax lossesa | |||
Unused tax losses – other jurisdictionsb | |||
Unused tax credits | |||
of which – arising in the UKc | |||
– arising in the USd | |||
Deductible temporary differencese | |||
Taxable temporary differences associated with investments in subsidiaries and equity-accounted entities |
$ million | ||||
Impact of previously unrecognized deferred tax or write-down of deferred tax assets on tax charge | 2024 | 2023 | 2022 | |
Current tax benefit relating to the utilization of previously unrecognized deferred tax assets | ||||
Deferred tax benefit arising from the reversal of a previous write-down of deferred tax assets | ||||
Deferred tax benefit relating to the recognition of previously unrecognized deferred tax assets | ||||
Deferred tax expense arising from the write-down of a previously recognized deferred tax asset |
bp Annual Report and Form 20-F 2024 | 175 |
Financial statements |
Pence per share | Cents per share | $ million | ||||||||
2024 | 2023 | 2022 | 2024 | 2023 | 2022 | 2024 | 2023 | 2022 | ||
Dividends announced and paid in cash | ||||||||||
Preference shares | ||||||||||
Ordinary shares | ||||||||||
March | ||||||||||
June | ||||||||||
September | ||||||||||
December | ||||||||||
Dividend announced, paid in March 2025 | ||||||||||
Cents per share | ||||
Per ordinary share | 2024 | 2023 | 2022 | |
Basic earnings per share | ( | |||
Diluted earnings per share | ( | |||
Dollars per share | ||||
Per American Depositary Share (ADS)a | 2024 | 2023 | 2022 | |
Basic earnings per share | ( | |||
Diluted earnings per share | ( | |||
$ million | ||||
2024 | 2023 | 2022 | ||
Profit (loss) attributable to bp shareholders | ( | |||
Less: dividend requirements on preference shares | ||||
Less: (gain) loss on redemption of perpetual hybrid bondsa | ( | |||
Profit (loss) for the year attributable to bp ordinary shareholders | ( | |||
Shares thousand | ||||
2024 | 2023 | 2022 | ||
Basic weighted average number of ordinary sharesb | ||||
Potential dilutive effect of ordinary shares issuable under employee share-based payment plans | ||||
Weighted average number of ordinary shares outstanding used to calculate diluted earnings per share | ||||
Shares thousand | ||||
2024 | 2023 | 2022 | ||
Basic weighted average number of ordinary shares – ADS equivalent | ||||
Potential dilutive effect of ordinary shares (ADS equivalent) issuable under employee share-based payment plans | ||||
Weighted average number of ordinary shares (ADS equivalent) outstanding used to calculate diluted earnings per share |
176 | bp Annual Report and Form 20-F 2024 |
Share options | 2024 | 2023 | |||
Number of optionsa b thousand | Weighted average exercise price $ | Number of optionsa b thousand | Weighted average exercise price $ | ||
Outstanding | |||||
Exercisable | |||||
Dilutive effect | n/a | n/a |
Share plans | 2024 | 2023 | |
Number of sharesa | Number of sharesa | ||
Vesting | thousand | thousand | |
Within one year | |||
1 to 2 years | |||
2 to 3 years | |||
3 to 4 years | |||
Over 4 years | |||
Dilutive effect |
bp Annual Report and Form 20-F 2024 | 177 |
Financial statements |
$ million | |||||||||
Land and land improvements | Buildings | Oil and gas propertiesa | Plant, machinery and equipment | Fittings, fixtures and office equipment | Transportation | Oil depots, storage tanks and service stations | Total | ||
Cost - owned PP&E | |||||||||
At 1 January 2024 | |||||||||
Exchange adjustments | ( | ( | ( | ( | ( | ( | ( | ||
Additions | |||||||||
Acquisitions | |||||||||
Transfers from intangible assets | |||||||||
Reclassified as assets held for sale | ( | ( | ( | ( | ( | ( | |||
Deletions and disposals | ( | ( | ( | ( | ( | ( | ( | ( | |
At 31 December 2024 | |||||||||
Depreciation - owned PP&E | |||||||||
At 1 January 2024 | |||||||||
Exchange adjustments | ( | ( | ( | ( | ( | ( | ( | ||
Charge for the year | |||||||||
Impairment losses | |||||||||
Impairment reversals | ( | ( | ( | ( | |||||
Reclassified as assets held for sale | ( | ( | ( | ( | ( | ( | |||
Deletions and disposals | ( | ( | ( | ( | ( | ( | ( | ( | |
At 31 December 2024 | |||||||||
Owned PP&E - net book amount at 31 December 2024 | |||||||||
Right-of-use assets - net book amount at 31 December 2024b | |||||||||
Total PP&E - net book amount at 31 December 2024 | |||||||||
Cost - owned PP&E | |||||||||
At 1 January 2023 | |||||||||
Exchange adjustments | |||||||||
Additions | |||||||||
Acquisitions | |||||||||
Transfers from intangible assets | |||||||||
Reclassified as assets held for sale | ( | ( | ( | ( | ( | ( | |||
Deletions and disposals | ( | ( | ( | ( | ( | ( | ( | ( | |
At 31 December 2023 | |||||||||
Depreciation - owned PP&E | |||||||||
At 1 January 2023 | |||||||||
Exchange adjustments | |||||||||
Charge for the year | |||||||||
Impairment losses | |||||||||
Impairment reversals | ( | ( | ( | ||||||
Reclassified as assets held for sale | ( | ( | ( | ( | ( | ( | |||
Deletions and disposals | ( | ( | ( | ( | ( | ( | ( | ( | |
At 31 December 2023 | |||||||||
Owned PP&E - net book amount at 31 December 2023 | |||||||||
Right-of-use assets - net book amount at 31 December 2023b | |||||||||
Total PP&E - net book amount at 31 December 2023 | |||||||||
Assets under construction included above | |||||||||
At 31 December 2024 | |||||||||
At 31 December 2023 | |||||||||
Depreciation charge for the year on right-of-use assets | |||||||||
2024 | |||||||||
2023 |
178 | bp Annual Report and Form 20-F 2024 |
$ million | |||
2024 | 2023 | ||
Cost | |||
At 1 January | |||
Exchange adjustments | ( | ||
Acquisitions and other additions | |||
Reclassified as assets held for sale | ( | ||
Deletions and disposals | ( | ||
At 31 December | |||
Impairment losses | |||
At 1 January | |||
Exchange adjustments | ( | ||
Impairment losses for the year | |||
Deletions and disposals | ( | ||
At 31 December | |||
Net book amount at 31 December | |||
Net book amount at 1 January |
$ million | |||
Goodwill at 31 December | 2024 | 2023 | |
gas & low carbon energy | |||
oil production & operations | |||
customers & products | |||
other businesses & corporate | |||
$ million | $ million | |||||||||
gas & low carbon energy | oil production & operations | |||||||||
2024 | 2023 | 2024 | 2023 | |||||||
Gas | LSbp | Total | Gas | LSbp | Total | |||||
Goodwill | ||||||||||
Excess of recoverable amount over carrying amount | ||||||||||
bp Annual Report and Form 20-F 2024 | 179 |
Financial statements |
$ million | |||||||||||||
2024 | 2023 | ||||||||||||
Castrol | US Fuels | European Fuels | Archaea | Other | Total | Castrol | US Fuels | European Fuels | Archaea | Other | Total | ||
Goodwill |
180 | bp Annual Report and Form 20-F 2024 |
$ million | |||||||||
2024 | 2023 | ||||||||
Exploration and appraisal expenditurea | Biogas rights agreements | Other intangibles | Total | Exploration and appraisal expenditurea | Biogas rights agreements | Other intangibles | Total | ||
Cost | |||||||||
At 1 January | |||||||||
Exchange adjustments | ( | ( | |||||||
Acquisitionsb | |||||||||
Remeasurements of acquisition accountingc | ( | ( | |||||||
Additions | |||||||||
Transfers to property, plant and equipment | ( | ( | ( | ( | |||||
Reclassified as assets held for sale | ( | ( | ( | ( | ( | ||||
Deletions and disposals | ( | ( | ( | ( | ( | ( | ( | ( | |
At 31 December | |||||||||
Amortization | |||||||||
At 1 January | |||||||||
Exchange adjustments | ( | ( | |||||||
Exploration expenditure written off | |||||||||
Charge for the year | |||||||||
Impairment losses | |||||||||
Impairment reversals | ( | ( | |||||||
Reclassified as assets held for sale | ( | ( | ( | ( | |||||
Deletions and disposals | ( | ( | ( | ( | ( | ( | ( | ( | |
At 31 December | |||||||||
Net book amount at 31 December | |||||||||
Net book amount at 1 January |
$ million | ||||||
Income statement | Balance sheet | |||||
Earnings from joint ventures - after interest and tax | Investments in joint ventures | |||||
2024 | 2023 | 2022 | 2024 | 2023 | ||
Azule Energy | ||||||
Pan American Energy Group | ||||||
Other joint venturesa | ( | |||||
bp Annual Report and Form 20-F 2024 | 181 |
Financial statements |
$ million | ||||||
Gross amount | ||||||
2024 | 2023 | 2022 | ||||
Azule Energy | Azule Energy | Azule Energy | PAEG | |||
Sales and other operating revenues | ||||||
Profit (loss) before interest and taxation | ||||||
Finance costs | ||||||
Profit (loss) before taxationa | ||||||
Taxation | ||||||
Profit (loss) for the year | ||||||
Other comprehensive income | ||||||
Total comprehensive income | ||||||
Non-current assets | ||||||
Current assetsb | ||||||
Total assets | ||||||
Current liabilitiesc | ||||||
Non-current liabilitiesd | ||||||
Total liabilities | ||||||
Net assets | ||||||
Less: non-controlling interests | ||||||
$ million | |||||||||||
bp share | |||||||||||
2024 | 2023 | 2022 | |||||||||
Azule Energy | Other | Total | Azule Energy | Other | Total | Azule Energy | PAEG | Other | Total | ||
Sales and other operating revenues | |||||||||||
Profit (loss) before interest and taxation | ( | ||||||||||
Finance costs | |||||||||||
Profit (loss) before taxation | ( | ( | |||||||||
Taxation | ( | ( | |||||||||
Non-controlling interest | |||||||||||
Profit (loss) for the year | ( | ||||||||||
Other comprehensive income | ( | ( | |||||||||
Total comprehensive income | ( | ||||||||||
Non-current assets | |||||||||||
Current assets | |||||||||||
Total assets | |||||||||||
Current liabilities | |||||||||||
Non-current liabilities | |||||||||||
Total liabilities | |||||||||||
Net assets | |||||||||||
Less: non-controlling interests | ( | ( | ( | ( | |||||||
Group investment in joint ventures | |||||||||||
Group share of net assets (as above) | |||||||||||
Cumulative impairment charge | ( | ( | ( | ( | |||||||
Loans made by group companies to joint ventures | ( | ( | ( | ( | |||||||
182 | bp Annual Report and Form 20-F 2024 |
$ million | |||||||
Sales to joint ventures | 2024 | 2023 | 2022 | ||||
Product | Sales | Amount receivable at 31 December | Sales | Amount receivable at 31 December | Sales | Amount receivable at 31 December | |
LNG, crude oil and oil products, natural gas | |||||||
Purchases from joint ventures | 2024 | 2023 | 2022 | ||||
Product | Purchases | Amount payable at 31 December | Purchases | Amount payable at 31 December | Purchases | Amount payable at 31 December | |
LNG, crude oil and oil products, natural gas, refinery operating costs, plant processing fees |
$ million | ||||||
Income statement | Balance sheet | |||||
Earnings from associates - after interest and tax | Investments in associates | |||||
2024 | 2023 | 2022 | 2024 | 2023 | ||
Rosneft | ||||||
Other associates | ||||||
bp Annual Report and Form 20-F 2024 | 183 |
Financial statements |
$ million | ||||
bp share | ||||
2024 | 2023 | 2022 | ||
Sales and other operating revenues | ||||
Profit before interest and taxation | ||||
Finance costs | ||||
Profit (loss) before taxation | ||||
Taxation | ||||
Non-controlling interests | ||||
Profit (loss) for the year | ||||
Other comprehensive income | ( | ( | ||
Total comprehensive income | ||||
Non-current assets | ||||
Current assets | ||||
Total assets | ||||
Current liabilities | ||||
Non-current liabilities | ||||
Total liabilities | ||||
Net assets | ||||
Less: non-controlling interests | ||||
Group investment in associates | ||||
Group share of net assets (as above) | ||||
Loans made by group companies to associates | ||||
$ million | |||||||
Sales to associates | 2024 | 2023 | 2022 | ||||
Product | Sales | Amount receivable at 31 December | Sales | Amount receivable at 31 December | Sales | Amount receivable at 31 December | |
LNG, crude oil and oil products, natural gas | |||||||
$ million | |||||||
Purchases from associates | 2024 | 2023 | 2022 | ||||
Product | Purchases | Amount payable at 31 December | Purchases | Amount payable at 31 December | Purchases | Amount payable at 31 December | |
Crude oil and oil products, natural gas, transportation tariff |
184 | bp Annual Report and Form 20-F 2024 |
$ million | |||||
2024 | 2023 | ||||
Current | Non-current | Current | Non-current | ||
Equity investmentsa | |||||
Contingent consideration | |||||
Other | |||||
$ million | |||
2024 | 2023 | ||
Crude oil | |||
Natural gas | |||
Emissions allowances | |||
Refined petroleum and petrochemical products | |||
Trading inventories | |||
Supplies | |||
Biological assets | |||
Solar projects | |||
Cost of inventories expensed in the income statement |
$ million | |||||
2024 | 2023 | ||||
Current | Non-current | Current | Non-current | ||
Financial assets | |||||
Trade receivables | |||||
Amounts receivable from joint ventures and associates | |||||
Other receivables | |||||
Non-financial assets | |||||
Sales taxes and production taxes | |||||
Other receivables | |||||
bp Annual Report and Form 20-F 2024 | 185 |
Financial statements |
$ million | |||||||
2024 | 2023 | 2022 | |||||
Trade and other receivables | Fixed asset investments | Trade and other receivables | Fixed asset investments | Trade and other receivables | Fixed asset investments | ||
At 1 January | |||||||
Charged to costs and expenses | ( | ||||||
Charged to other accountsa | ( | ( | ( | ( | |||
Deductions | ( | ( | ( | ( | ( | ( | |
Reclassifications | ( | ||||||
At 31 December |
$ million | |||||
2024 | 2023 | ||||
Current | Non-current | Current | Non-current | ||
Financial liabilities | |||||
Trade payables | |||||
Amounts payable to joint ventures and associates | |||||
Payables for capital expenditure and acquisitions | |||||
Payables related to the Gulf of America oil spill | |||||
Other payables | |||||
Non-financial liabilities | |||||
Sales taxes, customs duties, production taxes and social security | |||||
Other payables | |||||
186 | bp Annual Report and Form 20-F 2024 |
$ million | |||||||
Decommissioning | Environmental | Litigation and claims | Emissions | Otherc | Total | ||
At 1 January 2024 | |||||||
Exchange adjustments | ( | ( | ( | ( | ( | ( | |
Acquisitions | |||||||
New and increase in existing provisionsa | |||||||
Write-back of unused provisionsa | ( | ( | ( | ( | ( | ||
Unwinding of discountb | |||||||
Change in discount rate | ( | ( | ( | ( | ( | ||
Utilization | ( | ( | ( | ( | ( | ( | |
Reclassified to other payables | ( | ( | ( | ( | |||
Reclassified as liabilities directly associated with assets held for sale | ( | ( | ( | ||||
Deletions | ( | ( | ( | ( | |||
At 31 December 2024 | |||||||
Of which – current | |||||||
– non-current |
bp Annual Report and Form 20-F 2024 | 187 |
Financial statements |
188 | bp Annual Report and Form 20-F 2024 |
% | ||||||||||
Financial assumptions used to determine benefit obligation | UK | US | Eurozone | |||||||
2024 | 2023 | 2022 | 2024 | 2023 | 2022 | 2024 | 2023 | 2022 | ||
Discount rate for plan liabilities | ||||||||||
Rate of increase for pensions in payment | ||||||||||
Rate of increase in deferred pensions | ||||||||||
Inflation for plan liabilities | ||||||||||
% | ||||||||||
Financial assumptions used to determine benefit expense | UK | US | Eurozone | |||||||
2024 | 2023 | 2022 | 2024 | 2023 | 2022 | 2024 | 2023 | 2022 | ||
Discount rate for plan service costa | N/A | N/A | N/A | |||||||
Discount rate for plan other finance expense | ||||||||||
Inflation for plan service costa | N/A | N/A | N/A |
Years | ||||||||||
Mortality assumptions | UK | US | Eurozone | |||||||
2024 | 2023 | 2022 | 2024 | 2023 | 2022 | 2024 | 2023 | 2022 | ||
Life expectancy at age 60 for a male currently aged 60 | ||||||||||
Life expectancy at age 60 for a male currently aged 40 | ||||||||||
Life expectancy at age 60 for a female currently aged 60 | ||||||||||
Life expectancy at age 60 for a female currently aged 40 |
UK | US | ||
Asset category | % | % | |
Total equity (including private equity) | |||
Bonds/cash (including LDI) | |||
Property/real estate |
bp Annual Report and Form 20-F 2024 | 189 |
Financial statements |
$ million | ||||||
UKa | USb | Eurozone | Other | Total | ||
Fair value of pension plan assets | ||||||
At 31 December 2024 | ||||||
Listed equities – developed markets | ||||||
– emerging markets | ||||||
Private equityc | ||||||
Government issued nominal bondsd | ||||||
Government issued index-linked bondsd | ||||||
Corporate bondsd | ||||||
Propertye | ||||||
Cash | ||||||
Other | ||||||
Debt (repurchase agreements) used to fund liability driven investments | ( | ( | ||||
At 31 December 2023 | ||||||
Listed equities – developed markets | ||||||
– emerging markets | ||||||
Private equityc | ||||||
Government issued nominal bondsd | ||||||
Government issued index-linked bondsd | ||||||
Corporate bondsd | ||||||
Propertye | ||||||
Cash | ||||||
Otherf | ||||||
Debt (repurchase agreements) used to fund liability driven investments | ( | ( | ||||
At 31 December 2022 | ||||||
Listed equities – developed markets | ||||||
– emerging markets | ||||||
Private equityc | ||||||
Government issued nominal bondsd | ||||||
Government issued index-linked bondsd | ||||||
Corporate bondsd | ||||||
Propertye | ||||||
Cash | ||||||
Otherf | ||||||
Debt (repurchase agreements) used to fund liability driven investments | ( | ( | ||||
190 | bp Annual Report and Form 20-F 2024 |
$ million | ||||||
2024 | ||||||
UK | US | Eurozone | Other | Total | ||
Analysis of the amount charged to profit or loss | ||||||
Current service costa | ||||||
Past service costb | ( | ( | ||||
Settlementb | ( | ( | ||||
Operating charge (credit) relating to defined benefit plans | ||||||
Payments to defined contribution plans | ||||||
Total operating charge (credit) | ||||||
Interest income on plan assetsa | ( | ( | ( | ( | ( | |
Interest on plan liabilities | ||||||
Other finance (income) expense | ( | ( | ||||
Analysis of the amount recognized in other comprehensive income | ||||||
Actual asset return less interest income on plan assets | ( | ( | ( | |||
Change in financial assumptions underlying the present value of the plan liabilities | ( | |||||
Change in demographic assumptions underlying the present value of the plan liabilities | ( | |||||
Experience gains and losses arising on the plan liabilities | ( | ( | ( | |||
Remeasurements recognized in other comprehensive income | ( | ( | ||||
Movements in benefit obligation during the year | ||||||
Benefit obligation at 1 January | ||||||
Exchange adjustments | ( | ( | ( | ( | ||
Operating charge relating to defined benefit plans | ||||||
Interest cost | ||||||
Contributions by plan participants | ||||||
Benefit payments (funded plans)c | ( | ( | ( | ( | ( | |
Benefit payments (unfunded plans)c | ( | ( | ( | ( | ( | |
Disposals | ( | ( | ||||
Remeasurements | ( | ( | ( | ( | ||
Benefit obligation at 31 Decembera d | ||||||
Movements in fair value of plan assets during the year | ||||||
Fair value of plan assets at 1 January | ||||||
Exchange adjustments | ( | ( | ( | ( | ||
Interest income on plan assetsa e | ||||||
Contributions by plan participants | ||||||
Contributions by employers (funded plans) | ||||||
Benefit payments (funded plans)c | ( | ( | ( | ( | ( | |
Remeasurementse | ( | ( | ( | |||
Fair value of plan assets at 31 Decemberf | ||||||
Surplus (deficit) at 31 December | ( | ( | ( | |||
Represented by | ||||||
Asset recognized | ||||||
Liability recognized | ( | ( | ( | ( | ( | |
( | ( | ( | ||||
The surplus (deficit) may be analysed between funded and unfunded plans as follows | ||||||
Funded | ||||||
Unfunded | ( | ( | ( | ( | ( | |
( | ( | ( | ||||
The defined benefit obligation may be analysed between funded and unfunded plans as follows | ||||||
Funded | ( | ( | ( | ( | ( | |
Unfunded | ( | ( | ( | ( | ( | |
( | ( | ( | ( | ( |
bp Annual Report and Form 20-F 2024 | 191 |
Financial statements |
$ million | ||||||
2023 | ||||||
UK | US | Eurozone | Other | Total | ||
Analysis of the amount charged to profit or loss | ||||||
Current service costa | ||||||
Past service costb | ( | |||||
Settlementb | ||||||
Operating charge (credit) relating to defined benefit plans | ||||||
Payments to defined contribution plans | ||||||
Total operating charge (credit) | ||||||
Interest income on plan assetsa | ( | ( | ( | ( | ( | |
Interest on plan liabilities | ||||||
Other finance (income) expense | ( | ( | ||||
Analysis of the amount recognized in other comprehensive income | ||||||
Actual asset return less interest income on plan assets | ( | ( | ||||
Change in financial assumptions underlying the present value of the plan liabilities | ( | ( | ( | ( | ||
Change in demographic assumptions underlying the present value of the plan liabilities | ( | ( | ( | |||
Experience gains and losses arising on the plan liabilities | ( | ( | ( | ( | ||
Remeasurements recognized in other comprehensive income | ( | ( | ( | |||
Movements in benefit obligation during the year | ||||||
Benefit obligation at 1 January | ||||||
Exchange adjustments | ||||||
Operating charge relating to defined benefit plans | ||||||
Interest cost | ||||||
Contributions by plan participants | ||||||
Benefit payments (funded plans)c | ( | ( | ( | ( | ( | |
Benefit payments (unfunded plans)c | ( | ( | ( | ( | ( | |
Reclassified as assets held for sale | ( | ( | ||||
Remeasurements | ( | |||||
Benefit obligation at 31 Decembera d | ||||||
Movements in fair value of plan assets during the year | ||||||
Fair value of plan assets at 1 January | ||||||
Exchange adjustments | ||||||
Interest income on plan assetsa e | ||||||
Contributions by plan participants | ||||||
Contributions by employers (funded plans) | ||||||
Benefit payments (funded plans)c | ( | ( | ( | ( | ( | |
Remeasurementse | ( | ( | ||||
Fair value of plan assets at 31 Decemberf | ||||||
Surplus (deficit) at 31 December | ( | ( | ( | |||
Represented by | ||||||
Asset recognized | ||||||
Liability recognized | ( | ( | ( | ( | ( | |
( | ( | ( | ||||
The surplus (deficit) may be analysed between funded and unfunded plans as follows | ||||||
Funded | ||||||
Unfunded | ( | ( | ( | ( | ( | |
( | ( | ( | ||||
The defined benefit obligation may be analysed between funded and unfunded plans as follows | ||||||
Funded | ( | ( | ( | ( | ( | |
Unfunded | ( | ( | ( | ( | ( | |
( | ( | ( | ( | ( |
192 | bp Annual Report and Form 20-F 2024 |
$ million | ||||||
2022 | ||||||
UK | US | Eurozone | Other | Total | ||
Analysis of the amount charged to profit or loss | ||||||
Current service costa | ||||||
Past service costb | ( | ( | ||||
Settlementb | ( | ( | ( | |||
Operating charge (credit) relating to defined benefit plans | ||||||
Payments to defined contribution plans | ||||||
Total operating charge (credit) | ||||||
Interest income on plan assetsa | ( | ( | ( | ( | ( | |
Interest on plan liabilities | ||||||
Other finance (income) expense | ( | ( | ||||
Analysis of the amount recognized in other comprehensive income | ||||||
Actual asset return less interest income on plan assets | ( | ( | ( | ( | ( | |
Change in financial assumptions underlying the present value of the plan liabilities | ||||||
Change in demographic assumptions underlying the present value of the plan liabilities | ( | ( | ||||
Experience gains and losses arising on the plan liabilities | ( | ( | ( | ( | ( | |
Remeasurements recognized in other comprehensive income | ( |
$ million | |||||||
One percentage point | |||||||
UK | US | Eurozone | |||||
Increase | Decrease | Increase | Decrease | Increase | Decrease | ||
Discount ratea | |||||||
Effect on expense in 2025 | ( | ( | ( | ||||
Effect on obligation at 31 December 2024 | ( | ( | ( | ||||
Inflation rateb | |||||||
Effect on expense in 2025 | ( | ( | ( | ||||
Effect on obligation at 31 December 2024 | ( | ( | ( | ||||
$ million | ||||
One year increase | ||||
UK | US | Eurozone | ||
Longevity | ||||
Effect on expense in 2025 | ||||
Effect on obligation at 31 December 2024 | ||||
$ million | ||||||
Estimated future benefit payments | UK | US | Eurozone | Other | Total | |
2025 | ||||||
2026 | ||||||
2027 | ||||||
2028 | ||||||
2029 | ||||||
2030 - 2034 | ||||||
Years | ||||||
Weighted average duration |
bp Annual Report and Form 20-F 2024 | 193 |
Financial statements |
$ million | |||
2024 | 2023 | ||
Cash | |||
Triparty repos and term bank deposits | |||
Other cash equivalents | |||
$ million | |||||||
2024 | 2023 | ||||||
Current | Non-current | Total | Current | Non-current | Total | ||
Borrowings |
Fixed rate debt | Floating rate debt | Total | |||||
Weighted average interest rate % | Weighted average time for which rate is fixed Years | Amount $ million | Weighted average interest rate % | Amount $ million | Amount $ million | ||
2024 | |||||||
US dollar | |||||||
Other currencies | |||||||
2023 | |||||||
US dollar | |||||||
Other currencies | |||||||
$ million | |||||
2024 | 2023 | ||||
Fair value | Carrying amount | Fair value | Carrying amount | ||
Short-term borrowings | |||||
Long-term borrowings | |||||
Total finance debt |
194 | bp Annual Report and Form 20-F 2024 |
$ million | |||
At 31 December | 2024 | 2023 | |
Finance debt | |||
Less: fair value asset (liability) of hedges related to finance debta | ( | ( | |
Less: cash and cash equivalents | |||
Net debt | |||
Total equity | |||
Gearing |
$ million | ||||||
Finance debt | Currency swapsa | Lease liabilities | Net partner payable for leases entered into on behalf of joint operations | Total liabilities arising from financing activities | ||
At 1 January 2024 | ||||||
Exchange adjustments | ( | ( | ( | ( | ||
Net financing cash flow | ( | ( | ( | |||
Fair value (gains) losses | ( | |||||
New and remeasured leases/joint operations payables | ||||||
Other movementsb | ( | |||||
At 31 December 2024 | ||||||
At 1 January 2023 | ||||||
Exchange adjustments | ||||||
Net financing cash flow | ( | ( | ( | |||
Fair value (gains) losses | ( | ( | ||||
New and remeasured leases/joint operations payables | ||||||
Other movementsc | ( | ( | ||||
At 31 December 2023 |
bp Annual Report and Form 20-F 2024 | 195 |
Financial statements |
$ million | |||
2024 | 2023 | ||
Undiscounted lease liability cash flows due: | |||
Within 1 year | |||
1 to 2 years | |||
2 to 3 years | |||
3 to 4 years | |||
4 to 5 years | |||
5 to 10 years | |||
Over 10 years | |||
Impact of discounting | ( | ( | |
Lease liabilities at 31 December | |||
Of which – current | |||
– non-current |
$ million | |||
2024 | 2023 | ||
Total cash outflow for amounts included in lease liabilities | |||
Expense for variable payments not included in the lease liabilitya | |||
Short-term lease expensea | |||
Additions to right-of-use assets in the period |
$ million | |||||||
At 31 December 2024 | Note | Measured at amortized cost | Mandatorily measured at fair value through profit or loss | Derivative hedging instruments | Total carrying amount | ||
Financial assets | |||||||
Other investments | 18 | — | |||||
Loans | — | ||||||
Trade and other receivables | 20 | — | — | ||||
Derivative financial instruments | 30 | — | |||||
Cash and cash equivalents | 25 | — | |||||
Financial liabilities | |||||||
Trade and other payables | 22 | ( | — | — | ( | ||
Derivative financial instruments | 30 | — | ( | ( | ( | ||
Accruals | ( | — | — | ( | |||
Lease liabilities | 28 | ( | — | — | ( | ||
Finance debt | 26 | ( | — | — | ( | ||
( | ( | ( |
196 | bp Annual Report and Form 20-F 2024 |
$ million | |||||||
At 31 December 2023 | Note | Measured at amortized cost | Mandatorily measured at fair value through profit or loss | Derivative hedging instruments | Total carrying amount | ||
Financial assets | |||||||
Other investments | 18 | — | |||||
Loans | — | ||||||
Trade and other receivables | 20 | — | — | ||||
Derivative financial instruments | 30 | — | |||||
Cash and cash equivalents | 25 | — | |||||
Financial liabilities | |||||||
Trade and other payables | 22 | ( | — | — | ( | ||
Derivative financial instruments | 30 | — | ( | ( | ( | ||
Accruals | ( | — | — | ( | |||
Lease liabilities | 28 | ( | — | — | ( | ||
Finance debt | 26 | ( | — | — | ( | ||
( | ( | ( |
bp Annual Report and Form 20-F 2024 | 197 |
Financial statements |
198 | bp Annual Report and Form 20-F 2024 |
% | |||
As at 31 December | 2024 | 2023 | |
AAA to AA- | |||
A+ to A- | |||
BBB+ to BBB- | |||
BB+ to BB- | |||
B+ to B- | |||
CCC+ and below |
bp Annual Report and Form 20-F 2024 | 199 |
Financial statements |
$ million | |||||||
Gross amounts of recognized financial assets (liabilities) | Amounts set off | Net amounts presented on the balance sheet | Related amounts not set off in the balance sheet | Net amount | |||
At 31 December 2024 | Master netting arrangements | Cash collateral (received) pledged | |||||
Derivative assets | ( | ( | ( | ||||
Derivative liabilities | ( | ( | ( | ||||
Trade and other receivables | ( | ( | ( | ||||
Trade and other payables | ( | ( | ( | ||||
At 31 December 2023 | |||||||
Derivative assets | ( | ( | ( | ||||
Derivative liabilities | ( | ( | ( | ||||
Trade and other receivables | ( | ( | ( | ||||
Trade and other payables | ( | ( | ( | ||||
200 | bp Annual Report and Form 20-F 2024 |
2024 | ||||
Letters of Credit | Promissory Notes | Reverse Factoring Arrangements | ||
Carrying amount of liabilities ($ million) | ||||
Presented within trade and other payablesa | ||||
of which suppliers have received payment from the financial institutionb | ||||
Range of payment due dates (days) | ||||
Liabilities that are part of the arrangementb | ||||
Trade payables that are not part of the arrangement |
bp Annual Report and Form 20-F 2024 | 201 |
Financial statements |
$ million | |||||||||
2024 | 2023 | ||||||||
Trade and other payablesa | Accruals | Finance debt | Interest on finance debt | Trade and other payablesa | Accruals | Finance debt | Interest on finance debt | ||
Within one year | |||||||||
1 to 2 years | |||||||||
2 to 3 years | |||||||||
3 to 4 years | |||||||||
4 to 5 years | |||||||||
5 to 10 years | |||||||||
Over 10 years | |||||||||
$ million | |||
Cash outflows for derivative financial instruments at 31 December | 2024 | 2023 | |
Within one year | |||
1 to 2 years | |||
2 to 3 years | |||
3 to 4 years | |||
4 to 5 years | |||
5 to 10 years | |||
Over 10 years | |||
202 | bp Annual Report and Form 20-F 2024 |
$ million | |||||
2024 | 2023 | ||||
Fair value asset | Fair value liability | Fair value asset | Fair value liability | ||
Derivatives held for trading | |||||
Currency derivatives | ( | ( | |||
Oil price derivatives | ( | ( | |||
Natural gas price derivatives | ( | ( | |||
Power price derivatives | ( | ( | |||
Other derivatives | ( | ||||
( | ( | ||||
Cash flow hedges | |||||
Currency forwards | ( | ||||
( | |||||
Fair value hedges | |||||
Currency swaps | ( | ( | |||
Interest rate swaps | ( | ( | |||
( | ( | ||||
( | ( | ||||
Of which – current | ( | ( | |||
– non-current | ( | ( |
$ million | ||||||||
2024 | ||||||||
Less than 1 year | 1-2 years | 2-3 years | 3-4 years | 4-5 years | Over 5 years | Total | ||
Currency derivatives | ||||||||
Oil price derivatives | ||||||||
Natural gas price derivatives | ||||||||
Power price derivatives | ||||||||
Other derivatives | ||||||||
$ million | ||||||||
2023 | ||||||||
Less than 1 year | 1-2 years | 2-3 years | 3-4 years | 4-5 years | Over 5 years | Total | ||
Currency derivatives | ||||||||
Oil price derivatives | ||||||||
Natural gas price derivatives | ||||||||
Power price derivatives | ||||||||
Other derivatives | ||||||||
bp Annual Report and Form 20-F 2024 | 203 |
Financial statements |
$ million | ||||||||
2024 | ||||||||
Less than 1 year | 1-2 years | 2-3 years | 3-4 years | 4-5 years | Over 5 years | Total | ||
Currency derivatives | ( | ( | ( | ( | ( | ( | ( | |
Oil price derivatives | ( | ( | ( | ( | ( | ( | ||
Natural gas price derivatives | ( | ( | ( | ( | ( | ( | ( | |
Power price derivatives | ( | ( | ( | ( | ( | ( | ( | |
Other derivatives | ( | ( | ( | ( | ||||
( | ( | ( | ( | ( | ( | ( | ||
$ million | ||||||||
2023 | ||||||||
Less than 1 year | 1-2 years | 2-3 years | 3-4 years | 4-5 years | Over 5 years | Total | ||
Currency derivatives | ( | ( | ( | ( | ( | ( | ( | |
Oil price derivatives | ( | ( | ( | ( | ( | ( | ( | |
Natural gas price derivatives | ( | ( | ( | ( | ( | ( | ( | |
Power price derivatives | ( | ( | ( | ( | ( | ( | ( | |
( | ( | ( | ( | ( | ( | ( |
$ million | ||||||||
2024 | ||||||||
Less than 1 year | 1-2 years | 2-3 years | 3-4 years | 4-5 years | Over 5 years | Total | ||
Fair value of derivative assets | ||||||||
Level 1 | ||||||||
Level 2 | ||||||||
Level 3 | ||||||||
Less: netting by counterparty | ( | ( | ( | ( | ( | ( | ( | |
Fair value of derivative liabilities | ||||||||
Level 1 | ( | ( | ( | ( | ( | |||
Level 2 | ( | ( | ( | ( | ( | ( | ( | |
Level 3 | ( | ( | ( | ( | ( | ( | ( | |
( | ( | ( | ( | ( | ( | ( | ||
Less: netting by counterparty | ||||||||
( | ( | ( | ( | ( | ( | ( | ||
Net fair value | ( | ( | ||||||
$ million | ||||||||
2023 | ||||||||
Less than 1 year | 1-2 years | 2-3 years | 3-4 years | 4-5 years | Over 5 years | Total | ||
Fair value of derivative assets | ||||||||
Level 1 | ||||||||
Level 2 | ||||||||
Level 3 | ||||||||
Less: netting by counterparty | ( | ( | ( | ( | ( | ( | ( | |
Fair value of derivative liabilities | ||||||||
Level 1 | ( | ( | ( | ( | ( | |||
Level 2 | ( | ( | ( | ( | ( | ( | ( | |
Level 3 | ( | ( | ( | ( | ( | ( | ( | |
( | ( | ( | ( | ( | ( | ( | ||
Less: netting by counterparty | ||||||||
( | ( | ( | ( | ( | ( | ( | ||
Net fair value | ( |
204 | bp Annual Report and Form 20-F 2024 |
$ million | |||||||
Oil price | Natural gas price | Power price | Currency | Other | Total | ||
Fair value contracts at 1 January 2024 | ( | ||||||
Gains (losses) recognized in the income statement | ( | ( | ( | ( | |||
Purchases | |||||||
Settlements | ( | ( | ( | ( | ( | ||
Transfers out of level 3 | ( | ( | |||||
Net fair value of contracts at 31 December 2024 | ( | ||||||
Deferred day-one gains (losses) | |||||||
Derivative asset (liability) | |||||||
$ million | |||||||
Oil price | Natural gas price | Power price | Currency | Other | Total | ||
Fair value contracts at 1 January 2023 | ( | ||||||
Gains (losses) recognized in the income statement | |||||||
Settlements | ( | ( | ( | ( | |||
Transfers out of level 3 | ( | ( | ( | ( | |||
Net fair value of contracts at 31 December 2023 | ( | ||||||
Deferred day-one gains (losses) | |||||||
Derivative asset (liability) |
bp Annual Report and Form 20-F 2024 | 205 |
Financial statements |
$ million | ||||
Change in fair value of hedging instrument used to calculate ineffectiveness | Change in fair value of hedged item used to calculate ineffectiveness | Hedge ineffectiveness recognized in profit or (loss) | ||
At 31 December 2024 | ||||
Cash flow hedges | ||||
Foreign exchange risk | ||||
Highly probable forecast capital expenditure | ||||
Commodity price risk | ||||
Highly probable forecast sales | ( | |||
At 31 December 2023 | ||||
Cash flow hedges | ||||
Foreign exchange risk | ||||
Highly probable forecast capital expenditure | ( | |||
Commodity price risk | ||||
Highly probable forecast sales | ( |
206 | bp Annual Report and Form 20-F 2024 |
Carrying amount of hedging instrument | Nominal amounts of hedging instruments | ||||
Assets | Liabilities | ||||
At 31 December 2024 | $ million | $ million | $ million | mmBtu | |
Cash flow hedges | |||||
Foreign exchange risk | |||||
Highly probable forecast capital expenditure | |||||
Commodity price risk | |||||
Highly probable forecast sales | ( | ||||
At 31 December 2023 | |||||
Cash flow hedges | |||||
Foreign exchange risk | |||||
Highly probable forecast capital expenditure | ( | ||||
Commodity price risk | |||||
Highly probable forecast sales | ( | ||||
Weighted average price/rate | |||||
2024 | 2023 | ||||
At 31 December | Forecast capital expenditure | Forecast sales | Forecast capital expenditure | Forecast sales | |
Sterling/US dollar | |||||
Euro/US dollar | |||||
Henry Hub $/mmBtu | |||||
bp Annual Report and Form 20-F 2024 | 207 |
Financial statements |
$ million | ||||
Change in fair value of hedging instrument used to calculate ineffectiveness | Change in fair value of hedged item used to calculate ineffectiveness | Hedge ineffectiveness recognized in profit or (loss) | ||
At 31 December 2024 | ||||
Fair value hedges | ||||
Interest rate risk on finance debt | ( | |||
Interest rate and foreign currency risk on finance debt | ( | ( | ||
At 31 December 2023 | ||||
Fair value hedges | ||||
Interest rate risk on finance debt | ||||
Interest rate and foreign currency risk on finance debt | ( |
$ million | ||||
Carrying amount of hedging instrument | Nominal amounts of hedging instruments | |||
At 31 December 2024 | Assets | Liabilities | ||
Fair value hedges | ||||
Interest rate risk on finance debt | ( | |||
Interest rate and foreign currency risk on finance debt | ( | |||
At 31 December 2023 | ||||
Fair value hedges | ||||
Interest rate risk on finance debt | ( | |||
Interest rate and foreign currency risk on finance debt | ( | |||
208 | bp Annual Report and Form 20-F 2024 |
$ million | |||||||||
At 31 December 2024 | Less than 1 year | 1-2 years | 2-3 years | 3-4 years | 4-5 years | 5-10 years | Over 10 years | Total | |
Fair value hedges | |||||||||
Interest rate risk on finance debt | |||||||||
Interest rate and foreign currency risk on finance debt | |||||||||
At 31 December 2023 | |||||||||
Fair value hedges | |||||||||
Interest rate risk on finance debt | |||||||||
Interest rate and foreign currency risk on finance debt |
At 31 December | 2024 | 2023 | |||
Interest rate swaps | Cross-currency interest rate swaps | Interest rate swaps | Cross-currency interest rate swaps | ||
Interest rate | |||||
Sterling/US dollar | |||||
Euro/US dollar | |||||
Canadian dollar/US dollar | |||||
Australian dollar/ US dollar | |||||
Japanese Yen/ US dollar | |||||
Swiss Franc/US dollar |
$ million | |||||
Carrying amount of hedged item | Accumulated fair value adjustment included in the carrying amount of hedged items | ||||
At 31 December 2024 | Liabilities | Assets | Liabilities | Discontinued hedges | |
Fair value hedges | |||||
Interest rate risk on finance debt | ( | ( | |||
Interest rate and foreign currency risk on finance debt | ( | ||||
At 31 December 2023 | |||||
Fair value hedges | |||||
Interest rate risk on finance debt | ( | ( | |||
Interest rate and foreign currency risk on finance debt | ( | ||||
bp Annual Report and Form 20-F 2024 | 209 |
Financial statements |
$ million | |||||
Cash flow hedge reserve | |||||
Highly probable forecast capital expenditure | Highly probable forecast sales | Interest rate and foreign currency risk on finance debt | Total | ||
At 1 January 2024 | ( | ||||
Recognized in other comprehensive income | |||||
Cash flow hedges marked to market | ( | — | |||
Cash flow hedges reclassified to the income statement - hedged item affected profit or loss | ( | — | ( | ||
Costs of hedging marked to market | — | — | ( | ( | |
Costs of hedging reclassified to the income statement | — | — | ( | ( | |
( | ( | ( | ( | ||
Cash flow hedges transferred to the balance sheet | ( | — | ( | ||
At 31 December 2024 | ( | ( | ( | ||
$ million | |||||
Cash flow hedge reserve | |||||
Highly probable forecast capital expenditure | Highly probable forecast sales | Interest rate and foreign currency risk on finance debt | Total | ||
At 1 January 2023 | ( | ( | ( | ||
Recognized in other comprehensive income | |||||
Cash flow hedges marked to market | — | ||||
Cash flow hedges reclassified to the income statement - hedged item affected profit or loss | ( | — | ( | ||
Costs of hedging marked to market | — | — | ( | ( | |
Costs of hedging reclassified to the income statement | — | — | ( | ( | |
( | |||||
Cash flow hedges transferred to the balance sheet | ( | — | ( | ||
At 31 December 2023 | ( | ||||
210 | bp Annual Report and Form 20-F 2024 |
2024 | 2023 | 2022 | |||||
Issued | Shares thousand | $ million | Shares thousand | $ million | Shares thousand | $ million | |
Ordinary shares of | |||||||
At 1 January | |||||||
Issue of new shares for employee share-based payment plans | |||||||
Issue of new shares – otherb | |||||||
Repurchase of ordinary share capital | ( | ( | ( | ( | ( | ( | |
At 31 December | |||||||
2024 | 2023 | 2022 | |||||
Shares thousand | Nominal value $ million | Shares thousand | Nominal value $ million | Shares thousand | Nominal value $ million | ||
At 1 January | |||||||
Purchases for settlement of employee share plans | |||||||
Issue of new shares for employee share-based payment plans | |||||||
Shares re-issued for employee share-based payment plans | ( | ( | ( | ( | ( | ( | |
At 31 December | |||||||
Of which – shares held in treasury by bp | |||||||
– shares held in ESOP trusts | |||||||
– shares held by bp’s US share plan administratorb |
bp Annual Report and Form 20-F 2024 | 211 |
Financial statements |
212 | bp Annual Report and Form 20-F 2024 |
Share capital | Share premium account | Capital redemption reserve | Merger reserve | Total share capital and capital reserves | ||
At 1 January 2024 | ||||||
Profit (loss) for the year | ||||||
Items that may be reclassified subsequently to profit or loss | ||||||
Currency translation differences (including reclassifications)a | — | — | — | — | — | |
Cash flow hedges and costs of hedging (including reclassifications) | — | — | — | — | — | |
Share of items relating to equity-accounted entities, net of tax | — | — | — | — | — | |
Other | — | — | — | — | — | |
Items that will not be reclassified to profit or loss | ||||||
Remeasurements of the net pension and other post-employment benefit liability or asset | — | — | — | — | — | |
Remeasurements of equity investments | — | — | — | — | — | |
Cash flow hedges that will subsequently be transferred to the balance sheet | — | — | — | — | — | |
Total comprehensive income | — | — | — | — | — | |
Dividends | — | — | — | — | — | |
Cash flow hedges transferred to the balance sheet, net of tax | — | — | — | — | — | |
Repurchases of ordinary share capital | ( | — | — | |||
Share-based payments, net of taxb | — | — | ||||
Issue of perpetual hybrid bonds | — | — | — | — | — | |
Redemption of perpetual hybrid bonds | — | — | — | — | — | |
Payments on perpetual hybrid bonds | — | — | — | — | — | |
Transactions involving non-controlling interests, net of tax | — | — | — | — | — | |
At 31 December 2024 | ||||||
At 1 January 2023 | ||||||
Profit (loss) for the year | ||||||
Items that may be reclassified subsequently to profit or loss | ||||||
Currency translation differences (including reclassifications) | — | — | — | — | — | |
Cash flow hedges and costs of hedging (including reclassifications) | — | — | — | — | — | |
Share of items relating to equity-accounted entities, net of tax | — | — | — | — | — | |
Items that will not be reclassified to profit or loss | ||||||
Remeasurements of the net pension and other post-employment benefit liability or asset | — | — | — | — | — | |
Remeasurements of equity investments | — | — | — | — | — | |
Cash flow hedges that will subsequently be transferred to the balance sheet | — | — | — | — | — | |
Total comprehensive income | — | — | — | — | — | |
Dividends | — | — | — | — | — | |
Cash flow hedges transferred to the balance sheet, net of tax | — | — | — | — | — | |
Repurchases of ordinary share capital | ( | |||||
Share-based payments, net of taxb | ||||||
Share of equity-accounted entities’ changes in equity, net of tax | — | — | — | — | — | |
Issue of perpetual hybrid bonds | — | — | — | — | — | |
Payments on perpetual hybrid bonds | — | — | — | — | — | |
Transactions involving non-controlling interests, net of tax | — | — | — | — | — | |
At 31 December 2023 |
bp Annual Report and Form 20-F 2024 | 213 |
Financial statements |
$ million | ||||||||||
Treasury shares | Foreign currency translation reserve | Investments in equity instruments | Cash flow hedges | Costs of hedging | Total fair value reserves | Profit and loss account | bp shareholders’ equity | Non-controlling interests | Total equity | |
Hybrid bonds | Other interest | |||||||||
( | ( | ( | ||||||||
— | — | — | — | — | — | |||||
— | ( | ( | — | — | ( | — | ( | — | ( | ( |
— | — | — | ( | ( | ( | — | ( | — | — | ( |
— | — | — | — | — | — | ( | ( | — | — | ( |
— | — | — | — | — | — | ( | ( | — | — | ( |
— | — | — | — | — | — | — | — | |||
— | — | ( | — | — | ( | — | ( | — | — | ( |
— | — | — | ( | — | ( | — | ( | — | — | ( |
— | ( | ( | ( | ( | ( | |||||
— | — | — | — | — | — | ( | ( | — | ( | ( |
— | — | — | ( | — | ( | — | ( | — | — | ( |
— | — | — | — | — | — | ( | ( | — | — | ( |
— | — | — | — | — | ( | — | — | |||
— | — | — | — | — | — | — | — | |||
— | — | — | — | — | — | ( | ( | — | ||
— | — | — | — | — | — | ( | — | ( | ||
— | — | — | — | — | — | ( | — | ( | ||
— | — | — | — | — | — | — | ||||
( | ( | ( | ( | ( | ( | |||||
( | ( | ( | ( | ( | ||||||
— | — | — | — | — | — | |||||
— | — | — | — | — | — | — | ||||
— | — | — | ( | — | — | — | ||||
— | — | — | — | — | — | ( | ( | — | — | ( |
— | — | — | — | — | — | ( | ( | — | — | ( |
— | — | — | — | — | — | — | ||||
— | — | — | — | — | — | — | ||||
— | ( | |||||||||
— | — | — | — | — | — | ( | ( | — | ( | ( |
— | — | — | ( | — | ( | — | ( | — | — | ( |
— | — | — | — | — | — | ( | ( | — | — | ( |
— | — | — | — | — | ( | — | — | |||
— | — | — | — | — | — | — | — | |||
— | — | — | — | — | — | ( | ( | — | ||
— | ( | — | — | — | — | — | ( | ( | — | ( |
— | — | — | — | — | — | — | ( | |||
( | ( | ( | ||||||||
214 | bp Annual Report and Form 20-F 2024 |
Share capital | Share premium account | Capital redemption reserve | Merger reserve | Total share capital and capital reserves | ||
At 1 January 2022 | ||||||
Profit (loss) for the year | ||||||
Items that may be reclassified subsequently to profit or loss | ||||||
Currency translation differences (including reclassifications)b | — | — | — | — | — | |
Cash flow hedges and costs of hedging (including reclassifications)c | — | — | — | — | — | |
Share of items relating to equity-accounted entities, net of tax | — | — | — | — | — | |
Other | — | — | — | — | — | |
Items that will not be reclassified to profit or loss | ||||||
Remeasurements of the net pension and other post-employment benefit liability or asset | — | — | — | — | — | |
Cash flow hedges that will subsequently be transferred to the balance sheet | — | — | — | — | — | |
Total comprehensive income | — | — | — | — | — | |
Dividends | — | — | — | — | — | |
Cash flow hedges transferred to the balance sheet, net of tax | — | — | — | — | — | |
Issue of ordinary share capital | — | — | ||||
Repurchases of ordinary share capital | ( | — | — | — | ||
Share-based payments, net of taxa | — | — | ||||
Issue of perpetual hybrid bonds | — | — | — | — | — | |
Payments on perpetual hybrid bonds | — | — | — | — | — | |
Transactions involving non-controlling interests, net of tax | — | — | — | — | — | |
At 31 December 2022 |
bp Annual Report and Form 20-F 2024 | 215 |
Financial statements |
$ million | |||||||||
Treasury shares | Foreign currency translation reserve | Cash flow hedges | Costs of hedging | Total fair value reserves | Profit and loss account | bp shareholders’ equity | Non-controlling interests | Total equity | |
Hybrid bonds | Other interest | ||||||||
( | ( | ( | ( | ( | |||||
— | — | — | — | — | ( | ( | ( | ||
— | — | — | — | — | — | ( | |||
— | — | — | — | — | |||||
— | — | — | — | — | — | — | |||
— | — | — | — | — | ( | ( | — | — | ( |
— | — | — | — | — | — | — | |||
— | — | ( | — | ( | — | ( | — | — | ( |
— | ( | ||||||||
— | — | — | — | — | ( | ( | — | ( | ( |
— | — | — | — | — | — | ||||
— | — | — | — | — | — | — | — | ||
— | — | — | — | — | ( | ( | — | — | ( |
— | — | — | — | — | — | ||||
— | — | — | — | — | ( | ( | — | ||
— | — | — | — | — | ( | — | ( | ||
— | — | — | — | — | ( | ( | — | ( | ( |
( | ( | ( | ( | ( | |||||
216 | bp Annual Report and Form 20-F 2024 |
bp Annual Report and Form 20-F 2024 | 217 |
Financial statements |
$ million | ||||
2024 | ||||
Pre-tax | Tax | Net of tax | ||
Items that may be reclassified subsequently to profit or loss | ||||
Currency translation differences (including reclassifications) | ( | ( | ( | |
Cash flow hedges (including reclassifications) | ( | ( | ||
Costs of hedging (including reclassifications) | ( | ( | ||
Share of items relating to equity-accounted entities, net of tax | ( | ( | ||
Other | ( | ( | ||
Items that will not be reclassified to profit or loss | ||||
Remeasurements of the net pension and other post-employment benefit liability or asseta | ( | |||
Remeasurements of equity investments | ( | ( | ||
Cash flow hedges that will subsequently be transferred to the balance sheet | ( | ( | ||
Other comprehensive income | ( | ( | ||
$ million | ||||
2023 | ||||
Pre-tax | Tax | Net of tax | ||
Items that may be reclassified subsequently to profit or loss | ||||
Currency translation differences (including reclassifications) | ||||
Cash flow hedges (including reclassifications) | ( | |||
Costs of hedging (including reclassifications) | ( | ( | ( | |
Share of items relating to equity-accounted entities, net of tax | ( | ( | ||
Items that will not be reclassified to profit or loss | ||||
Remeasurements of the net pension and other post-employment benefit liability or asset | ( | ( | ||
Remeasurements of equity investments | ( | |||
Cash flow hedges that will subsequently be transferred to the balance sheet | ||||
Other comprehensive income | ( | ( | ||
$ million | ||||
2022 | ||||
Pre-tax | Tax | Net of tax | ||
Items that may be reclassified subsequently to profit or loss | ||||
Currency translation differences (including reclassifications) | ( | |||
Cash flow hedges (including reclassifications) | ( | |||
Costs of hedging (including reclassifications) | ||||
Share of items relating to equity-accounted entities, net of tax | ||||
Other | ( | ( | ||
Items that will not be reclassified to profit or loss | ||||
Remeasurements of the net pension and other post-employment benefit liability or asset | ||||
Cash flow hedges that will subsequently be transferred to the balance sheet | ( | ( | ||
Other comprehensive income | ( |
218 | bp Annual Report and Form 20-F 2024 |
bp Annual Report and Form 20-F 2024 | 219 |
Financial statements |
220 | bp Annual Report and Form 20-F 2024 |
$ million | ||||
2024 | 2023 | 2022 | ||
Total for all directors | ||||
Emoluments | ||||
Amounts received under incentive schemesa | ||||
Total |
$ million | ||||
2024 | 2023 | 2022 | ||
Total for all senior management and non-executive directors | ||||
Short-term employee benefits | ||||
Pensions and other post-employment benefits | ||||
Share-based paymentsa | ||||
Termination benefits | ||||
Total |
bp Annual Report and Form 20-F 2024 | 221 |
Financial statements |
$ million | ||||
Employee costs | 2024 | 2023 | 2022 | |
Wages and salariesa | ||||
Social security costs | ||||
Share-based paymentsb | ||||
Pension and other post-employment benefit costs | ||||
2024 | 2023 | 2022 | ||||||||
Average number of employeesc | US | Non-US | Total | US | Non-US | Total | US | Non-US | Total | |
gas & low carbon energy | ||||||||||
oil production & operations | ||||||||||
customers & productsd e | ||||||||||
other businesses and corporate | ||||||||||
$ million | ||||
Fees | 2024 | 2023 | 2022 | |
The audit of the company annual accountsa | ||||
The audit of accounts of subsidiaries of the company | ||||
Total audit | ||||
Audit-related assurance servicesb | ||||
Total audit and audit-related assurance services | ||||
Non-audit and other assurance services | ||||
Services relating to bp pension plans | ||||
222 | bp Annual Report and Form 20-F 2024 |
Subsidiaries | % | Country of incorporation | Principal activities | ||
International | |||||
BP Corporate Holdings Limited | England & Wales | Investment holding | |||
BP Exploration Operating Company Limited | England & Wales | Exploration and production | |||
*BP Gamma Holdings Limited | England & Wales | Investment holding | |||
*BP Global Investments Limited | England & Wales | Investment holding | |||
*BP International Limited | England & Wales | Integrated oil operations | |||
BP Oil International Limited | England & Wales | Integrated oil operations | |||
*Castrol Group Holdings Limited | Scotland | Investment holding | |||
Azerbaijan | |||||
BP Exploration (Caspian Sea) Limited | England & Wales | Exploration and production | |||
BP Exploration (Azerbaijan) Limited | England & Wales | Exploration and production | |||
Germany | |||||
BP Europa SE | Germany | Refining and marketing | |||
Trinidad and Tobago | |||||
BP Trinidad and Tobago LLC | US | Exploration and production | |||
UK | |||||
BP Capital Markets p.l.c. | England & Wales | Finance | |||
Lightsource BP Renewable Energy Investments Limited | England & Wales | Solar | |||
US | |||||
*BP Holdings North America Limited | England & Wales | Investment holding | |||
Atlantic Richfield Company | US | Exploration and production, refining and marketing | |||
BP America Inc. | US | ||||
BP America Production Company | US | ||||
BP Company North America Inc. | US | ||||
BP Corporation North America Inc. | US | ||||
BP Products North America Inc. | US | ||||
The Standard Oil Company | US | ||||
Archaea Energy Inc. | US | Bioenergy | |||
BP Capital Markets America Inc. | US | Finance | |||
Joint arrangements | % | Country of incorporation | Principal activities | ||
Angola | |||||
Azule Energy Holdings Limited | England & Wales | Exploration and production |
bp Annual Report and Form 20-F 2024 | 223 |
Financial statements |
224 | bp Annual Report and Form 20-F 2024 |
$ million | ||||||||||
2024 | ||||||||||
Europe | North America | South America | Africa Asia | Australasia | Total | |||||
UK | Rest of Europe | US | Rest of North America | |||||||
Subsidiaries | ||||||||||
Capitalized costs at 31 Decembera b | ||||||||||
Gross capitalized costs | ||||||||||
Proved properties | 29,781 | — | 72,248 | 8 | 14,427 | 18,756 | 42,709 | 6,504 | 184,433 | |
Unproved properties | 411 | — | 3,012 | 1,936 | 2,760 | 2,471 | 1,701 | 762 | 13,053 | |
30,192 | — | 75,260 | 1,944 | 17,187 | 21,227 | 44,410 | 7,266 | 197,486 | ||
Accumulated depreciation | 24,269 | — | 44,067 | 1,602 | 13,450 | 20,373 | 27,528 | 5,506 | 136,795 | |
Net capitalized costs | 5,923 | — | 31,193 | 342 | 3,737 | 854 | 16,882 | 1,760 | 60,691 | |
Costs incurred for the year ended 31 Decembera b | ||||||||||
Acquisition of properties | ||||||||||
Proved | — | — | 52 | — | — | — | — | — | 52 | |
Unproved | — | — | 21 | — | 2 | — | — | — | 23 | |
— | — | 73 | — | 2 | — | — | — | 75 | ||
Exploration and appraisal costsc | 57 | — | 655 | 102 | 294 | 508 | 82 | 59 | 1,757 | |
Development | 629 | — | 3,829 | — | 661 | 1,334 | 1,363 | 137 | 7,953 | |
Total costs | 686 | — | 4,557 | 102 | 957 | 1,842 | 1,445 | 196 | 9,785 | |
Results of operations for the year ended 31 Decembera | ||||||||||
Sales and other operating revenuesd | ||||||||||
Third parties | 182 | — | 1,859 | — | 1,090 | 2,094 | 4,515 | 1,888 | 11,628 | |
Sales between businesses | 2,762 | — | 13,035 | — | 163 | — | 7,410 | 362 | 23,732 | |
2,944 | — | 14,894 | — | 1,253 | 2,094 | 11,925 | 2,250 | 35,360 | ||
Exploration expenditure | 1 | — | 463 | 97 | 137 | 188 | 55 | 33 | 974 | |
Production costs | 539 | — | 2,645 | 1 | 399 | 230 | 617 | 106 | 4,537 | |
Production taxes | (4) | — | 149 | — | 248 | — | 1,366 | 40 | 1,799 | |
Other costs (income)e | (221) | (8) | 2,455 | 23 | 47 | 49 | (59) | 116 | 2,402 | |
Depreciation, depletion and amortization | 1,234 | — | 4,394 | 3 | 1,206 | 543 | 3,116 | 477 | 10,973 | |
Net impairments and (gains) losses on sale of businesses and fixed assets | 1,058 | 14 | (471) | (19) | (259) | 2,312 | (1) | (1) | 2,633 | |
2,607 | 6 | 9,635 | 105 | 1,778 | 3,322 | 5,094 | 771 | 23,318 | ||
Profit (loss) before taxationf | 337 | (6) | 5,259 | (105) | (525) | (1,228) | 6,831 | 1,479 | 12,042 | |
Allocable taxes | 195 | (1) | 1,194 | (14) | (203) | 291 | 5,003 | 557 | 7,022 | |
Results of operations | 142 | (5) | 4,065 | (91) | (322) | (1,519) | 1,828 | 922 | 5,020 | |
bp Annual Report and Form 20-F 2024 | 225 |
Financial statements |
$ million | ||||||||||
2024 | ||||||||||
Europe | North America | South America | Asia Africa | Australasia | Total | |||||
UK | Rest of Europe | US | Rest of North America | |||||||
Equity-accounted entities (bp share) | ||||||||||
Capitalized costs at 31 Decembera b | ||||||||||
Gross capitalized costs | ||||||||||
Proved properties | — | 5,211 | — | — | 12,185 | 10,181 | 10,848 | — | 38,425 | |
Unproved properties | — | 705 | — | — | 130 | 344 | — | — | 1,179 | |
— | 5,916 | — | — | 12,315 | 10,525 | 10,848 | — | 39,604 | ||
Accumulated depreciation | — | 2,968 | — | — | 7,284 | 3,209 | 2,661 | — | 16,122 | |
Net capitalized costs | — | 2,948 | — | — | 5,031 | 7,316 | 8,187 | — | 23,482 | |
Costs incurred for the year ended 31 Decembera c d | ||||||||||
Acquisition of propertiesb | ||||||||||
Proved | — | — | — | — | — | — | — | — | — | |
Unproved | — | — | — | — | — | 26 | — | — | 26 | |
— | — | — | — | — | 26 | — | — | 26 | ||
Exploration and appraisal costsc | — | 58 | — | — | 5 | 54 | — | — | 117 | |
Development | — | 761 | — | — | 821 | 1,105 | 901 | — | 3,588 | |
Total costs | — | 819 | — | — | 826 | 1,185 | 901 | — | 3,731 | |
Results of operations for the year ended 31 Decembera | ||||||||||
Sales and other operating revenuese | ||||||||||
Third parties | — | 1,943 | — | — | 1,967 | 2,692 | 1,854 | — | 8,456 | |
Sales between businesses | — | — | — | — | — | — | — | — | — | |
— | 1,943 | — | — | 1,967 | 2,692 | 1,854 | — | 8,456 | ||
Exploration expenditure | — | 51 | — | — | — | 8 | — | — | 59 | |
Production costs | — | 145 | — | — | 812 | 560 | 574 | — | 2,091 | |
Production taxes | — | — | — | — | 324 | 37 | — | — | 361 | |
Other costs (income) | — | 26 | — | — | 134 | 339 | 25 | — | 524 | |
Depreciation, depletion and amortization | — | 453 | — | — | 477 | 1,431 | 965 | — | 3,326 | |
Net impairments and losses on sale of businesses and fixed assets | — | 65 | — | — | 849 | — | — | — | 914 | |
— | 740 | — | — | 2,596 | 2,375 | 1,564 | — | 7,275 | ||
Profit (loss) before taxation | — | 1,203 | — | — | (629) | 317 | 290 | — | 1,181 | |
Allocable taxes | — | 931 | — | — | (766) | 198 | 120 | — | 483 | |
Results of operations | — | 272 | — | — | 137 | 119 | 170 | — | 698 | |
226 | bp Annual Report and Form 20-F 2024 |
$ million | ||||||||||
2023 | ||||||||||
Europe | North America | South America | Africa | Asia | Australasia | Total | ||||
UK | Rest of Europe | US | Rest of North America | |||||||
Subsidiaries | ||||||||||
Capitalized costs at 31 Decembera b | ||||||||||
Gross capitalized costs | ||||||||||
Proved properties | 29,127 | — | 70,404 | 6 | 17,475 | 20,763 | 41,351 | 6,331 | 185,457 | |
Unproved properties | 369 | — | 3,057 | 1,917 | 2,565 | 2,739 | 1,691 | 737 | 13,075 | |
29,496 | — | 73,461 | 1,923 | 20,040 | 23,502 | 43,042 | 7,068 | 198,532 | ||
Accumulated depreciation | 22,018 | — | 42,364 | 1,592 | 15,712 | 21,132 | 24,431 | 4,998 | 132,247 | |
Net capitalized costs | 7,478 | — | 31,097 | 331 | 4,328 | 2,370 | 18,611 | 2,070 | 66,285 | |
Costs incurred for the year ended 31 Decembera b | ||||||||||
Acquisition of properties | ||||||||||
Proved | — | — | 13 | — | — | — | — | — | 13 | |
Unproved | — | — | 51 | — | 2 | 6 | — | — | 59 | |
— | — | 64 | — | 2 | 6 | — | — | 72 | ||
Exploration and appraisal costsc | 123 | — | 356 | 123 | 114 | 270 | 145 | 100 | 1,231 | |
Development | 484 | — | 4,690 | — | 713 | 863 | 1,424 | 32 | 8,206 | |
Total costs | 607 | — | 5,110 | 123 | 829 | 1,139 | 1,569 | 132 | 9,509 | |
Results of operations for the year ended 31 Decembera | ||||||||||
Sales and other operating revenuesd | ||||||||||
Third parties | 206 | — | 665 | — | 1,348 | 3,227 | 4,801 | 1,765 | 12,012 | |
Sales between businesses | 3,483 | — | 12,705 | — | 20 | 22 | 7,731 | 412 | 24,373 | |
3,689 | — | 13,370 | — | 1,368 | 3,249 | 12,532 | 2,177 | 36,385 | ||
Exploration expenditure | 46 | — | 348 | 93 | 54 | 413 | 25 | 18 | 997 | |
Production costs | 477 | — | 2,382 | 2 | 360 | 232 | 588 | 111 | 4,152 | |
Production taxes | 13 | — | 136 | — | 229 | — | 1,357 | 44 | 1,779 | |
Other costs (income)e | (171) | — | 2,144 | 13 | 115 | 304 | (35) | 145 | 2,515 | |
Depreciation, depletion and amortization | 1,063 | — | 3,532 | — | 1,351 | 1,546 | 2,844 | 412 | 10,748 | |
Net impairments and (gains) losses on sale of businesses and fixed assets | 819 | (18) | 701 | (100) | 671 | 1,430 | (1) | (4) | 3,498 | |
2,247 | (18) | 9,243 | 8 | 2,780 | 3,925 | 4,778 | 726 | 23,689 | ||
Profit (loss) before taxationf | 1,442 | 18 | 4,127 | (8) | (1,412) | (676) | 7,754 | 1,451 | 12,696 | |
Allocable taxes | 365 | 19 | 889 | (3) | (565) | 439 | 5,317 | 451 | 6,912 | |
Results of operations | 1,077 | (1) | 3,238 | (5) | (847) | (1,115) | 2,437 | 1,000 | 5,784 | |
bp Annual Report and Form 20-F 2024 | 227 |
Financial statements |
$ million | ||||||||||
2023 | ||||||||||
Europe | North America | South America | Africa | Asia | Australasia | Total | ||||
UK | Rest of Europe | US | Rest of North America | |||||||
Equity-accounted entities (bp share) | ||||||||||
Capitalized costs at 31 Decembera b | ||||||||||
Gross capitalized costs | ||||||||||
Proved properties | — | 4,432 | — | — | 12,530 | 8,590 | 9,947 | — | 35,499 | |
Unproved properties | — | 652 | — | — | 125 | 372 | — | — | 1,149 | |
— | 5,084 | — | — | 12,655 | 8,962 | 9,947 | — | 36,648 | ||
Accumulated depreciation | — | 2,420 | — | — | 6,807 | 1,812 | 1,696 | — | 12,735 | |
Net capitalized costs | — | 2,664 | — | — | 5,848 | 7,150 | 8,251 | — | 23,913 | |
Costs incurred for the year ended 31 Decembera c d | ||||||||||
Acquisition of propertiesb | ||||||||||
Proved | — | — | — | — | — | — | — | — | — | |
Unproved | — | — | — | — | — | — | — | — | — | |
— | — | — | — | — | — | — | — | — | ||
Exploration and appraisal costsc | — | 42 | — | — | 7 | 44 | — | — | 93 | |
Development | — | 584 | — | — | 687 | 844 | 942 | — | 3,057 | |
Total costs | — | 626 | — | — | 694 | 888 | 942 | — | 3,150 | |
Results of operations for the year ended 31 Decembera | ||||||||||
Sales and other operating revenuese | ||||||||||
Third parties | — | 2,159 | — | — | 2,070 | 2,550 | 1,716 | — | 8,495 | |
Sales between businesses | — | — | — | — | — | — | — | — | — | |
— | 2,159 | — | — | 2,070 | 2,550 | 1,716 | — | 8,495 | ||
Exploration expenditure | — | 41 | — | — | — | 44 | — | — | 85 | |
Production costs | — | 169 | — | — | 715 | 427 | 374 | — | 1,685 | |
Production taxes | — | — | — | — | 332 | 52 | — | — | 384 | |
Other costs (income) | — | 21 | — | — | 257 | 239 | 8 | — | 525 | |
Depreciation, depletion and amortization | — | 455 | — | — | 451 | 1,344 | 1,144 | — | 3,394 | |
Net impairments and losses on sale of businesses and fixed assets | — | 141 | — | — | — | 15 | — | — | 156 | |
— | 827 | — | — | 1,755 | 2,121 | 1,526 | — | 6,229 | ||
Profit (loss) before taxation | — | 1,332 | — | — | 315 | 429 | 190 | — | 2,266 | |
Allocable taxes | — | 1,124 | — | — | 127 | 173 | 117 | — | 1,541 | |
Results of operations | — | 208 | — | — | 188 | 256 | 73 | — | 725 | |
228 | bp Annual Report and Form 20-F 2024 |
$ million | |||||||||||
2022 | |||||||||||
Europe | North America | South America | Africa | Asia | Australasia | Total | |||||
UK | Rest of Europe | USh | Rest of North America | Russia | Rest of Asia | ||||||
Subsidiaries | |||||||||||
Capitalized costs at 31 Decembera b | |||||||||||
Gross capitalized costs | |||||||||||
Proved properties | 30,010 | — | 65,870 | 6 | 16,720 | 20,257 | — | 39,899 | 6,324 | 179,086 | |
Unproved properties | 397 | — | 2,976 | 1,875 | 2,507 | 2,535 | — | 1,622 | 659 | 12,571 | |
30,407 | — | 68,846 | 1,881 | 19,227 | 22,792 | — | 41,521 | 6,983 | 191,657 | ||
Accumulated depreciation | 21,757 | — | 38,205 | 1,586 | 13,849 | 18,207 | — | 21,642 | 4,588 | 119,834 | |
Net capitalized costs | 8,650 | — | 30,641 | 295 | 5,378 | 4,585 | — | 19,879 | 2,395 | 71,823 | |
Costs incurred for the year ended 31 Decembera b | |||||||||||
Acquisition of properties | |||||||||||
Proved | 12 | — | 183 | — | — | — | — | 245 | — | 440 | |
Unproved | — | — | 37 | 164 | 2 | 14 | — | — | — | 217 | |
12 | — | 220 | 164 | 2 | 14 | — | 245 | — | 657 | ||
Exploration and appraisal costsc | 39 | — | 288 | 137 | 235 | 103 | — | 73 | 17 | 892 | |
Development | 318 | — | 3,825 | 15 | 483 | 1,378 | — | 1,555 | 176 | 7,750 | |
Total costs | 369 | — | 4,333 | 316 | 720 | 1,495 | — | 1,873 | 193 | 9,299 | |
Results of operations for the year ended 31 Decembera | |||||||||||
Sales and other operating revenuesd | |||||||||||
Third parties | 549 | — | 2,101 | 420 | 2,977 | 3,836 | — | 6,551 | 1,588 | 18,022 | |
Sales between businesses | 5,747 | — | 12,746 | — | 538 | 2,146 | — | 9,932 | 1,472 | 32,581 | |
6,296 | — | 14,847 | 420 | 3,515 | 5,982 | — | 16,483 | 3,060 | 50,603 | ||
Exploration expenditure | 11 | — | 144 | 109 | 172 | 57 | — | 94 | (2) | 585 | |
Production costs | 498 | — | 2,102 | 83 | 327 | 592 | — | 723 | 107 | 4,432 | |
Production taxes | 1 | — | 194 | — | 513 | — | — | 1,544 | 73 | 2,325 | |
Other costs (income)e | (210) | (47) | 2,926 | 63 | 96 | 206 | 32 | (44) | 300 | 3,322 | |
Depreciation, depletion and amortization | 1,242 | — | 3,122 | 18 | 680 | 2,075 | 1 | 2,495 | 384 | 10,017 | |
Net impairments and (gains) losses on sale of businesses and fixed assetsf | (433) | (901) | 217 | (3) | 1,570 | (1,189) | 1,523 | (341) | (43) | 400 | |
1,109 | (948) | 8,705 | 270 | 3,358 | 1,741 | 1,556 | 4,471 | 819 | 21,081 | ||
Profit (loss) before taxationg | 5,187 | 948 | 6,142 | 150 | 157 | 4,241 | (1,556) | 12,012 | 2,241 | 29,522 | |
Allocable taxes | 4,443 | — | 1,409 | 50 | 1,814 | 886 | (5) | 6,651 | 842 | 16,090 | |
Results of operations | 744 | 948 | 4,733 | 100 | (1,657) | 3,355 | (1,551) | 5,361 | 1,399 | 13,432 | |
bp Annual Report and Form 20-F 2024 | 229 |
Financial statements |
$ million | |||||||||||
2022 | |||||||||||
Europe | North America | South America | Africa | Asia | Australasia | Total | |||||
UK | Rest of Europe | US | Rest of North America | Russiaa | Rest of Asia | ||||||
Equity-accounted entities (bp share) | |||||||||||
Capitalized costs at 31 Decemberb c | |||||||||||
Gross capitalized costs | |||||||||||
Proved properties | — | 3,739 | — | — | 12,000 | 7,927 | — | 8,381 | — | 32,047 | |
Unproved properties | — | 611 | — | — | 120 | 371 | — | — | — | 1,102 | |
— | 4,350 | — | — | 12,120 | 8,298 | — | 8,381 | — | 33,149 | ||
Accumulated depreciation | — | 1,800 | — | — | 6,356 | 572 | — | 553 | — | 9,281 | |
Net capitalized costs | — | 2,550 | — | — | 5,764 | 7,726 | — | 7,828 | — | 23,868 | |
Costs incurred for the year ended 31 Decemberb d e | |||||||||||
Acquisition of propertiesc | |||||||||||
Proved | — | 1,224 | — | — | — | — | — | — | — | 1,224 | |
Unproved | — | 204 | — | — | — | — | — | — | — | 204 | |
— | 1,428 | — | — | — | — | — | — | — | 1,428 | ||
Exploration and appraisal costsd | — | 46 | — | — | 22 | 60 | 28 | — | — | 156 | |
Developmentf | — | (24) | — | — | 673 | 292 | 428 | 625 | — | 1,994 | |
Total costs | — | 1,450 | — | — | 695 | 352 | 456 | 625 | — | 3,578 | |
Results of operations for the year ended 31 Decemberb | |||||||||||
Sales and other operating revenuesg | |||||||||||
Third parties | — | 2,050 | — | — | 2,171 | 1,137 | — | 829 | — | 6,187 | |
Sales between businesses | — | — | — | — | — | — | 6,052 | — | — | 6,052 | |
— | 2,050 | — | — | 2,171 | 1,137 | 6,052 | 829 | — | 12,239 | ||
Exploration expenditure | — | 39 | — | — | — | 7 | 13 | — | — | 59 | |
Production costs | — | 148 | — | — | 628 | 246 | 411 | 191 | — | 1,624 | |
Production taxes | — | — | — | — | 397 | 15 | 4,435 | — | — | 4,847 | |
Other costs (income) | — | (6) | — | — | 16 | 152 | 97 | 20 | — | 279 | |
Depreciation, depletion and amortization | — | 348 | — | — | 462 | 572 | 535 | 553 | — | 2,470 | |
Net impairments and losses on sale of businesses and fixed assets | — | 164 | — | — | — | — | — | — | — | 164 | |
— | 693 | — | — | 1,503 | 992 | 5,491 | 764 | — | 9,443 | ||
Profit (loss) before taxation | — | 1,357 | — | — | 668 | 145 | 561 | 65 | — | 2,796 | |
Allocable taxes | — | 1,098 | — | — | 77 | 81 | 109 | 66 | — | 1,431 | |
Results of operations | — | 259 | — | — | 591 | 64 | 452 | (1) | — | 1,365 | |
230 | bp Annual Report and Form 20-F 2024 |
million barrels | ||||||||||
Crude oila b | 2024 | |||||||||
Europe | North America | South America | Asia Africa | Australasia | Total | |||||
UK | Rest of Europe | US | Rest of North America | |||||||
Subsidiaries | ||||||||||
At 1 January | ||||||||||
Developed | 129 | — | 713 | — | 3 | 5 | 729 | 11 | 1,590 | |
Undeveloped | 74 | — | 352 | — | 5 | — | 323 | 1 | 755 | |
203 | — | 1,065 | — | 7 | 6 | 1,052 | 12 | 2,345 | ||
Changes attributable to | ||||||||||
Revisions of previous estimates | (12) | — | 54 | — | 2 | 5 | 77 | 1 | 128 | |
Improved recovery | — | — | 2 | — | — | — | — | — | 2 | |
Purchases of reserves-in-place | 1 | — | — | — | — | 1 | — | — | 2 | |
Discoveries and extensions | — | — | 143 | — | — | — | — | — | 143 | |
Production | (25) | — | (138) | — | (2) | (7) | (109) | (3) | (284) | |
Sales of reserves-in-place | — | — | (1) | — | (3) | (4) | — | — | (7) | |
(36) | — | 61 | — | (2) | (5) | (31) | (2) | (16) | ||
At 31 Decemberc | ||||||||||
Developed | 104 | — | 653 | — | 1 | 1 | 716 | 9 | 1,483 | |
Undeveloped | 63 | — | 472 | — | 4 | — | 305 | 1 | 846 | |
167 | — | 1,125 | — | 5 | 1 | 1,021 | 10 | 2,329 | ||
Equity-accounted entities (bp share)d | ||||||||||
At 1 January | ||||||||||
Developed | — | 89 | — | 11 | 275 | 99 | 115 | — | 588 | |
Undeveloped | — | 45 | — | — | 253 | 88 | 2 | — | 387 | |
— | 133 | — | 11 | 528 | 187 | 117 | — | 976 | ||
Changes attributable to | ||||||||||
Revisions of previous estimates | — | 4 | — | — | (25) | 10 | 19 | — | 8 | |
Improved recovery | — | 1 | — | — | — | — | — | — | 1 | |
Purchases of reserves-in-place | — | — | — | — | — | 5 | — | — | 5 | |
Discoveries and extensions | — | — | — | — | 18 | — | — | — | 18 | |
Production | — | (21) | — | (1) | (20) | (30) | (25) | — | (97) | |
Sales of reserves-in-place | — | — | — | — | (14) | — | — | — | (15) | |
— | (16) | — | (1) | (41) | (16) | (6) | — | (80) | ||
At 31 December | ||||||||||
Developed | — | 76 | — | 10 | 271 | 94 | 107 | — | 558 | |
Undeveloped | — | 42 | — | — | 217 | 77 | 3 | — | 339 | |
— | 118 | — | 10 | 488 | 170 | 110 | — | 896 | ||
Total subsidiaries and equity-accounted entities (bp share) | ||||||||||
At 1 January | ||||||||||
Developed | 129 | 89 | 713 | 11 | 278 | 104 | 844 | 11 | 2,179 | |
Undeveloped | 74 | 45 | 352 | — | 258 | 88 | 324 | 1 | 1,142 | |
203 | 133 | 1,065 | 11 | 536 | 192 | 1,168 | 12 | 3,321 | ||
At 31 December | ||||||||||
Developed | 104 | 76 | 653 | 10 | 271 | 95 | 823 | 9 | 2,041 | |
Undeveloped | 63 | 42 | 472 | — | 221 | 77 | 308 | 1 | 1,184 | |
167 | 118 | 1,125 | 10 | 493 | 171 | 1,131 | 10 | 3,225 | ||
bp Annual Report and Form 20-F 2024 | 231 |
Financial statements |
million barrels | ||||||||||
Natural gas liquidsa b | 2024 | |||||||||
Europe | North America | South America | Africa Asia | Australasia | Total | |||||
UK | Rest of Europe | USc | Rest of North America | |||||||
Subsidiaries | ||||||||||
At 1 January | ||||||||||
Developed | 3 | — | 180 | — | — | — | — | 1 | 184 | |
Undeveloped | — | — | 217 | — | — | — | — | — | 217 | |
3 | — | 397 | — | — | — | — | 1 | 401 | ||
Changes attributable to | ||||||||||
Revisions of previous estimates | — | — | 89 | — | 2 | — | — | 1 | 93 | |
Improved recovery | — | — | — | — | — | — | — | — | — | |
Purchases of reserves-in-place | — | — | 1 | — | — | — | — | — | 1 | |
Discoveries and extensions | — | — | 4 | — | — | — | — | — | 4 | |
Productionc | (1) | — | (39) | — | (2) | — | — | (1) | (43) | |
Sales of reserves-in-place | — | — | (4) | — | — | — | — | — | (4) | |
(1) | — | 51 | — | — | — | — | — | 51 | ||
At 31 Decemberd | ||||||||||
Developed | 2 | — | 202 | — | 1 | — | — | 1 | 206 | |
Undeveloped | — | — | 246 | — | — | — | — | — | 246 | |
3 | — | 447 | — | 1 | — | — | 1 | 452 | ||
Equity-accounted entities (bp share)e | ||||||||||
At 1 January | ||||||||||
Developed | — | 3 | — | — | 3 | 14 | — | — | 19 | |
Undeveloped | — | 5 | — | — | 1 | — | — | — | 6 | |
— | 8 | — | — | 4 | 14 | — | — | 25 | ||
Changes attributable to | ||||||||||
Revisions of previous estimates | — | 1 | — | — | — | (2) | — | — | (1) | |
Improved recovery | — | — | — | — | — | — | — | — | — | |
Purchases of reserves-in-place | — | — | — | — | — | — | — | — | — | |
Discoveries and extensions | — | — | — | — | — | — | — | — | — | |
Production | — | (1) | — | — | — | (2) | — | — | (3) | |
Sales of reserves-in-place | — | — | — | — | — | — | — | — | — | |
— | — | — | — | — | (4) | — | — | (4) | ||
At 31 December | ||||||||||
Developed | — | 3 | — | — | 3 | 10 | — | — | 16 | |
Undeveloped | — | 5 | — | — | — | — | — | — | 6 | |
— | 8 | — | — | 4 | 10 | — | — | 22 | ||
Total subsidiaries and equity-accounted entities (bp share) | ||||||||||
At 1 January | ||||||||||
Developed | 3 | 3 | 180 | — | 3 | 14 | — | 1 | 204 | |
Undeveloped | — | 5 | 217 | — | 1 | — | — | — | 223 | |
3 | 8 | 397 | — | 4 | 14 | — | 1 | 427 | ||
At 31 December | ||||||||||
Developed | 2 | 3 | 202 | — | 4 | 10 | — | 1 | 222 | |
Undeveloped | — | 5 | 246 | — | — | — | — | — | 252 | |
3 | 8 | 447 | — | 4 | 10 | — | 1 | 474 | ||
232 | bp Annual Report and Form 20-F 2024 |
million barrels | ||||||||||
Total liquidsa b | 2024 | |||||||||
Europe | North America | South America | Africa Asia | Australasia | Total | |||||
UK | Rest of Europe | USc | Rest of North America | |||||||
Subsidiaries | ||||||||||
At 1 January | ||||||||||
Developed | 132 | — | 893 | — | 3 | 6 | 729 | 11 | 1,775 | |
Undeveloped | 75 | — | 568 | — | 5 | — | 323 | 1 | 971 | |
207 | — | 1,462 | — | 7 | 6 | 1,052 | 13 | 2,746 | ||
Changes attributable to | ||||||||||
Revisions of previous estimates | (11) | — | 144 | — | 4 | 6 | 77 | 2 | 221 | |
Improved recovery | — | — | 2 | — | — | — | — | — | 2 | |
Purchases of reserves-in-place | 1 | — | 1 | — | — | 1 | — | — | 3 | |
Discoveries and extensions | — | — | 146 | — | — | — | — | — | 147 | |
Productionc | (27) | — | (177) | — | (3) | (7) | (109) | (4) | (326) | |
Sales of reserves-in-place | — | — | (5) | — | (3) | (4) | — | — | (11) | |
(37) | — | 111 | — | (2) | (5) | (31) | (1) | 35 | ||
At 31 Decemberd | ||||||||||
Developed | 106 | — | 855 | — | 1 | 1 | 716 | 10 | 1,689 | |
Undeveloped | 63 | — | 718 | — | 4 | — | 305 | 1 | 1,092 | |
169 | — | 1,573 | — | 6 | 1 | 1,021 | 11 | 2,781 | ||
Equity-accounted entities (bp share)e | ||||||||||
At 1 January | ||||||||||
Developed | — | 92 | — | 11 | 278 | 113 | 115 | — | 608 | |
Undeveloped | — | 49 | — | — | 254 | 88 | 2 | — | 393 | |
— | 141 | — | 11 | 532 | 200 | 117 | — | 1,001 | ||
Changes attributable to | ||||||||||
Revisions of previous estimates | — | 5 | — | — | (25) | 8 | 19 | — | 8 | |
Improved recovery | — | 1 | — | — | — | — | — | — | 1 | |
Purchases of reserves-in-place | — | — | — | — | — | 5 | — | — | 5 | |
Discoveries and extensions | — | — | — | — | 18 | — | — | — | 18 | |
Production | — | (22) | — | (1) | (20) | (32) | (25) | — | (100) | |
Sales of reserves-in-place | — | — | — | — | (14) | — | — | — | (15) | |
— | (16) | — | (1) | (41) | (20) | (6) | — | (84) | ||
At 31 December | ||||||||||
Developed | — | 78 | — | 10 | 274 | 103 | 107 | — | 573 | |
Undeveloped | — | 47 | — | — | 217 | 77 | 3 | — | 344 | |
— | 125 | — | 10 | 491 | 180 | 110 | — | 918 | ||
Total subsidiaries and equity-accounted entities (bp share) | ||||||||||
At 1 January | ||||||||||
Developed | 132 | 92 | 893 | 11 | 281 | 118 | 844 | 11 | 2,382 | |
Undeveloped | 75 | 49 | 568 | — | 259 | 88 | 324 | 1 | 1,365 | |
207 | 141 | 1,462 | 11 | 540 | 206 | 1,168 | 13 | 3,747 | ||
At 31 December | ||||||||||
Developed | 106 | 78 | 855 | 10 | 275 | 105 | 823 | 10 | 2,263 | |
Undeveloped | 63 | 47 | 718 | — | 222 | 77 | 308 | 1 | 1,436 | |
169 | 125 | 1,573 | 10 | 497 | 182 | 1,131 | 11 | 3,699 | ||
bp Annual Report and Form 20-F 2024 | 233 |
Financial statements |
billion cubic feet | ||||||||||
Natural gasa b | 2024 | |||||||||
Europe | North America | South America | Asia Africa | Australasia | Total | |||||
UK | Rest of Europe | US | Rest of North America | |||||||
Subsidiaries | ||||||||||
At 1 January | ||||||||||
Developed | 221 | — | 2,672 | — | 931 | 518 | 3,051 | 1,550 | 8,942 | |
Undeveloped | 34 | — | 3,229 | — | 503 | 207 | 1,672 | 358 | 6,003 | |
255 | — | 5,901 | — | 1,434 | 724 | 4,722 | 1,907 | 14,944 | ||
Changes attributable to | ||||||||||
Revisions of previous estimates | 12 | — | (241) | — | (174) | 133 | 237 | (40) | (73) | |
Improved recovery | — | — | 1 | — | — | — | — | — | 1 | |
Purchases of reserves-in-place | 3 | — | 34 | — | — | 46 | — | — | 83 | |
Discoveries and extensions | — | — | 32 | — | 8 | — | 11 | 142 | 193 | |
Productionc | (80) | — | (639) | — | (423) | (340) | (625) | (325) | (2,432) | |
Sales of reserves-in-place | — | — | (76) | — | (115) | (402) | — | — | (594) | |
(65) | — | (889) | — | (704) | (564) | (376) | (222) | (2,821) | ||
At 31 Decemberd | ||||||||||
Developed | 162 | — | 2,600 | — | 379 | 161 | 3,026 | 1,254 | 7,582 | |
Undeveloped | 29 | — | 2,412 | — | 350 | — | 1,320 | 431 | 4,542 | |
190 | — | 5,012 | — | 730 | 161 | 4,346 | 1,685 | 12,124 | ||
Equity-accounted entities (bp share)e | ||||||||||
At 1 January | ||||||||||
Developed | — | 67 | — | 4 | 1,027 | 463 | 46 | — | 1,608 | |
Undeveloped | — | 110 | — | — | 621 | 188 | — | — | 919 | |
— | 177 | — | 4 | 1,648 | 651 | 46 | — | 2,527 | ||
Changes attributable to | ||||||||||
Revisions of previous estimates | — | 1 | — | — | (32) | (59) | — | — | (89) | |
Improved recovery | — | 2 | — | — | — | — | — | — | 2 | |
Purchases of reserves-in-place | — | — | — | — | — | 205 | — | — | 205 | |
Discoveries and extensions | — | — | — | — | 221 | — | — | — | 221 | |
Productionc | — | (20) | — | — | (129) | (46) | (2) | — | (199) | |
Sales of reserves-in-place | — | — | — | — | (4) | — | — | — | (5) | |
— | (18) | — | — | 56 | 100 | (2) | — | 135 | ||
At 31 December | ||||||||||
Developed | — | 49 | — | 4 | 1,053 | 536 | 43 | — | 1,686 | |
Undeveloped | — | 111 | — | — | 651 | 215 | — | — | 976 | |
— | 160 | — | 4 | 1,704 | 751 | 43 | — | 2,662 | ||
Total subsidiaries and equity-accounted entities (bp share) | ||||||||||
At 1 January | ||||||||||
Developed | 221 | 67 | 2,672 | 4 | 1,958 | 981 | 3,096 | 1,550 | 10,549 | |
Undeveloped | 34 | 110 | 3,229 | — | 1,125 | 394 | 1,672 | 358 | 6,922 | |
255 | 177 | 5,901 | 4 | 3,082 | 1,375 | 4,768 | 1,907 | 17,471 | ||
At 31 December | ||||||||||
Developed | 162 | 49 | 2,600 | 4 | 1,433 | 697 | 3,070 | 1,254 | 9,268 | |
Undeveloped | 29 | 111 | 2,412 | — | 1,001 | 215 | 1,320 | 431 | 5,518 | |
190 | 160 | 5,012 | 4 | 2,434 | 911 | 4,390 | 1,685 | 14,786 | ||
234 | bp Annual Report and Form 20-F 2024 |
million barrels of oil equivalentc | ||||||||||
Total hydrocarbonsa b | 2024 | |||||||||
Europe | North America | South America | Africa Asia | Australasia | Total | |||||
UK | Rest of Europe | USf | Rest of North America | |||||||
Subsidiaries | ||||||||||
At 1 January | ||||||||||
Developed | 170 | — | 1,354 | — | 163 | 95 | 1,255 | 279 | 3,316 | |
Undeveloped | 81 | — | 1,125 | — | 91 | 36 | 611 | 63 | 2,006 | |
251 | — | 2,479 | — | 255 | 131 | 1,866 | 341 | 5,323 | ||
Changes attributable to | ||||||||||
Revisions of previous estimates | (9) | — | 102 | — | (26) | 28 | 118 | (5) | 208 | |
Improved recovery | — | — | 2 | — | — | — | — | — | 2 | |
Purchases of reserves-in-place | 1 | — | 7 | — | — | 9 | — | — | 17 | |
Discoveries and extensions | — | — | 152 | — | 1 | — | 2 | 25 | 180 | |
Productiond e | (41) | — | (287) | — | (76) | (66) | (216) | (60) | (746) | |
Sales of reserves-in-place | — | — | (18) | — | (22) | (73) | — | — | (113) | |
(49) | — | (42) | — | (123) | (102) | (96) | (40) | (451) | ||
At 31 Decemberf | ||||||||||
Developed | 134 | — | 1,303 | — | 67 | 29 | 1,237 | 226 | 2,997 | |
Undeveloped | 68 | — | 1,134 | — | 65 | — | 533 | 76 | 1,875 | |
202 | — | 2,437 | — | 131 | 29 | 1,770 | 302 | 4,871 | ||
Equity-accounted entities (bp share)g | ||||||||||
At 1 January | ||||||||||
Developed | — | 103 | — | 12 | 455 | 192 | 123 | — | 885 | |
Undeveloped | — | 68 | — | — | 361 | 120 | 2 | — | 552 | |
— | 172 | — | 12 | 816 | 313 | 124 | — | 1,437 | ||
Changes attributable to | ||||||||||
Revisions of previous estimates | — | 5 | — | — | (30) | (2) | 19 | — | (8) | |
Improved recovery | — | 1 | — | — | — | — | — | — | 1 | |
Purchases of reserves-in-place | — | — | — | — | — | 40 | — | — | 40 | |
Discoveries and extensions | — | — | — | — | 56 | — | — | — | 56 | |
Productione | — | (26) | — | (1) | (42) | (40) | (26) | — | (135) | |
Sales of reserves-in-place | — | — | — | — | (15) | — | — | — | (16) | |
— | (19) | — | (1) | (31) | (3) | (7) | — | (60) | ||
At 31 December | ||||||||||
Developed | — | 87 | — | 11 | 456 | 196 | 115 | — | 864 | |
Undeveloped | — | 66 | — | — | 330 | 114 | 3 | — | 513 | |
— | 153 | — | 11 | 785 | 310 | 118 | — | 1,377 | ||
Total subsidiaries and equity-accounted entities (bp share) | ||||||||||
At 1 January | ||||||||||
Developed | 170 | 103 | 1,354 | 12 | 618 | 287 | 1,378 | 279 | 4,201 | |
Undeveloped | 81 | 68 | 1,125 | — | 453 | 156 | 613 | 63 | 2,558 | |
251 | 172 | 2,479 | 12 | 1,071 | 444 | 1,991 | 341 | 6,759 | ||
At 31 December | ||||||||||
Developed | 134 | 87 | 1,303 | 11 | 522 | 225 | 1,352 | 226 | 3,860 | |
Undeveloped | 68 | 66 | 1,134 | — | 394 | 114 | 535 | 76 | 2,387 | |
202 | 153 | 2,437 | 11 | 917 | 339 | 1,888 | 302 | 6,248 | ||
bp Annual Report and Form 20-F 2024 | 235 |
Financial statements |
million barrels | ||||||||||
Crude oila b | 2023 | |||||||||
Europe | North America | South America | Africa | Asia | Australasia | Total | ||||
UK | Rest of Europe | US | Rest of North America | |||||||
Subsidiaries | ||||||||||
At 1 January | ||||||||||
Developed | 153 | — | 679 | — | 4 | 24 | 717 | 20 | 1,596 | |
Undeveloped | 109 | — | 527 | — | 5 | 2 | 356 | 1 | 1,000 | |
261 | — | 1,206 | — | 9 | 26 | 1,073 | 21 | 2,596 | ||
Changes attributable to | ||||||||||
Revisions of previous estimates | (32) | — | (60) | — | (1) | (3) | 85 | (6) | (15) | |
Improved recovery | — | — | 14 | — | — | — | — | — | 14 | |
Purchases of reserves-in-place | — | — | 14 | — | — | — | — | — | 14 | |
Discoveries and extensions | — | — | 17 | — | — | — | 1 | — | 18 | |
Production | (27) | — | (123) | — | (1) | (11) | (107) | (4) | (274) | |
Sales of reserves-in-place | — | — | (1) | — | — | (6) | — | — | (7) | |
(58) | — | (141) | — | (2) | (20) | (21) | (9) | (252) | ||
At 31 Decemberc | ||||||||||
Developed | 129 | — | 713 | — | 3 | 5 | 729 | 11 | 1,590 | |
Undeveloped | 74 | — | 352 | — | 5 | — | 323 | 1 | 755 | |
203 | — | 1,065 | — | 7 | 6 | 1,052 | 12 | 2,345 | ||
Equity-accounted entities (bp share)d | ||||||||||
At 1 January | ||||||||||
Developed | — | 90 | — | 5 | 276 | 127 | 95 | — | 592 | |
Undeveloped | — | 16 | — | 7 | 244 | 74 | 1 | — | 342 | |
— | 106 | — | 12 | 520 | 201 | 96 | — | 935 | ||
Changes attributable to | ||||||||||
Revisions of previous estimates | — | 6 | — | — | 7 | 15 | 43 | — | 71 | |
Improved recovery | — | 21 | — | — | 4 | — | — | — | 24 | |
Purchases of reserves-in-place | — | — | — | — | — | — | — | — | — | |
Discoveries and extensions | — | 22 | — | — | 19 | — | — | — | 41 | |
Production | — | (22) | — | (1) | (20) | (30) | (23) | — | (95) | |
Sales of reserves-in-place | — | — | — | — | — | — | — | — | — | |
— | 27 | — | (1) | 9 | (14) | 20 | — | 41 | ||
At 31 December | ||||||||||
Developed | — | 89 | — | 11 | 275 | 99 | 115 | — | 588 | |
Undeveloped | — | 45 | — | — | 253 | 88 | 2 | — | 387 | |
— | 133 | — | 11 | 528 | 187 | 117 | — | 976 | ||
Total subsidiaries and equity-accounted entities (bp share) | ||||||||||
At 1 January | ||||||||||
Developed | 153 | 90 | 679 | 5 | 279 | 151 | 812 | 20 | 2,188 | |
Undeveloped | 109 | 16 | 527 | 7 | 249 | 76 | 358 | 1 | 1,343 | |
261 | 106 | 1,206 | 12 | 529 | 227 | 1,169 | 21 | 3,531 | ||
At 31 December | ||||||||||
Developed | 129 | 89 | 713 | 11 | 278 | 104 | 844 | 11 | 2,179 | |
Undeveloped | 74 | 45 | 352 | — | 258 | 88 | 324 | 1 | 1,142 | |
203 | 133 | 1,065 | 11 | 536 | 192 | 1,168 | 12 | 3,321 | ||
236 | bp Annual Report and Form 20-F 2024 |
million barrels | ||||||||||
Natural gas liquidsa b | 2023 | |||||||||
Europe | North America | South America | Africa | Asia | Australasia | Total | ||||
UK | Rest of Europe | USc | Rest of North America | |||||||
Subsidiaries | ||||||||||
At 1 January | ||||||||||
Developed | 6 | — | 181 | — | 1 | 6 | — | 1 | 196 | |
Undeveloped | — | — | 236 | — | — | 1 | — | — | 237 | |
6 | — | 417 | — | 1 | 7 | — | 1 | 432 | ||
Changes attributable to | ||||||||||
Revisions of previous estimates | (1) | — | (14) | — | — | — | — | 1 | (14) | |
Improved recovery | — | — | 15 | — | — | — | — | — | 16 | |
Purchases of reserves-in-place | — | — | 12 | — | — | — | — | — | 12 | |
Discoveries and extensions | — | — | — | — | — | — | — | — | — | |
Productionc | (2) | — | (31) | — | (1) | (1) | — | (1) | (35) | |
Sales of reserves-in-place | — | — | (3) | — | — | (6) | — | — | (9) | |
(3) | — | (20) | — | (1) | (7) | — | — | (31) | ||
At 31 Decemberd | ||||||||||
Developed | 3 | — | 180 | — | — | — | — | 1 | 184 | |
Undeveloped | — | — | 217 | — | — | — | — | — | 217 | |
3 | — | 397 | — | — | — | — | 1 | 401 | ||
Equity-accounted entities (bp share)e | ||||||||||
At 1 January | ||||||||||
Developed | — | 4 | — | — | 3 | 17 | — | — | 23 | |
Undeveloped | — | — | — | — | 1 | 9 | — | — | 10 | |
— | 4 | — | — | 4 | 26 | — | — | 34 | ||
Changes attributable to | ||||||||||
Revisions of previous estimates | — | — | — | — | 1 | (11) | — | — | (10) | |
Improved recovery | — | 1 | — | — | — | — | — | — | 1 | |
Purchases of reserves-in-place | — | — | — | — | — | — | — | — | — | |
Discoveries and extensions | — | 4 | — | — | — | — | — | — | 4 | |
Production | — | (1) | — | — | — | (1) | — | — | (3) | |
Sales of reserves-in-place | — | — | — | — | — | — | — | — | — | |
— | 4 | — | — | — | (12) | — | — | (8) | ||
At 31 December | ||||||||||
Developed | — | 3 | — | — | 3 | 14 | — | — | 19 | |
Undeveloped | — | 5 | — | — | 1 | — | — | — | 6 | |
— | 8 | — | — | 4 | 14 | — | — | 25 | ||
Total subsidiaries and equity-accounted entities (bp share) | ||||||||||
At 1 January | ||||||||||
Developed | 6 | 4 | 181 | — | 4 | 23 | — | 1 | 219 | |
Undeveloped | — | — | 236 | — | 1 | 10 | — | — | 247 | |
6 | 4 | 417 | — | 5 | 33 | — | 1 | 466 | ||
At 31 December | ||||||||||
Developed | 3 | 3 | 180 | — | 3 | 14 | — | 1 | 204 | |
Undeveloped | — | 5 | 217 | — | 1 | — | — | — | 223 | |
3 | 8 | 397 | — | 4 | 14 | — | 1 | 427 | ||
bp Annual Report and Form 20-F 2024 | 237 |
Financial statements |
million barrels | ||||||||||
Total liquidsa b | 2023 | |||||||||
Europe | North America | South America | Africa | Asia | Australasia | Total | ||||
UK | Rest of Europe | USc | Rest of North America | |||||||
Subsidiaries | ||||||||||
At 1 January | ||||||||||
Developed | 159 | — | 860 | — | 5 | 30 | 717 | 20 | 1,791 | |
Undeveloped | 109 | — | 763 | — | 5 | 3 | 356 | 1 | 1,237 | |
267 | — | 1,623 | — | 11 | 33 | 1,073 | 22 | 3,029 | ||
Changes attributable to | ||||||||||
Revisions of previous estimates | (33) | — | (74) | — | (1) | (3) | 85 | (5) | (30) | |
Improved recovery | — | — | 29 | — | — | — | — | — | 29 | |
Purchases of reserves-in-place | — | — | 25 | — | — | — | — | — | 25 | |
Discoveries and extensions | — | — | 17 | — | — | — | 1 | — | 18 | |
Productionc | (29) | — | (154) | — | (3) | (12) | (107) | (4) | (309) | |
Sales of reserves-in-place | — | — | (4) | — | — | (12) | — | — | (17) | |
(61) | — | (161) | — | (3) | (27) | (21) | (9) | (283) | ||
At 31 Decemberd | ||||||||||
Developed | 132 | — | 893 | — | 3 | 6 | 729 | 11 | 1,775 | |
Undeveloped | 75 | — | 568 | — | 5 | — | 323 | 1 | 971 | |
207 | — | 1,462 | — | 7 | 6 | 1,052 | 13 | 2,746 | ||
Equity-accounted entities (bp share)e | ||||||||||
At 1 January | ||||||||||
Developed | — | 94 | — | 5 | 278 | 144 | 95 | — | 616 | |
Undeveloped | — | 16 | — | 7 | 245 | 83 | 1 | — | 352 | |
— | 110 | — | 12 | 523 | 227 | 96 | — | 968 | ||
Changes attributable to | ||||||||||
Revisions of previous estimates | — | 6 | — | — | 7 | 4 | 43 | — | 61 | |
Improved recovery | — | 22 | — | — | 4 | — | — | — | 26 | |
Purchases of reserves-in-place | — | — | — | — | — | — | — | — | — | |
Discoveries and extensions | — | 26 | — | — | 19 | — | — | — | 45 | |
Production | — | (23) | — | (1) | (20) | (31) | (23) | — | (98) | |
Sales of reserves-in-place | — | — | — | — | — | — | — | — | — | |
— | 31 | — | (1) | 9 | (27) | 20 | — | 33 | ||
At 31 December | ||||||||||
Developed | — | 92 | — | 11 | 278 | 113 | 115 | — | 608 | |
Undeveloped | — | 49 | — | — | 254 | 88 | 2 | — | 393 | |
— | 141 | — | 11 | 532 | 200 | 117 | — | 1,001 | ||
Total subsidiaries and equity-accounted entities (bp share) | ||||||||||
At 1 January | ||||||||||
Developed | 159 | 94 | 860 | 5 | 283 | 174 | 812 | 20 | 2,407 | |
Undeveloped | 109 | 16 | 763 | 7 | 250 | 86 | 358 | 1 | 1,590 | |
267 | 110 | 1,623 | 12 | 534 | 260 | 1,169 | 22 | 3,997 | ||
At 31 December | ||||||||||
Developed | 132 | 92 | 893 | 11 | 281 | 118 | 844 | 11 | 2,382 | |
Undeveloped | 75 | 49 | 568 | — | 259 | 88 | 324 | 1 | 1,365 | |
207 | 141 | 1,462 | 11 | 540 | 206 | 1,168 | 13 | 3,747 | ||
238 | bp Annual Report and Form 20-F 2024 |
billion cubic feet | ||||||||||
Natural gasa b | 2023 | |||||||||
Europe | North America | South America | Africa | Asia | Australasia | Total | ||||
UK | Rest of Europe | US | Rest of North America | |||||||
Subsidiaries | ||||||||||
At 1 January | ||||||||||
Developed | 360 | — | 2,655 | — | 1,077 | 1,021 | 2,594 | 1,684 | 9,392 | |
Undeveloped | 41 | — | 3,154 | — | 748 | 221 | 2,125 | 407 | 6,696 | |
401 | — | 5,809 | — | 1,825 | 1,242 | 4,719 | 2,091 | 16,087 | ||
Changes attributable to | ||||||||||
Revisions of previous estimates | (54) | — | 212 | — | 34 | 42 | 563 | 100 | 897 | |
Improved recovery | 9 | — | 254 | — | — | — | — | — | 263 | |
Purchases of reserves-in-place | — | — | 206 | — | — | — | — | — | 206 | |
Discoveries and extensions | — | — | 5 | — | 14 | — | 34 | — | 53 | |
Productionc | (100) | — | (560) | — | (439) | (462) | (594) | (284) | (2,439) | |
Sales of reserves-in-place | — | — | (25) | — | — | (97) | — | — | (123) | |
(146) | — | 92 | — | (391) | (518) | 3 | (184) | (1,143) | ||
At 31 Decemberd | ||||||||||
Developed | 221 | — | 2,672 | — | 931 | 518 | 3,051 | 1,550 | 8,942 | |
Undeveloped | 34 | — | 3,229 | — | 503 | 207 | 1,672 | 358 | 6,003 | |
255 | — | 5,901 | — | 1,434 | 724 | 4,722 | 1,907 | 14,944 | ||
Equity-accounted entities (bp share)e | ||||||||||
At 1 January | ||||||||||
Developed | — | 72 | — | 3 | 974 | 534 | 43 | — | 1,627 | |
Undeveloped | — | 5 | — | 2 | 606 | 154 | — | — | 767 | |
— | 77 | — | 5 | 1,580 | 689 | 43 | — | 2,394 | ||
Changes attributable to | ||||||||||
Revisions of previous estimates | — | 12 | — | — | 8 | 4 | 5 | — | 29 | |
Improved recovery | — | 25 | — | — | 22 | — | — | — | 47 | |
Purchases of reserves-in-place | — | — | — | — | 132 | — | — | — | 132 | |
Discoveries and extensions | — | 85 | — | — | 118 | — | — | — | 203 | |
Productionc | — | (22) | — | — | (128) | (41) | (2) | — | (194) | |
Sales of reserves-in-place | — | — | — | — | (84) | — | — | — | (84) | |
— | 101 | — | (1) | 68 | (38) | 3 | — | 133 | ||
At 31 December | ||||||||||
Developed | — | 67 | — | 4 | 1,027 | 463 | 46 | — | 1,608 | |
Undeveloped | — | 110 | — | — | 621 | 188 | — | — | 919 | |
— | 177 | — | 4 | 1,648 | 651 | 46 | — | 2,527 | ||
Total subsidiaries and equity-accounted entities (bp share) | ||||||||||
At 1 January | ||||||||||
Developed | 360 | 72 | 2,655 | 3 | 2,051 | 1,556 | 2,637 | 1,684 | 11,018 | |
Undeveloped | 41 | 5 | 3,154 | 2 | 1,355 | 375 | 2,125 | 407 | 7,463 | |
401 | 77 | 5,809 | 5 | 3,405 | 1,931 | 4,762 | 2,091 | 18,481 | ||
At 31 December | ||||||||||
Developed | 221 | 67 | 2,672 | 4 | 1,958 | 981 | 3,096 | 1,550 | 10,549 | |
Undeveloped | 34 | 110 | 3,229 | — | 1,125 | 394 | 1,672 | 358 | 6,922 | |
255 | 177 | 5,901 | 4 | 3,082 | 1,375 | 4,768 | 1,907 | 17,471 | ||
bp Annual Report and Form 20-F 2024 | 239 |
Financial statements |
million barrels of oil equivalentc | ||||||||||
Total hydrocarbonsa b | 2023 | |||||||||
Europe | North America | South America | Africa | Asia | Australasia | Total | ||||
UK | Rest of Europe | USf | Rest of North America | |||||||
Subsidiaries | ||||||||||
At 1 January | ||||||||||
Developed | 221 | — | 1,318 | — | 191 | 206 | 1,164 | 311 | 3,411 | |
Undeveloped | 116 | — | 1,306 | — | 134 | 41 | 723 | 72 | 2,392 | |
337 | — | 2,624 | — | 325 | 247 | 1,887 | 382 | 5,802 | ||
Changes attributable to | ||||||||||
Revisions of previous estimates | (42) | — | (37) | — | 5 | 5 | 182 | 12 | 125 | |
Improved recovery | 2 | — | 73 | — | — | — | — | — | 75 | |
Purchases of reserves-in-place | — | — | 61 | — | — | — | — | — | 61 | |
Discoveries and extensions | — | — | 18 | — | 2 | — | 7 | — | 27 | |
Productiond e | (46) | — | (251) | — | (78) | (92) | (210) | (53) | (730) | |
Sales of reserves-in-place | — | — | (9) | — | — | (29) | — | — | (38) | |
(86) | — | (145) | — | (71) | (116) | (21) | (41) | (480) | ||
At 31 Decemberf | ||||||||||
Developed | 170 | — | 1,354 | — | 163 | 95 | 1,255 | 279 | 3,316 | |
Undeveloped | 81 | — | 1,125 | — | 91 | 36 | 611 | 63 | 2,006 | |
251 | — | 2,479 | — | 255 | 131 | 1,866 | 341 | 5,323 | ||
Equity-accounted entities (bp share)g | ||||||||||
At 1 January | ||||||||||
Developed | — | 106 | — | 6 | 446 | 236 | 102 | — | 896 | |
Undeveloped | — | 17 | — | 7 | 349 | 110 | 1 | — | 485 | |
— | 123 | — | 13 | 796 | 346 | 103 | — | 1,381 | ||
Changes attributable to | ||||||||||
Revisions of previous estimates | — | 8 | — | — | 9 | 5 | 44 | — | 66 | |
Improved recovery | — | 26 | — | — | 7 | — | — | — | 34 | |
Purchases of reserves-in-place | — | — | — | — | — | 23 | — | — | 23 | |
Discoveries and extensions | — | 41 | — | — | 39 | — | — | — | 80 | |
Productione | — | (27) | — | (1) | (42) | (38) | (23) | — | (131) | |
Sales of reserves-in-place | — | — | — | — | (15) | — | — | — | (15) | |
— | 48 | — | (1) | (2) | (11) | 21 | — | 56 | ||
At 31 December | ||||||||||
Developed | — | 103 | — | 12 | 455 | 192 | 123 | — | 885 | |
Undeveloped | — | 68 | — | — | 361 | 120 | 2 | — | 552 | |
— | 172 | — | 12 | 816 | 313 | 124 | — | 1,437 | ||
Total subsidiaries and equity-accounted entities (bp share) | ||||||||||
At 1 January | ||||||||||
Developed | 221 | 106 | 1,318 | 6 | 637 | 442 | 1,266 | 311 | 4,307 | |
Undeveloped | 116 | 17 | 1,306 | 7 | 484 | 151 | 724 | 72 | 2,877 | |
337 | 123 | 2,624 | 13 | 1,121 | 593 | 1,990 | 382 | 7,183 | ||
At 31 December | ||||||||||
Developed | 170 | 103 | 1,354 | 12 | 618 | 287 | 1,378 | 279 | 4,201 | |
Undeveloped | 81 | 68 | 1,125 | — | 453 | 156 | 613 | 63 | 2,558 | |
251 | 172 | 2,479 | 12 | 1,071 | 444 | 1,991 | 341 | 6,759 | ||
240 | bp Annual Report and Form 20-F 2024 |
million barrels | |||||||||||
Crude oila b | 2022 | ||||||||||
Europe | North America | South America | Africac | Asia | Australasia | Total | |||||
UK | Rest of Europe | US | Rest of North America | Russia | Rest of Asia | ||||||
Subsidiaries | |||||||||||
At 1 January | |||||||||||
Developed | 178 | — | 705 | 24 | 5 | 117 | — | 930 | 28 | 1,987 | |
Undeveloped | 101 | — | 601 | 167 | 7 | 14 | — | 449 | 4 | 1,343 | |
279 | — | 1,306 | 191 | 12 | 131 | — | 1,379 | 33 | 3,330 | ||
Changes attributable to | |||||||||||
Revisions of previous estimates | 9 | — | (11) | — | (1) | 1 | — | (40) | (4) | (47) | |
Improved recovery | 2 | — | (2) | — | — | 4 | — | — | — | 5 | |
Purchases of reserves-in-place | — | — | — | — | — | — | — | 3 | — | 3 | |
Discoveries and extensions | — | — | 22 | — | — | 1 | — | — | — | 23 | |
Production | (29) | — | (108) | (5) | (2) | (31) | — | (112) | (5) | (292) | |
Sales of reserves-in-place | — | — | (1) | (185) | — | (80) | — | (157) | (3) | (426) | |
(18) | — | (100) | (191) | (3) | (105) | — | (306) | (11) | (734) | ||
At 31 Decemberc | |||||||||||
Developed | 153 | — | 679 | — | 4 | 24 | — | 717 | 20 | 1,596 | |
Undeveloped | 109 | — | 527 | — | 5 | 2 | — | 356 | 1 | 1,000 | |
261 | — | 1,206 | — | 9 | 26 | — | 1,073 | 21 | 2,596 | ||
Equity-accounted entities (bp share)d | |||||||||||
At 1 January | |||||||||||
Developed | — | 100 | — | 10 | 275 | 3 | 3,045 | 1 | — | 3,434 | |
Undeveloped | — | 21 | — | 12 | 253 | — | 2,540 | 1 | — | 2,826 | |
— | 121 | — | 22 | 527 | 3 | 5,585 | 1 | — | 6,260 | ||
Changes attributable to | |||||||||||
Revisions of previous estimates | — | (17) | — | 1 | (1) | 23 | 4 | (46) | — | (37) | |
Improved recovery | — | 1 | — | — | 14 | 25 | — | — | — | 40 | |
Purchases of reserves-in-place | — | 42 | — | — | — | 165 | — | 152 | — | 359 | |
Discoveries and extensions | — | 2 | — | — | — | — | — | — | — | 2 | |
Production | — | (17) | — | (1) | (21) | (12) | (55) | (9) | — | (115) | |
Sales of reserves-in-placef | — | (25) | — | (10) | — | (3) | (5,535) | (1) | — | (5,574) | |
— | (15) | — | (10) | (8) | 198 | (5,585) | 95 | — | (5,325) | ||
At 31 December | |||||||||||
Developed | — | 90 | — | 5 | 276 | 127 | — | 95 | — | 592 | |
Undeveloped | — | 16 | — | 7 | 244 | 74 | — | 1 | — | 342 | |
— | 106 | — | 12 | 520 | 201 | — | 96 | — | 935 | ||
Total subsidiaries and equity-accounted entities (bp share) | |||||||||||
At 1 January | |||||||||||
Developed | 178 | 100 | 705 | 34 | 280 | 119 | 3,045 | 931 | 28 | 5,421 | |
Undeveloped | 101 | 21 | 601 | 179 | 259 | 14 | 2,540 | 450 | 4 | 4,169 | |
279 | 121 | 1,306 | 213 | 539 | 134 | 5,585 | 1,381 | 33 | 9,590 | ||
At 31 December | |||||||||||
Developed | 153 | 90 | 679 | 5 | 279 | 151 | — | 812 | 20 | 2,188 | |
Undeveloped | 109 | 16 | 527 | 7 | 249 | 76 | — | 358 | 1 | 1,343 | |
261 | 106 | 1,206 | 12 | 529 | 227 | — | 1,169 | 21 | 3,531 | ||
bp Annual Report and Form 20-F 2024 | 241 |
Financial statements |
million barrels | |||||||||||
Natural gas liquidsa b | 2022 | ||||||||||
Europe | North America | South America | Africac | Asia | Australasia | Total | |||||
UK | Rest of Europe | USd | Rest of North America | Russia | Rest of Asia | ||||||
Subsidiaries | |||||||||||
At 1 January | |||||||||||
Developed | 8 | — | 132 | — | 2 | 9 | — | — | 2 | 153 | |
Undeveloped | — | — | 195 | — | 19 | 1 | — | — | — | 215 | |
9 | — | 328 | — | 21 | 10 | — | — | 2 | 368 | ||
Changes attributable to | |||||||||||
Revisions of previous estimates | (1) | — | 101 | — | (18) | (1) | — | — | — | 81 | |
Improved recovery | — | — | 16 | — | — | 1 | — | — | — | 17 | |
Purchases of reserves-in-place | — | — | — | — | — | — | — | — | — | — | |
Discoveries and extensions | — | — | 1 | — | — | 1 | — | — | — | 2 | |
Productiond | (2) | — | (28) | — | (2) | (2) | — | — | (1) | (34) | |
Sales of reserves-in-place | — | — | (1) | — | — | (1) | — | — | — | (1) | |
(2) | — | 90 | — | (19) | (2) | — | — | (1) | 64 | ||
At 31 Decembere | |||||||||||
Developed | 6 | — | 181 | — | 1 | 6 | — | — | 1 | 196 | |
Undeveloped | — | — | 236 | — | — | 1 | — | — | — | 237 | |
6 | — | 417 | — | 1 | 7 | — | — | 1 | 432 | ||
Equity-accounted entities (bp share)f | |||||||||||
At 1 January | |||||||||||
Developed | — | 6 | — | — | 2 | 17 | 100 | — | — | 125 | |
Undeveloped | — | — | — | — | — | — | 41 | — | — | 41 | |
— | 6 | — | — | 2 | 17 | 140 | — | — | 166 | ||
Changes attributable to | |||||||||||
Revisions of previous estimates | — | (1) | — | — | 2 | 7 | — | — | — | 8 | |
Improved recovery | — | — | — | — | — | — | — | — | — | — | |
Purchases of reserves-in-place | — | 2 | — | — | — | 20 | — | — | — | 21 | |
Discoveries and extensions | — | — | — | — | — | — | — | — | — | — | |
Production | — | (1) | — | — | — | (1) | — | — | — | (2) | |
Sales of reserves-in-placeg | — | (2) | — | — | — | (17) | (140) | — | — | (159) | |
— | (2) | — | — | 2 | 9 | (140) | — | — | (132) | ||
At 31 December | |||||||||||
Developed | — | 4 | — | — | 3 | 17 | — | — | — | 23 | |
Undeveloped | — | — | — | — | 1 | 9 | — | — | — | 10 | |
— | 4 | — | — | 4 | 26 | — | — | — | 34 | ||
Total subsidiaries and equity-accounted entities (bp share) | |||||||||||
At 1 January | |||||||||||
Developed | 8 | 6 | 132 | — | 4 | 26 | 100 | — | 2 | 278 | |
Undeveloped | — | — | 195 | — | 19 | 1 | 41 | — | — | 256 | |
9 | 6 | 328 | — | 22 | 27 | 140 | — | 2 | 534 | ||
At 31 December | |||||||||||
Developed | 6 | 4 | 181 | — | 4 | 23 | — | — | 1 | 219 | |
Undeveloped | — | — | 236 | — | 1 | 10 | — | — | — | 247 | |
6 | 4 | 417 | — | 5 | 33 | — | — | 1 | 466 | ||
242 | bp Annual Report and Form 20-F 2024 |
million barrels | |||||||||||
Total liquidsa b | 2022 | ||||||||||
Europe | North America | South America | Africac | Asia | Australasia | Total | |||||
UK | Rest of Europe | USd | Rest of North America | Russia | Rest of Asia | ||||||
Subsidiaries | |||||||||||
At 1 January | |||||||||||
Developed | 187 | — | 837 | 24 | 7 | 125 | — | 930 | 30 | 2,141 | |
Undeveloped | 101 | — | 796 | 167 | 25 | 15 | — | 449 | 4 | 1,558 | |
288 | — | 1,634 | 191 | 32 | 140 | — | 1,379 | 34 | 3,699 | ||
Changes attributable to | |||||||||||
Revisions of previous estimates | 8 | — | 89 | — | (19) | — | — | (40) | (4) | 34 | |
Improved recovery | 2 | — | 14 | — | — | 5 | — | — | — | 22 | |
Purchases of reserves-in-place | 1 | — | — | — | — | — | — | 3 | — | 3 | |
Discoveries and extensions | — | — | 23 | — | — | 1 | — | — | — | 25 | |
Productiond | (31) | — | (136) | (5) | (3) | (34) | — | (112) | (5) | (326) | |
Sales of reserves-in-place | — | — | (2) | (185) | (80) | — | (157) | (4) | (428) | ||
(20) | — | (11) | (191) | (22) | (107) | — | (306) | (13) | (670) | ||
At 31 Decembere | |||||||||||
Developed | 159 | — | 860 | — | 5 | 30 | — | 717 | 20 | 1,791 | |
Undeveloped | 109 | — | 763 | — | 5 | 3 | — | 356 | 1 | 1,237 | |
267 | — | 1,623 | — | 11 | 33 | — | 1,073 | 22 | 3,029 | ||
Equity-accounted entities (bp share)f | |||||||||||
At 1 January | |||||||||||
Developed | — | 106 | — | 10 | 276 | 20 | 3,145 | 1 | — | 3,558 | |
Undeveloped | — | 21 | — | 12 | 253 | — | 2,581 | 1 | — | 2,867 | |
— | 127 | — | 22 | 529 | 20 | 5,726 | 1 | — | 6,425 | ||
Changes attributable to | |||||||||||
Revisions of previous estimates | — | (18) | — | 1 | 1 | 30 | 4 | (46) | — | (29) | |
Improved recovery | — | 1 | — | — | 14 | 25 | — | — | — | 40 | |
Purchases of reserves-in-place | — | 44 | — | — | — | 185 | — | 152 | — | 380 | |
Discoveries and extensions | — | 2 | — | — | — | — | — | — | — | 2 | |
Production | — | (18) | — | (1) | (21) | (13) | (55) | (9) | — | (117) | |
Sales of reserves-in-place | — | (27) | — | (10) | — | (19) | (5,675) | (1) | — | (5,733) | |
— | (17) | — | (10) | (6) | 207 | (5,726) | 95 | — | (5,457) | ||
At 31 December | |||||||||||
Developed | — | 94 | — | 5 | 278 | 144 | — | 95 | — | 616 | |
Undeveloped | — | 16 | — | 7 | 245 | 83 | — | 1 | — | 352 | |
— | 110 | — | 12 | 523 | 227 | — | 96 | — | 968 | ||
Total subsidiaries and equity-accounted entities (bp share) | |||||||||||
At 1 January | |||||||||||
Developed | 187 | 106 | 837 | 34 | 284 | 146 | 3,145 | 931 | 30 | 5,699 | |
Undeveloped | 101 | 21 | 796 | 179 | 278 | 15 | 2,581 | 450 | 4 | 4,425 | |
288 | 127 | 1,634 | 213 | 561 | 161 | 5,726 | 1,381 | 34 | 10,124 | ||
At 31 December | |||||||||||
Developed | 159 | 94 | 860 | 5 | 283 | 174 | — | 812 | 20 | 2,407 | |
Undeveloped | 109 | 16 | 763 | 7 | 250 | 86 | — | 358 | 1 | 1,590 | |
267 | 110 | 1,623 | 12 | 534 | 260 | — | 1,169 | 22 | 3,997 | ||
bp Annual Report and Form 20-F 2024 | 243 |
Financial statements |
billion cubic feet | |||||||||||
Natural gasa b | 2022 | ||||||||||
Europe | North America | South America | Africac | Asia | Australasia | Total | |||||
UK | Rest of Europe | US | Rest of North America | Russia | Rest of Asia | ||||||
Subsidiaries | |||||||||||
At 1 January | |||||||||||
Developed | 455 | — | 2,401 | — | 1,152 | 1,433 | — | 3,266 | 1,584 | 10,291 | |
Undeveloped | 45 | — | 3,404 | — | 1,147 | 154 | — | 2,522 | 939 | 8,211 | |
501 | — | 5,805 | — | 2,299 | 1,587 | — | 5,788 | 2,523 | 18,502 | ||
Changes attributable to | |||||||||||
Revisions of previous estimates | 6 | — | 449 | — | 2 | 180 | — | (575) | (165) | (102) | |
Improved recovery | 1 | — | 46 | — | — | — | — | — | — | 47 | |
Purchases of reserves-in-place | 2 | — | — | — | — | — | — | 92 | — | 94 | |
Discoveries and extensions | — | — | 10 | — | — | 87 | — | 21 | 10 | 128 | |
Productiond | (109) | — | (493) | — | (476) | (517) | — | (561) | (276) | (2,432) | |
Sales of reserves-in-place | — | — | (9) | — | — | (93) | — | (47) | — | (149) | |
(100) | — | 4 | — | (474) | (344) | — | (1,069) | (431) | (2,414) | ||
At 31 Decembere | |||||||||||
Developed | 360 | — | 2,655 | — | 1,077 | 1,021 | — | 2,594 | 1,684 | 9,392 | |
Undeveloped | 41 | — | 3,154 | — | 748 | 221 | — | 2,125 | 407 | 6,696 | |
401 | — | 5,809 | — | 1,825 | 1,242 | — | 4,719 | 2,091 | 16,087 | ||
Equity-accounted entities (bp share)f | |||||||||||
At 1 January | |||||||||||
Developed | — | 130 | — | 4 | 929 | 689 | 11,399 | — | — | 13,149 | |
Undeveloped | — | 11 | — | 4 | 536 | 133 | 7,279 | — | — | 7,964 | |
— | 140 | — | 8 | 1,465 | 822 | 18,678 | — | — | 21,113 | ||
Changes attributable to | |||||||||||
Revisions of previous estimates | — | (7) | — | 1 | 162 | 131 | 53 | — | — | 340 | |
Improved recovery | — | — | — | — | 82 | — | — | — | — | 82 | |
Purchases of reserves-in-place | — | 14 | — | — | — | 575 | — | 45 | — | 634 | |
Discoveries and extensions | — | 4 | — | — | — | — | — | — | — | 4 | |
Productiond | — | (25) | — | — | (128) | (36) | (86) | (2) | — | (277) | |
Sales of reserves-in-placeg | — | (49) | — | (4) | — | (803) | (18,645) | — | — | (19,501) | |
— | (64) | — | (3) | 115 | (133) | (18,678) | 43 | — | (18,719) | ||
At 31 December | |||||||||||
Developed | — | 72 | — | 3 | 974 | 534 | — | 43 | — | 1,627 | |
Undeveloped | — | 5 | — | 2 | 606 | 154 | — | — | — | 767 | |
— | 77 | — | 5 | 1,580 | 689 | — | 43 | — | 2,394 | ||
Total subsidiaries and equity-accounted entities (bp share) | |||||||||||
At 1 January | |||||||||||
Developed | 455 | 130 | 2,401 | 4 | 2,081 | 2,121 | 11,399 | 3,266 | 1,584 | 23,440 | |
Undeveloped | 45 | 11 | 3,404 | 4 | 1,683 | 287 | 7,279 | 2,522 | 939 | 16,174 | |
501 | 140 | 5,805 | 8 | 3,764 | 2,408 | 18,678 | 5,788 | 2,523 | 39,615 | ||
At 31 December | |||||||||||
Developed | 360 | 72 | 2,655 | 3 | 2,051 | 1,556 | — | 2,637 | 1,684 | 11,018 | |
Undeveloped | 41 | 5 | 3,154 | 2 | 1,355 | 375 | — | 2,125 | 407 | 7,463 | |
401 | 77 | 5,809 | 5 | 3,405 | 1,931 | — | 4,762 | 2,091 | 18,481 | ||
244 | bp Annual Report and Form 20-F 2024 |
million barrels of oil equivalentc | |||||||||||
Total hydrocarbonsa b | 2022 | ||||||||||
Europe | North America | South America | Africad | Asia | Australasia | Total | |||||
UK | Rest of Europe | USe | Rest of North America | Russia | Rest of Asia | ||||||
Subsidiaries | |||||||||||
At 1 January | |||||||||||
Developed | 265 | — | 1,251 | 24 | 206 | 372 | — | 1,494 | 303 | 3,915 | |
Undeveloped | 109 | — | 1,383 | 167 | 223 | 41 | — | 884 | 166 | 2,973 | |
374 | — | 2,634 | 191 | 429 | 414 | — | 2,377 | 469 | 6,889 | ||
Changes attributable to | |||||||||||
Revisions of previous estimates | 9 | — | 167 | — | (18) | 31 | — | (139) | (33) | 17 | |
Improved recovery | 2 | — | 22 | — | — | 5 | — | — | — | 30 | |
Purchases of reserves-in-place | 1 | — | — | — | — | — | — | 18 | — | 19 | |
Discoveries and extensions | — | — | 25 | — | — | 16 | — | 4 | 2 | 47 | |
Productionf g | (50) | — | (221) | (5) | (85) | (123) | — | (209) | (53) | (746) | |
Sales of reserves-in-place | — | — | (3) | (185) | — | (96) | — | (165) | (4) | (453) | |
(37) | — | (10) | (191) | (103) | (167) | — | (491) | (87) | (1,086) | ||
At 31 Decembere | |||||||||||
Developed | 221 | — | 1,318 | — | 191 | 206 | — | 1,164 | 311 | 3,411 | |
Undeveloped | 116 | — | 1,306 | — | 134 | 41 | — | 723 | 72 | 2,392 | |
337 | — | 2,624 | — | 325 | 247 | — | 1,887 | 382 | 5,802 | ||
Equity-accounted entities (bp share)h | |||||||||||
At 1 January | |||||||||||
Developed | — | 128 | — | 11 | 437 | 139 | 5,110 | 1 | — | 5,825 | |
Undeveloped | — | 23 | — | 12 | 345 | 23 | 3,836 | 1 | — | 4,240 | |
— | 151 | — | 23 | 782 | 162 | 8,946 | 1 | — | 10,065 | ||
Changes attributable to | |||||||||||
Revisions of previous estimates | — | (19) | — | 1 | 29 | 53 | 13 | (46) | — | 30 | |
Improved recovery | — | 1 | — | — | 28 | 25 | — | — | — | 54 | |
Purchases of reserves-in-place | — | 46 | — | — | — | 284 | — | 159 | — | 489 | |
Discoveries and extensions | — | 2 | — | — | — | — | — | — | — | 2 | |
Productiong | — | (22) | — | (1) | (43) | (19) | (70) | (10) | — | (165) | |
Sales of reserves-in-placei | — | (36) | — | (10) | — | (158) | (8,890) | (1) | — | (9,095) | |
— | (28) | — | (11) | 14 | 184 | (8,946) | 102 | — | (8,685) | ||
At 31 December | |||||||||||
Developed | — | 106 | — | 6 | 446 | 236 | — | 102 | — | 896 | |
Undeveloped | — | 17 | — | 7 | 349 | 110 | — | 1 | — | 485 | |
— | 123 | — | 13 | 796 | 346 | — | 103 | — | 1,381 | ||
Total subsidiaries and equity-accounted entities (bp share) | |||||||||||
At 1 January | |||||||||||
Developed | 265 | 128 | 1,251 | 35 | 642 | 511 | 5,110 | 1,494 | 303 | 9,740 | |
Undeveloped | 109 | 23 | 1,383 | 179 | 568 | 65 | 3,836 | 884 | 166 | 7,214 | |
374 | 151 | 2,634 | 214 | 1,210 | 576 | 8,946 | 2,379 | 469 | 16,954 | ||
At 31 December | |||||||||||
Developed | 221 | 106 | 1,318 | 6 | 637 | 442 | — | 1,266 | 311 | 4,307 | |
Undeveloped | 116 | 17 | 1,306 | 7 | 484 | 151 | — | 724 | 72 | 2,877 | |
337 | 123 | 2,624 | 13 | 1,121 | 593 | — | 1,990 | 382 | 7,183 | ||
bp Annual Report and Form 20-F 2024 | 245 |
Financial statements |
$ million | ||||||||||
2024 | ||||||||||
Europe | North America | South America | Africa Asia | Australasia | Total | |||||
UK | Rest of Europe | US | Rest of North America | |||||||
At 31 December | ||||||||||
Subsidiaries | ||||||||||
Future cash inflowsa | 15,100 | — | 99,300 | — | 3,700 | 600 | 107,300 | 15,200 | 241,200 | |
Future production costb | 11,800 | — | 39,100 | — | 2,900 | 100 | 37,800 | 3,900 | 95,600 | |
Future development costb | 1,000 | — | 15,300 | — | 500 | 100 | 11,200 | 2,100 | 30,200 | |
Future taxationc | 2,200 | — | 7,100 | — | 100 | 100 | 42,800 | 2,400 | 54,700 | |
Future net cash flows | 100 | — | 37,800 | — | 200 | 300 | 15,500 | 6,800 | 60,700 | |
10% annual discountd | 100 | — | 15,400 | — | (300) | — | 4,900 | 2,200 | 22,300 | |
Standardized measure of discounted future net cash flowse | — | — | 22,400 | — | 500 | 300 | 10,600 | 4,600 | 38,400 | |
Equity-accounted entities (bp share)f | ||||||||||
Future cash inflowsa | — | 11,700 | — | — | 41,600 | 15,100 | 8,400 | — | 76,800 | |
Future production costb | — | 4,100 | — | — | 20,900 | 5,400 | 4,200 | — | 34,600 | |
Future development costb | — | 2,000 | — | — | 4,100 | 2,200 | 2,900 | — | 11,200 | |
Future taxationc | — | 4,300 | — | — | 4,600 | 2,200 | 400 | — | 11,500 | |
Future net cash flows | — | 1,300 | — | — | 12,000 | 5,300 | 900 | — | 19,500 | |
10% annual discountd | — | 300 | — | — | 7,000 | 1,400 | 200 | — | 8,900 | |
Standardized measure of discounted future net cash flows | — | 1,000 | — | — | 5,000 | 3,900 | 700 | — | 10,600 | |
Total subsidiaries and equity-accounted entities | ||||||||||
Standardized measure of discounted future net cash flows | — | 1,000 | 22,400 | — | 5,500 | 4,200 | 11,300 | 4,600 | 49,000 | |
$ million | ||||
Subsidiaries | Equity-accounted entities (bp share) | Total subsidiaries and equity-accounted entities | ||
Sales and transfers of oil and gas produced, net of production costs | (25,700) | (5,300) | (31,000) | |
Development costs for the current year as estimated in previous year | 5,100 | 2,900 | 8,000 | |
Extensions, discoveries and improved recovery, less related costs | 400 | 300 | 700 | |
Net changes in prices and production cost | (7,300) | (1,800) | (9,100) | |
Revisions of previous reserves estimates | 2,500 | 300 | 2,800 | |
Net change in taxation | 11,200 | 2,100 | 13,300 | |
Future development costs | (1,400) | (600) | (2,000) | |
Net change in purchase and sales of reserves-in-place | (1,400) | 800 | (600) | |
Addition of 10% annual discount | 5,000 | 1,100 | 6,100 | |
Total change in the standardized measure during the yearg | (11,600) | (200) | (11,800) |
246 | bp Annual Report and Form 20-F 2024 |
$ million | ||||||||||
2023 | ||||||||||
Europe | North America | South America | Africa | Asia | Australasia | Total | ||||
UK | Rest of Europe | US | Rest of North America | |||||||
At 31 December | ||||||||||
Subsidiaries | ||||||||||
Future cash inflowsa | 19,400 | — | 100,200 | — | 6,800 | 4,400 | 118,300 | 18,000 | 267,100 | |
Future production costb | 11,900 | — | 37,500 | — | 4,300 | 600 | 39,600 | 4,500 | 98,400 | |
Future development costb | 1,200 | — | 12,100 | — | 1,000 | 500 | 8,500 | 1,400 | 24,700 | |
Future taxationc | 4,100 | — | 8,400 | — | 500 | 1,100 | 49,900 | 3,800 | 67,800 | |
Future net cash flows | 2,200 | — | 42,200 | — | 1,000 | 2,200 | 20,300 | 8,300 | 76,200 | |
10% annual discountd | 900 | — | 16,300 | — | (300) | 400 | 6,300 | 2,600 | 26,200 | |
Standardized measure of discounted future net cash flowse | 1,300 | — | 25,900 | — | 1,300 | 1,800 | 14,000 | 5,700 | 50,000 | |
Equity-accounted entities (bp share)f | ||||||||||
Future cash inflowsa | — | 13,700 | — | — | 44,600 | 15,200 | 9,000 | — | 82,500 | |
Future production costb | — | 3,700 | — | — | 20,700 | 5,500 | 4,700 | — | 34,600 | |
Future development costb | — | 2,100 | — | — | 5,200 | 2,300 | 3,100 | — | 12,700 | |
Future taxationc | — | 6,000 | — | — | 5,900 | 2,100 | 400 | — | 14,400 | |
Future net cash flows | — | 1,900 | — | — | 12,800 | 5,300 | 800 | — | 20,800 | |
10% annual discountd | — | 500 | — | — | 7,600 | 1,700 | 200 | — | 10,000 | |
Standardized measure of discounted future net cash flows | — | 1,400 | — | — | 5,200 | 3,600 | 600 | — | 10,800 | |
Total subsidiaries and equity-accounted entities | ||||||||||
Standardized measure of discounted future net cash flows | 1,300 | 1,400 | 25,900 | — | 6,500 | 5,400 | 14,600 | 5,700 | 60,800 | |
$ million | ||||
Subsidiaries | Equity-accounted entities (bp share) | Total subsidiaries and equity-accounted entities | ||
Sales and transfers of oil and gas produced, net of production costs | (36,500) | (6,500) | (43,000) | |
Development costs for the current year as estimated in previous year | 6,000 | 2,200 | 8,200 | |
Extensions, discoveries and improved recovery, less related costs | 500 | 800 | 1,300 | |
Net changes in prices and production cost | (50,800) | (7,100) | (57,900) | |
Revisions of previous reserves estimates | 2,500 | 1,300 | 3,800 | |
Net change in taxation | 30,000 | 5,100 | 35,100 | |
Future development costs | (1,000) | (300) | (1,300) | |
Net change in purchase and sales of reserves-in-place | (800) | — | (800) | |
Addition of 10% annual discount | 9,100 | 1,400 | 10,500 | |
Total change in the standardized measure during the yearg | (41,000) | (3,100) | (44,100) |
bp Annual Report and Form 20-F 2024 | 247 |
Financial statements |
$ million | |||||||||||
2022 | |||||||||||
Europe | North America | South America | Africa | Asia | Australasia | Total | |||||
UK | Rest of Europe | US | Rest of North America | Russia | Rest of Asia | ||||||
At 31 December | |||||||||||
Subsidiaries | |||||||||||
Future cash inflowsa | 34,900 | — | 154,500 | — | 16,400 | 9,400 | — | 151,500 | 23,600 | 390,300 | |
Future production costb | 13,600 | — | 36,000 | — | 5,300 | 1,300 | — | 42,700 | 5,200 | 104,100 | |
Future development costb | 1,100 | — | 12,200 | — | 1,400 | 700 | — | 8,800 | 1,900 | 26,100 | |
Future taxationc | 12,600 | — | 19,800 | — | 5,000 | 1,900 | — | 65,200 | 5,500 | 110,000 | |
Future net cash flows | 7,600 | — | 86,500 | — | 4,700 | 5,500 | — | 34,800 | 11,000 | 150,100 | |
10% annual discountd | 3,400 | — | 38,200 | — | 700 | 1,000 | — | 11,800 | 4,000 | 59,100 | |
Standardized measure of discounted future net cash flowse | 4,200 | — | 48,300 | — | 4,000 | 4,500 | — | 23,000 | 7,000 | 91,000 | |
Equity-accounted entities (bp share)f | |||||||||||
Future cash inflowsa | — | 12,800 | — | — | 49,800 | 20,500 | — | 9,200 | — | 92,300 | |
Future production costb | — | 2,100 | — | — | 22,000 | 6,300 | — | 4,900 | — | 35,300 | |
Future development costb | — | 400 | — | — | 4,900 | 2,800 | — | 3,000 | — | 11,100 | |
Future taxationc | — | 8,100 | — | — | 7,100 | 4,300 | — | 400 | — | 19,900 | |
Future net cash flows | — | 2,200 | — | — | 15,800 | 7,100 | — | 900 | — | 26,000 | |
10% annual discountd | — | 400 | — | — | 9,300 | 2,200 | — | 200 | — | 12,100 | |
Standardized measure of discounted future net cash flowsg | — | 1,800 | — | — | 6,500 | 4,900 | — | 700 | — | 13,900 | |
Total subsidiaries and equity-accounted entities | |||||||||||
Standardized measure of discounted future net cash flowsh | 4,200 | 1,800 | 48,300 | — | 10,500 | 9,400 | — | 23,700 | 7,000 | 104,900 | |
$ million | ||||
Subsidiaries | Equity-accounted entities (bp share) | Total subsidiaries and equity-accounted entities | ||
Sales and transfers of oil and gas produced, net of production costs | (22,800) | (4,600) | (27,400) | |
Development costs for the current year as estimated in previous year | 5,500 | 1,800 | 7,300 | |
Extensions, discoveries and improved recovery, less related costs | 1,600 | 900 | 2,500 | |
Net changes in prices and production cost | 80,800 | 11,100 | 91,900 | |
Revisions of previous reserves estimates | (18,300) | (2,700) | (21,000) | |
Net change in taxation | (23,000) | 1,400 | (21,600) | |
Future development costs | (2,100) | (800) | (2,900) | |
Net change in purchase and sales of reserves-in-place | (4,300) | (34,800) | (39,100) | |
Addition of 10% annual discount | 6,700 | 3,800 | 10,500 | |
Total change in the standardized measure during the yeari | 24,100 | (23,900) | 200 |
248 | bp Annual Report and Form 20-F 2024 |
Europe | North America | South America | Africa | Asia | Australasia | Total | |||||
UK | Rest of Europe | US | Rest of North America | Russiac | Rest of Asia | ||||||
Subsidiariesd | |||||||||||
Crude oile | thousand barrels per day | ||||||||||
2024 | 70 | — | 376 | — | 4 | 19 | — | 297 | 9 | 775 | |
2023 | 74 | — | 335 | — | 4 | 29 | — | 293 | 10 | 745 | |
2022 | 80 | — | 296 | 15 | 5 | 83 | — | 307 | 12 | 797 | |
Natural gas liquids | thousand barrels per day | ||||||||||
2024 | 4 | — | 107 | — | 4 | 1 | — | — | 2 | 117 | |
2023 | 5 | — | 88 | — | 4 | 2 | — | — | 2 | 100 | |
2022 | 5 | — | 76 | — | 4 | 6 | — | — | 2 | 93 | |
Natural gasf | million cubic feet per day | ||||||||||
2024 | 197 | — | 1,690 | — | 1,145 | 904 | — | 1,655 | 882 | 6,474 | |
2023 | 247 | — | 1,486 | — | 1,191 | 1,236 | — | 1,578 | 774 | 6,512 | |
2022 | 271 | — | 1,291 | — | 1,276 | 1,353 | — | 1,485 | 752 | 6,428 | |
Equity-accounted entities (bp share) | |||||||||||
Crude oile | thousand barrels per day | ||||||||||
2024 | — | 58 | — | — | 56 | 82 | — | 69 | — | 266 | |
2023 | — | 60 | — | — | 57 | 82 | — | 62 | — | 261 | |
2022 | — | 47 | — | — | 59 | 33 | 150 | 25 | — | 314 | |
Natural gas liquids | thousand barrels per day | ||||||||||
2024 | — | 2 | — | — | 1 | 6 | — | — | — | 9 | |
2023 | — | 3 | — | — | 1 | 6 | — | — | — | 9 | |
2022 | — | 2 | — | — | 1 | 5 | — | — | — | 9 | |
Natural gasf | million cubic feet per day | ||||||||||
2024 | — | 55 | — | — | 300 | 85 | — | — | — | 440 | |
2023 | — | 58 | — | — | 299 | 74 | — | — | — | 432 | |
2022 | — | 66 | — | — | 296 | 64 | 248 | — | — | 674 | |
bp Annual Report and Form 20-F 2024 | 249 |
Financial statements |
Europe | North America | South America | Africa Asiae | Australasiae | Totala | ||||||
UK | Rest of Europe | US | Rest of North America | ||||||||
Number of productive wells at 31 December 2024 | |||||||||||
Oil wellsb | – gross | 115 | 126 | 1,439 | 8 | 4,823 | 825 | 2,848 | — | 10,184 | |
– net | 67 | 20 | 751 | 2 | 2,368 | 77 | 625 | — | 3,911 | ||
Gas wellsc | – gross | 36 | 10 | 3,607 | — | 1,209 | 89 | 185 | 89 | 5,225 | |
– net | 8 | 2 | 1,819 | — | 392 | 37 | 70 | 21 | 2,348 | ||
Oil and natural gas acreage at 31 December 2024 | thousands of acres | ||||||||||
Developed | – gross | 70 | 87 | 1,565 | 8 | 1,319 | 618 | 1,343 | 838 | 5,847 | |
– net | 40 | 14 | 977 | 2 | 375 | 122 | 281 | 157 | 1,967 | ||
Undevelopedd | – gross | 479 | 1,794 | 3,916 | 9,663 | 10,976 | 20,256 | 9,877 | 4,858 | 61,818 | |
– net | 368 | 285 | 3,376 | 6,298 | 5,223 | 8,276 | 5,585 | 2,826 | 32,236 | ||
Europe | North America | South America | Africa | Asia | Australasia | Totala | |||||
UK | Rest of Europe | US | Rest of North America | Russia | Rest of Asia | ||||||
2024 | |||||||||||
Exploratory | |||||||||||
Productive | — | — | 0.7 | — | 0.5 | 0.4 | — | 0.7 | — | 2.3 | |
Dry | — | — | 1.0 | 0.8 | 0.5 | — | — | 0.5 | — | 2.8 | |
Development | |||||||||||
Productive | 1.5 | 0.5 | 149.0 | — | 69.3 | 2.5 | — | 55.1 | — | 277.8 | |
Dry | — | — | 15.0 | — | — | 1.1 | — | 0.5 | — | 16.6 | |
2023 | |||||||||||
Exploratory | |||||||||||
Productive | — | — | 2.0 | — | — | — | — | 0.8 | 0.4 | 3.2 | |
Dry | 0.5 | — | 0.8 | 0.5 | — | — | — | 0.2 | — | 2.0 | |
Development | |||||||||||
Productiveb | 2.6 | 0.6 | 141.9 | 0.1 | 85.2 | 4.2 | — | 39.7 | 0.4 | 274.7 | |
Dry | — | — | — | — | — | — | — | 0.4 | — | 0.4 | |
2022 | |||||||||||
Exploratory | |||||||||||
Productive | — | — | 0.5 | 1.0 | 1.0 | 0.6 | — | 0.5 | 0.3 | 4.0 | |
Dry | — | — | — | 1.2 | 0.3 | 0.1 | — | 0.8 | — | 2.3 | |
Development | |||||||||||
Productive | 0.9 | 1.5 | 137.2 | 0.3 | 71.4 | 2.8 | — | 39.0 | 1.4 | 254.5 | |
Dry | — | — | 1.1 | — | 0.5 | 0.1 | — | 1.1 | — | 2.8 | |
250 | bp Annual Report and Form 20-F 2024 |
Europe | North America | South America | Africa Asia | Australasia | Totala | |||||
UK | Rest of Europe | US | Rest of North America | |||||||
At 31 December 2024 | ||||||||||
Exploratory | ||||||||||
Gross | — | — | 2.0 | — | 3.0 | 2.0 | 4.0 | — | 11.0 | |
Net | — | — | 0.9 | — | 1.9 | 0.6 | 1.0 | — | 4.4 | |
Development | ||||||||||
Gross | 7.0 | 2.1 | 56.0 | — | 29.0 | 9.0 | 90.0 | — | 193.1 | |
Net | 3.7 | 0.3 | 36.4 | — | 10.9 | 4.4 | 20.5 | — | 76.1 | |
bp Annual Report and Form 20-F 2024 | 251 |
Financial statements |
252 | bp Annual Report and Form 20-F 2024 |
bp Annual Report and Form 20-F 2024 | 311 |
Additional disclosures |
Additional disclosures | ||||
Additional information | ||||
Liquidity and capital resources | ||||
Oil and gas disclosures for the group | ||||
Additional information for customers & products | ||||
Environmental expenditure | ||||
Regulation of the group’s business | ||||
International trade sanctions | ||||
Material contracts | ||||
Property, plant and equipment | ||||
Related party transactions | ||||
Corporate governance practices | ||||
Code of ethics | ||||
Controls and procedures | ||||
Cyber security | ||||
Principal accountant’s fees and services | ||||
Additional Directors’ report disclosures | ||||
Disclosures required under Listing Rule 6.6.1R | ||||
Cautionary statement | ||||
312 | bp Annual Report and Form 20-F 2024 |
$ million | ||||
2024 | 2023 | 2022 | ||
Capital expenditure | ||||
Organic capital expenditure« | 16,135 | 14,998 | 12,470 | |
Inorganic capital expenditureabc« | 102 | 1,255 | 3,860 | |
16,237 | 16,253 | 16,330 | ||
Capital expenditure by segment | ||||
gas & low carbon energya | 5,211 | 4,281 | 4,251 | |
oil production & operations | 6,198 | 6,278 | 5,278 | |
customers & productsabc | 4,420 | 5,253 | 6,252 | |
other businesses & corporate | 408 | 441 | 549 | |
16,237 | 16,253 | 16,330 | ||
Capital expenditure by geographical area | ||||
US | 6,566 | 8,105 | 8,656 | |
Non-US | 9,671 | 8,148 | 7,674 | |
16,237 | 16,253 | 16,330 |
bp Annual Report and Form 20-F 2024 | 313 |
Additional disclosures |
$ million | ||||
2024 | 2023 | 2022 | ||
gas & low carbon energy | ||||
Gain on sale of businesses and fixed assetsa | 297 | 19 | 45 | |
Net impairment and losses on sale of businesses and fixed assetsa | (3,004) | (2,221) | 588 | |
Environmental and related provisions | — | — | — | |
Restructuring, integration and rationalization costsb | (25) | — | 8 | |
Fair value accounting effectscd« | (1,550) | 8,859 | (1,811) | |
Othere | 1,048 | (1,299) | (197) | |
(3,234) | 5,358 | (1,367) | ||
oil production & operations | ||||
Gain on sale of businesses and fixed assetsa | 144 | 297 | 3,446 | |
Net impairment and losses on sale of businesses and fixed assetsa | (790) | (1,819) | (4,508) | |
Environmental and related provisionsf | 5 | 54 | 518 | |
Restructuring, integration and rationalization costsb | (15) | (1) | (11) | |
Fair value accounting effects | — | — | — | |
Otherg | (492) | (121) | 52 | |
(1,148) | (1,590) | (503) | ||
customers & products | ||||
Gain on sale of businesses and fixed assetsa | 190 | 44 | 374 | |
Net impairment and losses on sale of businesses and fixed assetsah | (3,117) | (1,757) | (1,983) | |
Environmental and related provisions | (99) | (97) | (101) | |
Restructuring, integration and rationalization costsb | (123) | — | 18 | |
Fair value accounting effectsd | (81) | (86) | (309) | |
Otheri | (847) | (287) | 81 | |
(4,077) | (2,183) | (1,920) | ||
other businesses & corporate | ||||
Gain on sale of businesses and fixed assetsa | 39 | 1 | 1 | |
Net impairment and losses on sale of businesses and fixed assetsa | (19) | (41) | (17) | |
Environmental and related provisionsj | (87) | (604) | (92) | |
Restructuring, integration and rationalization costsb | (59) | 38 | 19 | |
Fair value accounting effectsd | (221) | 630 | (1,381) | |
Rosneftk | — | — | (24,033) | |
Gulf of America oil spill | (51) | (57) | (84) | |
Other | 18 | (4) | 21 | |
(380) | (37) | (25,566) | ||
Total before interest and taxation | (8,839) | 1,548 | (29,356) | |
Finance costsl | (505) | (405) | (425) | |
Total before taxation | (9,344) | 1,143 | (29,781) | |
Taxation on adjusting itemsm | 1,495 | 972 | 456 | |
Taxation – tax rate change effectn | (316) | 232 | (1,834) | |
Total after taxationo | (8,165) | 2,347 | (31,159) |
314 | bp Annual Report and Form 20-F 2024 |
$ million | ||||
2024 | 2023 | 2022 | ||
gas & low carbon energy | ||||
Unrecognized (gains) losses brought forward from previous period | (1,125) | (9,960) | (8,149) | |
Favourable (adverse) impact relative to management’s measure of performance | (1,550) | 8,859 | (1,811) | |
Exchange translation gains (losses) on fair value accounting effects | 1 | (24) | — | |
Unrecognized (gains) losses carried forward | (2,674) | (1,125) | (9,960) | |
customers & products | ||||
Unrecognized (gains) losses brought forward from previous period | (17) | 79 | 391 | |
Favourable (adverse) impact relative to management’s measure of performance | (81) | (86) | (309) | |
Exchange translation gains (losses) on fair value accounting effects | 2 | (10) | (3) | |
Unrecognized (gains) losses carried forward | (96) | (17) | 79 | |
other businesses & corporate | ||||
Unrecognized (gains) losses brought forward from previous period | (925) | (1,555) | (174) | |
Favourable (adverse) impact relative to management’s measure of performancea | (221) | 630 | (1,381) | |
Unrecognized (gains) losses carried forward | (1,146) | (925) | (1,555) | |
Group | ||||
Unrecognized (gains) losses brought forward from previous period | (2,067) | (11,436) | (7,932) | |
Favourable (adverse) impact relative to management’s measure of performance | (1,852) | 9,403 | (3,501) | |
Exchange translation gains (losses) on fair value accounting effects | 3 | (34) | (3) | |
Unrecognized (gains) losses carried forward | (3,916) | (2,067) | (11,436) | |
Favourable (adverse) impact relative to management’s measure of performance – by region | ||||
gas & low carbon energy | ||||
US | (582) | 900 | (1,140) | |
Non-US | (968) | 7,959 | (671) | |
(1,550) | 8,859 | (1,811) | ||
customers & products | ||||
US | (214) | (18) | 3 | |
Non-US | 133 | (68) | (312) | |
(81) | (86) | (309) | ||
other businesses & corporate | ||||
US | — | — | — | |
Non-US | (221) | 630 | (1,381) | |
(221) | 630 | (1,381) | ||
(1,852) | 9,403 | (3,501) | ||
Taxation credit (charge) | 325 | (915) | 434 | |
(1,527) | 8,488 | (3,067) |
bp Annual Report and Form 20-F 2024 | 315 |
Additional disclosures |
$ million | |||
At 31 December | 2024 | 2023 | |
Net debta« | 22,997 | 20,912 | |
Lease liabilities | 12,000 | 11,121 | |
Net partner (receivable) payable for leases entered into on behalf of joint operations« | (88) | (131) | |
Net debt including leases | 34,909 | 31,902 | |
Total equity | 78,318 | 85,493 | |
Gearing including leases« | 30.8% | 27.2% |
316 | bp Annual Report and Form 20-F 2024 |
bp Annual Report and Form 20-F 2024 | 317 |
Additional disclosures |
$ million | ||||
Payments due by period | ||||
Capital expenditure | Less than 1 year | More than 1 year | Total | |
Committed | 12,520 | 13,513 | 26,033 | |
of which is contracted | 7,649 | 5,993 | 13,642 | |
$ million | ||||
Payments due by period | ||||
Expected payments by period under contractual obligations | Less than 1 year | More than 1 year | Total | |
Balance sheet obligations | ||||
Borrowingsa | 6,892 | 70,354 | 77,246 | |
Lease liabilitiesb | 3,237 | 11,031 | 14,268 | |
Decommissioning liabilitiesc | 643 | 23,967 | 24,610 | |
Environmental liabilitiesc | 349 | 1,584 | 1,933 | |
Gulf of America oil spill liabilitiesd | 1,137 | 8,383 | 9,520 | |
Pensions and other post- employment benefitse | 533 | 13,403 | 13,936 | |
12,791 | 128,722 | 141,513 | ||
Off-balance sheet obligations | ||||
Unconditional purchase obligationsf | ||||
Crude oil and oil products | 61,541 | 7,094 | 68,635 | |
Natural gas and LNG | 15,350 | 54,579 | 69,929 | |
Chemicals and other refinery feedstocks | 1,011 | 1,509 | 2,520 | |
Power | 6,111 | 14,165 | 20,276 | |
Utilities | 54 | 393 | 447 | |
Transportation | 2,000 | 14,538 | 16,538 | |
Use of facilities and services | 3,189 | 23,918 | 27,107 | |
89,256 | 116,196 | 205,452 | ||
Total | 102,047 | 244,918 | 346,965 | |
318 | bp Annual Report and Form 20-F 2024 |
bp Annual Report and Form 20-F 2024 | 319 |
Additional disclosures |
320 | bp Annual Report and Form 20-F 2024 |
bp Annual Report and Form 20-F 2024 | 321 |
Additional disclosures |
volumes in mmboea | |
Subsidiaries and equity-accounted entities | Group |
Proved undeveloped reserves at 1 January 2024 | 2,558 |
Revisions of previous estimates | (5) |
Price | (100) |
Revision of future activity plans | 130 |
Field performance | 1 |
Well results | (37) |
Improved recovery | 4 |
Discoveries and extensions | 237 |
Purchases | 13 |
Sales | (19) |
Total in year proved undeveloped reserves changes | 229 |
Proved developed reserves reclassified as undeveloped | 3 |
Progressed to proved developed reserves by development activities (e.g. drilling/completion) | (402) |
Proved undeveloped reserves at 31 December 2024 | 2,387 |
Subsidiaries only | volumes in mmboea |
Proved undeveloped reserves at 1 January 2024 | 2,006 |
Revisions of previous estimates | 18 |
Price | (99) |
Revision of future activity plans | 152 |
Field performance | (3) |
Well results | (33) |
Improved recovery | 2 |
Discoveries and extensions | 180 |
Purchases | 6 |
Sales | (15) |
Total in year proved undeveloped reserves changes | 191 |
Proved developed reserves reclassified as undeveloped | 2 |
Progressed to proved developed reserves by development activities (e.g. drilling/completion) | (325) |
Proved undeveloped reserves at 31 December 2024 | 1,875 |
322 | bp Annual Report and Form 20-F 2024 |
million barrels | |||
Developed | Undeveloped | Total | |
UK | 104 | 63 | 167 |
US | 653 | 472 | 1,125 |
Rest of North America | — | — | — |
South Americad | 1 | 4 | 5 |
Africa | 1 | — | 1 |
Rest of Asia | 716 | 305 | 1,021 |
Australasia | 9 | 1 | 10 |
Subsidiaries | 1,483 | 846 | 2,329 |
Equity-accounted entities | 558 | 339 | 896 |
Total | 2,041 | 1,184 | 3,225 |
million barrels | |||
Developed | Undeveloped | Total | |
UK | 2 | — | 3 |
US | 202 | 246 | 447 |
Rest of North America | — | — | — |
South America | 1 | — | 1 |
Africa | — | — | — |
Rest of Asia | — | — | — |
Australasia | 1 | — | 1 |
Subsidiaries | 206 | 246 | 452 |
Equity-accounted entities | 16 | 6 | 22 |
Total | 222 | 252 | 474 |
million barrels | |||
Developed | Undeveloped | Total | |
Subsidiaries | 1,689 | 1,092 | 2,781 |
Equity-accounted entities | 573 | 344 | 918 |
Total | 2,263 | 1,436 | 3,699 |
bp Annual Report and Form 20-F 2024 | 323 |
Additional disclosures |
billion cubic feet | |||
Developed | Undeveloped | Total | |
UK | 162 | 29 | 190 |
US | 2,600 | 2,412 | 5,012 |
Rest of North America | — | — | — |
South Americae | 379 | 350 | 730 |
Africa | 161 | — | 161 |
Rest of Asia | 3,026 | 1,320 | 4,346 |
Australasia | 1,254 | 431 | 1,685 |
Subsidiaries | 7,582 | 4,542 | 12,124 |
Equity-accounted entities | 1,686 | 976 | 2,662 |
Total | 9,268 | 5,518 | 14,786 |
million barrels of oil equivalent | |||
Developed | Undeveloped | Total | |
Subsidiaries | 2,997 | 1,875 | 4,871 |
Equity-accounted entities | 864 | 513 | 1,377 |
Total | 3,860 | 2,387 | 6,248 |
324 | bp Annual Report and Form 20-F 2024 |
thousand barrels per day | |||||||
bp net share of productionb | |||||||
Crude oil | Natural gas liquids | ||||||
2024 | 2023 | 2022 | 2024 | 2023 | 2022 | ||
Subsidiaries | |||||||
UK | 70 | 74 | 80 | 4 | 5 | 5 | |
Total Europe | 70 | 74 | 80 | 4 | 5 | 5 | |
Lower 48 onshorec | 86 | 69 | 71 | 84 | 66 | 56 | |
Gulf of America deepwater | 290 | 266 | 225 | 23 | 22 | 19 | |
Total US | 376 | 335 | 296 | 107 | 88 | 76 | |
Canadacd | — | — | 15 | — | — | — | |
Total Rest of North America | — | — | 15 | — | — | — | |
Total North America | 376 | 335 | 311 | 107 | 88 | 76 | |
Trinidad and Tobago | 4 | 4 | 5 | 4 | 4 | 4 | |
Total South America | 4 | 4 | 5 | 4 | 4 | 4 | |
Angolac | — | — | 49 | — | — | — | |
Egypt | 19 | 28 | 28 | 1 | 1 | — | |
Algeriac | — | 1 | 5 | — | 1 | 6 | |
Total Africa | 19 | 29 | 83 | 1 | 2 | 6 | |
Abu Dhabi | 202 | 197 | 195 | — | — | — | |
Azerbaijan | 66 | 70 | 73 | — | — | — | |
Iraqc | — | — | 15 | — | — | — | |
Indiag | 6 | 4 | — | — | — | — | |
Oman | 23 | 22 | 24 | — | — | — | |
Total Rest of Asia | 297 | 293 | 307 | — | — | — | |
Total Asia | 297 | 293 | 307 | — | — | — | |
Australiac | 7 | 8 | 11 | 2 | 2 | 2 | |
Eastern Indonesia | 2 | 2 | 1 | — | — | — | |
Total Australasia | 9 | 10 | 12 | 2 | 2 | 2 | |
Total subsidiaries | 775 | 745 | 797 | 117 | 100 | 93 | |
Equity-accounted entities (bp share) | |||||||
Rosnefte (Russia, Egypt) | — | — | 144 | — | — | — | |
Argentina | 52 | 51 | 51 | 1 | 1 | 1 | |
Mexico | 3 | 5 | 6 | — | — | — | |
Bolivia | 1 | 1 | 2 | — | — | — | |
Egypt | — | — | — | 2 | 2 | 3 | |
Norway | 58 | 60 | 47 | 2 | 3 | 2 | |
Russia | — | — | 7 | — | — | — | |
Iraq | 69 | 62 | 25 | — | — | — | |
Angola | 82 | 82 | 33 | 4 | 4 | 2 | |
Total equity-accounted entities | 266 | 261 | 314 | 9 | 9 | 9 | |
Total subsidiaries and equity-accounted entitiesf | 1,041 | 1,006 | 1,111 | 126 | 109 | 102 | |
bp Annual Report and Form 20-F 2024 | 325 |
Additional disclosures |
million cubic feet per day | |||
bp net share of productiona | |||
2024 | 2023 | 2022 | |
Subsidiaries | |||
UK | 197 | 247 | 271 |
Total Europe | 197 | 247 | 271 |
Lower 48 onshoreb | 1,530 | 1,338 | 1,148 |
Gulf of America deepwater | 160 | 149 | 143 |
Total US | 1,690 | 1,486 | 1,291 |
Canada | — | — | — |
Total Rest of North America | — | — | — |
Total North America | 1,690 | 1,486 | 1,291 |
Trinidad and Tobagob | 1,145 | 1,191 | 1,276 |
Total South America | 1,145 | 1,191 | 1,276 |
Egyptb | 904 | 1,220 | 1,272 |
Algeriab | — | 16 | 81 |
Total Africa | 904 | 1,236 | 1,353 |
Azerbaijan | 748 | 714 | 670 |
India | 303 | 283 | 216 |
Oman | 604 | 582 | 599 |
Total Rest of Asia | 1,655 | 1,578 | 1,485 |
Total Asia | 1,655 | 1,578 | 1,485 |
Australia | 276 | 301 | 331 |
Eastern Indonesia | 606 | 473 | 421 |
Total Australasia | 882 | 774 | 752 |
Total subsidiariesc | 6,474 | 6,512 | 6,428 |
Equity-accounted entities (bp share) | |||
Rosneftd (Russia, Canada, Egypt, Vietnam) | — | — | 238 |
Argentina | 267 | 247 | 238 |
Bolivia | 33 | 50 | 56 |
Mexico | 1 | 2 | 2 |
Egypt | 9 | — | — |
Norway | 55 | 58 | 66 |
Russia | — | — | 10 |
Angola | 76 | 74 | 64 |
Total equity-accounted entitiesc | 440 | 432 | 674 |
Total subsidiaries and equity-accounted entities | 6,914 | 6,944 | 7,101 |
326 | bp Annual Report and Form 20-F 2024 |
$ per unit of production | |||||||||||
Europe | North America | South America | Africa | Asia | Australasia | Total group average | |||||
UK | Rest of Europe | US | Rest of North America | Russia | Rest of Asia | ||||||
Subsidiaries | |||||||||||
2024 | |||||||||||
Crude oilb | 80.81 | — | 74.73 | — | 81.89 | 75.21 | — | 81.28 | 70.21 | 77.77 | |
Natural gas liquids | 43.45 | — | 20.09 | — | 20.46 | — | — | — | 49.25 | 21.25 | |
Gas | 11.65 | — | 1.49 | — | 3.42 | 4.68 | — | 6.83 | 8.95 | 4.91 | |
2023 | |||||||||||
Crude oilb | 82.99 | — | 75.28 | — | 84.36 | 76.30 | — | 83.86 | 68.27 | 79.37 | |
Natural gas liquids | 46.52 | — | 19.26 | — | 30.76 | 44.41 | — | — | 33.47 | 23.79 | |
Gas | 16.71 | — | 2.08 | — | 3.58 | 4.82 | — | 7.72 | 8.89 | 5.60 | |
2022 | |||||||||||
Crude oilb | 102.54 | — | 90.05 | 84.88 | 99.09 | 102.00 | — | 98.74 | 86.11 | 95.70 | |
Natural gas liquids | 60.41 | — | 31.72 | — | 60.55 | 54.78 | — | — | 54.20 | 37.00 | |
Gas | 33.45 | — | 5.61 | 3.68 | 7.65 | 5.21 | — | 11.81 | 12.33 | 9.29 | |
Equity-accounted entitiesc | |||||||||||
2024 | |||||||||||
Crude oilb | — | 80.10 | — | — | 79.21 | 78.60 | — | 73.86 | — | 77.84 | |
Natural gas liquids | — | — | — | — | 27.84 | — | — | — | — | 27.84 | |
Gas | — | 10.83 | — | — | 3.38 | — | — | — | — | 4.54 | |
2023 | |||||||||||
Crude oilb | — | 81.61 | — | — | 75.49 | 80.21 | — | 75.21 | — | 78.33 | |
Natural gas liquidsd | — | — | — | — | 30.95 | 42.89 | N/A | — | — | 36.70 | |
Gas | — | 12.80 | — | — | 3.66 | — | — | — | — | 5.15 | |
2022 | |||||||||||
Crude oilb | — | 71.14 | — | — | 78.05 | 86.73 | 102.84 | 90.16 | — | 90.18 | |
Natural gas liquidsd | — | — | — | — | 46.64 | — | N/A | — | — | 46.64 | |
Gas | — | 24.23 | — | — | 4.75 | — | 4.35 | — | — | 6.91 | |
$ per unit of production | |||||||||||
Europe | North America | South America | Africa | Asia | Australasia | Total group average | |||||
UK | Rest of Europe | US | Rest of North America | Russia | Rest of Asia | ||||||
Subsidiaries | |||||||||||
2024 | 13.74 | — | 9.33 | — | 5.27 | 3.57 | — | 2.89 | 1.78 | 6.17 | |
2023 | 10.69 | — | 9.61 | — | 4.53 | 2.52 | — | 2.81 | 2.09 | 5.78 | |
2022 | 10.36 | — | 9.70 | 15.36 | 3.92 | 5.02 | — | 3.52 | 2.04 | 6.07 | |
Equity-accounted entities | |||||||||||
2024 | — | 6.16 | — | — | 20.40 | 18.30 | — | 22.88 | — | 17.37 | |
2023 | — | 6.22 | — | — | 17.87 | 15.46 | — | 16.41 | — | 14.38 | |
2022 | — | 6.01 | — | — | 15.55 | 21.01 | 7.39 | 20.81 | — | 11.47 | |
bp Annual Report and Form 20-F 2024 | 327 |
Additional disclosures |
$ million | ||||
2024 | 2023 | 2022 | ||
RC profit (loss) before interest and tax for customers & products | (1,560) | 4,230 | 8,869 | |
Less: Adjusting items gains (charges) | (4,077) | (2,183) | (1,920) | |
Underlying RC profit before interest and tax for customers & products | 2,517 | 6,413 | 10,789 | |
By business: | ||||
customers – convenience & mobility | 2,584 | 2,644 | 2,966 | |
Castrol – included in customers | 831 | 730 | 700 | |
products – refining & trading | (67) | 3,769 | 7,823 | |
Add back: Depreciation, depletion and amortization | 3,957 | 3,548 | 2,870 | |
By business: | ||||
customers – convenience & mobility | 2,135 | 1,736 | 1,286 | |
Castrol – included in customers | 176 | 167 | 153 | |
products – refining & trading | 1,822 | 1,812 | 1,584 | |
Adjusted EBITDA for customers & products | 6,474 | 9,961 | 13,659 | |
By business: | ||||
customers – convenience & mobility | 4,719 | 4,380 | 4,252 | |
Castrol – included in customers | 1,007 | 897 | 853 | |
products – refining & trading | 1,755 | 5,581 | 9,407 |
thousand barrels per day | ||||
2024 | 2023 | 2022 | ||
Marketing salesa | 2,714 | 2,718 | 2,613 | |
Trading/supply salesb | 373 | 358 | 350 | |
Total refined product sales | 3,087 | 3,076 | 2,963 | |
Crude oilc | 86 | 102 | 184 | |
Total | 3,173 | 3,178 | 3,147 |
Number of bp-branded retail sites | ||||
2024 | 2023 | 2022 | ||
US | 8,500 | 8,200 | 7,750 | |
Europe | 7,750 | 8,050 | 8,150 | |
Rest of world | 4,950 | 4,850 | 4,750 | |
Total | 21,200 | 21,100 | 20,650 |
thousand barrels per day | ||||
2024 | 2023 | 2022 | ||
US | 612 | 662 | 678 | |
Europe | 782 | 749 | 804 | |
Rest of world | — | — | 22 | |
Total | 1,394 | 1,411 | 1,504 | |
% | ||||
Refining availability« | 94.3 | 96.1 | 94.5 |
328 | bp Annual Report and Form 20-F 2024 |
Crude distillation capacitiesc | ||||
Country | Refinery | thousand barrels per day | ||
US | ||||
US North West | US | Cherry Point | 251 | |
US Mid West | Whiting | 440 | ||
691 | ||||
Europe | ||||
North West Europe | Germany | Gelsenkirchend | 265 | |
Lingen | 97 | |||
Netherlands | Rotterdam | 394 | ||
Mediterranean | Spain | Castellón | 110 | |
866 | ||||
Total capacity at 31 December 2024 | 1,557 |
bp Annual Report and Form 20-F 2024 | 329 |
Additional disclosures |
$ million | ||||
2024 | 2023 | 2022 | ||
Operating expenditure | 575 | 524 | 416 | |
Capital expenditure | 393 | 329 | 224 | |
Clean-ups | 20 | 23 | 16 | |
Additions to environmental remediation provision | 254 | 228 | 502 | |
Increase (decrease) in decommissioning provision | 942 | 920 | 1,248 |
330 | bp Annual Report and Form 20-F 2024 |
bp Annual Report and Form 20-F 2024 | 331 |
Additional disclosures |
332 | bp Annual Report and Form 20-F 2024 |
bp Annual Report and Form 20-F 2024 | 333 |
Additional disclosures |
334 | bp Annual Report and Form 20-F 2024 |
bp Annual Report and Form 20-F 2024 | 335 |
Additional disclosures |
336 | bp Annual Report and Form 20-F 2024 |
bp Annual Report and Form 20-F 2024 | 337 |
Additional disclosures |
338 | bp Annual Report and Form 20-F 2024 |
Information required | Page |
(1) Amount of interest capitalized | 171 |
(2), (3) | Not applicable |
(4), (5) Waiver of director emoluments | Not applicable |
(6) – (10) | Not applicable |
(11), (12) Dividend waivers | 337 |
(13) | Not applicable |
bp Annual Report and Form 20-F 2024 | 339 |
Additional disclosures |
340 | bp Annual Report and Form 20-F 2024 |
bp Annual Report and Form 20-F 2024 | 341 |
Shareholder information |
Shareholder information | |||||
Share prices and listings | |||||
Dividends | |||||
Shareholder taxation information | |||||
Major shareholders | |||||
Annual general meeting | |||||
Memorandum and Articles of Association | |||||
Purchases of equity securities by the issuer and affiliated purchasers | |||||
Fees and charges payable by ADS holders | |||||
Fees and payments made by the Depositary to the issuer | |||||
Documents on display | |||||
Shareholding administration | |||||
2025 shareholder calendar | |||||
342 | bp Annual Report and Form 20-F 2024 |
Dividends per ADSa | March | June | September | December | Total | |
2020 | UK pence | 48.94 | 50.05 | 24.26 | 23.50 | 146.75 |
US cents | 63.00 | 63.00 | 31.50 | 31.50 | 189.00 | |
2021 | UK pence | 22.61 | 22.27 | 23.72 | 24.63 | 92.23 |
US cents | 31.50 | 31.50 | 32.76 | 32.76 | 128.52 | |
2022 | UK pence | 24.96 | 26.13 | 31.01 | 29.64 | 111.74 |
US cents | 32.76 | 32.76 | 36.04 | 36.04 | 137.60 | |
2023 | UK pence | 33.30 | 31.85 | 34.39 | 34.42 | 133.97 |
US cents | 39.66 | 39.66 | 43.62 | 43.62 | 166.56 | |
2024 | UK pence | 34.15 | 34.10 | 36.30 | 37.78 | 142.33 |
US cents | 43.62 | 43.62 | 48.00 | 48.00 | 183.24 | |
bp Annual Report and Form 20-F 2024 | 343 |
Shareholder information |
344 | bp Annual Report and Form 20-F 2024 |
Range of holdings | Number of ordinary shareholders | Percentage of total ordinary shareholders | Percentage of total ordinary share capital excluding shares held in treasury |
1-200 | 51,042 | 26.34 | 0.02 |
201-1,000 | 62,834 | 32.42 | 0.21 |
1,001-10,000 | 69,939 | 36.09 | 1.36 |
10,001-100,000 | 8,749 | 4.51 | 1.12 |
100,001-1,000,000 | 677 | 0.35 | 1.50 |
Over 1,000,000a | 555 | 0.29 | 95.79 |
Totals | 193,796 | 100 | 100 |
Range of holdings | Number of ADS holders | Percentage of total ADS holders | Percentage of total ADSs |
1-200 | 35,241 | 59.39 | 0.18 |
201-1,000 | 15,660 | 26.39 | 0.71 |
1,001-10,000 | 8,136 | 13.71 | 1.96 |
10,001-100,000 | 299 | 0.50 | 0.47 |
100,001-1,000,000 | 4 | 0.01 | 0.07 |
Over 1,000,000b | 2 | 0.00 | 96.63 |
Totals | 59,342 | 100 | 100 |
bp Annual Report and Form 20-F 2024 | 345 |
Shareholder information |
As at 31 December 2024 | As at 14 February 2025 | |||
Number of voting rights | Percentage of capital | Number of voting rights | Percentage of capital | |
BlackRock, Inc. | 1,504,412,502 | 7.37 | 1,504,412,502 | 7.37 |
Norges Banka | 651,587,439 | 4.00 | 651,587,439 | 4.00 |
Holder | Holding of ordinary shares | Percentage of ordinary share capital excluding shares held in treasury |
JPMorgan Chase Bank N.A., depositary for ADSs, through its nominee Guaranty Nominees Limited | 4,191,539,064 | 26.19 |
BlackRock, Inc. | 1,478,584,810 | 9.24 |
Vanguard Group Holdings | 792,582,730 | 4.95 |
Norges Bank | 722,312,781 | 4.51 |
Holder | Holding of 8% cumulative first preference shares | Percentage of class |
Hargreaves Lansdown Asset Management Limited | 1,370,985 | 18.96 |
Interactive Investor Share Dealing Services | 968,752 | 13.39 |
Barclays, Plc. | 682,038 | 9.43 |
Halifax Share Dealing Services | 625,009 | 8.64 |
Canaccord Genuity Group Inc. | 541,185 | 7.48 |
AJ Bell Securities, Ltd. | 379,756 | 5.25 |
Ameriprise Financials, Inc. | 287,500 | 3.97 |
Holder | Holding of 9% cumulative second preference shares | Percentage of class |
Hargreaves Lansdown Asset Management Limited | 907,748 | 16.58 |
AJ Bell Securities, Ltd. | 622,328 | 11.37 |
Interactive Investor Share Dealing Services | 527,194 | 9.63 |
Canaccord Genuity Group Inc. | 413,605 | 7.56 |
Safra Group | 345,500 | 6.31 |
Halifax Share Dealing Services | 292,679 | 5.35 |
Ameriprise Financials, Inc. | 250,000 | 4.57 |
abrdn plc | 215,000 | 3.93 |
Redmayne-Bentley LLP | 179,725 | 3.28 |
Barclays, Plc. | 174,656 | 3.19 |
346 | bp Annual Report and Form 20-F 2024 |
bp Annual Report and Form 20-F 2024 | 347 |
Shareholder information |
348 | bp Annual Report and Form 20-F 2024 |
Total number of shares purchaseda | Average price paid per share $ | Number of shares purchased by ESOPs or for certain employee share-based plansb | Number of shares purchased under buyback programmesc | Maximum approximate dollar value of shares yet to be purchased under the programmes $ million | ||
2024 | ||||||
January 02 - January 31 | 113,923,673 | 5.87 | 7,312,257 | 106,611,416 | N/A | |
February 1 - February 28 | 93,027,315 | 5.99 | 93,027,315 | N/A | ||
March 1 - March 28 | 91,984,194 | 6.18 | 91,984,194 | N/A | ||
April 2 - April 30 | 93,129,453 | 6.50 | 93,129,453 | N/A | ||
May 1 -May 31 | 90,477,384 | 6.34 | 90,477,384 | N/A | ||
June 3 - June 28 | 95,154,515 | 6.01 | 95,154,515 | N/A | ||
July 1- July 30 | 125,439,524 | 5.99 | 125,439,524 | N/A | ||
August 2 - August 30 | 102,310,465 | 5.68 | 102,310,465 | N/A | ||
September 02 -September 30 | 123,588,247 | 5.45 | 990,000 | 122,598,247 | N/A | |
October 01 - October 31 | 154,431,981 | 5.32 | 154,431,981 | N/A | ||
November 1 - November 29 | 90,683,490 | 4.90 | 90,683,490 | N/A | ||
December 2 - December 20 | 72,487,250 | 4.96 | 72,487,250 | N/A | ||
2025 | ||||||
January 03 - January 31 | 132,132,317 | 5.25 | 1,200,000 | 130,932,317 | N/A | |
February 03 - February 11 | 45,219,940 | 5.30 | 45,219,940 | N/A |
bp Annual Report and Form 20-F 2024 | 349 |
Shareholder information |
Type of service | Depositary actions | Fee |
Depositing or substituting the underlying shares | Issuance of ADSs against the deposit of shares, including deposits and issuances in respect of: •Share distributions, stock splits, rights, merger. •Exchange of securities or other transactions or event or other distribution affecting the ADSs or deposited securities. | $5.00 per 100 ADSs (or portion thereof) evidenced by the new ADSs delivered. |
Selling or exercising rights | Distribution or sale of securities, the fee being an amount equal to the fee for the execution and delivery of ADSs that would have been charged as a result of the deposit of such securities. | $5.00 per 100 ADSs (or portion thereof). |
Withdrawing an underlying share | Acceptance of ADSs surrendered for withdrawal of deposited securities. | $5.00 for each 100 ADSs (or portion thereof) evidenced by the ADSs surrendered. |
Expenses of the Depositary | Expenses incurred on behalf of holders in connection with: •Stock transfer or other taxes and governmental charges. •Delivery by cable, telex, electronic and facsimile transmission. •Transfer or registration fees, if applicable, for the registration of transfers of underlying shares. •Expenses of the Depositary in connection with the conversion of foreign currency into US dollars (which are paid out of such foreign currency). | Expenses payable are subject to agreement between the company and the Depositary by billing holders or by deducting charges from one or more cash dividends or other cash distributions. |
Dividend fees | ADS holders who receive a cash dividend are charged a fee which bp uses to offset the costs associated with administering the ADS programme. | The Deposit Agreement provides that a fee of $0.05 or less per ADS can be charged. The current fee is $0.02 per bp ADS per calendar year (equivalent to $0.005 per bp ADS per quarter per cash distribution). |
Global Invest Direct (GID) Plan | New investors and existing ADS holders can buy, sell or reinvest dividends into further bp ADSs by enrolling in bp’s GID Plan, sponsored and administered by the Depositary. | Cost per transaction is $2.00 for recurring, $2.00 for one-time automatic investments, and $5.00 for investment made by check. Dividend reinvestment is 5% of the dividend amount up to a maximum of $5.00. Purchase trading commission is $0.12 per share. |
Category of expense reimbursed, waived or paid directly to third parties | Amount reimbursed, waived or paid directly to third parties for the year ended 31 December 2024 $ |
Fees for delivery and surrender of bp ADSs | 2,071,528.80 |
Dividend fees | 13,677,275.27 |
Waived fees | — |
Total | 15,748,804.07 |
350 | bp Annual Report and Form 20-F 2024 |
28 Mar 2025 | Fourth quarter interim dividend payment for 2024 |
17 Apr 2025 | Annual general meeting |
29 Apr 2025 | First quarter results announced |
16 May 2025 | Record date (to be eligible for the first quarter interim dividend) |
27 Jun 2025 | First quarter interim dividend payment for 2025 and 8% and 9% preference shares record date |
31 Jul 2025 | 8% and 9% preference shares dividend payment |
05 Aug 2025 | Second quarter results announced |
15 Aug 2025 | Record date (to be eligible for the second quarter interim dividend) |
19 Sep 2025 | Second quarter interim dividend payment for 2025 |
04 Nov 2025 | Third quarter results announced |
14 Nov 2025 | Record date (to be eligible for the third quarter interim dividend) |
19 Dec 2025 | Third quarter interim dividend payment for 2025 |
bp Annual Report and Form 20-F 2024 | 351 |
Glossary |
352 | bp Annual Report and Form 20-F 2024 |
bp Annual Report and Form 20-F 2024 | 353 |
Glossary |
354 | bp Annual Report and Form 20-F 2024 |
bp Annual Report and Form 20-F 2024 | 355 |
Glossary |
356 | bp Annual Report and Form 20-F 2024 |
bp Annual Report and Form 20-F 2024 | 357 |
Glossary |
358 | bp Annual Report and Form 20-F 2024 |
bp Annual Report and Form 20-F 2024 | 359 |
Glossary |
360 | bp Annual Report and Form 20-F 2024 |
$ million | ||||||
2024 | 2023 | 2022 | 2021 | 2020 | ||
Profit (loss) for the year attributable to bp shareholders | 381 | 15,239 | (2,487) | 7,565 | (20,305) | |
Inventory holding (gains) losses«, before tax | 488 | 1,236 | (1,351) | (3,655) | 2,868 | |
Taxation charge (credit) on inventory holding gains and losses | (119) | (292) | 332 | 829 | (667) | |
RC profit (loss)« for the year | 750 | 16,183 | (3,506) | 4,739 | (18,104) | |
Net (favourable) adverse impact of adjusting items«, before tax | 9,344 | (1,143) | 29,781 | 8,697 | 16,649 | |
Adjusting items total taxation | (1,179) | (1,204) | 1,378 | (621) | (4,235) | |
Underlying RC profit or loss for the year | 8,915 | 13,836 | 27,653 | 12,815 | (5,690) | |
Per ordinary share – cents | ||||
2024 | 2023 | 2022 | ||
Profit (loss) for the year attributable to bp shareholders | 2.38 | 87.78 | (13.10) | |
Inventory holding (gains) losses, before tax | 2.98 | 7.12 | (7.12) | |
Taxation charge (credit) on inventory holding gains and losses | (0.73) | (1.69) | 1.75 | |
4.63 | 93.21 | (18.47) | ||
Net (favourable) adverse impact of adjusting items, before tax | 56.95 | (6.58) | 156.84 | |
Taxation charge (credit) on adjusting items | (7.18) | (6.94) | 7.26 | |
Underlying RC profit for the year | 54.40 | 79.69 | 145.63 | |
Per ADS – dollars | ||||
2024 | 2023 | 2022 | ||
Profit (loss) for the year attributable to bp shareholders | 0.14 | 5.27 | (0.79) | |
Inventory holding (gains) losses, before tax | 0.18 | 0.43 | (0.43) | |
Taxation charge (credit) on inventory holding gains and losses | (0.04) | (0.11) | 0.11 | |
0.28 | 5.59 | (1.11) | ||
Net (favourable) adverse impact of adjusting items, before tax | 3.42 | (0.40) | 9.41 | |
Taxation charge (credit) on adjusting items | (0.44) | (0.41) | 0.44 | |
Underlying RC profit for the year | 3.26 | 4.78 | 8.74 | |
$ million | ||||
2024 | 2023 | 2022 | ||
Taxation on profit or loss before taxation for the year | (5,553) | (7,869) | (16,762) | |
Adjusted for taxation on inventory holding gains and losses | 119 | 292 | (332) | |
Taxation on a RC profit or loss basis | (5,672) | (8,161) | (16,430) | |
Adjusted for adjusting items total taxation | 1,179 | 1,204 | (1,378) | |
Taxation on an underlying RC basis | (6,851) | (9,365) | (15,052) | |
% | ||||
2024 | 2023 | 2022 | ||
ETR on profit or loss before taxation for the year | 82 | 33 | 109 | |
Adjusted for inventory holding gains and losses | (4) | — | 8 | |
ETR on RC profit or loss | 78 | 33 | 117 | |
Adjusted for adjusting items total taxation | (37) | 6 | (83) | |
Underlying ETR | 41 | 39 | 34 | |
bp Annual Report and Form 20-F 2024 | 361 |
Non-IFRS measures reconciliations |
$ million | ||||||
2024 | 2023 | 2022 | 2021 | 2020 | ||
Profit (loss) for the year attributable to bp shareholders | 381 | 15,239 | (2,487) | 7,565 | (20,305) | |
Inventory holding (gains) losses, before tax | 488 | 1,236 | (1,351) | (3,655) | 2,868 | |
Taxation charge (credit) on inventory holding gains and losses | (119) | (292) | 332 | 829 | (667) | |
Adjusting items, before tax | 9,344 | (1,143) | 29,781 | 8,697 | 16,649 | |
Taxation charge (credit) on adjusting items | (1,179) | (1,204) | 1,378 | (621) | (4,235) | |
Underlying RC profit | 8,915 | 13,836 | 27,653 | 12,815 | (5,690) | |
Interest expensea | 3,113 | 2,569 | 1,632 | 1,322 | 1,808 | |
Taxation on interest expense | (404) | (661) | (296) | (195) | (406) | |
Non-controlling interests (NCI) | 848 | 641 | 1,130 | 922 | (424) | |
12,472 | 16,385 | 30,119 | 14,864 | (4,712) | ||
Total equity | 78,318 | 85,493 | 82,990 | 90,439 | 85,568 | |
Finance debt | 59,547 | 51,954 | 46,944 | 61,176 | 72,664 | |
Capital employed | 137,865 | 137,447 | 129,934 | 151,615 | 158,232 | |
Less: Goodwill | 14,888 | 12,472 | 11,960 | 12,373 | 12,480 | |
Cash and cash equivalents | 39,204 | 33,030 | 29,195 | 30,681 | 31,111 | |
83,773 | 91,945 | 88,779 | 108,561 | 114,641 | ||
Average capital employed excluding goodwill and cash and cash equivalents | 87,859 | 90,362 | 98,670 | 111,601 | 124,367 | |
Profit (loss) for the year attributable to bp shareholders divided by total equity | 0.5% | 17.8% | (3.0)% | 8.4% | (23.7)% | |
ROACE | 14.2% | 18.1% | 30.5% | 13.3% | (3.8)% | |
$ million | ||||
2024 | 2023 | 2022 | ||
Profit (loss) for the period | 1,229 | 15,880 | (1,357) | |
Finance costs | 4,683 | 3,840 | 2,703 | |
Net finance (income) expense relating to pensions and other post-employment benefits | (168) | (241) | (69) | |
Taxation | 5,553 | 7,869 | 16,762 | |
Profit before interest and tax | 11,297 | 27,348 | 18,039 | |
Inventory holding (gains) losses, before tax | 488 | 1,236 | (1,351) | |
11,785 | 28,584 | 16,688 | ||
Net (favourable) adverse impact of adjusting items, before interest and tax | 8,839 | (1,548) | 29,356 | |
20,624 | 27,036 | 46,044 | ||
Taxation on an underlying RC basisa | (6,851) | (9,365) | (15,052) | |
13,773 | 17,671 | 30,992 | ||
Add back: Depreciation, depletion and amortization | 16,622 | 15,928 | 14,318 | |
Exploration expenditure written off | 766 | 746 | 385 | |
Adjusted EBIDA | 31,161 | 34,345 | 45,695 |
362 | bp Annual Report and Form 20-F 2024 |
$ million | ||||
2024 | 2023 | 2022 | ||
Profit (loss) for the period | 1,229 | 15,880 | (1,357) | |
Finance costs | 4,683 | 3,840 | 2,703 | |
Net finance (income) expense relating to pensions and other post-employment benefits | (168) | (241) | (69) | |
Taxation | 5,553 | 7,869 | 16,762 | |
Profit before interest and tax | 11,297 | 27,348 | 18,039 | |
Inventory holding (gains) losses, before tax | 488 | 1,236 | (1,351) | |
11,785 | 28,584 | 16,688 | ||
Net (favourable) adverse impact of adjusting items, before interest and tax | 8,839 | (1,548) | 29,356 | |
20,624 | 27,036 | 46,044 | ||
Add back: Depreciation, depletion and amortization | 16,622 | 15,928 | 14,318 | |
Exploration expenditure written off | 766 | 746 | 385 | |
Adjusted EBITDA | 38,012 | 43,710 | 60,747 |
$ million | ||||
2024 | 2023 | 2022 | ||
gas & low carbon energy | ||||
RC profit before interest and tax | 3,569 | 14,080 | 14,696 | |
Less: Net favourable (adverse) impact of adjusting items | (3,234) | 5,358 | (1,367) | |
Underlying RC profit before interest and tax | 6,803 | 8,722 | 16,063 | |
Add back: Depreciation, depletion and amortization | 4,835 | 5,680 | 5,008 | |
Exploration expenditure written off | 222 | 362 | 2 | |
Adjusted EBITDA | 11,860 | 14,764 | 21,073 | |
oil production & operations | ||||
RC profit before interest and tax | 10,789 | 11,191 | 19,721 | |
Less: Net favourable (adverse) impact of adjusting items | (1,148) | (1,590) | (503) | |
Underlying RC profit before interest and tax | 11,937 | 12,781 | 20,224 | |
Add back: Depreciation, depletion and amortization | 6,797 | 5,692 | 5,564 | |
Exploration expenditure written off | 544 | 384 | 383 | |
Adjusted EBITDA | 19,278 | 18,857 | 26,171 |
bp Annual Report and Form 20-F 2024 | 363 |
Non-IFRS measures reconciliations |
$ million | |||
2024 | 2023 | ||
From group income statement | |||
Production and manufacturing expenses | 26,584 | 25,044 | |
Distribution and administration expenses | 16,417 | 16,772 | |
43,001 | 41,816 | ||
Less certain variable costs: | |||
Transportation and shipping costs | 11,531 | 10,752 | |
Environmental costs | 2,972 | 3,169 | |
Marketing and distribution costs | 1,882 | 2,430 | |
Commission, storage and handling costs | 1,519 | 1,633 | |
Other variable costs and non-cash costs | 1,495 | 743 | |
Certain variable costs | 19,399 | 18,727 | |
Operating expenditure« | 23,602 | 23,089 | |
Less certain adjusting items«: | |||
Gulf of America oil spill | 51 | 57 | |
Environmental and related provisions | 181 | 647 | |
Restructuring, integration and rationalization costs | 222 | (37) | |
Fair value accounting effects – derivative instruments relating to the hybrid bonds | 221 | (630) | |
Other certain adjusting items | 601 | 419 | |
Certain adjusting items | 1,276 | 456 | |
Underlying operating expenditure | 22,326 | 22,633 | |
Underlying operating expenditure reduction relative to 2023 | (307) | ||
Increase/(decrease) in underlying operating expenditure due to inflation, exchange, portfolio changes and organic growth | 443 | ||
Structural cost reduction« | (750) |
364 | bp Annual Report and Form 20-F 2024 |
bp Annual Report and Form 20-F 2024 | 365 |
Item 1. | Identity of Directors, Senior Management and Advisers | n/a | ||||
Item 2. | Offer Statistics and Expected Timetable | n/a | ||||
Item 3. | Key Information | |||||
A. | [Reserved] | n/a | ||||
B. | Capitalization and indebtedness | n/a | ||||
C. | Reasons for the offer and use of proceeds | n/a | ||||
D. | Risk factors | 65-67 | ||||
Item 4. | Information on the Company | |||||
A. | History and development of the company | 23-27, 164-167, 172, 178, 180-184, 318-328, 345, 349 | ||||
B. | Business overview | 6-7, 24-32, 33-35, 167-171, 318-334, 339 | ||||
C. | Organizational structure | 222 | ||||
D. | Property, plants and equipment | 14, 28-35, 177-178, 248-250, 317-329, 334 | ||||
Item 4A. | Unresolved Staff Comments | None | ||||
Item 5. | Operating and Financial Review and Prospects | |||||
A. | Operating results | 6-9, 12-13, 18-27, 65-67, 182-183, 193, 195-210, 318-334 | ||||
B. | Liquidity and capital resources | 142, 178, 193-201, 316-317 | ||||
C. | Research and development, patent and licenses, etc. | 12, 171 | ||||
D. | Trend information | 6-9, 12-13, 18-27, 318-328 | ||||
E. | Critical Accounting Estimates | n/a | ||||
Item 6. | Directors, Senior Management and Employees | |||||
A. | Directors and senior management | 72-74 | ||||
B. | Compensation | 88-110, 187-192, 220-221 | ||||
C. | Board practices | 72-73, 82-85 | ||||
D. | Employees | 57-59, 221 | ||||
E. | Share ownership | 57-59, 88-110, 187-192, 220 | ||||
F. | Disclosure of a registrant’s action to recover erroneously awarded compensation | n/a | ||||
Item 7. | Major Shareholders and Related Party Transactions | |||||
A. | Major shareholders | 344-345 | ||||
B. | Related party transactions | 180-184, 334-335 | ||||
C. | Interests of experts and counsel | n/a | ||||
Item 8. | Financial Information | |||||
A. | Consolidated Statements and Other Financial Information | 140, 142-222, 251-253, 316, 342 | ||||
B. | Significant Changes | n/a | ||||
Item 9. | The Offer and Listing | |||||
A. | Offer and listing details | 342 | ||||
B. | Plan of distribution | n/a | ||||
C. | Markets | 342 | ||||
D. | Selling shareholders | n/a | ||||
E. | Dilution | n/a | ||||
F. | Expenses of the issue | n/a | ||||
Item 10. | Additional Information | |||||
A. | Share capital | n/a | ||||
B. | Memorandum and articles of association | 345-347 | ||||
C. | Material contracts | 334 | ||||
D. | Exchange controls | 342 | ||||
E. | Taxation | 342-344 | ||||
F. | Dividends and paying agents | n/a | ||||
G. | Statements by experts | n/a | ||||
H. | Documents on display | 349 | ||||
I. | Subsidiary information | n/a | ||||
J. | Annual Report to Security Holders | n/a | ||||
Item 11. | Quantitative and Qualitative Disclosures About Market Risk | 195-201 | ||||
Item 12. | Description of Securities Other than Equity Securities | |||||
A. | Debt Securities | n/a | ||||
B. | Warrants and Rights | n/a | ||||
C. | Other Securities | n/a | ||||
D. | American Depositary Shares | 349 | ||||
Item 13. | Defaults, Dividend Arrearages and Delinquencies | None | ||||
Item 14. | Material Modifications to the Rights of Security Holders and Use of Proceeds | None | ||||
Item 15. | Controls and Procedures | 139, 336 | ||||
Item 16. | [Reserved] | n/a | ||||
Item 16A. | Audit committee financial expert | 82 | ||||
Item 16B. | Code of Ethics | 335-336 | ||||
Item 16C. | Principal Accountant Fees and Services | 84, 221, 337 | ||||
Item 16D. | Exemptions from the Listing Standards for Audit Committees | n/a | ||||
Item 16E. | Purchases of Equity Securities by the Issuer and Affiliated Purchasers | 348 | ||||
Item 16F. | Change in Registrant’s Certifying Accountant | n/a | ||||
Item 16G. | Corporate Governance | 335 | ||||
Item 16H. | Mine Safety Disclosure | n/a | ||||
Item 16I. | Disclosure Regarding Foreign Jurisdictions that Prevent Inspections | n/a | ||||
Item 16J. | Insider Trading Policies. | 335 | ||||
Item 16K. | Cybersecurity | 336-337 | ||||
Item 17. | Financial Statements | n/a | ||||
Item 18. | Financial Statements | 140-144 | ||||
Item 19. | Exhibits | 366 |
366 | bp Annual Report and Form 20-F 2024 |
Registered office and our worldwide headquarters: BP p.l.c. 1 St James’s Square London SW1Y 4PD UK Tel +44 (0)20 7496 4000 | Our agent in the US: BP America Inc. 501 Westlake Park Boulevard Houston, Texas 77079 US Tel +1 281 366 2000 |
Registered in England and Wales No. 102498. London Stock Exchange symbol ‘BP.’ | |
Memorandum and Articles of Association of BP p.l.c.† | ||
Description of rights of each class of securities registered under Section 12 of the Securities Exchange Act of 1934† | ||
The BP Executive Directors’ Incentive Plan† | ||
Director’s Service Agreement for K Thomson***† | ||
Director’s Service Agreement for M Auchincloss***† | ||
The BP Share Award Plan 2015**† | ||
Subsidiaries (included as Note 37 to the Financial Statements) | ||
Code of Ethics*† | ||
Insider trading policy and procedure | ||
Rule 13a – 14(a) Certifications† | ||
Rule 13a – 14(b) Certifications#† | ||
Consent of Netherland, Sewell & Associates† | ||
Report of Netherland, Sewell & Associates† | ||
Consent Decree**† | ||
Gulf states Settlement Agreement**† | ||
Consent of Deloitte LLP† | ||
Guaranteed Securities† | ||
Executive Compensation Clawback Policy† | ||
Exhibit 101 | Inline XBRL data files | |
Exhibit 104 | Cover page interactive data file (formatted as Inline XBRL and contained in Exhibit 101) |
* | Incorporated by reference to the company’s Annual Report on Form 20-F for the year ended 31 December 2009. | |
** | Incorporated by reference to the company’s Annual Report on Form 20-F for the year ended 31 December 2015. | |
*** | Incorporated by reference to the company’s Annual Report on Form 20-F for the year ended 31 December 2023. | |
# | Furnished only. | |
† | Included only in the annual report filed in the Securities and Exchange Commission EDGAR system. | |
bp Annual Report and Form 20-F 2024 | 367 |
368 | bp Annual Report and Form 20-F 2024 |

 | |
bp.com |
| |
bp.com/annualreport |
| |
bp.com/sustainability |
| |
bp.com/energyoutlook |
| |
bp.com/financial-disclosure |
| |
bp.com/printedcopies |
| |
bpreports@issuerdirect.com |
| |
bpdistributionservices@bp.com |
| |
corporatereporting@bp.com |