■Commitment to complying to our core regulatory obligations: We are building
on our core regulatory reporting in this area through key external indices, such
as the Parker Review and FTSE Women Leaders Review, under which we
disclose the number of the Board, ULE and ULE direct reports who identify as
ethnic minorities.
Employee wellbeing
We support our employees’ purposeful, physical, mental and emotional wellbeing
through a variety of programmes. A localised network of trained Mental Health
Champion volunteers is in place and all employees have access to a confidential
Employee Assistance Programme. We consider flexible working to be another
lever to improve the health and wellbeing of our workforce while managing
business demands. Our approach is a combination of global and local initiatives,
supported by local flexible working policies that embed geography-specific
legislation and cultural working styles.
Examples of wellbeing initiatives we run to support employees are:
■Psychological safety training: We consider psychological safety to be a key
enabler in dialling up a performance culture and a fundamental driver of
wellbeing. We developed training for line managers to build awareness of
psychological safety. In 2024, over 2,500 line managers and 1,900 employees
completed the training. Our psychological safety score remains steady at a
healthy 79% favourability in our annual UniVoice employee survey.
■Healthier U programme: Our global health programme supports our employees’
whole-person health and wellbeing. This data-driven approach offers tailored
interventions and activities aimed at building healthy habits to support employees
in addressing health risks. To date, Healthier U has reached over 50,000
employees across 56 countries.
■Hybrid working: In 2023, we launched our Intentionally Hybrid programme,
which translates the core principles of trust, flexibility, moments that matter
and performance into actions that ensure effective hybrid working, benefiting
both Unilever and its employees. Through this programme, we provide
guidelines and toolkits to help teams agree effective hybrid ways of working
and be intentional about flexible work patterns.
■U-Work: The U-Work model offers flexible employment arrangements, giving
employees the freedom associated with contract roles while still providing the
security and benefits typically linked to permanent roles. This allows us to
access a pool of skilled people familiar with Unilever without the hidden costs
that often come with finding freelance workers. The U-Work model has now
been launched in ten countries, and we plan to expand it during 2025, as well
as introducing other new employment models to meet different needs.
Competitive reward
To attract and retain skilled people, Unilever offers competitive reward packages.
Annually, we conduct a total reward benchmarking exercise in the countries
where we operate. This process involves reviewing our pay and benefits against
external peer groups, primarily consisting of other FMCG, as well as industries
from which we aim to attract talent, such as technology and pharmaceuticals.
This helps to ensure our reward packages remain competitive against the market
for pay, benefits, short-term incentives (annual bonus) and long-term
incentives (share plans).
Learning
Unilever’s strategy relies on a skilled workforce, making continuous upskilling
and reskilling essential for business success and talent risk mitigation. In 2024,
we have continued to focus on developing critical business skills to manage risks
and build a strong talent pipeline, including:
■Customer Strategy & Planning (CSP): Through the CSP Accelerator,
we identified four key skills to better enable CSP teams to succeed – digital
commerce, commercial strategy, data literacy and category growth
management. Upskilling of the CSP teams was provided through a global CSP
knowledge programme. Additionally, top CSP leaders underwent individual
assessments to create personalised development plans based on skills,
performance, experience and leadership. Informed by the collective results of
these assessments, we established the CSP Nexus programme to address
common skill gaps and provide a leadership forum to enable global CSP
leaders to connect and learn from each other.
■For office-based teams, we continued to develop stronger data sets on
employee skills (our ‘skills signal’) by inferring skill levels through successful
completion of flagship learning programmes, skills development discussions
during quarterly check-ins with line managers, and regularly updating skills
profiles. This data helps identify suitable opportunities, shape development
plans, and future-proof the employability of our people.
■To strengthen leadership, we launched two new Accelerator Programmes: the
work level (WL) 2C Accelerator for those with potential to step into WL3 roles
and the General Manager (GM) Accelerator for leaders with potential for
a GM role within the next 18 months. We launched our WL3 coaching
programme, with over 1,600 directors completing a six-month coaching
programme since it started. Our flagship WL4+ programme has engaged 180
leaders since 2019, incorporating real-world business challenges and market
visits to enhance leadership skills
■AI and data skills: In 2024, we invested significantly in AI and data skills, with
nearly 20,000 employees engaging with AI learning programmes.
Bullying and harassment, discrimination, forced labour and
working hours
Unilever's Respect, Dignity and Fair Treatment Code policy sets out our
commitments in relation to bullying and harassment, discrimination, forced labour
and working hours. Any allegations of breaches regarding these commitments
would be treated as a Code breach.
As described in our Governance disclosures, we conduct annual mandatory
Code training for all employees. This regularly includes training on how to
recognise bullying and harassment, discrimination, forced labour and working
hours breaches. We have further mandatory training (such as sexual harassment
training) in a number of countries in which we operate, in response to regulatory
requirements. Training is also made available to employees on subjects such as
how to recognise forced labour, our working hours policy, gender diversity,
unconscious bias, and race and ethnicity inclusion. This is delivered through
various mechanisms, including cross-function ‘learning hours’ and our Degreed
global learning platform.
Fair wages and income
Unilever’s Respect, Dignity and Fair Treatment Code policy codifies that all
employees should be paid a fair wage. In 2016, Unilever committed to pay a
living wage to employees by 2020. By the end of 2020, all direct employees i.e.
those on our global HR system, were paid at or above a certified living wage
level. In 2021, we were awarded our first global accreditation as a living wage
employer from the Fair Wage Network, achieved again in 2024.
To maintain this standard, Unilever annually reviews direct employees’ pay and
benefits against a certified independent living wage calculation. If any employees
are found to be below the living wage, we review and work with local leaders to
correct this. Additionally, Unilever continuously evolves its policies and practices
to promote living wages within the broader business environment.
The Unilever Framework for Fair Compensation 2022, governed by the Chief
People Officer, outlines the company’s position on wages for direct employees
globally. It includes principles such as fair and liveable compensation, market-
based compensation, and non-discrimination in compensation. This framework is
publicly available and applied through various compensation policies and
procedures in the countries where we operate.
We also provide training opportunities through platforms like Degreed to help
employees understand the company’s approach to the living wage, why it is
important and how it is implemented within Unilever.
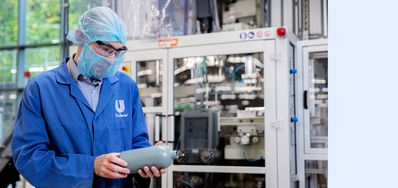
Health
Unilever is committed to providing healthy and safe working conditions for all its
global employees. Health and safety is a key part of our Code and integral to our
way of working. It is deeply embedded in our culture, governance and operating
structures, with accountability at all levels. In our own operations, we aim for
Zero Harm, which underpins everything we do as a business.
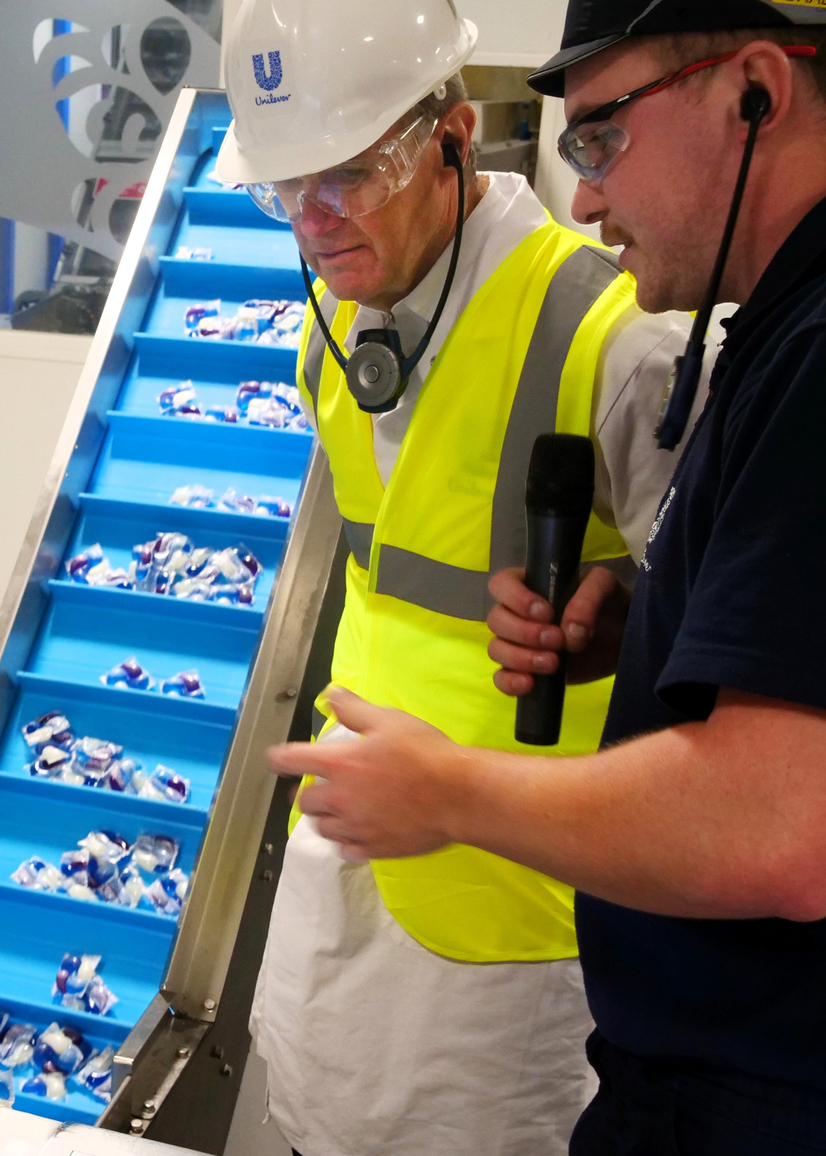
Safety standards and communications
Unilever is committed to continuously improving health and safety performance,
with strong safety leadership being key. In 2024, our Together for Safety
programme continued, inviting our CEO and top leaders to visit our
manufacturing sites with a specific focus on safety. These visits demonstrate our
leadership’s commitment to safety and encourage people to speak up about
unsafe behaviour.
Our ‘Safety First’ culture is embedded through activities like our annual Safety Day,
the Safety Moments programme (building safety into our employees’ day-to-day work
lives), and our annual Global Safety Awards, which celebrate the outstanding work of
our teams across the world. The 2024 Safety Day campaign focused on our safety on
the road and raised awareness for how being tired, in a rush or frustrated impacts our
safety. The campaign reached over 83,000 employees via our internal
communications platform, with approximately 72,000 employees reached through the
CEO’s Safety Day video. In line with our ambition to have impact beyond our borders,
we promoted our safety values on LinkedIn.
Compliance with all applicable legislation and regulations is a mandatory
minimum, with our safety standards aligning with obligations set out in the
international standard for occupational health and safety management, ISO
45001. Safety in our manufacturing sites is critical for us and therefore our safety
guidance is built into our Unilever Manufacturing System. Manufacturing sites
develop individual plans that drive improvements based on their particular risk
profile, such as hazardous substances, and electrical or mechanical risks.
Following any incident or the identification of a hazard or risk, follow-up
communications, lessons learned, and training are also shared with our
employees and third parties.
Freedom of association and collective bargaining
As set out in our approach to human rights section on page 270, our Code reflects our commitments with regard to freedom of association and collective
bargaining and, in practice, we work extensively with trade unions, through joint
working groups and formal consultations, on a multitude of different topics that
impact our employees. Any allegation of a breach of our commitment in this area
would be dealt with as a Code breach.