UNITED STATES
SECURITIES AND EXCHANGE COMMISSION
WASHINGTON, D.C. 20549
FORM
For the quarterly period ended
For the transition period from ____________ to ____________
Commission file number:
(Exact name of registrant as specified in its charter)
| (State or other jurisdiction of incorporation or organization) | (I.R.S. Employer Identification No.) |
| | ||
| (Address of principal executive offices) | (Zip Code) |
(Registrant’s telephone number, including area code)
Securities registered pursuant to Section 12(b) of the Act:
| Title of each class | Trading Symbol(s) | Name of each exchange on which registered | ||
Indicate by check mark whether the registrant
(1) has filed all reports required to be filed by Section 13 or 15(d) of the Securities Exchange Act of 1934 during the preceding 12 months
(or for such shorter period that the registrant was required to file such reports), and (2) has been subject to such filing requirements
for the past 90 days.
Indicate by check mark whether the registrant
has submitted electronically every Interactive Data File required to be submitted pursuant to Rule 405 of Regulation S-T (§232.405
of this chapter) during the preceding 12 months (or for such shorter period that the registrant was required to submit such files).
Indicate by check mark whether the registrant is a large accelerated filer, an accelerated filer, a non-accelerated filer, smaller reporting company, or an emerging growth company. See the definitions of “large accelerated filer,” “accelerated filer,” “smaller reporting company,” and “emerging growth company” in Rule 12b-2 of the Exchange Act.
| Large accelerated filer | ☐ | Accelerated filer | ☐ |
| ☒ | Smaller reporting company | ||
| Emerging growth company |
If an emerging growth company, indicate by check mark if the registrant has elected not to use the extended transition period for complying with any new or revised financial accounting standards provided pursuant to Section 13(a) of the Exchange Act. ☐
Indicate by check mark whether the registrant
is a shell company (as defined in Rule 12b-2 of the Exchange Act). Yes ☐ No
As of August 9, 2022,
PART 1. FINANCIAL INFORMATION
ITEM 1. FINANCIAL STATEMENTS
TD HOLDINGS, INC.
UNAUDITED CONDENSED CONSOLIDATED BALANCE SHEETS
As of June 30, 2022 and December 31, 2021
(Expressed in U.S. dollars, except for the number of shares)
| June 30, | December 31, | |||||||
| 2022 | 2021 | |||||||
| ASSETS | ||||||||
| Current Assets | ||||||||
| Cash and cash equivalents | $ | $ | ||||||
| Loans receivable from third parties | ||||||||
| Accounts receivable | ||||||||
| Prepayments | ||||||||
| Due from related parties | ||||||||
| Other current assets | ||||||||
| Inventories | ||||||||
| Total current assets | ||||||||
| Non-Current Assets | ||||||||
| Plant and equipment, net | ||||||||
| Goodwill | ||||||||
| Intangible assets, net | ||||||||
| Right-of-use assets, net | ||||||||
| Total non-current assets | ||||||||
| Total Assets | $ | $ | ||||||
| LIABILITIES AND EQUITY | ||||||||
| Current Liabilities | ||||||||
| Accounts payable | $ | $ | ||||||
| Bank borrowings | ||||||||
| Third party loans payable | ||||||||
| Contract liabilities | ||||||||
| Due to related parties | ||||||||
| Income tax payable | ||||||||
| Lease liabilities | ||||||||
| Other current liabilities | ||||||||
| Convertible promissory notes | ||||||||
| Total current liabilities | ||||||||
| Non-Current Liabilities | ||||||||
| Deferred tax liabilities | ||||||||
| Lease liabilities | ||||||||
| Total non-current liabilities | ||||||||
| Total liabilities | ||||||||
| Commitments and Contingencies (Note 16) | ||||||||
| Equity | ||||||||
| Common stock (par value $ | ||||||||
| Additional paid-in capital | ||||||||
| Statutory surplus reserve | ||||||||
| Accumulated deficit | ( | ) | ( | ) | ||||
| Accumulated other comprehensive (loss)/income | ( | ) | ||||||
| Total Equity | ||||||||
| Total Liabilities and Equity | $ | $ | ||||||
The accompanying notes are an integral part of the unaudited condensed consolidated financial statements.
1
TD HOLDINGS, INC.
UNAUDITED CONDENSED CONSOLIDATED STATEMENTS
OF OPERATIONS AND
COMPREHENSIVE INCOME (LOSS)
(Expressed in U.S. dollars, except for the number of shares)
| For the Three Months Ended June 30, | For the Six Months Ended June 30, | |||||||||||||||
| 2022 | 2021 | 2022 | 2021 | |||||||||||||
| Revenues | ||||||||||||||||
| - Sales of commodity products – third parties | $ | $ | $ | $ | ||||||||||||
| - Sales of commodity products – related parties | ||||||||||||||||
| - Supply chain management services – third parties | ||||||||||||||||
| Total Revenue | ||||||||||||||||
| Cost of revenue | ||||||||||||||||
| - Commodity product sales-third parties | ( | ) | ( | ) | ( | ) | ( | ) | ||||||||
| - Commodity product sales-related parties | ( | ) | ( | ) | ||||||||||||
| - Supply chain management services – third parties | ( | ) | ( | ) | ( | ) | ||||||||||
| Total cost of revenue | ( | ) | ( | ) | ( | ) | ( | ) | ||||||||
| Gross profit | ||||||||||||||||
| Operating expenses | ||||||||||||||||
| Selling, general, and administrative expenses | ( | ) | ( | ) | ( | ) | ( | ) | ||||||||
| Share-based payment for service | ( | ) | ||||||||||||||
| Total operating expenses | ( | ) | ( | ) | ( | ) | ( | ) | ||||||||
| Other income (expenses), net | ||||||||||||||||
| Interest income | ||||||||||||||||
| Interest expenses | ( | ) | ( | ) | ( | ) | ( | ) | ||||||||
| Amortization of beneficial conversion feature relating to issuance of convertible promissory notes | ( | ) | ( | ) | ||||||||||||
| Other income (expenses), net | ( | ) | ( | ) | ( | ) | ( | ) | ||||||||
| Total other income, net | ||||||||||||||||
| Net income (loss) before income taxes | ( | ) | ||||||||||||||
| Income tax expenses | ( | ) | ( | ) | ( | ) | ( | ) | ||||||||
| Net income (loss) | $ | $ | $ | $ | ( | ) | ||||||||||
| Comprehensive Income (Loss) | ||||||||||||||||
| Net income (loss) | $ | $ | $ | $ | ( | ) | ||||||||||
| Foreign currency translation adjustments | ( | ) | ( | ) | ||||||||||||
| Comprehensive income (loss) | $ | ( | ) | $ | $ | ( | ) | $ | ||||||||
| Income (Loss) per share - basic and diluted | ||||||||||||||||
| Income (loss) per share – Basic | $ | $ | $ | $ | ( | ) | ||||||||||
| Income (loss) per share – Diluted | $ | $ | $ | $ | ( | ) | ||||||||||
| Weighted Average Shares Outstanding-Basic | ||||||||||||||||
| Weighted Average Shares Outstanding- Diluted | ||||||||||||||||
The accompanying notes are an integral part of the unaudited condensed consolidated financial statements.
2
TD HOLDINGS, INC.
UNAUDITED CONDENSED CONSOLIDATED STATEMENTS OF CHANGES IN EQUITY
(Expressed in U.S. dollars, except for the number of shares)
| Common Stock | Additional paid-in | Accumulated | Surplus | Accumulated other comprehensive | Total (Deficit) | |||||||||||||||||||||||
| Shares | Amount | capital | Deficit | Reserve | loss | Equity | ||||||||||||||||||||||
| Balance as of December 31, 2021 | $ | $ | $ | ( | ) | $ | $ | $ | ||||||||||||||||||||
| Issuance of common stocks in connection with private placements | ||||||||||||||||||||||||||||
| Issuance of common stocks pursuant to exercise of convertible promissory notes | ||||||||||||||||||||||||||||
| Beneficial conversion feature relating to issuance of convertible promissory notes | - | - | ||||||||||||||||||||||||||
| Net income | - | - | ||||||||||||||||||||||||||
| Foreign currency translation adjustments | - | ( | ) | ( | ) | |||||||||||||||||||||||
| Balance as of June 30, 2022 | $ | $ | $ | ( | ) | $ | $ | ( | ) | $ | ||||||||||||||||||
| Balance as of December 31, 2020 | $ | $ | $ | ( | ) | $ | $ | $ | ||||||||||||||||||||
| Issuance of common stocks in connection with private placements | ||||||||||||||||||||||||||||
| Issuance of common stocks pursuant to registered direct offering | ||||||||||||||||||||||||||||
| Issuance of common stocks pursuant to exercise of warrants | ( | ) | ||||||||||||||||||||||||||
| Share-based payment for service | - | - | ||||||||||||||||||||||||||
| Net loss | - | ( | ) | ( | ) | |||||||||||||||||||||||
| Foreign currency translation adjustments | - | |||||||||||||||||||||||||||
| Balance as of June 30, 2021 | $ | $ | $ | ( | ) | $ | $ | $ | ||||||||||||||||||||
The accompanying notes are an integral part of the unaudited condensed consolidated financial statements
3
TD HOLDINGS, INC.
UNAUDITED CONDENSED CONSOLIDATED STATEMENTS OF CHANGES IN EQUITY
(Expressed in U.S. dollars, except for the number of shares)
| Common Stock | Additional paid-in | Accumulated | Surplus | Accumulated other comprehensive | Total (Deficit) | |||||||||||||||||||||||
| Shares | Amount | capital | Deficit | Reserve | income (loss) | Equity | ||||||||||||||||||||||
| Balance as of March 31, 2022 | $ | $ | $ | ( | ) | $ | $ | $ | ||||||||||||||||||||
| Issuance of common stocks in connection with private placements | ||||||||||||||||||||||||||||
| Issuance of common stocks pursuant to exercise of convertible promissory notes | ||||||||||||||||||||||||||||
| Beneficial conversion feature relating to issuance of convertible promissory notes | - | - | - | |||||||||||||||||||||||||
| Net income | - | |||||||||||||||||||||||||||
| Foreign currency translation adjustments | - | ( | ) | ( | ) | |||||||||||||||||||||||
| Balance as of June 30, 2022 | $ | $ | $ | ( | ) | $ | $ | ( | ) | $ | ||||||||||||||||||
| Balance as of March 31, 2021 (Restated, See Note 2) | $ | $ | $ | ( | ) | $ | $ | $ | ||||||||||||||||||||
| Issuance of common stocks in connection with exercise of warrants | - | |||||||||||||||||||||||||||
| Net Income | - | - | - | |||||||||||||||||||||||||
| Foreign currency translation adjustments | - | - | - | - | ||||||||||||||||||||||||
| Balance as of June 30, 2021 | $ | $ | $ | ( | ) | $ | $ | |||||||||||||||||||||
The accompanying notes are an integral part of the unaudited condensed consolidated financial statements.
4
TD HOLDINGS, INC.
UNAUDITED CONDENSED CONSOLIDATED STATEMENTS OF CASH FLOWS
(Expressed in U.S. dollar)
| For the Six Months Ended June 30, | ||||||||
| 2022 | 2021 | |||||||
| Cash Flows from Operating Activities: | ||||||||
| Net income(loss) | $ | $ | ( | ) | ||||
| Adjustments to reconcile net income (loss) to net cash used in operating activities: | ||||||||
| Amortization of intangible assets | ||||||||
| Depreciation of plant and equipment | ||||||||
| Amortization of discount on convertible promissory notes | ||||||||
| Amortization of right of use assets | ||||||||
| Amortization of beneficial conversion feature relating to issuance of convertible promissory notes | ||||||||
| Monitoring fee relating to convertible promissory notes | ||||||||
| Share-based payment for service | ||||||||
| Standstill fee relating to convertible promissory notes | ||||||||
| Interest expense for convertible promissory notes | ||||||||
| Deferred tax liabilities | ( | ) | ( | ) | ||||
| Changes in operating assets and liabilities: | ||||||||
| Other current assets | ||||||||
| Escrow account receivable | ( | ) | ( | ) | ||||
| Inventories | ( | ) | ( | ) | ||||
| Prepayments | ( | ) | ( | ) | ||||
| Contract liabilities | ( | ) | ||||||
| Accounts payable | ( | ) | ||||||
| Due to related parties | ( | ) | ( | ) | ||||
| Due from third parties | ( | ) | ||||||
| Due from related parties | ( | ) | ( | ) | ||||
| Income tax payable | ||||||||
| Other current liabilities | ( | ) | ||||||
| Lease liabilities | ( | ) | ||||||
| Due to third party loans payable | ||||||||
| Net cash provided by (used in) operating activities | ( | ) | ||||||
| Cash Flows from Investing Activities: | ||||||||
| Purchases of intangible assets | ( | ) | ||||||
| Purchases of plant and equipment | ( | ) | ( | ) | ||||
| Purchases of operating lease assets | ( | ) | ||||||
| Final payment of acquisition of a subsidiary | ( | ) | ||||||
| Payment made on loan to related parties | ( | ) | ||||||
| Payment made on loans to third parties | ( | ) | ( | ) | ||||
| Collection of loans from related parties | ||||||||
| Collection of loans from third parties | ||||||||
| Investments in other investing activities | ( | ) | ||||||
| Net cash used in investing activities | ( | ) | ( | ) | ||||
| Cash Flows from Financing Activities: | ||||||||
| Proceeds from issuance of common stock under ATM transaction | ||||||||
| Proceeds from issuance of common stock under private placement transactions | ||||||||
| Proceeds from exercise of warrants | ||||||||
| Proceeds from issuance of convertible promissory notes | ||||||||
| Proceeds from borrowings from third parties | ||||||||
| Repayments made on loans to related parties | ( | ) | ||||||
| Payments made on loans to third parties | ( | ) | ||||||
| Net cash provided by financing activities | ||||||||
| Effect of exchange rate changes on cash and cash equivalents | ( | ) | ||||||
| Net increase/(decrease) in cash and cash equivalents | ( | ) | ||||||
| Cash at beginning of period | ||||||||
| Cash at end of period | $ | $ | ||||||
| Supplemental Cash Flow Information | ||||||||
| Cash paid for interest expense | $ | $ | ||||||
| Cash paid for income tax | $ | $ | ||||||
| Supplemental disclosure of Non-cash investing and financing activities | ||||||||
| Right-of-use assets obtained in exchange for operating lease obligations | $ | $ | ||||||
| Issuance of common stocks in connection with conversion of convertible promissory notes | $ | $ | ||||||
| Issuance of common stocks in connection with warrant cashless exercise in March 2021 | $ | $ | ||||||
The accompanying notes are an integral part of the unaudited condensed consolidated financial statements.
5
TD HOLDINGS, INC.
NOTES TO CONSOLIDATED FINANCIAL STATEMENTS(UNAUDITED)
| 1. | ORGANIZATION AND BUSINESS DESCRIPTION |
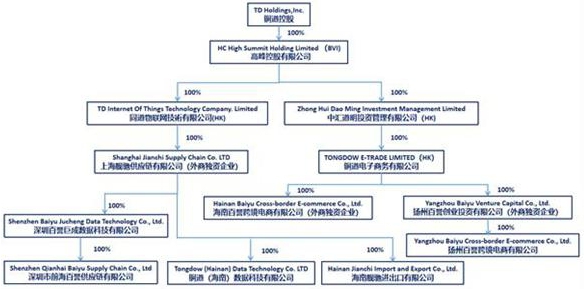
The Company conducts business through Shanghai Jianchi Supply chain Co., Ltd (“Shanghai Jianchi”), a subsidiary of the Company, which is engaged in the commodity trading business and providing supply chain management services to customers in the PRC. Supply chain management services consist of loan recommendation services and commodity product distribution services. The Company incorporated Hainan Jianchi Import and Export Co., Ltd, a subsidiary of Shanghai Jianchi, Hainan Baiyu Cross-border e-commerce Limited, a subsidiary of Tongdow HK, and Yangzhou Baiyu Cross-border e-commerce Limited, a subsidiary of Yangzhou Baiyu Venture Capital Co., Ltd during the six months ended June 30, 2022.
| Name | Background | Ownership | ||
6
The following diagram illustrates our corporate structure as of June 30, 2022.
| 2. | SUMMARY OF SIGNIFICANT ACCOUNTING POLICIES |
| (a) | Basis of presentation |
The accompanying unaudited condensed consolidated financial statements have been prepared in conformity with accounting principles generally accepted in the United States of America (“U.S. GAAP”). All transactions and balances among the Company and its subsidiaries have been eliminated upon consolidation.
The unaudited interim condensed consolidated financial information as of June 30, 2022 and for the six months ended June 30, 2022 and 2021 have been prepared, pursuant to the rules and regulations of the Securities and Exchange Commission (the “SEC”). Certain information and footnote disclosures, which are normally included in annual condensed consolidated financial statements prepared in accordance with U.S. GAAP, have been omitted pursuant to those rules and regulations. The unaudited interim condensed consolidated financial information should be read in conjunction with the consolidated financial statements and the notes thereto, included in the Company’s Form 10-K for the fiscal year ended December 31, 2021 previously filed with the SEC on March 16, 2022.
In the opinion of management, all adjustments (which include normal recurring adjustments) are necessary to present a fair statement of the Company’s unaudited condensed consolidated financial position as of June 30, 2022 and its unaudited condensed consolidated results of operations for the three months and six months ended June 30, 2022 and 2021, and its unaudited condensed consolidated cash flows for the six months ended June 30, 2022 and 2021, as applicable, have been made. The interim results of operations are not necessarily indicative of the operating results for the fiscal year or any future periods.
7
Error Correction
On March 4, 2021, the Company issued
The Company applied Black-Scholes model and determined
the fair value of the warrants to be $
The Company’s quarterly financial statements ended March 31, 2021 contained an error related to above share-based payment for service. Management has determined such error was qualitatively immaterial and the correction was made during this quarter. No restatement to previously issued interim financial statements was deemed necessary.
The following table illustrates the correction of the error had it been shown in the statement of operations on March 31, 2021 in the interim financial statement in Form 10-Q filing on June 25, 2021:
| Three months ended March 31, 2021 | ||||
| Income from operations as reported | $ | |||
| Effect on share-based payment for service | ( | ) | ||
| Loss from operations as revised | $ | ( | ) | |
| Three months ended March 31, 2021 | ||||
| Net income as reported | $ | |||
| Effect on share-based payment for service | ( | ) | ||
| Net loss as revised | $ | ( | ) | |
| Three months ended March 31, 2021 | ||||
| EPS as reported | $ | |||
| Effect on EPS | ( | ) | ||
| EPS as revised | $ | ( | ) | |
The Company included $
Use of estimates
The preparation of consolidated financial statements in conformity with GAAP requires management to make estimates and assumptions that affect the reported amounts of assets and liabilities, disclosure of contingent assets and liabilities at the date of the financial statements and the reported amounts of revenue and expenses during the reporting period. Actual results could differ from those estimates. On an ongoing basis, management reviews these estimates using the currently available information. Changes in facts and circumstances may cause the Company to revise its estimates. Significant accounting estimates reflected in the financial statements include: (i) useful lives and residual value of long-lived assets; (ii) the impairment of long-lived assets and investments; (iii) the valuation allowance of deferred tax assets; (iv) estimates of allowance for doubtful accounts, including loans receivable from third parties and related parties, (v) valuation of Inventory, and (vi) contingencies and litigation.
8
Foreign currency
The Company’s financial information is presented in U.S. dollars (“USD”). The functional currency of the Company is the Chinese Yuan Renminbi (“RMB”), the currency of PRC. Any transactions which are denominated in currencies other than RMB are translated into RMB at the exchange rate quoted by the People’s Bank of China prevailing at the dates of the transactions, and exchange gains and losses are included in the statements of operations as foreign currency transaction gain or loss. The consolidated financial statements of the Company have been translated into U.S. dollars in accordance with ASC 830, Foreign Currency Matters. The financial information is first prepared in RMB and then translated into U.S. dollars at period-end exchange rates for assets and liabilities and average exchange rates for revenue and expenses. Capital accounts are translated at their historical exchange rates when the capital transactions occurred. The effects of foreign currency translation adjustments are included as a component of accumulated other comprehensive income (loss) in stockholders’ equity. Cash flows from the Company’s operations are calculated based upon the local currencies using the average translation rate. As a result, amounts related to assets and liabilities reported on the statements of cash flows will not necessarily agree with changes in the corresponding balances on the balance sheets.
| (b) | Convertible promissory notes |
Convertible promissory notes are recognized initially at fair value, net of upfront fees, debt discounts or premiums, debt issuance costs and other incidental fees. Upfront fees, debt discounts or premiums, debt issuance costs and other incidental fees are recorded as a reduction of the proceeds received and the related accretion is recorded as interest expense in the consolidated income statements over the estimated term of the facilities using the effective interest method.
| (c) | Beneficial conversion feature |
The Company evaluates the conversion feature to determine whether it was beneficial as described in ASC 470-20. The intrinsic value of a beneficial conversion feature inherent to a convertible note payable, which is not bifurcated and accounted for separately from the convertible promissory notes payable and may not be settled in cash upon conversion, is treated as a discount to the convertible promissory notes payable. This discount is amortized over the period from the date of issuance to the date the notes are due using the effective interest method. If the notes payable are retired prior to the end of their contractual term, the unamortized discount is expensed in the period of retirement to interest expense. In general, the beneficial conversion feature is measured by comparing the effective conversion price, after considering the relative fair value of detachable instruments included in the financing transaction, if any, to the fair value of the shares of common stock at the commitment date to be received upon conversion.
9
| (d) | Inventory |
Inventories of the Company are bulk commodities products, such as precious metals. Inventories are stated at the lower of cost or net realizable value. Costs of inventory are determined using the first-in first-out method. Adjustments to reduce the cost of inventories are made, if required, for decreases in sales prices, obsolescence or similar reductions in the estimated net realizable value.
We keep inventory for our direct sales model. Our inventory control policy requires us to monitor our inventory level and to manage obsolete inventory. Risk is passed to our customers (or to delivery service providers) upon the delivery of commodities to our customers. For a substantial majority of precious metal sold through our network, the whole transaction process takes from a few hours to a few days, thus our inventory risk is limited. For a small portion of our transactions under direct sales model, we hold inventories for repeating customers with relatively stable demands of large quantity based on our transaction data. We analyze historical sales data and days in inventory to establish inventory management plans. We monitor our real-time inventory volume and adjust our inventory management plans based on factors such as fluctuations in supply and prices, seasonality, and sales of a particular product.
| (e) | Recent accounting pronouncement |
In June 2016, the FASB issued ASU No. 2016-13 (“ASU 2016-13”) “Financial Instruments - Credit Losses” (“ASC 326”): Measurement of Credit Losses on Financial Instruments” which requires the measurement and recognition of expected credit losses for financial assets held at amortized cost. ASU 2016-13 replaces the existing incurred loss impairment model with an expected loss model which requires the use of forward-looking information to calculate credit loss estimates. It also eliminates the concept of other-than-temporary impairment and requires credit losses related to available-for-sale debt securities to be recorded through an allowance for credit losses rather than as a reduction in the amortized cost basis of the securities. These changes will result in earlier recognition of credit losses. In November 2019, the FASB issued ASU 2019-10 “Financial Instruments – Credit Losses (Topic 326), Derivatives and Hedging (Topic 815), and Leases (Topic 842)” which defers the effective date of ASU 2016-13 to fiscal years beginning after December 15, 2022, including interim periods within those fiscal years, for public entities which meet the definition of a smaller reporting company. The Company will adopt ASU 2016-13 effective January 1, 2023. Management is currently evaluating the effect of the adoption of ASU 2016-13 on the consolidated financial statements. The effect will largely depend on the composition and credit quality of our investment portfolio and the economic conditions at the time of adoption.
In January 2017, the FASB issued ASU 2017-04, “Intangibles — Goodwill and Other (Topic 350): Simplifying the Test for Goodwill Impairment,” which simplifies how an entity is required to test goodwill for impairment by eliminating step two from the goodwill impairment test. Step two of the goodwill impairment test measures a goodwill impairment loss by comparing the implied fair value of a reporting unit’s goodwill with its carrying amount. As amended by ASU 2019-10, annual or interim goodwill impairment tests are performed in fiscal years beginning after December 15, 2022. We do not expect that the adoption of this guidance will have a material impact on our financial position, results of operations and cash flows.
In August 2020, the FASB issued ASU No. 2020-06 (“ASU 2020-06”) “Debt—Debt with Conversion and Other Options (Subtopic 470-20) and Derivatives and Hedging—Contracts in Entity’s Own Equity (Subtopic 815-40): Accounting for Convertible Instruments and Contracts in an Entity’s Own Equity.” ASU 2020-06 will simplify the accounting for convertible instruments by reducing the number of accounting models for convertible debt instruments and convertible preferred stock. For public business entities, the amendments in ASU 2020-06 are effective for public entities which meet the definition of a smaller reporting company and are effective for fiscal years, and interim periods within those fiscal years, beginning after December 15, 2023. The Company will adopt ASU 2020-06 effective January 1, 2024. Management is currently evaluating the effect of the adoption of ASU 2020-06 on the consolidated financial statements. The effect will largely depend on the composition and terms of the financial instruments at the time of adoption.
Other accounting standards that have been issued or proposed by FASB that do not require adoption until a future date are not expected to have a material impact on the consolidated financial statements upon adoption. The Company does not discuss recent pronouncements that are not anticipated to have an impact on or are unrelated to its consolidated financial condition, results of operations, cash flows or disclosures.
| 3. | LOANS RECEIVABLE FROM THIRD PARTIES |
| June 30, 2022 | December 31, 2021 | |||||||
| Loans receivable from third parties | $ | $ | ||||||
As of June 30, 2022, the Company has 13 loan agreements
compared with ten loan agreements on December 31, 2021. The Company provided loans aggregating $
Interest income of $
As of June 30, 2022 and December 31, 2021 there was no allowance recorded as the Company considers all of the loans receivable fully collectible.
10
| 4. | PLANT AND EQUIPMENT, NET |
| June 30, 2022 | December 31, 2021 | |||||||
| Cost: | ||||||||
| Office equipment | $ | $ | ||||||
| Accumulated depreciation: | ||||||||
| Office equipment | $ | ( | ) | $ | ( | ) | ||
| Plant and equipment, net | $ | $ | ||||||
Depreciation expense was $
| 5. | INTANGIBLE ASSETS |
| June 30, 2022 | December 31, 2021 | |||||||
| Customer relationships | $ | $ | ||||||
| Software copyright | ||||||||
| Total | ||||||||
| Less: accumulative amortization | ( | ) | ( | ) | ||||
| Intangible assets, net | $ | $ | ||||||
The Company’s intangible assets consist
of customer relationships, which are recorded in connection with acquisitions at their fair value, and software copyright which are purchased
from the related party Yunfeihu. Intangible assets with estimable lives are amortized, generally on a straight-line basis, over their
respective estimated useful lives of
For the six months ended June 30, 2022, the Company
amortized $
The estimated amortization expense for these intangible assets in the next five years and thereafter is as follows:
| Period ending June 30, 2022: | Amount | |||
| current year | $ | |||
| 2023 | ||||
| 2024 | ||||
| 2025 | ||||
| 2026 | ||||
| Thereafter | ||||
| Total: | $ | |||
| 6. | DERIVATIVE FINANCIAL INSTRUMENTS |
Derivative Instruments Not Designated As Hedge Accounting Treatment
On April 23, 2021 and May 26, 2022, Hainan
Jianchi Import and Export Co., Ltd, a subsidiary of the Company, entered into a contract with CITIC Futures Co., Ltd and Guoyuan Futures
Co., Ltd to deal with futures business to hedging sales and purchase commodity products market price risks respectively. The two futures
contracts are to trade non-ferrous metal products such as aluminum ingots, copper, silver, and gold. The contract is a derivative instrument
for accounting purposes. The quantities of product in these agreements are offset and are priced at prevailing market prices. The contract
does not qualify for hedge accounting treatment. The Company recognized other current assets on fair value of $
11
| 7. | GOODWILL |
The goodwill associated with the Baiyu Acquisition was initially recognized at the acquisition closing date in October 2020.
Based on an assessment of the qualitative factors,
management determined that it is more likely than not that the fair value of the reporting unit is in excess of its carrying amount.
Therefore, management concluded that it was not necessary to proceed with the two-step goodwill impairment test. At June 30, 2022 and
December 31, 2021, goodwill was $
| 8. | BANK BORROWINGS |
Bank borrowings represent the amounts due to Baosheng County Bank that are due within one year. As of June 30, 2022 and December 31, 2021, bank loans consisted of the following:
| June 30, 2022 | December 31, 2021 | |||||||
| Short-term bank loans: | ||||||||
| Loan from Baosheng County Bank | $ | $ | ||||||
On August 7, 2020, Qianhai Baiyu entered into
three loan agreements with Baosheng County Bank to borrow a total amount of RMB
In August 2021, Qianhai Baiyu entered into another
two loan agreements with Baosheng County Bank to borrow a total amount of RMB
| 9. | LEASES |
The Company determines whether a contract is or contains a lease at the inception of the contract and whether that lease meets the classification criteria of finance or operating lease. When available, the Company uses the rate implicit in the lease to discount lease payments to present value; however, most of the Company’s leases do not provide a readily determinable implicit rate. Therefore, the Company discounts lease payments based on an estimate of its incremental borrowing rate.
The Company’s lease agreements do not contain any material residual value guarantees or material restrictive covenants.
Supplemental consolidated balance sheet information related to the operating lease was as follows:
| June 30, 2022 | December 31, 2021 | |||||||
| Right-of-use lease assets, net | $ | $ | ||||||
| Lease Liabilities-current | $ | $ | ||||||
| Lease liabilities-non current | ||||||||
| Total | $ | $ | ||||||
12
The weighted average remaining lease terms and discount rates for the operating lease were as follows as of June 30, 2022:
| Remaining lease term and discount rate: | ||||
| Weighted average remaining lease term (years) | | |||
| Weighted average discount rate | | % |
For the six months ended June 30, 2022 and
2021, the Company charged total amortization of right-of-use assets of $
The following is a schedule, by fiscal quarter, of maturities of lease liabilities as of June 30, 2022:
| Period ending June 30, 2022: | Amount | |||
| current year | $ | |||
| 2023 | ||||
| 2024 | ||||
| Total lease payments | ||||
| Less: imputed interest | ||||
| Present value of lease liabilities | $ | |||
| 10. | OTHER CURRENT LIABILITIES |
| June 30, 2022 | December 31, 2021 | |||||||
| Accrued payroll and benefit | $ | $ | ||||||
| Other tax payable | ||||||||
| Others | ||||||||
| Total | $ | $ | ||||||
| 11. | CONVERTIBLE PROMISSORY NOTES |
| June 30, 2022 | December 31, 2021 | |||||||
| Convertible promissory notes – principal | $ | $ | ||||||
| Convertible promissory notes – discount | ( | ) | ( | ) | ||||
| Convertible promissory notes – interest | ||||||||
| Convertible promissory notes, net | $ | $ | ||||||
On March 4, 2021, the Company entered into a securities
purchase agreement with Streeterville Capital, LLC, pursuant to which the Company issued an unsecured promissory note in the original
principal amount of $3,320,000, convertible into shares of common stock, for proceeds of $
On October 4, 2021, the Company entered into
a securities purchase agreement with Atlas Sciences, LLC, a Utah limited liability company, pursuant to which the Company issued the
investor an unsecured promissory note on October 4, 2021 in the original principal amount of $
13
On May 6, 2022, the Company entered into a securities
purchase agreement with Streeterville Capital, LLC, pursuant to which the Company issued an unsecured promissory note in the original
principal amount of $
The above two unsettled convertible
promissory notes, issued on October 4, 2021 and May 6, 2022, has a maturity date of 12 months
with an interest rate of
For the above two unsettled convertible
promissory notes, upon evaluation, the Company determined that the Agreements contained embedded beneficial conversion features which
met the definition of Debt with Conversion and Other Options covered under the Accounting Standards Codification topic 470 (“ASC
470”). According to ASC 470, an embedded beneficial conversion feature present in a convertible instrument shall be recognized
separately at issuance by allocating a portion of the proceeds equal to the intrinsic value of that feature to additional paid-in capital.
| 12. | CAPITAL TRANSACTIONS |
Common stock issued in private placements
On May 27, 2022,
Common stock issued pursuant to the conversion of convertible promissory notes
The Company
settled convertible promissory note of $
14
Warrants
A summary of warrants activity for the six months ended June 30, 2022 was as follows:
| Number of shares | Weighted average life | Weighted average exercise price | Intrinsic Value | |||||||||||||
| Balance of warrants outstanding and exercisable as of December 31, 2021 | $ | |||||||||||||||
| Granted | ||||||||||||||||
| Exercised | ||||||||||||||||
| Balance of warrants outstanding and exercisable as of June 30, 2022 | $ | |||||||||||||||
As of December
31, 2021, the Company had
In connection
with
The Warrants ended on December 31, 2021 are subject to anti-dilution provisions to reflect stock dividends and splits or other similar transactions, but not as a result of future securities offerings at lower prices. The warrants did not meet the definition of liabilities or derivatives, and as such they are classified as equity.
| 13. | EARNINGS (LOSS) PER SHARE |
Basic earnings (loss) per share is computed by
dividing the net profit or loss by the weighted average number of common shares outstanding during the period. As of June 30, 2022, the
principal amount and interest expense of convertible promissory notes are $
The number of warrants is excluded from the computation as the anti-dilutive effect.
The following table sets forth the computation of basic and diluted loss per common share for the six months ended June 30, 2022 and 2021 respectively:
| For the Six Months Ended June 30, | ||||||||
| 2022 | 2021 | |||||||
| Net income(loss) | $ | $ | ( | ) | ||||
| Weighted Average Shares Outstanding-Basic | ||||||||
| Weighted Average Shares Outstanding- Diluted | ||||||||
| Net loss per share - basic and diluted | ||||||||
| Earnings (loss) per share - basic | $ | $ | ( | ) | ||||
| Earnings (loss) per share - diluted | $ | $ | ( | ) | ||||
15
| For the Three Months Ended June 30, | |||||||
| 2022 | 2021 | ||||||
| Net income | $ | $ | |||||
| Weighted Average Shares Outstanding-Basic | |||||||
| Weighted Average Shares Outstanding-Diluted | |||||||
| Net loss per share - basic and diluted | |||||||
| Earnings (loss) per share - basic | $ | $ | |||||
| Earnings (loss) per share - diluted | $ | $ | |||||
| 14. | INCOME TAXES |
The Enterprise Income Tax Law of the People’s
Republic of China (“PRC tax law”), which was effective on January 1, 2008, stipulates those domestic enterprises and foreign-invested
enterprises are subject to a uniform tax rate of
The Company evaluates the level of authority for each uncertain tax
position (including the potential application of interest and penalties) based on the technical merits, and measures the unrecognized
benefits associated with the tax positions. For the six months ended June 30, 2022, the Company had no unrecognized tax benefits. Due
to uncertainties surrounding future utilization, the Company estimates there will not be sufficient future income to realize the deferred
tax assets for certain subsidiaries and a VIE. As of June 30, 2022 and December 31, 2021, the Company had deferred tax assets of $
The Company does not anticipate any significant increase to its liability for unrecognized tax benefit within the next 12 months. The Company will classify interest and penalties related to income tax matters, if any, in income tax expense.
For the six months ended June 30, 2022 and 2021,
the Company had current income tax expenses of $
The Company accounts for uncertainty in income
taxes using a two-step approach to recognizing and measuring uncertain tax positions. The first step is to evaluate the tax position
for recognition by determining if the weight of available evidence indicates that it is more likely than not that the position will be
sustained on audit, including resolution of related appeals or litigation processes, if any.
16
| 15. | RELATED PARTY TRANSACTIONS AND BALANCES |
| 1) | Nature of relationships with related parties |
| Name | Relationship with the Company | |
(“Qianhai Baiyu”) |
||
(“Guangzhou Chengji”) |
||
(“Yunfeihu”) |
||
(“TD International Trade”) |
||
(“Beijing TD”) |
||
(“Shanghai TD”) |
||
(“Guangdong TD”) |
||
(“Yangzhou TD”) |
||
(“Zhejiang TD”) |
||
17
| 2) | Balances with related parties |
| - | Due from related parties |
As of June 30, 2022 and December 31, 2021, the balances with related parties were as follows:
| June 30, 2022 | December 31, 2021 | |||||||
| Yunfeihu (i) | $ | $ | ||||||
| Total due from related parties | $ | $ | ||||||
| (i) | The balance due from Yunfeihu represented loans provided to the related party is unsecured. The principal and interest of Yunfeihu has be due in May 2022, with an interest rate of |
| - | Due to related parties |
| June 30, 2022 | December 31, 2021 | |||||||
| Other related parties | $ | $ | ||||||
| Total due to related parties | $ | - | $ | |||||
18
| 3) | Transactions with related parties |
For the three and six months ended June 30, 2022, the Company generated revenues from below related party customers:
| For the Three Months Ended June 30, | For the Six Months Ended June 30, | |||||||||||||||
| 2022 | 2021 | 2022 | 2021 | |||||||||||||
| Revenue from sales of commodity products | ||||||||||||||||
| Yunfeihu | $ | $ | $ | $ | ||||||||||||
| Yangzhou TD | ||||||||||||||||
| Total revenues generated from related parties | $ | - | $ | $ | - | $ | ||||||||||
| 4) | Purchases from a related party |
For the six months ended June 30, 2022 and 2021, the Company purchased commodity products from below related party vendors:
| For the Three Months Ended June 30, | For the Six Months Ended June 30, | |||||||||||||||
| 2022 | 2021 | 2022 | 2021 | |||||||||||||
| Purchase of commodity products | ||||||||||||||||
| Yunfeihu | $ | $ | $ | $ | ||||||||||||
| Zhejiang TD | ||||||||||||||||
| Hainan TD | ||||||||||||||||
| TD International Trade | ||||||||||||||||
| Yangzhou TD | ||||||||||||||||
Total purchase of commodity products | $ | - | $ | - | $ | - | $ | |||||||||
For the three months and six months ended June
30, 2021, the Company purchased copyright software of $
| 16. | COMMITMENTS AND CONTINGENCIES |
| 1) | Commitments |
a Non-cancellable operating leases
The following table sets forth our contractual obligations as of June 30, 2022:
| Payment due by June 30 | ||||||||||||||||
| Total | 2023 | 2024 | 2025 | |||||||||||||
| Operating lease commitments for property management expenses under lease agreement | $ | $ | $ | $ | ||||||||||||
19
| 2) | Contingencies |
| a | 2020 Court Matter with Harrison Fund |
On April 6, 2020,
Due to the uncertainty arising from this pending legal proceeding, a full impairment has been applied against the Company’s investment in financial products.
| 17. | Risks and uncertainties |
| (1) | Credit risk |
Assets
that potentially subject the Company to a significant concentration of credit risk primarily consist of cash and cash equivalents and
trade receivables with its customers. The maximum exposure of such assets to credit risk is their carrying amount as at the balance sheet
dates. As of June 30, 2022, approximately $
The Company’s operations are carried out in Mainland China. Accordingly, the Company’s business, financial condition and results of operations may be influenced by the political, economic and legal environments in the PRC as well as by the general state of the PRC’s economy. In addition, the Company’s business may be influenced by changes in governmental policies with respect to laws and regulations, anti-inflationary measures, currency conversion and remittance abroad, rates and methods of taxation, and the extraction of mining resources, among other factors.
| (2) | Liquidity risk |
The Company is also exposed to liquidity risk which is the risk that it is unable to provide sufficient capital resources and liquidity to meet its commitments and business needs. Liquidity risk is controlled by the application of financial position analysis and monitoring procedures. When necessary, the Company will turn to other financial institutions and the owners to obtain short-term funding to meet the liquidity shortage.
The Company
is required to meet specified financial requirements to maintain its listing on the Nasdaq Capital Market. The minimum bid price per
share of its common shares has been below $
| (3) | Foreign currency risk |
The Company’s financial information is presented in USD. The functional currency of the Company is RMB, the currency of the PRC. Any transactions which are denominated in currencies other than RMB are translated into RMB at the exchange rate quoted by the People’s Bank of China prevailing at the dates of the transactions, and exchange gains and losses are included in the statements of operations as foreign currency transaction gain or loss. The consolidated financial statements of the Company have been translated into U.S. dollars in accordance with ASC 830, “Foreign Currency Matters”. The financial information is first prepared in RMB and then is translated into U.S. dollars at period- end exchange rates for assets and liabilities and average exchange rates for revenue and expenses. Capital accounts are translated at their historical exchange rates when the capital transactions occurred. The effects of foreign currency translation adjustments are included as a component of accumulated other comprehensive income in stockholder’s equity. Cash flows from the Company’s operations are calculated based upon the local currencies using the average translation rate. As a result, amounts related to assets and liabilities reported on the statements of cash flows will not necessarily agree with changes in the corresponding balances on the balance sheets. The value of RMB is subject to changes in central government policies and international economic and political developments affecting supply and demand in the China Foreign Exchange Trading System market. Where there is a significant change in the value of RMB, the gains and losses resulting from the translation of financial statements of a foreign subsidiary will be significantly affected.
20
| (4) | Economic and political risks |
The Company’s operations are conducted in the PRC. Accordingly, the Company’s business, financial condition and results of operation may be influenced by the political, economic and legal environment in the PRC and the general state of the PRC economy. In light of the uncertain and rapidly evolving situation relating to the spread of COVID-19, we have taken temporary precautionary measures intended to help minimize the risk of the virus to our employees, our customers, and the communities in which we participate, which could negatively impact our business. To this end, we are evaluating alternative working arrangements, including requiring all employees to work remotely, and we have suspended all non-essential travel for our employees and limiting in-person work-related meetings.
In addition, with the extended Chinese business shutdowns that resulted from the outbreak of COVID-19, we may experience delays or the inability to service our customers on a timely basis in our commodities trading business. The disruptions to our supply chain and business operations, or to our suppliers’ or customers’ supply chains and business operations, could include disruptions from the interruptions in the supply of commodities, personnel absences or delivery and storage of commodities, any of which could have adverse ripple effects on our commodities trading business. If we need to close any of our facilities or a critical number of our employees become too ill to work, our ability to provide our products and services to our customers could be materially adversely affected in a rapid manner. Similarly, if our customers experience adverse business consequences due to COVID-19, or any other pandemic, demand for our products and services could also be materially adversely affected in a rapid manner. Global health concerns, such as COVID-19, could also result in social, economic, and labor instability in the localities in which we or our suppliers and customers operate within China.
While the potential economic impact brought by and the duration of COVID-19 may be difficult to assess or predict, a widespread pandemic could result in significant disruption of global financial markets, reducing our ability to access capital, which could in the future negatively affect our liquidity. In addition, a recession or market correction resulting from the spread of COVID-19 could materially affect our business and the value of our common stock. While it is too early to tell whether COVID-19 will have a material effect on our business over time, we continue to monitor the situation as it unfolds. The extent to which COVID-19 affects our results will depend on many factors and future developments, including new information about COVID-19 and any new government regulations which may emerge to contain the virus, among others.
| (5) | Risks related to industry |
The Company sells precious products to customers through our industrial relationship. Sales contracts are entered into with each individual customer. The Company is the principal under the precious metal direct sales model as the Company controls the products with the ability to direct the use of, and obtain substantially all the remaining benefits from the precious metal products before they are sold to its customers. The Company has a single performance obligation to sell metal products to the buyers. Revenue for precious metal trading under direct sales model is recognized at a point in time when the single performance obligation is satisfied when the products are delivered to the customer. We are under the risk of economic environment in general and specific to the precious metal industry and to China as well as changes to the existing governmental regulations.
Commodity trading in China is subject to seasonal fluctuations, which may cause our revenues to fluctuate from quarter to quarter. We generally experience less user traffic and purchase orders during national holidays in China, particularly during the Chinese New Year holiday season in the first quarter of each year. Consequently, the first quarter of each calendar year generally contributes the smallest portion of our annual revenues. Furthermore, as we are substantially dependent on sales of precious metals, our quarterly revenues and results of operations are likely to be affected by price fluctuation under macroeconomic circumstances these years.
As our revenues have grown rapidly in recent years, these factors are difficult to discern based on our historical results, which, therefore, should not be relied on to predict our future performance. Our financial condition and results of operations for future periods may continue to fluctuate. As a result, the trading price of our stock may fluctuate from time to time due to seasonality.
| 18. | SUBSEQUENT EVENTS |
The Company settled convertible promissory notes of $125,000 on July 7, 2022, $125,000 on July 18, 2022, $125,000 on July 26, 2022 and $125,000 on August 4, 2022, respectively, and issued 678,463, 628,014, 625,500 and 625,500 shares of the Company’s common stock on July 7, 2022, July 19, 2022, July 26, 2022 and August 5, 2022 respectively.
On July 22, the Company’s Board of Directors approved the holding of the 2022 Annual Meeting of Stockholders of the Company at 25th Floor, Block C, Tairan Building, No. 31 Tairan 8th Road, Futian District, Shenzhen, Guangdong, PRC 518000, on August 11, 2022, at 9:30 am EST, for stockholders to consider and vote on certain proposals, including, (i) electing Renmei Ouyang, Tianshi (Stanley) Yang, Xiangjun Wang, Heung Ming (Henry) Wong and Donghong Xiong to serve on the Company’s Board until the next annual stockholders meeting and until their successors are duly elected and qualified, (ii) ratifying the selection of Audit Alliance LLP as the Company’s independent registered public accounting firm for the fiscal year ending December 31, 2022, (iii) approving and adopting certain amendments to the Company’s Certificate of Incorporation (the “Charter Amendment”) to effect a reverse stock split of our issued and outstanding common stock (“Common Stock”) at a ratio of one-for-five to one-for-ten immediately following the reverse split (the “Reverse Split”) at any time prior to August 12, 2022, with the final decision of whether to proceed with Reverse Split and the exact ratio to be set at a whole number within this range, as determined by our Board in its sole discretion, and (iv) transacting such other business as may properly come before the meeting or any adjournment or postponement thereof.
The Reverse Stock Split is primarily intended to bring the Company into compliance with the minimum bid price requirement for maintaining its listing on the Nasdaq Capital Market. If the stockholders approve the Reverse Split, and the Board decides to implement it, the Reverse Split will become effective upon the filing of the Charter Amendment with the Secretary of State of State of Delaware and will be realized simultaneously for all our Common Stock, which is expected to be August 11, 2022. The Reverse Split does not change the number of the Company’s authorized shares or the par value of the shares of our Common Stock. Immediately after the Reverse Split, each stockholder’s percentage ownership interest in the Company and proportional voting power will remain virtually unchanged except for minor changes and adjustments that will result from rounding fractional shares into whole shares. The rights and privileges of the holders of shares of Common Stock will be substantially unaffected by the Reverse Split. The expected Nasdaq marketplace effective date is August 17, 2022.
21
ITEM 2. MANAGEMENT’S DISCUSSION AND ANALYSIS OF FINANCIAL CONDITION AND RESULTS OF OPERATIONS
Overview
As of June 30, 2022, the Company had two business lines, which are the commodities trading business and supply chain management services.
Commodities trading business
The commodity trading business primarily involves purchasing non-ferrous metal products, such as aluminum ingots, copper, silver, and gold, from metal and mineral suppliers and then selling to customers. In connection with the Company’s commodity sales, in order to help customers to obtain sufficient funds to purchase various metal products and also help upstream metal and mineral suppliers to sell their metal products, the Company launched its supply chain management service in December 2019. The Company primarily generates revenues from selling bulk non-ferrous commodity products and providing related supply chain management services in the PRC.
For the six months ended June 30, 2022, the Company recorded revenue of $100,692,259 from commodities trading business and $1,150,252 from commodity distribution services and other related services, respectively.
The Company sources bulk commodity products from non-ferrous metal and mines or its designated distributors and then sells to manufacturers that need these metals in large quantities. The Company works with upstream suppliers in the sourcing of commodities. Major suppliers include various metal and mineral suppliers such as Kunsteel Group, Baosteel Group, Aluminum Corporate of China Limited, Yunnan Benyuan, Yunnan Tin, and Shanghai Copper. Potential customers include large infrastructure companies such as China National Electricity, Datang Power, China Aluminum Foshan International Trade, Tooke Investment (China), CSSC International Trade Co., Ltd., Shenye Group, and Keliyuan.
Supply Chain Management Services
We offer a distribution service to bulk suppliers of precious metals by acting as a sales intermediary, procuring small to medium-sized buyers through our own professional sales team and channels and distributing the bulk precious metals of the suppliers. Upon executing a purchase order from our sourced buyers, we charge the suppliers with a commission fee ranging from 1% to 2% of the distribution order, depending on the size of the order. We also offer some other supply chain management services business. For the six months ended June 30, 2022, the Company earned other supply chain management services revenue of $1,150,252 with 16 third-party customers, compared with a commodity distribution services revenue of $472,425 to eight third-party customers for the same period ended June 30, 2021.
Competition
The Company mainly competes against other large domestic commodity metal product trading service providers such as Xiamen International Trade and Yijian Shares. Currently, the principal competitive factors in the non-ferrous metals commodities trading business are price, product availability, quantity, service, and financing terms for purchases and sales of commodities.
Applicable Government Regulations
Shenzhen Baiyu Jucheng has obtained all material approvals, permits, licenses and certificates required for our metal product trading operations, including registrations from the local business and administrative department authorizing the purchase of raw materials.
22
Key Factors Affecting Our Results of Operation
The commodities trading industry has been experiencing decreasing demand as a result of China’s overall economic slowdown. We expect competition in the commodities trading business to persist and intensify.
We have a limited operating history, having just started our commodities trading business in late November 2019. We believe our future success depends on our ability to significantly increase sales as well as maintain profitability from our operations. Our limited operating history makes it difficult to evaluate our business and future prospects. You should consider our future prospects in light of the risks and challenges encountered by a company with a limited operating history in an emerging and rapidly evolving industry. These risks and challenges include, among other things,
| ● | our ability to continue our growth as well as maintain profitability; |
| ● | preservation of our competitive position in the commodities trading industry in China; |
| ● | our ability to implement our strategies and make timely and effective responses to competition and changes in customer preferences; |
| ● | recruitment, training and retaining of qualified managerial and other personnel; and |
| ● | The impact of strict governmental policies relating to coronavirus on our operations and the overall conditions of the markets we operate. |
Our business requires a significant amount of capital in large part due to our need to purchase a bulk volume of commodities and expand our business in existing markets and to additional markets where we currently do not have operations.
23
Results of Operations
The Company included $1,695,042 as share-based payment for services on the condensed consolidated statement of operations for the six months ended June 30, 2021.
Three Months Ended June 30, 2022 as Compared to Three Months Ended June 30, 2021
| For the Three Months Ended June 30, | Change | |||||||||||||||
| 2022 | 2021 | Amount | % | |||||||||||||
| Revenues | ||||||||||||||||
| - Sales of commodity products – third parties | $ | 53,108,294 | $ | 57,989,381 | $ | (4,881,087 | ) | (8 | )% | |||||||
| - Sales of commodity products – related parties | - | 1,523,616 | (1,523,616 | ) | (100 | )% | ||||||||||
| - Supply chain management services – third parties | 575,101 | 326,650 | 248,451 | 76 | % | |||||||||||
| Total Revenue | 53,683,395 | 59,839,647 | (6,156,252 | ) | (10 | )% | ||||||||||
| Cost of revenue | ||||||||||||||||
| - Commodity product sales – third parties | (53,250,178 | ) | (57,932,603 | ) | 4,682,425 | (8 | )% | |||||||||
| - Commodity product sales – related parties | - | (1,531,336 | ) | 1,531,336 | (100 | )% | ||||||||||
| - Supply chain management services – third parties | 5,912 | (2,592 | ) | 8,504 | (328 | )% | ||||||||||
| Total cost of revenue | (53,244,266 | ) | (59,466,531 | ) | 6,222,265 | (10 | )% | |||||||||
| Gross profit | 439,129 | 373,116 | 66,013 | 18 | % | |||||||||||
| Operating expenses | ||||||||||||||||
| Selling, general, and administrative expenses | (1,875,779 | ) | (2,054,354 | ) | 178,575 | (9 | )% | |||||||||
| Total operating cost and expenses | (1,875,779 | ) | (2,054,354 | ) | 178,575 | (9 | )% | |||||||||
| Other income (expenses), net | ||||||||||||||||
| Interest income | 4,366,318 | 2,946,236 | 1,420,082 | 48 | % | |||||||||||
| Interest expenses | (129,116 | ) | (155,825 | ) | 26,709 | 17 | % | |||||||||
| Amortization of beneficial conversion feature relating to issuance of convertible promissory notes | (320,291 | ) | - | (320,291 | ) | 100 | % | |||||||||
| Other expenses, net | (221,953 | ) | (379,924 | ) | 157,971 | 42 | % | |||||||||
| Total other income, net | 3,694,958 | 2,410,487 | 1,284,471 | 53 | % | |||||||||||
| Net Income Before Income Taxes | 2,258,308 | 729,249 | 1,529,059 | 210 | % | |||||||||||
| Income tax expenses | (833,037 | ) | (371,393 | ) | (461,644 | ) | 124 | % | ||||||||
| Net Income | $ | 1,425,271 | $ | 357,856 | $ | 1,067,415 | 298 | % | ||||||||
24
Revenue
For the three months ended June 30, 2022, we generate revenue from two sources, including (1) revenue from sales of commodity products, and (2) revenue from supply chain management services. Total revenue decreased by $6,156,252 or 10%, from $59,839,647 for the three months ended June 30, 2021 to $53,683,395 for the three months ended June 30, 2022, among which revenue from commodity trading and supply chain management accounted for 98.9% and 1.1% of our total revenue for the three months ended June 30, 2022. For the three months ended June 30, 2021, revenue from commodity trading and supply chain management accounted for 99.5% and 0.5% of our total revenue for the three months ended June 30, 2021.
(1) Revenue from sales of commodity products
For the three months ended June 30, 2022 and 2021, the Company sold non-ferrous metals to 22 customers at fixed prices, and earned revenues when the product ownership was transferred to its customers. The Company earned revenues of $53,108,294 from sales of commodity products for the three months ended June 30, 2022 compared with $59,512,997 generated from sales of commodity products for the same period in 2021.
(2) Revenue from supply chain management services
In connection with the Company’s commodity sales, in order to help customers to obtain sufficient funds to purchase various metal products and also help metal and mineral suppliers sell their metal products, the Company launched its supply chain management service business in December 2019, which primarily consisted of loan recommendation services and commodity distribution services. For the three months ended June 30, 2022, the Company provided $575,101 commodity distribution services to third-party customers compared with $326,650 to the third-party customers for the same period ended June 30, 2021.
Cost of revenue
Our cost of revenue primarily includes cost of revenue associated with commodity product sales and cost of revenue associated with management services of supply chain. Total cost of revenue decreased by $6,222,265 or 10% from $59,466,531 for the three months ended June 30, 2021 to $53,244,266 for the three months ended June 30, 2022, primarily due to an decrease of $4,682,425 in cost of revenue associated with commodity product sales from the third-party. The decreased cost of revenue is in line with the decrease in revenue.
25
Cost of revenue associated with commodity trading
Cost of revenue primarily consists of purchase costs of non-ferrous metal products. For the three months ended June 30, 2022, the Company purchased non-ferrous metal products of $53,250,178 from 15 third-party vendors compared with $57,932,603 from 15 third-party vendor and $1,531,336 from five related party vendor for the three months ended June 30, 2021.
Selling, general, and administrative expenses
Selling, general and administrative expenses decreased from $2,054,354 for the three months ended June 30, 2021 to $ 1,875,779 for the three months ended June 30, 2022, representing an decrease of $178,575 or 9%. Selling, general and administrative expenses primarily consisted of salary and employee benefits, office rental expense, amortizations of intangible assets and convertible promissory notes, professional service fees and finance offering related fees. There is no big decrease for the three months ended June 30, 2022 compared with the three months ended June 30, 2021.
Interest income
Interest income was primarily generated from loans made to third parties and related parties. For the three months ended June 30, 2022, interest income was $4,366,318, representing an increase of $1,420,082, or 48% from $2,946,236 for the three months ended June 30, 2021. The increase was full due to loans made to third-party vendors for the three months ended June 30, 2022.
Amortization of relative fair value of warrants relating to service provider
For the three months ended June 30, 2022, the item represented the amortization of beneficial conversion feature of $320,291 and relating to the convertible promissory notes.
For the three months ended June 30, 2021, no such expenses incurred.
Net income
As a result of the foregoing, net income for the three months ended June 30, 2022 was $1,425,271, representing an increase of $1,067,415 from net income of $357,856 for the three months ended June 30, 2021.
26
Six Months Ended June 30, 2022 as Compared to Six Months Ended June 30, 2021
| For the Six Months Ended June 30, | Change | |||||||||||||||
| 2022 | 2021 | Amount | % | |||||||||||||
| Revenues | ||||||||||||||||
| - Sales of commodity products – third parties | $ | 100,692,259 | $ | 67,022,848 | $ | 33,669,411 | 50 | % | ||||||||
| - Sales of commodity products – related parties | - | 21,926,631 | (21,926,631 | ) | (100 | )% | ||||||||||
| - Supply chain management services – third parties | 1,150,252 | 472,425 | 677,827 | 143 | % | |||||||||||
| Total Revenue | 101,842,511 | 89,421,904 | 12,420,607 | 14 | % | |||||||||||
| Cost of revenue | ||||||||||||||||
| - Commodity product sales – third parties | (100,840,754 | ) | (66,965,015 | ) | (33,875,739 | ) | 51 | % | ||||||||
| - Commodity product sales – related parties | - | (21,917,517 | ) | 21,917,517 | (100 | )% | ||||||||||
| - Supply chain management services – third parties | (5,690 | ) | (3,642 | ) | (2,048 | ) | 56 | % | ||||||||
| Total cost of revenue | (100,846,444 | ) | (88,886,174 | ) | (11,960,270 | ) | 13 | % | ||||||||
| Gross profit | 996,067 | 535,730 | 460,337 | 86 | % | |||||||||||
| Operating expenses | ||||||||||||||||
| Selling, general, and administrative expenses | (4,123,486 | ) | (3,624,733 | ) | (498,753 | ) | 14 | % | ||||||||
| Share-based payment for service | - | (1,695,042 | ) | 1,695,042 | (100 | )% | ||||||||||
| Total operating cost and expenses | (4,123,486 | ) | (5,319,775 | ) | 1,196,289 | (22 | )% | |||||||||
| Other income (expenses), net | ||||||||||||||||
| Interest income | 8,756,659 | 5,045,093 | 3,711,566 | 74 | % | |||||||||||
| Interest expenses | (239,442 | ) | (283,248 | ) | 43,806 | (15 | )% | |||||||||
| Amortization of beneficial conversion feature relating to issuance of convertible promissory notes | (533,658 | ) | - | (533,658 | ) | 100 | % | |||||||||
| Other income (expense), net | (126,244 | ) | (386,358 | ) | 260,114 | 67 | % | |||||||||
| Total other income, net | 7,857,315 | 4,375,487 | 3,481,828 | 80 | % | |||||||||||
| Net Income(Loss) Before Income Taxes | 4,729,896 | (408,558 | ) | 5,138,454 | 1258 | % | ||||||||||
| Income tax expenses | (1,710,768 | ) | (771,862 | ) | (938,906 | ) | 122 | % | ||||||||
| Net Income (Loss) | $ | 3,019,128 | $ | (1,180,420 | ) | $ | 4,199,548 | 356 | % | |||||||
27
Revenue
For the six months ended June 30, 2022, we generate revenue from the following two sources, including (1) revenue from sales of commodity products and (2) revenue from supply chain management services. Total revenue increased by $12,420,607 or 14%, from $89,421,904 for the six months ended June 30, 2021 to $101,842,511 for the six months ended June 30, 2022, among which revenue from commodity trading and supply chain management accounted for 98.9% and 1.1%, respectively, of our total revenue for the six months ended June 30, 2022. The increase is mainly due to the prosperous bulk market all over the world. An obvious increase in commodity price and growing demand drive more frequent transactions occurred during the first half of 2022. Since 2022, the Company put more emphasis on its business in Hainan which was able to obtain a competitive and supportive policy and generates more revenue from customers in the Hainan region. The Company made efforts to explore competitive upstream vendors in Hainan to meet the demands of lower transportation cost and time cost, meanwhile, our long-term positive image in the commodity products industry enhanced our comprehensive competitive support from local trade associates.
(1) Revenue from sales of commodity products
For the six months ended June 30, 2022, the Company sold non-ferrous metals to 22 third-party customers at fixed prices, and earned revenues when the product ownership was transferred to its customers. The Company earned revenues of $100,692,259 from sales of commodity products compared with $88,949,479 for the same period in 2021.
(2) Revenue from supply chain management services
In connection with the Company’s commodity sales, in order to help customers to obtain sufficient funds to purchase various metal products and also help metal and mineral suppliers sell their metal products, the Company launched its supply chain management service business in December 2019, which primarily consisted of loan recommendation services and commodity distribution services.
Commodity distribution service fees
The Company utilizes its strong sales and marketing expertise and customer network to introduce customers to large metal and mineral suppliers, and facilitate the metal product sales between the suppliers and the customers. The Company merely acts as an agent in this type of transaction and earns a commission fee based on the percentage of the volume of metal products that customers purchase. Commodity distribution service fees are recognized as revenue when the Company successfully facilitates the sales transactions between the suppliers and the customers. For the six months ended June 30, 2022, the Company earned commodity distribution commission fees of $1,150,252 from 16 third-party vendors compared with commission fees of 472,425 from third-party vendors for the six months ended June 30, 2021.
Cost of revenue
Our cost of revenue primarily includes cost of revenue associated with commodity product sales, cost of revenue associated with management services of supply chain. Total cost of revenue increased by $11,960,270 or 13% from $88,886,174 for the six months ended June 30, 2021 to $100,846,444 for the six months ended June 30, 2022, primarily due to an increase of $11,958,222 in cost of revenue associated with commodity product sales. The cost of revenue increased in line with the increase in sales volume.
Cost of revenue associated with commodity trading
Cost of revenue primarily consists of purchase costs of non-ferrous metal products.
For the six months ended June 30, 2022, the Company purchased non-ferrous metal products of $100,840,754 from 15 third-party vendors.
For the six months ended June 30, 2021, the Company purchased non-ferrous metal products of $66,965,015 from 15 third-party vendors and $21,917,517 from five related-party vendors.
28
Selling, general, and administrative expenses
Selling, general and administrative expenses increased from $3,624,733 for the six months ended June 30, 2021 to $4,123,486 for the six months ended June 30, 2022, representing an increase of $498,753, or 14%. Selling, general and administrative expenses primarily consisted of salary and employee benefits, office rental expense, amortizations of intangible assets and convertible promissory notes, professional service fees and finance offering related fees. The increase was mainly attributable to 1) salary and employee benefits increased by $0.62 million and, 2) amortization of convertible promissory notes increased by $0.22 million.
Interest income
Interest income was primarily generated from loans made to third parties and related parties. For the six months ended June 30, 2022, interest income was $8,756,659 representing an increase of $3,711,566, or 74% from $5,045,903 for the six months ended June 30, 2021. The increase was primarily due to loans made to third-party vendor customers, among which, $702,756 was attributed to related parties and $8,053,903 was generated from third-party vendors.
Share-based payment for service
On March 4, 2021, the Company issued 750,000 fully-vested warrants with an exercise price of $0.01, with a five-year life, to an agent who was engaged to complete the warrant waiver and exercise agreements. The Company applied Black-Scholes model and determined the fair value of the warrants to be $1,695,042. Significant estimates and assumptions used included stock price on March 4, 2021 of $2.27 per share, risk-free interest rate of one year of 0.08%, life of 5 years, and volatility of 71.57% for the six months ended June 30, 2021.
For the six months ended June 30, 2022, no such expenses incurred.
Amortization of beneficial conversion feature and relative fair value of warrants relating to issuance of convertible promissory notes
For the six months ended June 30, 2022, the item represented the amortization of beneficial conversion feature of $533,658 relating to the convertible promissory notes.
For the six months ended June 30, 2021, no such expenses incurred.
Net income (loss)
As a result of the foregoing, net income for the six months ended June 30, 2022 was $3,019,128, representing an increase of $4,199,548 from net loss of $1,180,420 for the six months ended June 30, 2021.
29
Cash Flows and Capital Resources
We have financed our operations primarily through shareholder contributions, cash flow from operations, borrowings from third parties and related parties, and equity financing through private placement and public offerings of our securities.
As reflected in the accompanying unaudited condensed consolidated financial statements, the Company incurred net income of $3,019,128 and cash inflow of $ 469,839 for the six months ended June 30, 2022. As of June 30, 2022, the Company positive working capital of $164 million.
During the six months ended June 30, 2022, the Company entered into additional private placement agreements with certain private investors and issued 65,000,000 shares of common stock at $0.7 per share for $45,500,000, and issued 57,100,000 shares of common stock at $0.2 per share for $11,420,000, sold unsecured senior convertible promissory notes (“Notes”) in the aggregate principal amount of $3,000,000.
The total gross proceeds from these transactions were $59.92 million. The Company expects to use the proceeds from the equity financing as working capital to expand its commodity trading business.
Based on the foregoing capital market activities, the management believes that the Company will continue as a going concern in the following 12 months.
Statement of Cash Flows
The following table sets forth a summary of our cash flows. For the six months ended June 30, 2022 and 2021, respectively:
| For the six months Ended June 30, | ||||||||
| 2022 | 2021 | |||||||
| Net Cash Provided by(Used in) Operating Activities | $ | 469,839 | $ | (3,789,382 | ) | |||
| Net Cash Used in Investing Activities | (60,102,346 | ) | (15,810,972 | ) | ||||
| Net Cash Provided by Financing Activities | 59,920,000 | 23,096,801 | ||||||
| Effect of exchange rate changes on cash and cash equivalents | (673,145 | ) | 700,055 | |||||
| Net increase (decrease) in cash and cash equivalents | (385,652 | ) | 4,196,502 | |||||
| Cash at beginning of period | 4,311,068 | 2,700,013 | ||||||
| Cash at end of period | $ | 3,925,416 | $ | 6,896,515 | ||||
30
Net Cash Provided by (Used in) Operating Activities
During the six months ended June 30, 2022, we had a cash inflow from operating activities of $469,839, an increase of $4,259,221 from a cash outflow of $3,789,382 for the six months ended June 30, 2021. We incurred a net income for the six months ended June 30, 2022 of $3,019,128, an increase of $4,199,548 from the six months ended June 30, 2021, during which we recorded a net loss of $1,180,420.
In addition to the change in profitability, the increase in net cash used in operating activities was the result of several factors, including (1) non cash effects adjustments include amortization of intangible assets of $2,016,116 and amortization of discount on convertible promissory notes of $219,333, amortization of beneficial conversion feature of convertible promissory notes of $533,658 and interest expenses for convertible promissory notes of $206,567.
Net Cash Used in Investing Activities
Net cash used in investing activities for the six months ended June 30, 2022 was $60,102,346 as compared to net cash used in investing activities of $15,810,972 from continuing operations for the six months ended June 30, 2021.
The cash used in investing activities for the six months ended June 30, 2022 was for the loans disbursed to third parties of $80,502,961, collected loans from third partis of $10,069,408 and collected loans from related partis of $10,839,631.
Net Cash Provided by Financing Activities
During the six months ended June 30, 2022, the cash provided by financing activities was mainly attributable to cash raised of $45,500,000 from certain private placements by issuance of 65,000,000 shares of common stocks, cash raised of $11,420,000 from certain private placements by issuance of 57,100,000 shares of common stocks and cash raised of $3,000,000 from issuance of unsecured senior convertible promissory notes.
Impact of COVID-19
Since the beginning of 2022, another wave of COVID-19 variants broke out in China, which caused surging numbers of COVID-19 cases in certain cities, such as Shenzhen, Shanghai and Beijing, where relevant local governments have taken certain lock-down and other restrictive measures to prevent the further spread of COVID-19. As a result, our operations in Shanghai at the beginning of 2022 were temporarily affected for about two weeks primarily attributable to the closure of our warehouse as local authorities in Shanghai imposed strict lock-down measures since March 2022. As of June 30, 2022, since the lock-down restrictions in Shanghai have been gradually lifted, our business operations have not experienced any material or adverse interruption due to the recent COVID-19 outbreak. To the best knowledge of our management, our business and financial conditions had not been materially adversely impacted by the resurgence of COVID-19 for the six months ended June 30, 2022.
The economic effect of a prolonged pandemic is difficult to predict and could result in a material financial impact on the Company’s future reporting periods. The actual impact caused by the COVID-19 outbreak will depend on its subsequent development. We will continue to assess the impacts of COVID-19 on the business and financial performance of our Group and will closely monitor the risks and uncertainties arising thereof, and may take further actions that alter our operations, or that we determine are in the best interests of our employees and third parties with which we do business.
Off-balance Sheet Arrangements
We do not have any off-balance sheet arrangements as of June 30, 2022.
31
Contractual Obligations
As of June 30, 2022, the Company had three lease arrangement with two unrelated third-party with a monthly rental fee of approximately $29,409. Two lease term were within 38 months, which will be due in December 2024. The remaining one was within 24 months, which will be due in August 2023. As of the date of this report, the Company cannot reasonably assess whether it will renew the lease term. The lease commitment was as following table:
| Less than | ||||||||||||||||
| Total | 1 year | 1-2 years | Thereafter | |||||||||||||
| Contractual obligations: | ||||||||||||||||
| Operating lease | $ | 797,819 | $ | 167,783 | $ | 325,293 | $ | 304,743 | ||||||||
| Total | $ | 797,819 | $ | 167,783 | $ | 325,293 | $ | 304,743 | ||||||||
Critical Accounting Policies
Please refer to Note 2 of the Condensed Consolidated Financial Statements included in this Form 10-Q for details of our critical accounting policies.
32
ITEM 3. QUANTITATIVE AND QUALITATIVE DISCLOSURES ABOUT MARKET RISK
Not applicable.
ITEM 4. CONTROLS AND PROCEDURES
Evaluation of Disclosure Controls and Procedures
Based on an evaluation under the supervision and with the participation of the Company’s management, the Company’s principal executive officer and principal financial officer have concluded that the Company’s disclosure controls and procedures as defined in Rules 13a-15(e) and 15d-15(e) under the Exchange Act were not effective as of June 30, 2022.
Certain personnel primarily responsible for preparing our financial statements require additional requisite levels of knowledge, experience and training in the application of U.S. GAAP commensurate with our financial reporting requirements. The management thought that in light of the inexperience of our accounting staff with respect to the requirements of U.S. GAAP-based reporting and SEC rules and regulations, we did not maintain effective controls and did not implement adequate and proper supervisory review to ensure that significant internal control deficiencies can be detected or prevented.
Management’s assessment of the control deficiency over accounting and finance personnel as of June 30, 2022 includes:
| ● | There is a lack of formal procedures for handling different types of revenue recognition. |
| ● | Company management conducted extensive transactions with related parties without adequate control by the Audit Committee and the Board of Directors. |
| ● | There is a lack of procedures and documentation for dealing with related parties. |
| ● | There was no accountant with adequate U.S. GAAP knowledge working in the Company’s Accounting Department. |
| ● | The Company has insufficient written policies and procedures for accounting and financial reporting, which led to an inadequate financial statement closing process. |
Based on the above factors, management concluded that the control deficiency over accounting and finance personnel was the material weakness as of June 30, 2022, as our accounting staff continues to lack sufficient U.S. GAAP experience and requires further substantial training.
Limitations on the Effectiveness of Disclosure Controls. Readers are cautioned that our management does not expect that our disclosure controls and procedures or our internal control over financial reporting will necessarily prevent all fraud and material error. An internal control system, no matter how well-conceived and operated, can provide only reasonable, not absolute, assurance that the objectives of the control system are met. Because of the inherent limitations in all control systems, no evaluation of controls can provide absolute assurance that all control issues and instances of fraud, if any, within the Company have been detected. The design of any system of controls is also based partly on certain assumptions about the likelihood of future events, and there can be no assurance that any control design will succeed in achieving its stated goals under all potential future conditions.
Changes in Internal Control over Financial Reporting
There were no changes in the Company’s internal control over financial reporting during the quarter ended June 30, 2022, which were identified in connection with management’s evaluation required by paragraph (d) of Rules 13a-15 and 15d-15 under the Exchange Act that have materially affected, or are reasonably likely to materially affect, our internal control over financial reporting.
33
PART II. OTHER INFORMATION
ITEM 1. LEGAL PROCEEDINGS
None.
ITEM 1A. RISK FACTORS
As of the date of this Report, there have been no material changes to the risk factors disclosed in our annual report on Form 10-K filed with the SEC on March 16, 2022.
ITEM 2. UNREGISTERED SALES OF EQUITY SECURITIES AND USE OF PROCEEDS
Common stock issued in private placements
On May 6, 2022, the Company entered into a securities purchase agreement with Streeterville Capital, LLC, a Utah limited liability company, pursuant to which the Company issued the investor an unsecured convertible promissory note on May 6, 2022 in the original principal amount of $3,320,000, convertible into shares of common stock, $0.001 par value per share, of the Company. The Company received proceeds of $3,000,000 in June 2022 after deducting the agent commission and other professional fee.
On May 27, 2022, the Company entered into that certain securities purchase agreement with Mr. Xiangjun Wang and Mr. Heung Ming (Henry) Wong, affiliates of the Company, and certain other non-affiliate purchasers who are “non-U.S. Persons” pursuant to which the Company agreed to sell an aggregate of 57,100,000 shares of Common Stock, par value $0.001 per share, at a per share purchase price of $0.20. The transaction was consummated on June 24, 2022 by the issuance of 57,100,000 shares of Common Stock. The Company received proceeds of $11,420,000 in June 2022.
Common stock issued pursuant to the conversion of convertible promissory notes
The Company settled convertible promissory notes of $125,000 on July 7, 2022, $125,000 on July 18, 2022, $125,000 on July 26, 2022 and $125,000 on August 4, 2022, respectively, and issued 678,463, 628,014, 625,500 and 625,500 shares of the Company’s common stock on July 7, 2022, July 19, 2022, July 26, 2022 and August 5, 2022, respectively.
ITEM 3. DEFAULTS UPON SENIOR SECURITIES
None.
ITEM 4. MINE SAFETY DISCLOSURES
Not applicable.
ITEM 5. OTHER INFORMATION
None.
34
ITEM 6. EXHIBITS
| * | Previously filed |
| ** | Filed herewith |
35
SIGNATURES
Pursuant to the requirements of the Securities Exchange Act of 1934, the registrant has duly caused this report to be signed on its behalf by the undersigned, thereunto duly authorized.
| TD HOLDINGS, INC. | ||
| Date: August 9, 2022 | By: | /s/ Renmei Ouyang |
| Name: | Renmei Ouyang | |
| Title: | Chief Executive Officer (Principal Executive Officer) | |
| By: | /s/ Tianshi (Stanley) Yang | |
| Name: | Tianshi (Stanley) Yang | |
| Title: | Chief Financial Officer | |
| (Principal Financial and Accounting Officer) | ||
36