International Financial Reporting Standardsfalse2024FY0001306965P3YP4Y61550230381xbrli:sharesiso4217:USDiso4217:USDxbrli:sharesshel:competitorxbrli:pureshel:tonnesCarbonDioxideEquivalentshel:outlookiso4217:USDutr:bbliso4217:USDutr:MMBTUiso4217:USDshel:barreliso4217:USDshel:Tonneiso4217:USDutr:tshel:numberOfRefineryiso4217:USDutr:Boeshel:quarterWithShareBuybackshel:projectshel:wellshel:programshel:planiso4217:EURxbrli:sharesiso4217:EURshel:lawsuitshel:claimshel:noticeOfViolationshel:actionshel:companyiso4217:RUBshel:employeeshel:contract00013069652024-01-012024-12-310001306965dei:BusinessContactMember2024-01-012024-12-310001306965shel:AmericanDepositorySharesMember2024-01-012024-12-310001306965shel:A325GuaranteedNotesDue2025Member2024-01-012024-12-310001306965shel:A25GuaranteedNotesDue2026Member2024-01-012024-12-310001306965shel:A2875GuaranteedNotesDue2026Member2024-01-012024-12-310001306965shel:A3875GuaranteedNotesDue2028Member2024-01-012024-12-310001306965shel:A2375GuaranteedNotesDue2029Member2024-01-012024-12-310001306965shel:A2.375GuaranteedNotesDue202929AMember2024-01-012024-12-310001306965shel:A275GuaranteedNotesDue2030Member2024-01-012024-12-310001306965shel:A2.750GuaranteedNotesDue203030AMember2024-01-012024-12-310001306965shel:A4125GuaranteedNotesDue2035Member2024-01-012024-12-310001306965shel:A4.125GuaranteedNotesDue203535AMember2024-01-012024-12-310001306965shel:A6375GuaranteedNotesDue2038Member2024-01-012024-12-310001306965shel:A55GuaranteedNotesDue2040Member2024-01-012024-12-310001306965shel:A2875GuaranteedNotesDue2041Member2024-01-012024-12-310001306965shel:A3625GuaranteedNotesDue2042Member2024-01-012024-12-310001306965shel:A455GuaranteedNotesDue2043Member2024-01-012024-12-310001306965shel:A4.550GuaranteedNotesDue204343AMember2024-01-012024-12-310001306965shel:A4.375GuaranteedNotesDue2045Member2024-01-012024-12-310001306965shel:A4.375GuaranteedNotesDue204545AMember2024-01-012024-12-310001306965shel:A375GuaranteedNotesDue2046Member2024-01-012024-12-310001306965shel:A4.00GuaranteedNotesDue204646AMember2024-01-012024-12-310001306965shel:A4.000GuaranteedNotesDue204646BMember2024-01-012024-12-310001306965shel:A3.750GuaranteedNotesDue204646CMember2024-01-012024-12-310001306965shel:A3125GuaranteedNotesDue2049Member2024-01-012024-12-310001306965shel:A325GuaranteedNotesDue2050Member2024-01-012024-12-310001306965shel:A3.250GuaranteedNotesDue205050AMember2024-01-012024-12-310001306965shel:A300GuaranteedNotesDue2051Member2024-01-012024-12-3100013069652024-12-3100013069652023-01-012023-12-3100013069652022-01-012022-12-3100013069652023-12-310001306965ifrs-full:IssuedCapitalMember2023-12-310001306965shel:SharesHeldInTrustMember2023-12-310001306965ifrs-full:OtherReservesMember2023-12-310001306965ifrs-full:RetainedEarningsMember2023-12-310001306965ifrs-full:EquityAttributableToOwnersOfParentMember2023-12-310001306965ifrs-full:NoncontrollingInterestsMember2023-12-310001306965ifrs-full:OtherReservesMember2024-01-012024-12-310001306965ifrs-full:RetainedEarningsMember2024-01-012024-12-310001306965ifrs-full:EquityAttributableToOwnersOfParentMember2024-01-012024-12-310001306965ifrs-full:NoncontrollingInterestsMember2024-01-012024-12-310001306965ifrs-full:IssuedCapitalMember2024-01-012024-12-310001306965shel:SharesHeldInTrustMember2024-01-012024-12-310001306965ifrs-full:IssuedCapitalMember2024-12-310001306965shel:SharesHeldInTrustMember2024-12-310001306965ifrs-full:OtherReservesMember2024-12-310001306965ifrs-full:RetainedEarningsMember2024-12-310001306965ifrs-full:EquityAttributableToOwnersOfParentMember2024-12-310001306965ifrs-full:NoncontrollingInterestsMember2024-12-310001306965ifrs-full:IssuedCapitalMember2022-12-310001306965shel:SharesHeldInTrustMember2022-12-310001306965ifrs-full:OtherReservesMember2022-12-310001306965ifrs-full:RetainedEarningsMember2022-12-310001306965ifrs-full:EquityAttributableToOwnersOfParentMember2022-12-310001306965ifrs-full:NoncontrollingInterestsMember2022-12-3100013069652022-12-310001306965ifrs-full:OtherReservesMember2023-01-012023-12-310001306965ifrs-full:RetainedEarningsMember2023-01-012023-12-310001306965ifrs-full:EquityAttributableToOwnersOfParentMember2023-01-012023-12-310001306965ifrs-full:NoncontrollingInterestsMember2023-01-012023-12-310001306965ifrs-full:IssuedCapitalMember2023-01-012023-12-310001306965shel:SharesHeldInTrustMember2023-01-012023-12-310001306965ifrs-full:IssuedCapitalMember2021-12-310001306965shel:SharesHeldInTrustMember2021-12-310001306965ifrs-full:OtherReservesMember2021-12-310001306965ifrs-full:RetainedEarningsMember2021-12-310001306965ifrs-full:EquityAttributableToOwnersOfParentMember2021-12-310001306965ifrs-full:NoncontrollingInterestsMember2021-12-3100013069652021-12-310001306965ifrs-full:OtherReservesMember2022-01-012022-12-310001306965ifrs-full:RetainedEarningsMember2022-01-012022-12-310001306965ifrs-full:EquityAttributableToOwnersOfParentMember2022-01-012022-12-310001306965ifrs-full:NoncontrollingInterestsMember2022-01-012022-12-310001306965ifrs-full:IssuedCapitalMember2022-01-012022-12-310001306965shel:SharesHeldInTrustMember2022-01-012022-12-310001306965srt:RevisionOfPriorPeriodReclassificationAdjustmentMember2023-10-012023-12-310001306965srt:RevisionOfPriorPeriodReclassificationAdjustmentMember2023-01-012023-12-310001306965shel:ChemicalPlantsMember2024-01-012024-12-310001306965shel:RetailServiceStationsMember2024-01-012024-12-310001306965shel:UpgradersMemberifrs-full:BottomOfRangeMember2024-01-012024-12-310001306965shel:UpgradersMemberifrs-full:TopOfRangeMember2024-01-012024-12-310001306965shel:ForecastYearToAchieveNearZeroMethaneEmissions2030Membersrt:MaximumMember2024-01-012024-12-310001306965shel:ForecastYearsToReduceCarbonIntensityOfEnergyPeriodTwoMembersrt:MinimumMember2024-01-012024-12-310001306965shel:ForecastYearsToReduceCarbonIntensityOfEnergyPeriodTwoMembersrt:MaximumMember2024-01-012024-12-310001306965shel:ForecastYearsToReduceCarbonIntensityOfEnergyPeriodThreeMembersrt:MinimumMember2024-01-012024-12-310001306965shel:ForecastYearsToReduceCarbonIntensityOfEnergyPeriodThreeMembersrt:MaximumMember2024-01-012024-12-310001306965shel:ForecastYearsToReduceCarbonIntensityOfEnergyPeriodFourMember2024-01-012024-12-310001306965shel:ForecastYearsToReduceCarbonIntensityOfEnergyPeriodThreeMembersrt:MinimumMember2024-03-012024-03-310001306965shel:ForecastYearsToReduceCarbonIntensityOfEnergyPeriodThreeMembersrt:MaximumMember2024-03-012024-03-310001306965shel:ForecastYearsToReduceCarbonIntensityOfEnergyPeriodThreeMember2024-01-012024-12-310001306965shel:IntegratedGasMember2024-12-310001306965shel:UpstreamMember2024-12-310001306965shel:ChemicalsAndProductsSegmentMember2024-12-310001306965shel:MarketingSegmentMember2024-12-310001306965shel:RenewablesAndEnergySolutionsSegmentMember2024-12-310001306965shel:CorporateSegment1Member2024-12-310001306965shel:IntegratedGasMember2023-12-310001306965shel:UpstreamMember2023-12-310001306965shel:ChemicalsAndProductsSegmentMember2023-12-310001306965shel:MarketingSegmentMember2023-12-310001306965shel:RenewablesAndEnergySolutionsSegmentMember2023-12-310001306965shel:CorporateSegment1Member2023-12-310001306965shel:IntegratedGasMember2016-12-310001306965shel:IntegratedGasMember2017-12-310001306965shel:IntegratedGasMember2018-12-310001306965shel:IntegratedGasMember2019-12-310001306965shel:IntegratedGasMember2020-12-310001306965shel:IntegratedGasMember2021-12-310001306965shel:IntegratedGasMember2022-12-310001306965shel:UpstreamMember2016-12-310001306965shel:UpstreamMember2017-12-310001306965shel:UpstreamMember2018-12-310001306965shel:UpstreamMember2019-12-310001306965shel:UpstreamMember2020-12-310001306965shel:UpstreamMember2021-12-310001306965shel:UpstreamMember2022-12-310001306965shel:IntegratedGasAndUpstreamSegmentsMember2016-12-310001306965shel:IntegratedGasAndUpstreamSegmentsMember2017-12-310001306965shel:IntegratedGasAndUpstreamSegmentsMember2018-12-310001306965shel:IntegratedGasAndUpstreamSegmentsMember2019-12-310001306965shel:IntegratedGasAndUpstreamSegmentsMember2020-12-310001306965shel:IntegratedGasAndUpstreamSegmentsMember2021-12-310001306965shel:IntegratedGasAndUpstreamSegmentsMember2022-12-310001306965shel:IntegratedGasAndUpstreamSegmentsMember2023-12-310001306965shel:IntegratedGasAndUpstreamSegmentsMember2024-12-310001306965shel:ProductionAssetsMember2016-12-310001306965shel:ProductionAssetsMember2017-12-310001306965shel:ProductionAssetsMember2018-12-310001306965shel:ProductionAssetsMemberifrs-full:PropertyPlantAndEquipmentNotSubjectToOperatingLeasesMember2019-12-310001306965shel:ProductionAssetsMemberifrs-full:PropertyPlantAndEquipmentNotSubjectToOperatingLeasesMember2020-12-310001306965shel:ProductionAssetsMemberifrs-full:PropertyPlantAndEquipmentNotSubjectToOperatingLeasesMember2021-12-310001306965shel:ProductionAssetsMemberifrs-full:PropertyPlantAndEquipmentNotSubjectToOperatingLeasesMember2022-12-310001306965shel:ProductionAssetsMemberifrs-full:PropertyPlantAndEquipmentNotSubjectToOperatingLeasesMember2023-12-310001306965shel:ProductionAssetsMemberifrs-full:PropertyPlantAndEquipmentNotSubjectToOperatingLeasesMember2024-12-310001306965shel:ProductionAssetsMemberifrs-full:PropertyPlantAndEquipmentSubjectToOperatingLeasesMember2019-12-310001306965shel:ProductionAssetsMemberifrs-full:PropertyPlantAndEquipmentSubjectToOperatingLeasesMember2020-12-310001306965shel:ProductionAssetsMemberifrs-full:PropertyPlantAndEquipmentSubjectToOperatingLeasesMember2021-12-310001306965shel:ProductionAssetsMemberifrs-full:PropertyPlantAndEquipmentSubjectToOperatingLeasesMember2022-12-310001306965shel:ProductionAssetsMemberifrs-full:PropertyPlantAndEquipmentSubjectToOperatingLeasesMember2023-12-310001306965shel:ProductionAssetsMemberifrs-full:PropertyPlantAndEquipmentSubjectToOperatingLeasesMember2024-12-310001306965shel:ProductionAssetsMember2019-12-310001306965shel:ProductionAssetsMember2020-12-310001306965shel:ProductionAssetsMember2021-12-310001306965shel:ProductionAssetsMember2022-12-310001306965shel:ProductionAssetsMember2023-12-310001306965shel:ProductionAssetsMember2024-12-310001306965ifrs-full:ExplorationAndEvaluationAssetsMember2016-12-310001306965ifrs-full:ExplorationAndEvaluationAssetsMember2017-12-310001306965ifrs-full:ExplorationAndEvaluationAssetsMember2018-12-310001306965ifrs-full:ExplorationAndEvaluationAssetsMember2019-12-310001306965ifrs-full:ExplorationAndEvaluationAssetsMember2020-12-310001306965ifrs-full:ExplorationAndEvaluationAssetsMember2021-12-310001306965ifrs-full:ExplorationAndEvaluationAssetsMember2022-12-310001306965ifrs-full:ExplorationAndEvaluationAssetsMember2023-12-310001306965ifrs-full:ExplorationAndEvaluationAssetsMember2024-12-310001306965shel:ProductionAssetsMembershel:IntegratedGasAndUpstreamSegmentsMember2024-12-310001306965shel:ProductionAssetsMembershel:IntegratedGasAndUpstreamSegmentsMember2016-12-310001306965shel:IntegratedGasAndUpstreamSegmentsMember2017-01-012024-12-310001306965shel:TwoThousandAndThirtyMember2024-01-012024-12-310001306965shel:TwoThousandAndFortyMember2024-01-012024-12-310001306965shel:TwoThousandAndFiftyMember2024-01-012024-12-310001306965srt:MinimumMember2024-01-012024-12-310001306965srt:MaximumMember2024-01-012024-12-310001306965srt:MinimumMembershel:IntegratedGasAndUpstreamSegmentsMember2024-12-310001306965srt:MaximumMembershel:IntegratedGasAndUpstreamSegmentsMember2024-12-310001306965srt:MinimumMembershel:IntegratedGasAndUpstreamSegmentsMember2023-12-310001306965srt:MaximumMembershel:IntegratedGasAndUpstreamSegmentsMember2023-12-310001306965srt:MinimumMembershel:IntegratedGasAndUpstreamSegmentsMember2024-01-012024-12-310001306965srt:MaximumMembershel:IntegratedGasAndUpstreamSegmentsMember2024-01-012024-12-310001306965srt:MinimumMembershel:IntegratedGasAndUpstreamSegmentsMember2023-01-012023-12-310001306965srt:MaximumMembershel:IntegratedGasAndUpstreamSegmentsMember2023-01-012023-12-310001306965shel:Priceline1Member2024-01-012024-12-310001306965shel:TwoThousandAndTwentyFiveMembershel:IHSMarkitACCS2024Membershel:Priceline1Member2024-01-012024-12-310001306965shel:TwoThousandAndTwentySixToTwoThousandAndTwentySevenMembershel:IHSMarkitACCS2024Membershel:Priceline1Member2024-01-012024-12-310001306965shel:TwoThousandAndTwentyEightMembershel:IHSMarkitACCS2024Membershel:Priceline1Member2024-01-012024-12-310001306965shel:TwoThousandAndThirtySevenMembershel:IHSMarkitACCS2024Membershel:Priceline1Member2024-01-012024-12-310001306965shel:TwoThousandAndFortyEightMembershel:IHSMarkitACCS2024Membershel:Priceline1Member2024-01-012024-12-310001306965shel:TwoThousandAndFiftyMembershel:IHSMarkitACCS2024Membershel:Priceline1Member2024-01-012024-12-310001306965shel:TwoThousandAndFortyTwoMembershel:IHSMarkitACCS2024Membershel:Priceline1Member2024-01-012024-12-310001306965shel:TwoThousandAndTwentyFiveMembershel:IHSMarkitACCS2024Membershel:Priceline1Membersrt:EuropeMember2024-01-012024-12-310001306965shel:TwoThousandAndThirtyTwoMembershel:IHSMarkitACCS2024Membershel:Priceline1Membersrt:EuropeMember2024-01-012024-12-310001306965shel:TwoThousandAndFiftyMembershel:IHSMarkitACCS2024Membershel:Priceline1Membersrt:EuropeMember2024-01-012024-12-310001306965shel:TwoThousandAndTwentyFiveMembershel:IHSMarkitACCS2024Membershel:Priceline1Membersrt:AsiaMember2024-01-012024-12-310001306965shel:TwoThousandAndThirtyThreeMembershel:IHSMarkitACCS2024Membershel:Priceline1Membersrt:AsiaMember2024-01-012024-12-310001306965shel:Priceline1Membersrt:MaximumMembershel:TwoThousandAndFiftyMembershel:IHSMarkitACCS2024Membersrt:AsiaMember2024-01-012024-12-310001306965shel:TwoThousandAndTwentyFiveMembershel:WoodmacWMAET15DegreeMembershel:Priceline1Member2024-01-012024-12-310001306965shel:TwoThousandAndFiftyMembershel:WoodmacWMAET15DegreeMembershel:Priceline1Member2024-01-012024-12-310001306965shel:TwoThousandAndTwentyFiveMembershel:WoodmacWMAET15DegreeMembershel:Priceline1Membershel:HenryHubNaturalGasMember2024-01-012024-12-310001306965shel:TwoThousandAndThirtyFiveMembershel:WoodmacWMAET15DegreeMembershel:Priceline1Membershel:HenryHubNaturalGasMember2024-01-012024-12-310001306965shel:TwoThousandAndTwentyFiveMembershel:WoodmacWMAET15DegreeMembershel:Priceline1Membersrt:EuropeMember2024-01-012024-12-310001306965shel:TwoThousandAndThirtyMembershel:WoodmacWMAET15DegreeMembershel:Priceline1Membersrt:EuropeMember2024-01-012024-12-310001306965shel:TwoThousandAndThirtyFiveMembershel:WoodmacWMAET15DegreeMembershel:Priceline1Membersrt:EuropeMember2024-01-012024-12-310001306965shel:TwoThousandAndFiftyMembershel:WoodmacWMAET15DegreeMembershel:Priceline1Membersrt:EuropeMember2024-01-012024-12-310001306965shel:TwoThousandAndTwentyFiveMembershel:WoodmacWMAET15DegreeMembershel:Priceline1Membersrt:AsiaMember2024-01-012024-12-310001306965shel:TwoThousandAndThirtyMembershel:WoodmacWMAET15DegreeMembershel:Priceline1Membersrt:AsiaMember2024-01-012024-12-310001306965shel:Priceline1Membersrt:MinimumMembershel:TwoThousandAndThirtySIxMembershel:WoodmacWMAET15DegreeMembersrt:AsiaMember2024-01-012024-12-310001306965shel:Priceline1Membersrt:MaximumMembershel:TwoThousandAndFiftyMembershel:WoodmacWMAET15DegreeMembersrt:AsiaMember2024-01-012024-12-310001306965shel:TwoThousandAndTwentyFiveMembershel:IEANZE50Membershel:Priceline1Member2024-01-012024-12-310001306965shel:TwoThousandAndFiftyMembershel:IEANZE50Membershel:Priceline1Member2024-01-012024-12-310001306965shel:TwoThousandAndTwentyFiveMembershel:IEANZE50Membershel:Priceline1Membershel:HenryHubNaturalGasMember2024-01-012024-12-310001306965shel:TwoThousandAndFiftyMembershel:IEANZE50Membershel:Priceline1Membershel:HenryHubNaturalGasMember2024-01-012024-12-310001306965shel:TwoThousandAndTwentyFiveMembershel:IEANZE50Membershel:Priceline1Membersrt:EuropeMember2024-01-012024-12-310001306965shel:TwoThousandAndTwentyFiveMembershel:IEANZE50Membershel:Priceline1Membersrt:AsiaMember2024-01-012024-12-310001306965shel:TwoThousandAndFiftyMembershel:IEANZE50Membershel:Priceline1Membersrt:EuropeMember2024-01-012024-12-310001306965shel:TwoThousandAndThirtyMembershel:IEANZE50Membershel:Priceline1Membersrt:AsiaMember2024-01-012024-12-310001306965shel:ShellMidPriceMembershel:IntegratedGasMember2024-12-310001306965shel:Priceline2Membershel:IntegratedGasMember2023-12-310001306965shel:ShellMidPriceMembershel:UpstreamMember2024-12-310001306965shel:Priceline1Membershel:UpstreamMember2023-12-310001306965shel:A2DegreesCelsiusExternalClimateChangeMembershel:IntegratedGasMemberifrs-full:BottomOfRangeMember2024-12-310001306965shel:A2DegreesCelsiusExternalClimateChangeMembershel:IntegratedGasMemberifrs-full:TopOfRangeMember2024-12-310001306965shel:Priceline1Membershel:IntegratedGasMembersrt:MinimumMember2023-12-310001306965shel:Priceline1Membershel:IntegratedGasMembersrt:MaximumMember2023-12-310001306965shel:A2DegreesCelsiusExternalClimateChangeMembershel:UpstreamMemberifrs-full:BottomOfRangeMember2024-12-310001306965shel:A2DegreesCelsiusExternalClimateChangeMembershel:UpstreamMemberifrs-full:TopOfRangeMember2024-12-310001306965shel:Priceline1Membershel:UpstreamMembersrt:MinimumMember2023-12-310001306965shel:Priceline1Membershel:UpstreamMembersrt:MaximumMember2023-12-310001306965shel:Priceline2Membershel:UpstreamMember2023-12-310001306965shel:HybridShellPlanAndIEANZE50Membershel:IntegratedGasMemberifrs-full:BottomOfRangeMember2024-12-310001306965shel:HybridShellPlanAndIEANZE50Membershel:IntegratedGasMemberifrs-full:TopOfRangeMember2024-12-310001306965shel:Priceline2Membershel:GasAssetsMembersrt:MinimumMember2023-12-310001306965shel:Priceline2Membershel:GasAssetsMembersrt:MaximumMember2023-12-310001306965shel:HybridShellPlanAndIEANZE50Membershel:UpstreamMemberifrs-full:TopOfRangeMember2024-12-310001306965shel:Priceline2Membershel:UpstreamAssetsMembersrt:MinimumMember2023-12-310001306965shel:HybridShellPlanAndIEANZE50Membershel:UpstreamMemberifrs-full:TopOfRangeMember2023-12-310001306965shel:Priceline3Membershel:IntegratedGasMember2023-12-310001306965shel:Priceline3Membershel:UpstreamMember2023-12-310001306965shel:IEANZE50Membershel:IntegratedGasMemberifrs-full:BottomOfRangeMember2024-12-310001306965shel:IEANZE50Membershel:IntegratedGasMemberifrs-full:TopOfRangeMember2024-12-310001306965shel:Priceline3Membershel:GasAssetsMembersrt:MinimumMember2023-12-310001306965shel:Priceline3Membershel:GasAssetsMembersrt:MaximumMember2023-12-310001306965shel:IEANZE50Membershel:UpstreamMemberifrs-full:BottomOfRangeMember2024-12-310001306965shel:IEANZE50Membershel:UpstreamMemberifrs-full:TopOfRangeMember2024-12-310001306965shel:Priceline3Membershel:UpstreamAssetsMembersrt:MinimumMember2023-12-310001306965shel:Priceline3Membershel:UpstreamAssetsMembersrt:MaximumMember2023-12-310001306965shel:ThousandTwentyTwentyFourMembershel:ShellMidPriceMember2024-01-012024-12-310001306965shel:TwoThousandTwentyFiveMembershel:ShellMidPriceMember2024-01-012024-12-310001306965shel:TwoThousandAndThirtyMembershel:ShellMidPriceMember2024-01-012024-12-310001306965shel:TwoThousandThirtyFiveMembershel:ShellMidPriceMember2024-01-012024-12-310001306965shel:TwoThousandAndFortyMembershel:ShellMidPriceMember2024-01-012024-12-310001306965shel:TwoThousandFourtyMembershel:ShellMidPriceMember2024-01-012024-12-310001306965shel:ThousandTwentyTwentyFourMembershel:A152DegreesCelsiusExternalClimateChangeMember2024-01-012024-12-310001306965shel:TwoThousandTwentyFiveMembershel:A152DegreesCelsiusExternalClimateChangeMember2024-01-012024-12-310001306965shel:TwoThousandAndThirtyMembershel:A152DegreesCelsiusExternalClimateChangeMember2024-01-012024-12-310001306965shel:TwoThousandThirtyFiveMembershel:A152DegreesCelsiusExternalClimateChangeMember2024-01-012024-12-310001306965shel:TwoThousandAndFortyMembershel:A152DegreesCelsiusExternalClimateChangeMember2024-01-012024-12-310001306965shel:TwoThousandFourtyMembershel:A152DegreesCelsiusExternalClimateChangeMember2024-01-012024-12-310001306965shel:ThousandTwentyTwentyFourMembershel:IEANZE50Member2024-01-012024-12-310001306965shel:TwoThousandTwentyFiveMembershel:IEANZE50Member2024-01-012024-12-310001306965shel:TwoThousandAndThirtyMembershel:IEANZE50Member2024-01-012024-12-310001306965shel:TwoThousandThirtyFiveMembershel:IEANZE50Member2024-01-012024-12-310001306965shel:TwoThousandAndFortyMembershel:IEANZE50Member2024-01-012024-12-310001306965shel:TwoThousandFourtyMembershel:IEANZE50Member2024-01-012024-12-310001306965shel:ThousandTwentyTwentyFourMembershel:NGFSGCAMNZE2050Member2024-01-012024-12-310001306965shel:TwoThousandTwentyFiveMembershel:NGFSGCAMNZE2050Member2024-01-012024-12-310001306965shel:TwoThousandAndThirtyMembershel:NGFSGCAMNZE2050Member2024-01-012024-12-310001306965shel:TwoThousandThirtyFiveMembershel:NGFSGCAMNZE2050Member2024-01-012024-12-310001306965shel:TwoThousandAndFortyMembershel:NGFSGCAMNZE2050Member2024-01-012024-12-310001306965shel:TwoThousandFourtyMembershel:NGFSGCAMNZE2050Member2024-01-012024-12-310001306965shel:ThousandTwentyTwentyFourMembershel:IEAAPSMember2024-01-012024-12-310001306965shel:TwoThousandTwentyFiveMembershel:IEAAPSMember2024-01-012024-12-310001306965shel:TwoThousandAndThirtyMembershel:IEAAPSMember2024-01-012024-12-310001306965shel:TwoThousandThirtyFiveMembershel:IEAAPSMember2024-01-012024-12-310001306965shel:TwoThousandAndFortyMembershel:IEAAPSMember2024-01-012024-12-310001306965shel:TwoThousandFourtyMembershel:IEAAPSMember2024-01-012024-12-310001306965shel:ShellMidPriceMembershel:IntegratedGasMember2023-12-310001306965shel:ShellMidPriceMembershel:IntegratedGasMemberifrs-full:BottomOfRangeMember2024-12-310001306965shel:ShellMidPriceMembershel:IntegratedGasMemberifrs-full:TopOfRangeMember2024-12-310001306965shel:ShellMidPriceMembershel:IntegratedGasMemberifrs-full:BottomOfRangeMember2023-12-310001306965shel:ShellMidPriceMembershel:IntegratedGasMemberifrs-full:TopOfRangeMember2023-12-310001306965shel:ShellMidPriceMembershel:UpstreamMember2023-12-310001306965shel:ShellMidPriceMembershel:UpstreamMemberifrs-full:BottomOfRangeMember2024-12-310001306965shel:ShellMidPriceMembershel:UpstreamMemberifrs-full:TopOfRangeMember2024-12-310001306965shel:ShellMidPriceMembershel:UpstreamMemberifrs-full:BottomOfRangeMember2023-12-310001306965shel:ShellMidPriceMembershel:UpstreamMemberifrs-full:TopOfRangeMember2023-12-310001306965shel:ShellMidPriceMembershel:IntegratedGasAndUpstreamSegmentsMember2024-12-310001306965shel:ShellMidPriceMembershel:IntegratedGasAndUpstreamSegmentsMember2023-12-310001306965shel:ShellMidPriceMembershel:IntegratedGasAndUpstreamSegmentsMemberifrs-full:BottomOfRangeMember2024-12-310001306965shel:ShellMidPriceMembershel:IntegratedGasAndUpstreamSegmentsMemberifrs-full:TopOfRangeMember2024-12-310001306965shel:ShellMidPriceMembershel:IntegratedGasAndUpstreamSegmentsMemberifrs-full:BottomOfRangeMember2023-12-310001306965shel:ShellMidPriceMembershel:IntegratedGasAndUpstreamSegmentsMemberifrs-full:TopOfRangeMember2023-12-310001306965shel:A2DegreesCelsiusExternalClimateChangeMembershel:IntegratedGasMember2024-12-310001306965shel:A2DegreesCelsiusExternalClimateChangeMembershel:IntegratedGasMember2023-12-310001306965shel:A2DegreesCelsiusExternalClimateChangeMembershel:IntegratedGasMemberifrs-full:BottomOfRangeMember2023-12-310001306965shel:A2DegreesCelsiusExternalClimateChangeMembershel:IntegratedGasMemberifrs-full:TopOfRangeMember2023-12-310001306965shel:A2DegreesCelsiusExternalClimateChangeMembershel:UpstreamMember2024-12-310001306965shel:A2DegreesCelsiusExternalClimateChangeMembershel:UpstreamMember2023-12-310001306965shel:A2DegreesCelsiusExternalClimateChangeMembershel:UpstreamMemberifrs-full:BottomOfRangeMember2023-12-310001306965shel:A2DegreesCelsiusExternalClimateChangeMembershel:UpstreamMemberifrs-full:TopOfRangeMember2023-12-310001306965shel:A2DegreesCelsiusExternalClimateChangeMember2024-12-310001306965shel:A2DegreesCelsiusExternalClimateChangeMember2023-12-310001306965shel:A2DegreesCelsiusExternalClimateChangeMembershel:IntegratedGasAndUpstreamSegmentsMemberifrs-full:BottomOfRangeMember2024-12-310001306965shel:A2DegreesCelsiusExternalClimateChangeMembershel:IntegratedGasAndUpstreamSegmentsMemberifrs-full:TopOfRangeMember2024-12-310001306965shel:A2DegreesCelsiusExternalClimateChangeMembershel:IntegratedGasAndUpstreamSegmentsMemberifrs-full:BottomOfRangeMember2023-12-310001306965shel:A2DegreesCelsiusExternalClimateChangeMembershel:IntegratedGasAndUpstreamSegmentsMemberifrs-full:TopOfRangeMember2023-12-310001306965shel:IEANZE50Membershel:IntegratedGasMember2024-12-310001306965shel:IEANZE50Membershel:IntegratedGasMember2023-12-310001306965shel:IEANZE50Membershel:IntegratedGasMemberifrs-full:BottomOfRangeMember2023-12-310001306965shel:IEANZE50Membershel:IntegratedGasMemberifrs-full:TopOfRangeMember2023-12-310001306965shel:IEANZE50Membershel:UpstreamMember2024-12-310001306965shel:IEANZE50Membershel:UpstreamMember2023-12-310001306965shel:IEANZE50Membershel:UpstreamMemberifrs-full:BottomOfRangeMember2023-12-310001306965shel:IEANZE50Membershel:UpstreamMemberifrs-full:TopOfRangeMember2023-12-310001306965shel:IEANZE50Membershel:IntegratedGasAndUpstreamSegmentsMember2024-12-310001306965shel:IEANZE50Membershel:IntegratedGasAndUpstreamSegmentsMember2023-12-310001306965shel:IEANZE50Membershel:IntegratedGasAndUpstreamSegmentsMemberifrs-full:BottomOfRangeMember2024-12-310001306965shel:IEANZE50Membershel:IntegratedGasAndUpstreamSegmentsMemberifrs-full:TopOfRangeMember2024-12-310001306965shel:IEANZE50Membershel:IntegratedGasAndUpstreamSegmentsMemberifrs-full:BottomOfRangeMember2023-12-310001306965shel:IEANZE50Membershel:IntegratedGasAndUpstreamSegmentsMemberifrs-full:TopOfRangeMember2023-12-310001306965shel:HybridShellPlanAndIEANZE50Membershel:IntegratedGasMember2024-12-310001306965shel:HybridShellPlanAndIEANZE50Membershel:IntegratedGasMember2023-12-310001306965shel:HybridShellPlanAndIEANZE50Membershel:IntegratedGasMemberifrs-full:BottomOfRangeMember2023-12-310001306965shel:HybridShellPlanAndIEANZE50Membershel:IntegratedGasMemberifrs-full:TopOfRangeMember2023-12-310001306965shel:HybridShellPlanAndIEANZE50Membershel:UpstreamMember2024-12-310001306965shel:HybridShellPlanAndIEANZE50Membershel:UpstreamMember2023-12-310001306965shel:HybridShellPlanAndIEANZE50Membershel:UpstreamMemberifrs-full:BottomOfRangeMember2024-12-310001306965shel:HybridShellPlanAndIEANZE50Membershel:UpstreamMemberifrs-full:BottomOfRangeMember2023-12-310001306965shel:HybridShellPlanAndIEANZE50Membershel:IntegratedGasAndUpstreamSegmentsMember2024-12-310001306965shel:HybridShellPlanAndIEANZE50Membershel:IntegratedGasAndUpstreamSegmentsMember2023-12-310001306965shel:HybridShellPlanAndIEANZE50Membershel:IntegratedGasAndUpstreamSegmentsMemberifrs-full:BottomOfRangeMember2024-12-310001306965shel:HybridShellPlanAndIEANZE50Membershel:IntegratedGasAndUpstreamSegmentsMemberifrs-full:TopOfRangeMember2024-12-310001306965shel:HybridShellPlanAndIEANZE50Membershel:IntegratedGasAndUpstreamSegmentsMemberifrs-full:BottomOfRangeMember2023-12-310001306965shel:HybridShellPlanAndIEANZE50Membershel:IntegratedGasAndUpstreamSegmentsMemberifrs-full:TopOfRangeMember2023-12-310001306965srt:ScenarioForecastMember2025-01-012025-12-310001306965srt:ScenarioForecastMember2034-01-012034-12-310001306965shel:ShellMidPriceMembersrt:MinimumMembersrt:ScenarioForecastMember2024-01-012024-12-310001306965shel:ShellMidPriceMembersrt:MaximumMembersrt:ScenarioForecastMember2024-01-012024-12-310001306965shel:IEANZE2050Membershel:IntegratedGasMembersrt:MinimumMember2024-12-310001306965shel:IEANZE2050Membershel:IntegratedGasMembersrt:MaximumMember2024-12-310001306965shel:IEANZE2050Membershel:IntegratedGasMembersrt:MinimumMember2023-12-310001306965shel:IEANZE2050Membershel:IntegratedGasMembersrt:MaximumMember2023-12-310001306965shel:IEANZE2050Membershel:UpstreamMembersrt:MaximumMember2024-12-310001306965shel:IEANZE2050Membershel:ChemicalsAndProductsSegmentMember2024-12-310001306965shel:IEANZE50Membershel:ChemicalsAndProductsSegmentMemberifrs-full:BottomOfRangeMembersrt:ScenarioForecastMember2024-01-012024-12-310001306965shel:IEANZE50Membershel:ChemicalsAndProductsSegmentMemberifrs-full:TopOfRangeMembersrt:ScenarioForecastMember2024-01-012024-12-310001306965shel:IEANZE2050Membershel:IntegratedGasMember2024-12-310001306965shel:IEANZE2050Membershel:IntegratedGasMember2023-12-310001306965shel:IEANZE2050Membershel:IntegratedGasMemberifrs-full:BottomOfRangeMember2024-12-310001306965shel:IEANZE2050Membershel:IntegratedGasMemberifrs-full:TopOfRangeMember2024-12-310001306965shel:IEANZE2050Membershel:IntegratedGasMemberifrs-full:BottomOfRangeMember2023-12-310001306965shel:IEANZE2050Membershel:IntegratedGasMemberifrs-full:TopOfRangeMember2023-12-310001306965shel:IEANZE2050Membershel:UpstreamMember2024-12-310001306965shel:IEANZE2050Membershel:UpstreamMember2023-12-310001306965shel:IEANZE2050Membershel:UpstreamMemberifrs-full:BottomOfRangeMember2024-12-310001306965shel:IEANZE2050Membershel:UpstreamMemberifrs-full:TopOfRangeMember2024-12-310001306965shel:IEANZE2050Membershel:UpstreamMemberifrs-full:BottomOfRangeMember2023-12-310001306965shel:IEANZE2050Membershel:UpstreamMemberifrs-full:TopOfRangeMember2023-12-310001306965shel:IEANZE2050Membershel:ChemicalsAndProductsSegmentMember2023-12-310001306965shel:IEANZE2050Membershel:ChemicalsAndProductsSegmentMemberifrs-full:BottomOfRangeMember2024-12-310001306965shel:IEANZE2050Membershel:ChemicalsAndProductsSegmentMemberifrs-full:TopOfRangeMember2024-12-310001306965shel:IEANZE2050Membershel:ChemicalsAndProductsSegmentMemberifrs-full:BottomOfRangeMember2023-12-310001306965shel:IEANZE2050Membershel:ChemicalsAndProductsSegmentMemberifrs-full:TopOfRangeMember2023-12-310001306965shel:IEANZE2050Membershel:IntegratedGasAndUpstreamSegmentsMember2024-12-310001306965shel:IEANZE2050Membershel:IntegratedGasAndUpstreamSegmentsMember2023-12-310001306965shel:IEANZE2050Membershel:IntegratedGasAndUpstreamSegmentsMemberifrs-full:BottomOfRangeMember2024-12-310001306965shel:IEANZE2050Membershel:IntegratedGasAndUpstreamSegmentsMemberifrs-full:TopOfRangeMember2024-12-310001306965shel:IEANZE2050Membershel:IntegratedGasAndUpstreamSegmentsMemberifrs-full:BottomOfRangeMember2023-12-310001306965shel:IEANZE2050Membershel:IntegratedGasAndUpstreamSegmentsMemberifrs-full:TopOfRangeMember2023-12-310001306965shel:ForecastYearsForChangeInCarbonEmissionsCostPeriodOneMembersrt:EuropeMemberifrs-full:BottomOfRangeMember2024-01-012024-12-310001306965shel:ForecastYearsForChangeInCarbonEmissionsCostPeriodOneMembersrt:EuropeMemberifrs-full:TopOfRangeMember2024-01-012024-12-310001306965shel:ForecastYearsForChangeInCarbonEmissionsCostPeriodTwoMembersrt:EuropeMemberifrs-full:BottomOfRangeMember2024-01-012024-12-310001306965shel:ForecastYearsForChangeInCarbonEmissionsCostPeriodTwoMembersrt:EuropeMemberifrs-full:TopOfRangeMember2024-01-012024-12-310001306965shel:ForecastYearsForChangeInCarbonEmissionsCostPeriodOneMembercountry:NOifrs-full:BottomOfRangeMember2024-01-012024-12-310001306965shel:ForecastYearsForChangeInCarbonEmissionsCostPeriodOneMembercountry:NOifrs-full:TopOfRangeMember2024-01-012024-12-310001306965shel:ForecastYearsForChangeInCarbonEmissionsCostPeriodTwoMembercountry:NOifrs-full:BottomOfRangeMember2023-01-012023-12-310001306965shel:ForecastYearsForChangeInCarbonEmissionsCostPeriodTwoMembercountry:NOifrs-full:TopOfRangeMember2023-01-012023-12-310001306965shel:ForecastYearsForChangeInCarbonEmissionsCostPeriodOneMembercountry:GBifrs-full:BottomOfRangeMember2024-01-012024-12-310001306965shel:ForecastYearsForChangeInCarbonEmissionsCostPeriodOneMembercountry:GBifrs-full:TopOfRangeMember2024-01-012024-12-310001306965shel:ForecastYearsForChangeInCarbonEmissionsCostPeriodTwoMembercountry:GBifrs-full:BottomOfRangeMember2023-01-012023-12-310001306965shel:ForecastYearsForChangeInCarbonEmissionsCostPeriodTwoMembercountry:GBifrs-full:TopOfRangeMember2023-01-012023-12-310001306965shel:ForecastYearsForChangeInCarbonEmissionsCostPeriodOneMembercountry:CAifrs-full:BottomOfRangeMember2024-01-012024-12-310001306965shel:ForecastYearsForChangeInCarbonEmissionsCostPeriodOneMembercountry:CAifrs-full:TopOfRangeMember2024-01-012024-12-310001306965shel:ForecastYearsForChangeInCarbonEmissionsCostPeriodTwoMembercountry:CAifrs-full:BottomOfRangeMember2024-01-012024-12-310001306965shel:ForecastYearsForChangeInCarbonEmissionsCostPeriodTwoMembercountry:CAifrs-full:TopOfRangeMember2024-01-012024-12-310001306965shel:ForecastYearsForChangeInCarbonEmissionsCostPeriodOneMembercountry:USifrs-full:BottomOfRangeMember2024-01-012024-12-310001306965shel:ForecastYearsForChangeInCarbonEmissionsCostPeriodOneMembercountry:USifrs-full:TopOfRangeMember2024-01-012024-12-310001306965shel:ForecastYearsForChangeInCarbonEmissionsCostPeriodTwoMembercountry:USifrs-full:BottomOfRangeMember2024-01-012024-12-310001306965shel:ForecastYearsForChangeInCarbonEmissionsCostPeriodTwoMembercountry:USifrs-full:TopOfRangeMember2024-01-012024-12-310001306965shel:ForecastYearsForChangeInCarbonEmissionsCostPeriodOneMembercountry:AUifrs-full:BottomOfRangeMember2024-01-012024-12-310001306965shel:ForecastYearsForChangeInCarbonEmissionsCostPeriodOneMembercountry:AUifrs-full:TopOfRangeMember2024-01-012024-12-310001306965shel:ForecastYearsForChangeInCarbonEmissionsCostPeriodTwoMembercountry:AUifrs-full:BottomOfRangeMember2024-01-012024-12-310001306965shel:ForecastYearsForChangeInCarbonEmissionsCostPeriodTwoMembercountry:AUifrs-full:TopOfRangeMember2024-01-012024-12-310001306965shel:ForecastYearsForChangeInCarbonEmissionsCostPeriodOneMembershel:OtherCountriesMemberifrs-full:BottomOfRangeMember2024-01-012024-12-310001306965shel:ForecastYearsForChangeInCarbonEmissionsCostPeriodOneMembershel:OtherCountriesMemberifrs-full:TopOfRangeMember2024-01-012024-12-310001306965shel:ForecastYearsForChangeInCarbonEmissionsCostPeriodTwoMembershel:OtherCountriesMemberifrs-full:BottomOfRangeMember2024-01-012024-12-310001306965shel:ForecastYearsForChangeInCarbonEmissionsCostPeriodTwoMembershel:OtherCountriesMemberifrs-full:TopOfRangeMember2024-01-012024-12-310001306965shel:ForecastYearsForChangeInCarbonEmissionsCostPeriodOneMembercountry:NLifrs-full:BottomOfRangeMember2024-01-012024-12-310001306965shel:ForecastYearsForChangeInCarbonEmissionsCostPeriodOneMembercountry:NLifrs-full:TopOfRangeMember2024-01-012024-12-310001306965shel:ForecastYearsForChangeInCarbonEmissionsCostPeriodTwoMembercountry:NLifrs-full:BottomOfRangeMember2024-01-012024-12-310001306965shel:ForecastYearsForChangeInCarbonEmissionsCostPeriodTwoMembercountry:NLifrs-full:TopOfRangeMember2024-01-012024-12-310001306965shel:ShellMidPriceMembersrt:ScenarioForecastMember2025-01-012025-12-310001306965shel:ShellMidPriceMembersrt:ScenarioForecastMember2030-01-012030-12-310001306965shel:ShellMidPriceMembersrt:ScenarioForecastMember2035-01-012035-12-310001306965shel:ShellMidPriceMembersrt:ScenarioForecastMember2040-01-012040-12-310001306965shel:ShellMidPriceMembersrt:ScenarioForecastMember2045-01-012045-12-310001306965shel:ShellMidPriceMembersrt:ScenarioForecastMember2050-01-012050-12-310001306965shel:IEANZE50Membersrt:ScenarioForecastMember2025-01-012025-12-310001306965shel:IEANZE50Membersrt:ScenarioForecastMember2030-01-012030-12-310001306965shel:IEANZE50Membersrt:ScenarioForecastMember2035-01-012035-12-310001306965shel:IEANZE50Membersrt:ScenarioForecastMember2040-01-012040-12-310001306965shel:IEANZE50Membersrt:ScenarioForecastMember2045-01-012045-12-310001306965shel:IEANZE50Membersrt:ScenarioForecastMember2050-01-012050-12-310001306965shel:ChemicalsMembershel:ChemicalsAndProductsSegmentMember2016-12-310001306965shel:ChemicalsMembershel:ChemicalsAndProductsSegmentMember2017-12-310001306965shel:ChemicalsMembershel:ChemicalsAndProductsSegmentMember2018-12-310001306965shel:ChemicalsMembershel:ChemicalsAndProductsSegmentMember2019-12-310001306965shel:ChemicalsMembershel:ChemicalsAndProductsSegmentMember2020-12-310001306965shel:ChemicalsMembershel:ChemicalsAndProductsSegmentMember2021-12-310001306965shel:ChemicalsMembershel:ChemicalsAndProductsSegmentMember2022-12-310001306965shel:ChemicalsMembershel:ChemicalsAndProductsSegmentMember2023-12-310001306965shel:ChemicalsMembershel:ChemicalsAndProductsSegmentMember2024-12-310001306965shel:RefineriesMembershel:ChemicalsAndProductsSegmentMember2016-12-310001306965shel:RefineriesMembershel:ChemicalsAndProductsSegmentMember2017-12-310001306965shel:RefineriesMembershel:ChemicalsAndProductsSegmentMember2018-12-310001306965shel:RefineriesMembershel:ChemicalsAndProductsSegmentMember2019-12-310001306965shel:RefineriesMembershel:ChemicalsAndProductsSegmentMember2020-12-310001306965shel:RefineriesMembershel:ChemicalsAndProductsSegmentMember2021-12-310001306965shel:RefineriesMembershel:ChemicalsAndProductsSegmentMember2022-12-310001306965shel:RefineriesMembershel:ChemicalsAndProductsSegmentMember2023-12-310001306965shel:RefineriesMembershel:ChemicalsAndProductsSegmentMember2024-12-310001306965shel:OtherChemicalAndProductionAssetsMembershel:ChemicalsAndProductsSegmentMember2016-12-310001306965shel:OtherChemicalAndProductionAssetsMembershel:ChemicalsAndProductsSegmentMember2017-12-310001306965shel:OtherChemicalAndProductionAssetsMembershel:ChemicalsAndProductsSegmentMember2018-12-310001306965shel:OtherChemicalAndProductionAssetsMembershel:ChemicalsAndProductsSegmentMember2019-12-310001306965shel:OtherChemicalAndProductionAssetsMembershel:ChemicalsAndProductsSegmentMember2020-12-310001306965shel:OtherChemicalAndProductionAssetsMembershel:ChemicalsAndProductsSegmentMember2021-12-310001306965shel:OtherChemicalAndProductionAssetsMembershel:ChemicalsAndProductsSegmentMember2022-12-310001306965shel:OtherChemicalAndProductionAssetsMembershel:ChemicalsAndProductsSegmentMember2023-12-310001306965shel:OtherChemicalAndProductionAssetsMembershel:ChemicalsAndProductsSegmentMember2024-12-310001306965shel:ChemicalsAndProductsSegmentMember2016-12-310001306965shel:ChemicalsAndProductsSegmentMember2017-12-310001306965shel:ChemicalsAndProductsSegmentMember2018-12-310001306965shel:ChemicalsAndProductsSegmentMember2019-12-310001306965shel:ChemicalsAndProductsSegmentMember2020-12-310001306965shel:ChemicalsAndProductsSegmentMember2021-12-310001306965shel:ChemicalsAndProductsSegmentMember2022-12-3100013069652016-12-3100013069652017-01-012024-12-310001306965ifrs-full:NoncurrentAssetsHeldForSaleMember2024-12-310001306965shel:RefineriesMember2016-12-310001306965shel:RefineriesMember2024-12-310001306965shel:RefineriesMembershel:ChemicalsAndProductsSegmentMember2024-01-012024-12-310001306965shel:RefineriesMembersrt:MinimumMember2024-01-012024-12-310001306965shel:RefineriesMembersrt:MaximumMember2024-01-012024-12-310001306965shel:PropertyPlantAndEquipmentOtherThanRefineriesMember2024-12-310001306965shel:ChemicalsSegmentMember2024-12-310001306965shel:ChemicalsSegmentMemberstpr:PA2024-12-310001306965shel:TradingAndSupplySegmentMember2024-12-310001306965ifrs-full:TopOfRangeMember2024-01-012024-12-310001306965ifrs-full:BottomOfRangeMember2023-01-012023-12-310001306965ifrs-full:TopOfRangeMember2023-01-012023-12-310001306965shel:MarketingSegmentMember2017-12-310001306965shel:MarketingSegmentMember2018-12-310001306965shel:MarketingSegmentMember2019-12-310001306965shel:MarketingSegmentMember2020-12-310001306965shel:MarketingSegmentMember2021-12-310001306965shel:MarketingSegmentMember2022-12-310001306965shel:RenewablesAndEnergySolutionsSegmentMember2017-12-310001306965shel:RenewablesAndEnergySolutionsSegmentMember2018-12-310001306965shel:RenewablesAndEnergySolutionsSegmentMember2019-12-310001306965shel:RenewablesAndEnergySolutionsSegmentMember2020-12-310001306965shel:RenewablesAndEnergySolutionsSegmentMember2021-12-310001306965shel:RenewablesAndEnergySolutionsSegmentMember2022-12-310001306965shel:PowerInfrastructureMember2024-01-012024-12-310001306965ifrs-full:OtherPropertyPlantAndEquipmentMember2024-01-012024-12-310001306965ifrs-full:ActuarialAssumptionOfDiscountRatesMember2024-12-310001306965ifrs-full:ActuarialAssumptionOfDiscountRatesMembershel:IntegratedGasAndUpstreamSegmentsMemberifrs-full:BottomOfRangeMember2024-01-012024-12-310001306965ifrs-full:ActuarialAssumptionOfDiscountRatesMembershel:IntegratedGasAndUpstreamSegmentsMemberifrs-full:TopOfRangeMember2024-01-012024-12-310001306965ifrs-full:ActuarialAssumptionOfDiscountRatesMembershel:IntegratedGasAndUpstreamSegmentsMemberifrs-full:BottomOfRangeMember2023-01-012023-12-310001306965ifrs-full:ActuarialAssumptionOfDiscountRatesMembershel:IntegratedGasAndUpstreamSegmentsMemberifrs-full:TopOfRangeMember2023-01-012023-12-310001306965ifrs-full:ActuarialAssumptionOfDiscountRatesMemberifrs-full:AllOtherSegmentsMember2024-01-012024-12-310001306965ifrs-full:ActuarialAssumptionOfDiscountRatesMemberifrs-full:AllOtherSegmentsMember2023-01-012023-12-310001306965ifrs-full:BottomOfRangeMember2024-01-012024-12-310001306965shel:BrazilMalaysiaAndAustraliaMember2024-12-310001306965shel:BrazilMalaysiaAndAustraliaMember2023-12-310001306965shel:ChemicalAndProductsSegmentMarketingSegmentMember2024-12-310001306965shel:ChemicalAndProductsSegmentMarketingSegmentMember2023-12-310001306965shel:IEANZE50Membershel:IntegratedGasAndUpstreamSegmentsMemberifrs-full:BottomOfRangeMembersrt:ScenarioForecastMember2024-01-012024-12-310001306965shel:IEANZE50Membershel:IntegratedGasAndUpstreamSegmentsMemberifrs-full:TopOfRangeMembersrt:ScenarioForecastMember2024-01-012024-12-310001306965ifrs-full:RetainedEarningsMembersrt:ScenarioForecastMember2024-01-012024-12-310001306965shel:ElectronicTradingSchemesAndRelatedSchemesMember2024-01-012024-12-310001306965shel:ElectronicTradingSchemesAndRelatedSchemesMember2023-01-012023-12-310001306965shel:ElectronicTradingSchemesAndRelatedSchemesMember2022-01-012022-12-310001306965shel:BiofuelSchemesMember2024-01-012024-12-310001306965shel:BiofuelSchemesMember2023-01-012023-12-310001306965shel:BiofuelSchemesMember2022-01-012022-12-310001306965shel:RenewablePowerSchemesMember2024-01-012024-12-310001306965shel:RenewablePowerSchemesMember2023-01-012023-12-310001306965shel:RenewablePowerSchemesMember2022-01-012022-12-310001306965shel:ElectronicTradingSchemesAndRelatedSchemesMember2023-12-310001306965shel:BiofuelSchemesMember2023-12-310001306965shel:RenewablePowerSchemesMember2023-12-310001306965shel:EmissionsInstrumentsMember2023-12-310001306965shel:EmissionsInstrumentsMember2024-01-012024-12-310001306965shel:ElectronicTradingSchemesAndRelatedSchemesMember2024-12-310001306965shel:BiofuelSchemesMember2024-12-310001306965shel:RenewablePowerSchemesMember2024-12-310001306965shel:EmissionsInstrumentsMember2024-12-310001306965shel:ElectronicTradingSchemesAndRelatedSchemesMember2022-12-310001306965shel:BiofuelSchemesMember2022-12-310001306965shel:RenewablePowerSchemesMember2022-12-310001306965shel:EmissionsInstrumentsMember2022-12-310001306965shel:EmissionsInstrumentsMember2023-01-012023-12-310001306965ifrs-full:BottomOfRangeMembersrt:ScenarioForecastMember2024-01-012024-12-310001306965ifrs-full:TopOfRangeMembersrt:ScenarioForecastMember2024-01-012024-12-310001306965ifrs-full:BottomOfRangeMembersrt:ScenarioForecastMember2025-01-012028-12-310001306965ifrs-full:TopOfRangeMembersrt:ScenarioForecastMember2025-01-012028-12-3100013069652021-10-012024-12-310001306965ifrs-full:BottomOfRangeMember2021-10-012024-12-310001306965srt:ScenarioForecastMember2024-10-012024-12-310001306965shel:IntegratedGasAndUpstreamCashGeneratingUnitMemberifrs-full:BottomOfRangeMembersrt:ScenarioForecastMember2025-01-012028-12-310001306965shel:IntegratedGasAndUpstreamCashGeneratingUnitMemberifrs-full:TopOfRangeMembersrt:ScenarioForecastMember2025-01-012028-12-310001306965srt:ScenarioForecastMembershel:DownstreamRenewablesAndEnergySolutionsCashGeneratingUnitMember2025-01-012028-12-310001306965srt:ScenarioForecastMember2024-01-012024-12-310001306965shel:IntegratedGasMember2024-01-012024-12-310001306965shel:UpstreamMember2024-01-012024-12-310001306965shel:MarketingSegmentMember2024-01-012024-12-310001306965shel:ChemicalsAndProductsSegmentMember2024-01-012024-12-310001306965shel:RenewablesAndEnergySolutionsSegmentMember2024-01-012024-12-310001306965shel:CorporateSegment1Member2024-01-012024-12-310001306965ifrs-full:EliminationOfIntersegmentAmountsMembershel:IntegratedGasMember2024-01-012024-12-310001306965ifrs-full:EliminationOfIntersegmentAmountsMembershel:UpstreamMember2024-01-012024-12-310001306965ifrs-full:EliminationOfIntersegmentAmountsMembershel:MarketingSegmentMember2024-01-012024-12-310001306965ifrs-full:EliminationOfIntersegmentAmountsMembershel:ChemicalsAndProductsSegmentMember2024-01-012024-12-310001306965ifrs-full:EliminationOfIntersegmentAmountsMembershel:RenewablesAndEnergySolutionsSegmentMember2024-01-012024-12-310001306965ifrs-full:EliminationOfIntersegmentAmountsMembershel:CorporateSegment1Member2024-01-012024-12-310001306965ifrs-full:EliminationOfIntersegmentAmountsMember2024-01-012024-12-310001306965ifrs-full:OperatingSegmentsMembershel:IntegratedGasMember2024-01-012024-12-310001306965ifrs-full:OperatingSegmentsMembershel:UpstreamMember2024-01-012024-12-310001306965ifrs-full:OperatingSegmentsMembershel:MarketingSegmentMember2024-01-012024-12-310001306965ifrs-full:OperatingSegmentsMembershel:ChemicalsAndProductsSegmentMember2024-01-012024-12-310001306965ifrs-full:OperatingSegmentsMembershel:RenewablesAndEnergySolutionsSegmentMember2024-01-012024-12-310001306965ifrs-full:OperatingSegmentsMembershel:CorporateSegment1Member2024-01-012024-12-310001306965ifrs-full:OperatingSegmentsMember2024-01-012024-12-310001306965shel:CurrentCostOfSuppliesBasisEarningsMembershel:IntegratedGasMember2024-01-012024-12-310001306965shel:CurrentCostOfSuppliesBasisEarningsMembershel:UpstreamMember2024-01-012024-12-310001306965shel:CurrentCostOfSuppliesBasisEarningsMembershel:MarketingSegmentMember2024-01-012024-12-310001306965shel:CurrentCostOfSuppliesBasisEarningsMembershel:ChemicalsAndProductsSegmentMember2024-01-012024-12-310001306965shel:CurrentCostOfSuppliesBasisEarningsMembershel:RenewablesAndEnergySolutionsSegmentMember2024-01-012024-12-310001306965shel:CurrentCostOfSuppliesBasisEarningsMembershel:CorporateSegment1Member2024-01-012024-12-310001306965shel:CurrentCostOfSuppliesBasisEarningsMember2024-01-012024-12-310001306965shel:IntegratedGasMember2023-01-012023-12-310001306965shel:UpstreamMember2023-01-012023-12-310001306965shel:MarketingSegmentMember2023-01-012023-12-310001306965shel:ChemicalsAndProductsSegmentMember2023-01-012023-12-310001306965shel:RenewablesAndEnergySolutionsSegmentMember2023-01-012023-12-310001306965shel:CorporateSegment1Member2023-01-012023-12-310001306965ifrs-full:EliminationOfIntersegmentAmountsMembershel:IntegratedGasMember2023-01-012023-12-310001306965ifrs-full:EliminationOfIntersegmentAmountsMembershel:UpstreamMember2023-01-012023-12-310001306965ifrs-full:EliminationOfIntersegmentAmountsMembershel:MarketingSegmentMember2023-01-012023-12-310001306965ifrs-full:EliminationOfIntersegmentAmountsMembershel:ChemicalsAndProductsSegmentMember2023-01-012023-12-310001306965ifrs-full:EliminationOfIntersegmentAmountsMembershel:RenewablesAndEnergySolutionsSegmentMember2023-01-012023-12-310001306965ifrs-full:EliminationOfIntersegmentAmountsMembershel:CorporateSegment1Member2023-01-012023-12-310001306965ifrs-full:EliminationOfIntersegmentAmountsMember2023-01-012023-12-310001306965ifrs-full:OperatingSegmentsMembershel:IntegratedGasMember2023-01-012023-12-310001306965ifrs-full:OperatingSegmentsMembershel:UpstreamMember2023-01-012023-12-310001306965ifrs-full:OperatingSegmentsMembershel:MarketingSegmentMember2023-01-012023-12-310001306965ifrs-full:OperatingSegmentsMembershel:ChemicalsAndProductsSegmentMember2023-01-012023-12-310001306965ifrs-full:OperatingSegmentsMembershel:RenewablesAndEnergySolutionsSegmentMember2023-01-012023-12-310001306965ifrs-full:OperatingSegmentsMembershel:CorporateSegment1Member2023-01-012023-12-310001306965ifrs-full:OperatingSegmentsMember2023-01-012023-12-310001306965shel:CurrentCostOfSuppliesBasisEarningsMembershel:IntegratedGasMember2023-01-012023-12-310001306965shel:CurrentCostOfSuppliesBasisEarningsMembershel:UpstreamMember2023-01-012023-12-310001306965shel:CurrentCostOfSuppliesBasisEarningsMembershel:MarketingSegmentMember2023-01-012023-12-310001306965shel:CurrentCostOfSuppliesBasisEarningsMembershel:ChemicalsAndProductsSegmentMember2023-01-012023-12-310001306965shel:CurrentCostOfSuppliesBasisEarningsMembershel:RenewablesAndEnergySolutionsSegmentMember2023-01-012023-12-310001306965shel:CurrentCostOfSuppliesBasisEarningsMembershel:CorporateSegment1Member2023-01-012023-12-310001306965shel:CurrentCostOfSuppliesBasisEarningsMember2023-01-012023-12-310001306965shel:ChemicalsAndProductsSegmentMembershel:CurrentCostOfSuppliesBasisEarningsMembersrt:RevisionOfPriorPeriodReclassificationAdjustmentMember2023-01-012023-12-310001306965shel:MarketingSegmentMembershel:CurrentCostOfSuppliesBasisEarningsMembersrt:RevisionOfPriorPeriodReclassificationAdjustmentMember2023-01-012023-12-310001306965shel:Corporate1Membershel:CurrentCostOfSuppliesBasisEarningsMembersrt:RevisionOfPriorPeriodReclassificationAdjustmentMember2023-01-012023-12-310001306965shel:IntegratedGasMember2022-01-012022-12-310001306965shel:UpstreamMember2022-01-012022-12-310001306965shel:MarketingSegmentMember2022-01-012022-12-310001306965shel:ChemicalsAndProductsSegmentMember2022-01-012022-12-310001306965shel:RenewablesAndEnergySolutionsSegmentMember2022-01-012022-12-310001306965shel:CorporateSegment1Member2022-01-012022-12-310001306965ifrs-full:EliminationOfIntersegmentAmountsMembershel:IntegratedGasMember2022-01-012022-12-310001306965ifrs-full:EliminationOfIntersegmentAmountsMembershel:UpstreamMember2022-01-012022-12-310001306965ifrs-full:EliminationOfIntersegmentAmountsMembershel:MarketingSegmentMember2022-01-012022-12-310001306965ifrs-full:EliminationOfIntersegmentAmountsMembershel:ChemicalsAndProductsSegmentMember2022-01-012022-12-310001306965ifrs-full:EliminationOfIntersegmentAmountsMembershel:RenewablesAndEnergySolutionsSegmentMember2022-01-012022-12-310001306965ifrs-full:EliminationOfIntersegmentAmountsMembershel:CorporateSegment1Member2022-01-012022-12-310001306965ifrs-full:EliminationOfIntersegmentAmountsMember2022-01-012022-12-310001306965ifrs-full:OperatingSegmentsMembershel:IntegratedGasMember2022-01-012022-12-310001306965ifrs-full:OperatingSegmentsMembershel:UpstreamMember2022-01-012022-12-310001306965ifrs-full:OperatingSegmentsMembershel:MarketingSegmentMember2022-01-012022-12-310001306965ifrs-full:OperatingSegmentsMembershel:ChemicalsAndProductsSegmentMember2022-01-012022-12-310001306965ifrs-full:OperatingSegmentsMembershel:RenewablesAndEnergySolutionsSegmentMember2022-01-012022-12-310001306965ifrs-full:OperatingSegmentsMembershel:CorporateSegment1Member2022-01-012022-12-310001306965ifrs-full:OperatingSegmentsMember2022-01-012022-12-310001306965shel:CurrentCostOfSuppliesBasisEarningsMembershel:IntegratedGasMember2022-01-012022-12-310001306965shel:CurrentCostOfSuppliesBasisEarningsMembershel:UpstreamMember2022-01-012022-12-310001306965shel:CurrentCostOfSuppliesBasisEarningsMembershel:MarketingSegmentMember2022-01-012022-12-310001306965shel:CurrentCostOfSuppliesBasisEarningsMembershel:ChemicalsAndProductsSegmentMember2022-01-012022-12-310001306965shel:CurrentCostOfSuppliesBasisEarningsMembershel:RenewablesAndEnergySolutionsSegmentMember2022-01-012022-12-310001306965shel:CurrentCostOfSuppliesBasisEarningsMembershel:CorporateSegment1Member2022-01-012022-12-310001306965shel:CurrentCostOfSuppliesBasisEarningsMember2022-01-012022-12-310001306965shel:MarketingSegmentMembershel:CurrentCostOfSuppliesBasisEarningsMembersrt:RevisionOfPriorPeriodReclassificationAdjustmentMember2022-01-012022-12-310001306965shel:ChemicalsAndProductsSegmentMembershel:CurrentCostOfSuppliesBasisEarningsMembersrt:RevisionOfPriorPeriodReclassificationAdjustmentMember2022-01-012022-12-310001306965shel:Corporate1Membershel:CurrentCostOfSuppliesBasisEarningsMembersrt:RevisionOfPriorPeriodReclassificationAdjustmentMember2022-01-012022-12-310001306965srt:EuropeMember2024-01-012024-12-310001306965shel:AsiaOceaniaAndAfricaMember2024-01-012024-12-310001306965country:US2024-01-012024-12-310001306965shel:OtherAmericasMember2024-01-012024-12-310001306965srt:EuropeMember2024-12-310001306965shel:AsiaOceaniaAndAfricaMember2024-12-310001306965country:US2024-12-310001306965shel:OtherAmericasMember2024-12-310001306965country:GB2024-01-012024-12-310001306965country:GB2024-12-310001306965srt:EuropeMember2023-01-012023-12-310001306965shel:AsiaOceaniaAndAfricaMember2023-01-012023-12-310001306965country:US2023-01-012023-12-310001306965shel:OtherAmericasMember2023-01-012023-12-310001306965srt:EuropeMember2023-12-310001306965shel:AsiaOceaniaAndAfricaMember2023-12-310001306965country:US2023-12-310001306965shel:OtherAmericasMember2023-12-310001306965country:GB2023-01-012023-12-310001306965country:GB2023-12-310001306965srt:EuropeMember2022-01-012022-12-310001306965shel:AsiaOceaniaAndAfricaMember2022-01-012022-12-310001306965country:US2022-01-012022-12-310001306965shel:OtherAmericasMember2022-01-012022-12-310001306965srt:EuropeMember2022-12-310001306965shel:AsiaOceaniaAndAfricaMember2022-12-310001306965country:US2022-12-310001306965shel:OtherAmericasMember2022-12-310001306965country:GB2022-01-012022-12-310001306965country:GB2022-12-310001306965srt:CrudeOilMember2024-01-012024-12-310001306965srt:CrudeOilMember2023-01-012023-12-310001306965srt:CrudeOilMember2022-01-012022-12-310001306965shel:OilProductsMember2024-01-012024-12-310001306965shel:OilProductsMember2023-01-012023-12-310001306965shel:OilProductsMember2022-01-012022-12-310001306965srt:NaturalGasPerThousandCubicFeetMember2024-01-012024-12-310001306965srt:NaturalGasPerThousandCubicFeetMember2023-01-012023-12-310001306965srt:NaturalGasPerThousandCubicFeetMember2022-01-012022-12-310001306965shel:LiquefiedNaturalGasLNGMember2024-01-012024-12-310001306965shel:LiquefiedNaturalGasLNGMember2023-01-012023-12-310001306965shel:LiquefiedNaturalGasLNGMember2022-01-012022-12-310001306965shel:PowerMember2024-01-012024-12-310001306965shel:PowerMember2023-01-012023-12-310001306965shel:PowerMember2022-01-012022-12-310001306965shel:LubricantsMember2024-01-012024-12-310001306965shel:LubricantsMember2023-01-012023-12-310001306965shel:LubricantsMember2022-01-012022-12-310001306965shel:ChemicalProductsMember2024-01-012024-12-310001306965shel:ChemicalProductsMember2023-01-012023-12-310001306965shel:ChemicalProductsMember2022-01-012022-12-310001306965shel:OtherContractsMember2024-01-012024-12-310001306965shel:OtherContractsMember2023-01-012023-12-310001306965shel:OtherContractsMember2022-01-012022-12-310001306965ifrs-full:GrossCarryingAmountMember2023-12-310001306965ifrs-full:GrossCarryingAmountMembershel:LNGOffTakeAndSalesContractsMember2023-12-310001306965ifrs-full:GrossCarryingAmountMembershel:EnvironmentalCertificatesMember2023-12-310001306965ifrs-full:GrossCarryingAmountMemberifrs-full:OtherIntangibleAssetsMember2023-12-310001306965ifrs-full:GrossCarryingAmountMember2024-01-012024-12-310001306965ifrs-full:GrossCarryingAmountMembershel:LNGOffTakeAndSalesContractsMember2024-01-012024-12-310001306965ifrs-full:GrossCarryingAmountMembershel:EnvironmentalCertificatesMember2024-01-012024-12-310001306965ifrs-full:GrossCarryingAmountMemberifrs-full:OtherIntangibleAssetsMember2024-01-012024-12-310001306965ifrs-full:GrossCarryingAmountMember2024-12-310001306965ifrs-full:GrossCarryingAmountMembershel:LNGOffTakeAndSalesContractsMember2024-12-310001306965ifrs-full:GrossCarryingAmountMembershel:EnvironmentalCertificatesMember2024-12-310001306965ifrs-full:GrossCarryingAmountMemberifrs-full:OtherIntangibleAssetsMember2024-12-310001306965ifrs-full:AccumulatedDepreciationAmortisationAndImpairmentMember2023-12-310001306965ifrs-full:AccumulatedDepreciationAmortisationAndImpairmentMembershel:LNGOffTakeAndSalesContractsMember2023-12-310001306965ifrs-full:AccumulatedDepreciationAmortisationAndImpairmentMemberifrs-full:OtherIntangibleAssetsMember2023-12-310001306965ifrs-full:AccumulatedDepreciationAmortisationAndImpairmentMember2024-01-012024-12-310001306965ifrs-full:AccumulatedDepreciationAmortisationAndImpairmentMembershel:LNGOffTakeAndSalesContractsMember2024-01-012024-12-310001306965ifrs-full:AccumulatedDepreciationAmortisationAndImpairmentMemberifrs-full:OtherIntangibleAssetsMember2024-01-012024-12-310001306965ifrs-full:AccumulatedDepreciationAmortisationAndImpairmentMember2024-12-310001306965ifrs-full:AccumulatedDepreciationAmortisationAndImpairmentMembershel:LNGOffTakeAndSalesContractsMember2024-12-310001306965ifrs-full:AccumulatedDepreciationAmortisationAndImpairmentMemberifrs-full:OtherIntangibleAssetsMember2024-12-310001306965shel:LNGOffTakeAndSalesContractsMember2024-12-310001306965shel:EnvironmentalCertificatesMember2024-12-310001306965ifrs-full:OtherIntangibleAssetsMember2024-12-310001306965ifrs-full:ComputerSoftwareMember2024-12-310001306965ifrs-full:GrossCarryingAmountMember2022-12-310001306965ifrs-full:GrossCarryingAmountMembershel:LNGOffTakeAndSalesContractsMember2022-12-310001306965ifrs-full:GrossCarryingAmountMembershel:EnvironmentalCertificatesMember2022-12-310001306965ifrs-full:GrossCarryingAmountMemberifrs-full:OtherIntangibleAssetsMember2022-12-310001306965ifrs-full:GrossCarryingAmountMember2023-01-012023-12-310001306965ifrs-full:GrossCarryingAmountMembershel:LNGOffTakeAndSalesContractsMember2023-01-012023-12-310001306965ifrs-full:GrossCarryingAmountMembershel:EnvironmentalCertificatesMember2023-01-012023-12-310001306965ifrs-full:GrossCarryingAmountMemberifrs-full:OtherIntangibleAssetsMember2023-01-012023-12-310001306965ifrs-full:AccumulatedDepreciationAmortisationAndImpairmentMember2022-12-310001306965ifrs-full:AccumulatedDepreciationAmortisationAndImpairmentMembershel:LNGOffTakeAndSalesContractsMember2022-12-310001306965ifrs-full:AccumulatedDepreciationAmortisationAndImpairmentMemberifrs-full:OtherIntangibleAssetsMember2022-12-310001306965ifrs-full:AccumulatedDepreciationAmortisationAndImpairmentMember2023-01-012023-12-310001306965ifrs-full:AccumulatedDepreciationAmortisationAndImpairmentMembershel:LNGOffTakeAndSalesContractsMember2023-01-012023-12-310001306965ifrs-full:AccumulatedDepreciationAmortisationAndImpairmentMemberifrs-full:OtherIntangibleAssetsMember2023-01-012023-12-310001306965shel:LNGOffTakeAndSalesContractsMember2023-12-310001306965shel:EnvironmentalCertificatesMember2023-12-310001306965ifrs-full:OtherIntangibleAssetsMember2023-12-310001306965shel:MarketingRenewablesAndEnergySolutionsMemberifrs-full:GrossCarryingAmountMemberifrs-full:OtherIntangibleAssetsMember2023-01-012023-12-310001306965ifrs-full:GrossCarryingAmountMemberifrs-full:ComputerSoftwareMember2024-01-012024-12-310001306965ifrs-full:ComputerSoftwareMember2023-12-310001306965shel:BGGroupPlcMembershel:IntegratedGasMember2024-12-310001306965shel:BGGroupPlcMembershel:UpstreamMember2024-12-310001306965shel:BGGroupPlcMembershel:OilProductsSegmentMember2024-12-310001306965ifrs-full:GrossCarryingAmountMemberifrs-full:ExplorationAndEvaluationAssetsMember2023-12-310001306965ifrs-full:GrossCarryingAmountMembershel:ProductionMember2023-12-310001306965ifrs-full:GrossCarryingAmountMembershel:ManufacturingSupplyAndDistributionMember2023-12-310001306965ifrs-full:GrossCarryingAmountMemberifrs-full:OtherPropertyPlantAndEquipmentMember2023-12-310001306965ifrs-full:GrossCarryingAmountMemberifrs-full:ExplorationAndEvaluationAssetsMember2024-01-012024-12-310001306965ifrs-full:GrossCarryingAmountMembershel:ProductionMember2024-01-012024-12-310001306965ifrs-full:GrossCarryingAmountMembershel:ManufacturingSupplyAndDistributionMember2024-01-012024-12-310001306965ifrs-full:GrossCarryingAmountMemberifrs-full:OtherPropertyPlantAndEquipmentMember2024-01-012024-12-310001306965ifrs-full:GrossCarryingAmountMemberifrs-full:ExplorationAndEvaluationAssetsMember2024-12-310001306965ifrs-full:GrossCarryingAmountMembershel:ProductionMember2024-12-310001306965ifrs-full:GrossCarryingAmountMembershel:ManufacturingSupplyAndDistributionMember2024-12-310001306965ifrs-full:GrossCarryingAmountMemberifrs-full:OtherPropertyPlantAndEquipmentMember2024-12-310001306965ifrs-full:AccumulatedDepreciationAmortisationAndImpairmentMemberifrs-full:ExplorationAndEvaluationAssetsMember2023-12-310001306965ifrs-full:AccumulatedDepreciationAmortisationAndImpairmentMembershel:ProductionMember2023-12-310001306965ifrs-full:AccumulatedDepreciationAmortisationAndImpairmentMembershel:ManufacturingSupplyAndDistributionMember2023-12-310001306965ifrs-full:AccumulatedDepreciationAmortisationAndImpairmentMemberifrs-full:OtherPropertyPlantAndEquipmentMember2023-12-310001306965ifrs-full:AccumulatedDepreciationAmortisationAndImpairmentMemberifrs-full:ExplorationAndEvaluationAssetsMember2024-01-012024-12-310001306965ifrs-full:AccumulatedDepreciationAmortisationAndImpairmentMembershel:ProductionMember2024-01-012024-12-310001306965ifrs-full:AccumulatedDepreciationAmortisationAndImpairmentMembershel:ManufacturingSupplyAndDistributionMember2024-01-012024-12-310001306965ifrs-full:AccumulatedDepreciationAmortisationAndImpairmentMemberifrs-full:OtherPropertyPlantAndEquipmentMember2024-01-012024-12-310001306965ifrs-full:AccumulatedDepreciationAmortisationAndImpairmentMemberifrs-full:ExplorationAndEvaluationAssetsMember2024-12-310001306965ifrs-full:AccumulatedDepreciationAmortisationAndImpairmentMembershel:ProductionMember2024-12-310001306965ifrs-full:AccumulatedDepreciationAmortisationAndImpairmentMembershel:ManufacturingSupplyAndDistributionMember2024-12-310001306965ifrs-full:AccumulatedDepreciationAmortisationAndImpairmentMemberifrs-full:OtherPropertyPlantAndEquipmentMember2024-12-310001306965shel:ProductionMember2024-12-310001306965shel:ManufacturingSupplyAndDistributionMember2024-12-310001306965ifrs-full:OtherPropertyPlantAndEquipmentMember2024-12-310001306965ifrs-full:GrossCarryingAmountMemberifrs-full:ExplorationAndEvaluationAssetsMember2022-12-310001306965ifrs-full:GrossCarryingAmountMembershel:ProductionMember2022-12-310001306965ifrs-full:GrossCarryingAmountMembershel:ManufacturingSupplyAndDistributionMember2022-12-310001306965ifrs-full:GrossCarryingAmountMemberifrs-full:OtherPropertyPlantAndEquipmentMember2022-12-310001306965ifrs-full:GrossCarryingAmountMemberifrs-full:ExplorationAndEvaluationAssetsMember2023-01-012023-12-310001306965ifrs-full:GrossCarryingAmountMembershel:ProductionMember2023-01-012023-12-310001306965ifrs-full:GrossCarryingAmountMembershel:ManufacturingSupplyAndDistributionMember2023-01-012023-12-310001306965ifrs-full:GrossCarryingAmountMemberifrs-full:OtherPropertyPlantAndEquipmentMember2023-01-012023-12-310001306965ifrs-full:GrossCarryingAmountMemberifrs-full:ExplorationAndEvaluationAssetsMember2023-01-012023-12-310001306965ifrs-full:GrossCarryingAmountMembershel:ProductionMember2023-01-012023-12-310001306965ifrs-full:GrossCarryingAmountMembershel:ManufacturingSupplyAndDistributionMember2023-01-012023-12-310001306965ifrs-full:GrossCarryingAmountMemberifrs-full:OtherPropertyPlantAndEquipmentMember2023-01-012023-12-310001306965ifrs-full:AccumulatedDepreciationAmortisationAndImpairmentMemberifrs-full:ExplorationAndEvaluationAssetsMember2022-12-310001306965ifrs-full:AccumulatedDepreciationAmortisationAndImpairmentMembershel:ProductionMember2022-12-310001306965ifrs-full:AccumulatedDepreciationAmortisationAndImpairmentMembershel:ManufacturingSupplyAndDistributionMember2022-12-310001306965ifrs-full:AccumulatedDepreciationAmortisationAndImpairmentMemberifrs-full:OtherPropertyPlantAndEquipmentMember2022-12-310001306965ifrs-full:AccumulatedDepreciationAmortisationAndImpairmentMemberifrs-full:ExplorationAndEvaluationAssetsMember2023-01-012023-12-310001306965ifrs-full:AccumulatedDepreciationAmortisationAndImpairmentMembershel:ProductionMember2023-01-012023-12-310001306965ifrs-full:AccumulatedDepreciationAmortisationAndImpairmentMembershel:ManufacturingSupplyAndDistributionMember2023-01-012023-12-310001306965ifrs-full:AccumulatedDepreciationAmortisationAndImpairmentMemberifrs-full:OtherPropertyPlantAndEquipmentMember2023-01-012023-12-310001306965ifrs-full:AccumulatedDepreciationAmortisationAndImpairmentMemberifrs-full:ExplorationAndEvaluationAssetsMember2023-01-012023-12-310001306965ifrs-full:AccumulatedDepreciationAmortisationAndImpairmentMembershel:ProductionMember2023-01-012023-12-310001306965ifrs-full:AccumulatedDepreciationAmortisationAndImpairmentMembershel:ManufacturingSupplyAndDistributionMember2023-01-012023-12-310001306965ifrs-full:AccumulatedDepreciationAmortisationAndImpairmentMemberifrs-full:OtherPropertyPlantAndEquipmentMember2023-01-012023-12-310001306965shel:ProductionMember2023-12-310001306965shel:ManufacturingSupplyAndDistributionMember2023-12-310001306965ifrs-full:OtherPropertyPlantAndEquipmentMember2023-12-310001306965ifrs-full:LaterThanOneYearAndNotLaterThanFiveYearsMember2024-12-310001306965shel:LaterThanSixYearsAndNotLaterThanTenYearsMember2024-12-310001306965shel:LaterThanElevenYearsAndNotLaterThanFifteenYearsMember2024-12-310001306965shel:LaterThanSixteenYearsAndNotTaterThanTwentyYearsMember2024-12-310001306965shel:ExplorationAndProductionMember2024-01-012024-12-310001306965shel:ExplorationAndProductionMember2023-01-012023-12-310001306965shel:ExplorationAndProductionMember2022-01-012022-12-310001306965shel:ManufacturingSupplyAndDistributionMember2024-01-012024-12-310001306965shel:ManufacturingSupplyAndDistributionMember2023-01-012023-12-310001306965shel:ManufacturingSupplyAndDistributionMember2022-01-012022-12-310001306965ifrs-full:OtherPropertyPlantAndEquipmentMember2023-01-012023-12-310001306965ifrs-full:OtherPropertyPlantAndEquipmentMember2022-01-012022-12-310001306965ifrs-full:AllOtherSegmentsMember2024-01-012024-12-310001306965ifrs-full:AllOtherSegmentsMember2023-01-012023-12-310001306965shel:AllSegmentsExcludingRenewablesAndEnergySolutionsSegmentMember2024-12-310001306965shel:BrentCrudeOilMember2024-01-012024-12-310001306965shel:HenryHubNaturalGasMember2024-01-012024-12-310001306965shel:BrentCrudeOilMember2023-01-012023-12-310001306965shel:HenryHubNaturalGasMember2023-01-012023-12-310001306965shel:HenryHubNaturalGasMembersrt:ScenarioForecastMember2028-01-012048-12-310001306965shel:ExplorationAndProductionMembershel:IntegratedGasMember2024-01-012024-12-310001306965shel:ExplorationAndProductionMembershel:UpstreamMember2024-01-012024-12-310001306965shel:ExplorationAndProductionMembershel:IntegratedGasMember2023-01-012023-12-310001306965shel:ExplorationAndProductionMembershel:UpstreamMember2023-01-012023-12-310001306965ifrs-full:OtherPropertyPlantAndEquipmentMembershel:MarketingSegmentMember2024-01-012024-12-310001306965ifrs-full:OtherPropertyPlantAndEquipmentMembershel:RenewablesAndEnergySolutionsSegmentMember2024-01-012024-12-310001306965ifrs-full:OtherPropertyPlantAndEquipmentMembershel:MarketingSegmentMember2023-01-012023-12-310001306965ifrs-full:OtherPropertyPlantAndEquipmentMembershel:RenewablesAndEnergySolutionsSegmentMember2023-01-012023-12-310001306965country:RU2022-01-012022-12-310001306965country:BR2022-01-012022-12-310001306965shel:IntegratedGasAndUpstreamCashGeneratingUnitMember2024-01-012024-12-310001306965shel:IntegratedGasAndUpstreamCashGeneratingUnitMember2024-12-310001306965shel:IntegratedGasAndUpstreamCashGeneratingUnitMemberifrs-full:BottomOfRangeMember2024-01-012024-12-310001306965shel:IntegratedGasAndUpstreamCashGeneratingUnitMemberifrs-full:TopOfRangeMember2024-01-012024-12-310001306965shel:ChemicalsAndProductsCashGeneratingUnitMember2024-01-012024-12-310001306965shel:ChemicalsAndProductsCashGeneratingUnitMemberifrs-full:BottomOfRangeMember2024-01-012024-12-310001306965shel:ChemicalsAndProductsCashGeneratingUnitMemberifrs-full:TopOfRangeMember2024-01-012024-12-310001306965ifrs-full:JointVenturesMember2024-01-012024-12-310001306965ifrs-full:AssociatesMember2024-01-012024-12-310001306965ifrs-full:JointVenturesMember2023-01-012023-12-310001306965ifrs-full:AssociatesMember2023-01-012023-12-310001306965ifrs-full:JointVenturesMember2022-01-012022-12-310001306965ifrs-full:AssociatesMember2022-01-012022-12-310001306965ifrs-full:JointVenturesMembershel:RenewablesAndEnergySolutionsMemberifrs-full:AssociatesMember2024-01-012024-12-310001306965country:RUifrs-full:JointVenturesMember2023-01-012023-12-310001306965ifrs-full:JointVenturesMembershel:OilProductsSegmentMember2024-01-012024-12-310001306965ifrs-full:JointVenturesMembershel:OilProductsSegmentMember2023-01-012023-12-310001306965ifrs-full:TradingEquitySecuritiesMember2024-12-310001306965ifrs-full:TradingEquitySecuritiesMember2023-12-310001306965ifrs-full:DebtSecuritiesMember2024-12-310001306965ifrs-full:DebtSecuritiesMember2023-12-310001306965ifrs-full:Level1OfFairValueHierarchyMemberifrs-full:AtFairValueMember2024-12-310001306965ifrs-full:Level1OfFairValueHierarchyMemberifrs-full:AtFairValueMember2023-12-310001306965ifrs-full:Level2OfFairValueHierarchyMemberifrs-full:AtFairValueMember2024-12-310001306965ifrs-full:Level2OfFairValueHierarchyMemberifrs-full:AtFairValueMember2023-12-310001306965ifrs-full:Level3OfFairValueHierarchyMemberifrs-full:AtFairValueMember2024-12-310001306965ifrs-full:Level3OfFairValueHierarchyMemberifrs-full:AtFairValueMember2023-12-310001306965ifrs-full:AtFairValueMember2024-12-310001306965ifrs-full:AtFairValueMember2023-12-310001306965ifrs-full:AtCostMember2024-12-310001306965ifrs-full:AtCostMember2023-12-310001306965ifrs-full:Level3OfFairValueHierarchyMembershel:DebtAndEquitySecuritiesMember2023-12-310001306965ifrs-full:Level3OfFairValueHierarchyMembershel:DebtAndEquitySecuritiesMember2022-12-310001306965ifrs-full:Level3OfFairValueHierarchyMembershel:DebtAndEquitySecuritiesMember2024-01-012024-12-310001306965ifrs-full:Level3OfFairValueHierarchyMembershel:DebtAndEquitySecuritiesMember2023-01-012023-12-310001306965ifrs-full:Level3OfFairValueHierarchyMembershel:DebtAndEquitySecuritiesMember2024-12-310001306965ifrs-full:AccumulatedImpairmentMember2024-12-310001306965ifrs-full:AccumulatedImpairmentMember2023-12-310001306965ifrs-full:BottomOfRangeMember2024-12-310001306965ifrs-full:TopOfRangeMember2024-12-310001306965ifrs-full:BottomOfRangeMember2023-12-310001306965ifrs-full:TopOfRangeMember2023-12-310001306965ifrs-full:NotLaterThanOneYearMember2024-12-310001306965ifrs-full:NotLaterThanOneYearMember2023-12-310001306965ifrs-full:LaterThanOneYearAndNotLaterThanFiveYearsMember2023-12-310001306965ifrs-full:LaterThanFiveYearsMember2024-12-310001306965ifrs-full:LaterThanFiveYearsMember2023-12-310001306965ifrs-full:AssetsAndLiabilitiesClassifiedAsHeldForSaleMember2024-12-310001306965ifrs-full:AssetsAndLiabilitiesClassifiedAsHeldForSaleMember2023-12-310001306965shel:BorrowingsExcludingLeaseLiabilitiesMember2024-12-310001306965ifrs-full:LeaseLiabilitiesMember2024-12-310001306965shel:BorrowingsExcludingLeaseLiabilitiesMember2023-12-310001306965ifrs-full:LeaseLiabilitiesMember2023-12-310001306965shel:CurrentDebtMember2023-12-310001306965shel:NonCurrentDebtMember2023-12-310001306965ifrs-full:DerivativesMember2023-12-310001306965shel:CashAndCashEquivalentMember2023-12-310001306965shel:CurrentDebtMember2024-01-012024-12-310001306965shel:NonCurrentDebtMember2024-01-012024-12-310001306965ifrs-full:DerivativesMember2024-01-012024-12-310001306965shel:CashAndCashEquivalentMember2024-01-012024-12-310001306965shel:CurrentDebtMember2024-12-310001306965shel:NonCurrentDebtMember2024-12-310001306965ifrs-full:DerivativesMember2024-12-310001306965shel:CashAndCashEquivalentMember2024-12-310001306965shel:CurrentDebtMember2022-12-310001306965shel:NonCurrentDebtMember2022-12-310001306965ifrs-full:DerivativesMember2022-12-310001306965shel:CashAndCashEquivalentMember2022-12-310001306965shel:CurrentDebtMember2023-01-012023-12-310001306965shel:NonCurrentDebtMember2023-01-012023-12-310001306965ifrs-full:DerivativesMember2023-01-012023-12-310001306965shel:CashAndCashEquivalentMember2023-01-012023-12-310001306965shel:CommercialPaperProgrammeMember2024-12-310001306965shel:CommercialPaperProgrammeMember2023-12-310001306965shel:CommittedCreditFacilityMember2024-12-310001306965shel:CommittedCreditFacilityMember2023-12-310001306965shel:ShortTermCommercialPaperProgrammeMember2024-12-310001306965ifrs-full:BottomOfRangeMembershel:ShortTermCommercialPaperProgrammeMember2024-01-012024-12-310001306965ifrs-full:TopOfRangeMembershel:ShortTermCommercialPaperProgrammeMember2024-01-012024-12-310001306965shel:LongTermCommercialPaperProgrammeMember2024-12-310001306965shel:LongTermCommercialPaperProgrammeMember2024-01-012024-12-310001306965shel:UniversalShelfRegistrationMember2024-01-012024-12-310001306965shel:UniversalShelfRegistrationMember2024-12-310001306965shel:UniversalShelfRegistrationMember2023-12-310001306965shel:EuroMediumTermNoteProgramMember2024-12-310001306965shel:EuroMediumTermNoteProgramMember2023-12-310001306965shel:CommittedCreditFacilityDueIn2024Member2024-12-310001306965shel:CommittedCreditFacilityDueIn2026Member2024-12-310001306965shel:CommittedCreditFacilityDueIn2026Member2023-12-310001306965ifrs-full:LaterThanOneYearAndNotLaterThanTwoYearsMember2024-12-310001306965ifrs-full:LaterThanTwoYearsAndNotLaterThanThreeYearsMember2024-12-310001306965ifrs-full:LaterThanThreeYearsAndNotLaterThanFourYearsMember2024-12-310001306965ifrs-full:LaterThanFourYearsAndNotLaterThanFiveYearsMember2024-12-310001306965shel:BondIssuedMember2024-12-310001306965ifrs-full:NotLaterThanOneYearMembershel:EuroMediumTermNoteProgramMember2024-12-310001306965ifrs-full:LaterThanOneYearAndNotLaterThanTwoYearsMembershel:EuroMediumTermNoteProgramMember2024-12-310001306965ifrs-full:LaterThanTwoYearsAndNotLaterThanThreeYearsMembershel:EuroMediumTermNoteProgramMember2024-12-310001306965ifrs-full:LaterThanThreeYearsAndNotLaterThanFourYearsMembershel:EuroMediumTermNoteProgramMember2024-12-310001306965ifrs-full:LaterThanFourYearsAndNotLaterThanFiveYearsMembershel:EuroMediumTermNoteProgramMember2024-12-310001306965ifrs-full:LaterThanFiveYearsMembershel:EuroMediumTermNoteProgramMember2024-12-310001306965shel:BondIssuedMembershel:EuroMediumTermNoteProgramMember2024-12-310001306965ifrs-full:NotLaterThanOneYearMembershel:UniversalShelfRegistrationMember2024-12-310001306965ifrs-full:LaterThanOneYearAndNotLaterThanTwoYearsMembershel:UniversalShelfRegistrationMember2024-12-310001306965ifrs-full:LaterThanTwoYearsAndNotLaterThanThreeYearsMembershel:UniversalShelfRegistrationMember2024-12-310001306965ifrs-full:LaterThanThreeYearsAndNotLaterThanFourYearsMembershel:UniversalShelfRegistrationMember2024-12-310001306965ifrs-full:LaterThanFourYearsAndNotLaterThanFiveYearsMembershel:UniversalShelfRegistrationMember2024-12-310001306965ifrs-full:LaterThanFiveYearsMembershel:UniversalShelfRegistrationMember2024-12-310001306965shel:BondIssuedMembershel:UniversalShelfRegistrationMember2024-12-310001306965shel:BankAndOtherBorrowingsMember2024-12-310001306965shel:ExcludeInterestMember2024-12-310001306965ifrs-full:LaterThanOneYearAndNotLaterThanTwoYearsMember2023-12-310001306965ifrs-full:LaterThanTwoYearsAndNotLaterThanThreeYearsMember2023-12-310001306965ifrs-full:LaterThanThreeYearsAndNotLaterThanFourYearsMember2023-12-310001306965ifrs-full:LaterThanFourYearsAndNotLaterThanFiveYearsMember2023-12-310001306965shel:BondIssuedMember2023-12-310001306965ifrs-full:NotLaterThanOneYearMembershel:EuroMediumTermNoteProgramMember2023-12-310001306965ifrs-full:LaterThanOneYearAndNotLaterThanTwoYearsMembershel:EuroMediumTermNoteProgramMember2023-12-310001306965ifrs-full:LaterThanTwoYearsAndNotLaterThanThreeYearsMembershel:EuroMediumTermNoteProgramMember2023-12-310001306965ifrs-full:LaterThanThreeYearsAndNotLaterThanFourYearsMembershel:EuroMediumTermNoteProgramMember2023-12-310001306965ifrs-full:LaterThanFourYearsAndNotLaterThanFiveYearsMembershel:EuroMediumTermNoteProgramMember2023-12-310001306965ifrs-full:LaterThanFiveYearsMembershel:EuroMediumTermNoteProgramMember2023-12-310001306965shel:BondIssuedMembershel:EuroMediumTermNoteProgramMember2023-12-310001306965ifrs-full:NotLaterThanOneYearMembershel:UniversalShelfRegistrationMember2023-12-310001306965ifrs-full:LaterThanOneYearAndNotLaterThanTwoYearsMembershel:UniversalShelfRegistrationMember2023-12-310001306965ifrs-full:LaterThanTwoYearsAndNotLaterThanThreeYearsMembershel:UniversalShelfRegistrationMember2023-12-310001306965ifrs-full:LaterThanThreeYearsAndNotLaterThanFourYearsMembershel:UniversalShelfRegistrationMember2023-12-310001306965ifrs-full:LaterThanFourYearsAndNotLaterThanFiveYearsMembershel:UniversalShelfRegistrationMember2023-12-310001306965ifrs-full:LaterThanFiveYearsMembershel:UniversalShelfRegistrationMember2023-12-310001306965shel:BondIssuedMembershel:UniversalShelfRegistrationMember2023-12-310001306965shel:BankAndOtherBorrowingsMember2023-12-310001306965shel:ExcludeInterestMember2023-12-310001306965ifrs-full:GrossCarryingAmountMembershel:ProductionMember2023-12-310001306965ifrs-full:GrossCarryingAmountMembershel:ManufacturingSupplyAndDistributionMember2023-12-310001306965ifrs-full:GrossCarryingAmountMemberifrs-full:OtherAssetsMember2023-12-310001306965ifrs-full:GrossCarryingAmountMembershel:ProductionMember2024-01-012024-12-310001306965ifrs-full:GrossCarryingAmountMembershel:ManufacturingSupplyAndDistributionMember2024-01-012024-12-310001306965ifrs-full:GrossCarryingAmountMemberifrs-full:OtherAssetsMember2024-01-012024-12-310001306965ifrs-full:GrossCarryingAmountMembershel:ProductionMember2024-12-310001306965ifrs-full:GrossCarryingAmountMembershel:ManufacturingSupplyAndDistributionMember2024-12-310001306965ifrs-full:GrossCarryingAmountMemberifrs-full:OtherAssetsMember2024-12-310001306965ifrs-full:AccumulatedDepreciationAmortisationAndImpairmentMembershel:ProductionMember2023-12-310001306965ifrs-full:AccumulatedDepreciationAmortisationAndImpairmentMembershel:ManufacturingSupplyAndDistributionMember2023-12-310001306965ifrs-full:AccumulatedDepreciationAmortisationAndImpairmentMemberifrs-full:OtherAssetsMember2023-12-310001306965ifrs-full:AccumulatedDepreciationAmortisationAndImpairmentMembershel:ProductionMember2024-01-012024-12-310001306965ifrs-full:AccumulatedDepreciationAmortisationAndImpairmentMembershel:ManufacturingSupplyAndDistributionMember2024-01-012024-12-310001306965ifrs-full:AccumulatedDepreciationAmortisationAndImpairmentMemberifrs-full:OtherAssetsMember2024-01-012024-12-310001306965ifrs-full:AccumulatedDepreciationAmortisationAndImpairmentMembershel:ProductionMember2024-12-310001306965ifrs-full:AccumulatedDepreciationAmortisationAndImpairmentMembershel:ManufacturingSupplyAndDistributionMember2024-12-310001306965ifrs-full:AccumulatedDepreciationAmortisationAndImpairmentMemberifrs-full:OtherAssetsMember2024-12-310001306965shel:ProductionMember2024-12-310001306965shel:ManufacturingSupplyAndDistributionMember2024-12-310001306965ifrs-full:OtherAssetsMember2024-12-310001306965ifrs-full:GrossCarryingAmountMembershel:ProductionMember2022-12-310001306965ifrs-full:GrossCarryingAmountMembershel:ManufacturingSupplyAndDistributionMember2022-12-310001306965ifrs-full:GrossCarryingAmountMemberifrs-full:OtherAssetsMember2022-12-310001306965ifrs-full:GrossCarryingAmountMembershel:ProductionMember2023-01-012023-12-310001306965ifrs-full:GrossCarryingAmountMembershel:ManufacturingSupplyAndDistributionMember2023-01-012023-12-310001306965ifrs-full:GrossCarryingAmountMemberifrs-full:OtherAssetsMember2023-01-012023-12-310001306965ifrs-full:AccumulatedDepreciationAmortisationAndImpairmentMembershel:ProductionMember2022-12-310001306965ifrs-full:AccumulatedDepreciationAmortisationAndImpairmentMembershel:ManufacturingSupplyAndDistributionMember2022-12-310001306965ifrs-full:AccumulatedDepreciationAmortisationAndImpairmentMemberifrs-full:OtherAssetsMember2022-12-310001306965ifrs-full:AccumulatedDepreciationAmortisationAndImpairmentMembershel:ProductionMember2023-01-012023-12-310001306965ifrs-full:AccumulatedDepreciationAmortisationAndImpairmentMembershel:ManufacturingSupplyAndDistributionMember2023-01-012023-12-310001306965ifrs-full:AccumulatedDepreciationAmortisationAndImpairmentMemberifrs-full:OtherAssetsMember2023-01-012023-12-310001306965shel:ProductionMember2022-12-310001306965shel:ManufacturingSupplyAndDistributionMember2022-12-310001306965ifrs-full:OtherAssetsMember2022-12-310001306965shel:UKEnergyProfitsLevyAct2022EPLMember2022-01-012022-12-310001306965shel:DecommissioningAndOtherProvisionsMember2023-12-310001306965shel:PropertyPlantAndEquipmentRelatedTemporaryDifferencesMember2023-12-310001306965shel:TaxLossesCarriedForwardMember2023-12-310001306965shel:RetirementBenefitsMember2023-12-310001306965ifrs-full:OtherTemporaryDifferencesMember2023-12-310001306965shel:DecommissioningAndOtherProvisionsMember2024-01-012024-12-310001306965shel:PropertyPlantAndEquipmentRelatedTemporaryDifferencesMember2024-01-012024-12-310001306965shel:TaxLossesCarriedForwardMember2024-01-012024-12-310001306965shel:RetirementBenefitsMember2024-01-012024-12-310001306965ifrs-full:OtherTemporaryDifferencesMember2024-01-012024-12-310001306965shel:DecommissioningAndOtherProvisionsMember2024-12-310001306965shel:PropertyPlantAndEquipmentRelatedTemporaryDifferencesMember2024-12-310001306965shel:TaxLossesCarriedForwardMember2024-12-310001306965shel:RetirementBenefitsMember2024-12-310001306965ifrs-full:OtherTemporaryDifferencesMember2024-12-310001306965shel:DecommissioningAndOtherProvisionsMember2022-12-310001306965shel:PropertyPlantAndEquipmentRelatedTemporaryDifferencesMember2022-12-310001306965shel:TaxLossesCarriedForwardMember2022-12-310001306965shel:RetirementBenefitsMember2022-12-310001306965ifrs-full:OtherTemporaryDifferencesMember2022-12-310001306965shel:DecommissioningAndOtherProvisionsMember2023-01-012023-12-310001306965shel:PropertyPlantAndEquipmentRelatedTemporaryDifferencesMember2023-01-012023-12-310001306965shel:TaxLossesCarriedForwardMember2023-01-012023-12-310001306965shel:RetirementBenefitsMember2023-01-012023-12-310001306965ifrs-full:OtherTemporaryDifferencesMember2023-01-012023-12-310001306965country:AU2024-06-300001306965country:AU2023-06-300001306965ifrs-full:PresentValueOfDefinedBenefitObligationMember2024-12-310001306965ifrs-full:PresentValueOfDefinedBenefitObligationMember2023-12-310001306965ifrs-full:PlanAssetsMember2024-12-310001306965ifrs-full:PlanAssetsMember2023-12-310001306965ifrs-full:EffectOfAssetCeilingMember2024-12-310001306965ifrs-full:EffectOfAssetCeilingMember2023-12-310001306965ifrs-full:PensionDefinedBenefitPlansMember2024-12-310001306965ifrs-full:PensionDefinedBenefitPlansMember2023-12-310001306965ifrs-full:PostemploymentMedicalDefinedBenefitPlansMember2024-12-310001306965ifrs-full:PostemploymentMedicalDefinedBenefitPlansMember2023-12-310001306965ifrs-full:PensionDefinedBenefitPlansMember2024-01-012024-12-310001306965ifrs-full:PensionDefinedBenefitPlansMember2023-01-012023-12-310001306965ifrs-full:PensionDefinedBenefitPlansMember2022-01-012022-12-310001306965ifrs-full:PostemploymentMedicalDefinedBenefitPlansMember2024-01-012024-12-310001306965ifrs-full:PostemploymentMedicalDefinedBenefitPlansMember2023-01-012023-12-310001306965ifrs-full:PostemploymentMedicalDefinedBenefitPlansMember2022-01-012022-12-310001306965ifrs-full:PresentValueOfDefinedBenefitObligationMembercountry:NL2023-12-310001306965ifrs-full:PresentValueOfDefinedBenefitObligationMembercountry:GB2023-12-310001306965ifrs-full:PresentValueOfDefinedBenefitObligationMembercountry:US2023-12-310001306965ifrs-full:PresentValueOfDefinedBenefitObligationMembershel:RestOfTheWorldMember2023-12-310001306965ifrs-full:PresentValueOfDefinedBenefitObligationMemberifrs-full:PostemploymentMedicalDefinedBenefitPlansMember2023-12-310001306965ifrs-full:PresentValueOfDefinedBenefitObligationMembercountry:NL2024-01-012024-12-310001306965ifrs-full:PresentValueOfDefinedBenefitObligationMembercountry:GB2024-01-012024-12-310001306965ifrs-full:PresentValueOfDefinedBenefitObligationMembercountry:US2024-01-012024-12-310001306965ifrs-full:PresentValueOfDefinedBenefitObligationMembershel:RestOfTheWorldMember2024-01-012024-12-310001306965ifrs-full:PresentValueOfDefinedBenefitObligationMemberifrs-full:PostemploymentMedicalDefinedBenefitPlansMember2024-01-012024-12-310001306965ifrs-full:PresentValueOfDefinedBenefitObligationMember2024-01-012024-12-310001306965ifrs-full:PresentValueOfDefinedBenefitObligationMembercountry:NL2024-12-310001306965ifrs-full:PresentValueOfDefinedBenefitObligationMembercountry:GB2024-12-310001306965ifrs-full:PresentValueOfDefinedBenefitObligationMembercountry:US2024-12-310001306965ifrs-full:PresentValueOfDefinedBenefitObligationMembershel:RestOfTheWorldMember2024-12-310001306965ifrs-full:PresentValueOfDefinedBenefitObligationMemberifrs-full:PostemploymentMedicalDefinedBenefitPlansMember2024-12-310001306965country:NLifrs-full:WhollyOrPartlyFundedDefinedBenefitPlansMemberifrs-full:PresentValueOfDefinedBenefitObligationMemberifrs-full:PensionDefinedBenefitPlansMember2024-12-310001306965country:GBifrs-full:WhollyOrPartlyFundedDefinedBenefitPlansMemberifrs-full:PresentValueOfDefinedBenefitObligationMemberifrs-full:PensionDefinedBenefitPlansMember2024-12-310001306965country:USifrs-full:WhollyOrPartlyFundedDefinedBenefitPlansMemberifrs-full:PresentValueOfDefinedBenefitObligationMemberifrs-full:PensionDefinedBenefitPlansMember2024-12-310001306965shel:RestOfTheWorldMemberifrs-full:WhollyOrPartlyFundedDefinedBenefitPlansMemberifrs-full:PresentValueOfDefinedBenefitObligationMemberifrs-full:PensionDefinedBenefitPlansMember2024-12-310001306965ifrs-full:WhollyOrPartlyFundedDefinedBenefitPlansMemberifrs-full:PresentValueOfDefinedBenefitObligationMemberifrs-full:PensionDefinedBenefitPlansMember2024-12-310001306965country:NLifrs-full:WhollyOrPartlyFundedDefinedBenefitPlansMemberifrs-full:PresentValueOfDefinedBenefitObligationMemberifrs-full:PensionDefinedBenefitPlansMember2024-01-012024-12-310001306965country:GBifrs-full:WhollyOrPartlyFundedDefinedBenefitPlansMemberifrs-full:PresentValueOfDefinedBenefitObligationMemberifrs-full:PensionDefinedBenefitPlansMember2024-01-012024-12-310001306965country:USifrs-full:WhollyOrPartlyFundedDefinedBenefitPlansMemberifrs-full:PresentValueOfDefinedBenefitObligationMemberifrs-full:PensionDefinedBenefitPlansMember2024-01-012024-12-310001306965shel:RestOfTheWorldMemberifrs-full:WhollyOrPartlyFundedDefinedBenefitPlansMemberifrs-full:PresentValueOfDefinedBenefitObligationMemberifrs-full:PensionDefinedBenefitPlansMember2024-01-012024-12-310001306965ifrs-full:WhollyOrPartlyFundedDefinedBenefitPlansMemberifrs-full:PresentValueOfDefinedBenefitObligationMemberifrs-full:PensionDefinedBenefitPlansMember2024-01-012024-12-310001306965country:GBifrs-full:WhollyUnfundedDefinedBenefitPlansMemberifrs-full:PresentValueOfDefinedBenefitObligationMemberifrs-full:PensionDefinedBenefitPlansMember2024-12-310001306965country:USifrs-full:WhollyUnfundedDefinedBenefitPlansMemberifrs-full:PresentValueOfDefinedBenefitObligationMemberifrs-full:PensionDefinedBenefitPlansMember2024-12-310001306965shel:RestOfTheWorldMemberifrs-full:WhollyUnfundedDefinedBenefitPlansMemberifrs-full:PresentValueOfDefinedBenefitObligationMemberifrs-full:PensionDefinedBenefitPlansMember2024-12-310001306965ifrs-full:WhollyUnfundedDefinedBenefitPlansMemberifrs-full:PresentValueOfDefinedBenefitObligationMemberifrs-full:PensionDefinedBenefitPlansMember2024-12-310001306965country:GBifrs-full:WhollyUnfundedDefinedBenefitPlansMemberifrs-full:PresentValueOfDefinedBenefitObligationMemberifrs-full:PensionDefinedBenefitPlansMember2024-01-012024-12-310001306965country:USifrs-full:WhollyUnfundedDefinedBenefitPlansMemberifrs-full:PresentValueOfDefinedBenefitObligationMemberifrs-full:PensionDefinedBenefitPlansMember2024-01-012024-12-310001306965shel:RestOfTheWorldMemberifrs-full:WhollyUnfundedDefinedBenefitPlansMemberifrs-full:PresentValueOfDefinedBenefitObligationMemberifrs-full:PensionDefinedBenefitPlansMember2024-01-012024-12-310001306965ifrs-full:WhollyUnfundedDefinedBenefitPlansMemberifrs-full:PresentValueOfDefinedBenefitObligationMemberifrs-full:PensionDefinedBenefitPlansMember2024-01-012024-12-310001306965ifrs-full:WhollyUnfundedDefinedBenefitPlansMemberifrs-full:PresentValueOfDefinedBenefitObligationMemberifrs-full:PostemploymentMedicalDefinedBenefitPlansMember2024-12-310001306965ifrs-full:WhollyUnfundedDefinedBenefitPlansMemberifrs-full:PresentValueOfDefinedBenefitObligationMemberifrs-full:PostemploymentMedicalDefinedBenefitPlansMember2024-01-012024-12-310001306965country:USifrs-full:PresentValueOfDefinedBenefitObligationMembershel:SettlementOfPensionLiabilitiesMember2024-12-310001306965country:USifrs-full:PlanAssetsMembershel:SettlementOfPensionLiabilitiesMember2024-12-310001306965ifrs-full:PresentValueOfDefinedBenefitObligationMembercountry:DE2024-12-310001306965ifrs-full:PresentValueOfDefinedBenefitObligationMembercountry:CA2024-12-310001306965ifrs-full:PresentValueOfDefinedBenefitObligationMembercountry:NL2022-12-310001306965ifrs-full:PresentValueOfDefinedBenefitObligationMembercountry:GB2022-12-310001306965ifrs-full:PresentValueOfDefinedBenefitObligationMembercountry:US2022-12-310001306965ifrs-full:PresentValueOfDefinedBenefitObligationMembershel:RestOfTheWorldMember2022-12-310001306965ifrs-full:PresentValueOfDefinedBenefitObligationMemberifrs-full:PostemploymentMedicalDefinedBenefitPlansMember2022-12-310001306965ifrs-full:PresentValueOfDefinedBenefitObligationMember2022-12-310001306965ifrs-full:PresentValueOfDefinedBenefitObligationMembercountry:NL2023-01-012023-12-310001306965ifrs-full:PresentValueOfDefinedBenefitObligationMembercountry:GB2023-01-012023-12-310001306965ifrs-full:PresentValueOfDefinedBenefitObligationMembercountry:US2023-01-012023-12-310001306965ifrs-full:PresentValueOfDefinedBenefitObligationMembershel:RestOfTheWorldMember2023-01-012023-12-310001306965ifrs-full:PresentValueOfDefinedBenefitObligationMemberifrs-full:PostemploymentMedicalDefinedBenefitPlansMember2023-01-012023-12-310001306965ifrs-full:PresentValueOfDefinedBenefitObligationMember2023-01-012023-12-310001306965country:NLifrs-full:WhollyOrPartlyFundedDefinedBenefitPlansMemberifrs-full:PresentValueOfDefinedBenefitObligationMemberifrs-full:PensionDefinedBenefitPlansMember2023-12-310001306965country:GBifrs-full:WhollyOrPartlyFundedDefinedBenefitPlansMemberifrs-full:PresentValueOfDefinedBenefitObligationMemberifrs-full:PensionDefinedBenefitPlansMember2023-12-310001306965country:USifrs-full:WhollyOrPartlyFundedDefinedBenefitPlansMemberifrs-full:PresentValueOfDefinedBenefitObligationMemberifrs-full:PensionDefinedBenefitPlansMember2023-12-310001306965shel:RestOfTheWorldMemberifrs-full:WhollyOrPartlyFundedDefinedBenefitPlansMemberifrs-full:PresentValueOfDefinedBenefitObligationMemberifrs-full:PensionDefinedBenefitPlansMember2023-12-310001306965ifrs-full:WhollyOrPartlyFundedDefinedBenefitPlansMemberifrs-full:PresentValueOfDefinedBenefitObligationMemberifrs-full:PensionDefinedBenefitPlansMember2023-12-310001306965country:NLifrs-full:WhollyOrPartlyFundedDefinedBenefitPlansMemberifrs-full:PresentValueOfDefinedBenefitObligationMemberifrs-full:PensionDefinedBenefitPlansMember2023-01-012023-12-310001306965country:GBifrs-full:WhollyOrPartlyFundedDefinedBenefitPlansMemberifrs-full:PresentValueOfDefinedBenefitObligationMemberifrs-full:PensionDefinedBenefitPlansMember2023-01-012023-12-310001306965country:USifrs-full:WhollyOrPartlyFundedDefinedBenefitPlansMemberifrs-full:PresentValueOfDefinedBenefitObligationMemberifrs-full:PensionDefinedBenefitPlansMember2023-01-012023-12-310001306965shel:RestOfTheWorldMemberifrs-full:WhollyOrPartlyFundedDefinedBenefitPlansMemberifrs-full:PresentValueOfDefinedBenefitObligationMemberifrs-full:PensionDefinedBenefitPlansMember2023-01-012023-12-310001306965ifrs-full:WhollyOrPartlyFundedDefinedBenefitPlansMemberifrs-full:PresentValueOfDefinedBenefitObligationMemberifrs-full:PensionDefinedBenefitPlansMember2023-01-012023-12-310001306965country:GBifrs-full:WhollyUnfundedDefinedBenefitPlansMemberifrs-full:PresentValueOfDefinedBenefitObligationMemberifrs-full:PensionDefinedBenefitPlansMember2023-12-310001306965country:USifrs-full:WhollyUnfundedDefinedBenefitPlansMemberifrs-full:PresentValueOfDefinedBenefitObligationMemberifrs-full:PensionDefinedBenefitPlansMember2023-12-310001306965shel:RestOfTheWorldMemberifrs-full:WhollyUnfundedDefinedBenefitPlansMemberifrs-full:PresentValueOfDefinedBenefitObligationMemberifrs-full:PensionDefinedBenefitPlansMember2023-12-310001306965ifrs-full:WhollyUnfundedDefinedBenefitPlansMemberifrs-full:PresentValueOfDefinedBenefitObligationMemberifrs-full:PensionDefinedBenefitPlansMember2023-12-310001306965country:GBifrs-full:WhollyUnfundedDefinedBenefitPlansMemberifrs-full:PresentValueOfDefinedBenefitObligationMemberifrs-full:PensionDefinedBenefitPlansMember2023-01-012023-12-310001306965country:USifrs-full:WhollyUnfundedDefinedBenefitPlansMemberifrs-full:PresentValueOfDefinedBenefitObligationMemberifrs-full:PensionDefinedBenefitPlansMember2023-01-012023-12-310001306965shel:RestOfTheWorldMemberifrs-full:WhollyUnfundedDefinedBenefitPlansMemberifrs-full:PresentValueOfDefinedBenefitObligationMemberifrs-full:PensionDefinedBenefitPlansMember2023-01-012023-12-310001306965ifrs-full:WhollyUnfundedDefinedBenefitPlansMemberifrs-full:PresentValueOfDefinedBenefitObligationMemberifrs-full:PensionDefinedBenefitPlansMember2023-01-012023-12-310001306965ifrs-full:WhollyUnfundedDefinedBenefitPlansMemberifrs-full:PresentValueOfDefinedBenefitObligationMemberifrs-full:PostemploymentMedicalDefinedBenefitPlansMember2023-12-310001306965ifrs-full:WhollyUnfundedDefinedBenefitPlansMemberifrs-full:PresentValueOfDefinedBenefitObligationMemberifrs-full:PostemploymentMedicalDefinedBenefitPlansMember2023-01-012023-12-310001306965ifrs-full:PresentValueOfDefinedBenefitObligationMembercountry:DE2023-12-310001306965ifrs-full:PresentValueOfDefinedBenefitObligationMembercountry:CA2023-12-310001306965ifrs-full:PlanAssetsMembercountry:NL2023-12-310001306965ifrs-full:PlanAssetsMembercountry:GB2023-12-310001306965ifrs-full:PlanAssetsMembercountry:US2023-12-310001306965ifrs-full:PlanAssetsMembershel:RestOfTheWorldMember2023-12-310001306965ifrs-full:PlanAssetsMembercountry:NL2024-01-012024-12-310001306965ifrs-full:PlanAssetsMembercountry:GB2024-01-012024-12-310001306965ifrs-full:PlanAssetsMembercountry:US2024-01-012024-12-310001306965ifrs-full:PlanAssetsMembershel:RestOfTheWorldMember2024-01-012024-12-310001306965ifrs-full:PlanAssetsMember2024-01-012024-12-310001306965ifrs-full:PlanAssetsMembercountry:NL2024-12-310001306965ifrs-full:PlanAssetsMembercountry:GB2024-12-310001306965ifrs-full:PlanAssetsMembercountry:US2024-12-310001306965ifrs-full:PlanAssetsMembershel:RestOfTheWorldMember2024-12-310001306965shel:RestOfTheWorldMembershel:CaptiveStructureMemberifrs-full:PlanAssetsMember2024-01-012024-12-310001306965ifrs-full:PlanAssetsMembercountry:DE2024-12-310001306965ifrs-full:PlanAssetsMembercountry:CA2024-12-310001306965ifrs-full:PlanAssetsMembercountry:NL2022-12-310001306965ifrs-full:PlanAssetsMembercountry:GB2022-12-310001306965ifrs-full:PlanAssetsMembercountry:US2022-12-310001306965ifrs-full:PlanAssetsMembershel:RestOfTheWorldMember2022-12-310001306965ifrs-full:PlanAssetsMember2022-12-310001306965ifrs-full:PlanAssetsMembercountry:NL2023-01-012023-12-310001306965ifrs-full:PlanAssetsMembercountry:GB2023-01-012023-12-310001306965ifrs-full:PlanAssetsMembercountry:US2023-01-012023-12-310001306965ifrs-full:PlanAssetsMembershel:RestOfTheWorldMember2023-01-012023-12-310001306965ifrs-full:PlanAssetsMember2023-01-012023-12-310001306965ifrs-full:PlanAssetsMembercountry:DE2023-12-310001306965ifrs-full:PlanAssetsMembercountry:CA2023-12-310001306965ifrs-full:Level1OfFairValueHierarchyMemberifrs-full:TradingEquitySecuritiesMember2024-12-310001306965ifrs-full:Level1OfFairValueHierarchyMemberifrs-full:TradingEquitySecuritiesMember2023-12-310001306965ifrs-full:Level1OfFairValueHierarchyMemberifrs-full:DebtSecuritiesMember2024-12-310001306965ifrs-full:Level1OfFairValueHierarchyMemberifrs-full:DebtSecuritiesMember2023-12-310001306965ifrs-full:Level1OfFairValueHierarchyMembershel:RealEstate1Member2024-12-310001306965ifrs-full:Level1OfFairValueHierarchyMembershel:RealEstate1Member2023-12-310001306965ifrs-full:Level2And3OfFairValueHierarchyMemberifrs-full:TradingEquitySecuritiesMember2024-12-310001306965ifrs-full:Level2And3OfFairValueHierarchyMemberifrs-full:TradingEquitySecuritiesMember2023-12-310001306965ifrs-full:Level2And3OfFairValueHierarchyMemberifrs-full:DebtSecuritiesMember2024-12-310001306965ifrs-full:Level2And3OfFairValueHierarchyMemberifrs-full:DebtSecuritiesMember2023-12-310001306965ifrs-full:Level2And3OfFairValueHierarchyMembershel:RealEstate1Member2024-12-310001306965ifrs-full:Level2And3OfFairValueHierarchyMembershel:RealEstate1Member2023-12-310001306965ifrs-full:Level2And3OfFairValueHierarchyMemberifrs-full:InvestmentFundsMember2024-12-310001306965ifrs-full:Level2And3OfFairValueHierarchyMemberifrs-full:InvestmentFundsMember2023-12-310001306965ifrs-full:Level2And3OfFairValueHierarchyMembershel:DebtRepurchaseAgreementsMember2024-12-310001306965ifrs-full:Level2And3OfFairValueHierarchyMembershel:DebtRepurchaseAgreementsMember2023-12-310001306965ifrs-full:Level2And3OfFairValueHierarchyMembershel:OtherFinancialInstrumentsMember2024-12-310001306965ifrs-full:Level2And3OfFairValueHierarchyMembershel:OtherFinancialInstrumentsMember2023-12-310001306965ifrs-full:Level2And3OfFairValueHierarchyMember2024-12-310001306965ifrs-full:Level2And3OfFairValueHierarchyMember2023-12-310001306965country:NL2024-12-310001306965country:NL2023-12-310001306965country:NL2024-01-012024-12-310001306965country:GBifrs-full:WhollyOrPartlyFundedDefinedBenefitPlansMember2024-12-310001306965country:GBifrs-full:WhollyOrPartlyFundedDefinedBenefitPlansMember2023-12-310001306965country:GBifrs-full:WhollyUnfundedDefinedBenefitPlansMember2024-12-310001306965country:GBifrs-full:WhollyUnfundedDefinedBenefitPlansMember2023-12-310001306965country:GBshel:BGPensionSchemeMember2024-12-310001306965country:USifrs-full:WhollyUnfundedDefinedBenefitPlansMember2024-12-310001306965country:USifrs-full:WhollyUnfundedDefinedBenefitPlansMember2023-12-310001306965ifrs-full:PostemploymentMedicalDefinedBenefitPlansMembercountry:US2024-12-310001306965ifrs-full:PostemploymentMedicalDefinedBenefitPlansMembercountry:US2023-12-310001306965country:NLifrs-full:PensionDefinedBenefitPlansMemberifrs-full:TopOfRangeMember2024-12-310001306965shel:ActuarialAssumptionOfRateOfIncreaseInPensionableRemunerationMember2024-12-310001306965shel:ActuarialAssumptionOfRateOfIncreaseInPensionableRemunerationMember2023-12-310001306965shel:ActuarialAssumptionOfRateOfIncreaseInPensionableRemunerationMemberifrs-full:BottomOfRangeMember2024-12-310001306965shel:ActuarialAssumptionOfRateOfIncreaseInPensionableRemunerationMemberifrs-full:TopOfRangeMember2024-12-310001306965shel:ActuarialAssumptionOfRateOfIncreaseInPensionableRemunerationMemberifrs-full:BottomOfRangeMember2023-12-310001306965shel:ActuarialAssumptionOfRateOfIncreaseInPensionableRemunerationMemberifrs-full:TopOfRangeMember2023-12-310001306965shel:ActuarialAssumptionOfRateOfIncreaseInPensionableRemunerationMembercountry:NL2024-12-310001306965shel:ActuarialAssumptionOfRateOfIncreaseInPensionableRemunerationMembercountry:NL2023-12-310001306965shel:ActuarialAssumptionOfRateOfIncreaseInPensionableRemunerationMembercountry:GB2024-12-310001306965shel:ActuarialAssumptionOfRateOfIncreaseInPensionableRemunerationMembercountry:GB2023-12-310001306965shel:ActuarialAssumptionOfRateOfIncreaseInPensionableRemunerationMembercountry:US2024-12-310001306965shel:ActuarialAssumptionOfRateOfIncreaseInPensionableRemunerationMembercountry:US2023-12-310001306965shel:ActuarialAssumptionOfRateOfIncreaseInPensionsInPaymentMember2024-12-310001306965shel:ActuarialAssumptionOfRateOfIncreaseInPensionsInPaymentMember2023-12-310001306965shel:ActuarialAssumptionOfRateOfIncreaseInPensionsInPaymentMemberifrs-full:BottomOfRangeMember2024-12-310001306965shel:ActuarialAssumptionOfRateOfIncreaseInPensionsInPaymentMemberifrs-full:TopOfRangeMember2024-12-310001306965shel:ActuarialAssumptionOfRateOfIncreaseInPensionsInPaymentMemberifrs-full:BottomOfRangeMember2023-12-310001306965shel:ActuarialAssumptionOfRateOfIncreaseInPensionsInPaymentMemberifrs-full:TopOfRangeMember2023-12-310001306965shel:ActuarialAssumptionOfRateOfIncreaseInPensionsInPaymentMembercountry:NL2024-12-310001306965shel:ActuarialAssumptionOfRateOfIncreaseInPensionsInPaymentMembercountry:NL2023-12-310001306965shel:ActuarialAssumptionOfRateOfIncreaseInPensionsInPaymentMembercountry:GB2024-12-310001306965shel:ActuarialAssumptionOfRateOfIncreaseInPensionsInPaymentMembercountry:GB2023-12-310001306965shel:ActuarialAssumptionOfRateOfIncreaseInPensionsInPaymentMembercountry:US2024-12-310001306965shel:ActuarialAssumptionOfRateOfIncreaseInPensionsInPaymentMembercountry:US2023-12-310001306965shel:ActuarialAssumptionOfDiscountRateForPensionPlansMember2024-12-310001306965shel:ActuarialAssumptionOfDiscountRateForPensionPlansMember2023-12-310001306965shel:ActuarialAssumptionOfDiscountRateForPensionPlansMemberifrs-full:BottomOfRangeMember2024-12-310001306965shel:ActuarialAssumptionOfDiscountRateForPensionPlansMemberifrs-full:TopOfRangeMember2024-12-310001306965shel:ActuarialAssumptionOfDiscountRateForPensionPlansMemberifrs-full:BottomOfRangeMember2023-12-310001306965shel:ActuarialAssumptionOfDiscountRateForPensionPlansMemberifrs-full:TopOfRangeMember2023-12-310001306965shel:ActuarialAssumptionOfDiscountRateForPensionPlansMembercountry:NL2024-12-310001306965shel:ActuarialAssumptionOfDiscountRateForPensionPlansMembercountry:NL2023-12-310001306965shel:ActuarialAssumptionOfDiscountRateForPensionPlansMembercountry:GB2024-12-310001306965shel:ActuarialAssumptionOfDiscountRateForPensionPlansMembercountry:GB2023-12-310001306965shel:ActuarialAssumptionOfDiscountRateForPensionPlansMembercountry:US2024-12-310001306965shel:ActuarialAssumptionOfDiscountRateForPensionPlansMembercountry:US2023-12-310001306965ifrs-full:ActuarialAssumptionOfExpectedRatesOfInflationMember2024-12-310001306965ifrs-full:ActuarialAssumptionOfExpectedRatesOfInflationMember2023-12-310001306965ifrs-full:ActuarialAssumptionOfExpectedRatesOfInflationMemberifrs-full:BottomOfRangeMember2024-12-310001306965ifrs-full:ActuarialAssumptionOfExpectedRatesOfInflationMemberifrs-full:TopOfRangeMember2024-12-310001306965ifrs-full:ActuarialAssumptionOfExpectedRatesOfInflationMemberifrs-full:BottomOfRangeMember2023-12-310001306965ifrs-full:ActuarialAssumptionOfExpectedRatesOfInflationMemberifrs-full:TopOfRangeMember2023-12-310001306965ifrs-full:ActuarialAssumptionOfExpectedRatesOfInflationMembercountry:NL2024-12-310001306965ifrs-full:ActuarialAssumptionOfExpectedRatesOfInflationMembercountry:NL2023-12-310001306965ifrs-full:ActuarialAssumptionOfExpectedRatesOfInflationMembercountry:GB2024-12-310001306965ifrs-full:ActuarialAssumptionOfExpectedRatesOfInflationMembercountry:GB2023-12-310001306965shel:MenMember2024-01-012024-12-310001306965shel:MenMember2023-01-012023-12-310001306965shel:MenMemberifrs-full:BottomOfRangeMember2024-12-310001306965shel:MenMemberifrs-full:TopOfRangeMember2024-12-310001306965shel:MenMemberifrs-full:BottomOfRangeMember2023-12-310001306965shel:MenMemberifrs-full:TopOfRangeMember2023-12-310001306965shel:MenMembercountry:NL2024-01-012024-12-310001306965shel:MenMembercountry:NL2023-01-012023-12-310001306965shel:MenMembercountry:GB2024-01-012024-12-310001306965shel:MenMembercountry:GB2023-01-012023-12-310001306965shel:MenMembercountry:US2024-01-012024-12-310001306965shel:MenMembercountry:US2023-01-012023-12-310001306965shel:WomenMember2024-01-012024-12-310001306965shel:WomenMember2023-01-012023-12-310001306965shel:WomenMemberifrs-full:BottomOfRangeMember2024-12-310001306965shel:WomenMemberifrs-full:TopOfRangeMember2024-12-310001306965shel:WomenMemberifrs-full:BottomOfRangeMember2023-12-310001306965shel:WomenMemberifrs-full:TopOfRangeMember2023-12-310001306965shel:WomenMembercountry:NL2024-01-012024-12-310001306965shel:WomenMembercountry:NL2023-01-012023-12-310001306965shel:WomenMembercountry:GB2024-01-012024-12-310001306965shel:WomenMembercountry:GB2023-01-012023-12-310001306965shel:WomenMembercountry:US2024-01-012024-12-310001306965shel:WomenMembercountry:US2023-01-012023-12-310001306965shel:ActuarialAssumptionOfRateOfIncreaseInHealthcareCostsMember2024-12-310001306965shel:ActuarialAssumptionOfRateOfIncreaseInHealthcareCostsMember2023-12-310001306965shel:ActuarialAssumptionOfRateOfIncreaseInHealthcareCostsMemberifrs-full:BottomOfRangeMember2024-12-310001306965shel:ActuarialAssumptionOfRateOfIncreaseInHealthcareCostsMemberifrs-full:TopOfRangeMember2024-12-310001306965shel:ActuarialAssumptionOfRateOfIncreaseInHealthcareCostsMemberifrs-full:BottomOfRangeMember2023-12-310001306965shel:ActuarialAssumptionOfRateOfIncreaseInHealthcareCostsMemberifrs-full:TopOfRangeMember2023-12-310001306965shel:ActuarialAssumptionOfDiscountRateForHealthCarePlansMember2024-12-310001306965shel:ActuarialAssumptionOfDiscountRateForHealthCarePlansMember2023-12-310001306965shel:ActuarialAssumptionOfDiscountRateForHealthCarePlansMemberifrs-full:BottomOfRangeMember2024-12-310001306965shel:ActuarialAssumptionOfDiscountRateForHealthCarePlansMemberifrs-full:TopOfRangeMember2024-12-310001306965shel:ActuarialAssumptionOfDiscountRateForHealthCarePlansMemberifrs-full:BottomOfRangeMember2023-12-310001306965shel:ActuarialAssumptionOfDiscountRateForHealthCarePlansMemberifrs-full:TopOfRangeMember2023-12-310001306965ifrs-full:ProvisionForDecommissioningRestorationAndRehabilitationCostsMember2023-12-310001306965ifrs-full:LegalProceedingsProvisionMember2023-12-310001306965ifrs-full:OnerousContractsProvisionMember2023-12-310001306965ifrs-full:OtherEnvironmentRelatedProvisionMember2023-12-310001306965shel:RedundancyMember2023-12-310001306965shel:OtherProvisionMember2023-12-310001306965ifrs-full:ProvisionForDecommissioningRestorationAndRehabilitationCostsMember2024-01-012024-12-310001306965ifrs-full:LegalProceedingsProvisionMember2024-01-012024-12-310001306965ifrs-full:OnerousContractsProvisionMember2024-01-012024-12-310001306965ifrs-full:OtherEnvironmentRelatedProvisionMember2024-01-012024-12-310001306965shel:RedundancyMember2024-01-012024-12-310001306965shel:OtherProvisionMember2024-01-012024-12-310001306965ifrs-full:ProvisionForDecommissioningRestorationAndRehabilitationCostsMember2024-12-310001306965ifrs-full:LegalProceedingsProvisionMember2024-12-310001306965ifrs-full:OnerousContractsProvisionMember2024-12-310001306965ifrs-full:OtherEnvironmentRelatedProvisionMember2024-12-310001306965shel:RedundancyMember2024-12-310001306965shel:OtherProvisionMember2024-12-310001306965ifrs-full:ProvisionForDecommissioningRestorationAndRehabilitationCostsMember2022-12-310001306965ifrs-full:LegalProceedingsProvisionMember2022-12-310001306965ifrs-full:OnerousContractsProvisionMember2022-12-310001306965ifrs-full:OtherEnvironmentRelatedProvisionMember2022-12-310001306965shel:RedundancyMember2022-12-310001306965shel:OtherProvisionMember2022-12-310001306965ifrs-full:ProvisionForDecommissioningRestorationAndRehabilitationCostsMember2023-01-012023-12-310001306965ifrs-full:LegalProceedingsProvisionMember2023-01-012023-12-310001306965ifrs-full:OnerousContractsProvisionMember2023-01-012023-12-310001306965ifrs-full:OtherEnvironmentRelatedProvisionMember2023-01-012023-12-310001306965shel:RedundancyMember2023-01-012023-12-310001306965shel:OtherProvisionMember2023-01-012023-12-310001306965ifrs-full:LaterThanFiveYearsAndNotLaterThanTenYearsMember2024-12-310001306965ifrs-full:LaterThanTenYearsMember2024-12-310001306965shel:InvestmentsInSecuritiesMemberifrs-full:FinancialAssetsAtAmortisedCostCategoryMember2024-12-310001306965shel:InvestmentsInSecuritiesMemberifrs-full:FinancialAssetsAtFairValueThroughProfitOrLossCategoryMember2024-12-310001306965shel:InvestmentsInSecuritiesMemberifrs-full:FinancialAssetsAtFairValueThroughOtherComprehensiveIncomeCategoryMember2024-12-310001306965shel:InvestmentsInSecuritiesMember2024-12-310001306965ifrs-full:TradeReceivablesMemberifrs-full:FinancialAssetsAtAmortisedCostCategoryMember2024-12-310001306965ifrs-full:TradeReceivablesMember2024-12-310001306965ifrs-full:FinancialAssetsAtFairValueThroughProfitOrLossMandatorilyMeasuredAtFairValueCategoryMember2024-12-310001306965ifrs-full:FinancialAssetsAtFairValueThroughProfitOrLossDesignatedUponInitialRecognitionCategoryMember2024-12-310001306965ifrs-full:InvestmentsInEquityInstrumentsMeasuredAtFairValueThroughOtherComprehensiveIncomeMember2024-12-310001306965ifrs-full:FinancialAssetsAtAmortisedCostCategoryMember2024-12-310001306965ifrs-full:FinancialAssetsAtFairValueThroughProfitOrLossCategoryMember2024-12-310001306965ifrs-full:FinancialAssetsAtFairValueThroughOtherComprehensiveIncomeCategoryMember2024-12-310001306965ifrs-full:FinancialLiabilitiesAtAmortisedCostCategoryMembershel:BankAndOtherBorrowingsMember2024-12-310001306965shel:BankAndOtherBorrowingsMember2024-12-310001306965ifrs-full:FinancialLiabilitiesAtAmortisedCostCategoryMembershel:TradePayablesMember2024-12-310001306965shel:TradePayablesMember2024-12-310001306965ifrs-full:FinancialLiabilitiesAtFairValueThroughProfitOrLossThatMeetDefinitionOfHeldForTradingCategoryMember2024-12-310001306965ifrs-full:FinancialLiabilitiesAtFairValueThroughProfitOrLossDesignatedUponInitialRecognitionCategoryMember2024-12-310001306965shel:FairValueChangesRelatedToOwnCreditRiskRecognisedInOtherComprehensiveIncomeMember2024-12-310001306965ifrs-full:FinancialLiabilitiesAtAmortisedCostCategoryMember2024-12-310001306965shel:InvestmentsInSecuritiesMemberifrs-full:FinancialAssetsAtAmortisedCostCategoryMember2023-12-310001306965shel:InvestmentsInSecuritiesMemberifrs-full:FinancialAssetsAtFairValueThroughProfitOrLossCategoryMember2023-12-310001306965shel:InvestmentsInSecuritiesMemberifrs-full:FinancialAssetsAtFairValueThroughOtherComprehensiveIncomeCategoryMember2023-12-310001306965shel:InvestmentsInSecuritiesMember2023-12-310001306965ifrs-full:TradeReceivablesMemberifrs-full:FinancialAssetsAtAmortisedCostCategoryMember2023-12-310001306965ifrs-full:TradeReceivablesMember2023-12-310001306965ifrs-full:FinancialAssetsAtFairValueThroughProfitOrLossMandatorilyMeasuredAtFairValueCategoryMember2023-12-310001306965ifrs-full:FinancialAssetsAtFairValueThroughProfitOrLossDesignatedUponInitialRecognitionCategoryMember2023-12-310001306965ifrs-full:InvestmentsInEquityInstrumentsMeasuredAtFairValueThroughOtherComprehensiveIncomeMember2023-12-310001306965ifrs-full:FinancialAssetsAtAmortisedCostCategoryMember2023-12-310001306965ifrs-full:FinancialAssetsAtFairValueThroughProfitOrLossCategoryMember2023-12-310001306965ifrs-full:FinancialAssetsAtFairValueThroughOtherComprehensiveIncomeCategoryMember2023-12-310001306965ifrs-full:FinancialLiabilitiesAtAmortisedCostCategoryMembershel:BankAndOtherBorrowingsMember2023-12-310001306965shel:BankAndOtherBorrowingsMember2023-12-310001306965ifrs-full:FinancialLiabilitiesAtAmortisedCostCategoryMembershel:TradePayablesMember2023-12-310001306965shel:TradePayablesMember2023-12-310001306965ifrs-full:FinancialLiabilitiesAtFairValueThroughProfitOrLossThatMeetDefinitionOfHeldForTradingCategoryMember2023-12-310001306965ifrs-full:FinancialLiabilitiesAtFairValueThroughProfitOrLossDesignatedUponInitialRecognitionCategoryMember2023-12-310001306965shel:FairValueChangesRelatedToOwnCreditRiskRecognisedInOtherComprehensiveIncomeMember2023-12-310001306965ifrs-full:FinancialLiabilitiesAtAmortisedCostCategoryMember2023-12-310001306965ifrs-full:FloatingInterestRateMember2024-12-310001306965ifrs-full:FloatingInterestRateMember2024-01-012024-12-310001306965ifrs-full:FloatingInterestRateMember2023-01-012023-12-310001306965currency:GBPshel:TenPercentageAppreciationMember2024-01-012024-12-310001306965currency:GBPshel:TenPercentageAppreciationMember2023-01-012023-12-310001306965currency:GBPshel:TenPercentageAppreciationMember2024-12-310001306965currency:GBPshel:TenPercentageAppreciationMember2023-12-310001306965currency:EURshel:TenPercentageAppreciationMember2024-01-012024-12-310001306965currency:EURshel:TenPercentageAppreciationMember2023-01-012023-12-310001306965currency:EURshel:TenPercentageAppreciationMember2024-12-310001306965currency:EURshel:TenPercentageAppreciationMember2023-12-310001306965currency:MYRshel:TenPercentageAppreciationMember2024-01-012024-12-310001306965currency:MYRshel:TenPercentageAppreciationMember2023-01-012023-12-310001306965currency:MYRshel:TenPercentageAppreciationMember2024-12-310001306965currency:MYRshel:TenPercentageAppreciationMember2023-12-310001306965currency:AUDshel:TenPercentageAppreciationMember2024-01-012024-12-310001306965currency:AUDshel:TenPercentageAppreciationMember2023-01-012023-12-310001306965currency:AUDshel:TenPercentageAppreciationMember2024-12-310001306965currency:AUDshel:TenPercentageAppreciationMember2023-12-310001306965currency:CADshel:TenPercentageAppreciationMember2024-01-012024-12-310001306965currency:CADshel:TenPercentageAppreciationMember2023-01-012023-12-310001306965currency:CADshel:TenPercentageAppreciationMember2024-12-310001306965currency:CADshel:TenPercentageAppreciationMember2023-12-310001306965shel:GlobalOilMemberifrs-full:WeightedAverageMemberifrs-full:CommodityPriceRiskMember2024-12-310001306965shel:GlobalOilMemberifrs-full:CommodityPriceRiskMember2024-12-310001306965shel:GlobalOilMemberifrs-full:WeightedAverageMemberifrs-full:CommodityPriceRiskMember2023-12-310001306965shel:GlobalOilMemberifrs-full:CommodityPriceRiskMember2023-12-310001306965shel:NorthAmericaGasAndPowerMemberifrs-full:WeightedAverageMemberifrs-full:CommodityPriceRiskMember2024-12-310001306965shel:NorthAmericaGasAndPowerMemberifrs-full:CommodityPriceRiskMember2024-12-310001306965shel:NorthAmericaGasAndPowerMemberifrs-full:WeightedAverageMemberifrs-full:CommodityPriceRiskMember2023-12-310001306965shel:NorthAmericaGasAndPowerMemberifrs-full:CommodityPriceRiskMember2023-12-310001306965shel:EuropeGasAndPowerMemberifrs-full:WeightedAverageMemberifrs-full:CommodityPriceRiskMember2024-12-310001306965shel:EuropeGasAndPowerMemberifrs-full:CommodityPriceRiskMember2024-12-310001306965shel:EuropeGasAndPowerMemberifrs-full:WeightedAverageMemberifrs-full:CommodityPriceRiskMember2023-12-310001306965shel:EuropeGasAndPowerMemberifrs-full:CommodityPriceRiskMember2023-12-310001306965shel:AustraliaGasAndPowerMemberifrs-full:WeightedAverageMemberifrs-full:CommodityPriceRiskMember2024-12-310001306965shel:AustraliaGasAndPowerMemberifrs-full:CommodityPriceRiskMember2024-12-310001306965shel:AustraliaGasAndPowerMemberifrs-full:WeightedAverageMemberifrs-full:CommodityPriceRiskMember2023-12-310001306965shel:AustraliaGasAndPowerMemberifrs-full:CommodityPriceRiskMember2023-12-310001306965shel:EnvironmentalCertificatesMemberifrs-full:WeightedAverageMemberifrs-full:CommodityPriceRiskMember2024-12-310001306965shel:EnvironmentalCertificatesMemberifrs-full:CommodityPriceRiskMember2024-12-310001306965shel:EnvironmentalCertificatesMemberifrs-full:WeightedAverageMemberifrs-full:CommodityPriceRiskMember2023-12-310001306965shel:EnvironmentalCertificatesMemberifrs-full:CommodityPriceRiskMember2023-12-310001306965ifrs-full:CommodityPriceRiskMember2024-12-310001306965ifrs-full:CommodityPriceRiskMember2024-01-012024-12-310001306965ifrs-full:CommodityPriceRiskMember2023-01-012023-12-310001306965ifrs-full:TradeReceivablesMember2024-12-310001306965shel:DerivativeFinancialAssetsMember2024-12-310001306965shel:TradePayablesMember2024-12-310001306965shel:DerivativeFinancialLiabilitiesMember2024-12-310001306965ifrs-full:TradeReceivablesMember2023-12-310001306965shel:DerivativeFinancialAssetsMember2023-12-310001306965shel:TradePayablesMember2023-12-310001306965shel:DerivativeFinancialLiabilitiesMember2023-12-310001306965shel:GuaranteesAndLettersOfCreditMember2024-12-310001306965shel:GuaranteesAndLettersOfCreditMember2023-12-310001306965ifrs-full:InterestRateSwapContractMember2024-12-310001306965shel:ForwardForeignExchangeContractsMember2024-12-310001306965shel:CurrencySwapsAndOptionsMember2024-12-310001306965shel:CommodityDerivativesMember2024-12-310001306965shel:OtherContractsMember2024-12-310001306965ifrs-full:InterestRateSwapContractMember2023-12-310001306965shel:ForwardForeignExchangeContractsMember2023-12-310001306965shel:CurrencySwapsAndOptionsMember2023-12-310001306965shel:CommodityDerivativesMember2023-12-310001306965shel:OtherContractsMember2023-12-310001306965ifrs-full:CashFlowHedgesMembershel:ForwardForeignExchangeContractsMemberifrs-full:CurrencyRiskMember2024-12-310001306965ifrs-full:CashFlowHedgesMembershel:ForwardForeignExchangeContractsMemberifrs-full:CurrencyRiskMember2023-12-310001306965shel:InterestRateAndCurrencySwapContractsMemberifrs-full:FairValueHedgesMember2024-12-310001306965shel:InterestRateAndCurrencySwapContractsMemberifrs-full:FairValueHedgesMember2023-12-310001306965ifrs-full:HedgesOfNetInvestmentInForeignOperationsMemberifrs-full:CurrencyRiskMember2024-12-310001306965ifrs-full:HedgesOfNetInvestmentInForeignOperationsMemberifrs-full:CurrencyRiskMember2023-12-310001306965ifrs-full:InterestRateSwapContractMemberifrs-full:GrossCarryingAmountMemberifrs-full:NotLaterThanOneYearMember2024-12-310001306965ifrs-full:InterestRateSwapContractMemberifrs-full:GrossCarryingAmountMemberifrs-full:LaterThanOneYearAndNotLaterThanTwoYearsMember2024-12-310001306965ifrs-full:InterestRateSwapContractMemberifrs-full:GrossCarryingAmountMemberifrs-full:LaterThanTwoYearsAndNotLaterThanThreeYearsMember2024-12-310001306965ifrs-full:InterestRateSwapContractMemberifrs-full:GrossCarryingAmountMemberifrs-full:LaterThanThreeYearsAndNotLaterThanFourYearsMember2024-12-310001306965ifrs-full:InterestRateSwapContractMemberifrs-full:GrossCarryingAmountMemberifrs-full:LaterThanFourYearsAndNotLaterThanFiveYearsMember2024-12-310001306965ifrs-full:InterestRateSwapContractMemberifrs-full:GrossCarryingAmountMemberifrs-full:LaterThanFiveYearsMember2024-12-310001306965ifrs-full:GrossCarryingAmountMemberifrs-full:InterestRateSwapContractMember2024-12-310001306965shel:DiscountedMemberifrs-full:InterestRateSwapContractMember2024-12-310001306965shel:ForwardForeignExchangeContractsMemberifrs-full:GrossCarryingAmountMemberifrs-full:NotLaterThanOneYearMember2024-12-310001306965shel:ForwardForeignExchangeContractsMemberifrs-full:GrossCarryingAmountMemberifrs-full:LaterThanOneYearAndNotLaterThanTwoYearsMember2024-12-310001306965shel:ForwardForeignExchangeContractsMemberifrs-full:GrossCarryingAmountMemberifrs-full:LaterThanTwoYearsAndNotLaterThanThreeYearsMember2024-12-310001306965shel:ForwardForeignExchangeContractsMemberifrs-full:GrossCarryingAmountMemberifrs-full:LaterThanThreeYearsAndNotLaterThanFourYearsMember2024-12-310001306965shel:ForwardForeignExchangeContractsMemberifrs-full:GrossCarryingAmountMemberifrs-full:LaterThanFourYearsAndNotLaterThanFiveYearsMember2024-12-310001306965shel:ForwardForeignExchangeContractsMemberifrs-full:GrossCarryingAmountMemberifrs-full:LaterThanFiveYearsMember2024-12-310001306965ifrs-full:GrossCarryingAmountMembershel:ForwardForeignExchangeContractsMember2024-12-310001306965shel:DiscountedMembershel:ForwardForeignExchangeContractsMember2024-12-310001306965shel:CurrencySwapsAndOptionsMemberifrs-full:GrossCarryingAmountMemberifrs-full:NotLaterThanOneYearMember2024-12-310001306965shel:CurrencySwapsAndOptionsMemberifrs-full:GrossCarryingAmountMemberifrs-full:LaterThanOneYearAndNotLaterThanTwoYearsMember2024-12-310001306965shel:CurrencySwapsAndOptionsMemberifrs-full:GrossCarryingAmountMemberifrs-full:LaterThanTwoYearsAndNotLaterThanThreeYearsMember2024-12-310001306965shel:CurrencySwapsAndOptionsMemberifrs-full:GrossCarryingAmountMemberifrs-full:LaterThanThreeYearsAndNotLaterThanFourYearsMember2024-12-310001306965shel:CurrencySwapsAndOptionsMemberifrs-full:GrossCarryingAmountMemberifrs-full:LaterThanFourYearsAndNotLaterThanFiveYearsMember2024-12-310001306965shel:CurrencySwapsAndOptionsMemberifrs-full:GrossCarryingAmountMemberifrs-full:LaterThanFiveYearsMember2024-12-310001306965ifrs-full:GrossCarryingAmountMembershel:CurrencySwapsAndOptionsMember2024-12-310001306965shel:DiscountedMembershel:CurrencySwapsAndOptionsMember2024-12-310001306965shel:CommodityDerivativesMemberifrs-full:GrossCarryingAmountMemberifrs-full:NotLaterThanOneYearMember2024-12-310001306965shel:CommodityDerivativesMemberifrs-full:GrossCarryingAmountMemberifrs-full:LaterThanOneYearAndNotLaterThanTwoYearsMember2024-12-310001306965shel:CommodityDerivativesMemberifrs-full:GrossCarryingAmountMemberifrs-full:LaterThanTwoYearsAndNotLaterThanThreeYearsMember2024-12-310001306965shel:CommodityDerivativesMemberifrs-full:GrossCarryingAmountMemberifrs-full:LaterThanThreeYearsAndNotLaterThanFourYearsMember2024-12-310001306965shel:CommodityDerivativesMemberifrs-full:GrossCarryingAmountMemberifrs-full:LaterThanFourYearsAndNotLaterThanFiveYearsMember2024-12-310001306965shel:CommodityDerivativesMemberifrs-full:GrossCarryingAmountMemberifrs-full:LaterThanFiveYearsMember2024-12-310001306965ifrs-full:GrossCarryingAmountMembershel:CommodityDerivativesMember2024-12-310001306965shel:DiscountedMembershel:CommodityDerivativesMember2024-12-310001306965shel:OtherContractsMemberifrs-full:GrossCarryingAmountMemberifrs-full:NotLaterThanOneYearMember2024-12-310001306965shel:OtherContractsMemberifrs-full:GrossCarryingAmountMemberifrs-full:LaterThanOneYearAndNotLaterThanTwoYearsMember2024-12-310001306965shel:OtherContractsMemberifrs-full:GrossCarryingAmountMemberifrs-full:LaterThanTwoYearsAndNotLaterThanThreeYearsMember2024-12-310001306965shel:OtherContractsMemberifrs-full:GrossCarryingAmountMemberifrs-full:LaterThanThreeYearsAndNotLaterThanFourYearsMember2024-12-310001306965shel:OtherContractsMemberifrs-full:GrossCarryingAmountMemberifrs-full:LaterThanFourYearsAndNotLaterThanFiveYearsMember2024-12-310001306965shel:OtherContractsMemberifrs-full:GrossCarryingAmountMemberifrs-full:LaterThanFiveYearsMember2024-12-310001306965ifrs-full:GrossCarryingAmountMembershel:OtherContractsMember2024-12-310001306965shel:DiscountedMembershel:OtherContractsMember2024-12-310001306965ifrs-full:GrossCarryingAmountMemberifrs-full:NotLaterThanOneYearMember2024-12-310001306965ifrs-full:GrossCarryingAmountMemberifrs-full:LaterThanOneYearAndNotLaterThanTwoYearsMember2024-12-310001306965ifrs-full:GrossCarryingAmountMemberifrs-full:LaterThanTwoYearsAndNotLaterThanThreeYearsMember2024-12-310001306965ifrs-full:GrossCarryingAmountMemberifrs-full:LaterThanThreeYearsAndNotLaterThanFourYearsMember2024-12-310001306965ifrs-full:GrossCarryingAmountMemberifrs-full:LaterThanFourYearsAndNotLaterThanFiveYearsMember2024-12-310001306965ifrs-full:GrossCarryingAmountMemberifrs-full:LaterThanFiveYearsMember2024-12-310001306965shel:DiscountedMember2024-12-310001306965ifrs-full:InterestRateSwapContractMemberifrs-full:GrossCarryingAmountMemberifrs-full:NotLaterThanOneYearMember2023-12-310001306965ifrs-full:InterestRateSwapContractMemberifrs-full:GrossCarryingAmountMemberifrs-full:LaterThanOneYearAndNotLaterThanTwoYearsMember2023-12-310001306965ifrs-full:InterestRateSwapContractMemberifrs-full:GrossCarryingAmountMemberifrs-full:LaterThanTwoYearsAndNotLaterThanThreeYearsMember2023-12-310001306965ifrs-full:InterestRateSwapContractMemberifrs-full:GrossCarryingAmountMemberifrs-full:LaterThanThreeYearsAndNotLaterThanFourYearsMember2023-12-310001306965ifrs-full:InterestRateSwapContractMemberifrs-full:GrossCarryingAmountMemberifrs-full:LaterThanFourYearsAndNotLaterThanFiveYearsMember2023-12-310001306965ifrs-full:InterestRateSwapContractMemberifrs-full:GrossCarryingAmountMemberifrs-full:LaterThanFiveYearsMember2023-12-310001306965ifrs-full:GrossCarryingAmountMemberifrs-full:InterestRateSwapContractMember2023-12-310001306965shel:DiscountedMemberifrs-full:InterestRateSwapContractMember2023-12-310001306965shel:ForwardForeignExchangeContractsMemberifrs-full:GrossCarryingAmountMemberifrs-full:NotLaterThanOneYearMember2023-12-310001306965shel:ForwardForeignExchangeContractsMemberifrs-full:GrossCarryingAmountMemberifrs-full:LaterThanOneYearAndNotLaterThanTwoYearsMember2023-12-310001306965shel:ForwardForeignExchangeContractsMemberifrs-full:GrossCarryingAmountMemberifrs-full:LaterThanTwoYearsAndNotLaterThanThreeYearsMember2023-12-310001306965shel:ForwardForeignExchangeContractsMemberifrs-full:GrossCarryingAmountMemberifrs-full:LaterThanThreeYearsAndNotLaterThanFourYearsMember2023-12-310001306965ifrs-full:LaterThanFourYearsAndNotLaterThanFiveYearsMembershel:ForwardForeignExchangeContractsMember2023-12-310001306965shel:ForwardForeignExchangeContractsMemberifrs-full:GrossCarryingAmountMemberifrs-full:LaterThanFiveYearsMember2023-12-310001306965ifrs-full:GrossCarryingAmountMembershel:ForwardForeignExchangeContractsMember2023-12-310001306965shel:DiscountedMembershel:ForwardForeignExchangeContractsMember2023-12-310001306965shel:CurrencySwapsAndOptionsMemberifrs-full:GrossCarryingAmountMemberifrs-full:NotLaterThanOneYearMember2023-12-310001306965shel:CurrencySwapsAndOptionsMemberifrs-full:GrossCarryingAmountMemberifrs-full:LaterThanOneYearAndNotLaterThanTwoYearsMember2023-12-310001306965shel:CurrencySwapsAndOptionsMemberifrs-full:GrossCarryingAmountMemberifrs-full:LaterThanTwoYearsAndNotLaterThanThreeYearsMember2023-12-310001306965shel:CurrencySwapsAndOptionsMemberifrs-full:GrossCarryingAmountMemberifrs-full:LaterThanThreeYearsAndNotLaterThanFourYearsMember2023-12-310001306965shel:CurrencySwapsAndOptionsMemberifrs-full:GrossCarryingAmountMemberifrs-full:LaterThanFourYearsAndNotLaterThanFiveYearsMember2023-12-310001306965shel:CurrencySwapsAndOptionsMemberifrs-full:GrossCarryingAmountMemberifrs-full:LaterThanFiveYearsMember2023-12-310001306965ifrs-full:GrossCarryingAmountMembershel:CurrencySwapsAndOptionsMember2023-12-310001306965shel:DiscountedMembershel:CurrencySwapsAndOptionsMember2023-12-310001306965shel:CommodityDerivativesMemberifrs-full:GrossCarryingAmountMemberifrs-full:NotLaterThanOneYearMember2023-12-310001306965shel:CommodityDerivativesMemberifrs-full:GrossCarryingAmountMemberifrs-full:LaterThanOneYearAndNotLaterThanTwoYearsMember2023-12-310001306965shel:CommodityDerivativesMemberifrs-full:GrossCarryingAmountMemberifrs-full:LaterThanTwoYearsAndNotLaterThanThreeYearsMember2023-12-310001306965shel:CommodityDerivativesMemberifrs-full:GrossCarryingAmountMemberifrs-full:LaterThanThreeYearsAndNotLaterThanFourYearsMember2023-12-310001306965shel:CommodityDerivativesMemberifrs-full:GrossCarryingAmountMemberifrs-full:LaterThanFourYearsAndNotLaterThanFiveYearsMember2023-12-310001306965shel:CommodityDerivativesMemberifrs-full:GrossCarryingAmountMemberifrs-full:LaterThanFiveYearsMember2023-12-310001306965ifrs-full:GrossCarryingAmountMembershel:CommodityDerivativesMember2023-12-310001306965shel:DiscountedMembershel:CommodityDerivativesMember2023-12-310001306965shel:OtherContractsMemberifrs-full:GrossCarryingAmountMemberifrs-full:NotLaterThanOneYearMember2023-12-310001306965shel:OtherContractsMemberifrs-full:GrossCarryingAmountMemberifrs-full:LaterThanOneYearAndNotLaterThanTwoYearsMember2023-12-310001306965shel:OtherContractsMemberifrs-full:GrossCarryingAmountMemberifrs-full:LaterThanTwoYearsAndNotLaterThanThreeYearsMember2023-12-310001306965shel:OtherContractsMemberifrs-full:GrossCarryingAmountMemberifrs-full:LaterThanThreeYearsAndNotLaterThanFourYearsMember2023-12-310001306965shel:OtherContractsMemberifrs-full:GrossCarryingAmountMemberifrs-full:LaterThanFourYearsAndNotLaterThanFiveYearsMember2023-12-310001306965shel:OtherContractsMemberifrs-full:GrossCarryingAmountMemberifrs-full:LaterThanFiveYearsMember2023-12-310001306965ifrs-full:GrossCarryingAmountMembershel:OtherContractsMember2023-12-310001306965shel:DiscountedMembershel:OtherContractsMember2023-12-310001306965ifrs-full:GrossCarryingAmountMemberifrs-full:NotLaterThanOneYearMember2023-12-310001306965ifrs-full:GrossCarryingAmountMemberifrs-full:LaterThanOneYearAndNotLaterThanTwoYearsMember2023-12-310001306965ifrs-full:GrossCarryingAmountMemberifrs-full:LaterThanTwoYearsAndNotLaterThanThreeYearsMember2023-12-310001306965ifrs-full:GrossCarryingAmountMemberifrs-full:LaterThanThreeYearsAndNotLaterThanFourYearsMember2023-12-310001306965ifrs-full:GrossCarryingAmountMemberifrs-full:LaterThanFourYearsAndNotLaterThanFiveYearsMember2023-12-310001306965ifrs-full:GrossCarryingAmountMemberifrs-full:LaterThanFiveYearsMember2023-12-310001306965shel:DiscountedMember2023-12-310001306965ifrs-full:Level1OfFairValueHierarchyMemberifrs-full:InterestRateSwapContractMember2024-12-310001306965ifrs-full:Level2OfFairValueHierarchyMemberifrs-full:InterestRateSwapContractMember2024-12-310001306965ifrs-full:Level3OfFairValueHierarchyMemberifrs-full:InterestRateSwapContractMember2024-12-310001306965ifrs-full:InterestRateSwapContractMember2024-12-310001306965ifrs-full:Level1OfFairValueHierarchyMembershel:ForwardForeignExchangeContractsMember2024-12-310001306965ifrs-full:Level2OfFairValueHierarchyMembershel:ForwardForeignExchangeContractsMember2024-12-310001306965ifrs-full:Level3OfFairValueHierarchyMembershel:ForwardForeignExchangeContractsMember2024-12-310001306965shel:ForwardForeignExchangeContractsMember2024-12-310001306965ifrs-full:Level1OfFairValueHierarchyMembershel:CurrencySwapsAndOptionsMember2024-12-310001306965ifrs-full:Level2OfFairValueHierarchyMembershel:CurrencySwapsAndOptionsMember2024-12-310001306965ifrs-full:Level3OfFairValueHierarchyMembershel:CurrencySwapsAndOptionsMember2024-12-310001306965shel:CurrencySwapsAndOptionsMember2024-12-310001306965ifrs-full:Level1OfFairValueHierarchyMembershel:CommodityDerivativesMember2024-12-310001306965ifrs-full:Level2OfFairValueHierarchyMembershel:CommodityDerivativesMember2024-12-310001306965ifrs-full:Level3OfFairValueHierarchyMembershel:CommodityDerivativesMember2024-12-310001306965shel:CommodityDerivativesMember2024-12-310001306965ifrs-full:Level1OfFairValueHierarchyMembershel:OtherContractsMember2024-12-310001306965ifrs-full:Level2OfFairValueHierarchyMembershel:OtherContractsMember2024-12-310001306965ifrs-full:Level3OfFairValueHierarchyMembershel:OtherContractsMember2024-12-310001306965shel:OtherContractsMember2024-12-310001306965ifrs-full:Level1OfFairValueHierarchyMember2024-12-310001306965ifrs-full:Level2OfFairValueHierarchyMember2024-12-310001306965ifrs-full:Level3OfFairValueHierarchyMember2024-12-310001306965ifrs-full:Level1OfFairValueHierarchyMemberifrs-full:InterestRateSwapContractMember2023-12-310001306965ifrs-full:Level2OfFairValueHierarchyMemberifrs-full:InterestRateSwapContractMember2023-12-310001306965ifrs-full:Level3OfFairValueHierarchyMemberifrs-full:InterestRateSwapContractMember2023-12-310001306965ifrs-full:InterestRateSwapContractMember2023-12-310001306965ifrs-full:Level1OfFairValueHierarchyMembershel:ForwardForeignExchangeContractsMember2023-12-310001306965ifrs-full:Level2OfFairValueHierarchyMembershel:ForwardForeignExchangeContractsMember2023-12-310001306965ifrs-full:Level3OfFairValueHierarchyMembershel:ForwardForeignExchangeContractsMember2023-12-310001306965shel:ForwardForeignExchangeContractsMember2023-12-310001306965ifrs-full:Level1OfFairValueHierarchyMembershel:CurrencySwapsAndOptionsMember2023-12-310001306965ifrs-full:Level2OfFairValueHierarchyMembershel:CurrencySwapsAndOptionsMember2023-12-310001306965ifrs-full:Level3OfFairValueHierarchyMembershel:CurrencySwapsAndOptionsMember2023-12-310001306965shel:CurrencySwapsAndOptionsMember2023-12-310001306965ifrs-full:Level1OfFairValueHierarchyMembershel:CommodityDerivativesMember2023-12-310001306965ifrs-full:Level2OfFairValueHierarchyMembershel:CommodityDerivativesMember2023-12-310001306965ifrs-full:Level3OfFairValueHierarchyMembershel:CommodityDerivativesMember2023-12-310001306965shel:CommodityDerivativesMember2023-12-310001306965ifrs-full:Level1OfFairValueHierarchyMembershel:OtherContractsMember2023-12-310001306965ifrs-full:Level2OfFairValueHierarchyMembershel:OtherContractsMember2023-12-310001306965ifrs-full:Level3OfFairValueHierarchyMembershel:OtherContractsMember2023-12-310001306965shel:OtherContractsMember2023-12-310001306965ifrs-full:Level1OfFairValueHierarchyMember2023-12-310001306965ifrs-full:Level2OfFairValueHierarchyMember2023-12-310001306965ifrs-full:Level3OfFairValueHierarchyMember2023-12-310001306965ifrs-full:Level3OfFairValueHierarchyMember2022-12-310001306965ifrs-full:Level3OfFairValueHierarchyMember2024-01-012024-12-310001306965ifrs-full:Level3OfFairValueHierarchyMember2023-01-012023-12-310001306965ifrs-full:OrdinarySharesMemberifrs-full:IssuedCapitalMember2023-12-310001306965ifrs-full:OrdinarySharesMemberifrs-full:IssuedCapitalMember2024-01-012024-12-310001306965ifrs-full:OrdinarySharesMemberifrs-full:IssuedCapitalMember2024-12-310001306965ifrs-full:OrdinarySharesMemberifrs-full:IssuedCapitalMember2022-12-310001306965ifrs-full:OrdinarySharesMemberifrs-full:IssuedCapitalMember2023-01-012023-12-310001306965shel:OrdinarySharesIssueMandateMember2024-05-2100013069652024-05-210001306965shel:OrdinarySharesIssueMandateMember2024-05-212024-05-210001306965shel:EquitySettledMember2024-01-012024-12-310001306965shel:EquitySettledMember2023-01-012023-12-310001306965shel:EquitySettledMember2022-01-012022-12-310001306965ifrs-full:BottomOfRangeMembershel:ShareAwardsUnderPSPAndLTIPMember2024-01-012024-12-310001306965ifrs-full:TopOfRangeMembershel:ShareAwardsUnderPSPAndLTIPMember2024-01-012024-12-310001306965ifrs-full:OrdinarySharesMembershel:ShareAwardsUnderPSPAndLTIPMember2023-12-310001306965shel:AClassAmericanDepositarySharesMembershel:ShareAwardsUnderPSPAndLTIPMember2023-12-310001306965shel:ShareAwardsUnderPSPAndLTIPMember2023-01-012023-12-310001306965ifrs-full:OrdinarySharesMembershel:ShareAwardsUnderPSPAndLTIPMember2024-01-012024-12-310001306965shel:AClassAmericanDepositarySharesMembershel:ShareAwardsUnderPSPAndLTIPMember2024-01-012024-12-310001306965ifrs-full:OrdinarySharesMembershel:ShareAwardsUnderPSPAndLTIPMember2024-12-310001306965shel:AClassAmericanDepositarySharesMembershel:ShareAwardsUnderPSPAndLTIPMember2024-12-310001306965shel:ShareAwardsUnderPSPAndLTIPMember2024-01-012024-12-310001306965ifrs-full:OrdinarySharesMembershel:ShareAwardsUnderPSPAndLTIPMember2022-12-310001306965shel:AClassAmericanDepositarySharesMembershel:ShareAwardsUnderPSPAndLTIPMember2022-12-310001306965shel:ShareAwardsUnderPSPAndLTIPMember2022-01-012022-12-310001306965ifrs-full:OrdinarySharesMembershel:ShareAwardsUnderPSPAndLTIPMember2023-01-012023-12-310001306965shel:AClassAmericanDepositarySharesMembershel:ShareAwardsUnderPSPAndLTIPMember2023-01-012023-12-310001306965ifrs-full:OrdinarySharesMembershel:SharesHeldByEmployeeShareTrustsMember2024-12-310001306965ifrs-full:OrdinarySharesMembershel:SharesHeldByEmployeeShareTrustsMember2023-12-310001306965shel:AClassAmericanDepositarySharesMembershel:SharesHeldByEmployeeShareTrustsMember2024-12-310001306965shel:AClassAmericanDepositarySharesMembershel:SharesHeldByEmployeeShareTrustsMember2023-12-310001306965ifrs-full:MergerReserveMember2023-12-310001306965shel:SharePremiumReserveMember2023-12-310001306965ifrs-full:CapitalRedemptionReserveMember2023-12-310001306965shel:SharePlanReserveMember2023-12-310001306965ifrs-full:AccumulatedOtherComprehensiveIncomeMember2023-12-310001306965ifrs-full:AccumulatedOtherComprehensiveIncomeMember2024-01-012024-12-310001306965ifrs-full:CapitalRedemptionReserveMember2024-01-012024-12-310001306965shel:SharePlanReserveMember2024-01-012024-12-310001306965ifrs-full:MergerReserveMember2024-12-310001306965shel:SharePremiumReserveMember2024-12-310001306965ifrs-full:CapitalRedemptionReserveMember2024-12-310001306965shel:SharePlanReserveMember2024-12-310001306965ifrs-full:AccumulatedOtherComprehensiveIncomeMember2024-12-310001306965ifrs-full:MergerReserveMember2022-12-310001306965shel:SharePremiumReserveMember2022-12-310001306965ifrs-full:CapitalRedemptionReserveMember2022-12-310001306965shel:SharePlanReserveMember2022-12-310001306965ifrs-full:AccumulatedOtherComprehensiveIncomeMember2022-12-310001306965ifrs-full:AccumulatedOtherComprehensiveIncomeMember2023-01-012023-12-310001306965ifrs-full:CapitalRedemptionReserveMember2023-01-012023-12-310001306965shel:SharePlanReserveMember2023-01-012023-12-310001306965ifrs-full:MergerReserveMember2021-12-310001306965shel:SharePremiumReserveMember2021-12-310001306965ifrs-full:CapitalRedemptionReserveMember2021-12-310001306965shel:SharePlanReserveMember2021-12-310001306965ifrs-full:AccumulatedOtherComprehensiveIncomeMember2021-12-310001306965ifrs-full:AccumulatedOtherComprehensiveIncomeMember2022-01-012022-12-310001306965ifrs-full:CapitalRedemptionReserveMember2022-01-012022-12-310001306965shel:SharePlanReserveMember2022-01-012022-12-310001306965shel:ForeignCurrencyTranslationDifferencesMember2023-12-310001306965shel:EquityInstrumentRemeasurementsMember2023-12-310001306965shel:DebtInstrumentsRemeasurementsMember2023-12-310001306965shel:CashFlowHedgingGainsLossesMember2023-12-310001306965shel:ReserveOfNetInvestmentHedgesMember2023-12-310001306965shel:DeferredCostOfHedgingMember2023-12-310001306965shel:RetirementBenefitsRemeasurementsMember2023-12-310001306965shel:ForeignCurrencyTranslationDifferencesMember2024-01-012024-12-310001306965shel:EquityInstrumentRemeasurementsMember2024-01-012024-12-310001306965shel:DebtInstrumentsRemeasurementsMember2024-01-012024-12-310001306965shel:CashFlowHedgingGainsLossesMember2024-01-012024-12-310001306965shel:ReserveOfNetInvestmentHedgesMember2024-01-012024-12-310001306965shel:DeferredCostOfHedgingMember2024-01-012024-12-310001306965shel:RetirementBenefitsRemeasurementsMember2024-01-012024-12-310001306965shel:ForeignCurrencyTranslationDifferencesMember2024-12-310001306965shel:EquityInstrumentRemeasurementsMember2024-12-310001306965shel:DebtInstrumentsRemeasurementsMember2024-12-310001306965shel:CashFlowHedgingGainsLossesMember2024-12-310001306965shel:ReserveOfNetInvestmentHedgesMember2024-12-310001306965shel:DeferredCostOfHedgingMember2024-12-310001306965shel:RetirementBenefitsRemeasurementsMember2024-12-310001306965shel:ForeignCurrencyTranslationDifferencesMember2022-12-310001306965shel:EquityInstrumentRemeasurementsMember2022-12-310001306965shel:DebtInstrumentsRemeasurementsMember2022-12-310001306965shel:CashFlowHedgingGainsLossesMember2022-12-310001306965shel:ReserveOfNetInvestmentHedgesMember2022-12-310001306965shel:DeferredCostOfHedgingMember2022-12-310001306965shel:RetirementBenefitsRemeasurementsMember2022-12-310001306965shel:ForeignCurrencyTranslationDifferencesMember2023-01-012023-12-310001306965shel:EquityInstrumentRemeasurementsMember2023-01-012023-12-310001306965shel:DebtInstrumentsRemeasurementsMember2023-01-012023-12-310001306965shel:CashFlowHedgingGainsLossesMember2023-01-012023-12-310001306965shel:ReserveOfNetInvestmentHedgesMember2023-01-012023-12-310001306965shel:DeferredCostOfHedgingMember2023-01-012023-12-310001306965shel:RetirementBenefitsRemeasurementsMember2023-01-012023-12-310001306965shel:ForeignCurrencyTranslationDifferencesMember2021-12-310001306965shel:EquityInstrumentRemeasurementsMember2021-12-310001306965shel:DebtInstrumentsRemeasurementsMember2021-12-310001306965shel:CashFlowHedgingGainsLossesMember2021-12-310001306965shel:ReserveOfNetInvestmentHedgesMember2021-12-310001306965shel:DeferredCostOfHedgingMember2021-12-310001306965shel:RetirementBenefitsRemeasurementsMember2021-12-310001306965shel:ForeignCurrencyTranslationDifferencesMember2022-01-012022-12-310001306965shel:EquityInstrumentRemeasurementsMember2022-01-012022-12-310001306965shel:DebtInstrumentsRemeasurementsMember2022-01-012022-12-310001306965shel:CashFlowHedgingGainsLossesMember2022-01-012022-12-310001306965shel:ReserveOfNetInvestmentHedgesMember2022-01-012022-12-310001306965shel:DeferredCostOfHedgingMember2022-01-012022-12-310001306965shel:RetirementBenefitsRemeasurementsMember2022-01-012022-12-310001306965shel:MarchMember2024-01-012024-12-310001306965shel:MarchMember2023-01-012023-12-310001306965shel:MarchMember2022-01-012022-12-310001306965shel:JuneMember2024-01-012024-12-310001306965shel:JuneMember2023-01-012023-12-310001306965shel:JuneMember2022-01-012022-12-310001306965shel:SeptemberMember2024-01-012024-12-310001306965shel:SeptemberMember2023-01-012023-12-310001306965shel:SeptemberMember2022-01-012022-12-310001306965shel:DecemberMember2024-01-012024-12-310001306965shel:DecemberMember2023-01-012023-12-310001306965shel:DecemberMember2022-01-012022-12-310001306965ifrs-full:MajorOrdinaryShareTransactionsMember2025-01-302025-01-300001306965shel:PesticideLitigationMember2024-01-012024-12-310001306965country:USshel:ClimateChangeLitigationMember2024-01-012024-12-310001306965country:NLshel:ClimateChangeLitigationMember2024-01-012024-12-310001306965shel:NederlandseAardolieMaatschappijBVMember2024-01-012024-12-310001306965shel:ExxonMobilMembershel:NederlandseAardolieMaatschappijBVMember2024-01-012024-12-310001306965shel:NAMGroningenGasFieldLitigationMember2024-12-310001306965country:KZ2024-01-012024-12-310001306965shel:NigerianLitigationMember2017-03-012017-03-310001306965country:RU2024-10-022024-10-020001306965country:RU2024-10-020001306965shel:ShellBusinessServiceCentreMember2024-01-012024-12-310001306965shel:ShellBusinessServiceCentreMember2023-01-012023-12-310001306965shel:ShellBusinessServiceCentreMember2022-01-012022-12-310001306965shel:DirectorsMember2024-01-012024-12-310001306965shel:DirectorsMember2023-01-012023-12-310001306965shel:DirectorsMember2022-01-012022-12-310001306965shel:DirectorsAndSeniorManagementMember2024-01-012024-12-310001306965shel:DirectorsAndSeniorManagementMember2023-01-012023-12-310001306965shel:DirectorsAndSeniorManagementMember2022-01-012022-12-310001306965ifrs-full:MajorOrdinaryShareTransactionsMember2025-01-30
UNITED STATES SECURITIES AND EXCHANGE COMMISSION
Washington, D.C. 20549
Form 20-F
(Mark one)
☐ REGISTRATION STATEMENT PURSUANT TO SECTION 12(b) OR (g) OF THE SECURITIES EXCHANGE ACT OF 1934
OR
☑ ANNUAL REPORT PURSUANT TO SECTION 13 OR 15(d) OF THE SECURITIES EXCHANGE ACT OF 1934
For the fiscal year ended December 31, 2024
OR
☐ TRANSITION REPORT PURSUANT TO SECTION 13 OR 15(d) OF THE SECURITIES EXCHANGE ACT OF 1934
OR
☐ SHELL COMPANY REPORT PURSUANT TO SECTION 13 OR 15(d) OF THE SECURITIES EXCHANGE ACT OF 1934
Commission file number 001-32575
Shell plc
(Exact name of registrant as specified in its charter)
England and Wales
(Jurisdiction of incorporation or organization)
Shell Centre
London, SE1 7NA
United Kingdom
(Address of principal executive offices)
Sean Ashley, Company Secretary
Shell Centre
London, SE1 7NA
United Kingdom
Telephone Number: 0044-20-7934-1234
E-mail Address: sean.ashley@shell.com
(Name, Telephone, E-mail and/or Facsimile number and Address of Company Contact Person)
Securities registered pursuant to Section 12(b) of the Act
| | | | | | | | | | | |
| Title of Each Class | Trading Symbols | Name of Each Exchange on Which Registered | |
American Depositary Shares representing two ordinary shares with a nominal value of €0.07 each | SHEL | New York Stock Exchange | * |
| 3.25% Guaranteed Notes due 2025 | SHEL/25 | New York Stock Exchange | |
| 2.5% Guaranteed Notes due 2026 | SHEL/26 | New York Stock Exchange | |
| 2.875% Guaranteed Notes due 2026 | SHEL/26A | New York Stock Exchange | |
| 3.875% Guaranteed Notes due 2028 | SHEL/28 | New York Stock Exchange | |
| 2.375% Guaranteed Notes due 2029 | SHEL/29 | New York Stock Exchange | |
2.375% Guaranteed Notes due 2029 | SHEL/29A | New York Stock Exchange | |
| 2.75% Guaranteed Notes due 2030 | SHEL/30 | New York Stock Exchange | |
2.750% Guaranteed Notes due 2030 | SHEL/30A | New York Stock Exchange | |
| 4.125% Guaranteed Notes due 2035 | SHEL/35 | New York Stock Exchange | |
4.125% Guaranteed Notes due 2035 | SHEL/35A | New York Stock Exchange | |
| 6.375% Guaranteed Notes due 2038 | SHEL/38 | New York Stock Exchange | |
| 5.5% Guaranteed Notes due 2040 | SHEL/40 | New York Stock Exchange | |
| 2.875% Guaranteed Notes due 2041 | SHEL/41 | New York Stock Exchange | |
| 3.625% Guaranteed Notes due 2042 | SHEL/42 | New York Stock Exchange | |
| 4.55% Guaranteed Notes due 2043 | SHEL/43 | New York Stock Exchange | |
4.550% Guaranteed Notes due 2043 | SHEL/43A | New York Stock Exchange | |
| 4.375% Guaranteed Notes due 2045 | SHEL/45 | New York Stock Exchange | |
4.375% Guaranteed Notes due 2045 | SHEL/45A | New York Stock Exchange | |
| 3.75% Guaranteed Notes due 2046 | SHEL/46 | New York Stock Exchange | |
| 4.00% Guaranteed Notes due 2046 | SHEL/46A | New York Stock Exchange | |
4.000% Guaranteed Notes due 2046 | SHEL/46B | New York Stock Exchange | |
3.750% Guaranteed Notes due 2046 | SHEL/46C | New York Stock Exchange | |
| 3.125% Guaranteed Notes due 2049 | SHEL/49 | New York Stock Exchange | |
| 3.25% Guaranteed Notes due 2050 | SHEL/50 | New York Stock Exchange | |
3.250% Guaranteed Notes due 2050 | SHEL/50A | New York Stock Exchange | |
| 3.00% Guaranteed Notes due 2051 | SHEL/51 | New York Stock Exchange | |
* Not for trading, but only in connection with the registration of the American Depositary Shares issued in respect thereof, pursuant to the requirements of the Securities and Exchange Commission.
Securities registered pursuant to Section 12(g) of the Act: none
Securities for which there is a reporting obligation pursuant to Section 15(d) of the Act: none
Indicate the number of outstanding shares of each of the issuer's classes of capital or common stock as of the close of the period covered by the annual report.
Outstanding as of December 31, 2024:
6,084,228,376 ordinary shares with a nominal value of €0.07 each.
| | | | | | | | | | | | | | |
| Indicate by check mark if the registrant is a well-known seasoned issuer, as defined in Rule 405 of the Securities Act. | þ | Yes | ☐ | No |
| If this report is an annual or transition report, indicate by check mark if the registrant is not required to file reports pursuant to Section 13 or 15(d) of the Securities Exchange Act of 1934. | ☐ | Yes | þ | No |
| Indicate by check mark whether the registrant (1) has filed all reports required to be filed by Section 13 or 15(d) of the Securities Exchange Act of 1934 during the preceding 12 months (or for such shorter period that the registrant was required to file such reports), and (2) has been subject to such filing requirements for the past 90 days. | þ | Yes | ☐ | No |
| Indicate by check mark whether the registrant has submitted electronically every Interactive Data File required to be submitted pursuant to Rule 405 of Regulation S-T (§232.405 of this chapter) during the preceding 12 months (or for such shorter period that the registrant was required to submit such files). | þ | Yes | ☐ | No |
Indicate by check mark whether the registrant is a large accelerated filer, an accelerated filer, a non-accelerated filer, or an emerging growth company.
See definition of "large accelerated filer," "accelerated filer," and "emerging growth company" in Rule 12b-2 of the Exchange Act.
| | | | | | | | | | | | | | | | | | | | | | | |
| Large accelerated filer | þ | Accelerated filer | ☐ | Non-accelerated filer | ☐ | |
| | | | | Emerging growth company | ☐ | |
| If an emerging growth company that prepares its financial statements in accordance with U.S. GAAP, indicate by check mark if the registrant has elected not to use the extended transition period for complying with any new or revised financial accounting standards† provided pursuant to Section 13(a) of the Exchange Act. | | ☐ | |
† The term "new or revised financial accounting standards" refers to any update issued by the Financial Accounting Standards Board to its Accounting Standards Codification after April 5, 2012.
| | | | | | | | | | | | | | | | | | | | |
Indicate by check mark whether the registrant has filed a report on and attestation to its management's assessment of the effectiveness of its internal control over financial reporting under Section 404(b) of the Sarbanes-Oxley Act (15 U.S.C. 7262(b)) by the registered public accounting firm that prepared or issued its audit report. | | þ | | | | |
If securities are registered pursuant to Section 12(b) of the Act, indicate by check mark whether the financial statements of the registrant included in the filing reflect the correction of an error to previously issued financial statements. | | ☐ | | | | |
Indicate by check mark whether any of those error corrections are restatements that required a recovery analysis of incentive-based compensation received by any of the registrant's executive officers during the relevant recovery period pursuant to §240.10D-1(b). | | ☐ | | | | |
| Indicate by check mark which basis of accounting the registrant has used to prepare the financial statements included in this filing: | | | U.S. GAAP | ☐ | |
International Financial Reporting Standards as issued by the International Accounting Standards Board. | þ | | Other | ☐ | |
| If "Other" has been checked in response to the previous question, indicate by check mark which financial statement item the registrant has elected to follow. | Item 17 | ☐ | | Item 18 | ☐ | |
| If this is an annual report, indicate by check mark whether the registrant is a shell company (as defined in Rule 12b-2 of the Exchange Act). | | ☐ | Yes | | þ | No |
Copies of notices and communications from the Securities and Exchange Commission should be sent to:
Shell plc
Shell Centre
London, SE1 7NA
United Kingdom
Attn:Sean Ashley
| | | | | |
| Cover | |
| Cross reference to Form 20-F | |
| Terms and abbreviations | |
| About this Report | |
| Chair's message | |
| Chief Executive Officer's review | |
Shell's Strategy | |
This is Shell | |
Our strategy | |
| |
Outlook | |
Risk factors and risk management | |
Performance in the year | |
| Performance indicators | |
| Generating shareholder value | |
| Group Results | |
Liquidity and capital resources | |
| Market overview | |
| Integrated Gas | |
| Upstream | |
| Oil and gas information | |
| Marketing | |
| Chemicals and Products | |
| Renewables and Energy Solutions | |
| Corporate | |
| Other central activities | |
| Our journey to net zero | |
| Energy transition strategy | |
| Climate-related metrics and targets | |
| Other regulatory disclosures | |
| Respecting Nature | |
| Powering Lives | |
Our People | |
| Contribution to society | |
Safety | |
| Living by our values | |
Our approach to sustainability | |
| The Board of Shell plc | |
| | | | | |
Executive Committee | |
| Board Activities | |
| Governance framework | |
| Nomination and Succession Committee | |
Sustainability Committee | |
Audit and Risk Committee Report | |
| Directors' Remuneration Report | |
| Annual Report on Remuneration | |
| Directors' Remuneration Policy | |
| Other regulatory and statutory information | |
Report of Independent Registered Public Accounting Firm (ID: 1438) | |
| Consolidated Statement of Income | |
| Consolidated Statement of Comprehensive Income | |
| Consolidated Balance Sheet | |
| Consolidated Statement of Changes in Equity | |
| Consolidated Statement of Cash Flows | |
| Notes to the Consolidated Financial Statements | |
1.Basis of preparation | |
2.Material accounting policies, judgements and estimates | |
3.Changes to IFRS not yet adopted | |
4.Climate change and energy transition | |
5.Emission schemes and related environmental plans | |
6.Capital management | |
7.Segment information | |
8.Operating Revenues | |
9.Interest and other income | |
10.Interest expense | |
11.Goodwill and other Intangible assets | |
12.Property, plant and equipment | |
13.Impairment of property, plant and equipment, goodwill and other intangible assets | |
14.Joint ventures and associates | |
15.Investments in securities | |
16.Trade and other receivables | |
17.Inventories | |
18.Cash and cash equivalents | |
19.Assets held for sale | |
20.Trade and other payables | |
21.Debt | |
| | | | | |
22.Leases | |
23.Taxation | |
24.Retirement benefits | |
25.Decommissioning and other provisions | |
26.Financial instruments | |
27.Share capital | |
28.Share-based compensation plans and shares held in trust | |
29.Other reserves | |
30.Dividends | |
31.Earnings per share | |
32.Legal proceedings and other contingencies | |
33.Employees | |
34.Directors and Senior Management | |
35.Auditor's remuneration | |
36.Post-balance sheet events | |
| Supplementary information - oil and gas (unaudited) | |
| Supplementary information - EU Taxonomy disclosure | |
| |
| Shareholder information | |
| Section 13(r) of the US Securities Exchange Act of 1934 disclosure | |
| Non-GAAP measures reconciliations | |
| Index to the exhibits | |
| Signatures | |
| |
| Financial calendar | 347 |
| | | | | |
CROSS REFERENCE TO FORM 20-F |
| |
| | | | | | | | | | | |
| Part I | | | Pages |
| Item 1. | Identity of Directors, Senior Management and Advisers | N/A |
| Item 2. | Offer Statistics and Expected Timetable | N/A |
| Item 3. | Key Information | |
| A. | [Reserved] | |
| B. | Capitalization and indebtedness | N/A |
| C. | Reasons for the offer and use of proceeds | N/A |
| D. | Risk factors | 25-32 |
| Item 4. | Information on the Company | |
| A. | History and development of the company | 12-28, 39-79, 114-138, 291-309 |
| B. | Business overview | 13-32, 35-36, 48-92, 124-148, 297-316 |
| C. | Organizational structure | 18, Exhibit 8.1 |
| D. | Property, plants and equipment | 25-32, 38-40, 48-92, 124-128, 137-141, 297-316 |
| Item 4A. | Unresolved Staff Comments | N/A |
| Item 5. | Operating and Financial Review and Prospects | |
| A. | Operating results | 25-32, 35-44, 48-92, 282-294 |
| B. | Liquidity and capital resources | 38-44, 48-49, 55-56, 72-73, 77-78, 85-86, 89-90, 227-237, 252, 258-271 |
| C. | Research and development, patents and licences, etc. | 13, 92, 107, 223, 228, 253-255 |
| D. | Trend information | 23-32, 35-63, 72-88, 93-148 |
| E. | Critical Accounting Estimates | N/A |
| Item 6. | Directors, Senior Management and Employees | |
| A. | Directors and senior management | 149-156, 211-213 |
| B. | Compensation | 180-183, 185-207, 295 |
| C. | Board practices | 33-34, 149-199, 208-218 |
| D. | Employees | 130-134, 295 |
| E. | Share ownership | 134, 156, 193, 210, 289-290, 331 |
| F. | Disclosure of a registrant's action to recover erroneously awarded compensation | N/A |
| Item 7. | Major Shareholders and Related Party Transactions | |
| A. | Major shareholders | 332 | |
| B. | Related party transactions | 209, 264, 295 |
| C. | Interests of experts and counsel | N/A |
| Item 8. | Financial Information | |
| A. | Consolidated Statements and Other Financial Information | 24, 43-44, 219-296 |
| B. | Significant Changes | 296 | |
| Item 9. | The Offer and Listing | |
| A. | Offer and listing details | 331 | |
| B. | Plan of distribution | N/A |
| C. | Markets | 331 | |
| D. | Selling shareholders | N/A |
| E. | Dilution | N/A |
| F. | Expenses of the issue | N/A |
| Item 10. | Additional Information | |
| A. | Share capital | N/A |
| B. | Memorandum and articles of association | 211-218 |
| C. | Material contracts | N/A |
| D. | Exchange controls | 333 | |
| E. | Taxation | 333-335 |
| | | | | | | | | | | |
| F. | Dividends and paying agents | N/A |
| G. | Statement by experts | N/A |
| H. | Documents on display | 12 | |
| I. | Subsidiary Information | N/A |
| J. | Annual Report to Security Holders | See Form 6-K, furnished March 25, 2025 |
| Item 11. | Quantitative and Qualitative Disclosures About Market Risk | 41, 234-236, 265, 282-288 |
| Item 12. | Description of Securities Other than Equity Securities | |
| A. | Debt Securities | Exhibit 2.6 |
| B. | Warrants and Rights | N/A |
| C. | Other Securities | N/A |
| D. | American Depositary Shares | 331-333, Exhibit 2.6 |
| | | |
| Part II | | | |
| Item 13. | | Defaults, Dividend Arrearages and Delinquencies | N/A |
| Item 14. | | Material Modifications to the Rights of Security Holders and Use of Proceeds | N/A |
| Item 15. | | Controls and Procedures | 208, 222 |
| Item 16. | | [Reserved] | |
| Item 16A. | | Audit committee financial expert | 169 |
| Item 16B. | | Code of Ethics | 210 |
| Item 16C. | | Principal Accountant Fees and Services | 179 |
| Item 16D. | | Exemptions from the Listing Standards for Audit Committees | 210-211 |
| Item 16E. | | Purchases of Equity Securities by the Issuer and Affiliated Purchasers | 43-44, 208 |
| Item 16F. | | Change in Registrant's Certifying Accountant | N/A |
| Item 16G. | | Corporate Governance | 210-218 |
| Item 16H. | | Mine Safety Disclosure | N/A |
| Item 16I. | | Disclosure Regarding Foreign Jurisdictions that Prevent Inspections | N/A |
| Item 16J. | | Insider trading policies | 210, Exhibits 11.1 and 11.2 |
| Item 16K. | | Cybersecurity | 30, 91-92 |
| | | |
| Part III | | | |
| Item 17. | | Financial Statements | N/A |
| Item 18. | | Financial Statements | 219-296 |
| Item 19. | | Exhibits | 345 |
Terms and abbreviations
Currencies
Units of measurement
| | | | | |
| acre | approximately 0.004 square kilometres |
| b(/d) | barrels (per day) |
| bbl | barrel |
boe(/d)
| barrels of oil equivalent (per day); natural gas volumes are converted into oil equivalent using a factor of 5,800 scf per barrel |
| GJ | gigajoule |
| GW | gigawatt |
kboe(/d)
| thousand barrels of oil equivalent (per day); natural gas volumes are converted into oil equivalent using a factor of 5,800 scf per barrel |
| kWh | kilowatt-hours |
| mb/d | million barrels per day |
| megajoule | a unit of energy equal to one million joules |
| MMBtu | million British thermal units |
| mtpa | million tonnes per annum |
| MW | megawatt |
| MWh | megawatt-hours |
Nm3 | normal cubic metre |
| per day | volumes are converted into a daily basis using a calendar year |
| scf(/d) | standard cubic feet (per day) |
| TWh | terawatt-hours |
Products
| | | | | |
| GTL | gas-to-liquids |
| LNG | liquefied natural gas |
| LPG | liquefied petroleum gas |
| NGL | natural gas liquids |
Miscellaneous
| | | | | |
| Act | UK Companies Act 2006 |
| ADS | American Depositary Share |
| AGM | Annual General Meeting |
| API | American Petroleum Institute |
| APM | Alternative performance measure |
| ARC | Audit and Risk Committee |
| CCS | carbon capture and storage |
| CCS earnings | earnings on a current cost of supplies basis |
CFFO | cash flow from operating activities |
CISO | Chief Information Security Officer |
CMD | Capital Markets Day |
| CMF | carbon management framework |
CO2 | carbon dioxide |
CO2e | carbon dioxide equivalent |
CRC | Carbon Reporting Committee |
CRT | Commercial Road Transport |
CSRD | Corporate Sustainability Reporting Directive |
| DE&I | Diversity, equity, and inclusion |
| EC | Executive Committee |
| | | | | |
| EMTN | Euro medium-term note |
| EPS | earnings per share |
| EPSA | exploration and production sharing agreement |
| EPTB | Environmental Products Trading Business |
ESRS | European Sustainability Reporting Standards |
| ETS24 | Energy Transition Strategy 2024 |
EV | Electric vehicle |
| FCF | free cash flow |
| FID | final investment decision |
| GAAP | generally accepted accounting principles |
| GHG | greenhouse gas |
| HSSE | health, safety, security and environment |
| IAS | International Accounting Standards |
| IEA | International Energy Agency |
| IFRS | International Financial Reporting Standard(s) |
| IOGP | International Association of Oil & Gas Producers |
| IPCC | Intergovernmental Panel on Climate Change |
Ipieca
| International Petroleum Industry Environmental Conservation Association |
| IRM | Information Risk Management |
| ISO | International Organisation for Standardisation |
ISSB | International Sustainability Standards Board |
| KPI | Key performance indicator |
| LGBT+ | Lesbian, gay, bisexual and transgender |
| LTIP | Long-term Incentive Plan |
NBS | Nature-Based Solutions |
| NCI | net carbon intensity |
NGO | Non-governmental organisation |
| NOMCO | Nomination and Succession Committee |
| NZE | Net zero emissions |
| OECD | Organisation for Economic Co-operation and Development |
| OFCF | organic free cash flow |
| OGCI | Oil and Gas Climate Initiative |
| OML | oil mining lease |
| OPEC | Organization of the Petroleum Exporting Countries |
| OPEC+ | 12 members of the OPEC and 11 other non-OPEC members |
| OPL | oil prospecting licence |
| PSC | production-sharing contract |
| PSP | Performance Share Plan |
| QRA | Quarterly Results Announcement |
| R&D | Research and development |
| REMCO | Remuneration Committee |
| RNG | Renewable natural gas |
| RT | real terms |
| SEAM | Safety, Environment and Asset Management |
| SEC | US Securities and Exchange Commission |
| SGBP | Shell General Business Principles |
| SIAI | Shell Internal Audit and Investigations |
| SP | social performance |
| SUSCO | Sustainability Committee |
| TCFD | Task Force on Climate-related Financial Disclosures |
| TSR | total shareholder return |
| WACC | weighted average cost of capital |
| WTI | West Texas Intermediate |
| Indicates information that supports TCFD disclosure |
This Form 20-F as filed with the US Securities and Exchange Commission for the year ended December 31, 2024 (this "Report") presents the Consolidated Financial Statements of Shell plc (the "Company") and its subsidiaries (collectively referred to as "Shell") (pages 223-296). Except for these Financial Statements, the numbers presented throughout this Report may not sum precisely to the totals provided and percentages may not precisely reflect the absolute figures due to rounding. Cross-references to Form 20-F are set out on pages 8-9 of this Report.
The Consolidated Financial Statements of Shell plc and its subsidiaries contained in this Report have been prepared in accordance with international accounting standards in conformity with the requirements of the UK Companies Act 2006 (the "Act"), and therefore in accordance with UK-adopted international accounting standards. As applied to Shell, there are no material differences from International Financial Reporting Standards (IFRS) as issued by the International Accounting Standards Board (IASB); therefore, the Consolidated Financial Statements have been prepared in accordance with IFRS as issued by the IASB. IFRS as defined above includes interpretations issued by the IFRS Interpretations Committee. Financial reporting terms used in this Report are in accordance with IFRS.
This Report contains certain forward-looking non-GAAP measures such as cash capital expenditure and divestments. We are unable to provide a reconciliation of these forward-looking non-GAAP measures to the most comparable GAAP financial measures because certain information needed to reconcile those non-GAAP measures to the most comparable GAAP financial measures is dependent on future events some of which are outside the control of Shell, such as oil and gas prices, interest rates and exchange rates. Moreover, estimating such GAAP measures with the required precision necessary to provide a meaningful reconciliation is extremely difficult and could not be accomplished without unreasonable effort. Non-GAAP measures in respect of future periods which cannot be reconciled to the most comparable GAAP financial measure are calculated in a manner which is consistent with the accounting policies applied in Shell plc's consolidated financial statements.
The companies in which Shell plc directly and indirectly owns investments are separate legal entities. In this report "Shell", "Shell Group" and "Group" are sometimes used for convenience to reference Shell plc and its subsidiaries in general. Likewise, the words "we", "us" and "our" are also used to refer to Shell plc and its subsidiaries in general or to those who work for them. These terms are also used where no useful purpose is served by identifying the particular entity or entities. "Subsidiaries", "Shell subsidiaries" and "Shell companies" as used in this report refer to entities over which Shell plc either directly or indirectly has control. The terms "joint venture", "joint operations", "joint arrangements", and "associates" may also be used to refer to a commercial arrangement in which Shell has a direct or indirect ownership interest with one or more parties. The term "Shell interest" is used for convenience to indicate the direct and/or indirect ownership interest held by Shell in an entity or unincorporated joint arrangement, after exclusion of all third-party interest.
As used in this Report, "Accountable" is intended to mean: required or expected to justify actions or decisions. The Accountable person does not necessarily implement the action or decision (implementation is usually carried out by the person who is Responsible) but must organise the implementation and verify that the action has been carried out as required. This includes obtaining requisite assurance from Shell companies that the framework is operating effectively. "Responsible" is intended to mean: required or expected to implement actions or decisions. Each Shell company and Shell-operated venture is responsible for its operational performance and compliance with the Shell General Business Principles, Code of Conduct, Statement on Risk Management and Risk Manual, and Standards and Manuals. This includes responsibility for the operationalisation and implementation of Shell Group strategies and policies.
Shell's "net carbon intensity" referred to in this Report includes Shell's carbon emissions from the production of our energy products, our suppliers' carbon emissions in supplying energy for that production, and our
customers' carbon emissions associated with their use of the energy products we sell. Shell's NCI also includes the emissions associated with the production and use of energy products produced by others which Shell purchases for resale. Shell only controls its own emissions. The use of the terms Shell's "net carbon intensity" or NCI is for convenience only and not intended to suggest these emissions are those of Shell plc or its subsidiaries.
Shell's operating plan and outlook are forecasted for a three year period and 10-year period, respectively, and are updated every year. They reflect the current economic environment and what we can reasonably expect to see over the next three and ten years. Accordingly, the outlook reflects our Scope 1, Scope 2 and NCI targets over the next 10 years. However, Shell's operating plan and outlook cannot reflect our 2050 net-zero emissions target, as this target is outside our planning period. Such future operating plans and outlooks could include changes to our portfolio, efficiency improvements and the use of carbon capture and storage and carbon credits. In the future, as society moves towards net-zero emissions, we expect Shell's operating plans and outlooks to reflect this movement. However, if society is not net zero in 2050, as of today, there would be significant risk that Shell may not meet this target.
Except where indicated, the figures shown in the tables in this Report are in respect of subsidiaries only, without deduction of any non-controlling interest. However, the term "Shell share" is used for convenience to refer to the volumes of hydrocarbons that are produced, processed or sold through subsidiaries, joint ventures and associates. All of a subsidiary's production, processing or sales volumes (including the share of joint operations) are included in the Shell share, even if Shell owns less than 100% of the subsidiary. In the case of joint ventures and associates, however, Shell-share figures are limited only to Shell's entitlement. In all cases, royalty payments in kind are deducted from the Shell share.
Except where indicated, the figures shown in this Report are stated in US dollars. As used herein all references to "dollars" or "$" are to the US currency.
This Report contains forward-looking statements (within the meaning of the US Private Securities Litigation Reform Act of 1995) concerning the financial condition, results of operations and businesses of Shell. All statements other than statements of historical fact are, or may be deemed to be, forward-looking statements. Forward-looking statements are statements of future expectations that are based on management's current expectations and assumptions and involve known and unknown risks and uncertainties that could cause actual results, performance or events to differ materially from those expressed or implied in these statements. Forward-looking statements include, among other things, statements concerning the potential exposure of Shell to market risks and statements expressing management's expectations, beliefs, estimates, forecasts, projections and assumptions. These forward-looking statements are identified by their use of terms and phrases such as "aim", "ambition", "anticipate", "aspire", "aspiration", "believe", "commit", "commitment", "could", "desire", "estimate", "expect", "goals", "intend", "may", "milestones", "objectives", "outlook", "plan", "probably", "project", "risks", "schedule", "seek", "should", "target", "vision", "will", "would" and similar terms and phrases. There are a number of factors that could affect the future operations of Shell and could cause those results to differ materially from those expressed in the forward-looking statements included in this Report, including (without limitation): (a) price fluctuations in crude oil and natural gas; (b) changes in demand for Shell's products; (c) currency fluctuations; (d) drilling and production results; (e) reserves estimates; (f) loss of market share and industry competition; (g) environmental and physical risks, including climate change; (h) risks associated with the identification of suitable potential acquisition properties and targets, and successful negotiation and completion of such transactions; (i) the risk of doing business in developing countries and countries subject to international sanctions; (j) legislative, judicial, fiscal and regulatory developments including tariffs and regulatory measures addressing climate change; (k) economic and financial market conditions in various countries and regions; (l) political risks, including the risks of expropriation and renegotiation of
About this Report continued
the terms of contracts with governmental entities, delays or advancements in the approval of projects and delays in the reimbursement for shared costs; (m) risks associated with the impact of pandemics, regional conflicts, such as the Russia-Ukraine war and the conflict in the Middle East, and a significant cyber security, data privacy or IT incident; (n) the pace of the energy transition; and (o) changes in trading conditions. Also see "Risk factors and risk management" on page 25-34 for additional risks and further discussion. No assurance is provided that future dividend payments will match or exceed previous dividend payments. All forward-looking statements contained in this Report are expressly qualified in their entirety by the cautionary statements contained or referred to in this section. Readers should not place undue reliance on forward-looking statements. Each forward-looking statement speaks only as of the date of this Report. Neither the Company nor any of its subsidiaries undertake any obligation to publicly update or revise any forward-looking statement as a result of new information, future events or other information. In light of these risks, results could differ materially from those stated, implied or inferred from the forward-looking statements contained in this Report.
Past performance cannot be relied on as a guide to future performance.
This Report contains references to Shell's website, the Shell Energy Transition Strategy 2024 Report, Tax Contribution Report, Shell Climate and Energy Transition Lobbying Report and our report on Payments to Governments. These references are for the readers' convenience only. Shell is not incorporating by reference into this Report any information posted on shell.com or in the Shell Energy Transition Strategy 2024 Report, Tax Contribution Report, Shell Climate and Energy Transition Lobbying Report or our report on Payments to Governments. The content of any other websites referred to in this Report does not form part of this Report.
With effect from January 29, 2022, Shell's A shares and B shares were assimilated into a single line of ordinary shares. Shell's A and B American Depositary Shares (ADSs) were assimilated into a single line of ADSs on the same date. This Report continues to refer to A shares, B shares, A ADSs and B ADSs when describing the position prior to January 29, 2022.
Shell V-Power and Shell LiveWire are Shell trademarks.
Documents on display
The SEC maintains an Internet site that contains reports, proxy and information statements, and other information regarding issuers that file electronically with the SEC. All of the SEC filings made electronically by Shell are available to the public on the SEC website at sec.gov (commission file number 001-32575).
This Report is also available, free of charge, at shell.com/investors/financial-reporting/sec-filings or at the offices of Shell in London, United Kingdom and The Hague, the Netherlands. Copies of this Report also may be obtained, free of charge, by mail.
Strategic Report
Chair's message
In 2024, we continued to do what Shell does best, connecting energy and people.
In total, we served around 33 million customers at Shell-branded retail sites every day, and around 1 million business customers across more than 70 countries. We used the power of our people, brand, technology and trading network to provide our customers with the oil and gas they need today. At the same time, we increasingly helped them to make
low-carbon choices, from biofuels to charging for electric vehicles.
In this second year under our Chief Executive Officer, Wael Sawan, Shell went from strength to strength. We improved Shell's operational performance, and made good progress against the financial and climate targets and ambition we set out at our Capital Markets Day in 2023 and in our Energy Transition Strategy 2024.
We demonstrated that our strategy to deliver more value with less emissions is producing strong results, and compelling shareholder returns. By the beginning of 2025, we had announced $3 billion or more in buybacks for 13 consecutive quarters.
New projects
Shell has pioneered ways to provide energy for more than a century. As the energy system and energy mix keep evolving, we will continue to provide the energy people need through the complex transition to low-carbon energy.
We will help to keep the world moving with oil and gas, while developing the low-carbon alternatives our customers need to decarbonise. To that end, we have built on our leadership positions in
[A]Based on a five-year average 2016–2020 for Brent Charlie emissions, and the highest expected emissions for Penguins.
liquefied natural gas (LNG) and deep-water oil and gas production with some important new projects. We announced a final investment decision for Manatee, an undeveloped gas field in Trinidad and Tobago, which will have a key role in providing gas to the country's Atlantic LNG facility.
Our deep-water Whale platform in the Gulf of America started production in January 2025. At its peak, we expect that Whale will produce around 100,000 barrels of oil equivalent a day, enough to fuel the daily journeys of 2.7 million cars in the USA. It will operate with 30% lower carbon intensity over its life cycle than Vito, another US deep-water platform. In February 2025, our next-generation Penguins facility started production in the North Sea. It will produce mostly oil but also enough gas to heat around 700,000 UK homes a year, with around 30% lower operational emissions than its predecessor, Brent Charlie [A].
Less emissions
We kept our focus on reducing emissions as we worked to become a net-zero emissions energy business by 2050. In 2024, we achieved our short-term target to reduce the net carbon intensity of the products we sell, compared with 2016. We achieved this mainly by reducing sales of oil products and growing power sales.
By the end of 2024, we had achieved 60% of our target to halve Scope 1 and 2 emissions from our operations by 2030, compared with 2016 levels.
We continued to transform our business. In January 2024, we announced the decision to stop processing crude oil into petrol, jet fuel and diesel at the Wesseling site of our Energy and Chemicals Park Rheinland, Germany, and to produce premium oils instead. In April 2024, we opened our bioLNG liquefaction plant in Germany, which can produce enough bioLNG to fuel around 5,000 LNG trucks a year.
Technology and innovation
Innovation remains vital for a successful transition to low-carbon energy. In 2024, we spent around $500 million on projects that contributed to decarbonisation, almost half of our total spending on research and development. In December, I saw some of that work for myself when I visited the Energy Transition Campus Amsterdam in the Netherlands. I was especially excited to see how our research is building on Shell's leadership in gas-to-liquids (GTL) technology, something we pioneered almost half a century ago.
Today, the Pearl GTL gas-to-liquids plant in Qatar uses natural gas to produce an alternative fuel to conventional diesel for transport, as well as oils and lubricants. We have also used GTL technology to develop immersion cooling fluids for data centres. These fluids reduce costs, energy consumption and emissions compared with conventional cooling. This will be increasingly important as the growth in artificial intelligence leads to greater use of energy-intensive data centres.
Now our scientists in Amsterdam are researching how to use that same GTL technology to produce sustainable aviation fuel made from renewable power and captured carbon on a commercial scale. In another exciting development for the energy transition, they are also
Strategic Report | Chair's message continued
looking at how to produce synthetic methane, made from renewable hydrogen and captured carbon, to decarbonise the production of LNG.
We are creating the business case for other pioneering solutions, such as carbon capture and storage, which will be critical for the energy transition. In 2024, we took a final investment decision for two projects in Canada that will capture and store carbon from our Shell Energy and Chemicals Park Scotford in Alberta. These build on the success of our Quest CCS project in Canada which has captured more than 9 million tonnes of CO₂ since 2015.
The Northern Lights joint venture with Equinor and TotalEnergies in Norway is developing the world's first project to offer commercial carbon transport and storage as a service. The first CO2 shipments are expected in 2025.
Unique capabilities
Our strengths go way beyond production. Through our integrated portfolio, we can buy and blend energy products to meet our customers' needs. We can use our unique capabilities, including trading, to connect energy to our customers through the energy transition.
For example, we became one of the world's largest traders and suppliers of sustainable aviation fuel in 2024. We achieved this because of our long-term agreements with producers, the strength of our customer relationships, and strategic investments in logistics around key terminals and airports.
In 2024, we continued to build an organisation with an outstanding brand, as well as outstanding people, and trading, technology and innovation capabilities. Today, we sell nearly three times the energy products that we produce, meeting our customers' demand for oil and gas and low-carbon products through our integrated model.
Working together
We believe that the energy transition will be achieved by governments, companies like Shell, and customers all working together. Governments need to put in place effective policies to progress the energy transition, and energy producers need to help develop the solutions of the future. The transition also requires demand from customers who are willing to pay for low-carbon energy. We are playing our part. I am confident that Shell can continue to bring its deep experience to help advance the energy transition.
In 2024, we demonstrated that you can still be sure of Shell. As a customer, you can be sure that Shell will provide you with the right products and solutions today and through the energy transition. And as an investor you can be sure that this is the right management team with the right strategy, setting Shell up for success in the years to come.
Sir Andrew Mackenzie
Chair
1.The Whale deep-water platform started production in January 2025.
2.The Northern Lights joint venture in Norway is developing the world's first project to deliver commercial carbon transport and storage as a service.
3.The Penguins facility in the North Sea will produce enough gas to heat around 700,000 UK homes a year.
Strategic Report
Chief Executive
Officer's review
| | | | | | | | | | | | | | | | | | | | | | | |
| | | | | | | |
| 2024 at a glance | | |
| 1.5 | | | | 90.0 | | |
| Serious injury, illness and fatality frequency (SIF-F) in Shell-operated ventures | | | | Tier 1 and Tier 2 process safety incidents | | |
| | | | (2023: 63.0) | | |
| (2023: 2.6) | | | | | | |
| | | | | | | |
| $16.5 billion | | | | $23.7 billion | | |
| Income for the period | | | | Adjusted Earnings* | | |
| (2023: $19.6) | | | | (2023: $28.3) | | |
| | | | | | | |
| $54.7 billion | | | | $39.5 billion | | |
| Cash flow from operating activities (2023: $54.2) | | | | Free cash flow* | | |
| | | | (2023: $36.5) | | |
| | | | | | | |
| $19.6 billion | | | | $21.1 billion | | |
| Capital expenditure | | | | Cash capital expenditure | | |
| (2023: $23.0) | | | | (2023: $24.4) | | |
| | | | | | | |
| $13.9 billion |
| | | $8.7 billion |
| |
| Share buyback programme | | | | Dividends paid | | |
| (2023: $14.6) | | | | (2023: $8.4) | | |
| | | | | | | |
| 58 million tonnes |
| | | 71 gCO2e/MJ |
| |
| Scope 1 and 2 emissions CO2e | | | Net carbon intensity (NCI) | |
| (2023: 57) | | | | (2023: 72) | | |
| | | | | | | |
|  Key performance indicators (see pages 35-36). Key performance indicators (see pages 35-36).* Non-GAAP measure (see page 337). | | |
In 2024, the world experienced continued geopolitical volatility. The Russia-Ukraine war entered its third year and conflict escalated in the Middle East, bringing personal tragedy to many. It was a time of political change, with elections in more than 60 countries.
Energy security and affordability rose higher on political agendas, even as the share of renewable energy grew. This came into sharp focus during Europe's winter of 2024. Wind and solar power reached record levels in the region, while liquefied natural gas (LNG) played a critical role in keeping homes and businesses running when there was not enough wind or sunlight.
With global demand for energy increasing, coupled with the challenge of climate change, Shell continues to focus on its strategy to deliver more value with less emissions. We believe the world needs to maintain secure and affordable energy supplies while moving to
low-carbon energy.
In 2024, my second year as Chief Executive Officer, I am proud of the progress we have made in putting our strategy into action. I want to thank everyone at Shell for their contribution. We are growing shareholder returns, while working to reduce emissions from our operations and products. We are positioning Shell to win through the energy transition on our journey to become a net-zero emissions energy business by 2050.
Integrated energy company
Our strategy aims to grow our world-leading LNG business, which provides flexibility alongside renewable energy, and a lower-carbon alternative to coal. We expect that supplying LNG will be the biggest contribution we will make to the energy transition over the next decade, as we help to build the energy system of the future.
Building on our deep knowledge and strong partnerships, we are also responsibly producing the oil that will be needed for decades to come, with a focus on cost and carbon competitiveness. We intend to be the most customer-focused energy marketer and trader in the world, providing people with the energy they need to power their lives and businesses. We are developing commercial models for low-carbon solutions, such as biofuels. My vision is for Shell to become the world's leading integrated energy company, delivering impact at scale, connecting energy and people, matching supply to demand.
We have set out to transform Shell into a more focused and more competitive energy business, and I am pleased to say that in 2024, we moved forward at pace in that direction. Following our principles of performance, discipline and simplification, we have made good progress against the targets and ambition we presented at our Capital Markets Day in 2023 and in our Energy Transition Strategy 2024.
Strategic Report | Chief Executive Officer's review continued
More value
In 2024, we achieved our target to reduce structural costs* by $2-3 billion by the end of 2025, against 2022, one year ahead of time. We continued to make disciplined investments, and difficult choices, such as pausing construction of our biofuels plant in Rotterdam, the Netherlands, to assess the most commercial way forward.
We are building a strong track record of performance. Shell reported the second-highest cash flow from operations in our history in 2024, outperforming our target for free cash flow growth. By the end of the year, we had delivered at the top end of our target to distribute 30-40% of cash flow from operations to our shareholders*, mainly through buybacks.
Our Prelude floating LNG facility off the coast of Australia had record production in 2024, as did our QGC natural gas business in Queensland, Australia, boosting our operational performance. We added major new projects. We took a final investment decision on Bonga North, off the coast of Nigeria, which is expected to start up by the end of the decade and reach peak production of 110,000 barrels of oil equivalent a day. Our US deep-water platform Whale started production in January 2025, with estimated peak production of 100,000 barrels of oil equivalent a day.
Our agreement to acquire Pavilion Energy in Singapore further strengthened our LNG portfolio with more sales and flexibility.
I also signed an agreement in Abu Dhabi to invest in the Ruwais LNG project [A], which is designed to operate with lower carbon intensity than traditional LNG plants. LNG Canada is expected to start producing in the middle of 2025, the largest private-sector energy investment in Canada's history.
Another example of our transformation is the sale of Shell Pakistan, which is helping us to achieve our aim to divest around 500 retail sites every year until 2025.
Less emissions
In 2024, we worked hard towards our climate goals. We abated more than 1 million tonnes of CO2 from our operations through projects such as reduced flaring and the use of renewable electricity. This allowed us to keep our Scope 1 and 2 emissions roughly flat compared with 2023, despite increased oil and gas production and asset utilisation. By the end of 2024, we had achieved 60% of the reduction required to meet our 2030 Scope 1 and 2 target.
Shell remains a leader in reducing emissions of methane, a potent greenhouse gas that can be released during oil, gas and LNG production. By the end of 2024, we had reduced total methane emissions from assets under our operational control by 76% compared with 2016. Total routine flaring from our upstream oil and gas assets remained stable in 2024, and, as of January 1, 2025, we no longer routinely flare from these assets.
[A]Subject to completion.
* Non-GAAP measure (see page 337).
When it comes to our sales, we achieved our short-term target to reduce the net carbon intensity of the energy products we sell with a 9% reduction compared with 2016, moving us closer to our target of a 15-20% reduction by 2030 compared with 2016 levels.
By the end of 2024, we had installed more than 70,000 public charge points for electric vehicles, a year ahead of schedule. I am encouraged by the progress we are making in carbon capture and storage, with plans for two linked projects in Canada. In Norway, our Northern Lights joint venture is ready to offer commercial carbon transport and storage as a service. I saw for myself another exciting initiative, our first megawatt charger for electric trucks and ships in Amsterdam.
Beyond our operations, 2024 was an important year because the Court of Appeal of The Hague dismissed Milieudefensie's claim against Shell. I believe the decision was the right one for the energy transition and our company. On February 11, 2025, Milieudefensie announced that it was taking its case to the Netherlands' Supreme Court. I am confident in the strength of our position.
Shell people
The safety of everyone at Shell remains our top priority. I am deeply saddened by the deaths of four people working for Shell in 2024 and early 2025. These tragic incidents took place in India, Malaysia, the Netherlands and Nigeria. My heart goes out to the families and friends of these four people. We must continue to protect everyone working for Shell, and we will learn from these and other incidents.
Shell's success depends on our people. I experienced the dynamism and diversity of our teams when I visited our operations in Brazil, China, India, Kuwait, Oman, Poland, Qatar, and the USA. I was impressed by how they are embracing the principles of performance, discipline and simplification in their everyday work.
I also spent Safety Day with our team at the Shell Polymers Monaca chemical plant in the USA. Once again, I had the opportunity to witness first-hand how far we have advanced our safety culture and processes in recent years.
Investment case and partner of choice
I am convinced that we are the best positioned energy company to navigate the energy transition because of our people, our connections to customers, and our portfolio of world-class assets. We are building on these strengths by transforming Shell. We are becoming a more focused and competitive business, so that we are the investment case and partner of choice through the energy transition. We had another strong year in 2024, and we have more to do. I am confident that our strategy, executed with conviction and determination, is working. We are on the path to becoming the world's leading integrated energy company.
Wael Sawan
Chief Executive Officer
Strategic Report | Shell's strategy
This is Shell
Shell is a global group of energy and petrochemical companies, employing around 96,000 people [A] across more than 70 countries. We have activities ranging from oil and gas exploration and production to the marketing of fuels and lubricants, and research and development. We are increasingly offering our customers low-carbon energy solutions.
For more than a century, Shell has connected people and energy. We provide the energy people need to fuel their homes, hospitals, schools, vehicles, machinery and factories. Our purpose is to power progress together, by working with each other, our customers and our partners. Our vision [B] is to be the world's leading integrated energy company -- delivering impact at scale, connecting energy and people, matching supply to demand.
Shell's strategy is to deliver more value with less emissions as we work to become a net-zero emissions business by 2050. As we navigate the energy transition through the next decade, we will leverage our global footprint, the trust in our brand, and our innovation and technology capabilities to be the energy company that customers and countries choose to be their partner.
Our people and values
Whether they work on our platforms and pipelines, or in our offices and research labs, people are key to our success. They collectively determine our culture and we expect them to behave according to our values: honesty, integrity and respect for people.
We expect everyone at Shell to also comply with relevant laws and regulations to help us conduct business in an ethical and transparent manner. We firmly believe in the fundamental importance of trust, openness, teamwork and professionalism. The Board assesses and
monitors our culture and how it is embedded in our attitudes and behaviours, including in our activities and stakeholder relationships.
To realise our vision, we are transforming Shell to become a more focused and competitive business. Our extraordinary community of talent will approach the next decade of the energy transition with courage and determination. We expect Shell's people to care about each other, our work, and about doing business the right way with a focus on safety, people and sustainability.
The Shell General Business Principles set out our responsibilities to all our stakeholders. As part of these principles, we commit to contribute to sustainable development, and we have embedded this commitment into our strategy, our processes and decision-making. This requires balancing short- and long-term interests, integrating economic, environmental and social considerations into business decision-making. As we implement our strategy, we will also maintain our relentless focus on achieving our Goal Zero ambition: to do no harm to people and to have no leaks across operations. The Shell Code of Conduct explains how employees, contractors and anyone else acting on behalf of Shell must behave.
Strong relationships
We seek to build strong, trusted relationships with all our stakeholders, including our approximately 1 million commercial and industrial customers, and the around 33 million people we serve daily at our Shell-branded retail stations. Our stakeholders include: our employees, contractors and pensioners; the investor community; customers; our suppliers and strategic partners; regulators and governments; non-governmental organisations, civil society, academia and think tanks; and the communities where we work.
[A]At December 31, 2024, and including portfolio companies.
[B]A vision statement defines the desired future state of a company rather than a series of firm, binding commitments.
| | | | | | | | | | | | | | | | | | | | | | | | | | | | | | | | | | | | | | | | | | | | | | | |
| | | | | | | | | | | | | | | |
| Our core values | | | Our guiding principles | |
| Honesty | | Integrity | | Respect for people | | | Performance | | Discipline | | Simplification | |
| We encourage our employees and business partners to speak up and celebrate those who do the right thing. | | We empower our employees and business partners to make the right decisions. | | We embrace diversity, equality and inclusivity. | | | We maintain a relentless focus on improving operational and financial performance. | | We allocate shareholders' capital with discipline and make clear choices about where we can create value. | | We streamline the way we do things, removing complexity, and manage the portfolio to support disciplined capital allocation. | |
| | | | | | | | | | | | | | | |
| Our Goal Zero ambition | | We aim to do no harm to people and to have no leaks across our operations. We call this our Goal Zero ambition. Everyone working for Shell strives to achieve Goal Zero each day. |
|
| | | | | | | | | | | | | | | |
| | | | | | |
Strategic Report | Shell's strategy | This is Shell continued
| | | | | | | | | | | | | | |
| | | | |
| Our business directorates in 2024 | | Reporting segments | |
| Integrated Gas and Upstream | | Integrated Gas explores for and extracts natural gas which we then process to produce liquefied natural gas (LNG) or convert into gas-to-liquids (GTL) products. Our activities include the operation of the upstream and midstream infrastructure that is needed to deliver gas and gas products to the market. We earn revenues from the trading and optimisation, marketing and distribution of LNG, GTL and natural gas. See pages 48-54 for a review of our performance. | |
| | Upstream explores for and extracts crude oil, natural gas and natural gas liquids. Shell has activities in deep water and conventional oil and gas. The business also operates the infrastructure necessary to transport the oil and gas to the market or to process it in our integrated energy and chemicals parks. See pages 55-63 for a review of our performance. | |
| | | | |
| | | | |
| Downstream, Renewables and Energy Solutions | | Marketing supplies fuels and lubricants, for transport, manufacturing, mining, power generation, agriculture and construction. Shell is also a major blender and trader of biofuels. Shell Mobility operates our retail network, including electric vehicle charging and convenience retail. See pages 72-76 for a review of our performance. | |
| | Chemicals and Products includes manufacturing plants and refineries which we are repurposing into energy and chemicals parks. We turn crude oil and other feedstocks into products for households, industry and transport. The segment also includes the pipeline business, trading and optimisation of crude oil, oil products and petrochemicals, and oil sands activities. See pages 77-84 for a review of our performance. | |
| | Renewables and Energy Solutions generates, markets and trades power from wind, solar and pipeline gas. The business also includes hydrogen production and marketing, commercial carbon capture and storage (CCS) hubs, carbon credits and nature-based solutions to avoid or reduce carbon emissions. See pages 85-88 for a review of our performance. | |
| | | | |
What sets us apart
| | | | | |
| Deep-water expertise | We have almost five decades of deep-water expertise and continue to develop innovative designs for oil and gas assets, replicating successful projects to deliver more value with less emissions. Our deep-water business has a track record of sustained cash flow. |
| Integrated gas and LNG capability | We have a world-leading LNG business with a sizeable portfolio, a global network of customers, extensive shipping and storage assets, and access to regasification plants. Our diversified and global portfolio of plants and terminals enhances our resilience to market shocks and allows us to capitalise on price volatility. |
| Technology and innovation | Shell has a long history in technology and innovation. We have a global network of R&D centres and work closely with our customers, suppliers and partners. We also collaborate with some of the world's leading technology companies to deploy digital solutions at scale across our business. |
| Integrated business model – trading and optimisation | Shell produces energy and is also one of the world's largest and most experienced energy traders and suppliers. We can identify and meet a customer's needs quickly. Our value chains are enhanced by purchases from third parties, and we have a leading global position in energy markets. |
Strategic Report | Shell's strategy
Our strategy
Our strategy is to deliver more value with less emissions.
Our vision [A] is to be the world's leading integrated energy company and our strategy is to deliver more value with less emissions. We are positioning Shell to become the investment case and partner of choice through the energy transition.
More value
We are committed to enhancing value for our investors through disciplined investments, enhanced shareholder distributions and maintaining a strong balance sheet. Our focus remains on providing secure and reliable products, both now and throughout the energy transition, to meet the evolving needs of our customers. At Capital Markets Day 2023 (CMD23), we outlined our specific targets, and the progress we have made against these targets can be found on shell.com.
Less emissions
We are committed to becoming a net-zero emissions energy business by 2050. We have set climate targets and an ambition, outlined in our Energy Transition Strategy 2024 (ETS24), to help us reach net zero. ETS24 was approved by 78% of shareholders who voted at our Annual General Meeting (AGM) in May. Progress against our climate targets and ambition is presented on page 121.
Shell aims to lead in the energy transition where we have competitive strengths, see strong customer demand, and identify clear regulatory support from governments. We will continue to provide our customers with the energy and other products they need, and we will provide this affordably and reliably, while also increasingly offering them low-carbon energy solutions to help them decarbonise their activities.
Moving forward
In 2024, we delivered our strategy against the four themes of generating shareholder value, achieving net-zero emissions, respecting nature and powering lives. These themes are presented on pages 21-22.
Like all businesses, we will continue to adapt how we implement our strategy as the world evolves. This adaptability is crucial for navigating the dynamic energy landscape enabling long-term success.
Capital Markets Day on March 25, 2025, presents an update to our financial targets for investors. See pages 23-24.
[A]A vision statement defines the desired future state of a company rather than a series of firm, binding commitments.
Photo: Staff at Shell QGC's training centre in Chinchilla, Queensland, Australia.
We will deliver more value with less emissions by:
○Growing our integrated gas and LNG business
○Sustaining liquids production
○Focusing Downstream, Renewables and Energy Solutions.
Growing our integrated gas and LNG business
We are investing in our gas production and growing our LNG business to deliver the secure energy the world needs. LNG is a critical fuel for the energy transition because it is a lower-carbon alternative to coal in power generation and can be easily transported to where it is needed.
Sustaining liquids production
We aim to sustain liquids production of at least 1.4 million barrels a day through to 2030 with increasingly lower carbon intensity. We are focusing our exploration activities in locations where hydrocarbons have already been discovered.
Focusing Downstream, Renewables
and Energy Solutions:
We are expanding our premium marketing businesses while streamlining our portfolio with a focus on value over volume. We will build on the options we have invested in for low-carbon growth through the energy transition. Our global customer reach and our supply and trading capabilities position us well to deliver the low-carbon solutions people and businesses need.
Strategic Report | Shell's strategy | Our strategy continued
We are seeking to change the mix of energy products we sell to our customers as their needs for energy change. We believe we can make the greatest contribution to the energy transition by helping to enable our customers to switch to low-carbon energy products and services.
This is reflected in Shell's strategy to build a portfolio that seeks to:
○develop low- and zero-carbon alternatives to traditional fuel, including biofuels, and other low- and zero-carbon gases;
○provide more renewable power solutions to customers in select markets;
○work with customers across different sectors to help them decarbonise their use of energy, for example by substituting the use of coal with LNG; and
○address any remaining emissions from conventional fuels with solutions such as CCS and high-quality carbon credits.
As we implement our strategy, we will continue to focus on performance, discipline and simplification. This applies not only to our financial and operational outcomes, but also to safety and sustainability. Our Goal Zero ambition is fundamental to the success of our company.
| | | | | |
| |
| See "Safety" on page 137. |
| |
We believe that no business can succeed without an unwavering commitment to respecting the environment and the communities within which it works. At Shell, we seek to protect the environment, increase our reuse and recycling, make a positive contribution to biodiversity and use water and other resources efficiently. We also work to make a positive impact on people around the world, and power lives through our products and activities, and by supporting an inclusive society.
| | | | | |
| |
| See "Respecting nature" on page 124 and "Powering lives" on page 129. |
| |
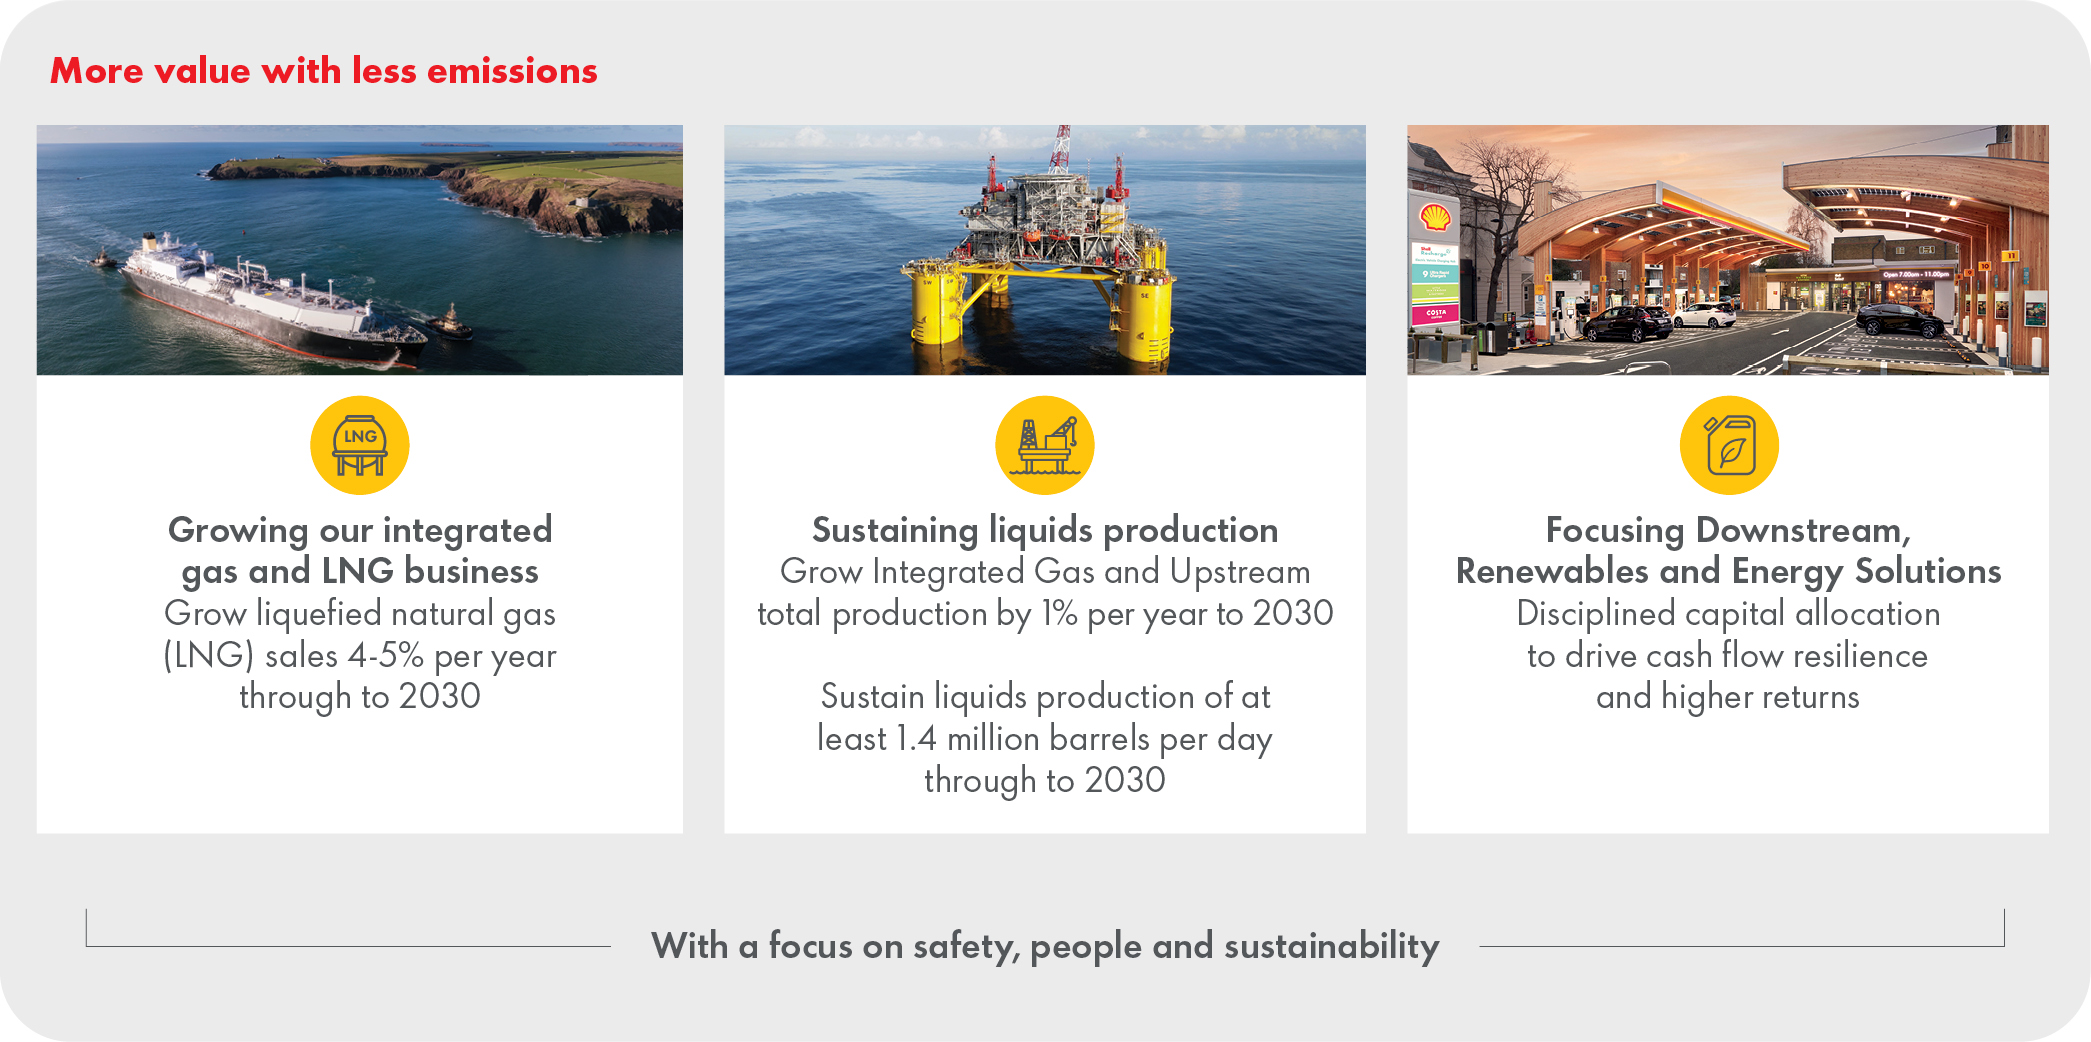
Strategic Report | Shell's strategy | Our strategy continued
| | | | | |
| |
| Generating shareholder value |
We aim to generate more value for shareholders through disciplined capital allocation, strong financial performance and by maintaining a strong balance sheet.
We seek to provide enhanced shareholder distributions through our progressive dividend policy and share buyback programmes.
2024 performance
○Total shareholder distributions* were $23 billion, comprising $9 billion in cash dividends and $14 billion in share buybacks.
○Total shareholder distributions* were 41% of cash flow from operating activities.
○Cash flow from operating activities was $55 billion.
○Cash capital expenditure was $21 billion.
○Total debt was reduced to $77 billion and net debt* was
$39 billion as of December 31, 2024. Net debt excluding leases* was $10 billion.
○Structural cost reductions* were $3.1 billion from a 2022 baseline and against a $2-3 billion target by the end of 2025.
○The annual dividend was $1.390 per share, and the quarterly dividend increased to $0.358 per share for the fourth quarter.
Progress on our longer-term business targets can be found on Shell.com
As we implement our strategy, we will work to:
○Enhance shareholder distributions from 30-40% to 40-50% of cash flow from operating activities* through the cycle.
○Increase the structural cost reduction* target from $2-3 billion by the end of 2025 to a cumulative $5-7 billion by end of 2028, compared to 2022.
○Invest for growth while maintaining capital discipline,with spend of cash capital expenditure lowered to $20-22 billion per year from 2025-2028.
○Grow normalised free cash flow per share* on average by more than 10% per year through to 2030.
* Non-GAAP measure (see page 337).
| | | | | |
| |
| Achieving net-zero emissions |
We have a target to become a net-zero emissions energy business by 2050 and will work with customers to help them decarbonise.
We are transforming our business, including selling more low-carbon products and services. We are working with our customers and others to help accelerate the energy transition. We advocate policies, legislation and regulation that will generate demand for investment
in a low-carbon energy system.
2024 performance
○Scope 1 and 2 emissions were down by 30% compared with the 2016 reference year [A].
○Methane emissions intensity of 0.04% continued to be below our 0.2% target.
○Net carbon intensity (NCI) decreased by 9.0% compared with the 2016 reference year and was within the 2024 target range.
○Routine flaring from upstream operations remained stable at 0.1 million tonnes and, with effect from January 1, 2025, Shell no longer carries out any routine flaring at its upstream operations.
○Customer emissions from the use of our oil products (Scope 3, Category 11) were reduced by 5% in 2024 to a total of 14% compared with 2021 [B].
As we implement our strategy, we will work to:
○Achieve net-zero emissions by 2050 (Scope 1, 2 and 3).
○Reduce by 50% Scope 1 and 2 absolute emissions from activities under operational control by 2030, compared with 2016 levels on a net basis.
○Achieve near-zero methane emissions intensity by 2030.
○Reduce net carbon intensity by 15-20% by 2030, compared with the 2016 reference year.
○Reduce customer emissions from the use of our oil products by 15-20% by 2030, Scope 3, Category 11 [B], compared with the 2021 reference year.
Progress against our longer-term emissions targets can be found in "Our journey to net zero" on page 121.
[A]Reduced from 83 million tonnes of CO2e in 2016 to 58 million tonnes of CO2e in 2024.
[B]Customer emissions from the use of our oil products (Scope 3, Category 11) were 517 million tonnes CO2e in 2023 and 569 million tonnes CO2e in 2021.
Strategic Report | Shell's strategy | Our strategy continued
We power lives through our products and activities, and by supporting an inclusive society.
We provide vital energy for homes, businesses and transport. We also aim to create a desirable workplace that is accepting and inclusive and representative of the communities we are a part of. Additionally, our activities generate revenues for governments through the taxes and royalties we pay, and the taxes we collect on their behalf.
2024 performance
○In 2024, we spent around $42 billion on goods and services* from suppliers around the world. Total spend on capital expenditure was $20 billion.
○In 2024, taxes paid* were $18 billion. Corporate income tax paid was $12 billion.
○In 2024, representation of women in Senior Leadership [A] grew to 33%.
○As of December 31, 2024, 15% of Shell's Senior Management [B] identifies as being from an ethnic minority group.
○Our 2024 Shell People Survey showed a result of 81 points out of 100 for all questions relating to diversity, equity and inclusion (DE&I).
As we implement our strategy, we will work to:
○Collaborate with suppliers that behave in an economically, environmentally and socially responsible manner.
○Be a good neighbour through strong community engagement, managing negative impacts from our activities and seeking to enhance positive impacts [C].
○Respect human rights as set out in the UN Universal Declaration of Human Rights.
○Continue to achieve 15% ethnic minority group representation in Senior Management [B] by 2027.
○Have at least one Board member from an ethnic minority background.
○Increase representation of women in senior leadership positions to 40% by 2030.
○Achieve gender balance on the Board, with at least one senior Board position held by a woman.
[A]Senior Leadership is a Shell measure based on compensation grade levels. This measure is distinct from "senior manager" as per statutory disclosure requirements. See "Our people" on page 132
[B]As per the latest Parker Review recommendations, Senior Management refers to Senior Leadership based in the UK and is a Shell measure based on compensation grade levels
[C]See Powering Lives for examples of how we seek to be a good neighbour.
* Non-GAAP measure (see page 337).
We seek to protect the environment, increase our reuse and recycling, make a positive contribution to biodiversity and use water and other resources efficiently.
Our businesses use natural resources such as land and water for their operations. Our activities can impact nature through discharges and emissions to the environment, and through changes to the use of land and water. We assess and manage the impact of our operations on local ecosystems and communities.
2024 performance
○We continued to embed respect for nature into our activities, standards and business processes, including by ensuring that these are reflected in our Safety, Environment and Asset Management (SEAM) Standards.
○In partnership with Monash University, we are executing an ecological restoration programme on Browse Island, Australia, to eradicate invasive alien species, improve reef health and promote the return of breeding seabirds.
○At the Pearl GTL gas-to-liquids facility in Qatar, we diverted waste to local cement kilns for use as clinker in cement production, thereby reducing use of raw materials and the amount of waste sent to landfill.
As we implement our strategy, we will work to:
○Achieve net-zero deforestation from new activities
by replanting forests, while maintaining biodiversity and conservation value.
○Achieve a net positive impact on biodiversity, based
on reference year 2021, for new projects in critical habitats.
○Better understand the types of waste we generate and identify options to increase circular approaches.
○Implement water stewardship principles across our businesses, including the sustainable management of fresh-water resources, particularly in water-stressed areas.
Strategic Report | Shell's strategy
Outlook
Capital Markets Day on March 25, 2025, presents an update to our financial targets for investors.
Our vision [A] is to be the world's leading integrated energy company.
Shell is transforming to become simpler, more resilient and competitive. We want to become the world's leading integrated gas and LNG business and the most customer-focused energy marketer and trader, while sustaining a material level of liquids production.
We are building on the significant progress we have made in executing our strategy to deliver more value with less emissions. As we do this, we will maintain our focus on performance, discipline and simplification. We aim to grow returns for shareholders, while reducing our emissions and helping our customers reduce theirs.
To successfully implement our strategy, we will take a value-led approach through a financial framework which enhances shareholder distributions, and maintains discipline in capital allocation and a balance sheet with a strong investment grade rating.
Financial discipline and strategic focus
We will maintain our focus on performance, cost and capital discipline, investing in areas of competitive strength to maximise returns.
Updates to our financial targets:
○Enhance shareholder distributions from 30--40% to 40--50% of cash flow from operations* through the cycle, continuing to prioritise share buybacks while maintaining the 4% a year progressive dividend policy [B].
○Increase the structural cost reduction* target from $2--3 billion by the end of 2025 to a cumulative $5--7 billion by the end of 2028, compared with 2022.
○Invest for growth while maintaining capital discipline with cash capital expenditure lowered to $20--22 billion a year for
2025--2028 compared with $21 billion in 2024.
○Grow normalised free cash flow per share* on average by more than 10% a year through to 2030.
[A]A vision statement defines the desired future state of a company rather than a series of firm, binding commitments.
Shell financial framework: Capital Markets Day 2025
| | | | | | | | | | | |
| | Balanced capital allocation |
|
| |
| | | | | | | | | | | | | | |
| | | | |
| Total distributions Enhanced shareholder distributions 40 - 50% of CFFO* through the cycle | | | Cash capital expenditure (cash capex) Disciplined investment $20 - 22 billion p.a. 2025-2028 |
| | | | |
| | | | | | | | | | | | | | | | | | | | |
| | |
Prioritising buybacks 13 consecutive quarters >$3 billion | | Dividend consistency +4% announced at Q4'24 | | Integrated Gas and Upstream cash capex ~ $12-14 billion | | Downstream, Renewables and Energy Solutions cash capex ~ $8 billion |
| | |
| | | | | | | | | | | | | | | | | | | | |
Intrinsic value creation >10% p.a. normalised free cash flow growth per share* through to 2030 | | Progressive dividend 4% annual increase [B] | | Capital reallocation ≥10% ROACE* across all segments [C] |
| | | | | | | | |
| Balance sheet Maintain strong investment grade rating | |
[B]Subject to Board approval as well as shareholder approval at the 2025 Annual General Meeting.
[C]Price normalised ROACE on an Adjusted Earnings plus non-controlling interest basis.
* Non-GAAP measure (see page 337).
Strategic Report | Shell's strategy | Outlook continued
The Board intends to enhance shareholder distributions through a combination of dividends and share buybacks, maintaining a 4% progressive dividend policy.
When the Board sets the level of shareholder distributions, it looks
at a range of factors including the macro environment, underlying business earnings and Group cash flows, the current balance sheet, future investment, acquisition and divestment plans, and existing commitments.
Growth and resilience through the energy transition
Shell believes the world is facing a complex, multi-decade energy transition in which there will be growing demand for secure, affordable and, increasingly, low-carbon energy.
In liquefied natural gas (LNG), we will reinforce our leadership position by growing sales 4--5% a year through to 2030.
We will also grow production across our combined Upstream and Integrated Gas business by 1% a year to 2030, sustaining our 1.4 million barrels a day of liquids production with increasingly lower carbon intensity.
And, we will drive cash flow resilience and higher returns in Downstream, Renewables and Energy Solutions by:
○Pursuing focused growth in our high-return Mobility and Lubricants businesses.
○Leveraging competitive strengths to drive profitable and scalable businesses across our lower-carbon platforms [A] where we expect to have up to 10% of capital employed by 2030.
○Unlocking more value from our strong portfolio of Chemicals assets. This will be done by exploring strategic and partnership opportunities in the USA and through high-grading and selective closures in Europe. We believe this will enable the business to prosper while improving returns and reducing capital employed by 2030.
[A]Shell's lower-carbon platforms include low-carbon fuels, carbon capture and storage, and hydrogen, as well as power which includes renewable generation and gas fired power.
Shell will continue to deliver more value with less emissions, growing in areas where we have competitive strengths. We believe we are providing a compelling investment case for our shareholders, now, and into the future.
Performance culture and commitment
We will continue to embed a performance culture, empowering our people with greater ownership and faster decision-making, helping to ensure safe and responsible operations.
Shell is committed to delivering on our promises, transforming to become more resilient and competitive, and driving growth and value creation through disciplined execution of our strategy. We are confident in our ability to navigate the energy transition and deliver enhanced returns for our shareholders.
Photo: Shell employees and contractors on the Vito deep-water platform in Ingleside, Texas, USA.
Risk factors and risk management
Risk factors
The risks discussed below could have a material adverse effect separately, or in combination, on our earnings, cash flows and financial condition. Accordingly, investors should carefully
consider these risks.
Further background on each risk is set out in the relevant sections of this Report, indicated by way of cross references.
We are exposed to risks that could adversely affect the resilience of our overall portfolio of businesses. These include external risks such as macroeconomic risks, including fluctuating commodity prices and competitive forces. Our future performance depends on the successful development and deployment of new technologies that provide new products and solutions. In addition, our future hydrocarbon production depends on the delivery of integrated projects and our ability to replace proved oil and gas reserves. Many of our major projects and operations are conducted in joint arrangements or with associates. This could reduce our degree of control and our ability to identify and manage risks.
Risk description
We are exposed to various external risks, such as macroeconomic and competitive risks, and internal risks associated with growing and maturing our business opportunities through our portfolio of businesses and joint arrangements, as follows:
Macroeconomic risks:
○The prices of crude oil, natural gas, oil products and chemicals can be volatile and are affected by supply and demand, both globally and regionally. Factors that influence supply and demand include operational issues; natural disasters; pandemics; political instability; conflicts, such as the Russia-Ukraine war and the conflict in the Middle East; economic conditions, including inflation; and actions by major oil and gas producing countries. These have in the past resulted in, and similar events could in the future result in, material price fluctuations. In addition, macroeconomic, geopolitical and technological uncertainties have affected, and could affect in the future, production costs and demand for our products. Government actions may affect the prices of crude oil, natural gas, oil products and chemicals. These include price caps on gas, tariffs, the promotion of electric vehicle sales or the phasing-out of future sales of new diesel or petrol vehicles. Oil and gas prices have moved independently of each other and could do so in the future.
Under high oil and gas prices, our entitlement to proved reserves under some production-sharing contracts has been, and could be in the future, reduced. Higher prices could also reduce demand for our products which could result in lower profitability in certain businesses in the Group, particularly in our Chemicals and Products, and Marketing businesses. Some of the reduction in demand could be permanent. Higher prices can also lead to more capacity being built, potentially resulting in an oversupplied market which would negatively affect our businesses. In the past, a high oil and gas price environment has generally led to sharp increases in costs and this could happen in the future.
○In a low oil and gas price environment, we have generated, and could in the future again generate, less revenue from our Upstream and Integrated Gas businesses, and parts of those businesses could become less profitable or incur losses. Low oil and gas prices have also resulted, and could result in the future, in the debooking of proved oil or gas reserves, if they become uneconomic in this type of price environment. Prolonged periods of low oil and gas prices, or rising costs, have resulted, and could result in the future, in projects being delayed or cancelled. Assets have been impaired in the past, and there could be impairments in the future. Low oil and gas prices have affected, and could affect in the future, our ability to maintain our long-term capital investment and shareholder distribution programmes.
○We use a range of commodity price and margin assumptions to evaluate the robustness of our capital allocation across our different projects and commercial opportunities. Due to volatility in macroeconomic conditions, our assumptions have proven to be incorrect in the past, yielding returns that are less than what we planned, and could prove incorrect in the future.
Strategic Report | Risk factors and risk management continued
Competitive risks:
○We face competition in all our businesses. We seek to differentiate our services and products, though many of our products are competing in commodity-type markets. Accordingly, a failure to manage our costs and our operational performance could result in a material adverse effect on our earnings, cash flows and financial condition. We also compete with state-owned hydrocarbon entities and state-backed utility entities with access to financial resources and local markets. Such entities could be motivated by political or other factors in making their business decisions and may not require competitive returns. Accordingly, when bidding on new leases or projects, we could find ourselves at a competitive disadvantage or unable to obtain competitive returns.
Technology risks:
○Technology and innovation are essential to our efforts to help meet the world's energy demands competitively. If we fail to effectively develop and/or deploy new technology, products and solutions, there could be a material adverse effect on the delivery of our strategy. We operate in environments where advanced technologies are used. In developing new technologies, products and solutions, unknown or unforeseeable technological failures or environmental and health effects could harm our reputation and licence to operate or expose us to litigation or sanctions. The associated costs of new technology are sometimes underestimated. We have faced delays in developing new technology in the past, and such delays could happen again in the future. If we are unable to develop our technology and products in a timely and cost-effective manner, we may fail to realise commercially viable products.
Delivery of capital projects and our ability to replace proved oil and gas reserves:
○We face numerous challenges in developing capital projects, especially those which are integrated. Challenges include: uncertain geology; frontier conditions; drilling at significant depths, the existence and availability of necessary technology and engineering resources; supply chain constraints; the availability of skilled labour; the existence of transport infrastructure; the expiration of licences; project delays, including delays in obtaining required permits; potential cost overruns; and technical, fiscal, regulatory, political and other conditions. We may fail to assess or manage these and other risks properly. Such potential obstacles have impaired, and could in the future impair, our delivery of these projects, our ability to realise the full potential value of the project as assessed when the investment was approved, and our ability to fulfil related contractual commitments. This has led, and could in the future lead, to impairments.
○Our future oil and gas production depends on our access to new proved reserves through exploration, negotiations with governments and other owners of proved reserves and acquisitions, and through developing and applying new technologies and recovery processes to existing fields. A failure to replace proved reserves would result in an accelerated decrease of future production.
| | | | | | | | | | | |
| Oil and gas production available for sale |
| Million boe [A] |
| 2024 | 2023 | 2022 |
| Shell subsidiaries | 956 | 937 | 938 |
| Shell share of joint ventures and associates | 82 | 82 | 108 |
Total | 1,038 | 1,019 | 1,046 |
[A]Natural gas volumes are converted into oil equivalent using a factor of 5,800 scf per barrel.
| | | | | | | | | | | |
Proved developed and undeveloped oil and gas reserves [A][B] |
| Million boe [C] |
| Dec 31, 2024 | Dec 31, 2023 | Dec 31, 2022 |
| Shell subsidiaries | 8,156 | 8,283 | 8,317 |
| Shell share of joint ventures and associates | 1,464 | 1,504 | 1,261 |
Total [D] [E] [F] | 9,620 | 9,787 | 9,578 |
| Attributable to non-controlling interest of Shell subsidiaries | 370 | 378 | 365 |
[A]We manage our total proved reserves base without distinguishing between proved reserves from subsidiaries and those from joint ventures and associates.
[B]Includes proved reserves associated with future production that will be consumed in operations.
[C]Natural gas volumes are converted into oil equivalent using a factor of 5,800 scf per barrel.
[D]On March 13, 2025, Shell completed the sale of its Nigerian onshore subsidiary The Shell Petroleum Development Company of Nigeria Limited (SPDC) which holds a 30% interest in the SPDC JV to Renaissance. As of December 31, 2024, Shell had proved reserves of 453 million boe in SPDC.
[E]Pursuant to Shell's 2017 agreement with Canadian Natural Resources Limited, its remaining mining interest and associated synthetic crude oil reserves will be swapped for an additional 10% interest in the Scotford Upgrader and Quest CCS project. The transaction is expected to close by the end of the first half of 2025, subject to regulatory approvals. The associated proved reserves as of December 31, 2024 were 741 million barrels (of which 50% attributable to non-controlling interest).
[F]On December 5, 2024, Shell and Equinor ASA, announced the combination of their UK offshore oil and gas assets and expertise to form a new company which will be the UK North Sea's biggest independent producer. On deal completion, the new independent producer will be jointly owned by Equinor (50%) and Shell (50%) and 157 million boe (as of December 31, 2024) of Shell's proved reserves will be contributed to the new joint venture alongside proved reserves contributed by Equinor. Subsequently, Shell will report 50% of the proved reserves of the new joint venture as part of Shell's share of proved reserves from joint ventures and associates.
○The estimation of proved oil and gas reserves involves subjective judgements and determinations based on available geological, technical, contractual and economic information. Estimates can change over time because of new information from production or drilling activities, changes in economic factors, such as oil and gas prices, alterations in the regulatory policies of host governments, or other events. Estimates also change to reflect acquisitions, divestments, new discoveries, extensions of existing fields and mines, and improved recovery techniques. Published proved oil and gas reserves estimates could also be subject to correction because of errors in the application of rules and changes in regulatory guidance. Downward adjustments could indicate lower future production volumes and could also lead to impairment of assets.
Strategic Report | Risk factors and risk management continued
Joint arrangements:
○When we are not the operator, we have less influence and control over the behaviour, performance and operating costs of joint arrangements or associates. Despite having less control, we could still be exposed to the risks associated with these operations, including environmental, reputational, legal (where joint and several liability could apply) and government sanction risks. For example, our partners or members of a joint arrangement or an associate (particularly local partners in developing countries) may be unable to meet their financial or other obligations to projects, threatening the viability of a given project. Where we are the operator of a joint arrangement, the other partner(s) could still be able to veto or block certain decisions, which could be detrimental to the joint arrangement.
If any of the risks above materialise, it could have a material adverse effect on our earnings, cash flows and financial condition.
| | | | | |
| |
| See "Market overview" on pages 45-47, "Other central activities" on pages 91-92, "Oil and gas information" on pages 64-71 and "Supplementary information - oil and gas (unaudited)" on pages 297-316. |
| |
2.Climate change and the energy transition
Risk type:  Strategic risk Operational risk Conduct and culture risk
 Rising concerns about climate change and the effects of the energy transition pose multiple risks to Shell, including declines in the demand for and prices of our products, commercial risks from growing our low-carbon business, and adverse litigation and regulatory developments. The physical impacts of climate change could also adversely affect our assets and supply chains.
Risk description
Societal demand for urgent action on climate change has increased, especially since the Intergovernmental Panel on Climate Change (IPCC) Special Report on Global Warming of 1.5°C in 2018 effectively made the more ambitious goal of the Paris Agreement to limit the rise in global average temperature this century to 1.5°C the default target for the parties to the agreement. Society's increasing focus on climate change and drive for an energy transition is contributing to a rapidly changing risk environment and a wide range of stakeholder actions against our organisation. The risks and impacts include the following:
Commercial risks:
○Changing customer sentiment favouring the use of renewable and sustainable energy products may reduce demand for our oil and gas products. An excess of fossil fuel supply over demand could in the future result in reduced fossil fuel prices. This could result in lower earnings, cancelled projects and the potential impairment of certain assets.
○If we fail to stay in step with the pace and extent of change or customers' and other stakeholders' demand for low-carbon products, this could adversely affect our reputation and future earnings. If we move much faster than society, we risk investing in technologies, markets or low-carbon products for which there may be insufficient demand. Therefore, we cannot transition too quickly, or we may offer products that customers do not want. If we are slower than society, customers may prefer a different supplier, which would reduce demand for our products adversely affecting our reputation and materially affect our financial results.
○Low-carbon technology and innovation are essential to our efforts to help meet the world's energy demands competitively. If we are unable to develop the right technologies and products in a timely and cost-effective manner, there could be an adverse effect on our future earnings. The operating margins for our low-carbon products and services have been, and could be in the future, lower than the margins we have experienced historically in our oil and gas operations.
○Certain investors have decided to divest their interest in fossil fuel companies and, if this were in to increase significantly, this could have a material adverse effect on the price of our securities and our ability to access capital markets. Some financial institutions have been aligning their portfolios to low-carbon and net-zero opportunities, driven by both regulatory and broader stakeholder pressures. A failure to decarbonise our business portfolios in line with investor and lender expectations could have a material adverse effect on our ability to access financing for certain types of projects. This could also adversely affect our partners' ability to finance their portion of costs, either through equity or debt.
Regulatory risks:
○The transition to a low-carbon economy has increased, and is likely to continue to increase the cost of compliance for our assets and/or products. Shell's annual carbon cost exposure is expected to increase over the next decade because of evolving carbon regulations. Governments may set regulatory frameworks in the future that could further restrict our exploration and production of hydrocarbons and introduce controls to limit the use of such products, which could also affect the timing and standards associated with the decommissioning of our exploration assets.
○The lack of net-zero-aligned global and national policies and frameworks increases the uncertainty around how carbon pricing and other regulatory mechanisms will be implemented in the future. This makes it harder to determine the appropriate assumptions to be taken into account in our financial planning and investment decision processes which could impair our ability to evaluate the robustness of our plans and opportunities. Changing net-zero policies and regulations could also lead to impairments of our existing oil and gas assets.
Strategic Report | Risk factors and risk management continued
Societal risks, including litigation:
○In some countries, governments, regulators, non-governmental organisations (NGOs) and individuals have filed lawsuits seeking to hold fossil fuel companies liable for costs associated with climate change. If successful, these claims may have wide-ranging consequences, including forcing entities to hand over strategic autonomy in part to regulators, or to divest from hydrocarbon assets and technologies. We have also been subjected to climate activism that has caused disruptions to our operations and such disruptions could happen again in the future. Climate change lawsuits that have been filed against us could have a material adverse effect on our reputation. In the Netherlands, in a case against Shell brought by a group of environmental NGOs and individual claimants (referred to herein as "Milieudefensie"), the Hague District Court in 2021 found that while Shell was not acting unlawfully, Shell had the obligation to reduce the aggregate annual volume of CO2 emissions of Shell operations and energy-carrying products sold across Scope 1, 2 and 3 by 45% (net) by the end of 2030 relative to its 2019 emissions levels. For Scope 2 and 3, this was a significant best-efforts obligation. Shell appealed that ruling. On November 12, 2024, the Hague Court of Appeal upheld Shell's appeal and dismissed the claim against Shell. In doing so, the Court of Appeal annulled the earlier judgment of the District Court in its entirety with immediate effect. On February 11, 2025, Milieudefensie filed an appeal to the Supreme Court of the Netherlands.
○Societal expectations of businesses are increasing, with a focus on business ethics, quality of products, contribution to society, safety and minimising damage to the environment. There is a focus on the role of the oil and gas sector in the context of climate change and the energy transition. This has negatively affected, and in the future could negatively affect, our brand and reputation, which could limit our ability to deliver our strategy, reduce consumer demand for our products, harm our ability to secure new resources and contracts, and restrict our ability to access capital markets or attract employees.
Physical risks:
○The physical effects of climate change, such as, but not limited to, increases in temperature, sea levels and fluctuations in water availability, could also adversely affect our assets, operations, supply chains, employees and markets.
In summary, rising climate change concerns, the pace at which we decarbonise our operations relative to society and effects of the energy transition pose multiple challenges to our business. These could result in, for example, increased costs, financial penalties, payments of financial damages in the event of losses of lawsuits, cancelled projects and potential impairment of certain assets, and adverse impacts on our supply chains and licence to operate. Individually or collectively, these risks could have a material adverse effect on our earnings, cash flows and financial condition.
| | | | | |
| |
| See "Our journey to net zero" on pages 93-123, "Energy Transition Strategy" on pages 94-109, "Renewables and energy solutions" on pages 85-88, Note 32 "Legal proceedings and other contingencies" on pages 292-294 and Note 4 "Climate change and energy transition" on pages 237-249. |
| |
We operate in more than 70 countries which have differing degrees of political, legal and fiscal stability. This has exposed, and could expose, us to a wide range of political developments that could result in changes to contractual terms, laws and regulations. We also face various risks from the business and operating environment in Nigeria which could have a material adverse effect on us.
Risk description
Developments in politics, laws and regulations can and do affect our supply chains and operations. Potential impacts, which we have experienced in the past, include: forced divestment of assets; expropriation of property; cancellation or forced renegotiation of contract rights; delay of new projects; additional tariffs and taxes, including windfall taxes (especially during periods of prolonged high oil and gas prices experienced in recent years, such as 2022); restrictions on deductions and retroactive tax claims; antitrust claims; changes to trade compliance regulations; price controls; local content requirements; foreign exchange controls; changes to environmental regulations; changes to regulatory interpretations and enforcement; and changes to disclosure requirements. Many parts of the world are facing economic and fiscal challenges and growing pressure on cost-of-living standards. These issues impact our business as governments, in response to political and social pressures, pursue policies that could have a material adverse effect on our earnings, cash flows and financial condition.
The world is also facing continued geopolitical instability, including the Russia-Ukraine war, which impacts market conditions and our operations. The broader consequences of the ongoing crisis in the Middle East remain uncertain, and a wider escalation could have greater impacts on our operations in the region and beyond.
We also face risks and adverse conditions in our Nigerian operations. These include security incidents affecting the safety of our people, host communities and operations; sabotage and crude theft; ongoing litigation; limited infrastructure; challenges presented by delayed government and partner funding and budget delays; and regional instability created by militant activities. Some of these risks and adverse conditions, such as security issues affecting the safety of our people, sabotage and theft, have occurred in the past and are likely to occur in the future.
Such developments and outcomes have had, and could have in the future, a material adverse effect on our earnings, cash flows and financial condition.
| | | | | |
| |
| See "Upstream" on pages 55-63. |
| |
Strategic Report | Risk factors and risk management continued
We are exposed to treasury risks, including liquidity risk, interest rate risk, foreign exchange risk and credit risk. We are affected by the global macroeconomic environment and the conditions of financial markets. These, and changes to certain demographic factors, also impact our pension assets and liabilities.
Risk description
We are subject to differing economic and financial market conditions around the world. Political or economic instability affects such markets.
We use debt instruments, such as bonds and commercial paper, to raise significant amounts of capital. Should access to debt markets become more challenging, the impact on our liquidity could have a material adverse effect on our operations. For example, some financial institutions have started to limit their exposure to fossil fuel projects. Group financing costs could also be adversely affected by interest rate fluctuations or any credit rating deterioration.
We are exposed to changes in currency values and to exchange controls as a result of our substantial international operations. Our reporting currency is the US dollar, although, to a significant extent, we also hold assets and are exposed to liabilities in other currencies. While we undertake some foreign exchange hedging, we do not do so for all our activities. Even where hedging is in place, it may not function as expected.
We are also exposed to financial losses from credit risk. Some of our counterparties have, from time to time, not met their payment and/or performance obligations under contractual arrangements and this could happen in the future.
We operate a number of defined benefit pension plans with significant associated liabilities. Volatility in capital markets or changes to government policies could affect inflation, interest rates and investment performance, causing significant changes to the funding level of future liabilities. Changes in assumptions for mortality, retirement age or pensionable remuneration at retirement could also cause significant changes to the funding level of future liabilities. In the case of a funding shortfall, we could be required to make substantial cash contributions (depending on the applicable local regulations).
If any of the above risks materialise, they could have a material adverse effect on our earnings, cash flows and financial condition.
| | | | | |
| |
| See "Liquidity and capital resources" on pages 41-44 and Note 24 "Retirement benefits" on page 274. |
| |
We are exposed to market, regulatory and conduct risks in our trading operations.
Risk description
Commodity trading is an important component of our business which involves processing, managing and monitoring many transactions across different countries, exposing us to operational risks, market risks including commodity price risk, regulatory and conduct risks. We use physical and financial instruments, including derivatives such as futures and options to hedge market risks. It is not possible to eliminate all market risks we are exposed to. Therefore, our hedging has occasionally not performed as expected and may not do so in the future. We utilise commodity trading to optimise commercial margins from market price movements. Consequently, this activity could expose us to the risk of incurring significant losses if prices develop unfavourably.
Our commodity trading entities are subject to many regulations, including requirements for standards of conduct. Due to the high volume of trades we execute, commodity trading gives rise to the risk of ineffective controls, failure in oversight of trading activities and a risk that traders could deliberately operate outside our internal operating limits. These risks have materialised in the past, and could materialise in the future, resulting in financial losses. The rapidly changing regulatory environment also creates a risk of insufficient, delayed or incorrect implementation of new regulatory requirements or changes to existing regulatory requirements. Violations of such regulatory requirements could expose us and our employees to regulatory fines.
If any of the above risks materialise, it could harm our reputation and licence to operate and have a material adverse effect on our earnings, cash flows and financial condition.
| | | | | |
| |
| See "Liquidity and capital resources" on pages 41-44 and "Living by our values" on page 140-148. |
| |
Strategic Report | Risk factors and risk management continued
6.Health, safety, security and the environment
Risk type:  Strategic risk Operational risk Conduct and culture risk
 The nature of our operations exposes us, and the communities in which we work, to a wide range of health, safety, security and environment risks.
Risk description
The health, safety, security and environment (HSSE) risks to which we and the communities in which we work are potentially exposed cover a wide spectrum, given the geographical range, operational diversity and technical complexity of our operations. These risks include the effects of safety lapses, natural disasters (including weather events and earthquakes) and pandemic diseases. If a major safety risk materialises, such as an explosion or hydrocarbon leak or spill, which we have experienced in the past, this could result in injuries, loss of life, environmental harm (including biodiversity loss), disruption of business activities, loss or suspension of permits, loss of our licence to operate and loss of our ability to bid on mineral rights.
Social instability, criminality, civil unrest, terrorism, cyber disruption and acts of war have also negatively impacted, and could negatively impact, our operations, our assets, our employees and contractors, and the communities in which we operate. Risks which have materialised in the past include: acts of terrorism; acts of criminality, including maritime criminality and piracy; crude oil theft, illegal oil refining, sabotage of pipelines and militant activities in Nigeria; cyber espionage or disruptive cybersecurity attacks; conflicts and civil unrest; malicious acts carried out by individuals within Shell, such as data exfiltration; and environmental and climate activism (including disruptions by NGOs especially in the USA and north-west Europe). For example, activists have boarded and protested on our vessels, assets and work sites, such as the Penguins floating production and storage and offloading (FPSO) vessel in 2023.
Financial losses and remediation costs from safety and environmental incidents are partially, but not fully, covered by our Group insurance companies (wholly owned subsidiaries) or third-party insurers. Accordingly, in the event of a significant incident, we may have to meet our obligations without access to proceeds from third-party insurers. We have in the past incurred adverse impacts and costs from events, such as Hurricane Ida in 2021.
Our operations are subject to extensive HSSE regulatory requirements that often change and are expected to become more stringent over time, particularly in the areas of environment. Governments could require operators to adjust their future production plans, affecting production and costs. We have incurred, and could incur, significant extra costs in the future because of the need to comply with such requirements. Due to past violations of laws and regulations, and other regulatory obligations, we have incurred significant costs such as fines, penalties, clean-up costs (including decommissioning and restoration costs) and costs associated with third-party claims. We also face the risk of increasing costs from changes in regulations and technical standards relating to decommissioning and restoration.
The above risks have threatened, and can threaten, the safe operation of our assets and the transport of our products. They have harmed, and can harm, the well-being of our people, inflict loss of life and injuries, and disrupt our operational activities. They can also damage the environment and negatively impact our reputation.
If a significant HSSE risk materialises, it could have a material adverse effect on our earnings, cash flows and financial condition.
| | | | | |
| |
| See "Safety" on pages 137-139, "Our approach to sustainability" on pages 142-148, "Corporate" on pages 89-90 and Note 32 "Legal proceedings and other contingencies" on pages 292-294. |
| |
7.Information technology and cybersecurity risks
Risk type: Strategic risk Operational risk Conduct and culture risk We rely heavily on information technology systems in our operations.
Risk description
Shell operates a globally integrated model with a strong focus on digitalising business processes and an increasing dependence on information technology (IT) systems for our core operations, including for the management of personal data. As a result, we are heavily reliant on secure, affordable and resilient IT services provided both in-house and by third parties. Rapid advancements in digital technologies, including artificial intelligence (AI) and quantum computing, are ongoing. If we do not effectively harness these technologies, our business operations may become less efficient, and our product offerings could lose their competitive edge, ultimately hindering our ability to execute our strategy.
Externally, we observe developments impacting our IT and cybersecurity risk profile: a worsening of the cybersecurity threat landscape represented by increasing volumes of sophisticated cybersecurity attacks, technology developments, geopolitical conflicts and increases in regulations across the markets in which Shell operates (such as the EU AI Act). As an organisation we have experienced, and expect to experience in the future, cybersecurity threats such as denial-of-service, ransomware, hacktivism and attacks from nation state actors that target critical energy infrastructure. We have also experienced and could in the future be exposed to non-malicious IT incidents. Across our supply chain, our suppliers, customers and business partners encounter similar cybersecurity threats and incidents. Cybersecurity incidents affecting us or our supply chain have impacted, and could impact, our operations, the security of our assets, the safety of our employees, and have a societal impact on the delivery and maintenance of critical energy infrastructure. Cybersecurity incidents frequently involve personal data breaches causing harm or potential harm to our customers, employees and stakeholders such as investors. In addition, such incidents have disrupted, and could disrupt, operations, cause reputational damage and possibly lead to significant regulatory fines. Cybersecurity incidents could therefore have a material adverse effect on our customers, staff and stakeholders thereby negatively affecting operations and our reputation. Accordingly, cyber security incidents could have a material adverse effect on our earnings, cash flows and financial condition.
| | | | | |
| |
| See "Other central activities" on pages 91-92. |
| |
Strategic Report | Risk factors and risk management continued
8.Litigation and regulatory compliance
Risk type: Strategic risk Operational risk Conduct and culture risk Violations of laws carry fines and could expose us and/or our employees to criminal sanctions and civil suits. We have faced, and could also face, the risk of litigation and disputes worldwide.
Risk description
We must comply with various laws. These include laws related to antitrust, competition, anti-bribery, tax evasion, anti-money laundering, trade compliance (including sanctions) and data privacy.
We have been fined in the past for violations of antitrust and competition laws, including fines by the EU Directorate-General for Competition (DG COMP). We have also, in the past, settled with the US Securities and Exchange Commission regarding violations of the US Foreign Corrupt Practices Act (FCPA). As a result, any future conviction of Shell or any of its operated joint arrangements or associates for violations of EU competition law or the FCPA could result in significantly larger fines and have a material adverse effect on us, including, but not limited to, damage to our reputation, resulting litigation, regulatory actions and criminal sanctions or penalties, and could potentially adversely affect our licence to operate. Violation of antitrust laws is a criminal offence in many countries, and individuals can be imprisoned or fined. In certain circumstances, directors may receive director disqualification orders.
We are also subject to "trade compliance", the umbrella term that we use for various national and international laws designed to regulate the movement of items across national boundaries and restrict or prohibit trade, financial flows and other dealings with certain parties, countries and territories. For example, the EU, the UK and the USA continue to impose comprehensive sanctions on countries and territories such as Syria, North Korea and Crimea and other territories in Eastern Ukraine. The USA continues to have comprehensive sanctions against Iran and Cuba. The EU, the UK and some other nations such as Canada and Australia continue to maintain targeted sanctions against Iran. Countries around the world continue to impose sanctions and trade controls against Russia over its full-scale invasion of Ukraine. Intergovernmental co-operation in this area has increased and there is growing pressure to enforce existing sanctions globally. Abiding by all the laws and regulations on trade compliance is often complex and challenging because of factors such as: the expansion of sanctions; the frequent addition of prohibited parties as other measures; the number of markets in which we operate; the risk of differences in how jurisdictions apply sanctions; and the large number of transactions we process. Shell has voluntarily self-disclosed potential violations of sanctions in the past. Any violation of sanctions could lead to loss of import or export privileges and significant penalties on, or prosecution of, Shell and/or its employees.
The protection and lawful use of personal data is of increasing importance to our licence to operate, given the significant increase in digital solutions provided to Shell's customers and business partners. We process personal data in all our operations. A failure to protect personal data or a failure to use it only for lawful and ethical purposes could result in significant harm to those individuals whose personal data we process. In addition, regulatory action by way of significant fines of up to 4% of Shell Group annual turnover and other enforcement actions such as orders to cease processing personal data may be imposed depending on the law in scope. There is a related risk of harm to our reputation potentially causing the loss of trust of existing and potential customers, stakeholders, regulators and employees. We have notified a number of data privacy regulators of personal data breaches and have had fines issued against us and this could happen in the future.
We also face the risk of litigation and disputes worldwide. For example, Shell (in its capacity as previous owner of SPDC) and various subsidiaries and associates operating in Nigeria are parties to various environmental, non-environmental and contractual disputes brought in the courts of Nigeria, the USA and England. Nederlandse Aardolie Maatschappij B.V. (NAM), a joint venture between Shell and ExxonMobil (50%:50%) has also settled claims for physical damage to property caused by earthquakes induced by historical production from the Groningen gas field, and remains financially responsible insofar as the costs corresponded to NAM's liability. From time to time, social and political factors play a role in unprecedented and unanticipated judicial outcomes that could adversely affect Shell. Non‑compliance with policies and regulations could result in regulatory investigations, litigation and, ultimately, sanctions. Certain governments and regulatory bodies have, in Shell's opinion, exceeded their constitutional authority by attempting unilaterally to amend or cancel existing agreements or arrangements; failing to honour existing contractual commitments; and seeking to adjudicate disputes between private litigants. Certain governments have also adopted laws and regulations that could potentially conflict with other countries' laws and regulations, potentially subjecting us to criminal and civil sanctions. It is also now common for persons or corporations allegedly injured by violations of laws to sue for damages.
Violations of laws carry fines, which we have been subject to, and could be subject to in the future, and which could expose us and/or our employees to criminal sanctions, civil suits and other consequences, such as debarment and the revocation of licences. Accordingly, violation of laws, including those noted above, litigation and disputes could harm our reputation and could have a material adverse effect on our earnings, cash flows and financial condition.
| | | | | |
| |
| See "Living by our values" on pages 140-148 and Note 32 "Legal proceedings and other contingencies" on pages 292-294. |
| |
Strategic Report | Risk factors and risk management continued
9.Reputation and risks to our licence to operate
Risk type: Strategic risk Operational risk Conduct and culture risk An erosion of our business reputation could have a material adverse effect on our brand, on our ability to secure new hydrocarbon or low-carbon opportunities, to access capital markets, and to attract and retain people, and on our licence to operate.
Risk description
Our reputation is an important asset. Real or perceived failures of governance or regulatory compliance or a perceived lack of understanding of how our operations affect surrounding communities and the environment could harm our reputation.
Societal expectations of companies are high, with a focus on business ethics, quality of products, contribution to society, safety and minimising negative impact on the environment and people, including human rights. There is ongoing focus on the role of oil and gas companies in the context of climate change and the energy transition. NGOs continue to challenge Shell's licence to operate through activities to block or delay projects and by bringing legal actions, diverting our resources and challenging trust. In key markets, we continue to see protests at external events such as our Annual General Meeting. We also continue to receive claims brought by NGOs. Our brand communications have been subject to challenge from advertising regulators in the UK and the Netherlands, following complaints received from members of the public. During prolonged periods of high oil and gas prices, the oil and gas industry has been accused in the past and could in the future be accused of profiteering from higher fuel and electricity prices and therefore impacting living costs. The materialisation of these risks has at times negatively affected, and could affect in the future, our brand, which could limit our ability to deliver our strategy; reduce consumer demand for our branded and non-branded products; harm our ability to secure new resources, partnerships and contracts; and restrict our ability to access capital markets or attract staff.
Individually or collectively, these risks could negatively affect our reputation and licence to operate and, accordingly, could have a material adverse effect on our earnings, cash flows and financial condition.
| | | | | |
| |
| See "Living by our values" on pages 140-148. |
| |
10.Our people and culture
Risk type: Strategic risk Operational risk Conduct and culture risk The successful delivery of our strategy is dependent on our people and on a culture that aligns to our goals and reflects the changes we need to make as part of the energy transition.
Risk description
Shell's culture is defined as the shared values, practices and beliefs of its employees. All these elements need to act in harmony to create our desired culture and ensure successful and sustained performance in line with our strategy. Our culture is influenced by decisions on organisational structure and accountabilities, people and skills, how work is done using processes and systems, and the mindset and behaviours that exist.
As the energy system transforms and we reshape our portfolio, elements of our culture will need to adapt. For example, we will have to develop new skills, and adapt our processes and systems, which, in some areas, will need to be different from those required for our traditional oil and gas businesses. We will have to continually leverage our learner mindset to anticipate and respond to changes in the external market. However, we will also need to retain our core values of honesty, integrity and respect for people to help ensure trust and openness in how we do business and help ensure our employees feel valued and perform at their best.
If we fail to maintain a culture that aligns with our strategy, this could harm our reputation and have a material adverse effect on our earnings, cash flows and financial condition.
| | | | | |
| |
| See "Powering lives (People)" on pages 130-136 and "Living by our values" on pages 140-148. |
| |
Investors should also consider the following, which could limit shareholder remedies.
11.Other (generally applicable to an investment in securities)
The Company's Articles of Association determine the jurisdiction for shareholder disputes. This could limit shareholder remedies.
Risk description
Our Articles of Association generally require that all disputes between our shareholders in such capacity and the Company or our subsidiaries (or our Directors or former Directors), or between the Company and our Directors or former Directors, be exclusively resolved by arbitration in London, the United Kingdom. Our Articles of Association also provide that, if this provision were to be determined invalid or unenforceable for any reason, the dispute could only be brought before the courts of England and Wales. Accordingly, the ability of shareholders to obtain monetary or other relief, including in respect of securities law claims, could be determined in accordance with these provisions.
Strategic Report | Risk factors and risk management continued
Risk management
The Board is responsible for establishing and maintaining procedures to manage risk, overseeing the internal control framework, and determining the nature and extent of the principal risks that Shell is willing to take to achieve its long-term strategic objectives.
Our approach to managing risk sits at the heart of the Shell Performance Framework and is embedded in the Improvement Cycle which integrates performance management, risk management, learning and improvement. This approach is designed to manage rather than eliminate the risk of failure to achieve our business objectives and covers the areas below.
| | | | | |
| |
| See Shell Performance Framework on page 159. |
| |
Risk identification 
We employ different methods to identify risks. These include monitoring external developments, such as policy changes and new regulations. We also assess changes in the internal operating context, such as monitoring incidents that have occurred across our activities to determine if these could give rise to new risks.
We seek to identify and define risks across the spectrum of strategic, operational, conduct and culture risks. With strategic risks, we consider the current and future portfolio, examining parameters such as country concentration or exposure to higher-risk countries. We consider long-range developments to test key assumptions or beliefs in relation to energy markets. When assessing operational risks, we consider exposures across our value chain. Through conduct and culture risks, we consider how our policies and practices align with our purpose, core values and desired mindset and behaviours.
These perspectives help us to maintain a comprehensive view of the different types of risks we face and the different time horizons during which they may affect us.
Risk assessment To further understand the risks we face, we evaluate the impact and likelihood of each risk occurring.
When assessing the potential impact of a risk, we consider its materiality in terms of the possible financial consequences. We also consider the impacts on people, the environment and the community where we operate, our reputation and our ability to comply with external regulations. For example, the technical complexity of our operations gives rise to safety risks, which could result in injuries, loss of life, environmental harm and financial losses.
When assessing the likelihood of a risk occurring, we consider several factors, such as the level of risk exposure, our ability to prevent the risk happening and whether the risk has occurred in the past.
To support risk assessments, we also seek to establish and articulate our risk appetite, which is the level of risk that we are willing to accept in pursuit of Shell's strategy and objectives. We consider the resources available – such as financial resources, people, processes, systems and controls – that we are willing and able to allocate to manage each risk in pursuit of our objectives and the impact on Shell's overall risk profile. The financial framework, which shapes Shell's financial resilience, sets an overarching boundary condition for risk appetite.
Strategic Report | Risk factors and risk management continued
The impact and likelihood assessments, combined with risk appetite, determine the type of risk responses, such as controls and assurance activities, that may be required to manage each risk. The impact and likelihood assessments also help us to prioritise risks by understanding their significance to our strategy and objectives, individually and relative to other risks.
Risk response Risk responses are developed based on the assessment of impact, likelihood and risk appetite.
Possible responses include:
○taking the risk while using appropriate processes and controls to maintain the risk within risk appetite. These processes and controls include, for example, the requirements and guidance in the Shell General Business Principles, Code of Conduct and our Group Standards, which establish the mandatory rules that are to be applied in all Shell companies and operations;
○transferring the risk, for example to insurance providers where appropriate; and
○avoiding the risk, by stopping or exiting the activity that gives rise to the risk or doing the activity differently.
We use assurance activities to objectively assess the effectiveness of our risk management activities and to improve them.
Examples of how some risk factors are managed include:
○Country risks (see "Risk factors" 3, on page 28):
–We continually monitor geopolitical developments and societal issues relevant to our interests. We are prepared to exit a country if we believe we can no longer operate there in accordance with our standards and applicable law, and we have done so in the past. With regard to the crisis in the Middle East, we have made adjustments to our operations in the region to reduce our exposure and we continue to monitor the risk of wider escalation.
–When we participate in joint ventures in Nigeria, we require that they operate in accordance with good industry practice. We seek to proportionally share risks and funding commitments with joint-venture partners. We monitor the security situation, and liaise with host communities, governmental and non-governmental organisations to help promote peaceful and safe operations. As a result of the March 13, 2025 completion of the sale of The Shell Petroleum Development Company, our exposure to these risks arising from onshore activities is expected to reduce. Shell has other businesses in Nigeria that are outside the scope of the announced divestment transaction.
○Joint arrangements (see "Risk factors" 1, on page 25):
–For every major project and operation where we share control, or where we do not have control or do not operate, Shell appoints a Shell Shareholder representative, whose responsibility is to manage performance, create and protect value for Shell. The representative seeks to influence operators and other partners to adapt their practices in order to drive value appropriately and to mitigate identified risks. We perform regular risk assessments of our joint ventures, including how our joint ventures' standards align with those of Shell and seek to influence to close any gaps identified.
○Litigation and regulatory compliance (see "Risk factors" 8, on page 31):
–Our Legal and Tax functions are organised globally and support our business lines in seeking to ensure compliance with local laws and fiscal regulations and proactively filing claims where warranted to protest unfair practices.
Emerging risks Management and the Board also consider emerging risks. These are defined as risks where the scope, impact and likelihood are still uncertain, but which may have a significant effect on achieving Shell's strategy and objectives in the future. These are identified through the monitoring of external developments, the status of risk indicators, learnings from incidents and assurance findings, and the appraisal of Shell's forward-looking plans. Once identified, we undertake activities to monitor, prepare for and plan appropriate responses, should such emerging risks occur.
In 2024, management and the Board considered the pace and evolution of technological developments in areas such as artificial intelligence and quantum computing as emerging risks, given their potential impacts, for example, on cyber security and data protection. The Board also considered the risks of the evolving landscape of geopolitical tensions for the Group.
Management and Board risk reviews Throughout the year, each business and function regularly reviews its risk profile, risk responses and assurance activities to ensure that significant risks are managed effectively.
The Board, Board committees and management also regularly review Shell's principal risks or risk factors, conducting deeper dives on individual risks, as appropriate. These reviews also support management in assessing the effectiveness of existing risk management activities, and whether changes may be needed.
| | | | | |
| |
| See "Governance framework"on pages 157-162 for other Board and Board committee responsibilities on risk management. |
| |
Performance
in the year
Performance indicators
These indicators enable management to evaluate Shell's performance against our annual Operating Plan. They are also used as part of determining Executive Directors' remuneration. See "Directors' Remuneration Report" on pages 180-182.
Progress to date on targets included at Capital Markets Day in June 2023 and Energy Transition strategy in March 2024 is available at shell.com
| | | | | |
Safety |
Personal safety (SIF-F cases per 100 million working hours) | |
Serious injury, illness and fatality (SIF) is defined as a serious work-related injury or illness that resulted in a fatality or permanent impairment. For SIF Frequency (SIF-F), the number of SIF employee and contractor incidents is divided by 100 million working hours.
2024 performance
Despite improvement, the result reflects two fatalities and five serious injuries reported in 2024, which is too many. We will continue to strengthen the safety culture among our employees and contract staff.
| | | | | |
Process safety (number of Tier 1 and Tier 2 events) | |
Operational process safety events are defined as the unplanned or uncontrolled release of any material from a process with the greatest actual consequence resulting in harm to employees, contract staff, a neighbouring community, or damage to equipment, or exceeding a threshold quantity.
2024 performance
The increase in process safety tiered events was driven by our Downstream and Renewables businesses. We are actively addressing these challenges by refining our operational strategies, renewing our focus on fundamentals and leveraging new technologies to return to the downward trend of previous years.
For details on our safety performance see "Safety" on pages 137-139.
[A]2022 adjustment on SIF-F from 1.7 to 2.0 is due to a change in classification for one injury after publication of the 2023 Annual Report and Accounts.
| | | | | |
| Financial delivery |
Cash flow from operating activities ($ billion) | |
Total cash receipts and payments associated with oil, gas, chemicals and other product sales. This reflects our ability to generate cash to service and reduce debt, invest and make shareholder distributions.
2024 performance
Driven mainly by a strong operational performance.
See "Liquidity and capital resources" on pages 41-44.
| | | | | |
| Shell's journey in the energy transition |
LNG volumes (million tonnes) | |
Shell's share of sales of equity LNG volumes from liquefaction plants owned by Shell subsidiaries, Shell joint ventures and associates, and Shell's share of LNG produced from liquefaction plants which operate under tolling arrangements with Shell.
2024 performance
LNG liquefaction volumes increased mainly due to lower maintenance in Australia.
See "Integrated Gas" on page 48.
| | | | | |
Reducing operational emissions (Scope 1 and 2; thousand tonnes CO2) | |
Operational emission reductions achieved from GHG abatement projects (e.g. reduced flaring, increased energy efficiency, and use of renewable electricity), site closures and decommissioning or transformations, resulting in sustained GHG reductions.
2024 performance
This was mainly due to catalyst improvements at Pearl GTL in Qatar, routine flaring reduction (Forcados Yokri Gas Project) in Nigeria and optimisation of the liquefaction control system at QGC in Australia.
See "Our journey to net zero" on pages 93-123.
| | | | | |
Electric vehicle (EV) charge points (thousand) | |
Number of public electric vehicle charge points owned, controlled, or Shell branded. The definition has been revised to exclude operated only charge points. Prior year figures have been restated
2024 performance
Performance was largely due to growth in top adoption markets, and we achieved our goal of installing 70,000 public charge points a year ahead of schedule.
See "Marketing" on pages 72-76.
Strategic Report | Performance in the year | Performance indicators continued
| | | | | |
Operational excellence |
Project delivery on schedule (%) | |
Our capability to complete major projects on time, measured as the percentage of projects delivered on schedule.
2024 performance
Highlights for this year include the successful start-up of 10 projects, half of which came on-stream ahead of schedule.
| | | | | |
Project delivery on budget (%) | |
Aggregate cost against the aggregate baseline for those projects, where a figure greater than 100% means over budget.
2024 performance
The result was impacted by the decision to pause on-site construction at our biofuels plant in Rotterdam.
| | | | | |
Customer satisfaction (index) | |
This quantitative measurement of customer experience performance is calculated as a simple average of customer satisfaction scores from the global business-to-business transactional survey programme.
2024 performance
The result reflects focus on prioritisation, continuous improvement of
e-commerce platforms, and the resilience of our teams.
The percentage of customers answering "Shell" when asked: "Assuming that all the fuel station companies that you would consider are conveniently located, which one company do you prefer most?" The responses are taken from survey respondents in more than 60 countries covering both fuel and non-fuel retail consumers.
2024 performance
Our Brand Share Preference continued to rise, performing ahead of expectations in all regions.
| | | | | |
|
Upstream controllable availability (%) | |
Reflects our ability to optimally run our Upstream assets and includes all Shell-operated assets and selected assets not operated by Shell but for which Shell has strategic influence. It excludes the impact of extreme unexpected events that are outside our control, such as government restrictions and hurricanes. Reliability issues, turnarounds and maintenance at own-operated or third-party facilities impact controllable availability.
2024 performance
Performance improved, particularly in Kazakhstan, Nigeria, Norway, Oman and the USA, partially offset by lower performance in the UK.
The extent to which LNG assets are ready to process product as a comparison with capacity, considering the impact of planned and unplanned maintenance.
2024 performance
Improved performance, especially in Australia, Qatar and Oman.
| | | | | |
Refinery and chemical plant availability (%) | |
Weighted average of plants' actual uptime, as a percentage of their maximum possible uptime, is a measure of the operational excellence of our refinery and chemical plant facilities. The weighting is based on the capital employed, adjusted for cash and non-current liabilities.
2024 performance
Improvements this year were mainly in Shell Polymers Monaca in the USA and Bukom Refinery in Singapore.
See "Chemicals and Products" on page 77.
Strategic Report | Performance in the year
| | | | | |
| |
| Generating shareholder value |
| We are committed to enhancing shareholder distributions with a focus on performance, discipline and simplification. |
| |
Strategic Report | Performance in the year | Generating shareholder value
Group results
| | | | | | | | | | | |
| $ million, except where indicated |
| 2024 | 2023 | 2022 |
Income attributable to Shell plc shareholders | 16,094 | 19,359 | 42,309 |
Income for the period | 16,521 | 19,636 | 42,874 |
Total segment earnings*[A] [B] | 16,792 | 20,281 | 41,562 |
| Adjusted Earnings*[A] [C] | 23,716 | 28,250 | 39,870 |
Adjusted EBITDA*[A] | 65,803 | 68,538 | 84,289 |
| Cash flow from operating activities | 54,687 | 54,191 | 68,414 |
| Cash flow from investing activities | (15,155) | (17,734) | (22,448) |
Free cash flow* | 39,533 | 36,457 | 45,965 |
Cash capital expenditure | 21,085 | 24,392 | 24,833 |
| Operating expenses*[D] | 36,917 | 39,960 | 39,476 |
| Underlying operating expenses*[D] | 35,707 | 39,201 | 39,456 |
| ROACE on an Adjusted Earnings plus Non-controlling interest basis* [E] | 11.3% | 12.8% | 18.0% |
| Total debt at December 31 [F] | 77,078 | 81,541 | 83,795 |
| Net debt* at December 31 [F] | 38,809 | 43,542 | 44,837 |
Gearing* at December 31 | 17.7% | 18.8% | 18.9% |
| Oil and gas production available for sale (thousand boe/d) | 2,836 | 2,791 | 2,864 |
| Proved oil and gas reserves at December 31 (million boe) | 9,620 | 9,787 | 9,578 |
| Basic earnings per share ($) | 2.55 | 2.88 | 5.76 |
Adjusted Earnings per share* ($) | 3.76 | 4.20 | 5.43 |
| Dividend per share ($) | 1.3900 | 1.2935 | 1.0375 |
[A]Segment earnings, Adjusted Earnings and Adjusted EBITDA are presented on a current cost of supplies basis.
[B]See Note 7 to the "Consolidated Financial Statements" which includes an explanation of the reporting segment changes applicable from 2024.
[C]Adjusted Earnings exclude the non-controlling interest component.
[D]The most comparable GAAP financial measure is Production and manufacturing expenses (2024: $23 billion; 2023: $25 billion).
[E]Effective first quarter 2024, the definition has been amended and comparative information has been revised. Refer to Non-GAAP measures section for details.
[F]See Note 21 to the "Consolidated Financial Statements".
* Non-GAAP measure (see page 337).
"2024 was another year of strong performance across Shell, with significant progress against all
our financial targets."
Sinead Gorman
Chief Financial Officer
| | |
Segment earnings [A] [B] $ million |
| | |
Segment Adjusted Earnings*[A] [B] $ million |
Strategic Report | Performance in the year | Generating shareholder value | Group results continued
We made significant progress towards the financial
targets that we set at Capital Markets Day 2023. Our focus
on performance, discipline and simplification has been key to achieving these results, enabling us to deliver more value with
less emissions. In 2024, we reported the second-highest cash flow from operations in our history. Our operational performance has also improved. We have brought a number of projects online and we have taken disciplined final investment decisions that will help strengthen Shell further.
Earnings 2024-2023
Income attributable to Shell plc shareholders in 2024 was $16,094 million, compared with $19,359 million in 2023. With non-controlling interest included, income for the period in 2024 was $16,521 million, compared with $19,636 million in 2023. After current cost of supplies adjustment, total segment earnings* in 2024 were $16,792 million, compared with $20,281 million in 2023.
Adjusted Earnings* in 2024 were $23,716 million, compared with $28,250 million in 2023. The decrease was mainly driven by lower LNG trading and optimisation margins, lower realised prices, lower refining margins as well as lower trading and optimisation margins of power and pipeline gas in Renewables and Energy Solutions, partly offset by lower operating expenses and higher realised Chemicals margins.
2024 income attributable to Shell plc shareholders also included net impairment charges and reversals of $4,371 million, reclassifications from equity to profit and loss of cumulative currency translation differences related to funding structures, unfavourable movements relating to an accounting mismatch due to fair value accounting of commodity derivatives, and charges related to redundancy and restructuring. These charges, reclassifications and movements are included in identified items amounting to a net loss of $7,365 million.
Integrated Gas
Integrated Gas segment earnings in 2024 were $9,590 million, compared with $7,057 million in 2023. The increase was mainly driven by lower unfavourable movements relating to an accounting mismatch due to fair value accounting of commodity derivatives, lower net impairment charges and reversals, higher volumes, lower operating expenses, and favourable deferred tax movements, partly offset by the combined effect of lower contributions from trading and optimisation and lower realised prices.
| | | | | |
| |
| See "Integrated Gas" on page 48. |
| |
Upstream
Upstream segment earnings in 2024 were $7,772 million, compared with $8,540 million in 2023. The decrease was mainly driven by unfavourable tax movements, lower realised prices and higher exploration well write-offs, partly offset by the comparative favourable impact relating to gas storage effects.
| | | | | |
| |
| See "Upstream" on page 55. |
| |
* Non-GAAP measure (see page 337).
Marketing
Marketing segment earnings in 2024 were $1,894 million, compared with $3,057 million in 2023. The decrease was mainly driven by higher net impairment charges and reversals, net losses related to sale of assets, unfavourable tax movements and higher depreciation charges. These were partly offset by higher Marketing margins including higher unit margins in Lubricants and Mobility, partly compensated by lower Sectors and Decarbonisation margins. Segment earnings also reflected lower operating expenses.
| | | | | |
| |
| See "Marketing" on page 72. |
| |
Chemicals and Products
Chemicals and Products segment earnings in 2024 were $1,757 million, compared with $1,482 million in 2023. The increase was mainly driven by lower net impairment charges and reversals, lower operating expenses and higher Chemicals margins. These were partly offset by lower Products margins, largely due to lower refining margins, unfavourable movements relating to an accounting mismatch due to fair value accounting of commodity derivatives and unfavourable tax movements.
| | | | | |
| |
| See "Chemicals and Products" on page 77. |
| |
Renewables and Energy Solutions
Renewables and Energy Solutions segment earnings in 2024 were an expense of $1,229 million, compared with a gain of $3,089 million in 2023. The decrease was mainly driven by lower favourable movements relating to an accounting mismatch due to fair value accounting of commodity derivatives, lower margins, largely from trading and optimisation primarily in Europe due to lower volatility and higher net impairment charges and reversals, partly offset by lower operating expenses.
| | | | | |
| |
| See "Renewables and Energy Solutions" on page 85. |
| |
Corporate
Corporate segment earnings in 2024 were an expense of $2,992 million, compared with an expense of $2,944 million in 2023. The increase was mainly driven by reclassifications from equity to profit and loss of cumulative currency translation differences related to funding structures, partly offset by favourable tax movements, favourable net interest movements and favourable currency exchange rate effects.
| | | | | |
| |
| See "Corporate" on page 89. |
| |
Strategic Report | Performance in the year | Generating shareholder value | Group results continued
Prior year earnings summary
Our earnings summary for the financial year ended December 31, 2023, compared with the financial year ended December 31, 2022, can be found in the Annual Report and Accounts (page 32) and Form 20-F (page 30) for the year ended December 31, 2023, as filed with the Registrar of Companies for England and Wales and the US Securities and Exchange Commission, respectively.
Cash flow from operating activities
Cash flow from operating activities was $54,687 million in 2024, compared with $54,191 million in 2023. Cash flow from operating activities in 2024 was primarily driven by Adjusted EBITDA, and working capital inflow of $2,062 million, partly offset by tax payments of $12,002 million.
Cash capital expenditure
Cash capital expenditure was $21,085 million in 2024, compared
with $24,392 million in 2023.
| | | | | |
| |
| See "Our journey to net zero" on page 104. |
| |
Operating expenses and Underlying operating expenses
Operating expenses* were $36,917 million in 2024, compared with $39,960 million in 2023. Underlying operating expenses* were $35,707 million, compared with $39,201 million in 2023. The decrease in both Operating expenses and Underlying operating expenses was mainly driven by structural cost reductions delivered through operational efficiencies across our businesses, a leaner corporate centre, faster decision-making in project development, and portfolio changes.
Return on average capital employed on an Adjusted Earnings plus Non-controlling interest (NCI) basis
Our ROACE on an Adjusted Earnings plus Non-controlling interest basis* decreased to 11.3%, compared with 12.8% in 2023, mainly driven by lower earnings.
Significant accounting estimates and judgements
See Note 2 to the "Consolidated Financial Statements"
on pages 227-237.
Legal proceedings
See Note 32 to the "Consolidated Financial Statements"
on pages 292-294.
* Non-GAAP measure (see page 337).
Production available for sale
Oil and gas production available for sale in 2024 was 2,836 thousand boe/d, compared with 2,791 thousand boe/d in 2023. This increase was mainly driven by growth from new fields and partly offset by divestments.
| | |
Oil and gas production available for sale [A][B] |
| | | | | | | | | | | |
| | Thousand boe/d |
| 2024 | 2023 | 2022 |
| Crude oil and natural gas liquids | 1,452 | 1,454 | 1,460 |
| Synthetic crude oil | 51 | 52 | 46 |
| Natural gas [C] | 1,333 | 1,285 | 1,357 |
| Total | 2,836 | 2,791 | 2,864 |
| Of which: | | | |
| Integrated Gas | 954 | 939 | 921 |
| Upstream | 1,831 | 1,800 | 1,897 |
Oil sands (part of Chemicals and Products) | 51 | 52 | 46 |
[A]See "Oil and gas information".
[B]Reflects 100% of production of subsidiaries except in respect of PSCs, where the figures shown represent the entitlement of the subsidiaries concerned under those contracts.
[C]Natural gas volumes are converted into oil equivalent using a factor of 5,800 scf
per barrel.
Proved reserves
The proved oil and gas reserves of Shell subsidiaries and the Shell share of the proved oil and gas reserves of joint ventures and associates are summarised in "Oil and gas information" on pages 64-71 and set out in more detail in "Supplementary information –
oil and gas (unaudited)" on pages 297-316.
Before taking production into account, our proved reserves increased by 917 million boe in 2024. Total oil and gas production was
1,084 million boe. Accordingly, after taking production into account, our proved reserves decreased by 167 million boe in 2024, to 9,620 million boe at December 31, 2024.
Strategic Report | Performance in the year | Generating shareholder value
Liquidity and capital resources
Liquidity and capital resources
Shell generated free cash flow*of $39.5 billion in 2024, aided by disciplined capital management, portfolio simplification and operational performance improvements. Net debt* decreased to $38.8 billion at December 31, 2024 (December 31, 2023: $43.5 billion). Total debt decreased to $77.1 billion at December 31, 2024 (December 31, 2023: $81.5 billion). Gearing* decreased to 17.7% at December 31, 2024, compared with 18.8% at December 31, 2023.
| | | | | |
| |
| See Note 21 to the "Consolidated Financial Statements" on pages 268-269. |
| |
Liquidity
Shell satisfies its funding, liquidity and working capital requirements by using cash generated from our operations, taking on debt and through divestments. In 2024, access to the international debt capital markets remained strong, with Shell's debt principally financed from these markets through central debt programmes consisting of:
○a $10 billion global commercial paper (CP) programme, with maturities between 183 days and 364 days;
○a $10 billion US CP programme, with maturities not exceeding 397 days;
○an unlimited Euro medium-term note (EMTN) programme (also referred to as the Multi-Currency Debt Securities Programme). This programme lapsed in November 2024, and will be renewed in the first half of 2025 or as required to issue debt; and
○an unlimited US universal shelf (US shelf) registration.
The debt issued under the CP, EMTN and US shelf has been issued by Shell International Finance B.V., the issuance company for Shell, with its debt being guaranteed by Shell plc. In 2023, Shell incorporated a new US subsidiary, Shell Finance US Inc., and in 2024 a portion of the debt issued by Shell International Finance B.V. was moved into this entity through an exchange offer. This debt remains guaranteed by Shell plc, as will any new debt issued by Shell Finance US Inc. under the US shelf.
We also maintain an $8 billion committed credit facility maturing in 2026. This remained fully undrawn at December 31, 2024. This facility was reduced from $10 billion in the third quarter of 2024 due to the strong liquidity position of the Group. This reduced core facility and cash on balance sheet provide back-up coverage for our CP programmes. Other than certain borrowings by subsidiaries in their local jurisdictions, we do not have any other committed credit facilities.
Our total debt decreased by $4.5 billion to $77.1 billion at December 31, 2024. The total debt excluding lease liabilities matures as follows: 14% in 2025; 8% in 2026; 5% in 2027 and 73% in 2028 and beyond. The portion of debt maturing in 2025 is expected to be repaid from some combination of cash balances, cash generated from operations, divestments and the issuance of new debt. In 2024, we did not issue any debt under our US shelf registration, EMTN programme or CP programmes. The Group had no CP outstanding at December 31, 2024.
While our subsidiaries are subject to restrictions, such as foreign withholding taxes on the transfer of funds in the form of cash dividends, loans or advances, such restrictions are not expected to have a material impact on our ability to meet our cash obligations.
* Non-GAAP measure (see page 337).
Market risk, credit risk and pension commitments
Financial risks
We use various financial instruments for managing exposure to foreign exchange and interest rate movements. Our treasury operations are highly centralised and seek to manage credit exposures associated with our substantial cash, foreign exchange and interest rate positions.
Our portfolio of cash investments is diversified to avoid concentrating risk in any one instrument, country or counterparty. Other than in exceptional cases, the use of external derivative instruments is confined to specialist trading and central treasury organisations that have the appropriate skills, experience, supervision, control and reporting systems.
We operate with procedures and policies designed to ensure that trading risks are managed within a prescribed control framework. The framework sets out authorised limits and requirements that trading should only be performed by employees with the appropriate skills and experience. Senior management regularly reviews these authorised trading limits. In addition, a department that is independent from our traders monitors our market risk exposures daily, using techniques such as value-at-risk alongside other risk metrics.
We have counterparty credit risk policies in place which seek to ensure that products are sold to customers with appropriate creditworthiness. These policies include detailed credit analysis and monitoring of customers against counterparty credit limits. Where appropriate, netting arrangements, credit insurance, prepayments and collateral are used to manage credit risk.
Management believes it has access to sufficient debt funding sources (capital markets) and to undrawn committed borrowing facilities to meet foreseeable requirements.
A pensions forum chaired by the CFO oversees Shell's input to pension strategy, policy and operation. A risk committee supports the forum in reviewing the results of assurance processes with respect to pension risk. Local trustees manage the funded defined benefit pension plans and set the strategic asset allocation for the plans, including the extent to which currency, interest rate and inflation risks are hedged, and the contributions paid are based on independent actuarial valuations that align with applicable local regulations. Pension fund liquidity is managed by holding appropriate liquid assets and maintaining credit facilities. Where appropriate, transactions to transfer pension liabilities to third parties are also considered. Our total employer contributions were $0.4 billion in 2024 and are estimated to be $0.9 billion in 2025.
| | | | | |
| |
| See "Risk factors" on page 29, Note 24 and Note 26 to the "Consolidated Financial Statements" on pages 274-280 and 282-288. |
| |
Strategic Report | Performance in the year | Generating shareholder value | Liquidity and capital resources continued
| | | | | | | | |
| $ million |
| December 31, 2024 | December 31, 2023 |
| Equity attributable to Shell plc shareholders | 178,307 | 186,607 |
| Current debt | 11,630 | 9,931 |
| Non-current debt | 65,448 | 71,610 |
| Total debt [A] | 77,078 | 81,541 |
| Total capitalisation | 255,385 | 268,148 |
[A]Of total debt of $77.1 billion (2023: $81.5 billion), $48.1 billion (2023: $53.4 billion) was unsecured and $29.0 billion (2023: $28.2 billion) was secured; $46.0 billion is fully and unconditionally guaranteed by Shell plc (December 31, 2023: $51.3 billion), with the following amounts issued by Shell Group subsidiaries: $31.8 billion by Shell International Finance B.V., a wholly owned finance subsidiary of Shell plc (December 31, 2023: $48.4 billion); $11.4 billion by Shell Finance US Inc., a wholly owned finance subsidiary of Shell plc (December 31, 2023: $nil billion); and $2.8 billion by BG Energy Capital plc (December 31, 2023: $2.9 billion).
| | | | | |
| |
| See Note 21 to the "Consolidated Financial Statements" for further disclosure on total debt and net debt. |
| |
Guarantees and other off-balance sheet arrangements
There were no guarantees or other off-balance sheet arrangements at December 31, 2024, or December 31, 2023, that were reasonably likely to have a material impact on Shell.
| | | | | |
| |
| See Note 32 to the "Consolidated Financial Statements" on page 292 for further details on guarantees where the potential obligations related to issuance are assessed to be remote. |
| |
Consolidated Statement of Cash Flows
Cash flow from operating activities in 2024 was $54.7 billion, compared with $54.2 billion in 2023. The cash flow from operating activities in 2024 was primarily driven by Adjusted EBITDA and working capital inflow of $2.1 billion (compared with working capital inflow of $7.1 billion in 2023), partly offset by tax payments of $12.0 billion (compared with tax payments of $13.7 billion in 2023). The cash flow from operating activities in 2024 also included favourable commodity-related derivative financial instrument movement of $2.5 billion (compared with unfavourable
movement of $5.7 billion in 2023).
Cash flow from investing activities in 2024 was an outflow of $15.2 billion, compared with an outflow of $17.7 billion in 2023. The cash flow from investing activities in 2024 included cash capital expenditure of $21.1 billion (compared with cash capital expenditure of $24.4 billion in 2023), partly offset by divestment proceeds* of $2.8 billion (compared with divestment proceeds* of $3.1 billion in 2023) and interest received of $2.4 billion (compared with interest received of $2.1 billion in 2023).
Cash flow from financing activities in 2024 was an outflow of $38.4 billion, compared with outflows of $38.2 billion in 2023, mainly due to lower repurchases of shares of $13.9 billion (2023: $14.6 billion) and unfavourable debt-related derivative financial instrument movements of $0.6 billion (2023: $0.7 billion favourable movement) and lower net repayment of debt of $9.6 billion (2023: $9.8 billion net repayment).
Cash and cash equivalents were $39.1 billion at December 31, 2024 (December 31, 2023: $38.8 billion).
* Non-GAAP measure (see page 337).
Prior year Consolidated Statement of Cash Flows
Our Consolidated Statement of Cash Flows for the financial year ended December 31, 2023, compared with the financial year ended December 31, 2022, can be found in the Annual Report and Accounts (page 35) and Form 20-F (page 33) for the year ended December 31, 2023, as filed with the Registrar of Companies for England and Wales and the US Securities and Exchange Commission, respectively.
| | | | | |
| |
| See "Consolidated Statement of Cash Flows" on page 226. |
| |
Cash flow from operating activities
The most significant factors affecting Shell's cash flow from operating activities are earnings, which are mainly impacted by: realised prices for crude oil, natural gas and LNG; production levels of crude oil, natural gas and LNG; chemicals, refining and marketing margins; and movements in working capital and derivative financial instruments.
The impact on earnings from changes in market prices depends on: the extent to which contractual arrangements are tied to market prices; the dynamics of production-sharing contracts; the existence of agreements with governments or state-owned oil and gas companies that have limited sensitivity to crude oil and natural gas prices; tax impacts; and the extent to which changes in commodity prices flow through into operating expenses. Changes in benchmark prices of crude oil and natural gas in any particular period provide only a broad indicator of changes in our Integrated Gas and Upstream earnings in that period. Changes in any factors, from within the industry or the broader economic environment, can influence refining and marketing margins. The precise impact of any changes depends on how the oil markets respond to them. The market response is affected by factors such as: whether the change affects all crude oil types or only a specific grade; regional and global crude oil and refined products inventories; and the collective speed of response of refiners and product marketers in adjusting their operations. As a result, margins fluctuate from region to region and from period to period.
Divestment and cash capital expenditure
The levels of divestment proceeds and cash capital expenditure in 2024 and 2023 reflect our discipline and focus as we implement our strategy. Proceeds from sale of property, plant and equipment and businesses were $1.6 billion for 2024, compared with $2.6 billion
in 2023. Divestment proceeds* for 2024 were $2.8 billion, compared with $3.1 billion in 2023. Cash capital expenditure split
by segment is presented in the table below:
| | |
Cash capital expenditure [A] |
| | | | | | | | | | | |
| $ million |
| 2024 | 2023 | 2022 |
| Integrated Gas | 4,767 | 4,196 | 4,265 |
| Upstream | 7,890 | 8,343 | 8,143 |
Marketing [B] | 2,445 | 5,790 | 4,978 |
| Chemicals and Products | 3,290 | 3,014 | 3,691 |
Renewables and Energy Solutions [C] | 2,549 | 2,681 | 3,469 |
| Corporate | 144 | 368 | 287 |
| Total cash capital expenditure | 21,085 | 24,392 | 24,833 |
[A]See Note 7 to the "Consolidated Financial Statements" which includes an explanation of the reporting segment changes applicable from 2024.
[B]Includes acquisition of Nature Energy in 2023.
[C]Includes acquisition of Sprng in 2022.
Strategic Report | Performance in the year | Generating shareholder value | Liquidity and capital resources continued
Contractual obligations
The table below summarises Shell's principal contractual obligations at December 31, 2024, by expected settlement period. The amounts presented have not been offset by any committed third-party revenue in relation to these obligations.
| | | | | | | | | | | | | | | | | |
| $ billion |
| Less than 1 year | Between
1 and 3 years | Between
3 and 5 years | 5 years
and later | Total |
| Debt [A] | 6.9 | 6.4 | 7.9 | 27.6 | 48.8 |
| Leases | 6.4 | 9.5 | 6.3 | 19.8 | 42.0 |
| Purchase obligations [B] | 28.8 | 22.1 | 13.5 | 55.2 | 119.6 |
| Other long-term contractual liabilities [C] | 0.1 | 1.0 | 0.2 | 0.7 | 2.1 |
| Total | 42.2 | 39.0 | 27.9 | 103.4 | 212.4 |
[A]See Note 21 to the "Consolidated Financial Statements". Debt contractual obligations exclude interest, which is estimated to be $1.4 billion payable in less than one year, $2.4 billion between one and three years, $2.2 billion between three and five years, and $12.2 billion in five years and later. For this purpose, we assume that interest rates with respect to variable interest rate debt remain constant at the rates in effect at December 31, 2024, and that there is no change in the aggregate principal amount of debt other than repayment at scheduled maturity as reflected in the table. Lease contractual obligations include interest.
[B]Purchase obligations disclosed in the above table exclude commodity purchase obligations that are not fixed or determinable and are principally intended to be resold in a short period of time through sale agreements with third parties. Examples include long-term non-cancellable LNG and natural gas purchase commitments and commitments to purchase refined products or crude oil at market prices. Inclusion of such commitments would not be meaningful in measuring liquidity and cash flow, as the cash outflows generated by these purchases will generally be offset in the same periods by cash received from the related sales transactions.
[C]Includes obligations included in "Trade and other payables" and provisions related to onerous contracts included in "Decommissioning and other provisions" in "Non-current liabilities" in the "Consolidated Balance Sheet" that are contractually fixed as to timing and amount. In addition to these amounts, Shell has certain obligations that are not contractually fixed as to timing and amount, including contributions to defined benefit pension plans (see Note 24 to the "Consolidated Financial Statements") and obligations associated with decommissioning and restoration (see Note 25 to the "Consolidated Financial Statements").
Shareholder distributions
We returned $8.7 billion to our shareholders through dividends and $13.9 billion through share buybacks in 2024. Total shareholder distributions represented 41% of cash flow from operating activities*.
The fourth quarter 2024 dividend of $0.358 per share was paid
on March 24, 2025, to shareholders on the register at February 14, 2025, and represents an increase of 4% compared with the third quarter of 2024.
| | | | | |
| |
| See Note 30 to the "Consolidated Financial Statements" on page 292. |
| |
Purchases of securities
The intent to purchase shares was announced alongside the quarterly results during 2024, and covered the period up until the next quarterly announcement. In 2024, share buybacks of $3.5 billion were announced on February 1, $3.5 billion on May 2, $3.5 billion on August 1 and $3.5 billion on October 31 (finalised in the first quarter of 2025). In addition, on January 30, 2025, a further buyback of $3.5 billion was announced along with the fourth quarter 2024 results; it is intended that this will be completed by the announcement date of the first quarter 2025 results.
During 2024, 409.1 million ordinary shares were purchased and cancelled. Overall, a total nominal share value of €29 million ($34 million), 6.3% of the Company's total issued share capital at December 31, 2023, was purchased and cancelled during 2024 for a total cost of $13.9 billion, including expenses, at an average price of $34.36 per share.
* Non-GAAP measure (see page 337).
The buybacks completed in the first half of 2024 were in accordance with the authorities granted by shareholders at the 2023 Annual General Meeting (AGM). The buybacks completed in the second half of 2024 were in accordance with the authorities granted by shareholders at the 2024 AGM. At the 2024 AGM, authority was granted for the Company to repurchase up to a maximum of 10% of its issued ordinary shares, excluding treasury shares, (644.2 million ordinary shares), both on and off market, allowing purchases on the Amsterdam as well as London exchanges. As at December 31, 2024, 468 million ordinary shares could still be repurchased under the current AGM authorities. The purpose of the share repurchases in 2024 was to reduce the issued share capital of the Company.
New resolutions will be proposed at the 2025 AGM to renew the authority for the Company to purchase its own share capital, up to specified limits, for a further year. These proposals will be described in more detail in the 2025 Notice of Annual General Meeting.
Shares are also purchased by the employee share ownership trusts and trust-like entities (see Note 28 to the "Consolidated Financial Statements" on page 289) to meet delivery commitments under employee share plans. All share purchases are made in open market transactions.
The table on the next page provides information on purchases of shares in 2024 and January 2025 by the Company and affiliated purchasers. Purchases in euros and sterling are converted into dollars using the exchange rate on each transaction date.
Strategic Report | Performance in the year | Generating shareholder value | Liquidity and capital resources continued
| | |
Purchases of equity securities by issuer and affiliated purchasers in 2024 [A] |
| | | | | | | | | | | | | | | | | | | | | | | | | | | | | | | | |
| Euro Shares | | GBP Shares | | ADSs [B] |
| Purchase period | Number
purchased
for employee
share plans | Number
purchased
for cancellation
[C] | Weighted
average
price ($)[D] | | Number
purchased
for employee
share plans | Number purchased for cancellation [C] | Weighted
average
price ($)[D] | | Number
purchased
for employee
share plans | Weighted
average
price ($)[D] |
January | 3,187,890 | 2,992,417 | 32.32 | | 1,189,886 | 20,282,994 | 31.54 | | 650,966 | 66.03 |
| February | — | 20,209,031 | 31.72 | | — | 20,594,628 | 31.35 | | — | — |
| March | — | 11,550,631 | 32.41 | | — | 11,495,330 | 32.05 | | 67,764 | 67.37 |
| April | — | 13,500,349 | 35.93 | | — | 27,822,393 | 35.43 | | — | — |
| May | — | 18,389,736 | 36.02 | | — | 17,661,025 | 35.86 | | — | — |
| June | — | 14,235,749 | 35.05 | | — | 16,234,749 | 34.93 | | 34,819 | 71.43 |
| July | — | 9,320,167 | 36.30 | | — | 22,056,649 | 36.27 | | — | — |
| August | — | 17,386,007 | 35.89 | | — | 16,989,085 | 35.59 | | — | — |
| September | — | 18,341,974 | 33.96 | | — | 19,439,076 | 25.70 | | 36,136 | 69.48 |
| October | — | 15,538,143 | 33.74 | | — | 15,598,083 | 33.40 | | — | — |
| November | 3,161,027 | 15,370,794 | 33.00 | | 773,600 | 23,427,791 | 32.71 | | — | — |
| December | 5,290,944 | 15,272,833 | 31.53 | | 1,261,616 | 23,175,726 | 31.28 | | 514,913 | 61.24 |
| Total 2024 | 11,639,861 | 172,107,831 | 33.91 | | 3,225,102 | 234,777,529 | 33.66 | | 1,304,597 | 64.45 |
| January | 5,446,429 | 13,269,767 | 32.91 | | 1,271,425 | 19,923,745 | 32.68 | | 2,047,363 | 64.83 |
| Total 2025 | 5,446,429 | 13,269,767 | 32.91 | | 1,271,425 | 19,923,745 | 32.68 | | 2,047,363 | 64.83 |
[A]Reported as at transaction date.
[B]American Depositary Shares.
[C]Under the share buyback programme.
[D]Includes stamp duty and brokers' commission.
Financial information relating to the Royal Dutch Shell Dividend Access Trust
The results of the Royal Dutch Shell Dividend Access Trust (the Trust) are included in the consolidated results of operations and financial position of Shell. Certain condensed financial information in respect of the Trust is given below.
The Shell Transport and Trading Company Limited and BG Group Limited have each issued a dividend access share to Computershare Trustees (Jersey) Limited (the Trustee). For the years 2024, 2023 and 2022, the Trust recorded income before tax of £nil, £nil and £nil respectively. In each period, this reflected the amount of dividends payable on the dividend access shares. Dividends are also classified as unclaimed where amounts have not cleared recipient bank accounts.
At December 31, 2024, the Trust had total equity of £nil (December 31, 2023: £nil; December 31, 2022: £nil), reflecting assets of £3 million (December 31, 2023: £4 million; December 31, 2022: £6 million) and unclaimed dividends of £3 million (December 31, 2023: £4 million; December 31, 2022: £6 million). The Trust only records a liability for an unclaimed dividend to the extent that dividend cheque payments have not been presented within 12 months, have expired or have been returned unpresented. As these unclaimed dividends relate to dividends that were announced by the Company during the period the Company was still named Royal Dutch Shell plc, and it is expected that the Company will not announce any further dividends on the dividend access shares, the Trust continues to be named the Royal Dutch Shell Dividend Access Trust.
On January 29, 2022, one line of shares was established through assimilation of each A share and each B share into one ordinary share of the Company. This assimilation had no impact on voting rights or dividend entitlements. Dutch withholding tax, applied previously on dividends on A shares, no longer applies on dividends paid on the ordinary shares following the assimilation.
In relation to the assimilation of the Company's A and B shares, the Trust will continue in existence for the foreseeable future to facilitate the payment of unclaimed dividend liabilities for shareholders of the former B shares until these are either claimed or forfeited in line with the terms outlined. Dividends which are unclaimed after six years are forfeited and unconditionally revert to The Shell Transport and Trading Company Limited and BG Group Limited, as appropriate.
Strategic Report | Performance in the year | Generating shareholder value
Market overview
Shell maintains a large and diversified business portfolio across an integrated value chain. We are exposed to fluctuating prices of crude oil, natural gas, oil products, chemicals and power. However, our diversified portfolio provides resilience when prices are volatile. Our annual planning cycle and periodic portfolio reviews aim to ensure that our levels of capital investment and operating expenses are appropriate in the context of a volatile price environment.
| | | | | |
| |
| See "Risk factors" on page 25. |
| |
We prepare an annual financial plan that tests different scenarios, and their impact on prices, on our businesses and organisation as a whole. These scenarios help us determine which issues could affect our operating environment and have implications for our strategy. They also help us to identify potential interventions to preserve our cash levels.
We continually assess the external environment -- the markets and the underlying economic, political, social and environmental drivers that shape them -- to evaluate changes in competitive forces. We define multiple potential future scenarios and business environments by identifying drivers, uncertainties, enablers and constraints to our competitiveness.
We also continually screen for new opportunities globally through our opportunity identification process. We test the resilience of our opportunities against a range of prices and costs for crude oil, natural gas, oil products and chemicals. These tests are based on short-, medium- and long-term market drivers, such as the extent and pace of the energy transition. Our opportunities are then ranked, prioritised and tested for strategic fit and value return expectations before being included in our growth funnel.
Global economic growth
In 2024, the global economy has demonstrated resilience at a time of geopolitical tensions, inflation and rising interest rates. The World Economic Outlook, published by the International Monetary Fund in January 2025, estimated global economic growth in 2024 to be 3.2% compared with 3.3% in 2023.
Macroeconomic performance was unevenly distributed. For example, growth in China disappointed, as stronger exports only partly offset a slowdown in consumption amid delayed stabilisation in the property market. India and Indonesia saw relatively brisk growth, while growth in Europe was strained, largely reflecting weakness in manufacturing and goods exports. By contrast, momentum in the USA remained robust with the economy powered by strong consumption.
Inflation receded further toward target levels in most countries, bolstering real incomes. From June 2024, many major central banks began cutting interest rates. This has supported deal-making and economic activity. However, growth is likely to be limited because of protectionist trade policies and economic challenges, such as high energy prices in Europe and the property market slowdown in China.
Global prices, demand and supply
The following table provides an overview of the main crude oil and natural gas price markers to which Shell is exposed:
| | |
| Oil and gas average industry prices [A] |
| | | | | | | | | | | |
| 2024 | 2023 | 2022 |
| Brent ($/b) | 81 | 83 | 101 |
| West Texas Intermediate ($/b) | 76 | 78 | 95 |
| Henry Hub ($/MMBtu) | 2.2 | 2.5 | 6.4 |
| EU TTF ($/MMBtu) | 11 | 13 | 40 |
| Japan Customs-cleared Crude ($/b) - 3 months | 88 | 89 | 98 |
[A]The 2024 average price for Japan Customs-cleared Crude is based on available market information up to the end of the period. Brent, West Texas Intermediate and EU TTF yearly average prices are based on daily spot prices. Henry Hub and Japan Customs-cleared Crude yearly average prices are based on monthly average prices.
Crude oil and oil products
The global benchmark oil price Brent averaged $81 per barrel (bbl) in 2024, slightly lower than the average of $83/bbl in 2023. Prices continued to be volatile, with Brent daily spot ranging between $70/bbl and $93/bbl. This reflected a well-supplied market due to slower economic growth and fuel substitution, as well as continued conflict in the Middle East and Europe.
Global liquids demand growth was weaker in 2024, mainly due to significantly less demand growth from China. In 2023, demand from China increased by around 1.3 million barrels per day (mb/d) year-on-year because of growth after COVID-19 but in 2024 this slowed to around 0.2 mb/d, mainly due to the country's economic slowdown and partly due to the rapid uptake of electric vehicles. This has driven the slowdown of overall global demand growth, from more than 2 mb/d in 2023 to just 0.9 mb/d in 2024.
Global liquids supply growth came in slightly lower than demand growth at around 0.6 mb/d, which includes 0.2 mb/d of growth from global biofuel supplies and the rest from non-OPEC crude supplies. OPEC supply declined further, by around 0.2 mb/d year-on-year, as OPEC maintained a production cut to keep the market balanced. The timing for the unwinding of curtailed production of OPEC and its alliances has been a key factor for supply. The return of the voluntary cut, put in place in 2023, has been repeatedly delayed due to weak market conditions, and is now expected to happen in the second quarter of 2025 at the earliest.
Conflicts in the Middle East and Europe caused some spikes in oil prices throughout the year as the market perceived increased risks to oil infrastructure and key shipping routes, such as the Red Sea. But the spikes were short-lived as the market continued to focus on demand and supply fundamentals.
In 2025, the slowdown in China is expected to continue to influence demand. The International Energy Agency (IEA) expects continued below-trend growth from China and this could result in a similar rate of growth for global oil demand as in 2024. On the supply side,
non-OPEC supply — excluding US Light Tight Oil — is expected to rise, strongly bolstered by conventional offshore projects. Meanwhile, the market will continue to watch the pace at which OPEC unwinds its curtailed production.
Strategic Report | Performance in the year | Generating shareholder value | Market overview continued
Natural gas
Gas market
Global gas prices weakened in 2024, leading to higher demand and hence a modest return to growth in global gas markets in 2024. But prices remained higher than the historical levels seen prior to the Russian invasion of Ukraine. The market remained volatile because of concerns about security of supply in Europe and limited new LNG supply. LNG supply increased by less than 3% in 2024, supporting relatively elevated pricing levels. The early part of 2024 saw spot LNG prices fall to their lowest level since early 2022, but prices recovered by mid-year due to delays in the development of new supply capacity.
Title Transfer Facility (TTF): In Europe, TTF spot prices averaged $10.95/MMBtu (17% lower year-on-year). Demand remained weak due to warmer than normal winter weather early in the year, continued lower demand from the industrial sector, and high levels of renewable power generation. As a result, European storage levels reached maximum fill levels by the end of October 2024 and entered the winter in a strong position. However, continued concerns over gas supply security because of geopolitical tensions resulted in a more volatile price environment in the fourth quarter of the year. Europe is expected to increase imports of LNG in 2025 to refill its gas storage.
Japan Korea Marker (JKM): Spot LNG prices in Asia closely tracked the market dynamics impacting the European market. JKM prices averaged $11.89 (14% lower year-on-year). Through the first three quarters of 2024, JKM prices traded at a premium to TTF as modest growth in Chinese and Indian demand drew cargoes east because of constrained LNG supply. With storage levels high in the fourth quarter, JKM prices fell below TTF as cargoes were pulled to Europe.
Henry Hub: The North American gas market was well supplied in 2024. Higher-than-expected power generation from wind and solar reduced the need for gas-fired power. Lower gas demand put downward pressure on Henry Hub spot prices to the extent that natural gas producers responded by curtailing production. Henry Hub spot hit a new all-time low of $1.24/MMBtu in March 2024 and then again in November at $1.22/MMBtu. Henry Hub spot averaged $2.2/MMBtu over 2024, with a wide range of $1.22/MMBtu to $13.20/MMBtu, with the high mark due to a short-lived January winter storm. In the summer, temperatures averaged 1.4°C higher than the 10-year norm. While this was bullish for gas power generation, it was offset by the impact of strong renewable generation. As such, natural gas storage ended the summer at a five-year high. For 2025, continued growth in renewable capacity coupled with higher dry gas production is expected to put downward pressure on natural gas prices.
Global gas prices are expected to remain volatile in 2025. Project delays and legacy production declines are likely to constrain supply growth. However, demand has also been bolstered by economic growth in Asia, the end of Russian gas flowing to Europe via Ukraine, and Europe's need to replenish inventories. Increased government intervention as well as geopolitical unrest continue to affect global LNG trade flows and price variance.
Power
USA: In 2024, US power prices remained stable across most eastern markets compared with 2023. Henry Hub gas benchmark prices in North America were largely steady, staying below $3/MMBtu after a short-lived spike in January 2024. In the western USA, a cold start to the year drove Mid-Columbia prices to reach the $1,000/MWh soft cap multiple times in January, although the California Independent System Operator (CAISO) market was largely insulated from these fluctuations. The ERCOT (Texas) market set a new peak of 85.5 GW on August 20, 2024, but ERCOT successfully managed the high load with much lower prices compared with 2023. In the eastern USA, including PJM, MISO (Midcontinent), ISO-NE (New England) and NYISO,
power prices remained stable relative to 2023. Solar and wind generation continued to grow and, depending on their market penetration levels, impacted the hourly price profiles. Continued growth in renewable energy demand is expected in 2025, driven by the expansion of data centres.
Europe: Across Europe, power prices continued to fall for the second year in a row from the height of the energy crisis in 2022. Germany, France, the United Kingdom and Spain saw a reduction of between EUR 20/MWh and 30/MWh in their annual average wholesale power prices in 2024, compared with 2023. This was partly due to depressed demand, more output from wind power generation in the winter months and record-setting solar power output in the summer. German power prices are still among the highest on the continent with an annual average of EUR 79/MWh. Germany is testing a new auction mechanism for excess power to be used by flexible loads as a means of managing the increasing number of negative price hours. More than 32 GW of wind capacity was awarded by European governments in auctions this year. Nearly 10 GW of Europe's oldest remaining coal-fired power stations were retired this year; the majority were retired in Germany, while the UK and Denmark closed their last coal plants. Power prices show an increasing dependence on solar and wind generation, reaching more than EUR 800/MWh during a period of very low solar and wind power generation in Germany in early November. In 2025, a policy shift towards economic competitiveness is likely, potentially paired with protectionist interventions in Europe. Issues such as operational flexibility and grid infrastructure are being addressed by, for example, increased battery investments and market changes, such as the transition to 15-minute trading intervals in all bidding zones of the European Single Day-Ahead Coupling market.
Australia: The volume-weighted average prices (VWAP) in the east coast National Electricity Market (NEM) averaged about A$130/MWh in 2024, increasing from around A$90/MWh in 2023. The west coast Wholesale Electricity Market (WEM) saw a more modest year-on-year VWAP increase from roughly A$90/MWh to around A$95/MWh. The VWAP of the east coast domestic gas markets (Brisbane, Sydney, Adelaide and the Declared Wholesale Gas Market (DWGM)) rose to around A$12.75/GJ in 2024 from around A$11.70/GJ in 2023. Meanwhile, in Western Australia the average gas price rose to around A$7.10/GJ in 2024 from about A$6.15/GJ in 2023. In addition to higher power prices, price volatility also increased compared with the previous year in both the NEM and WEM, largely due to increasing levels of rooftop solar generation which pushed network demand to record lows and led to prolonged periods of negative prices. In the NEM, cold weather, low wind and low hydroelectric generation in the second quarter and early third quarter put upward pressure on prices and led to greater reliance on gas-powered generation, increasing domestic gas demand. A key development to watch in 2025 is the outcome of the federal election, given the differing policies of the incumbent and opposition parties on the role of gas and power generation technologies.
Crude oil and natural gas price assumptions
Our ability to deliver competitive returns and pursue commercial opportunities depends on the accuracy of our price assumptions. We use a rigorous assessment of short-, medium- and long-term market uncertainties to determine which ranges of future crude oil and natural gas prices to use in project and portfolio evaluations. Market uncertainties include, for example, future economic conditions, geopolitics, actions by major resource holders, production costs, technological progress and the balance of supply and demand.
| | | | | |
| |
| See "Risk factors" on page 25 and Note 12 to the "Consolidated Financial Statements" on pages 259-260. |
| |
Strategic Report | Performance in the year | Generating shareholder value | Market overview continued
Refining and chemical margins
Refining margins declined in 2024 from the high levels seen in 2022 and 2023. Despite conflicts in the Middle East and a continuing war in Ukraine, supply chains have adjusted to keep the Atlantic Basin well supplied, particularly with middle distillate to Europe. There were some shipping disruptions in the Red Sea at the start of 2024 which reduced the amount of oil products coming into Europe from East of Suez. This led to a spike in margins when combined with a heavy first-quarter refinery maintenance season in the Atlantic Basin. However, once the refineries came back online and supplies to Europe came in via the Cape of Good Hope, margins dropped to more normal levels. Moreover, demand growth has been limited with the Eurozone economy struggling, China's lower economic growth and muted growth in US gasoline demand.
The margin for 2025 is expected to be in line with 2024 levels. Oil product demand growth is likely to be weak and concentrated in Latin America, South-east Asia and India as economic growth is likely to remain sluggish in China and weak in Europe, and as electric vehicle penetration ramps up. New refinery capacity in India and China is still coming online and the major Atlantic Basin projects, Olemca (Mexico) and Dangote (Nigeria), will ramp up production in 2025 although neither site is expected to reach full capacity in 2025. Some support for refining margins will come from announced site closures in California, the US Gulf Coast and Europe. In addition, US gasoline stocks remain low and this could lead to a spike in margins if there is a supply disruption. Lower crude oil prices could also support more demand growth.
Chemical cracker margins remained pressured in 2024 because of global oversupply and weak demand. Asia and Europe saw slight relief with lower crude prices, but both regions remained under significant pressure. Cracker utilisation continued to drift lower with the start-up of new Asian capacity. Europe remained under strain with high energy costs as various producers, including LyondellBasell Industries (LB)I and Dow Inc., announced closures and portfolio reviews.
The outlook for petrochemical margins in 2025 and beyond depends on feedstock costs and the balance of supply and demand. Global oversupply is expected to persist through the year with a slow demand recovery. A recovery in demand is needed to absorb excess capacity. The supply of petrochemicals will depend on how new facilities come online and how plant closures will impact net capacity, with utilisation balancing the system. Product prices will reflect the cost of raw materials, which is closely linked to crude oil and natural gas prices. Increasing volatility driven by political and upstream price uncertainty will present short-term localised opportunities to bolster returns.
Refining margins
| | |
| Global indicative refining margin [A] |
| | | | | | | | | | | |
| | | $/bbl |
| 2024 | 2023 | 2022 |
| Indicative refining margin | 7.74 | 12.45 | 18.03 |
[A]The indicative refining margin (IRM) is an approximation of Shell's global gross refining unit margin, calculated using price markers from third-party databases. It is based on a simplified crude and product yield profile at a nominal level of refining performance. The actual margins realised by Shell may vary due to factors including specific local market effects, refinery maintenance, crude diet optimisation as the crudes in the IRM are indicative benchmark crudes, operating decisions and product demand. Gross refining unit margin is defined as the hydrocarbon margin net of purchased/sold utilities, additives and relevant freight costs, divided by crude and feedstock intake in barrels. It is only applicable to the impact of market pricing on refining business performance, excluding trading margin.
Petrochemical margins
| | |
| Global indicative chemical margin [A] |
| | | | | | | | | | | |
| | | $/tonne |
| 2024 | 2023 | 2022 |
| Indicative chemical margin | 151.72 | 132.63 | 48.04 |
[A]The indicative chemical margin (ICM) is an approximation of Shell's global chemical margin performance trend (including equity-accounted associates), calculated using price markers from third-party databases. It is based on a simplified feedstock and product yield profile at a nominal level of plant performance. The actual margins realised by Shell may vary due to factors including specific local market effects, chemical plants maintenance, optimisation, operating decisions and product demand. Chemical unit margin is defined as the hydrocarbon margin net of purchased/sold utilities, additives and relevant freight costs, divided by a nominal denominator expressed in metric tonnes. It is only applicable to the impact of market pricing on Chemicals business performance.
The statements in this "Market overview" section are forward-looking statements based on management's current expectations and certain material assumptions and, accordingly, involve risks and uncertainties that could cause actual results, performance or events to differ materially from those expressed or implied herein.
| | | | | |
| |
| See "About this Report" on pages 11-16 and "Risk factors" on page 25. |
| |
Strategic Report | Performance in the year | Generating shareholder value
| | | | | | | | | | | | | | | | | | | | |
| | Integrated Gas includes liquefied natural gas (LNG) and the conversion of natural gas into gas-to-liquids (GTL) fuels and other products. It includes natural gas and liquids exploration and extraction, and the operation of the upstream and midstream infrastructure necessary to deliver these to market. Integrated Gas also includes the marketing, trading and optimisation of LNG. | |
| | | | | | |
| | 9.6 Segment earnings ($ billion) (2023: 7.1) | | | 11.4 Adjusted Earnings ($ billion) (2023: 13.9) | |
| | 16.9 Cash flow from operating activities ($ billion) (2023: 17.5) | | | 954 Production (thousand boe/d) (2023: 939) | |
| | 29 LNG liquefaction volumes (million tonnes) (2023: 28) | | | 66 LNG sales volumes (million tonnes) (2023: 67) | |
| | | | | | |
Strategic Report | Performance in the year | Generating shareholder value | Integrated Gas continued
Integrated Gas performed well as we increased LNG liquefaction volumes and our access to third-party volumes. We boosted our operational performance. In Australia, Prelude and QGC achieved record availability, resulting in their highest ever production. During the year, we extended partnerships in Oman and decided to invest in the ADNOC Ruwais LNG project in Abu Dhabi [A]. We also took final investment decisions on a number of key projects, including Manatee in Trinidad and Tobago, and agreed to acquire Pavilion Energy in Singapore [A]. See "Outlook" on pages 23-24 for our Capital Markets 2025 investor update.
Business conditions
For the business conditions relevant to Integrated Gas, see "Market overview" on pages 45-47.
Financial delivery
Earnings 2024-2023
Segment earnings increased by $2,533 million compared with 2023. This was a result of higher volumes (increase of $514 million), lower operating expenses (decrease of $478 million), and favourable deferred tax movements ($399 million) compared with 2023. Furthermore, this included the combined effect of lower contributions from trading and optimisation and lower realised prices (decrease of $3,819 million compared with 2023), partly offset by a comparative help relating to fair value accounting of commodity derivatives (unfavourable movement of $1,088 million in 2024 compared with an unfavourable movement of $4,407 million in 2023 which are part of identified items). Segment earnings in 2024 also included net impairment charges and reversals of $363 million (2023: $2,247 million), which are part of identified items.
As part of Shell's normal business, commodity derivative hedge contracts are entered into for mitigation of economic exposures on future purchases, sales and inventory.
Adjusted Earnings and Adjusted EBITDA were driven by the same factors as the segment earnings, and adjusted for identified items.
Prior year earnings summary
Segment earnings in 2023 were lower in comparison to 2022 and reflected the net effect of lower realised prices and higher contributions from trading and optimisation (a decrease of $1,143 million), lower volumes (a decrease of $466 million), and unfavourable deferred tax movements (a decrease of $728 million).
Segment earnings included identified items: mainly unfavourable movements of $4,407 million due to the fair value accounting of commodity derivatives and net impairment charges and reversals of $2,247 million. In 2022, identified items included favourable movements of $6,273 million due to the fair value accounting of commodity derivatives and net impairment reversals of $779 million. In 2022, these were partly offset by other impacts of $608 million, mainly loan write-downs, as well as charges of $387 million as provisions for onerous contracts.
Adjusted Earnings and Adjusted EBITDA were driven by the same factors as the segment earnings, and adjusted for identified items.
[A]Transaction subject to completion.
* Non-GAAP measure (see page 337).
| | | | | | | | | | | |
| $ million, except where indicated |
| 2024 | 2023 | 2022 |
Segment earnings [C] | 9,590 | 7,057 | 22,221 |
Identified items | (1,800) | (6,861) | 6,075 |
| Adjusted Earnings* [C] | 11,390 | 13,919 | 16,146 |
| Adjusted EBITDA* [C] | 20,978 | 23,773 | 26,581 |
Cash flow from operating activities* | 16,909 | 17,520 | 27,692 |
Cash capital expenditure | 4,767 | 4,196 | 4,265 |
| Liquids production available for sale (thousand b/d) | 132 | 128 | 128 |
| Natural gas production available for sale (million scf/d) | 4,769 | 4,700 | 4,600 |
| Total production available for sale (thousand boe/d) | 954 | 939 | 921 |
| LNG liquefaction volumes (million tonnes) | 29.1 | 28.3 | 29.7 |
| LNG sales volumes (million tonnes) | 65.8 | 67.1 | 66.0 |
[B]See Note 7 to the "Consolidated Financial Statements" which includes an explanation of the reporting segment changes applicable from 2024.
[C]Segment earnings, Adjusted Earnings, and Adjusted EBITDA are presented on a current cost of supplies basis.
Cash flow from operating activities
Cash flow from operating activities for 2024 was primarily driven by Adjusted EBITDA and working capital inflows of $467 million, partly offset by tax payments of $2,955 million and net cash outflows related to derivatives of $1,466 million.
Shell's policy is to settle the inter-segment use of tax attributes between business segments. This settlement is usually made in cash but in certain instances there is no cash settlement. In 2024, the Integrated Gas segment's deferred tax assets ($974 million) were mainly used by the Upstream ($759 million) and Chemicals and Products ($183 million) segments, for which no cash settlement was made.
Cash capital expenditure
Our cash capital expenditure in 2024 was higher than in 2023. The increase was mainly a result of maturation of projects in Trinidad and Tobago and Australia, as well as higher maintenance in Pearl GTL. Our cash capital expenditure is expected to be around $6 billion in 2025 in Integrated Gas.
Operational performance
Production available for sale
Our natural gas production increased by 2% in 2024 compared with 2023, mainly due to the ramp-up of fields in Oman and Australia. In this period, natural gas and liquids made up 86% and 14% of total production, respectively.
LNG liquefaction and sales volumes
Our LNG liquefaction volumes increased by 3% compared with the previous year, mainly due to lower maintenance in Australia.
LNG sales volumes decreased primarily because of lower purchases from third parties, coupled with higher inventory at the end of the year.
Strategic Report | Performance in the year | Generating shareholder value | Integrated Gas continued
Integrated Gas data table
| | | | | | | | | | | |
| Million tonnes |
| 2024 | 2023 | 2022 |
| Australia | 14.4 | 13.3 | 13.2 |
| Brunei | 1.2 | 1.1 | 1.2 |
| Egypt | — | 0.3 | 0.5 |
| Nigeria | 3.5 | 3.3 | 3.6 |
| Oman | 2.8 | 2.7 | 2.8 |
| Peru | 0.9 | 0.8 | 0.8 |
| Qatar | 2.3 | 2.4 | 2.4 |
| Russia | — | — | 0.9 |
| Trinidad and Tobago | 4.0 | 4.3 | 4.3 |
| Total | 29.1 | 28.3 | 29.7 |
Strategic progress
Portfolio and business developments
Significant portfolio and business developments:
○In June 2024, we agreed to acquire 100% of the shares in Singapore-based Pavilion Energy Pte. Ltd. from Carne Investments Pte. Ltd., a wholly owned subsidiary of Temasek. Pavilion Energy includes a global LNG trading business with about 6.5 mtpa of contracted supply volume [A].
○In July 2024, we took the final investment decision (FID) on the Manatee project, a gas field in the East Coast Marine Area (ECMA) in Trinidad and Tobago.
○In July 2024, we signed an agreement to invest in the Abu Dhabi National Oil Company's (ADNOC) Ruwais LNG project through a 10% participating interest [A]. The project will consist of two 4.8 mtpa LNG liquefaction trains with a total capacity of 9.6 mtpa. LNG deliveries are expected to start in 2028.
○In August 2024, Arrow Energy, an incorporated joint venture between Shell (50%) and PetroChina (50%), announced the sanction of Phase 2 of Arrow Energy's Surat Gas Project in Queensland, Australia.
During 2024, we continued to grow our world-leading LNG business. We invested in our existing assets, for example taking a final investment decision on the Manatee gas project in Trinidad and Tobago and by going ahead with projects to supply gas at our LNG facilities in Australia, such as Surat Gas Project North.
Manatee is expected to start production in 2027 and, once online, is expected to reach peak production of about 104,000 barrels of oil equivalent per day (boe/d) (604 MMscf/d). It will provide backfill for the country's Atlantic LNG facility and to the petrochemical sector. Increasing utilisation at existing LNG plants is an important lever to maximise potential from Shell's existing assets. We also undertook the Phase 1 of the commercial restructuring of Atlantic LNG in Trinidad and Tobago in 2024 in an effort to simplify the structure of the project. The remaining phases are expected to be completed by 2027.
[A]Transaction subject to completion.
| | | | | | | | |
|
| | |
| Shell completes its largest ever turnaround at Pearl GTL In 2024, more than 16,000 workers converged on the Pearl GTL gas-to-liquids facility in Qatar to carry out maintenance and repair work over 56 days on Pearl GTL's Train 2 production line. The turnaround was completed on schedule and at a competitive cost – a clear example of how Shell, the operator, is focusing on performance and discipline as we implement our strategy. Turnaround events, like this one, are planned, periodic shutdowns of a manufacturing facility for maintenance and repair work that cannot be conducted while the facility is fully operational. These events are crucial for maintaining the integrity and reliability of the facility. Throughout the turnaround, Pearl GTL's Train 1 remained operational, ensuring continuous supply of GTL products used by global customers in sectors from industry to transport. Planning for the event started more than three years prior, and during the execution phase teams worked around the clock, making it a 24/7 event. The effective execution included nearly 10,000 heavy lifts, more than 14,000 flanges opened, and 2,700 field welds completed, resulting in over 9 million exposure hours with no significant incidents. In recent years, Pearl GTL has been operating with high safety, reliability and availability performance. In 2024, Pearl achieved its second-best year for reliability with unplanned downtime at 1.4%. In the same year, Pearl also achieved its lowest greenhouse gas (GHG) intensity since start-up and was the largest GHG abatement contributor to the Shell scorecard. Learning from the previous turnaround in 2022, Pearl GTL reduced flaring by approximately 19% during this event. Overall, Pearl GTL has reduced total flaring by 75% since 2016. Despite the challenge of a turnaround this size, we continued to place a strong emphasis on worker welfare. This was a critical success factor in ensuring we had a healthy and focused team when it mattered most – on the job, at the point of risk. This turnaround was conducted in close partnership with Qatar's state energy company – QatarEnergy. Collaborating and consulting during every phase of the project ensured successful completion, supporting reliable and safe future operations. | |
| Photo: Pearl GTL Plant, Qatar. | |
| | |
Strategic Report | Performance in the year | Generating shareholder value | Integrated Gas continued
The Surat Gas Project Phase 2 is expected to contribute around 22,400 barrels of oil equivalent per day (or 130 million standard cubic feet per day) at peak production and first gas is expected in 2026. The gas from the project will flow to the Shell-operated Queensland Curtis LNG (QCLNG) facility on Curtis Island, near Gladstone, to meet long-term contracts and supply domestic customers.
We announced the investment in new projects such as Pavilion Energy in Singapore, which will add to our current sales and bring flexibility to our portfolio, as well as additional access to strategic gas markets in Asia and Europe. The 10-year LNG supply agreement that we signed with Boru Hatları ile Petrol Taşıma AŞ (BOTAS) of Turkey in 2024, will also increase the diversity and flexibility of our portfolio.
We also continued growing our portfolio through the construction of new lower-carbon intensity LNG plants, for example with the
agreement to invest in the Ruwais LNG project that will use an electric-powered liquefaction system and has access to nuclear and solar power. The transaction is still subject to completion.
Finally, in 2024, we made good progress at LNG Canada, the single largest private-sector energy investment in Canada's history. The facility is expected to initially export up to 14 million tonnes of LNG per annum, contributing up to 5.6 mtpa to Shell's global LNG supply portfolio. The project is on track to ship its first cargoes to global markets by the middle of 2025. LNG Canada has also been designed with energy-efficient natural gas turbines and is expected to use renewable power from an electric utility in the province of British Columbia.
Business and property
Integrated Gas
A complete list of LNG and GTL plants in operation and under construction in which we have an interest is provided below.
| | |
| LNG liquefaction plants in operation at December 31, 2024 [A] |
| | | | | | | | | | | | | | | | | |
| Asset | Location | Shell interest (%) | 100% capacity (mtpa) [B] | Shell-operated |
| Asia | | | | | |
| Brunei | Brunei LNG | Lumut | 25 | 7.6 | No |
| Oman | Oman LNG | Sur | 30 | 7.1 | No |
| Qalhat LNG [C] | Sur | 11 | 3.7 | No |
| Qatar | QatarEnergy LNG N(4) [D] | Ras Laffan | 30 | 7.8 | No |
| Oceania | | | | | |
| Australia | Australia North West Shelf [D] | Karratha | 16.7 | 16.9 | No |
| Gorgon LNG [D] | Barrow Island | 25 | 15.6 | No |
| Prelude [D] | Browse Basin | 67.5 | 3.6 | Yes |
| Queensland Curtis LNG T1 [D] | Curtis Island | 50 | 4.3 | Yes |
| Queensland Curtis LNG T2 [D] | Curtis Island | 97.5 | 4.3 | Yes |
| Africa | | | | | |
| Egypt | Egyptian LNG T1 | Idku | 35.5 | 3.6 | No |
| Egyptian LNG T2 | Idku | 38 | 3.6 | No |
| Nigeria | Nigeria LNG T1-T6 | Bonny | 25.6 | 24.1 | No |
| South America | | | | | |
| Peru | Peru LNG | Pampa Melchorita | 20 | 4.5 | No |
| Trinidad and Tobago | Atlantic LNG T1/T2/T3 [E] | Point Fortin | 47.15 | 9.3 | No |
| Atlantic LNG T4 | Point Fortin | 51.1 | 5.2 | No |
[A]We have offtake rights via a lease to 100% of the capacity (2.5 mtpa) of the Kinder Morgan-operated Elba Island liquefaction plant in Georgia, USA.
[B]100% capacity represents the total capacity that all trains can process as reported by the operator.
[C]The interest is held via an indirect shareholding through Oman LNG.
[D]These assets are clustered as integrated assets and have onshore or offshore upstream production.
[E]Shell % applies from October 1, 2024, as result of the agreement between Shell, the government of Trinidad and Tobago, and Atlantic LNG and its shareholders to restructure the Atlantic LNG facility. Prior to the restructuring, Shell's equity was 46% in T1 and 57.5% in T2/T3.
Strategic Report | Performance in the year | Generating shareholder value | Integrated Gas continued
| | |
LNG liquefaction plants under construction at December 31, 2024 [A] |
| | | | | | | | | | | | | | | | | |
| Asset | Location | Shell interest (%) | 100% capacity (mtpa) [B] | Shell-operated |
| Africa | | | | | |
| Nigeria | Train 7 [C] | Bonny | 25.6 | 7.6 | No |
| North America | | | | | |
| Canada | LNG Canada T1-2 [D] | Kitimat | 40.0 | 14.0 | No |
| Asia | | | | | |
| Qatar | QatarEnergy LNG NFE(2) [E] | Ras Laffan | 25.0 | 8.0 | No |
| QatarEnergy LNG NFS(2) [F] | Ras Laffan | 25.0 | 6.0 | No |
[A]In July 2024, we agreed to invest in the Ruwais LNG project in Abu Dhabi through a 10% participating interest. The Ruwais LNG project, which is already under construction, will consist of two 4.8 mtpa LNG liquefaction trains with a total capacity of 9.6 mtpa. LNG deliveries are expected to start in 2028. The deal is subject to completion.
[B]100% capacity represents the total capacity that all trains are expected to process as reported by the operator.
[C]First LNG is expected in the second half of the 2020s.
[D]Construction started in October 2018 and first LNG is expected by mid-2025.
[E]Shell holds 25% in the joint venture, which owns 25% of the North Field East expansion project, which has a nameplate capacity of 32 mtpa. First LNG is expected in the second half of the 2020s.
[F]Shell holds 25% in the joint venture, which owns 37.5% of the North Field South expansion project, which has a nameplate capacity of 16 mtpa. First LNG is expected in the second half of the 2020s.
| | |
| GTL plants in operation at December 31, 2024 |
| | | | | | | | | | | | | | | | | |
| Asset | Location | Shell interest (%) | 100% capacity (b/d) [A] | Shell-operated |
| Asia | | | | | |
| Malaysia | Shell MDS | Bintulu | 72.0 | 14,700 | Yes |
| Qatar | Pearl | Ras Laffan | 100.0 | 140,000 | Yes |
[A]100% capacity represents the total capacity of the plant.
LNG regasification terminals
In 2024, we held interests in regasification terminals: Dragon LNG in the UK (Shell interest 50%), Shell Energy India Pvt Ltd (Shell interest 100%) and Shell LNG Gibraltar (Shell interest 51%). We had rights in other regasification terminals in Mexico (Shell capacity rights 2.7 mtpa), the Netherlands (Shell capacity rights 4.6 mtpa), Singapore (mainly licences to import LNG and sell regasified LNG in Singapore with no volume cap) and the USA (total Shell capacity rights 24.7 mtpa). Total Shell regasification capacity rights were 7.7 mtpa in Europe, 27.4 mtpa in North America and 6 mtpa in Asia.
Oil and natural gas production, exploration and development
Australia
We operate the Queensland Curtis LNG (QCLNG) venture's natural gas operations in the onshore Surat Basin. Our interests range from 44% to 74% in 25 field compression stations and six central processing plants. Gas from the Surat Basin is supplied to the QCLNG liquefaction plant and the domestic gas market. Also in Queensland, we have a 50% interest in the Arrow joint venture with China National Petroleum Corporation (CNPC). Arrow owns coalbed methane assets and a domestic power business. In August 2024, we announced plans to develop Phase 2 of Arrow Energy's Surat Gas Project.
Shell has interests in offshore production, LNG liquefaction and exploration licences in the Browse Basin, and in the North West Shelf (NWS) and Greater Gorgon areas of the Carnarvon Basin. Woodside operates the NWS joint venture (Shell interest 16.7%). We have a 25% interest in the Chevron-operated Gorgon LNG joint venture that includes offshore production. In the Browse Basin, Shell operates the Prelude field (Shell interest 67.5%), the Crux gas and condensate development field (Shell interest 84.5%) and other backfill projects for the Prelude FLNG.
Bolivia
We have a 37.5% interest in the Repsol-operated Caipipendi block where natural gas is produced and delivered to domestic and export markets. We also have a 25% interest in the Tarija XX West block which produces from the Itaú field.
Canada
We produce and market natural gas, natural gas liquids and condensate. We hold mineral acres, primarily in the Montney play in British Columbia and Alberta. We operate four natural gas processing facilities at our Groundbirch asset in British Columbia with another natural gas processing facility that will be commissioned and operational in early 2025. Shell's working interest across the Groundbirch acreage ranges from 88% to 92%.
Photo: Shell Canada Integrated Gas employees at work on a pipeline project,
Fort St. John, British Columbia.
Strategic Report | Performance in the year | Generating shareholder value | Integrated Gas continued
China
We develop and produce from the onshore Changbei tight-gas field under a PSC with China National Petroleum Corporation.
Egypt
We have a range of venture and concession interests. The Burullus Gas Company joint venture (Shell interest 25%) operates the West Delta Deep Marine concession (Shell interest 50%) and supplies gas to the domestic market and an Egyptian LNG plant. The Rashid Petroleum Company (Rashpetco) joint venture (Shell interest 50%) operates the Rosetta concession (Shell interest 100%). The El Burg Offshore Company (EBOC) joint venture (Shell interest 30%) operates the El Burg offshore concession (Shell interest 60%).
We also have interests in several exploration concessions in the Nile Delta and the wider East Mediterranean.
Oman
We have a concession agreement for the development and production of natural gas and condensate in the Shell-operated Block 10 (Shell interest 53.45%). We have a separate gas sales agreement and oil supply agreement for production from the block. We also have an exploration and production-sharing agreement for the exploration and appraisal of natural gas and condensate in the Shell-operated Block 11 (Shell interest 67.5%).
Qatar
Under a development and production-sharing contract with the government, we operate the fully integrated Pearl GTL plant (Shell interest 100%). Pearl GTL has the capacity to produce, process and transport 1.6 billion standard cubic feet per day (scf/d) of gas from Qatar's North Field.
We have a 30% interest in QatarEnergy LNG N(4), an integrated onshore gas-processing facility operated by QatarEnergy LNG, which can produce around 1.4 billion scf/d of gas from Qatar's North Field. We also have a 25% interest in the QatarEnergy LNG NFE(2) joint venture, which owns a 25% interest in the North Field East (NFE) project. Shell's ownership of NFE via the joint venture is 6.25%. In addition, we have a 25% interest in the QatarEnergy LNG NFS(2) joint venture which owns a 37.5% interest in the North Field South (NFS) project. Shell's ownership of NFS via the joint venture is 9.375%.
Russia
In 2022, Shell announced its intent to withdraw in a phased manner from its involvement in all Russian hydrocarbons, including crude oil, petroleum products, gas and LNG. Shell still holds a 27.5% (minus one share) interest in Sakhalin Energy Investment Company Ltd. (SEIC), a Bermudan entity, which purportedly no longer holds any licences, rights and obligations in Sakhalin-2. Shell still holds one long-term LNG purchase contract with a Novatek entity.
Trinidad and Tobago
We have interests in three concessions with producing fields: Central Block (Shell interest 65%), North Coast Marine Area (Shell interest 80.5%) and East Coast Marine Area (Shell interest 100%), where in July 2024 we took an FID on the Manatee project.
In 2024, we signed a Sales and Purchase Agreement (SPA) with Touchstone Exploration Trinidad Limited for the sale of our interest in the Central Block facility. We expect to complete this transaction in the first half of 2025.
We have a 100% interest in exploration blocks 5(c)REA, 5(d) and 6(d). We also have a 50% interest in exploration blocks 25a, 25b and 27 in the Columbus Basin. We operate Block 27 and bp is the operator of the remaining two. Furthermore in 2024, we signed the PSC for modified block U(c) (Shell share 100%).
Other
We also have interests in Barbados, Colombia, Cyprus, Tanzania and Venezuela.
Trading and Optimisation
Our trading organisation markets and sells a portion of our share of equity production of LNG and third-party LNG through our UK, UAE and Singapore trading hubs. We have term sales contracts for most of our LNG liquefaction and term purchase contracts. Our shipping network, regasification terminals, and ability to buy and deliver spot cargoes from third parties enable us to optimise the income we generate from our LNG cargoes. For example, if a customer no longer needs a scheduled cargo, we can deliver it to another customer. Similarly, if a customer needs an additional cargo not available from our own production, we contract with third parties to deliver that cargo. We conduct paper trades, primarily to manage commodity price risk related to sales and purchase contracts.
Strategic Report | Performance in the year | Generating shareholder value | Integrated Gas continued
| | | | | | | | | | | | | | |
|
| | | | |
| Increasing natural gas and LNG production in Australia We continue to grow our natural gas and liquefied natural gas (LNG) businesses in Queensland, Australia, by supplying increasing volumes of natural gas to the domestic market and LNG to customers in Asia. Shell QGC (Shell interest between 44% and 74%) produces natural gas from wells drilled into coal seams in the Surat Basin. Extending across several thousand square kilometres, Shell QGC's operations span around 3,500 wells (gross), gas processing infrastructure and the two-train Shell-operated QCLNG facility on Curtis Island. In 2024, QGC celebrated 10 years of LNG production and export by achieving its highest production levels ever. We also announced plans to develop Phase 2 of Arrow Energy's Surat Gas Project (Shell interest 50%, non-operated) in Queensland, which is expected to contribute around 22,400 barrels of oil equivalent (130 million standard cubic feet) per day at peak production. First gas is expected in 2026. Gas from the project will flow to Shell's QCLNG facility to meet long-term contracts and supply domestic customers. Long-term supplies of Australian LNG can help support the energy security and net-zero emission ambitions of countries in Asia. QCLNG has shipped more than 1,100 cargoes of LNG to customers since it began operating in 2014. The increase in production capacity at QGC and Arrow Energy will make a significant contribution to Shell's plan to grow its LNG business. | | Shell QGC has long used advanced technology such as sensors, drones and satellites to detect potential methane leaks from its extensive infrastructure and improve emissions reporting. This has helped QGC reduce reported methane emissions by 70% compared with 2016. Shell's aim is to maintain methane emissions intensity for global operated oil and gas assets below 0.2%, which we met in 2024, and achieve near-zero methane emissions by 2030 [A]. Shell QGC contributes significantly to Australia's economy through the stable supply of gas for power generation, manufacturing and transport. It also supports local communities through employment programmes and initiatives, and provides educational support, skills development training and economic development assistance for First Nations people and communities. In 2024 alone, Shell QGC spent AUD 322 million with local suppliers in regional Queensland. 1. Shell QGC is a leading natural gas producer in Queensland, Australia. QGC includes a two-train LNG facility (pictured), which produces LNG for international markets. 2. Staff at Shell QGC's training centre in Chinchilla, Queensland. Shell QGC has employed more than 400 apprentices and trainees in the past decade. [A]On an intensity basis. | |
| | | | |
Strategic Report | Performance in the year | Generating shareholder value
| | | | | | | | | | | | | | | | | | | | |
| | The Upstream segment includes exploration and extraction of crude oil, natural gas and natural gas liquids. It also markets and transports oil and gas, and operates the infrastructure necessary to deliver them to the market. Shell has activities in deep water and conventional oil and gas. | |
| | | | | | |
| | 7.8 Segment earnings ($ billion) (2023: 8.5) | | | 8.4 Adjusted Earnings ($ billion) (2023: 9.8) | |
| | 21.2 Cash flow from operating activities ($ billion) (2023: 21.5) | | | 1,831 Production (thousand boe/d) (2023: 1,800) | |
| | | | | | |
Strategic Report | Performance in the year | Generating shareholder value | Upstream continued
In 2024, Upstream delivered consistent performance through improved operations, cost reductions, portfolio optimisation and strategic investments. Our assets improved their availability and reliability, and we completed several major scheduled maintenance activities ahead of time, paving the way for higher production. We reached several milestones as part of our strategy to focus on high-margin basins, including investments in projects like the Atapu-2 field, which will increase our offshore production capacity in Brazil, and achieving first gas from Malaysia's Jerun field. We also took the final investment decision on the Vito waterflood project in the Gulf of America, and on Bonga North in the Gulf of Guinea — demonstrating how we can secure long-term value from existing assets. Our Whale platform, also in the Gulf of America, started production in January 2025 and is an example of how we are building on four decades of deep-water expertise and replicating innovative projects for more value. See "Outlook" on pages 23-24 for our Capital Markets 2025 investor update.
Business conditions
For the business conditions relevant to Upstream, see "Market overview" on pages 45-47.
Financial delivery
Earnings 2024-2023
Segment earnings decreased by $768 million compared with 2023. This reflected unfavourable tax movements ($1,289 million), lower realised prices (a decrease of $949 million) and higher well write-offs (an increase of $541 million), partly offset by the comparative favourable impact of $962 million mainly relating to gas storage effects. Segment earnings in 2024 also included a loss of $325 million related to the impact of the weakening Brazilian real on a deferred tax position, net impairment charges and reversals of $323 million and charges of $214 million related to redundancy and restructuring, partly offset by gains of $638 million related to the impact of inflationary adjustments in Argentina on a deferred tax position. These charges and gains are part of identified items and compare with 2023, where segment earnings included net impairment charges and reversals of $642 million, and net charges of $295 million related to the impact of the weakening Argentine peso and strengthening Brazilian real on a deferred tax position.
Adjusted Earnings and Adjusted EBITDA were driven by the same factors as the segment earnings and adjusted for identified items.
Prior year earnings summary
Segment earnings, compared with 2022, mainly reflected lower realised oil and gas prices (decrease of $5,696 million) and lower volumes (decrease of $2,001 million).
Segment earnings in 2023 also included net impairment charges and reversals of $642 million, and net charges of $295 million, which related to the impact of the weakening Argentine peso and strengthening Brazilian real on a deferred tax position. These charges and gains are part of identified items and compare with 2022, where segment earnings included net impairment reversals and charges of $853 million, and charges of $1,385 million relating to the EU solidarity contribution and $802 million relating to the UK Energy Profits Levy.
Adjusted Earnings and Adjusted EBITDA were driven by the same factors as the segment earnings and adjusted for identified items.
* Non-GAAP measure (see page 337).
| | | | | | | | | | | |
| $ million, except where indicated |
| 2024 | 2023 | 2022 |
Segment earnings [B] | 7,772 | 8,540 | 16,258 |
Identified items | (623) | (1,267) | (1,096) |
| Adjusted Earnings* [B] | 8,395 | 9,806 | 17,355 |
| Adjusted EBITDA* [B] | 31,264 | 30,622 | 42,144 |
Cash flow from operating activities* | 21,244 | 21,450 | 29,641 |
Cash capital expenditure | 7,890 | 8,343 | 8,143 |
| Liquids production available for sale (thousand b/d) | 1,320 | 1,325 | 1,333 |
| Natural gas production available for sale (million scf/d) | 2,964 | 2,754 | 3,272 |
| Total production available for sale (thousand boe/d) | 1,831 | 1,800 | 1,897 |
[A]See Note 7 to the "Consolidated Financial Statements" which includes an explanation of the reporting segment changes applicable from 2024.
[B]Segment earnings, Adjusted Earnings, and Adjusted EBITDA are presented on a current cost of supplies basis.
Cash flow from operating activities
Cash flow from operating activities for 2024 was primarily driven by Adjusted EBITDA, partly offset by tax payments of $7,851 million and the timing impact of dividends (net of profits) from joint ventures and associates of $946 million.
Shell's policy is to settle the inter-segment use of tax attributes between business segments. This settlement is usually made in cash but in certain instances there is no cash settlement. In 2024, the Integrated Gas segment's deferred tax assets ($974 million) were mainly used by the Upstream ($759 million) and Chemicals and Products ($183 million) segments, for which no cash settlement was made.
Cash capital expenditure
Cash capital expenditure in 2024 was lower compared with 2023. The decrease was mainly a result of projects ramp-up in the Gulf of America and Brazil in 2023. This was partially offset by higher spend from projects in Nigeria and the UK in 2024. Cash capital expenditure is expected to be around $7 billion in 2025.
Operational performance
Production available for sale
In 2024, liquids production was flat and natural gas production increased by 8%, compared with 2023.
Total production, compared with 2023, increased mainly due to new liquids and gas production, partly offset by field decline.
Strategic progress
Portfolio and business developments
Significant portfolio and business developments:
○In May 2024, the Petrobras-operated Atapu consortium (Shell interest 16.7%) announced a final investment decision (FID) for the Atapu-2 project, a second floating production, storage and offloading (FPSO) vessel to be deployed at the Atapu field in Brazil's offshore Santos basin.
○In July 2024, first gas was achieved at the Jerun field (Shell interest 30%) in Malaysia. Jerun is operated by SapuraOMV Upstream (40%) in partnership with our subsidiary Sarawak Shell Berhad and PETRONAS Carigali Sdn Bhd (30%).
○In August 2024, we announced an FID on a waterflood project at our Vito asset in the Gulf of America. Water will be injected into the reservoir formation to displace additional oil.
Strategic Report | Performance in the year | Generating shareholder value | Upstream continued
○In October 2024, we announced the start of production of the FPSO Marechal Duque de Caxias in the Mero field, in the pre-salt area of the Santos Basin, offshore Brazil. Also known as Mero-3, the FPSO has an operational capacity of 180,000 barrels of oil per day (Shell share 19.3%).
○In December 2024, we, along with Equinor ASA, announced to combine our UK offshore oil and gas assets and expertise to form a new company which will be the UK North Sea's biggest independent producer. On deal completion, the new independent producer will be jointly owned by Equinor (50%) and Shell (50%). Completion of the transaction remains subject to approvals and is expected by the end of 2025.
○In December 2024, we announced a final investment decision (FID) on Bonga North, a deep-water project off the coast of Nigeria. Shell (55%) operates the Bonga field in partnership with Esso Exploration and Production Nigeria Ltd. (20%), Nigerian Agip Exploration Ltd. (12.5%), and TotalEnergies Exploration and Production Nigeria Ltd. (12.5%), on behalf of the Nigerian National Petroleum Company Limited.
○In January 2025, we announced the start of production at the Shell-operated Whale floating production facility in the Gulf of America. The Whale development is owned by Shell (60%, operator) and Chevron U.S.A. Inc. (40%).
○In February 2025, we announced production restart at the Penguins field in the UK North Sea with a modern floating, production, storage and offloading (FPSO) facility (Shell 50%, operator; NEO Energy 50%). The previous export route for this field was via the Brent Charlie platform, which ceased production in 2021 and is being decommissioned.
○In February 2025, we signed an agreement to acquire a 15.96% working interest from ConocoPhillips Company (COP) in the Shell-operated Ursa platform in the Gulf of America. Shell's working interest in the platform, pipeline and associated fields will increase from around 45.39% to a maximum of 61.35%. The transaction is subject to regulatory and other conditions, and is expected to be completed by the end of the second quarter of 2025.
○On March 13, 2025, we completed the sale of The Shell Petroleum Development Company of Nigeria Limited (SPDC) to Renaissance.
Business and property
Our subsidiaries, joint ventures and associates are involved in all aspects of upstream activities. These activities include land tenure and the exploration, development and production of crude oil, natural gas and natural gas liquids. They also include the marketing and transportation of oil and gas, as well as the operation of the infrastructure necessary to deliver them to market.
The conditions of the leases, licences and contracts under which oil and gas interests are held vary from country to country. In almost all cases outside North America, legal agreements are generally granted by, or entered into with, a government, state-owned company, government-run oil and gas company or agency. The exploration risk usually rests with the independent oil and gas company. In North America, these agreements may also be with private parties that own mineral rights. Of these agreements, the following are most relevant to our interests:
○Licences (or concessions), which entitle the holder to explore for hydrocarbons and exploit any commercial discoveries. Under a licence, the holder bears the risk of exploration, development and production activities, and is responsible for financing these activities. In principle, the licence holder is entitled to the totality of production less any royalties in kind. The government, state-owned company or government-run oil and gas company may sometimes enter into a joint arrangement as a participant, sharing the rights and obligations of the licence but usually without sharing the exploration risk. In a few cases, the state-owned company, government-run oil and gas company or agency has an option to purchase a certain share of production.
○Lease agreements, which are typically used in North America and are usually governed by terms similar to licences. Participants may include governments or private entities. Royalties are paid either in cash or in kind.
○Production-sharing contracts (PSCs) entered into with a government, state-owned company or government-run oil and gas company. PSCs generally oblige the independent oil and gas company, as contractor, to provide all the financing and bear the risk of exploration, development and production activities in exchange for a share of the production. Usually, this share consists of a fixed or variable part that is reserved for the recovery of the contractor's cost (cost oil). The remaining production is split with the government, state-owned company or government-run oil and gas company on a fixed or volume/revenue-dependent basis. In some cases, the government, state-owned company or government-run oil and gas company will participate in the rights and obligations of the contractor and will share in the costs of development and production. Such participation can be across the venture or on a field-by-field basis. Additionally, as the price of oil or gas increases above certain predetermined levels, the independent oil and gas company's entitlement share of production normally decreases, and vice versa. Accordingly, its interest in a project may not be the same as its entitlement.
Europe
Germany
Shell is a 50% shareholder in BEB Erdgas und Erdoel GmbH & Co. KG (BEB), which owns interests in various concessions, mainly in Lower Saxony. ExxonMobil Production Deutschland GmbH has a service contract with BEB, under which it provides operating services to BEB for most of the concessions.
Italy
Shell has a 39% interest in the Val d'Agri producing concession, operated by ENI S.p.A., and a 25% interest in the Tempa Rossa producing concession, operated by TotalEnergies EP Italia S.p.A.
Netherlands
Shell and ExxonMobil are 50:50 shareholders in Nederlandse Aardolie Maatschappij B.V. (NAM). NAM holds a 60% interest in the onshore low-calorific Groningen gas field (the remaining 40% interest is held by EBN, a Dutch government entity), the Schoonebeek oil field, some 25 smaller hydrocarbon production licences and two underground gas storage facilities.
Historical production from the Groningen field induces earthquakes which have led to damage claims, security concerns, and a strengthening operation to make buildings earthquake resistant.
In June 2018, NAM's shareholders and the Dutch government signed a Heads of Agreement (HoA) to inter alia reduce, and eventually cease, production from the Groningen field. Under the terms of the HoA, it was agreed that the Dutch government would pass on to NAM costs insofar as the costs corresponded to NAM's liability. Further agreements were signed to implement the HoA. Shell has put in place an appropriate security to fulfil its obligation under the HoA.
NAM is working with the Dutch government to fulfil its financial obligations for earthquake costs. These include compensating for damage caused by the earthquakes and paying to strengthen houses where this is required for safety. In 2022, NAM started arbitrations with the Dutch government to have its financial liability determined for the costs the Dutch government has charged to NAM in relation to the strengthening operation and the handling of claims for physical damage to property. The outcomes of these arbitrations are expected in 2025.
Strategic Report | Performance in the year | Generating shareholder value | Upstream continued
On the instructions of the Dutch government, production at the Groningen field ceased on October 1, 2023, and a law was passed to shut down the field permanently from April 19, 2024. On July 18, 2024, NAM signed an agreement to divest OneGas East, its offshore asset in the Dutch North Sea, to Tenaz Energy. The transaction is expected to be completed by mid-2025.
| | | | | |
| |
| See Note 32 NAM (Groningen gas field) litigation in the "Consolidated Financial Statements" on page 293. |
| |
Norway
Shell holds participating interests in 15 production licences on the Norwegian continental shelf, and is the operator of three of these. In 2024, Shell was awarded one new licence, relinquished four licences and divested the Linnorm gas field. Shell has participating interests in two producing gas fields in Norway: Shell-operated Ormen Lange (Shell interest 17.8%) and Equinor-operated Troll (Shell interest 8.19%). In 2024, significant projects were executed at both assets. The Troll B and C platforms were partially electrified, which is expected to reduce annual emissions of CO2 by 250,000 tonnes. At Ormen Lange, subsea compression, powered from shore, is being installed to enhance gas recovery.
Additionally, Shell holds a 10% participating interest in the Irpa gas discovery, operated by Equinor, which is under development. We operate two licences which are being decommissioned: Knarr and Gaupe. We are also the technical service provider for the Nyhamna gas facility, operated by Gassco, which processes and exports gas from several Norwegian fields.
UK
Shell operates a number of assets on the UK continental shelf, mostly under unincorporated joint-venture agreements. Shell also has non-operated positions in the West of Shetland area, including the Clair (Shell interest 27.97%) and Schiehallion (Shell interest 44.89%) fields, which are both operated by bp.
In December 2024, Shell, along with Equinor ASA, announced a combination of our UK offshore oil and gas assets and expertise to form a new company which will be the UK North Sea's biggest independent producer. On deal completion, the new independent producer will be jointly owned by Equinor (50%) and Shell (50%). Completion of the transaction remains subject to approvals and is expected by the end of 2025.
In April 2023, Shell restarted operations at the Pierce field (Shell interest 92.5%) in the North Sea after a major redevelopment to enable gas production after years of the field producing only oil. The Haewene Brim floating production, storage and offloading (FPSO) vessel, which produces from the Pierce field, was shut down between August 2023 and April 2024 to allow completion of mooring lines integrity works. The FPSO vessel is fully operational and back in production.
The operated Penguins FPSO vessel (Shell interest 50%) was successfully moored in the northern North Sea in September 2024 with first oil in February 2025.
Victory (Shell interest 100%), a subsea tieback to the Total-operated Greater Laggan Area facilities, is on track for an expected start-up in 2026. Priority work activities for 2024 were delivered ahead of schedule with new subsea pipelines installed in preparation for well execution in 2025.
Significant progress has also been made on the Jackdaw project (Shell interest 100%) in the North Sea and it is expected to become operational in the mid-2020s. On January 29, 2025, the Court of
Session (Outer House) in Scotland ruled, in legal proceedings brought by the non-governmental organisation, Greenpeace, that the original consents for Jackdaw are no longer valid, though importantly, work on the project can continue while new consents are being sought. This ruling has not been appealed.
Within Shell's UK exploration portfolio, there is an ongoing judicial review by Oceana UK challenging the award of tranche three of the 33rd licensing round awards (including two licences awarded to Shell in the Mid-North Sea High area) which is expected to be heard by the High Court in March 2025.
In July 2024, Shell signed an agreement with RockRose Energy Limited, a subsidiary of Viaro Energy, to divest its equity stake in 11 gas fields and one exploration prospect in the UK Southern North Sea, as well as the onshore gas processing terminal in Bacton, England. The sale is subject to regulatory approvals and is expected to complete in 2025.
In July 2023, the UK government announced that the Acorn carbon capture, utilisation and storage project (Shell interest 30%) had been selected as one of two clusters to enter Track 2 of the UK's cluster sequencing process for carbon capture and storage (CCS). In 2024, Shell had expected to start more detailed discussions about the project with the UK government, but these have not yet commenced in earnest.
The Offshore Petroleum Regulator for Environment and Decommissioning (OPRED) continues to assess the Brent Field decommissioning programme for the Brent gravity-based substructures. The Brent Charlie topside was lifted and transported to shore in July 2024.
Decommissioning of the Heather A platform and Curlew FPSO asset continued in 2024. Shell is also continuing with the campaign of subsea well plug and abandonment activity to decommission 25 wells in the Central North Sea which began in 2023.
Rest of Europe
Shell also has interests in Albania.
Asia (including the Middle East)
Brunei
Shell and the Brunei government are 50:50 shareholders in Brunei Shell Petroleum Company Sendirian Berhad (BSP). BSP has long-term onshore and offshore oil and gas concession rights and sells most of its gas production to Brunei LNG Sendirian Berhad, with the remainder sold in the domestic market.
In addition to our interest in BSP, we have a non-operated 35% interest in the offshore Block B concession, which is operated by Hibiscus Petroleum. The gas and condensate are produced from the Maharaja Lela field.
We have a non-operated 20% interest under a PSC in a gas-holding area for deep-water Block CA2, which is operated by Petronas.
We operate the deep-water Block CA1 (Shell interest 86.95%) in which the Jagus East field is located and forms part of the unitised GKGJE field under a PSC. As referred to in the Malaysia section the unitised GKGJE field is operated by Shell Malaysia.
| | | | | |
| |
| See "Integrated Gas" on pages 48-54. |
| |
Iraq
Shell has a 44% interest in the Basrah Gas Company, which gathers, treats and processes associated gas that was previously flared from the Rumaila, West Qurna 1 and Zubair fields. Processed gas and associated products, such as condensate and LPG, are sold to the domestic and international markets.
Strategic Report | Performance in the year | Generating shareholder value | Upstream continued
| | | | | | | | |
|
| | |
| Karachaganak Expansion Project 1A completed Karachaganak is one of the world's largest gas and condensate fields. It produces around 260,000 barrels of oil and condensate per day, which are processed by Karachaganak Petroleum Operating B.V. (KPO) for export. Shell is the joint operator, along with Eni, of the Karachaganak field (Shell interest 29.3%). In 2024, KPO completed the Karachaganak Expansion Project 1A (KEP1A) to maintain production levels and extend the field's long productive life by reinjecting gas into the reservoir through a new fifth gas compressor. Around 7,000 local people were employed during construction. The project was completed one month ahead of schedule, after starting in December 2020, and was delivered within budget. This success can be attributed to the resilience of the team who worked hard to achieve the result, despite the disruption caused by the COVID-19 pandemic and the nearby Russia‒Ukraine war. KEP1A is a key example of Shell's focus on performance and discipline. KPO is now working on the installation of a sixth gas reinjection compressor as part of Karachaganak Expansion Project 1B to maintain pressure in the reservoir and keep production levels stable. The project is scheduled for completion in 2026. | |
| Photo: Staff at Karachaganak, Kazakhstan. | |
| | |
Kazakhstan
Shell is the joint operator with ENI S.p.A. of the onshore Karachaganak oil and condensate field (Shell interest 29.3%) in north-west Kazakhstan which covers more than 280 square kilometres.
We also have a 16.8% interest in the North Caspian Sea PSA, which includes the Kashagan field in the Kazakh sector of the Caspian Sea. The North Caspian Operating Company is the operator. This shallow-water field covers around 3,400 square kilometres.
Shell has a 7.4% interest in the Caspian Pipeline Consortium (CPC), which owns and operates an oil pipeline running from the Caspian Sea to the Black Sea across parts of Kazakhstan and Russia. We hold our interest in the CPC via three legal entities. Two of these are wholly owned by Shell and the other is a joint venture with Rosneft, Rosneft-Shell Caspian Ventures Ltd (Cyprus) (RSCV) (Shell interest 49%), which was formed in 1996 to own and manage pipeline capacity rights. We continue to manage our interest in CPC held through RSCV in full compliance with applicable laws, including sanctions.
We have several matters in dispute involving non-operated ventures and the Republic of Kazakhstan, including court proceedings in respect of a sulphur permitting outcome and two arbitrations under the applicable production-sharing agreements. There remains a high degree of uncertainty regarding the outcomes, as well as the potential effect on future operations, earnings, cash flows and Shell's financial condition.
| | | | | |
| |
| See Note 32 to the "Consolidated Financial Statements" on pages 292-294. |
| |
Kuwait
Shell Kuwait Exploration and Production B.V. (Shell interest 100%) holds three enhanced technical service agreements (ETSA) with Kuwait Oil Company. The ETSA Jurassic Gas runs to 2026, the ETSA Heavy Oil and ETSA Conventional Oil run to 2027.
Malaysia
Shell explores for and produces oil and gas off the coast of Sabah and Sarawak under 20 PSCs, in which our interests range from 20% to 92.5%.
Offshore Sabah
We operate two producing oil fields: the Malikai deep-water field (Shell interest 35%) in the Block G PSC, and the unitised Gumusut-Kakap Geronggong-Jagus East (GKGJE) field in the Block J PSC which straddles the Malaysia-Brunei border (Shell interest 37.89%).
We hold a 50% operated participating interest in exploration phase Block 2W, Block X, Block ND6 and Block ND7 PSCs. Our exploration activities in Block ND6 and Block ND7 PSCs were suspended in 2005 because of Malaysia's border disputes with Indonesia.
Our non-operated portfolio includes two producing fields: the unitised Siakap North-Petai deep-water field in Block G PSC (Shell interest 21%) and the Kebabangan Cluster PSC (Shell interest 30%). We also hold interests in exploration phase Block SB 2K, Block N and Block 2V PSCs, which range from 25.1% to 40%. In 2024, we signed a new non-operated PSC for Ubah Cluster, a deep-water project off the coast of Sabah (Shell interest 35%).
Offshore Sarawak
We are the operator of four PSCs producing gas and oil, holding interests ranging from 30% to 75% under the MLNG, SK308, SK408 and SK318 PSCs. Nearly all the gas produced offshore Sarawak is supplied to Malaysia LNG (MLNG) and to our gas-to-liquids plant in Bintulu. We also continue to explore in the MLNG PSC.
Photo: The Jerun offshore gas field (Shell interest 30%) in Malaysia achieved first gas in July 2024, adding to Shell's contribution to Malaysia's offshore gas production.
Strategic Report | Performance in the year | Generating shareholder value | Upstream continued
The SK318 PSC contains the Timi field (Shell interest 75%), the unitised Rosmari field (Shell interest 68%) and the unitised Marjoram field (Shell interest 72%). Rosmari-Marjoram is a natural gas project situated around 220 kilometres off the coast of Bintulu, comprising a remotely operated offshore platform and onshore gas plant. These fields will mainly be powered by renewable energy from solar power offshore and hydroelectric power onshore.
We hold participating interests ranging from 45% to 92.5% in the exploration phase Block SK437, Blocks SK439/440 and Block 3B PSCs. In 2024, we signed a new PSC for Block 5E (Shell interest 50%), a deep-water block off the coast of Sarawak.
In our non-operated portfolio, we hold a 20% interest in the Pegaga field under the Block SK320 PSC and a 30% interest in the Jerun, Larak and Bakong fields which are part of the SK408 PSC. Jerun achieved first gas in July 2024.
| | | | | |
| |
| See "Integrated Gas" on pages 48-54. |
| |
Oman
Shell has a 34% interest in Petroleum Development Oman (PDO), which operates the Block 6 oil concession. Shell is entitled to 34% of oil produced from Block 6 through its interest in Private Oil Holdings Oman Ltd. The government of Oman has a 60% interest in PDO and the Block 6 oil concession through its wholly owned company, Energy Development Oman (EDO). PDO operates a concession area of about 90,000 square kilometres and has more than 200 producing oil fields.
We have a 50% interest in Block 42 under an exploration and production-sharing agreement (EPSA) where Shell is the operator. We also operate in Block 55 under an EPSA (Shell interest 100%). We are in the process of relinquishing our interests in Block 42 and Block 55 to the government.
| | | | | |
| |
| See "Integrated Gas" on pages 48-54. |
| |
Syria
Shell holds a 65% interest in Syria Shell Petroleum Development B.V. (SSPD), a joint venture between Shell and the China National Petroleum Corporation. SSPD holds a 31.25% interest in Al Furat Petroleum Company, a Syrian joint stock company whose role was to perform petroleum operations. Shell also holds a 70% interest in two exploration licences via Shell South Syria Exploration B.V. In December 2011, in compliance with international sanctions on Syria, including European Council Decision 2011/782/CFSP, Shell suspended all exploration and production activities in Syria as well as its participation and/or support in activities related to Al Furat Petroleum Company. SSPD continued to fulfil minimum contractual obligations towards the Syrian finance and labour ministries, in compliance with applicable trade control laws. In 2024, as part of the minimum contractual obligations, payments for taxes related to salary and social security amounted to $282. In addition, in 2024, in compliance with applicable sanctions on Syria, we reimbursed an employee $713.05 for the renewal of his and his son's Syrian passport, which was paid to the Syrian Embassy in Kuwait.
Rest of Middle East and Asia
Shell has certain interests in the United Arab Emirates including a 15% shareholding in the Abu Dhabi Gas Industries Limited ("ADNOC Gas Processing") operating joint venture which is a key supplier of natural gas in the country.
Africa
Nigeria
In 2024, Shell operated a number of interests in onshore and offshore oil exploration and production assets in Nigeria.
| | | | | |
| |
| See "Risk factors" on pages 28. |
| |
Onshore
The Shell Petroleum Development Company of Nigeria Limited (SPDC) is the operator of the SPDC joint venture (SPDC JV, Shell interest 30%) which has 15 Niger Delta onshore oil mining leases (OMLs) and three shallow-water leases (OML 74, 77 and 79).
On March 13, 2025, Shell completed the sale of SPDC to Renaissance. As part of the transaction and ongoing business arrangements, Shell provided loan facilities for amounts up to $2.5 billion. Shell will continue to support Renaissance in the development of its gas reserves and retain an interest in the performance of the export feedgas business.
Offshore
Our main offshore deep-water activities are carried out by our wholly owned subsidiary Shell Nigeria Exploration and Production Company Limited (SNEPCo). SNEPCo has interests in three deep-water blocks that are under PSC terms: the producing assets Bonga (OML 118) and Erha (OML 133), and the non-producing asset Bolia Chota (OML 135). SNEPCo operates OML 118 (Shell interest 55%), including the Bonga field FPSO vessel. We also operate OML 135 (Shell interest 55%), encompassing the Bolia and Doro fields. We have a 43.8% non-operated interest in OML 133 (including the Erha FPSO). In addition, SNEPCo holds a 40% interest in a non-producing shallow-water lease (OML 144) that is held in a joint venture with Sunlink Energies.
In December 2024, we announced a final investment decision (FID) on Bonga North (OML 118), a deep-water project off the coast of Nigeria.
Authorities have investigated our involvement in the 2011 settlement of litigation pertaining to OPL 245. In January 2020, criminal charges alleging disobeying direction of law related to tax waivers were filed in Nigeria against Shell Nigeria Ultra Deep Ltd., SNEPCO, and third parties including Nigeria Agip Exploration Limited (NAE). In March 2024, the Court approved the defendant's no-case submission and dismissed the charges against all defendants.
| | | | | |
| |
| See Note 32 to the "Consolidated Financial Statements" on pages 292-294 for more information about OPL 245. |
| |
Business update
Security issues, sabotage and crude oil theft in the Niger Delta continued and remained significant challenges to our onshore operations in 2024. We will continue to monitor the situation closely and evaluate implications for the integrity of our infrastructure and the sustainability of our current operations. We continue to put the safety of our employees and contractors first.
In our Nigerian operations, we face various risks and adverse conditions which could have a significant adverse effect on our operational performance, earnings, cash flows and financial condition.
| | | | | |
| |
| See "Respecting nature" on pages 124-128. |
| |
Strategic Report | Performance in the year | Generating shareholder value | Upstream continued
There are limitations to the extent to which we can mitigate these risks. We monitor the security situation and liaise with host communities, and governmental and non-governmental organisations to help promote peaceful and safe operations for our people and local communities. We test the economic and operational resilience of our Nigerian projects against a range of assumptions and scenarios. When we participate in joint ventures in Nigeria, we require that they operate in accordance with good industry practice. We seek to proportionally share risks and funding commitments with joint-venture partners. As a result of the completion of the sale of SPDC, our exposure to the risks arising from onshore operations is expected to reduce. Shell has other businesses in Nigeria that are outside the scope of the announced transaction.
| | | | | |
| |
| See "Risk factors" on page 28. |
| |
We support the Nigerian government's efforts to improve the efficiency, functionality and domestic benefits of Nigeria's oil and gas industry. We report spills and how we respond to spills, including those that are caused by third-party interference. We implement a maintenance strategy to support sustainable equipment reliability and we have a multi-year programme to reduce routine flaring of associated gas.
| | | | | |
| |
| See "Our journey to net zero" on page 112. |
| |
Rest of Africa
Shell also has interests in Algeria, Namibia, São Tomé and Príncipe, South Africa and Tunisia.
In 2021, Shell announced plans to hand back upstream assets associated with the Miskar and Hasdrubal concessions to the government of Tunisia. In June 2022, Shell handed back the Miskar concession upon its expiry. Discussions are ongoing with the competent authorities for the hand-back/relinquishment of Hasdrubal concession.
North America
USA
The majority of our oil and gas interests in the USA comprise leases for federal offshore blocks in the deep waters of the Gulf of America. Such leases usually have a fixed primary term and, once production is established, remain in effect through continued production, subject to compliance with the relevant terms and provisions (including applicable laws and regulations).
In 2024, we relinquished our interest in one licence in the North Slope area of Alaska.
Gulf of America
Shell's major production area in the USA is the Gulf of America. We have a total of 304 active federal offshore leases where Shell is the operator, and 62 active federal offshore leases where Shell has a non-operated interest.
We are the operator of 10 production hubs: Mars (Shell interests 33.7% to 100%), Olympus (Shell interests 71.5% to 100%), Auger (Shell interests 27.5% to 100%), Perdido (Shell interests 33.3% to 40%), Ursa (Shell interests 45.4% to 100%), Enchilada/Salsa (Shell interests 37.5% to 75%), Appomattox (Shell interests 79% to 80%), Vito (Shell interest 63.1%), Stones (Shell interest 100%) and Whale (Shell interest 60%). We also have an interest in the West Delta 143 offshore processing facilities (Shell interest 71.5%).
We continue to produce from the Coulomb field (Shell interest 100%), which ties into the Na Kika platform (Shell interest 50%) and which is co-owned and operated by BP Exploration and Production Inc.
We continued exploration, development and decommissioning activities in the Gulf of America in 2024.
In February 2024, we began production at Rydberg (Shell interest 80%), a subsea tie-back to the Shell-operated Appomattox production hub (Shell interest 79%). Rydberg is expected to produce up to 16,000 barrels of oil equivalent per day (boe/d) at peak rates expected between September 2025 to January 2026.
In August 2024, an FID was taken on a waterflood project at Vito where water will be injected into the reservoir formation to displace additional oil. The process is due to begin in 2027 and is expected to enhance volume capacity at the Vito field.
In December 2024, FID was announced on a Phase 3 Silvertip project, which will deliver two wells to boost production at the Shell-operated Perdido spar. These wells, located in the Silvertip Frio reservoir (Shell interest 40%), are expected to collectively produce up to 6,000 barrels of oil equivalent per day (boe/d) at peak rates. First production is expected in 2026.
In January 2025, we began production at the Shell-operated Whale stand-alone host (Shell interest 60%). Whale is expected to produce up to 100,000 boe/d at peak rates in 2027.
In February 2025, we signed an agreement to acquire a 15.96% working interest from ConocoPhillips Company (COP) in the Shell-operated Ursa platform in the Gulf of America. Shell's working interest in the platform, pipeline and associated fields will increase from around 45.39% to a maximum of 61.35%. The transaction is subject to regulatory and other conditions, and is expected to be completed by the end of the second quarter of 2025.
Rest of North America
Shell also has deep-water licences and one shallow-water licence in Mexico, and we are in the process of relinquishing them to the government.
South America
Argentina
Shell has interests in the onshore Vaca Muerta Basin in the Neuquén Province. We are the operator of the Cruz de Lorena, Sierras Blancas, Coiron Amargo Sur Oeste (Shell interest 90% in each), and Bajada de Añelo (Shell interest 50%) areas. We have non-operated interests in the areas of Rincon La Ceniza and La Escalonada (Shell interest 45% in each), both operated by Total Austral S.A., and in the Bandurria Sur area (Shell interest 30%), operated by YPF S.A. Shell has a participating interest in the oil pipeline connecting Sierras Blancas and the regional distribution network and is the administrator in the joint property agreement that regulates its operation (Shell interest 60%). Shell also has a participating interest in the oil pipeline in the northern area of the basin which connects to the Pacific Evacuation Route (Shell interest 13.3%), operated by YPF S.A.
In the north-western Argentina basin, we have a non-operated interest in the onshore Acambuco area (Shell interest 22.5%), operated by Pan American Energy.
In addition to the producing interests, we are the operator of two frontier exploration blocks offshore Argentina (Shell interest 60% in each), and we have a non-operated interest in an adjacent block (Shell interest 30%) operated by Equinor.
Strategic Report | Performance in the year | Generating shareholder value | Upstream continued
Brazil
Shell's operates the Bijupirá and Salema fields (Shell interest 80% in each), which are being decommissioned; the producing BC-10 field (Shell interest 50%) in the Campos Basin; and the Gato do Mato and adjacent Sul de Gato do Mato areas in the Santos Basin (Shell interest 50%), which are subject to unitisation and with development options under evaluation. We also hold interests in 11 exploration blocks in the Santos Basin (Shell interests 70%), six exploration blocks in the Barreirinhas Basin (Shell interests 50% to 100%), three in the Campos Basin (Shell interests 40% to 100%) and one in the Potiguar Basin (Shell interest 100%).
Our non-operated portfolio consists of eight producing fields in the offshore Santos Basin:
○the Sapinhoá field (Shell interest 30%, operated by Petrobras and straddling the BM-S-9 and Entorno de Sapinhoá blocks already unitised);
○the Lapa field (Shell interest 30% in Block BM-S-9A, operated by TotalEnergies);
○the Berbigão and Sururu fields (Shell interest 25% in Block BM-S-11A, operated by Petrobras and subject to ongoing unitisation agreement discussions);
○the Atapu field (Shell interest 16.7% and straddling the BM-S-11A and Atapu PSC area already unitised);
○the Tupi field (Shell interest 23%, already unitised, in Block BM-S-11 and operated by Petrobras);
○the Iracema field (Shell interest 25% in Block BM-S-11 and operated by Petrobras); and
○the Mero field in the Libra PSC area (Shell interest 19.3%, already unitised with an adjoining open area and operated by Petrobras).
In addition to the producing assets, we hold interests in 33 non-operated exploration blocks: two in the Santos Basin (Shell interests 20% to 40%, operated by Petrobras), two in the Potiguar Basin (Shell interests 40%, both operated by Petrobras) and 29 blocks in the Pelotas Basin (Shell interests 30%, all operated by Petrobras).
In October 2024, production started at the Marechal Duque de Caxias FPSO in the Mero field. Mero is expected to receive one more FPSO and start producing from it by the end of 2025.
Rest of South America
Shell also has interests in Suriname and Uruguay.
Trading and Supply
Shell markets and trades equity crude oil from its Upstream operations through our main trading offices in the UK, Singapore, the USA, The Bahamas and Canada. We are active in most crude oil markets and, with our global network of supply and distribution activities and shipping and maritime capabilities, we manage and optimise the supply of crude to Shell's refineries, and the sale of crude to third-party customers.
Strategic Report | Performance in the year | Generating shareholder value | Upstream continued
| | | | | | | | | | | | | | |
|
| | | | |
| Whale produces first oil in the Gulf of America The simplified and cost-efficient Whale platform started oil production in the Gulf of America in January 2025. Whale, operated by Shell, has an estimated peak production of 100,000 barrels of oil equivalent per day -- enough to fuel the daily journeys of 2.7 million cars in the USA. Whale is a close replica of the Shell-operated Vito platform, which started production in the Gulf of America in early 2023. Vito is significantly smaller than its original design, resulting in lower costs and emissions. Whale will operate with around 30% lower carbon intensity over its life cycle than Vito. Investments in oil and gas platforms such as Whale are needed to meet the world's energy demand while low-carbon alternatives are developed and made commercially available. Energy companies like Shell are finding ways to produce oil and gas with lower greenhouse gas emissions. Power turbines are one of the biggest producers of emissions on offshore platforms. To reduce emissions on Whale, engineers have fitted waste-heat recovery units to all its power turbines. These units capture energy that would otherwise be lost to the atmosphere. This energy is then reused to heat the raw fluids so they can be exported from the platform. The process of compressing gas before it is exported to the shore is another contributor to emissions on offshore facilities. To reduce these emissions on Whale, engineers have installed compressors which use less energy than a typical system. | |
Most of Whale's operations can be managed from New Orleans, which is about 600 kilometres away from the platform. Engineers use virtual reality headsets to carry out checks. They also deploy drones to inspect other areas, keeping the number of people needed on the platform to a minimum. Whale has been designed to hold just 60 people, compared with the 180 people that can live on the Shell-operated Appomattox platform in the Gulf of America, which started production in 2019. Weighing around 25,000 tonnes, Whale is a third of the weight of Appomattox. The smaller scale helped designers to cut the cost of building the facility. The Whale development is owned by Shell Offshore Inc. (60%) and Chevron U.S.A. Inc. (40%) and lies 320 kilometres south of Houston.
1. The Shell-operated Whale platform has a smaller footprint and lower carbon intensity over its life cycle than earlier platforms. 2. Whale is controlled by remote from New Orleans, some 600 km away. With just 60 people on board and a simplified, more energy-efficient design, Whale is reducing costs and emissions. | |
| | | | |
Strategic Report | Performance in the year | Generating shareholder value
Oil and gas information
This section sets out information about Shell's oil and gas exploration and production activities, which include the extraction of oil, condensates, natural gas liquids, oil sands and natural gas from their natural reservoirs. These activities are undertaken within the Integrated Gas, Upstream and the Chemicals and Products (includes oil sands) segments. They do not represent the full extent of the activities of these segments, and exclude GTL processing, some LNG activities, trading and optimisation, as well as other non-extractive activities.
| | |
| Proved developed and undeveloped reserves of Shell subsidiaries and Shell share of joint ventures and associates |
| | | | | | | | | | | | | | | |
| Crude oil and natural gas liquids
(million barrels) | Synthetic crude oil
(million barrels) | | Natural gas
(thousand million scf) | Total (million boe) |
| Shell subsidiaries | | | | | |
| At January 1, 2024 | 3,512 | 757 | | 23,276 | 8,283 |
| Increase/(decrease) in 2024: | | | | | |
| Revisions and reclassifications | 408 | (13) | | (82) | 381 |
| Improved recovery | 48 | — | | 7 | 49 |
| Extensions and discoveries | 52 | — | | 1,983 | 394 |
| Purchases and sales of minerals in place | 13 | 16 | | 100 | 46 |
| Total before taking production into account | 521 | 3 | | 2,008 | 870 |
| Production [A] | (507) | (19) | | (2,726) | (997) |
| Total | 14 | (16) | | (718) | (127) |
| At December 31, 2024 | 3,526 | 741 | | 22,558 | 8,156 |
| Shell share of joint ventures and associates | | | | | |
| At January 1, 2024 | 392 | — | | 6,453 | 1,504 |
| Increase/(decrease) in 2024: | | | | | |
| Revisions and reclassifications | (5) | — | | 148 | 21 |
| Improved recovery | — | — | | — | — |
| Extensions and discoveries | — | — | | 149 | 26 |
| Purchases and sales of minerals in place | — | — | | — | — |
| Total before taking production into account | (5) | — | | 297 | 47 |
| Production [B] | (24) | — | | (366) | (87) |
| Total | (29) | — | | (69) | (40) |
| At December 31, 2024 | 363 | — | | 6,384 | 1,464 |
| Totals | | | | | |
| At January 1, 2024 | 3,904 | 757 | | 29,729 | 9,787 |
| Increase/(decrease) before taking production into account | 516 | 3 | | 2,305 | 917 |
| Production | (531) | (19) | | (3,092) | (1,084) |
| Increase/(decrease) | (15) | (16) | | (787) | (167) |
| At December 31, 2024 [C] [D] [E] | 3,889 | 741 | | 28,942 | 9,620 |
Reserves attributable to non-controlling interest in
Shell subsidiaries at December 31, 2024 | — | 370 | | — | 370 |
[A]Includes 41 million boe consumed in operations (natural gas: 238 thousand million scf; synthetic crude oil: 1 million barrels).
[B]Includes 5 million boe consumed in operations (natural gas: 27 thousand million scf).
[C]On March 13, 2025, Shell completed the sale of its Nigerian onshore subsidiary The Shell Petroleum Development Company of Nigeria Limited (SPDC) which holds a 30% interest in the SPDC JV to Renaissance. As of December 31, 2024, Shell had proved reserves of 453 million boe in SPDC.
[D]Pursuant to Shell's 2017 agreement with Canadian Natural Resources Limited, its remaining mining interest and associated synthetic crude oil reserves will be swapped for an additional 10% interest in the Scotford Upgrader and Quest CCS project. The transaction is expected to close by the end of the first half of 2025, subject to regulatory approvals. The associated proved reserves as of December 31, 2024 were 741 million barrels (of which 50% attributable to non-controlling interest).
[E]On December 5, 2024, Shell and Equinor ASA, announced the combination of their UK offshore oil and gas assets and expertise to form a new company which will be the UK North Sea's biggest independent producer. On deal completion, the new independent producer will be jointly owned by Equinor (50%) and Shell (50%) and 157 million boe (as of December 31, 2024) of Shell's proved reserves will be contributed to the new joint venture alongside proved reserves contributed by Equinor. Subsequently, Shell will report 50% of the proved reserves of the new joint venture as part of Shell's share of proved reserves from joint ventures and associates.
Strategic Report | Performance in the year | Generating shareholder value | Oil and gas information continued
Proved reserves
Before taking production into account, our proved reserves increased by 917 million boe in 2024. This consisted of an increase of 870 million boe from Shell subsidiaries and an increase of 47 million boe from the Shell share of joint ventures and associates. After taking production into account, our proved reserves decreased by 167 million boe in 2024 to 9,620 million boe at December 31, 2024.
Shell subsidiaries
Before taking production into account, Shell subsidiaries' proved reserves increased by 870 million boe in 2024. This consisted of an increase of 521 million barrels of crude oil and natural gas liquids, an increase of 346 million boe (2,008 thousand million scf) of natural gas and an increase of 3 million barrels of synthetic crude oil. The 870 million boe increase comprised an increase of 394 million boe from extensions and discoveries, a net increase of 381 million boe from revisions and reclassifications, an increase of 49 million boe from improved recovery and a net increase of 46 million boe related to purchases and sales of minerals in place.
After taking into account production of 997 million boe (of which 41 million boe were consumed in operations), Shell subsidiaries' proved reserves decreased by 127 million boe in 2024 to 8,156 million boe. In 2024, Shell subsidiaries' proved developed reserves (PD) increased by 25 million boe to 6,346 million boe and proved undeveloped reserves (PUD) decreased by 152 million boe to 1,810 million boe.
Shell share of joint ventures and associates
Before taking production into account, the Shell share of joint ventures and associates' proved reserves increased by 47 million boe in 2024. This consisted of an increase of 52 million boe (297 thousand million scf) of natural gas, and a decrease of 5 million barrels of crude oil and natural gas liquids. The 47 million boe increase comprised an increase of 26 million boe from extensions and discoveries and a net increase of 21 million boe from revisions and reclassifications.
After taking into account production of 87 million boe (of which 5 million boe were consumed in operations), the Shell share of joint ventures and associates' proved reserves decreased by 40 million boe to 1,464 million boe at December 31, 2024.
The Shell share of joint ventures and associates' PD increased by 9 million boe to 517 million boe, and PUD decreased by 49 million boe to 947 million boe.
| | | | | |
| |
| See "Supplementary information - oil and gas (unaudited)" on pages 297-316 for more information about proved oil and gas reserves of Shell subsidiaries and the Shell share of the proved oil and gas reserves of joint ventures and associates. |
| |
Proved undeveloped reserves
In 2024, Shell subsidiaries' and the Shell share of joint ventures and associates' PUD decreased by 201 million boe to 2,757 million boe. There were decreases of 617 million boe as a result of maturation to PD, mainly 305 million boe in Kashagan (Kazakhstan), 65 million boe in Mero (Brazil), 38 million boe in Mabrouk North-East (Oman), and 209 million boe spread across other fields and a net decrease of 71 million boe as a result of revisions, reclassifications and entitlement
changes, which were mainly because of the decrease of 137 million boe in Groundbirch due to low average Alberta Energy Company (AECO) prices in 2024, an increase of 102 million boe due to an FID on an additional FPSO in Atapu, Brazil, and a decrease of 36 million spread across other fields. These were offset by an increase of 7 million boe due to de-maturation of PD to PUD, an increase of 420 million boe due to extensions and discoveries, mainly 286 million boe in Manatee (T&T), and 134 million boe spread across other fields, an increase of 49 million boe due to improved recovery, and a net increase of 11 million boe due to purchases and sales of minerals in place.
In addition to the maturation of 617 million boe from PUD to PD, 61 million boe were matured to PD as through PUD as a result of project execution during the year.
PUD held for five years or more (PUD5+) on December 31, 2024, amounted to 138 million boe, a decrease of 74 million boe compared with the end of 2023. The decrease in PUD5+ during 2024 was
driven mainly by changes in Tupi (Brazil), Gbaran (Nigeria) and
Kolo Creek (Nigeria).
The fields with the largest PUD5+ on December 31, 2024, were Assa North (Nigeria) and Penguins (UK). These PUD5+ remain undeveloped because of delays in drilling operations and security incidents impacting facility construction (Nigeria) and due to project delays (UK).
During 2024, we spent $8.2 billion on development activities related to PUD maturation.
Delivery commitments
We sell crude oil and natural gas from our producing operations under a variety of contractual obligations. Most contracts generally commit us to sell quantities based on production from specified properties, although some natural gas sales contracts specify delivery of fixed and determinable quantities, as discussed below.
In the past three years, we met our contractual delivery commitments, with the notable exceptions of Egypt, Trinidad and Tobago, and Malaysia. The delivery commitments for Egypt and Trinidad and Tobago have been renegotiated. In the period 2025-2027, we are contractually committed to deliver to third parties, joint ventures and associates a total of some 4,945 billion scf of natural gas from our subsidiaries, joint ventures and associates. The sales contracts contain a mixture of fixed and variable pricing formulae that are generally referenced to the prevailing market price for crude oil, natural gas or other petroleum products at the time of delivery.
In the period 2025-2027, we expect to meet our delivery commitments for almost all the areas in which they are carried, with an estimated 74% coming from PD, 4% through the delivery of gas that becomes available to us from paying royalties in cash, and 22% from the development of PUD as well as other new projects and purchases. In Malaysia Sabah, one of the third-party gas supply lines remains non-operational. New contracts for Domestic and LNG Markets were agreed and signed in 2024, resulting in no shortfall in the period 2025-2027.
Strategic Report | Performance in the year | Generating shareholder value | Oil and gas information continued
| | |
Summary of proved oil and gas reserves of Shell subsidiaries and Shell share of joint ventures and associates (at December 31, 2024) |
| | | | | | | | | | | | | | |
| Based on average prices for 2024 |
| Crude oil and natural gas liquids (million barrels) | Natural gas (thousand million scf) | Synthetic crude oil (million barrels) | Total (million boe) [A] |
| Proved developed | | | | |
| Europe | 116 | 2,142 | — | 485 |
| Asia | 1,318 | 9,548 | — | 2,964 |
| Oceania | 43 | 4,786 | — | 868 |
| Africa | 216 | 1,072 | — | 401 |
| North America | — | — | — | — |
| USA | 285 | 226 | — | 324 |
| Canada | — | — | 741 | 741 |
| South America | 886 | 1,120 | — | 1,080 |
| Total proved developed | 2,864 | 18,894 | 741 | 6,863 |
| Proved undeveloped | | | | |
| Europe | 43 | 454 | — | 121 |
| Asia | 405 | 5,243 | — | 1,309 |
| Oceania | 22 | 1,304 | — | 246 |
| Africa | 78 | 880 | — | 230 |
| North America | — | — | — | — |
| USA | 152 | 272 | — | 199 |
| Canada | — | — | — | — |
| South America | 325 | 1,895 | — | 652 |
| Total proved undeveloped | 1,025 | 10,048 | — | 2,757 |
| Total proved developed and undeveloped | | | | |
| Europe | 159 | 2,596 | — | 606 |
| Asia | 1,723 | 14,791 | — | 4,273 |
| Oceania | 65 | 6,090 | — | 1,114 |
| Africa | 294 | 1,952 | — | 631 |
| North America | — | — | — | — |
| USA | 437 | 498 | — | 523 |
| Canada | — | — | 741 | 741 |
| South America | 1,211 | 3,015 | — | 1,732 |
| Total [B] | 3,889 | 28,942 | 741 | 9,620 |
| Reserves attributable to non-controlling interest in Shell subsidiaries | — | — | 370 | 370 |
[A]Natural gas volumes are converted into oil equivalent using a factor of 5,800 scf per barrel.
[B]See footnote C, D and E in the proved developed and undeveloped reserves table on page 64.
Exploration
Shell continues to explore for and mature hydrocarbons across our Integrated Gas and Upstream businesses. Exploration may result in discoveries of oil and gas that we can develop, helping maintain energy security and contributing to our strategy.
We use our integrated exploration, development and project commercial and technical expertise to mature these opportunities and actively manage non-technical risks. We benchmark our projects internally and externally to make sure our proposals are competitive. We review the maturation progress of our various opportunities and perform post-investment reviews to extract learnings for implementation in future opportunities.
In 2024, hydrocarbons were found in Brunei, Oman and the Gulf of America.
Key exploration portfolio developments
UK
The UK government ratified 13 licences that we were awarded in the 33rd Offshore Licensing Round (Shell interests 50% to 100%), of which three are non-operated (Shell interests 50%). We relinquished two Shell-operated licences (Shell interests 70% and 100%), and one non-operated licence (Shell interest 33%). We also acquired an additional 15% interest in two licences, bringing our interest in each to 65%.
Malaysia
We signed one exploration PSC for an operated offshore Sarawak block (Shell interest 50%).
Strategic Report | Performance in the year | Generating shareholder value | Oil and gas information continued
Oman
We are in the process of relinquishing to the government our operated interest in two blocks (Shell interests 50% and 100%).
Egypt
The Egyptian government ratified an agreement in which we farmed out 40% of our participating interest in one operated concession (Shell retained interest 60%). We were directly awarded one concession in the West Nile Delta, which is pending government approval (Shell interest 100%, operator). We also relinquished five operated concessions (Shell interests 21% to 100%) and one non--operated concession (Shell interest 30%).
Gulf of America
In Lease Sale 261, we acquired 63 operated leases (Shell interest 100%). We sold our operated interest in 14 leases (Shell interests 55.88% to 66.66%) and non-operated interest in 32 leases (Shell interests 33.33%). We also relinquished 33 operated leases (Shell interests 50% to 100%) and 11 non-operated ones (Shell interests 25% to 40%).
Brazil
We farmed out 30% of our interest in four operated Santos Basin blocks, retaining an interest of 70% in each. The Brazilian government ratified 29 Petrobras-operated Pelotas Basin blocks (Shell interests 30%), which were secured in the 4th Permanent Offer Concession Bid-Round in 2023.
Trinidad and Tobago
Near the Eastern Coast area, we signed one PSC for one operated block (Shell interest 100%). We are also in the process of relinquishing to the government one operated licence (Shell interest 100%).
Other
In Mauritania, we relinquished two operated blocks (Shell interests 90% and 50%).
In São Tomé and Príncipe, we signed one operated exploration PSC (Shell interest 85%).
In Barbados, we relinquished one non-operated licence (Shell interest 40%) and we are in the process of relinquishing another non-operated one (Shell interest 40%).
In Uruguay, the government ratified one non-operated exploration block secured in the 2022 Open Uruguay Round (Shell interest 50%).
| | | | | |
| |
| See "Supplementary information - oil and gas (unaudited)" on pages 297-316. |
| |
Location of oil and gas exploration and production activities
| | |
| Location of oil and gas exploration and production activities [A] (at December 31, 2024) |
| | | | | | | | | | | |
| Exploration | Development and/or Production | Shell operator [B] |
| Europe | | | |
| Albania | ● | ● | ● |
| Cyprus | | ● | |
| Germany | | ● | |
| Italy | | ● | |
| Netherlands | ● | ● | ● |
| Norway | ● | ● | ● |
| UK | ● | ● | ● |
| Asia | | | |
| Brunei | ● | ● | ● |
| China | | ● | ● |
| Kazakhstan | | ● | |
| Malaysia | ● | ● | ● |
| Oman | ● | ● | ● |
| Qatar | | ● | ● |
| Oceania | | | |
| Australia | ● | ● | ● |
| Africa | | | |
| Egypt | ● | ● | ● |
| Namibia | ● | | ● |
| Nigeria | ● | ● | ● |
| São Tomé and Príncipe | ● | | ● |
| South Africa | ● | | ● |
| Tanzania | | ● | ● |
| Tunisia | | ● | |
| North America | | | |
| Barbados | ● | | |
| Canada | ● | ● | ● |
| Mexico | ● | | ● |
| USA | ● | ● | ● |
| South America | | | |
| Argentina | ● | ● | ● |
| Bolivia | | ● | |
| Brazil | ● | ● | ● |
| Colombia | ● | ● | ● |
| Suriname | ● | | ● |
| Trinidad and Tobago | ● | ● | ● |
| Uruguay | ● | | ● |
| Venezuela | | ● | ● |
[A]Includes joint ventures and associates. Where a joint venture or an associate has properties outside its base country, those properties are not shown in this table.
[B]In several countries where "Shell operator" is indicated, Shell is the operator of some but not all exploration and/or production ventures.
Strategic Report | Performance in the year | Generating shareholder value | Oil and gas information continued
Oil and gas production available for sale
| | |
| Crude oil and natural gas liquids [A] |
| | | | | | | | | | | | | | | | | | | | | | | | | | |
| | Thousand barrels |
| 2024 | | 2023 | | 2022 |
| Shell
subsidiaries | Shell share of
joint ventures
and associates | | Shell
subsidiaries | Shell share of
joint ventures
and associates | | Shell
subsidiaries | Shell share of
joint ventures
and associates |
| Europe | | | | | | | | |
| Italy | 8,551 | — | | 8,373 | — | | 9,091 | — |
| UK | 22,910 | — | | 23,458 | — | | 23,905 | — |
| Other [B] | 2,730 | 526 | | 2,493 | 524 | | 3,722 | 621 |
| Total Europe | 34,191 | 526 | | 34,324 | 524 | | 36,718 | 621 |
| Asia | | | | | | | | |
| Brunei | 1,148 | 15,987 | | 1,271 | 14,395 | | 3,256 | 16,282 |
| Kazakhstan | 37,744 | — | | 38,765 | — | | 29,667 | — |
| Malaysia | 11,763 | — | | 12,630 | — | | 16,759 | — |
| Oman | 86,235 | — | | 82,849 | — | | 82,006 | — |
| Russia | — | — | | — | — | | 10,955 | 1,963 |
| Other [B] | 24,068 | 7,392 | | 25,240 | 7,443 | | 24,965 | 7,498 |
| Total Asia | 160,958 | 23,379 | | 160,755 | 21,838 | | 167,608 | 25,743 |
| Oceania | | | | | | | | |
| Australia | 12,775 | — | | 10,370 | — | | 9,391 | — |
Total Oceania | 12,775 | — | | 10,370 | — | | 9,391 | — |
| Africa | | | | | | | | |
| Nigeria | 39,758 | — | | 37,137 | — | | 27,554 | — |
| Other [B] | 978 | — | | 1,084 | — | | 1,855 | — |
| Total Africa | 40,736 | — | | 38,221 | — | | 29,409 | — |
| North America | | | | | | | | |
| USA | 108,090 | — | | 112,912 | — | | 121,690 | — |
| Canada | 538 | — | | 597 | — | | 687 | — |
| Total North America | 108,628 | — | | 113,509 | — | | 122,377 | — |
| South America | | | | | | | | |
| Argentina | 15,610 | — | | 12,152 | 627 | | 9,023 | 2,587 |
| Brazil | 133,355 | — | | 136,825 | — | | 127,862 | — |
| Other [B] | 1,240 | — | | 1,425 | — | | 1,583 | — |
| Total South America | 150,205 | — | | 150,402 | 627 | | 138,468 | 2,587 |
| Total | 507,493 | 23,905 | | 507,581 | 22,989 | | 503,971 | 28,951 |
[A]Reflects 100% of production of subsidiaries except in respect of production-sharing contracts (PSCs), where the figures shown represent the entitlement of the subsidiaries concerned under those contracts.
[B]Comprises countries where production was lower than 10,100 thousand barrels or where specific disclosures are prohibited.
| | | | | | | | | | | | | | | | | |
| Thousand barrels |
| 2024 | | 2023 | | 2022 |
| Shell
subsidiaries | | Shell
subsidiaries | | Shell
subsidiaries |
| North America - Canada | 18,548 | | 19,102 | | 16,949 |
Strategic Report | Performance in the year | Generating shareholder value | Oil and gas information continued
| | | | | | | | | | | | | | | | | | | | | | | | | | |
| Million standard cubic feet |
| 2024 | | 2023 | | 2022 |
| Shell
subsidiaries | Shell share of
joint ventures
and associates | | Shell
subsidiaries | Shell share of
joint ventures
and associates | | Shell
subsidiaries | Shell share of
joint ventures
and associates |
| Europe | | | | | | | | |
| Netherlands | — | 37,601 | | — | 55,351 | | — | 133,210 |
| Norway | 176,629 | — | | 150,318 | — | | 174,523 | — |
| UK | 61,098 | — | | 70,585 | — | | 69,647 | — |
| Other [B] | 36,570 | | | 38,774 | — | | 45,159 | — |
| Total Europe | 274,297 | 37,601 | | 259,677 | 55,351 | | 289,329 | 133,210 |
| Asia | | | | | | | | |
| Brunei | 15,276 | 144,410 | | 13,531 | 136,684 | | 15,328 | 138,007 |
| China | 39,592 | — | | 48,170 | — | | 56,008 | — |
| Kazakhstan | 75,668 | — | | 75,521 | — | | 57,932 | — |
| Malaysia | 219,485 | — | | 173,638 | — | | 200,249 | — |
| Oman | 83,520 | — | | 55,675 | — | | — | — |
| Russia | — | — | | — | — | | 2,085 | 37,897 |
| Other [B] | 354,653 | 118,375 | | 369,125 | 118,252 | | 378,313 | 118,435 |
| Total Asia | 788,194 | 262,785 | | 735,660 | 254,936 | | 709,915 | 294,339 |
| Oceania | | | | | | | | |
| Australia | 736,482 | 39,281 | | 700,248 | 29,773 | | 693,293 | 22,577 |
| Total Oceania | 736,482 | 39,281 | | 700,248 | 29,773 | | 693,293 | 22,577 |
| Africa | | | | | | | | |
| Egypt | 27,737 | — | | 21,434 | — | | 49,618 | — |
| Nigeria | 129,533 | — | | 96,967 | — | | 118,032 | — |
| Other [B] | 3,022 | — | | 3,423 | — | | 11,966 | — |
| Total Africa | 160,292 | — | | 121,824 | — | | 179,616 | — |
| North America | | | | | | | | |
| USA | 100,971 | — | | 104,079 | — | | 112,560 | — |
| Canada | 152,576 | — | | 137,660 | — | | 122,753 | — |
| Total North America | 253,547 | — | | 241,739 | — | | 235,313 | — |
| South America | | | | | | | | |
| Bolivia | 33,453 | — | | 35,432 | — | | 40,360 | — |
| Brazil | 66,534 | — | | 71,162 | — | | 73,975 | — |
| Trinidad and Tobago | 159,937 | — | | 199,877 | — | | 186,150 | — |
| Other [B] | 17,942 | — | | 14,204 | 857 | | 12,912 | 2,227 |
| Total South America | 277,866 | — | | 320,675 | 857 | | 313,397 | 2,227 |
| Total | 2,490,678 | 339,667 | | 2,379,823 | 340,917 | | 2,420,863 | 452,353 |
[A]Reflects 100% of production of subsidiaries except in respect of PSCs, where the figures shown represent the entitlement of the subsidiaries concerned under those contracts.
[B]Comprises countries where production was lower than 41,795 million scf or where specific disclosures are prohibited.
Strategic Report | Performance in the year | Generating shareholder value | Oil and gas information continued
Average realised price by geographical area
| | |
| Crude oil and natural gas liquids |
| | | | | | | | | | | | | | | | | | | | | | | | | | |
| $/barrel |
| 2024 | | 2023 | | 2022 |
| Shell
subsidiaries | Shell share of
joint ventures
and associates | | Shell
subsidiaries | Shell share of
joint ventures
and associates | | Shell
subsidiaries | Shell share of
joint ventures
and associates |
| Europe | 70.82 | 76.61 | | 77.19 | 79.10 | | 94.52 | 91.26 |
| Asia | 76.13 | 79.77 | | 76.57 | 82.24 | | 88.69 | 100.81 |
| Oceania | 63.98 | — | | 58.31 | — | | 78.37 | — |
| Africa | 79.63 | — | | 84.33 | — | | 104.84 | — |
| North America - USA | 74.07 | — | | 75.07 | — | | 92.89 | — |
| North America - Canada | 38.52 | — | | 46.45 | — | | 62.10 | — |
| South America | 71.85 | — | | 71.93 | 67.98 | | 85.84 | 71.21 |
| Total | 74.04 | 79.70 | | 75.12 | 81.75 | | 90.06 | 97.80 |
| | | | | | | | | | | | | | | | | |
| | | | | $/barrel |
| 2024 | | 2023 | | 2022 |
| Shell
subsidiaries | | Shell
subsidiaries | | Shell
subsidiaries |
| North America - Canada | 68.35 | | 69.26 | | 86.93 |
| | | | | | | | | | | | | | | | | | | | | | | | | | | | | | | | |
| $/thousand scf |
| 2024 | | 2023 | | 2022 |
| Shell
subsidiaries | Shell share of
joint ventures
and associates | | Shell
subsidiaries | Shell share of
joint ventures
and associates | | Shell
subsidiaries | | Shell share of
joint ventures
and associates | |
| Europe | 12.76 | 9.63 | | 17.47 | 18.89 | | 27.24 | | 39.11 | [A] |
| Asia | 2.62 | 7.23 | | 2.84 | 7.60 | | 3.74 | | 10.88 | |
| Oceania | 10.47 | 6.40 | | 11.05 | 6.23 | | 13.21 | | 6.75 | |
| Africa | 3.02 | — | | 3.25 | — | | 7.08 | | — | |
| North America - USA | 3.50 | — | | 3.74 | — | | 8.46 | | — | |
| North America - Canada | 1.19 | — | | 2.25 | — | | 4.08 | | — | |
| South America | 4.13 | — | | 5.10 | 3.69 | | 8.71 | | 3.90 | |
| Total | 6.47 | 7.44 | | 7.40 | 9.78 | | 10.88 | | 17.59 | [A] |
[A]As revised, following a reassessment.
Strategic Report | Performance in the year | Generating shareholder value | Oil and gas information continued
Average production cost by geographical area
| | |
| Crude oil, natural gas liquids and natural gas [A] |
| | | | | | | | | | | | | | | | | | | | | | | | | | | | | | | | |
| | $/boe |
| 2024 | | 2023 | | 2022 |
| Shell
subsidiaries | Shell share of
joint ventures
and associates | | Shell
subsidiaries | | Shell share of
joint ventures
and associates | | Shell
subsidiaries | | Shell share of
joint ventures
and associates |
| Europe | 17.05 | 28.54 | | 20.93 | | 25.33 | | 24.83 | | 12.25 |
| Asia | 6.33 | 9.10 | | 6.35 | | 9.64 | | 6.75 | | 8.06 |
| Oceania | 7.85 | 19.49 | | 9.01 | | 21.23 | | 10.32 | | 24.97 |
| Africa | 11.95 | — | | 11.12 | | — | | 13.66 | | — |
| North America - USA | 10.11 | — | | 9.62 | | — | | 11.03 | | — |
| North America - Canada | 9.30 | — | | 9.70 | | — | | 11.15 | | — |
| South America | 7.51 | — | | 7.36 | | 9.03 | | 6.91 | | 7.74 |
| Total | 8.74 | 11.60 | | 9.08 | | 12.29 | | 10.20 | | 9.59 |
[A]Natural gas volumes are converted into oil equivalent using a factor of 5,800 scf per barrel.
| | | | | | | | | | | | | | | | | |
| $/barrel |
| 2024 | | 2023 | | 2022 |
| Shell
subsidiaries | | Shell
subsidiaries | | Shell
subsidiaries |
| North America - Canada | 17.00 | | 19.47 | | 23.05 |
Strategic Report | Performance in the year | Generating shareholder value
| | | | | | | | | | | | | | | | | | | | |
| | Marketing comprises the Mobility, Lubricants, and Sectors and Decarbonisation businesses. Mobility operates Shell's retail network, including electric vehicle charging services and the wholesale commercial fuels business, which provides fuels for transport, industry and heating. The Lubricants business produces, markets and sells lubricants for road transport, and machinery used in manufacturing, mining, power generation, agriculture and construction. The Sectors and Decarbonisation business sells fuels, speciality products and services including low-carbon energy solutions to commercial customers including the aviation, marine, and agricultural sectors. | |
| | | | | | |
| | 1.9 Segment earnings ($ billion) (2023: 3.1) | | | 3.9 Adjusted Earnings ($ billion) (2023: 3.3) | |
| | 7.4 Cash flow from operating activities ($ billion) (2023: 5.6) | | | 2,843 Marketing sales volumes (thousand b/d) (2023: 3,045) | |
| | | | | | |
Strategic Report | Performance in the year | Generating shareholder value | Marketing continued
Our Marketing business grew as a result of higher margins in fuels and lubricants as we focused on high-value customers and profitable market segments. We have been the leading finished lubricants supplier in the world for 18 years, according to Kline & Company data for 2023. Mobility continued to focus on key markets and we completed the sale of Shell Pakistan. We have also installed more than 70,000 electric vehicle public charge points globally achieving yet another aim one year ahead of schedule. As an example of our focus on discipline, we have paused on-site construction work at our planned biofuels facility in Rotterdam to address project delivery and ensure future competitiveness. See "Outlook" on pages 23-24 for our Capital Markets 2025 investor update.
Business conditions
For the business conditions relevant to Marketing, see "Market overview" on pages 45-47.
Financial delivery
Earnings 2024-2023
Segment earnings decreased by $1,163 million compared with 2023. This reflected higher Marketing margins (increase of $483 million) including higher unit margins in Lubricants and Mobility. This was partly offset by lower Sectors and Decarbonisation margins. Segment earnings also reflected lower operating expenses (decrease of $449 million). These were partly offset by unfavourable tax movements ($157 million) and higher depreciation charges (increase of $142 million). The 2024 segment earnings also included net impairment charges and reversals of $1,423 million, mainly related to an asset in the Netherlands, net losses of $386 million related to the sale of assets and charges of $215 million related to redundancies and restructuring. These charges are part of identified items and compare with the full year 2023, which included net impairment charges and reversals of $466 million, and charges of $113 million related to redundancies and restructuring, partly offset by gains of $298 million related to indirect tax credits.
Adjusted Earnings increased by $573 million, compared with 2023, as a result of the following:
○Mobility (including wholesale commercial fuels) Adjusted Earnings were $392 million higher, mainly as a result of higher unit margins and lower operating expenses. This was partly offset by higher depreciation and higher taxes;
○Lubricants Adjusted Earnings were $329 million higher, mainly because of higher margins; and
○Sectors and Decarbonisation Adjusted Earnings were $148 million lower, mainly because of lower earnings in joint ventures partly offset by lower operating expenses.
Prior year earnings summary
Segment earnings in 2023 were 33% higher than in 2022, reflecting higher margins (increase of $1,482 million), including higher unit margins in Mobility, higher margins in Lubricants because of lower feedstock costs, and higher volumes in Sectors and Decarbonisation.
These increases were partly offset by higher operating expenses (increase of $730 million) and higher depreciation charges (increase of $267 million), mainly due to asset acquisitions.
* Non-GAAP measure (see page 337).
| | | | | | | | | | | |
| $ million, except where indicated |
| 2024 | 2023 | 2022 |
Segment earnings [B] | 1,894 | 3,057 | 2,292 |
Identified items | (1,991) | (254) | (612) |
| Adjusted Earnings* [B] | 3,885 | 3,312 | 2,905 |
| Adjusted EBITDA* [B] | 7,476 | 6,337 | 5,613 |
Cash flow from operating activities* | 7,363 | 5,561 | 3,810 |
Cash capital expenditure | 2,445 | 5,790 | 4,978 |
| Marketing sales volumes (thousand b/d) | 2,843 | 3,045 | 3,043 |
[A]See Note 7 to the "Consolidated Financial Statements" which includes an explanation of the reporting segment changes applicable from 2024.
[B]Segment earnings, Adjusted Earnings, and Adjusted EBITDA are presented on a current cost of supplies basis.
Segment earnings in 2023 included impairment charges of $466 million and charges of $113 million related to redundancy and restructuring, partly offset by gains of $298 million related to indirect tax credits. These charges and gains are part of identified items and compare with 2022, which included net impairment charges and reversals of $321 million; net losses of $122 million related to the sale of assets; and provisions for onerous contracts of $62 million.
Adjusted Earnings increased by $407 million compared with 2022, as a result of the following:
○Mobility (including wholesale commercial fuels) Adjusted Earnings were $73 million lower, mainly as a result of higher operating expenses and higher depreciation. This was partly offset by better margins;
○Lubricants Adjusted Earnings were $339 million higher, mainly because of higher margins due to lower feedstock costs; and
○Sectors and Decarbonisation Adjusted Earnings were $141 million higher, mainly because of increased volumes and higher earnings in joint ventures.
Cash flow from operating activities
Cash flow from operating activities in 2024 was primarily driven by Adjusted EBITDA, working capital inflows of $998 million, and dividends (net of profits) from joint ventures and associates of $262 million. These inflows were partly offset by tax payments of $562 million, non-cash cost of supplies adjustment of $254 million, and outflows from the timing impact of $221 million in payments related to emission certificates and biofuel programmes.
Cash capital expenditure
Cash capital expenditure of $2.4 billion in 2024 reflected $0.8 billion in low-carbon energy solutions, compared with $3.3 billion in 2023.
Cash capital expenditure in low-carbon energy solutions was higher in 2023, mainly due to the acquisition of Nature Energy and the expansion of our Mobility electric vehicle charging business.
Our cash capital expenditure is expected to be in the range of $2-3 billion in 2025.
Strategic Report | Performance in the year | Generating shareholder value | Marketing continued
Operational performance
Marketing sales
Marketing sales volumes, which comprise hydrocarbon sales, decreased compared with 2023. This was mainly as a result of reduced sales volumes in Mobility because of our focus on value over volume.
Number of electric vehicle charge points
In 2024, the number of electric vehicle charge points owned or Shell- branded was almost 73,000 compared with 54,000 in 2023.
Strategic progress
Portfolio and business developments
Significant portfolio and business developments:
○In July 2024, we announced that we had paused on-site construction work at the biofuels facility at the Shell Energy and Chemicals Park Rotterdam in the Netherlands to assess the most commercial way forward for the project.
Business and property
Mobility
Shell Mobility is where we connect with individual customers on a personal level. Shell Mobility is one of the world's largest mobility retailers by number of sites, with more than 44,000 Shell-branded mobility sites, including service stations, in more than 80 markets at the end of 2024. We operate different models across these markets, from full ownership of sites to brand licensing agreements. In line with our strategy to focus on markets that provide high returns on investment, we are continuing with our plan to divest around 500 low-return Shell-owned sites (including joint ventures) each year until 2025. The sale of Shell Pakistan in 2024 has helped us achieve our aim.
Every day, around 33 million retail customers visit Shell-branded mobility sites for a range of quality fuels, electric vehicle charging, and convenience and non-fuel products and services. Through Shell Fleet Solutions, our business customers can obtain fuel cards, road services and carbon-offset offers, among other products and services.
We are expanding our convenience and non-fuel retail offer to cater to our customers' needs. At many of our sites, we offer convenience items, including beverages and fresh food, and services, such as lubricant changes and car washes. At the end of 2024, Shell operated 13,000 convenience stores worldwide. We have upgraded more than 2,500 stores with our Shell Café premium fresh coffee and food offer since launching in 2021.
Low-carbon products and services
Shell Mobility offers customers lower-emission products and services, including biofuels and electric vehicle charging. We are focusing on growing our presence in China, Europe and the USA. At the end of 2024, we had almost 73,000 public charge points globally at Shell forecourts, on-street locations, mobility hubs and other sites, such as supermarkets. This was an increase from around 54,000 at the end of 2023. As part of our value over volume focus, we no longer set a volumetric target for the number of charge points by 2030.
Shell's global electric vehicle charging business is not yet profitable. However, we remain committed to investing in this sector as we anticipate future profitability. The timeline and extent of this profitability will be influenced by factors, such as network accessibility, market competition, customer demand, advancements in cost-related technologies and supportive government policies.
As we work to provide more low-carbon alternatives to our customers, we also continue to develop traditional fuels for drivers of internal combustion engine vehicles. Aided by our partnership with Scuderia Ferrari, we have concentrated on developing fuels with special formulations designed to clean engines and improve performance. An example of this is Shell V-Power. We sold fuels under the Shell
V-Power brand in 72 markets in 2024.
| | | | | | | | |
|
| | |
| Partnering with Ferrari in motorsport We are the lead technical partner to the Scuderia Ferrari F1™ team, with the partnership being one of the longest and most successful in motorsport. The partnership is the ultimate test bed for our products, challenging them to perform in some of the most extreme conditions and ensuring our customers are getting the very best. In October 2024, a multi-year renewal was announced. Taking effect on January 1, 2026, the partnership will encompass Scuderia Ferrari HP, Ferrari Hypercar and the Ferrari Challenge Series. We are helping to shape the future of fuels by supporting Scuderia Ferrari with the development of an advanced sustainable race fuel for the 2026 F1™ World Championship season. The fuel will meet FIA requirements of achieving greenhouse gas emissions savings, relative to fossil-fuel-derived petrol, of at least 65%. | |
| Photo: Imagery of Scuderia Ferrari HP driver Charles Leclerc driving at the 2024 Singapore Grand Prix, Round 18. | |
| | |
Shell Commercial Road Transport (CRT) is also working to help drive the decarbonisation of the transport sector by providing fuels, lubricants and digital services to customers with heavy-duty vehicles in their fleets. We have a public electric vehicle charging facility for trucks in Hamburg, Germany, which has four fast-charging stations.
We also offer drivers using heavy-duty LNG-fuelled trucks access to Shell-operated and partner networks in Europe. We have LNG refuelling sites in Austria and Hungary.
Photo: A heavy-duty LNG-fuelled truck on Shell and IVECO's "On the road to net-zero emissions" bioLNG tour of Europe in 2023.
Strategic Report | Performance in the year | Generating shareholder value | Marketing continued
In April 2024, we opened our bioLNG liquefaction plant at the Shell Energy and Chemicals Park Rheinland. This can produce 100,000 tonnes of bioLNG per annum, which will help around 5,000 LNG trucks reduce their carbon emissions. Since 2022, our customers in the Netherlands have been able to opt for a bioLNG blend.
Trading and Supply
Through our main trading and supply offices in London, Houston, Singapore and Rotterdam, we trade low-carbon fuels, refined products, chemical feedstocks and environmental products. We trade in physical and financial contracts, and have wholesale commercial fuel activities. Shell Wholesale Commercial Fuels provides fuels for transport, industry and heating — from reliable main-grade fuels to premium products. With about 180 Shell and joint-venture (including pipeline) terminals and operating in around 25 countries, our infrastructure is well positioned to make deliveries around the world.
Lubricants
Shell Lubricants has been the number one global finished lubricants supplier in terms of market share for 18 consecutive years, according to Kline & Company data for 2023. Shell lubricants are available across more than 175 markets for passenger cars, motorcycles, trucks, coaches, and machinery used in manufacturing, mining, power generation, agriculture and construction.
In addition to making premium lubricants for conventional vehicles, we also make Shell E-fluids for electric vehicles from base oils made from natural gas at Pearl gas-to-liquids (GTL) plant in Qatar.
Our global lubricants supply chain has a network of 32 lubricants blending plants, four base oil plants (one of which we operate), 10 grease plants and five GTL base oil storage hubs.
Sectors and Decarbonisation
The Sectors and Decarbonisation business sells fuels, speciality products and services including low-carbon energy solutions to a broad range of commercial customers including the aviation, marine, and agricultural sectors.
Shell Bitumen supplies customers across several markets and provides enough bitumen to resurface 500 kilometres of road lanes every day.
Shell Sulphur Solutions manages the value chain of sulphur from refining to marketing. It provides sulphur for use in applications, such as fertiliser, mining and chemicals. It also licenses Shell Thiogro technologies to create sulphur-enhanced fertilisers.
Aviation
Shell Aviation provides aviation fuel, lubricants and low-carbon solutions globally. Shell's Avelia platform is one of the world's first blockchain-powered sustainable aviation fuel (SAF) book-and-claim solutions for business travel. It is designed to help trigger demand for SAF — increased demand would help encourage investment in SAF production. Wider production and supply, driven by increased demand, could help lower the price point for these fuels. Since launch, Avelia has injected more than 18 million gallons of SAF into the fuel network at nine airports around the world and supported more than 36 airlines and corporate customers in accessing the environmental attributes of SAF.
Marine
Shell Marine serves customers whose vessels range from ocean-going tankers to fishing boats. We supply seven types of fuel, more than 300 grades of lubricants and low-carbon solutions. Our global supply network covers key bunkering locations. Shell Marine also supplies chemical products, and marine-related technical and digital services. Our lubricants are used in around 10,000 vessels and are available in more than 700 ports across more than 50 countries.
Biofuels
Shell and the non-operated joint venture Raízen (Shell interest 44%) are, together, one of the world's largest blenders and distributors of biofuels. Biofuels, along with natural gas, will play a key role in reducing emissions from heavy-duty transport.
In 2024, around 10.37 billion litres of biofuels (2023: 9.7 billion litres) were blended into Shell's sale of fuels worldwide, which includes the Shell share of sales made by Raízen. Raízen produced, on a 100% basis, around 3.16 billion litres of ethanol in 2024 (2023: 3.12 billion litres). The cellulosic ethanol plant at Raízen's Costa Pinto mill in Brazil produced 61 million litres of second-generation ethanol in 2024 (2023: 30 million litres). Expansion began in 2024, with the start-up at a new plant and commissioning of two further plants at the end of 2024. The majority of the ethanol and cellulosic ethanol produced by Raízen is sold unblended to international customers in markets such as the USA, Europe and Japan. Raízen also produced around 5.1 million tonnes of sugar from sugar cane (2023: 5.8 million tonnes).
Renewable natural gas (RNG), also known as biogas or biomethane, is gas derived from processing organic waste in a controlled environment until it is fully interchangeable with conventional natural gas.
Nature Energy, which Shell acquired in 2023, is one of Europe's largest producers of RNG. In 2024, Nature Energy opened its first biogas plant in France. The Sécalia plant is operated in partnership with the Dijon Céréales consortium of 150 farmers. It is France's largest renewable gas plant with annual production of 230 GWh of biogas. Together with its partners, Nature Energy also owns and operates 13 biogas plants in Denmark and one in the Netherlands.
In March 2024, we started operations at Shell Downstream Bovarius, which is one of two facilities at the Bettencourt Dairies in Wendell, Idaho, USA, where we are converting dairy manure to RNG. Bovarius is expected to produce around 400,000 MMBtu a year of RNG. The second facility, Shell Downstream Friesian, is expected to produce around 350,000 MMBtu a year of RNG and operations are expected to start in 2025.
Marketing data tables
| | |
Branded mobility locations [A] |
| | | | | | | | | | | |
| 2024 | 2023 | 2022 |
| Europe | 8,227 | 8,346 | 8,260 |
| Asia [B] | 7,742 | 10,824 | 10,470 |
| Oceania [B] | 1,047 | 1,087 | 1,083 |
| Africa | 2,994 | 2,917 | 2,815 |
| Americas [C] | 24,099 | 23,830 | 23,597 |
Total [D] | 44,109 | 47,004 | 46,225 |
[A]Includes different models, from full-ownership retail sites, and sites operated by joint ventures, through to trademark licensing agreements, and excludes sites closed for more than six months.
[B]Asia includes Turkey; Oceania includes French Polynesia, Guam, Palau and New Caledonia. Decrease in sites is primarily due to exit from Japan market.
[C]2024 includes around 8,138 sites operated by the Raízen joint venture.
[D]2024 includes 8,030 sites operated through trademark licensing agreements.
Strategic Report | Performance in the year | Generating shareholder value | Marketing continued
| | |
Marketing sales volumes [A][B][C][D] |
| | | | | | | | | | | | | | |
| Thousand b/d |
| 2024 | 2023 | 2022 | |
| Europe | | | | |
| Mobility | 611 | 626 | 614 | [E] |
| Lubricants | 16 | 16 | 16 | |
| Sectors and Decarbonisation | 192 | 186 | 176 | [E] |
| Total | 819 | 828 | 806 | |
| Asia | | | | |
| Mobility | 594 | 607 | 635 | [E] |
| Lubricants | 40 | 39 | 38 | |
| Sectors and Decarbonisation | 104 | 138 | 113 | [E] |
| Total | 738 | 784 | 786 | |
| Africa | | | | |
| Mobility | 63 | 74 | 86 | [E] |
| Lubricants | 2 | 3 | 3 | |
| Sectors and Decarbonisation | 6 | 9 | 8 | [E] |
| Total | 71 | 86 | 97 | |
| Americas | | | | |
| Mobility | 790 | 919 | 938 | [E] |
| Lubricants | 23 | 24 | 25 | |
| Sectors and Decarbonisation | 402 | 404 | 390 | [E] |
| Total | 1,215 | 1,347 | 1,354 | |
| Total product sales | | | | |
| Mobility | 2,057 | 2,226 | 2,274 | [E] |
| Lubricants | 82 | 82 | 83 | |
| Sectors and Decarbonisation | 704 | 737 | 686 | [E] |
| Total | 2,843 | 3,045 | 3,043 | |
| Gasolines | 1,282 | 1,321 | 1,307 | |
| Kerosenes | 391 | 386 | 345 | |
| Gas/Diesel oils | 960 | 1,012 | 1,057 | |
| Fuel oil | 22 | 23 | 24 | |
| Other products [F] | 188 | 303 | 310 | |
| Total | 2,843 | 3,045 | 3,043 | |
[A]Excludes deliveries to other companies under reciprocal sale and purchase arrangements, that are in the nature of exchange contracts.
[B]Includes the Shell share of Raízen's sales volumes and other joint ventures' sales volumes.
[C]Excludes sales volumes from markets where Shell operates under trademark licensing agreements.
[D]From the first quarter 2024, wholesale commercial fuels forms part of Mobility with inclusion in the Marketing segment (previously Chemicals & Products segment). Prior period comparatives have been revised to conform with current year presentation with an offsetting impact between Marketing and Chemicals and Products segments.
[E]Previously reported within the Sectors and Decarbonisation class of business, with effect from July 1, 2023, the Commercial Road Transport business (CRT) is part of Mobility and Customer Operations is part of Lubricants. Comparative information has been revised.
[F]Includes LPG sales volumes of 26 thousand b/d (2023: 29 thousand b/d; 2022: 33 thousand b/d).
Strategic Report | Performance in the year | Generating shareholder value
| | | | | | | | | | | | | | | | | | | | |
| | Chemicals and Products includes chemical manufacturing plants with their own marketing network, and refineries which turn crude oil and other feedstocks into a range of oil products which are moved and marketed around the world for domestic, industrial and transport use. The segment also includes the pipeline business, trading and optimisation of crude oil, oil products and petrochemicals, and the extraction of bitumen from mined oil sands and its conversion into synthetic crude oil. | |
| | | | | | |
| | 1.8 Segment earnings ($ billion) (2023: 1.5) | | | 2.9 Adjusted Earnings ($ billion) (2023: 3.6) | |
| | 7.3 Cash flow from operating activities ($ billion) (2023: 7.5) | | | 1,344 Refinery processing intake (thousand b/d) (2023: 1,349) | |
| | 1,052 Product sales volumes (thousand b/d) (2023: 1,078) | | | 11,875 Chemicals sales volumes (thousand tonnes) (2023: 11,245) | |
| | | | | | |
Strategic Report | Performance in the year | Generating shareholder value | Chemicals and Products continued
We announced the decision to stop processing crude oil into petrol, jet fuel and diesel at our Wesseling site in Germany, and to produce premium oils instead. We also opened our first bioLNG liquefaction plant in Germany. In Chemicals, we saw improved utilisation thanks to the ramp-up of operations at Shell Polymers Monaca, USA, and we took a final investment decision to expand our CSPC petrochemicals joint venture with CNOOC in Daya Bay, China. See "Outlook" on pages 23-24 for our Capital Markets 2025 investor update.
Business conditions
For the business conditions relevant to Chemicals and Products, see "Market overview" on pages 45-47.
Financial delivery
Earnings 2024-2023
Segment earnings in 2024 increased by $275 million compared with 2023. This reflected lower operating expenses (a decrease of $812 million) and higher Chemicals margins (increase of $602 million). These were partially offset by lower Products margins (a decrease of $1,832 million), mainly driven by lower refining margins and unfavourable tax movements ($248 million). Segment earnings in 2024 also included:
○net impairment charges and reversals of $1,176 million mainly relating to assets in Singapore;
○charges of $142 million related to redundancy and restructuring; and
○unfavourable movements of $86 million relating to an accounting mismatch due to fair value accounting of commodity derivatives, partly offset by favourable deferred tax movements of $114 million.
These charges and movements are part of identified items, and compare with the full year 2023 which included net impairment charges and reversals of $2,195 million mainly relating to the Chemicals assets in Singapore, and charges of $82 million related to redundancy and restructuring partly offset by favourable movements of $214 million relating to an accounting mismatch due to fair value accounting of commodity derivatives.
In 2024, Adjusted Earnings from Chemicals accounted for (15)%, Refining for 34% and Trading and Optimisation including pipelines for 81%. The decrease in Adjusted Earnings of $683 million was driven by the following:
○Products Adjusted Earnings were $1,818 million lower than in 2023, mainly driven by lower refining and oil sands margins and unfavourable tax movements, higher depreciation partly offset by lower operating expenses.
○Chemicals negative Adjusted Earnings were $1,135 million lower than in 2023, mainly because of higher margins and lower operating expenses, and lower depreciation.
Prior year earnings summary
Segment earnings in 2023 were 66% lower than in 2022, reflecting lower Products margins (a decrease of $1,545 million), mainly driven by lower refining margins and partly offset by higher margins from trading and optimisation. The segment earnings also reflected higher depreciation charges (an increase of $543 million) due to the start-up of operations at Shell Polymers Monaca in the USA. These losses were partly offset by higher Chemicals margins (an increase of $612 million). Segment earnings in 2023 included the following:
○net impairment charges and reversals of $2,195 million, mainly related to the Chemicals assets in Singapore; and
○charges of $82 million related to redundancy and restructuring, partly offset by favourable movements of $214 million related to the fair value accounting of commodity derivatives.
* Non-GAAP measure (see page 337).
| | | | | | | | | | | |
| $ million, except where indicated |
| 2024 | 2023 | 2022 |
Segment earnings [B] | 1,757 | 1,482 | 4,380 |
Identified items | (1,177) | (2,135) | (213) |
| Adjusted Earnings*[B] | 2,934 | 3,617 | 4,592 |
| Adjusted EBITDA*[B] | 6,783 | 7,489 | 8,305 |
Cash flow from operating activities* | 7,253 | 7,513 | 11,472 |
Cash capital expenditure | 3,290 | 3,014 | 3,691 |
| Chemicals manufacturing plant utilisation (%) | 76% | 68% | 79% |
| Refinery utilisation (%) | 85% | 85% | 86% |
| Refinery processing intake (thousand b/d) | 1,344 | 1,349 | 1,402 |
| Product sales volumes (thousand b/d) | 1,052 | 1,078 | 1,160 |
| Chemicals sales volumes (thousand tonnes) | 11,875 | 11,245 | 12,281 |
[A]See Note 7 to the "Consolidated Financial Statements" which includes an explanation of the reporting segment changes applicable from 2024.
[B]Segment earnings, Adjusted Earnings, and Adjusted EBITDA are presented on a current cost of supplies basis.
These charges and gains are part of identified items and compare with 2022, which included:
○net impairment charges and reversals of $226 million;
○legal provisions of $149 million;
○unfavourable movements of $142 million related to the fair value accounting of commodity derivatives;
○tax charges relating to the EU solidarity contribution of $74 million; partly offset by gains of $210 million, related to the sale of assets; and
○gains of $104 million, related to the remeasurement of redundancy and restructuring costs.
In 2023, Adjusted Earnings from Chemicals accounted for (43)%, Refining for 67% and Trading and Optimisation including pipelines for 76%. The decrease in Adjusted Earnings of $975 million was driven by the following:
○Products Adjusted Earnings were $758 million lower than in 2022, mainly driven by lower refining and oil sands margins and partly offset by higher margins from Trading & Optimisation.
○Chemicals negative Adjusted Earnings were $217 million more than in 2022, mainly because of higher depreciation and operating expenses, partly offset by higher margins and Income from associates.
Cash flow from operating activities
Cash flow from operating activities in 2024 was primarily driven by Adjusted EBITDA, working capital inflows of $524 million, dividends (net of profits) from joint ventures and associates of $304 million and net cash inflows relating to commodity derivatives of $219 million. These inflows were partly offset by cash outflows relating to legal provisions of $215 million, tax payments of $146 million, cash outflows relating to the timing impact of payments relating to emission certificates and biofuel programmes of $114 million,
and a non-cash cost of supplies adjustment of $109 million.
Shell's policy is to settle the inter-segment use of tax attributes between business segments. This settlement is usually made in cash but in certain instances there is no cash settlement. In 2024, the Integrated Gas segment's deferred tax assets ($974 million) were mainly used by the Upstream ($759 million) and Chemicals and Products ($183 million) segments, for which no cash settlement was made.
Cash capital expenditure
Cash capital expenditure increased by $0.3 billion in 2024 to $3.3 billion mainly because of growth projects in China. Our cash capital expenditure is expected to be around $3 billion in 2025.
Strategic Report | Performance in the year | Generating shareholder value | Chemicals and Products continued
Operational performance
Chemicals manufacturing plant utilisation
Utilisation is defined as the actual use of the plants as a percentage of the rated capacity. Chemicals manufacturing plant utilisation was 8 percentage points higher than in 2023, mainly due to economic optimisation in 2023. The increase was also driven by the ramp-up of Shell Polymers Monaca and lower unplanned maintenance in 2024.
Refinery utilisation
Utilisation is defined as the actual use of the plants as a percentage
of the rated capacity. Refinery utilisation of 85% was in line with 2023.
Chemicals and Products sales
Chemicals sales volumes were 6% higher than in 2023, mainly due to higher polyethylene volumes partly offset by lower intermediate volumes.
Products sales volumes were 2% lower than in 2023 due to lower Trading sales volumes in Europe partly offset by increases in the USA and Asia.
Strategic progress
Portfolio and business developments
Significant portfolio and business developments:
○In January 2024, we took an FID to convert the hydrocracker of the Wesseling site at the Energy and Chemicals Park Rheinland in Germany into a production unit for Group III base oils.
○In May 2024, we agreed to sell our Energy and Chemicals Park in Singapore to CAPGC Pte. Ltd., a joint venture company between Chandra Asri Capital Pte. Ltd. and Glencore Asian Holdings Pte. Ltd. The transaction will transfer all of Shell's interests in Shell Energy and Chemicals Park Singapore to CAPGC [A].
○In June 2024, we took an FID for Polaris, a carbon capture project at the Shell Energy and Chemicals Park Scotford in Alberta, Canada. We also took an FID to proceed with the Atlas Carbon Storage Hub which will store CO2 captured by the Polaris project.
○In January 2025, CNOOC and Shell Petrochemicals Company Limited (CSPC), a 50-50 joint venture between Shell Nanhai B.V and CNOOC Petrochemicals Investment Ltd, took an FID to expand its petrochemical complex in Daya Bay, Huizhou, south China.
Business and property
Energy and chemicals plants
We are repurposing our refineries into energy and chemicals parks to focus on meeting customers' low-carbon and sustainability needs. This is underway at Norco in the USA, Scotford in Canada, Rotterdam in the Netherlands and Rheinland in Germany. We continue to explore options for the former Convent Refinery in Louisiana, USA, which has been shut down, and we have agreed to sell our Energy and Chemicals Park in Singapore. As we transform our refineries, we are building new facilities or converting existing units to support low-carbon products, while dismantling units that do not deliver sustainable long-term value.
Chemicals
Products made from chemicals are used in everyday life, including in medical equipment, construction, transport, electronics, agriculture and sports. Our plants produce a range of base chemicals, including ethylene, propylene and aromatics, and intermediate chemicals, such as styrene monomer, propylene oxide, solvents, linear alpha olefins, detergent alcohols, ethylene oxide, ethylene glycol and polyethylene. We have the capacity to produce around 8.1 million tonnes of ethylene a year (including the Shell share of capacity entitlement (offtake rights) of joint ventures and associates, which may be different from nominal equity interest).
[A]Transaction subject to completion.
Our Pennsylvania chemical project, Shell Polymers Monaca, which commenced operations in November 2022, was not fully functional during 2023 due to operational and start-up challenges. The facility has since ramped up operations since the first quarter of 2024.
We are expanding our product portfolio to include chemicals made from circular feedstocks, and more intermediates and performance chemicals, such as polyethylene and polycarbonate.
We operate chemical plants worldwide and have a balance of locations, feedstocks and products. In 2024, we began production at our new pyrolysis oil upgrader at the Shell Chemicals Park Moerdijk in the Netherlands. The unit improves the quality of pyrolysis oil, a liquid made from hard-to-recycle plastic waste, and turns it into chemical feedstock. The plant has the capacity to process up to 50,000 tonnes of pyrolysis oil per year.
Products – Refining and Trading
Refining
We have interests in eight refineries, with a total capacity to process 1.6 million barrels of crude oil a day. The distribution of our refining capacity is 60% in Europe, 26% in the Americas and 14% in Asia.
In 2024, we took an FID to convert the hydrocracker of the Wesseling site at the Energy and Chemicals Park Rheinland in Germany into a production unit for Group III base oils. These mineral base oils have a very high viscosity index, which meets transport industry standards, and are produced with hydrocracking technology. The market for high-quality engine and transmission oils, as well as electric vehicle fluids and cooling fluids, some of which are made from these oils, is expected to grow. Crude oil processing will end at the Wesseling site in 2025 but continue at the Godorf site.
Photo: Barges at the Shell Energy and Chemicals Park Rheinland in Germany.
Trading and Supply
Through our main trading offices in London, Houston, Singapore and Rotterdam, we trade crude oil, low-carbon fuels, refined products, chemical feedstocks and environmental products.
We trade in physical and financial contracts, lease storage and transportation capacities, and manage global shipping activities.
Shipping and Maritime enables the safe delivery of our contracts and this includes supplying feedstock for our refineries and chemical plants, and finished products such as gasoline, diesel and aviation fuel to our Marketing segment and customers.
Strategic Report | Performance in the year | Generating shareholder value | Chemicals and Products continued
Pipelines
We own and operate three tank farms across the USA through Shell Pipeline Company LP (Shell interest 100%). It transports around 1.5 billion barrels of crude oil, refined products and chemicals a year through around 5,500 kilometres of pipelines in the Gulf of America and nine US states. Our non-operated ownership interests provide another 13,000 kilometres of pipeline.
Our pipelines carry more than 40 types of crude oil and more than 20 grades of fuel and chemicals, including petrol, diesel, aviation fuel and chemicals including ethylene.
We own, operate, develop and acquire pipelines and other midstream and logistics assets. Our assets include interests in entities that own crude oil and refined products pipelines and terminals that serve as key infrastructure to:
○transport onshore and offshore crude oil production to US Gulf Coast and Midwest refining markets; and
○deliver refined products from those markets to major demand centres.
Our assets also include interests in entities that own natural gas and refinery gas pipelines that transport offshore natural gas to market hubs and deliver refinery gas from refineries and plants to chemical sites along the US Gulf Coast.
Oil Sands
Synthetic crude oil is produced by mining bitumen-saturated sands, extracting the bitumen and transporting it to a processing facility where hydrogen is added to make a wide range of feedstocks for refineries. The Athabasca Oil Sands Project (AOSP) in Alberta, Canada, includes the Albian Sands mining and extraction operations, the Scotford Upgrader and the Quest Carbon Capture and Storage (CCS) facility. Quest CCS captures about 1 million tonnes per year of CO2 from the hydrogen manufacturing units within the upgrader. Since opening in 2015, Quest CCS has safely stored more than 9 million tonnes of CO2.
We have a 50% interest in 1745844 Alberta Ltd. (formerly known as Marathon Oil Canada Corporation), which holds a 20% interest in the Athabasca Oil Sands Project.
Pursuant to our 2017 agreement with Canadian Natural Resources Limited, our remaining mining interest and associated synthetic crude oil reserves will be swapped for an additional 10% interest in the Scotford Upgrader and Quest CCS project. The transaction is expected to close by the end of the first half of 2025, subject to regulatory approvals.
Chemicals and Products data tables
The tables below reflect Shell subsidiaries and instances where Shell owns the crude oil or feedstocks processed by a refinery. Other joint ventures and associates are only included where explicitly stated.
| | |
Products sales volumes [A][B][C] |
| | | | | | | | | | | |
| Thousand b/d |
| 2024 | 2023 | 2022 |
| Europe | 507 | 560 | 574 |
| Asia | 248 | 240 | 274 |
| Africa | — | — | — |
| Americas | 297 | 278 | 312 |
| Total | 1,052 | 1,078 | 1,160 |
| Gasolines | 141 | 154 | 264 |
| Kerosenes | 94 | 104 | 93 |
| Gas/Diesel oils | 321 | 346 | 291 |
| Fuel oil | 200 | 221 | 257 |
| Other products [D] | 296 | 252 | 256 |
| Total | 1,052 | 1,078 | 1,160 |
[A]Excludes deliveries to other companies under reciprocal sale and purchase arrangements, which are in the nature of exchanges. Sales of condensate are included.
[B]Certain contracts are held for trading purposes and reported net rather than gross. The effect in 2024 was a reduction in refining and trading sales of around 1,286 thousand b/d (2023: 1,202 thousand b/d; 2022: 1,197 thousand b/d).
[C]From the first quarter 2024, Wholesale Commercial Fuels forms part of Mobility with inclusion in the Marketing segment (previously Chemicals and Products segment). Prior period comparatives have been revised to conform with current year presentation with an offsetting impact between Marketing and Chemicals and Products segments.
[D]Includes LPG sales volumes of 54 thousand b/d (2023: 55 thousand b/d; 2022: 48 thousand b/d).
| | |
| Cost of crude oil processed or consumed [A] |
| | | | | | | | | | | |
| $/barrel |
| 2024 | 2023 | 2022 |
| Total | 77.97 | 71.13 | 84.39 |
[A]Includes Upstream and Integrated Gas margins on crude oil supplied by Shell subsidiaries, joint ventures and associates.
| | |
| Crude distillation capacity [A] |
| | | | | | | | | | | |
| Thousand b/stream day [B] |
| 2024 | 2023 | 2022 |
| Europe | 975 | 975 | 990 |
| Asia | 237 | 237 | 237 |
| Africa | — | — | 23 |
| Americas | 435 | 435 | 449 |
| Total | 1,646 | 1,646 | 1,698 |
[A]Average operating capacity for the year, excluding mothballed capacity.
[B]Stream day capacity is the maximum capacity with no allowance for downtime.
| | | | | | | | | | | |
| Thousand b/d |
| 2024 | 2023 | 2022 |
| Europe | 742 | 732 | 715 |
| Asia | 165 | 168 | 184 |
| Africa | — | — | 16 |
| Americas | 359 | 322 | 353 |
| Total | 1,266 | 1,222 | 1,268 |
[A]Includes natural gas liquids, share of joint ventures and associates and processing
for others.
Strategic Report | Performance in the year | Generating shareholder value | Chemicals and Products continued
| | |
| Refinery processing intake [A] |
| | | | | | | | | | | |
| Thousand b/d |
| 2024 | 2023 | 2022 |
| Europe | 742 | 764 | 763 |
| Asia | 166 | 171 | 184 |
| Africa | — | — | 16 |
| Americas | 437 | 414 | 439 |
| Total | 1,344 | 1,349 | 1,402 |
[A]Includes crude oil, natural gas liquids and feedstocks processed in crude distillation units and in secondary conversion units.
| | |
| Refinery processing outturn [A] |
| | | | | | | | | | | |
| Thousand b/d |
| 2024 | 2023 | 2022 |
| Gasolines | 486 | 489 | 477 |
Kerosenes | 162 | 168 | 166 |
| Gas/Diesel oils | 506 | 516 | 512 |
| Fuel oil | 80 | 88 | 90 |
| Other | 186 | 149 | 193 |
| Total | 1,419 | 1,410 | 1,438 |
[A]Excludes own use and products acquired for blending purposes.
Manufacturing plants at December 31, 2024
| | | | | | | | | | | | | | | | | | | | | | | |
| Thousand barrels/stream day, 100% capacity [B] |
| Location | Asset class | Shell interest (%) [A] | Crude
distillation
capacity | Thermal
cracking/
visbreaking/
coking | Catalytic
cracking | Hydro-
cracking |
| Europe | | | | | | | |
| Germany | Miro [C] | | 32 | 313 | 40 | 96 | — |
| Rheinland | | 100 | 339 | 32 | — | 87 |
| Schwedt [C] | | 38 | 234 | 46 | 57 | — |
| Netherlands | Pernis | | 100 | 447 | — | 53 | 104 |
| Asia | | | | | | | |
| Singapore | Pulau Bukom[D] | | 100 | 237 | — | — | 61 |
| Americas | | | | | | | |
| Argentina | Buenos Aires [E] | | 44 | 112 | 14 | 22 | — |
| Canada | | | | | | | |
| Alberta | Scotford | | 100 | 100 | — | — | 83 |
| Ontario | Sarnia | | 100 | 85 | 5 | 21 | 10 |
| USA | | | | | | | |
| Louisiana | Norco | | 100 | 250 | 29 | 119 | 44 |
[A]Shell interest is rounded to the nearest whole percentage point; Shell share of production capacity may differ.
[B]Stream day capacity is the maximum capacity with no allowance for downtime.
[C]Not operated by Shell.
[D]Refinery has been classified as held for sale.
[E]Owned through Raízen joint venture.
 Integrated refinery and chemical complex
  Refinery complex with cogeneration capacity
  Refinery complex with chemical unit(s)
Strategic Report | Performance in the year | Generating shareholder value | Chemicals and Products continued
Chemicals data tables
The tables below reflect Shell subsidiaries and instances where Shell owns the crude oil or feedstocks processed by a refinery. Other joint ventures and associates are only included where explicitly stated.
| | | | | | | | | | | |
| Thousand tonnes/year |
| 2024 | 2023 | 2022 |
| Europe | 1,713 | 1,710 | 1,710 |
| Asia | 2,542 | 2,542 | 2,542 |
| Americas [B] | 3,821 | 3,821 | 3,821 |
| Total | 8,076 | 8,073 | 8,073 |
[A]Includes the Shell share of capacity entitlement (offtake rights) of joint ventures and associates, which may be different from nominal equity interest. Nominal capacity is quoted at December 31, 2024.
[B]Shell Polymers Monaca, which commenced operations in November 2022, was not fully functional during 2023 due to operational and start-up challenges. The facility has since ramped up operations since the first quarter of 2024.
| | |
| Chemicals sales volumes [A] |
| | | | | | | | | | | |
| Thousand tonnes/year |
| 2024 | 2023 | 2022 |
| Europe | | | |
| Base chemicals | 2,113 | 1,741 | 2,809 |
| Intermediates and other chemical products | 1,889 | 1,848 | 1,955 |
| Total | 4,001 | 3,589 | 4,764 |
| Asia | | | |
| Base chemicals | 1,198 | 1,190 | 825 |
| Intermediates and other chemical products | 1,744 | 1,917 | 2,147 |
| Total | 2,943 | 3,107 | 2,972 |
| Americas | | | |
| Base chemicals | 1,366 | 1,508 | 2,125 |
| Intermediates and other chemical products | 3,566 | 3,041 | 2,420 |
| Total | 4,932 | 4,549 | 4,545 |
| Total product sales | | | |
| Base chemicals | 4,677 | 4,439 | 5,759 |
| Intermediates and other chemical products | 7,199 | 6,806 | 6,522 |
| Total | 11,875 | 11,245 | 12,281 |
[A]Excludes feedstock trading and by-products.
Strategic Report | Performance in the year | Generating shareholder value | Chemicals and Products continued
| | |
Major chemical plants [A] |
| | | | | | | | | | | | | | | | | | | | | | | |
| | Thousand tonnes/year, Shell share capacity [B] |
| Location | Ethylene | Polyethylene | Styrene
monomer | Ethylene
glycol | Higher olefins
[C] | Additional
products |
| Europe | | | | | | | |
| Germany | Rheinland | 324 | — | — | — | — | A |
| Netherlands | Moerdijk | 974 | — | 817 | 154 | — | A, I |
| UK | Mossmorran [D] | 415 | — | — | — | — | O |
| Asia | | | | | | | |
| China | Nanhai [D] | 1,100 | 605 | 645 | 415 | — | A, I |
| Singapore | Jurong Island [E][F] | 281 | 40 | 1,069 | 924 | — | A, I, P, O |
| Pulau Bukom [F] | 1,161 | — | — | — | — | A |
| Americas | | | | | | | |
| Canada | Scotford | — | — | 475 | 462 | — | A, I |
| USA | Monaca | 1,500 | 1,600 | — | — | — | |
| Deer Park | 889 | — | — | — | — | A, I |
| Geismar | — | — | — | 400 | 1,390 | I |
| Norco | 1,432 | — | — | — | — | A |
| Total | | 8,076 | 2,245 | 3,006 | 2,355 | 1,390 | |
[A]Major chemical plants are large integrated chemical facilities, typically producing a range of chemical products from an array of feedstocks.
[B]Shell share of capacity of subsidiaries, joint arrangements and associates (Shell- and non-Shell-operated), excluding capacity of the Infineum additives joint ventures.
[C]Higher olefins are linear alpha and internal olefins (products range from C4 to C2024).
[D]Not operated by Shell.
[E]The polypropylene and olefins production mentioned refers to Shell share of capacity of our non-operated joint ventures Petchem Corporation of Singapore (PCS) and The Polyolefin Company (TPC) which are on Jurong Island.
[F]The plant has been classified as held for sale.
A Aromatics, lower olefins
I Intermediates
P Polypropylene
O Other
| | |
Other Chemicals locations [A] |
| | | | | | | | |
| Location | Products |
| Europe | | |
| Germany | Karlsruhe | A |
| Schwedt | A |
| Netherlands | Rotterdam | A, I, O |
| Americas | | |
| Argentina | Buenos Aires | I |
| Canada | Sarnia | A, I |
| | |
| | |
[A]Other chemical locations reflect locations with smaller chemical units, typically serving more local markets.
A Aromatics, lower olefins
I Intermediates
O Other
Strategic Report | Performance in the year | Generating shareholder value | Chemicals and Products continued
| | | | | | | | | | | | | | |
|
| | | | |
| Progressing CCS to help decarbonise our and customers' activities As part of our strategy to deliver more value with less emissions, we are investing in carbon capture and storage (CCS) projects to help decarbonise our own operations, as well as those of our customers. In June 2024, we took a final investment decision to proceed with the Polaris carbon capture project (Shell interest 100%) at the Shell Energy and Chemicals Park Scotford in Alberta, Canada. Polaris is designed to capture an estimated 650,000 tonnes of CO2 annually. We also took a final investment decision to proceed with the Atlas Carbon Storage Hub which will store the CO2 captured by the Polaris project. Both Polaris and Atlas are expected to begin operations towards the end of 2028. A future additional phase of Atlas that could potentially store carbon for the partners and other companies is subject to a future possible investment decision. Polaris and Atlas will build on the success of the Quest Carbon Capture and Storage (CCS) facility (Shell interest 10%) at Scotford, which has captured and stored more than 9 million tonnes of CO2 since 2015 (as at the end of 2024). The CO2 captured by Quest CCS from the hydrogen manufacturing units within the upgrader is stored in a saline aquifer more than 2 kilometres underground. Northern lights shipments due in 2025 In September 2024, our Northern Lights joint venture in Norway (Shell interest 33.3%) with Equinor and TotalEnergies, completed the onshore and offshore facilities for the world's first project to offer commercial carbon transport and storage as a service. The first marine CO2 shipments are expected in 2025. | |
Carbon dioxide captured by customers in industries that are difficult to decarbonise is liquefied, transported by ship to a receiving terminal on the Norwegian coast, then piped 100 km offshore for safe, permanent storage 2,600 metres under the North Sea. Agreements have already been signed with Yara, the crop nutrition company, and Ørsted, the renewable energy company, to transport and store CO2 from production facilities in the Netherlands and Denmark respectively. Northern Lights has the capacity to store around 1.5 million tonnes of CO2 per year. It is part of the Norwegian government's Longship project to develop a decarbonisation value chain, from carbon capture to transport and storage, for companies in Norway and across Europe. CCS hubs developed to offer CCS-as-a-service to our customers are reported in the Renewable and Energy Solutions segment. Where existing or future CCS projects may help to decarbonise our own assets, they will be reported in the segment where the asset sits. 1, 2. The Northern Lights receiving terminal in Norway. CO2 is transported by ship, then piped 100 km offshore and stored 2,600 metres under the North Sea. | |
| | | | |
Strategic Report | Performance in the year | Generating shareholder value
| | | | | | | | | | | |
| | Renewables and Energy Solutions | |
| | | | | | | | | | | | | | | | | | | | |
| | Renewables and Energy Solutions (R&ES) includes activities such as renewable power generation, the marketing and trading and optimisation of power and pipeline gas, as well as carbon credits and digitally enabled customer solutions. It also includes the production and marketing of hydrogen, development of commercial carbon capture and storage hubs, investment in nature-based projects that avoid or reduce carbon emissions, and Shell Ventures, which invests in companies that work to accelerate the energy and mobility transformation. | |
| | | | | | |
| | (1.2) Segment earnings ($ billion) (2023: 3.1) | | | (0.5) Adjusted Earnings ($ billion) (2023: 0.8) | |
| | 3.8 Cash flow from operating activities ($ billion) (2023: 3.0) | | | 306 External power sales (terawatt hours) (2023: 279) | |
| | 652 Sales of pipeline gas to end-use customers (terawatt hours) (2023: 738) | | | | |
| | | | | | |
Strategic Report | Performance in the year | Generating shareholder value | Renewables and Energy Solutions continued
In 2024, we continued to develop our portfolio of renewable and low-carbon solutions, with an increased focus on energy storage, flexible generation and, increasingly, on power trading. We started commercial operations at an offshore wind park in the Netherlands and at two solar parks in Italy and the USA. We also agreed to acquire a combined-cycle gas turbine power plant to strengthen our power business in New England, USA. We made progress in carbon capture and storage by taking the final investment decisions to proceed with two projects in Canada, while our Northern Lights joint venture completed its onshore and offshore facilities in Norway for the world's first commercial carbon transport and storage project. See "Outlook" on pages 23-24 for our Capital Markets 2025 investor update.
Business conditions
For the business conditions relevant to Renewables and Energy Solutions, see "Market overview" on pages 45-47.
Financial delivery
Earnings 2024-2023 [A]
Segment earnings in 2024 decreased by $4,318 million compared with 2023. This reflected lower margins (decrease of $1,719 million), mainly from trading and optimisation primarily in Europe due to lower volatility. This was partly offset by lower operating expenses (decrease of $632 million). Segment earnings in 2024 also included net impairment charges and reversals of $1,085 million, mainly related to renewable generation assets in North America, and partly offset by favourable movements of $300 million relating to an accounting mismatch due to fair value accounting of commodity derivatives, and a net gain on sale of assets of $94 million. These net charges and favourable movements are part of identified items and compare with the full year 2023 which included favourable movements of $2,756 million due to the fair value accounting of commodity derivatives, partly offset by net impairment charges and reversals of $669 million. As part of Shell's normal business, commodity derivative hedge contracts are entered into for the mitigation of economic exposures on future purchases, sales and inventory.
Adjusted Earnings were a loss of ($497) million in 2024. Adjusted Earnings from Renewable Power Generation, Hydrogen, CCS, Nature- Based Solutions (NBS) and Shell Ventures accounted for 146% of 2024 negative Adjusted Earnings. These were partially offset by positive Adjusted Earnings contributions from Energy Marketing and Trading and Optimisation (46%).
Prior year earnings summary
Segment earnings reflected lower margins (a decrease of $684 million), mainly from trading and optimisation. This was due to lower gas and power price volatility in 2023, unfavourable tax movements (a decrease of $218 million), and higher operating expenses resulting from business growth (an increase of $168 million). Segment earnings also included favourable movements of $2,756 million due to the fair value accounting of commodity derivatives, partly offset by net impairment charges and reversals of $669 million. These favourable movements and charges are part of identified items and compare with 2022, which included unfavourable movements of $2,443 million due to the fair value accounting of commodity derivatives and impairment charges of $361 million.
Cash flow from operating activities
Cash flow from operating activities was primarily driven by net cash inflows related to derivatives of $3,012 million and working capital inflows of $923 million, partly offset by tax payments of $457 million and Adjusted EBITDA.
* Non-GAAP measure (see page 337).
| | | | | | | | | | | |
| $ million, except where indicated |
| 2024 | 2023 | 2022 |
Segment earnings [B] | (1,229) | 3,089 | (1,027) |
Identified items | (732) | 2,333 | (2,805) |
| Adjusted Earnings*[B] | (497) | 756 | 1,778 |
| Adjusted EBITDA*[B] | (22) | 1,481 | 2,503 |
Cash flow from operating activities* | 3,798 | 2,984 | (6,394) |
Cash capital expenditure | 2,549 | 2,681 | 3,469 |
| External power sales (terawatt hours) [C] | 306 | 279 | 243 |
| Sales of pipeline gas to end-use customers (terawatt hours) [D] | 652 | 738 | 843 |
[A]See Note 7 to the "Consolidated Financial Statements" which includes an explanation of the reporting segment changes applicable from 2024.
[B]Segment earnings, Adjusted Earnings and Adjusted EBITDA are presented on a current cost of supplies basis.
[C]Physical power sales to third parties; excluding financial trades and physical trade with brokers, investors, financial institutions, trading platforms, and wholesale traders.
[D]Physical natural gas sales to third parties; excluding financial trades and physical trade with brokers, investors, financial institutions, trading platforms, and wholesale traders. Excluding sales of natural gas by other segments and LNG sales.
Cash capital expenditure
Within cash capital expenditure, $1.6 billion was in low-carbon energy solutions. This includes Renewable Power Generation, Environmental Solutions, Hydrogen and CCS. In 2023, cash capital expenditure included $2.3 billion in low-carbon energy solutions. Higher cash capital expenditure in 2023 was mainly a result of Hollandse Kust Noord spending.
Our cash capital expenditure is expected to be in the range
of $2-3 billion in 2025.
| | | | | |
| |
| See "Our journey to net zero" on page 104. |
| |
Operational performance
External power sales
In 2024, our external power sales increased compared with 2023 as a result of organic customer growth across the portfolio and acquisitions.
Sales of pipeline gas to end-use customers
In 2024, the decrease in our sales of pipeline gas to end-use customers was mainly driven by the decision to prioritise value over volume, focusing on higher-margin sales.
Strategic progress
Portfolio and business developments
Key portfolio and business developments:
○In January 2024, our Savion subsidiary completed the sale of its 50% interest in the Madison Fields 180 MW solar development in Ohio, USA, to InfraRed Capital Partners.
○In March 2024, we sold our 50% interest in SouthCoast Wind, a joint venture established to develop wind projects off the coast of Massachusetts, USA, to our partner, Ocean Winds.
○In March 2024, Hollandse Kust Noord, our offshore wind park in the Netherlands (Shell interest 79.9%), achieved commercial operations.
○In May 2024, Shell opened its first solar park in Zamboni, Italy, with a capacity of 20 MW.
○In June 2024, together with our partner, ATCO EnPower we took the final investment decision on the Atlas Carbon Storage Hub in Canada.
Strategic Report | Performance in the year | Generating shareholder value | Renewables and Energy Solutions continued
○In July 2024, we took the final investment decision to build REFHYNE II, a 100 MW electrolyser to produce renewable hydrogen, in Germany.
○In September 2024, the Northern Lights joint venture (Shell interest 33.3%) completed the construction of carbon storage facilities in Norway.
○In October 2024, we signed an agreement to acquire RISEC Holdings, which owns a 609 MW two-unit combined-cycle gas turbine power plant in Rhode Island, USA. We completed the transaction in January 2025.
○In December 2024, Rangebank battery energy storage system (BESS) in Australia became operational.
Business and property
We are building a business to deliver clean energy for our customers.
Despite the rapid growth seen in recent years, the renewable energy sector as a whole is experiencing significant challenges, including supply chain disruptions and regulatory hurdles, which have led to delays, increased costs and downward pressure on margins. 2024 was a year of significantly lower volatility in gas and power markets, which prevented us from maintaining trading and optimisation results at the levels we have seen in previous years. Our market outlook and supply chain environment has also deteriorated, resulting in significant impairment charges across various assets within our North American and European portfolios. To address this and given our focus on value, we refreshed our renewable generation, energy marketing, and gas and power trading strategy in December 2024. As part of this refresh, we are shifting our asset portfolio towards energy storage and flexible generation, and we are reducing investments in offshore wind assets. Our refresh also sees an increased focus on gas and power trading, leveraging our existing capabilities and technology to improve returns of this business. We also aim to maximise returns from our existing onshore positions by using capital-light business models, debt finance and working with partners.
Energy marketing
We provide electricity and smart energy solutions to residential, commercial and industrial customers. We do this through direct electricity sales, storage solutions and energy optimisation services. Our largest markets for commercial and industrial customers are Australia and the USA. In Australia, we are one of the largest commercial and industrial retailers of electricity in the market.
Trading and optimisation
We trade and optimise power and pipeline gas, and carbon credits from our own assets and from third parties. We work with Shell businesses across regions to offer energy solutions that can help our customers decarbonise. We have a gas and power trading presence
in key markets, including the Americas and Europe, but also in Australia
and Asia.
In October 2024, we signed an agreement to acquire RISEC Holdings, which owns a 609 MW two-unit combined-cycle gas turbine power plant in Rhode Island, USA. We completed the transaction in January 2025. This acquisition secures long-term supply and capacity offtake for Shell in the deregulated Independent System Operator New England (ISO New England) power market.
Renewable power generation
We enable renewable power generation by owning and operating solar plants and wind farms, and by participating in joint ventures. We target selective growth in markets where there is potential for integration with our value chain.
A significant milestone was achieved by the CrossWind joint venture (Shell interest 79.9%) when the Hollandse Kust Noord offshore wind development in the Netherlands achieved commercial operations in
March 2024 after producing its first electricity in June 2023. The wind farm plans to supply electricity to the 200 MW electrolyser Holland Hydrogen 1 (Shell interest 100%) that we are building in the Netherlands
| | | | | | | | |
|
| | |
| Savion completes build and sale of Madison Fields In the USA, our wholly owned subsidiary Savion is a utility-scale solar and energy storage developer. Savion specialises in developing solar power and energy storage projects, serving a variety of customers, including utilities and major commercial and industrial organisations. In January 2024, Savion completed the construction and sale of its 50% interest in the Madison Fields 180 MW solar park to InfraRed Capital Partners. Madison Fields, in Madison County, Ohio, is the first project to be designed, developed and owned by Savion. In July 2024, the project achieved commercial operations and Savion entered into a long-term power purchase agreement (PPA) with Amazon for the offtake of the facility's full capacity generation of solar energy. Savion also signed an agreement in June 2024 to sell the 150 MW Cass County Solar Project in Illinois, to Ameren Missouri. In December 2024, Savion's solar farm in Martin County in Kentucky, USA reached commercial operations. | |
| Photo: Madison Fields solar park, Ohio, USA. | |
| | |
In May 2024, Shell opened its first solar park in Zamboni, Italy, with a capacity of 20 MW. Shell also signed a power purchase agreement for Baker Hughes to offtake part of the power generated at the plant.
At the end of 2024, our share of renewable power generation capacity was 3.4 GW in operation and 4.0 GW in development.
Our renewable power generation capacities are listed below:
| | |
| Renewable power generation capacity in operation and in development as of December 31, 2024 - by region |
| | | | | | | | | | | | | | | | | |
| In operation [A] | | In development [B] |
| Location | 100% capacity (MW) | Shell interest (MW) | | 100% capacity (MW) | Shell interest (MW) |
| Asia | 2,394 | 1,983 | | 2,220 | 2,047 |
| Europe | 1,858 | 1,118 | | 965 | 661 |
Americas | 465 | 214 | | 1,920 | 1,165 |
| Australia | — | — | | 120 | 120 |
Other | 84 | 76 | | 18 | 17 |
| Total | 4,801 | 3,391 | | 5,243 | 4,010 |
Strategic Report | Performance in the year | Generating shareholder value | Renewables and Energy Solutions continued
| | |
Renewable power generation capacity in operation and in development as of December 31, 2024 |
| | | | | | | | | | | |
| 2024 | 2023 | 2022 |
Renewable power generation capacity (Shell interest - gigawatts): | | | |
| In operation [A] | 3.4 | 2.5 | 2.2 |
| In development [B] | 4.0 | 4.1 | 4.2 |
[A]Renewable generation capacity post commercial operation date.
[B]Renewable generation capacity under construction and/or committed for sale under
long-term offtake agreements (PPA).
Hydrogen
Hydrogen can help reduce emissions for our customers in sectors which are hard to decarbonise, such as heavy industry and heavy-duty road transport. We can also use it to help decarbonise our own assets. Shell is part of joint ventures and alliances that have built electrolysers and hydrogen filling stations. We have also participated in feasibility studies that aim to show the viability of a global import and export market for hydrogen.
When it comes to developing hydrogen investment opportunities, we aim to do so where we see adjacencies with our integrated business value chain and where we believe there are pathways to attractive returns. Since 2021, we have operated an electrolyser (Shell interest 100%) in Germany, which produces hydrogen using electricity from renewable sources. In July 2022 we announced the final investment decision to build Holland Hydrogen I. Construction is progressing well, and we expect to start commissioning in late 2026, with production ramp-up in 2027. In July 2024, we took the final investment decision to build REFHYNE II, a 100 MW electrolyser to produce renewable hydrogen in Germany. We plan to use this hydrogen to partially decarbonise the Shell Energy and Chemicals Park Rheinland. We expect the electrolyser to be operational by the end of the decade.
Photo: Holland Hydrogen I, one of Europe's largest renewable hydrogen plants, under construction in the Netherlands.
Carbon capture and storage (CCS)
We report existing CCS operations that help decarbonise our own assets in the segment where the relevant asset sits. We also offer carbon capture, transport and storage to our customers as we seek to help them decarbonise.
In September 2024, the Northern Lights joint venture (Shell interest 33.3%) in Norway completed the construction of its carbon storage facilities. Northern Lights is designed to transport and store up to 1.5 million tonnes of CO2 per year in its first phase. We expect the first shipment of CO2 in early 2025 from industrial customers in Norway and Continental Europe. Equinor and TotalEnergies are equal partners in the joint venture.
In June 2024, Shell took an FID with its partner, ATCO EnPower, on the Atlas Carbon Storage Hub (Shell interest 50%). Atlas is designed to store an estimated 650,000 tonnes of CO2 captured annually from the Shell Energy and Chemicals Park Scotford in Alberta, Canada. The CO2 is to be captured by Shell's Polaris project for which an FID was also taken in 2024. Both Polaris and Atlas are expected to begin operations towards the end of 2028.
| | | | | |
| |
| See "Progressing CCS to decarbonise our and customers' activities" on page 84. |
| |
Shell also has CCS project opportunities at earlier stages of development in Canada, the USA, Europe, the Middle East and Asia.
Nature and environmental solutions
Through the Nature Based Solutions (NBS) business and the Environmental Products Trading Business (EPTB), we provide carbon credits to our customers. NBS invests in projects that conserve, enhance and restore ecosystems – such as forests, grasslands and wetlands – to prevent GHG emissions or reduce atmospheric CO2 levels.
Through EPTB, we develop, source, offtake, trade and supply environmental products across compliance and voluntary markets. This includes working with our other businesses such as Integrated Gas or Marketing to provide integrated energy solutions to customers.
Shell Ventures
Through Shell Ventures entities we act as an investor and a partner to start-ups, businesses and venture funds to help accelerate the energy and mobility transformation. We invest in companies that work on solutions to lower emissions, electrify energy systems, gain data-based insights and provide innovative consumer solutions.
Investments
Within R&ES, we maintain an integrated business model with trading and optimisation to help us manage our value delivery. Our investments in low-carbon solutions are subject to financial modelling and stress-testing, due diligence and risk assessments to ensure that our capital is allocated to the most attractive low-carbon projects and opportunities.
Strategic Report | Performance in the year | Generating shareholder value
| | | | | | | | | | | | | | | | | | | | |
| | Corporate covers the non-operating activities supporting Shell. It comprises Shell's holdings and treasury organisation, headquarters and central functions, self-insurance activities, and centrally managed longer-term innovation portfolio. | |
| | | | | | |
| | (3.0) Segment earnings ($ billion) (2023: (2.9)) | | | (2.0) Adjusted Earnings ($ billion) (2023: (2.9)) | |
| | (1.9) Cash flow from operating activities ($ billion) (2023: (0.8)) | | | | |
| | | | | | |
Strategic Report | Performance in the year | Generating shareholder value | Corporate continued
Headquarter and central functions provide communications, finance, treasury, human resources, information technology (IT), legal, real estate and security services to the businesses. These functions also provide support for shareholder-related activities, such as investor relations. The central functions are supported by business service centres, which process transactions, manage data and produce regulatory returns, among other services.
All finance expense, income and related taxes for Shell, which is headquartered in London, are included in the Corporate segment earnings rather than the business segment earnings. Most headquarter and central function costs are recovered from the business segments. Costs that are not recovered or relate to centrally managed activities are retained in Corporate.
The Holdings and Treasury organisation manages many of our corporate entities. It is the point of contact between Shell and external capital markets and, for example, raises debt instruments and conducts foreign exchange transactions. Treasury centres in London and Singapore support these activities.
Shell's innovation portfolio is managed as a central function. We have major research and development (R&D) centres in the Netherlands, the USA and India, and smaller specialised centres in Germany, Brazil and China. We use technology to enhance our existing value chains and help build the energy system of the future. Shell's longer-term innovation portfolio is reported as part of the Corporate segment. Other innovation portfolio activities are reported in the business segments.
Earnings 2024-2023
An increase in the negative segment earnings was mainly driven by reclassifications, from equity to profit and loss, of cumulative currency translation differences principally triggered by changes in the funding structure. This resulted in unfavourable movements of $1,122 million, included in identified items, and was partially offset by favourable tax movements, net interest movements and currency exchange rate effects.
Photo: A view of the Shell Centre, our headquarters, from across the River Thames in London, UK.
| | | | | | | | | | | |
| $ million, except where indicated |
| 2024 | 2023 | 2022 |
Segment earnings [B] | (2,992) | (2,944) | (2,562) |
Identified items | (1,024) | (69) | (90) |
| Adjusted Earnings*[B] | (1,968) | (2,875) | (2,472) |
| Adjusted EBITDA*[B] | (675) | (1,164) | (856) |
Cash flow from operating activities* | (1,882) | (832) | 2,192 |
[A]See Note 7 to the "Consolidated Financial Statements" which includes an explanation of the reporting segment changes applicable from 2024.
[B]Segment earnings, Adjusted Earnings and Adjusted EBITDA are presented on a current cost of supplies basis.
* Non-GAAP measure (see page 337).
Prior year earnings summary
An increase in the negative segment earnings was mainly driven by unfavourable movements in currency exchange rate effects
and tax credits.
Cash flow from operating activities
Cash flow from operating activities decreased primarily due to unfavourable working capital movements.
Self-insurance
Shell, like other major oil and gas companies, self-insures most of its exposures to hazard risks. Our Group insurance companies are wholly owned subsidiaries. They provide insurance coverage to our subsidiaries and entities in which we have an interest, including those that are not controlled by Shell.
We continually assess the safety performance of our operations and make risk mitigation recommendations, where relevant, to keep the risk of an accident as low as possible. Our insurance companies are adequately capitalised and they may transfer risks to third-party insurers where economical, effective and relevant.
| | | | | |
| |
| See "Risk factors" on page 30. |
| |
Strategic Report | Performance in the year | Generating shareholder value
Shell operates certain key activities centrally. These include Projects & Technology, intellectual property and information technology. This allows us to provide leadership, innovation and risk management across our business.
Information technology and cyber security
Digitalisation is a key success factor in delivering Shell's strategy. We are transforming our IT systems to support our evolving portfolio of businesses. We invest in new technologies, such as artificial intelligence (AI) and quantum computing, to enhance our IT capabilities and bring value to the business.
The growing dependence on IT and rising data volumes introduce risks. A breach in IT systems or data loss could significantly impact Shell and its supply chain, leading to productivity disruptions, loss of confidential information, regulatory penalties, and potential reputational harm. Additionally, sanctions, including orders to delete data and regulatory fines, might be imposed on Shell if authorities find Shell failed to meet its obligations in relation to cyber security or personal data protection.
In 2024, we continued to implement a comprehensive cyber security programme as part of our cyber defence strategy. This was done through the formalisation of the Information and Digital Technology (IDT) requirements based on the Shell Performance Framework (SPF). Our Information and Digital Technology Standard sets out a structured approach to identify, assess and mitigate IT and cyber security risks. Following the approval of the IDT requirements, we refreshed our Information Risk Management (IRM) capabilities and streamlined the organisational structure to enhance the formal Chief Information Security Officer (CISO) role, with support from the Executive Committee. This included integrating the cyber defence teams and other decentralised cyber security functions into the central IRM organisation. These changes are in effect from March 2025.
Our global integrated IRM and cyber defence teams are staffed with cyber security professionals that monitor, assure and help defend our global IT and data landscape. As all our employees play a role in protecting our IT systems, we give them training on data protection, regulatory compliance and regularly run cyber security awareness campaigns and simulations on how to respond to cyber-attacks.We evaluate emerging digital technologies with our businesses annually to align on their impact and necessary remediation, considering the value and opportunities they present, as well as their incremental risks. Additionally, Shell works to monitor and respond in real time to cyber security incidents as they happen.
Cyber security risk management
Our cyber security capabilities are embedded into our IT systems, and our IT and data are protected by various detective and protective technologies and controls. A structured approach to identify, assess and mitigate the IT and cyber security risks is built into our support processes and is benchmarked to external best practices. We continuously track cyber-attacks, threat intelligence, cyber legislation (including the EU AI Act) and vulnerabilities relevant to our IT landscape and have a well-structured incident management and escalation process in place.
The security of IT services, where operated by external IT companies, is managed through contractual clauses and additionally through formal supplier assurance reports for critical IT services. Shell collaborates bi-annually with third parties and supplements these reports with bi-annual internal benchmarking to assess our cyber security risk management practices against cyber security best practices and peer organisations. Using the insights gained from these assessments, along with changes in external risks and the outcome of internal audits and control testing results, we enhance our cyber security capabilities and adopt a risk-based strategy for our investment decisions concerning cyber risk exposure.
Shell employees and contract staff are required to complete mandatory training courses and participate in regular cyber threat awareness campaigns. In 2024, we introduced the Think Secure Scorecard across the organisation. This provides data insights into the cyber behaviour of Shell staff on an individual level, encouraging continuous learning about cyber threats and advocating personal accountability. Shell has robust governance processes to monitor key cyber risks, provide risk assurance and encourage a corporate culture that prioritises security.
Our cyber security strategy is regularly reviewed and updated, as required, by our CISO and Shell's Information and Digital Technology leadership team, with oversight from the EC, the Audit and Risk Committee, and the Board. These reviews involve consideration of external environment changes; strategic, operational, and cultural risks; response to cyber security risks and implementation of further remedial actions as appropriate; and updates on the performance and benchmarking of the Group's cyber defences. In 2024, dedicated deep dives into areas, such as geopolitical developments and artificial intelligence (AI), were performed. In 2024, Shell reported data privacy incidents to regulatory authorities across multiple jurisdictions. There were no cyber or data privacy incidents that had a material impact on Shell's business strategy, operations, or financial condition.
Strategic Report | Performance in the year | Generating shareholder value | Other central activities continued
The IRM organisation leadership teams involved in monitoring and managing our cyber security threat risk and assurance process have an average of around 25 years of experience. The IRM organisation is led by our CISO, who has more than 20 years of experience in the IT and information security field, including serving as the chief information officer for various large public companies. In addition to holding the Certified Information Systems Security Professional (CISSP) certification, our CISO holds other qualified technical expert certifications, has completed the London School of Economics Executive Development programme, and holds an undergraduate degree in management information systems, risk management, and corporate finance. Our CISO is active in various cyber-security industry trade groups and is on the board of Oil and Natural Energy Information Sharing and Analysis Center (ONE-ISAC), having previously held leadership positions in the oil and gas cyber security sector.
Intellectual property
At Shell, we have a wide-ranging intellectual property (IP) portfolio which includes patents, trademarks, know-how, trade secrets and copyrights. The distinctive Shell Pecten, a trademark in use since the early 20th century, and trademarks where the word Shell appears, help raise the profile of our Shell brand globally. We protect and defend our IP and we respect the valid IP rights of others. At December 31, 2024, we held 8,677 patents. This includes granted patents and pending patent applications.
Shell holds trademarks globally, even in countries where we no longer operate. For instance, in 2024, we renewed national trademark registrations for the word marks "Shell", "Shell Spirax" and the Shell logo, through our local agent SABA Intellectual Property, who paid $10,543 in official fees to the Syrian Patent Office. Although we ceased operations in Syria in 2011, these renewals do not indicate any product sales in the country.
Innovation
We use technology to improve our efficiency, safety and competitiveness. By applying our technical and digital capabilities,
we can also help build the low-carbon energy system of the future. In 2024, we invested $1,099 million in research and development (R&D). We combine our expertise in R&D with digital solutions, often powered by AI, to help accelerate innovation and scale up more effectively.
Shell's Projects & Technology organisation and our businesses work together to determine the content, scope and budget for developing new technology that supports our activities. This includes partnering with start-ups and small- to medium-sized enterprises that are in the early stages of developing new technologies through our Shell Ventures and Shell GameChanger programme. New technology is developed using a maturation process, to systematically mitigate technical and commercial risks, while staying aligned with Shell's strategic ambitions and deployment commitments.
| | | | | |
| |
| See "Risk factors" on page 30. |
| |
| | | | | | | | |
|
| | |
| Innovation is pivotal to what we do Our research and development (R&D) seeks to deliver innovative, cost-competitive solutions that meet global energy demands while reducing emissions. To achieve this, we have a network of R&D centres and collaborate closely with our customers, suppliers and partners, as well as with many of the world's leading universities and research institutes. Global Lubricants In 2024, for instance, our Global Lubricants business was named industry leader by market analysts Kline + Company for the 18th consecutive year for consumer automotive, commercial automotive and industrial lubricants. These lubricants are designed to continually push the boundaries of engine and equipment performance and longevity, as well as to reduce emissions. This leadership is built on more than 45 years of research and commercial development of our proprietary gas-to-liquids (GTL) technology with which we make high-quality liquid fuels, base oils for lubricants, and other speciality products from natural gas. Keeping data centres cool We recently extended our comprehensive GTL product range by developing an immersion cooling fluid for data centres that significantly improves their performance and energy efficiency. Data centres consume vast amounts of electricity to power the servers and cool the heat they generate. Our new GTL immersion cooling fluid allows servers to run faster and cooler, improving computing performance and enabling considerable reductions in energy use, CO2 emissions and operating costs compared to conventional air cooling. Second-generation biofuels Shell is one of the world's largest producers, distributors and traders of biofuels made from sugar cane, corn and other types of biomass. In 2024, we commissioned a demonstration plant in partnership with Green Plains in Nebraska, USA, that uses our proprietary Shell Fibre Conversion Technology to convert the oil in corn kernels into second-generation low-carbon biofuel and high-protein animal feed. This bolt-on technology is designed to help first-generation ethanol producers increase yield and margin – making their operations more valuable and more resilient. | |
| Photo: Two scientists analysing industrial and off-highway lubricants at Shell's Shanghai Technology Centre, China. | |
| | |
Strategic Report | Performance in the year
| | | | | | | | |
| | |
| Our journey to net zero |
| We have a target to be a net-zero emissions energy business by 2050 and work with our customers across sectors to help accelerate the energy transition. |
| | |
Strategic Report | Performance in the year | Our journey to net zero continued
Shell's energy transition plans
Our target is to become a net-zero emissions energy business by 2050 and we are transforming our operations and energy products. We believe this target supports the more ambitious goal of the Paris Agreement, to limit the rise in the global average temperature this century to 1.5°C above pre-industrial levels.
The Paris Agreement aims to strengthen the global response to the threat of climate change by "holding the increase in the global average temperature to well below 2°C above pre-industrial levels and pursuing efforts to limit the temperature increase to 1.5°C above
pre-industrial levels".
As we implement our strategy to deliver more value with less emissions, we are responding to evolving global demand by offering our customers more and cleaner energy solutions.
The world needs a balanced energy transition, one that maintains secure energy supplies, while accelerating the transition to affordable low-carbon solutions. We believe our strategy supports a balanced transition by providing the oil and gas people need today, while helping to build the energy system of the future.
We recognise that the scale of the energy transition requires fundamental change in both supply and demand. It will take supportive government policies, advances in technology and investments by companies across all parts of the economy to achieve this. We advocate policies, legislation and regulations in areas where we can best support the decarbonisation of our customers, reduce our own emissions and help accelerate the energy transition.
There remains significant uncertainty around the shape of the future energy system. As a result, we are developing a multi-energy portfolio that has the flexibility to respond to uncertainty, and that we believe will allow us to remain a successful business while working towards net-zero emissions. We are changing the mix of energy products we sell and developing new carbon removal and abatement businesses.
We aim to lead in the energy transition where we have competitive strengths, see strong customer demand, and identify clear regulatory support from governments.
We are reducing emissions from our operations, and helping our customers transition to more cost-competitive and cleaner energy solutions. Our energy transition plans cover all our businesses.
Integrated Gas - growing our world-leading LNG business with lower carbon intensity
We plan to grow our LNG volumes by adding new liquefaction capacity. We are developing new projects with lower carbon intensity by using renewable power and carbon abatement technology in the form of carbon capture and storage (CCS). Beyond our own production, we will continue to add scale and flexibility to our portfolio by growing the LNG volumes that we purchase from third parties.
LNG provides both energy security and flexibility because it can be easily transported to places where it is needed most. It is also a critical fuel in the energy transition. Natural gas is the lowest-carbon fossil fuel, producing around 50% less carbon emissions than coal when used to generate electricity, according to the International Energy Agency.
Upstream - cutting emissions from oil and gas production.
As we sustain oil and gas liquids production, we will continue to focus on delivering more value with less emissions. The oil we are producing will increasingly come from our deep-water business. Through innovative designs, our deep-water platforms are producing higher-margin and lower-carbon barrels.
As a responsible energy producer, we are implementing carbon management plans and working to reduce carbon emissions from our assets. We are looking at ways to electrify our offshore oil facilities, and using wind and solar power to reduce operational emissions. We see CCS as a core technology to further capture emissions from our facilities, reusing our own oil and gas fields where possible.
We set a target to eliminate routine flaring from our upstream-operated assets by 2025 [A] five years ahead of the World Bank's initiative. Routine flaring burns gas that is not used or reinjected into wells, which is inefficient and contributes to climate change. With effect from January 1, 2025, SPDC has ceased routine flaring of associated gas, with the completion of essential gas capture projects and the shut-in of remaining facilities from which gas cannot be transported to market. We have therefore met our target to eliminate routine flaring from our upstream-operated assets by 2025 as of this date.
[A]This target was subject to the completion of the sale of The Shell Petroleum Development Company of Nigeria Limited (SPDC). As detailed elsewhere in this report, on March 13, 2025, Shell completed the sale of SPDC to Renaissance.
Downstream, Renewables and Energy Solutions – focusing our businesses to offer more low-carbon solutions while reducing sales of oil products.
We are starting from a place of strength. We believe that our global customer reach, our innovation and technology, and the strength of our supply and trading capabilities, mean we are well placed to deliver the low-carbon solutions people and businesses need, such as electric vehicle charging and biofuels, to support our customers as they decarbonise. Leveraging our integrated portfolio of energy and chemicals parks, terminals and blending plants, we will make, buy, and blend products to meet customer demand. We are also able to identify changes in demand for products so that we can respond quickly.
To help us get to net zero, we have set short-, medium- and long-term targets to reduce the carbon intensity of the energy products we sell, measured by using our net carbon intensity (NCI) metric. We believe these targets are aligned with a 1.5°C pathway derived from scenarios developed for the IPCC's Sixth Assessment Report (AR6). For more information see "Setting targets for NCI" on page 119.
We set out our climate-related targets and ambition on page 121.
| | | | | |
| |
| See "Our strategy" on pages 19-22. |
| |
Strategic Report | Performance in the year | Our journey to net zero continued
[A]This target was subject to the completion of the sale of The Shell Petroleum Development Company of Nigeria Limited (SPDC). With effect from January 1, 2025, SPDC ceased routine flaring. As detailed elsewhere in this report, on March 13, 2025, Shell completed the sale of SPDC to Renaissance.
[B]On an intensity basis. Methane intensity is measured separately for oil and gas assets with marketed gas (gas, LNG and GTL available for sale) and assets without marketed gas (oil and gas assets where gas is reinjected).
[C]We set this ambition in March 2024. Customer emissions from the use of our oil products (Scope 3, Category 11) were 517 million tonnes carbon dioxide equivalent (CO2e) in 2023 and 569 million tonnes CO2e in 2021.
Strategic Report | Performance in the year | Our journey to net zero continued
Strategic Report | Performance in the year | Our journey to net zero continued
Climate-related risks and opportunities identified by Shell over the short, medium and long term We are continually enhancing our approach to assessing and managing risks and opportunities resulting from climate change. This includes considering different time horizons and their relevance to risk identification and business planning. We actively monitor societal developments, such as regulation-driven carbon pricing mechanisms and customer-driven preferences for products. We incorporate these developments, where relevant, into potential scenarios which provide insights into how the energy transition may unfold in the medium and long term. These insights and those from various external scenarios (such as those prepared for the IPCC AR6) help guide how we set our strategy, capital allocation and climate-related targets and ambition.
The process for identifying and assessing climate-related risks is set out in "Risk management" on page 34. The impact and likelihood assessment described on page 34 helps us to prioritise climate-related risks and determine their relative materiality, based on a comprehensive picture of significant risks to any relevant business objectives. We consider climate-related risks from a strategic, operational, conduct and culture perspective to help us maintain a comprehensive view of the different types of climate risks we face and the different time horizons in which they may affect us. Monitoring and reviewing risks is a key risk management process. The EC, the Board and Board committees review climate-related risks and their impact on the Group, as appropriate. This allows management to take a holistic view and optimise risk mitigation responses, to ensure that climate-related risk responses are properly integrated into the relevant activities.
Shell has identified climate change and the energy transition as a material risk. The risk could potentially continue to result in changes to the demand for our products, supply chains and markets; further changes to the regulatory environment in which we operate; and increased litigation (see Note 32 to the Consolidated Financial Statements "Legal proceedings and other contingencies" on page 293).
The risk is composed of a combination of complex and interrelated elements that affect Shell's value chain and our asset, product and business portfolio. The risk landscape is evolving rapidly. To achieve our climate-related targets and ambition, active holistic management of all climate-related risk components is important. The composite risk is broken down into the following sub-components:
○commercial risk;
○regulatory risk;
○societal risk (including litigation risk); and
○physical risk.
We are working to mitigate our identified climate-related risks and deliver more value with less emissions by focusing on performance, discipline and simplification. We believe we are positioning ourselves to achieve our financial targets, and climate-related targets and ambition by:
○reducing the GHG emissions from our operations (Scope 1 and 2) by improving our energy efficiency, deploying renewable electricity, and reducing methane emissions in our assets and projects;
○growing our LNG business while decarbonising our LNG portfolio in two main ways: by growing our portfolio with a lower carbon intensity, and continuing to invest in emissions abatement projects to reduce both CO₂ and methane emissions;
○managing our Integrated Gas and Upstream portfolio to support a balanced energy transition by cutting emissions from oil and gas production. Oil production is increasingly from our deep-water business which, through innovation, produces higher-margin and lower-carbon barrels; and
○focusing our businesses in Downstream and Renewables and Energy Solutions to offer more low-carbon energy solutions, while reducing sales of oil products.In addition, we adapt our assets and activities as necessary to enhance our resilience to the physical risks related to climate change. Many of these adaptations are based on our Safety, Environment and Asset Management (SEAM) Standards and practices.
| | | | | |
| |
| See page 100 for more details of physical risks. |
| |
Our approach to climate change emphasises the need to work collaboratively. We aim to continue to build strategic alliances with customers, other companies and entire sectors so we and they can make profitable progress towards net zero.
We engage with governments on their climate policies to advocate policies that help establish regulatory frameworks that will help to enable society to reach the goals of the Paris Agreement. We are a founding member of the Oil and Gas Climate Initiative (OGCI), a group of 12 national and international energy companies. The OGCI supports the climate goals of the Paris Agreement and recognises that collective actions can help drive the energy transition.
We are signed up to the Oil and Gas Decarbonization Charter (OGDC), in which companies have pledged to achieve near-zero methane emissions by 2030, zero routine flaring by no later than 2030 and commit to halving scope 1 and 2 emissions by or before 2050. In April 2024, we became the first official partner to the World Bank Global Flaring and Methane Reduction Fund partnership which we committed to at the 28th Conference of the Parties (COP28) in 2023. We are a founding signatory of the Oil and Gas Methane Partnership (OGMP) 2.0 reporting framework. Shell achieved the OGMP 2.0 Gold standard of reporting in 2023.
As a leading global energy business, Shell seeks to identify opportunities in the energy transition. These risks and opportunities are described below. Climate-related risks are also summarised in the "Risk factors and risk management" section on pages 27-28.
Time horizons: short, medium and long
Due to the inherent uncertainty and pervasive risks across our strategy and business model, we monitor climate-related risks and opportunities across multiple time horizons.
○Short term (up to three years): we develop detailed financial projections and use them to manage performance and expectations on a three-year cycle. These projections incorporate decarbonisation measures required to meet our short-term targets.
○Medium term (generally three to 10 years): these are embedded within our Operating Plan, with our continued focus on the customer, the investments and portfolio shifts required in the medium term that will reshape Shell's portfolio.
○Long term (generally beyond 10 years): our portfolio and product mix are expected to evolve over time with changing customer demand.
Strategic Report | Performance in the year | Our journey to net zero continued
| | | | | |
Transition risks |
| Description | CR1 Climate-related commercial risk ○The transition to a low-carbon economy may lead to lower sales volumes and/or margins due to a general reduction or elimination of demand for oil and gas products, possibly resulting in underutilised or stranded oil and gas assets, and a failure to secure new opportunities. ○Changing preferences of investors and financial institutions could reduce access to and increase the cost of capital. |
Relevant time horizon | medium and long |
Potential material impacts | Lower demand and margins for oil and gas products ○Changing customer sentiment favouring the use of renewable and sustainable energy products may reduce demand for our oil and gas products. An excess of fossil fuel supply over demand could in the future result in reduced fossil fuel prices. This could result in lower earnings in the future, cancelled projects and potential impairment of certain assets. Changing preferences of investors and financial institutions ○Certain investors have decided to divest their investments in fossil fuel companies. If this were to increase significantly, it could have a material adverse effect on the price of our securities and our ability to access capital markets. Some investors and financial institutions have been aligning their portfolios to a low-carbon and net-zero world, driven by both regulatory and broader stakeholder pressures. ○A failure to decarbonise our business portfolios in line with investor and lender expectations could have a material adverse effect on our ability to access financing for certain types of projects. This could also adversely affect our partners' ability to finance their portion of costs, either through equity or debt. ○Sensitivity analysis of a 1% shift in Shell's weighted average cost of capital on asset carrying values is presented in the section "Carbon pricing and discount rate sensitivities" on page 106. Remaining in step with the pace and extent of the energy transition ○The energy transition provides us with significant opportunities, as described in "Climate-related opportunities" (CO1) below. If we fail to stay in step with the pace and extent of change, or customers and other stakeholders' demand for low-carbon products, this could adversely affect our reputation and future earnings. If we move much faster than society, we risk investing in technologies, markets or low-carbon products for which there may be insufficient demand. Therefore we cannot transition too quickly or we will be trying to sell products that customers do not want. If we are slower than society, customers may prefer a different supplier, which would reduce demand for our products and adversely affect our reputation and materially affect our financial results. ○Low-carbon technology and innovation are essential to our efforts to help meet the world's energy demands competitively. If we are unable to develop the right technology and products in a timely and cost-effective manner there could be an adverse effect on our future earnings. The operating margins for our low-carbon products and services have been, and could continue to be, lower than the margins we have experienced historically in our oil and gas operations. |
Description | CR2 Climate-related regulatory risks ○The transition to a low-carbon economy has increased, and is likely to continue to increase the cost of compliance for our assets and/or products, and may include restrictions on the use of hydrocarbons. The lack of net-zero-aligned global and national policies and frameworks increases the uncertainty around this risk. |
| Relevant time horizon | short, medium and long |
Potential material impacts | Increased compliance costs ○Some governments have introduced carbon pricing mechanisms, which we believe can be an effective way to reduce GHG emissions across the economy at the lowest overall cost to society. ○Shell's cost of compliance with the Emissions Trading Scheme (ETS) and related schemes was around $381 million in 2024, as recognised in Shell's Consolidated Statement of Income for 2024. A further $3,565 million of costs in respect of emissions schemes and related environmental programmes were incurred in respect of biofuels ($2,942 million) and renewable power ($623 million) programmes (see Note 5 to the "Consolidated Financial Statements" on pages 250-251). ○Shell's annual carbon cost exposure (including ETS and related schemes) is expected to increase over the next decade because of evolving carbon regulations, with the forecast annual cost exposure in 2025 estimated to be around $1 billion and around $5 billion in 2034. This estimate is based on a forecast of Shell's equity share of emissions from operated and non-operated assets, and real-term carbon cost estimates using the mid-price scenario (see Note 4 to the "Consolidated Financial Statements" on pages 237-249 for more information) [A]. This exposure also takes into account the estimated impact of available CO2 free allowances as relevant to assets based on their location [B]. Restrictions on use of hydrocarbons ○Governments may set regulatory frameworks in the future that could further restrict our exploration and production of hydrocarbons, and introduce controls to limit the use of such products. Failure to replace proved reserves could result in an accelerated decrease of future production, which could have a material adverse effect on our earnings, cash flows and financial condition. Lack of net-zero-aligned global and national policies and frameworks ○The lack of net-zero-aligned global and national policies and frameworks increases the uncertainty around how carbon pricing and other regulatory mechanisms will be implemented in the future. This makes it harder to determine the appropriate assumptions to be taken into account in our financial planning and investment decision processes which could impair our ability to evaluate the robustness of our plans and opportunities. Changing net-zero policies and regulations could also lead to impairments of our existing oil and gas assets. |
[A]Carbon cost estimates that include inflation, usually a yearly 2% inflation is applied.
[B]Free allowances are amounts of CO2 an asset is allowed to emit without paying the emissions trading scheme (ETS) price/tax.
Strategic Report | Performance in the year | Our journey to net zero continued
| | | | | |
Transition risks continued |
Description | CR3 Climate-related societal risks (including litigation) ○As societal expectations develop around climate change, there is a potential impact on Shell's licence to operate, reputation, brand and competitive position. This is likely to include litigation. |
Relevant time horizon | short, medium and long |
Potential material impacts | Decline in reputation, brand and licence to operate ○Societal expectations of businesses are increasing, with a focus on business ethics, quality of products, contribution to society, safety and minimising damage to the environment. There is a focus on the role of the oil and gas sector in the context of climate change and the energy transition. This could negatively affect our brand, reputation and licence to operate, which could limit our ability to deliver our strategy, reduce consumer demand for our products, harm our ability to secure new resources and contracts, and restrict our ability to access capital markets or attract employees. Deteriorating relationships with key stakeholders ○Failure to decarbonise Shell's value chain in line with societal, governmental and investor expectations is a material risk to Shell's reputation as a responsible energy company. The impact of this risk includes shareholder divestment, greater regulatory scrutiny and potential asset closure resulting from public interest groups' protests. Litigation ○There is an increasing risk to oil and gas companies from private (including non-governmental organisations) and governmental lawsuits. If successful, these claims may have wide-ranging consequences, including forcing entities to hand over strategic autonomy in part to regulators, divesting from hydrocarbon technologies, denying entities regulatory approvals and/or requiring payment of fines or penalties or large compensation packages to plaintiffs. ○In some countries, governments, regulators, organisations and individuals have filed lawsuits of a wide variety, including seeking to hold oil and gas companies liable for costs associated with climate change, or seeking court-ordered reductions in emissions, challenging the regulatory approvals and operating licences, or challenging energy transition strategies and plans. While we believe these lawsuits to be without merit, losing could have a material adverse effect on our earnings, cash flows and financial condition. ○In the Netherlands, in a case against Shell brought by a group of environmental NGOs and individual claimants (referred to herein as "Milieudefensie"), the Hague District Court in 2021 found that while Shell was not acting unlawfully, Shell had the obligation to reduce the aggregate annual volume of CO2 emissions of Shell operations and energy-carrying products sold across Scope 1, 2 and 3 by 45% (net) by the end of 2030 relative to its 2019 emissions levels. For Scope 2 and 3, this was a significant best-efforts obligation. Shell appealed that ruling. On November 12, 2024, the Hague Court of Appeal upheld Shell's appeal and dismissed the claim against Shell. In doing so, the Court of Appeal annulled the earlier judgment of the District Court in its entirety with immediate effect. On February 11, Milieudefensie filed an appeal to the Supreme Court of the Netherlands. ○We have also been subjected to climate activism which has caused disruptions to our operations and such disruptions could happen again in the future. |
Strategic Report | Performance in the year | Our journey to net zero continued
| | | | | |
Physical risks |
Description | CR4 Climate-related physical risks ○The potential physical effects of changing climatic conditions could adversely affect our assets, operations, supply chains, employees and markets. |
| Relevant time horizon | short, medium and long |
Potential material impacts | Types of physical risk The impact of physical risks comes from both acute and chronic climate hazards. Acute hazards, such as flooding and droughts, wildfires and more severe tropical storms, and chronic hazards, such as rising temperatures and rising sea levels, could potentially impact some of our facilities, operations and supply chains. The frequency of these hazards and impacts is expected to increase in certain locations. Extreme weather events, whether or not related to climate change, could have a negative impact on our earnings, cash flows and financial condition. Mitigation of physical risks, whether or not related to climate change, is considered and embedded in the design and construction of our projects, and/or operation of our assets to help minimise the risk of adverse incidents to our employees and contractors, the communities where we operate, and our equipment. |
| Shell's assessment ○In 2023, we carried out a detailed review to assess the impact of a range of changing climatic conditions, including projected changes in temperature, precipitation, wind and sea levels, across segments and geographies for our significant assets. We used IPCC climate modelling data covering three exploratory climate scenarios (RCP2.6, RCP4.5 and RCP8.5 [A]) across the time horizons 2025, 2030 and 2050. These scenarios were selected to ensure a broad range of risks and uncertainties were assessed. There have been no changes to the climate modelling data that would require a full update of the 2023 assessment. We have confirmed there are no changes to the risk profile of our significant assets and accounted for portfolio changes. ○In the short to medium term, the risks identified were found to be related to factors that Shell is already aware of (whether or not related to climate change) and that the assets are actively managing to mitigate, e.g. hurricane impacts on the US Gulf Coast, rising air temperatures in the Middle East and water scarcity in Europe and Asia. As an example, in recent years the Rhine river in Europe has seen historic lows during the summer months leading to challenges in the use of barges for transportation of our products. Dredging of harbours and investment in shallower-draft barges have helped to mitigate the risk. ○In the long term, the results of the exercise indicated that while we have evaluated against current climate modelling projections and our current asset portfolio, by 2050 the frequency and severity of the climate hazards may differ from current projections. The level of predictability is such that the need for investment in climate adaptation measures at the assets is not immediate and the results mean we are in a position to monitor the assets and determine whether there is any need for adaptation action, e.g. the impact of potential water scarcity on various assets. ○Our testing to assess the potential impact of climate-related changes on our significant assets covers over 70% of the carrying value of our physical assets as at December 31, 2023. Over 12% (based on the carrying value) of physical assets tested are considered to be exposed to climate-related physical risks in the short to medium term which the assets are already actively managing to mitigate. In addition, we reviewed significant acquisitions made in 2023 and 2024, none of which were found to have significant climate-related physical risks in the short to medium term. ○Our business plan reflects the impact of mitigating actions in the short to medium term for the assets assessed. We will continue to monitor and assess the future exposure of our assets in the longer term to changing climatic conditions to establish the need for any further adaptation actions and related metrics. ○The impact of physical climate change on our operations is unlikely to be limited to the boundaries of our assets. For example, the downstream transportation and distribution of our products from our own operations could potentially be exposed to climate-related hazards that ultimately impact our operations. The overall impact, including how supply chains, resource availability and markets may be affected, also needs to be considered for a holistic assessment of this risk. Our assets manage this risk as part of broad risk and threat management processes as required by our SEAM Standards, part of the wider Shell Performance Framework. |
[A]Representative Concentration Pathway (RCP) refers to the GHG concentration (not emissions) trajectory adopted by the IPCC. The pathways describe different climate change scenarios, all of which are considered possible depending on the amount of GHG emitted in the years to come.
Strategic Report | Performance in the year | Our journey to net zero continued
| | | | | |
| Opportunities |
| Description | CO1 Climate-related opportunities ○The transition to a low-carbon economy also brings significant opportunities for us to benefit from changing customer demands, given our position as a leading global energy provider. |
| Relevant time horizon | short, medium and long |
Potential material impacts | As the global energy mix changes, our current infrastructure, know-how and global footprint put us in an ideal position to service the changing energy demands of the market. Our global customer reach, our use of technology and innovation to develop the business models and fuels of the future and the strength of our trading capabilities, coupled with our own production, will help us deliver affordable and low-carbon solutions for our customers. Our research and development (R&D) activities are an important contributor to achieving our net-zero emissions target. We believe we are the investment case and partner of choice through the energy transition. As we work to deliver more value with less emissions we are focusing on: LNG ○Demand for LNG is expected to grow. We are one of the world's largest suppliers of LNG, with around 40 million tonnes of equity capacity. Gas is critical to the energy transition and plays an important role in enabling countries to replace coal-fired power generation with a less carbon-intensive alternative, as on average, coal-to-gas switching reduces emissions by 50% when producing electricity [A]. LNG also provides grid stability alongside wind and solar power in electricity generation. LNG is the lowest-carbon marine fuel available at scale today and offers significant GHG emissions reductions compared with conventional fuels. Furthermore, LNG offers a long-term decarbonisation pathway through bioLNG when the supply is scaled up. Shell has developed the world's largest LNG fuelling network of ports and bunker vessels on key trading routes, enabling more customers to choose LNG. Beyond our own production, we expect to continue to add scale and flexibility to our portfolio by buying LNG from others. Our LNG business will remain a key priority for Shell, meeting continued strong demand especially in Asia where we send most of our shipments today. Our integrated model is at the heart of LNG value creation, with our business spanning every stage of the LNG journey. Biofuels ○We invest in biofuels where we see growing customer demand and where we can use the strength of our supply and trading positions. Aviation and shipping remain some of the slower-to-decarbonise sectors and we expect that they will require low-carbon molecular solutions, such as biofuels, at scale in the future. Shell is already one of the world's largest energy traders and blenders of biofuels, selling significantly more low-carbon fuels than we produce. We expect to continue to grow both our own production and sales of biofuels in the coming years. We are focusing on producing premium biofuels such as sustainable aviation fuel, renewable diesel and renewable natural gas (RNG). We expect that these fuels will help to reduce emissions in commercial road transport. To support our production of biofuels, we are investing in new feedstocks through investments and partnerships, while using the strength of our trading business to expand sales beyond our production volumes. Through our Raízen joint venture in Brazil we are already the largest producer of second-generation ethanol and the leading sugar-cane ethanol producer globally. To support growing demand for biofuels this decade, we are developing more second-generation technologies. We are also developing technologies and feedstocks that aim to allow continued and sustainable growth in biofuels, while minimising impacts on the environment and food supplies. Integrated power ○Renewable power is expected to be critical for helping our commercial customers decarbonise and we will continue to grow our integrated power business. We are making disciplined choices to create value from our portfolio, stepping back from activities that do not fit our strategy or generate enough return. We aim to use the strength of our trading and optimisation capabilities to meet the growing need for flexible power storage solutions such as batteries. We already have a significant presence in battery and storage through our ventures programme and investments in research and development. We are focusing on selling power, including renewable power, to business customers. We are also using renewable power to decarbonise our own operations. Over time, we expect to use our renewable power capacity to produce low-carbon molecules, such as hydrogen. Electric vehicle charging ○We are growing our electric vehicle charging business to support customers who choose to change from a petrol or diesel vehicle to an electric one. We are focusing on offering our customers choices where we see increasing demand, such as in the fast-growing electric mobility markets of China and Europe. We are focusing on public charging, rather than home charging, because we believe it will be needed most by our customers. We have a major competitive advantage in terms of locations, as our global network of service stations is one of the largest in the world. We have other competitive advantages, such as our convenience retail offering which allows us to offer our customers coffee, food and other convenience items as they charge their cars. Carbon capture and storage ○We are developing technologies related to carbon capture and storage (CCS) and carbon removals, which are necessary to reduce emissions where there are few low-carbon alternatives. For the rest of this decade, we expect to direct most of our investments in CCS towards decarbonising our own operations. We are also looking to turn this into a profitable business for Shell by helping other companies decarbonise their operations in the future. However, in many countries CCS still lacks a clear business model. To address this challenge, Shell advocates policy mechanisms to enable CCS, and supports industry partnerships dedicated to the growth of commercially viable CCS projects. |
[A]Source "The Role of Gas in Today's Energy Transitions", IEA 2019.
Strategic Report | Performance in the year | Our journey to net zero continued
Impact of climate-related risks and opportunities on Shell's businesses, strategy and financial planning The transformation of the energy system to net-zero emissions will require simultaneous action in three areas:
○an unprecedented improvement in the efficiency with which energy is used;
○a sharp reduction in the carbon intensity of the energy mix; and
○the mitigation of residual emissions through the use of technology and natural sinks.
While it is difficult to predict the exact combination of actions that will deliver the net-zero goal, scenarios help us to consider the variables and the potential direction and pace of the transition needed. Scenarios are not intended to be predictions of likely future events or outcomes and, therefore, are not the basis for Shell's Operating Plans and financial statements.
We have been developing scenarios within Shell for almost 60 years, helping Shell leaders to explore ways forward and make better decisions. Shell scenarios are designed to stretch management's thinking when it comes to considering events that may be possible, even if remotely. Scenarios help management to consider options and make choices in times of uncertainty and transition as we grapple with tough energy and environmental issues. They are aligned to different energy transition pathways and help in decision-making by guiding the identification of a wide range of risks and opportunities.
Different socio-economic and technological parameters are used to construct these scenarios, such as:
○sectoral and regional energy demand;
○future trajectory of oil consumption and demand for natural gas;
○renewable electricity demand and the pace of the electrification of the global energy system;
○supply of solar and wind energy;
○pace of uptake of electric vehicles;
○demand for biofuels;
○growth of the hydrogen economy;
○level of CCS available;
○deployment of lower-carbon energy technologies; and
○global trade of oil and gas.
Management consideration of different climate change outcomes informs a range of areas, including, but not limited to, the setting of the long-term strategy, business planning, and investment and divestment decisions. The outcomes considered by management vary in relation to the extent and pace of the energy transition.
| | | | | | | | |
| | |
| Carbon Management Framework (CMF) Shell's CMF provides the structure and processes to drive delivery of Group carbon targets. The CMF seeks to manage and reduce emissions in a manner that is similar to how we use our financial framework. Carbon budgets are used as input and guidance for the annual business plan process. They act as an effective mechanism to maintain absolute emissions below a capped level and help drive a change in product mix. The carbon budgets are allocated to the businesses and enable trade-offs between emitting carbon and generating shareholder value to occur within those budgets. The CMF informs portfolio decisions and supports delivery of our decarbonisation targets. For the 2024 Operating Plan cycle, our net carbon intensity (NCI) targets and 2030 oil products emissions ambition were translated into relevant budgets or targets for each business (see Greenhouse gas and energy management below). These budgets and targets were used by each business to optimise their operating plans. Performance against the annual NCI target, including the relative mix of products, is monitored and reviewed by the EC on a quarterly basis, facilitating corrective action if required. Examples of how our decarbonisation targets are taken into account in fundamental decisions across the organisation include the use of carbon metrics (profitability per unit of carbon emitted), a key parameter considered in decision-making and when comparing different growth opportunities against each other within the various businesses. | |
| | |
| | | | | | | | |
| | |
| Greenhouse gas and energy management Each Shell entity and Shell-operated venture is responsible for the development of its Greenhouse Gas (GHG) Emissions and Energy Management Plan. Plans are in place for all significant assets. Our Greenhouse Gas and Energy Management process sets out Shell's requirements for GHG reduction opportunities and portfolio choices to meet our carbon budgets and achieve our decarbonisation targets. These requirements allocate accountabilities for GHG and energy management within businesses, assets and projects, including responsibility for analysing our emissions, identifying improvement opportunities, and forecasting future performance. These requirements are applied to capital project delivery and through the asset-level annual business planning process, ensuring it is reflected in both opportunity realisation and strategic asset management planning. A key aspect of the GHG and Energy Management process is the development of an energy efficiency and greenhouse gas reduction opportunity curve, economically assessed against the current and future costs of carbon. This information provides the basis for forecasts of absolute GHG emissions and associated intensities at the asset and project level. These forecasts are then aggregated to inform decisions on potential decarbonisation opportunities across our businesses. The Shell Global Process Council for GHG and Energy Management, led by the Global Process Owner for GHG and including business and functional experts, meets regularly to evaluate opportunities for the ongoing improvement of processes, tools, communications, and capabilities needed within the businesses to achieve our decarbonisation aspirations. | |
| | |
Strategic Report | Performance in the year | Our journey to net zero continued
Impact on strategic planning
The application of scenario analysis informs our assessment of the impact of a wide range of risks and opportunities, including climate- change-related issues, on our strategy and business planning at the Group and business levels. At the Group level, the potential impacts of the energy transition on our business model are discussed and assessed by the Board and the EC as part of the annual strategic and business planning cycle. This assessment allows us to challenge accepted ways of thinking, identify material risks and opportunities, and identify key dilemmas and trade-offs.
| | | | | | | | |
| | |
| Key financial and non-financial components of business planning The Board approves our annual business plan. The plan contains operational and financial metrics, and its objective is to drive the delivery of our strategy. Decarbonisation targets are key to our business planning process. Each business owner offers viable Scope 1, 2 and 3 reduction opportunities as part of this process, in line with the CMF, see "Our approach to Sustainability" on page 142). The business plan is underpinned by assumptions about internal and external parameters and includes: ○commodity prices; ○refining margins; ○production levels and product demand; ○exchange rates; ○future carbon costs; ○the schedules of capital investment programmes; and ○risks and opportunities that may have material impacts on free cash flow. These assumptions are developed with input from our scenarios and internal estimates and outlooks. The level of uncertainty around these assumptions increases over longer time horizons. | |
| | |
Impact on business and financial planning
There is no single scenario that underpins Shell's business and financial planning. Our scenarios help develop our future oil and gas pricing outlooks. These outlooks take account of factors relating to the energy transition, such as potential changes in supply and demand (see details of scenario parameters above). The low-, mid- and high-pricing outlooks are prepared by a team of experts, reviewed by the EC and approved by the CEO and CFO. The mid-price outlook represents management's reasonable best estimate and is the basis for Shell's financial statements, Operating Plans and impairment testing.
Shell's Operating Plan reflects Shell's strategy. We will continue to update our Operating Plan, price outlooks and assumptions as we move towards net-zero emissions by 2050.
As described in "Climate-related risks and opportunities identified by Shell over the short, medium and long term" on page 97, the
low-pricing outlooks could result in increased commercial, regulatory and societal risks. The prioritisation of these risks is described in "Risk management" on page 33. Given our net-zero target, the use of low-pricing outlooks is part of our resilience testing and resulting actions.
| | | | | | | | |
| | |
| Our strategy and national net-zero commitments In accordance with UK Listing Rule 6.6.12G, we have taken into account the extent to which country-level net-zero commitments have been considered in developing our energy transition plans. Our strategy aims to deliver a net-zero emissions energy business by 2050. The pace of the energy transition will be heavily influenced by government policy, creating a strong country and regional dimension in seeking to deliver the goals of the Paris Agreement. Our commitment is a global one and, as such, we look to deliver our strategy through a global lens. We seek to translate our energy transition plans into specific targets and plans at a business segment level. We also seek to take capital deployment and portfolio decisions in the context of the integrated nature of our global operations. However, we continue to recognise the importance of engagement and collaboration in delivering the fundamental changes to the energy system that are required. This includes supporting and advocating for policies that aim to reduce carbon emissions and working with governments and other stakeholders in the development of policies that support the transition to a low-carbon energy system. As national transition plans develop, consideration will be given to the impact on our operations and the associated implications for our energy transition plans. | |
| | |
Resilience of Shell's strategy to different climate-related scenarios Shell's financial strength and access to capital give us the ability to reshape our portfolio as the energy system transforms. They also allow us to withstand volatility in oil and gas markets.
As we work towards net-zero emissions, we continue to exercise focus
and discipline to optimise our capital allocation and operational expenditure, balancing energy security and demand, as well as internal and external transition considerations and opportunities. We will make disciplined choices about where we can create the most value for our investors and customers through the energy transition.
Investing in the energy transition
| | |
Cash capital expenditure evolution by segment [A] |
[A]2022 and 2023 for Marketing and Chemicals and Products revised to conform with reporting segment changes applicable from 2024.
Strategic Report | Performance in the year | Our journey to net zero continued
Cash capital expenditure monitors investing activities on a cash basis, excluding items such as lease additions which do not necessarily result in cash outflows in the period. The measure comprises the following lines from the Consolidated Statement of Cash Flows: Capital expenditure, Investments in joint ventures and associates and Investments in equity securities. The reconciliation of "Capital expenditure" to "Cash capital expenditure" is presented in Note 7 to the "Consolidated Financial Statements" on pages 252-257.
| | |
Investing in the energy transition: Total cash capital expenditure |
| | | | | | | | | | | | | | |
| | | | |
Total cash capital expenditure of $21.1 billion in 2024 |
| | | | |
| Non-energy
products [A] $2.2 billion | | Low-carbon
energy solutions [B] $2.4 billion | |
| | | | |
| | | | |
| LNG, gas and power marketing and trading [C] $5.0 billion | | Oil, oil products
and other [D] $11.5 billion | |
| | | | |
| | | | |
[A]Products for which usage does not cause Scope 3, Category 11 emissions: Lubricants, Chemicals, Convenience Retailing, Agriculture and Forestry, Construction and Road.
[B]E-Mobility and Electric Vehicle Charging Services, Low-Carbon Fuels, Renewable Power Generation, Environmental Solutions, Hydrogen, CCS. We define low-carbon energy products as those that have an average carbon intensity that is lower than conventional hydrocarbon products, assessed on a life-cycle basis.
[C]LNG Production & Trading, Gas and Power Trading, and Energy Marketing.
[D]Upstream segment, GTL, Refining and Trading, Marketing fuel and hydrocarbon sales, Shell Ventures, Corporate segment.
Total cash capital expenditure was lower in 2024 compared with 2023 driven by project prioritisation and cost optimisation. Movements by category in 2024 versus 2023 were driven by:
○Non-energy products: comparable year-on-year.
○Low-carbon energy solutions: decreased by $3.2 billion compared with 2023. This reflects lower spend on renewable power generation projects and lower spend in the Marketing business, when compared with the significant inorganic growth investments in 2023 (the acquisition of Nature Energy for nearly $2 billion and the roll-out of electric vehicle charging).
○LNG, gas and power marketing and trading: 25% higher spend in 2024 compared with 2023 due to investments in LNG infrastructure projects and Renewable and Energy Solutions (two-unit combined-cycle gas turbine power plant).
○Oil, oil products and other: 8% lower spend compared with 2023 due to reductions in Marketing and Upstream (in deep water assets, including in the Gulf of America, partly offset by higher spend in Nigeria and the UK).
Cash capital expenditure by segment for 2025 is expected to be around $7 billion for Upstream ($7.9 billion in 2024), around $6 billion for Integrated Gas ($4.8 billion in 2024), in the range of $2-3 billion for Marketing ($2.4 billion in 2024), around $3 billion for Chemicals and Products ($3.3 billion in 2024), in the range of $2-3 billion for Renewables and Energy Solutions ($2.5 billion in 2024).
| | |
Energy transition: Total cash capital expenditure by segment |
| | | | | | | | | | | | | | | | | | | | | | | | | | | | | | | | |
| | | | | | | | | | $ billion |
Classification [1] | | Segment | 2024 | | 2023 | | 2022 |
| Non-energy products [A] | | Marketing | 0.6 | 2.2 | | 0.9 | 2.3 | | 1.5 | 3.9 |
| Chemicals and Products | 1.6 | | 1.4 | 2.4 |
| Low-carbon energy solutions [B] | | Marketing | 0.8 | 2.4 | | 3.3 | 5.6 | | 1.4 | 4.3 |
Renewables and Energy Solutions | 1.6 | | 2.3 | 2.9 |
| LNG, gas and power marketing and trading [C] | | Integrated Gas | 4.2 | 5.0 | | 3.7 | 4.0 | | 3.8 | 4.2 |
Renewables and Energy Solutions | 0.8 | | 0.3 | 0.4 |
| Oil, oil products and other [D] | | Integrated Gas | 0.6 | 11.5 | | 0.5 | 12.5 | | 0.5 | 12.5 |
| Upstream | 7.9 | | 8.3 | 8.1 |
| Marketing | 1.0 | | 1.6 | 2.1 |
| Chemicals and Products | 1.8 | | 1.6 | 1.3 |
Renewables and Energy Solutions | 0.1 | | 0.1 | 0.2 |
| Corporate | 0.1 | | 0.4 | 0.3 |
| Total | | | 21.1 | 21.1 | | 24.4 | 24.4 | | 24.8 | 24.8 |
[1]See the corresponding footnotes under the table "Investing in the energy transition: Total cash capital expenditure" on page 104 for more details.
* Non-GAAP measure (see page 337).
Strategic Report | Performance in the year | Our journey to net zero continued
| | |
Operating expenses evolution by segment [A] |
[A]2022 and 2023 for Marketing and Chemicals and Products revised to conform with reporting segment changes applicable from 2024.
Operating expenses is a measure of Shell's cost management performance, comprising the following items from the "Consolidated Statement of Income": production and manufacturing expenses; selling, distribution and administrative expenses; and research and development expenses. See Note 7 to the "Consolidated Financial Statements" for reconciliation of total operating expenses.
Total operating expenses* in 2024 were $36.9 billion with a focus on structural cost savings and improved operational efficiency, including lower maintenance cost.
| | |
Energy transition: Total operating expenses |
| | | | | | | | | | | | | | |
| | | | |
Total operating expenses* of $36.9 billion in 2024 |
| | | | |
| Non-energy
products [A] $7.4 billion | | Low-carbon
energy solutions [B] $1.9 billion | |
| | | | |
| | | | |
| LNG, gas and power marketing and trading [C] $5.4 billion | | Oil, oil products
and other [D] $22.2 billion | |
| | | | |
| | | | |
[A]Products for which usage does not cause Scope 3, Category 11 emissions: Lubricants, Chemicals, Convenience Retailing, Agriculture & Forestry, Construction & Road.
[B]E-Mobility and Electric Vehicle Charging Services, Low-Carbon Fuels, Renewable Power Generation, Environmental Solutions, Hydrogen, CCS. We define low-carbon energy products as those that have an average carbon intensity that is lower than conventional hydrocarbon products, assessed on a life-cycle basis.
[C]LNG Production & Trading, Gas & Power Trading, and Energy Marketing.
[D]Upstream segment, GTL, Refining & Trading, Marketing fuel and hydrocarbon sales, Shell Ventures, Corporate segment.
Total operating expenses* by segment for 2025 are expected to be approximately $9 billion for Upstream (2024: $9.8 billion), $5 billion for Integrated Gas (2024: $4.4billion), $11 billion for Marketing (2024: $10.7 billion), $8 billion for Chemicals and Products (2024: $8.4 billion), and $3 billion for Renewables and Energy Solutions (2024: 2.9 billion).
| | |
Energy transition: Total operating expenses* by segment |
| | | | | | | | | | | | | | | | | | | | | | | | | | | | | | | | |
| | | | | | | | | $ billion |
Classification [1] | | Segment | 2024 | | 2023 | | 2022 |
Non-energy products [A] | | Marketing | 3.9 | 7.4 | | 4.1 | 8.1 | | 3.9 | 7.5 |
| Chemicals and Products | 3.5 | | 4.0 | | 3.6 |
Low-carbon energy solutions [B] | | Marketing | 0.7 | 1.9 | | 0.9 | 2.2 | | 0.5 | 1.5 |
Renewables and Energy Solutions | 1.2 | | 1.3 | | 1.0 |
| LNG, gas and power marketing and trading [C] | | Integrated Gas | 3.7 | 5.4 | | 4.0 | 6.5 | | 4.4 | 6.9 |
Renewables and Energy Solutions | 1.7 | | 2.5 | | 2.5 |
| Oil, oil products and other [D] | | Integrated Gas | 0.8 | 22.2 | | 0.8 | 23.2 | | 0.8 | 23.6 |
| Upstream | 9.8 | | 9.8 | | 10.3 |
| Marketing | 6.0 | | 6.2 | | 5.8 |
| Chemicals and Products | 4.9 | | 5.6 | | 6.0 |
Renewables and Energy Solutions | 0.0 | | 0.0 | | 0.0 |
| Corporate | 0.7 | | 0.8 | | 0.7 |
| Total | | | 36.9 | 36.9 | | 40.0 | 40.0 | | 39.5 | 39.5 |
[1]See the footnotes under the table "Energy transition: Total operating expenses" on page 105 for more details.
* Non-GAAP measure (see page 337).
Key aspects of Shell's financial resilience in the context of climate-related impacts are assessed and described in more detail in Note 4
to the "Consolidated Financial Statements". This describes how Shell has considered climate-related impacts in key areas of the financial statements and how this translates into the valuation of assets and measurement of liabilities. Shell's financial statements are based on reasonable and supportable assumptions that represent management's best estimate of the range of economic conditions that may exist in the foreseeable future.
Sensitivity analysis using external, and often normative, climate change scenarios has been performed for the period covering asset life cycles. If these different price outlooks were used, this would impact the
recoverability of certain assets recognised in the "Consolidated Balance Sheet" as at December 31, 2024.
As there is no single scenario that underpins our Operating Plans, sensitivity analysis has been conducted using a range of key assumptions to test the resilience of our asset base. This includes (but is not limited to):
○sensitivity analysis on asset carrying values using commodity price outlooks from external, and often normative, climate change scenarios;
○carbon price sensitivities;
○chemical and refining margins price sensitivities; and
○discount rate sensitivities.
Strategic Report | Performance in the year | Our journey to net zero continued
Commodity price sensitivities
Oil and gas prices are one of the key assumptions that underpin Shell's financial statements, with the mid-price outlook informed by Shell's scenario planning representing management's reasonable best estimate. Price outlooks reflect a broad range of factors, including, but not limited to, future supply and demand, and the pace of growth of low-carbon solutions. The scenarios have been selected to illustrate the resilience of the asset base under a range of possible outcomes, including the price implications arising from the ambitious IEA Net Zero Emissions scenario which provides a potential path for the global energy system (IEA NZE50) to achieve net-zero emissions by 2050. Sensitivities of asset carrying values to prices are under the assumption that all other factors in the models used to calculate impacts remain unchanged.
Sensitivity analysis has been performed using price outlooks from:
1.Average prices from three 1.5-2°C external climate change scenarios: in view of the broad range of price outlooks across the various scenarios, the average of three external price outlooks was taken from IHS Markit/ACCS 2024; Woodmac WM AET-1.5 degree; and IEA NZE 2050 (IEA NZE50).
Applying this priceline to Integrated Gas assets of $74 billion and Upstream assets of $77 billion as at December 31, 2024, shows recoverable amounts that are $11-15 billion and $1-3 billion lower, respectively, than the carrying values as at December 31, 2024.
2.Hybrid Shell Plan and IEA NZE50: for this Shell's mid-price outlook is applied for the next 10 years. Because of greater uncertainty, the IEA normative Net Zero Emissions scenario is applied for the period after 10 years. This gives less weight to the price-risk uncertainty in the first 10 years reflected in the Operating Plan period and applies more risk to the more uncertain subsequent periods.
Applying this priceline to Integrated Gas assets of $74 billion and Upstream assets of $77 billion as at December 31, 2024, shows recoverable amounts that are $7--10 billion and up to $1 billion lower, respectively, than the carrying values as at December 31, 2024.
3.A 1.5°C scenario, derived from IEA NZE50: this priceline applies the IEA normative Net Zero Emissions scenario over the whole period under review and reflects the sensitivity to a pure net-zero emissions scenario from the IEA.
Applying this priceline to Integrated Gas assets of $74 billion and Upstream assets of $77 billion as at December 31, 2024, shows recoverable amounts that are $21-27 billion and $5-7 billion lower, respectively, than the carrying values as at December 31, 2024.
In addition, further sensitivities are provided of -10% or +10% to Shell's mid-price outlook, as an average percentage over the full period. A change of -10% or +10% to the mid-price outlook, as an average percentage over the full period, would result in around $5-9 billion impairment or some $2-5 billion impairment reversal, respectively, in Integrated Gas and Upstream as at December 31, 2024.
| | | | | | | | |
| | |
| Carbon pricing We consider the potential costs associated with operational GHG emissions when we assess the resilience of projects. For each region, we have developed short-, medium- and long-term estimates of future costs of carbon. These are reviewed and updated annually. See Note 4 to the "Consolidated Financial Statements" for further details on our regional cost of carbon estimates. Up to 2030, costs for carbon emissions estimates are largely policy driven through emissions trading schemes or taxation which is levied by governments and which varies significantly on a country-by-country basis. Beyond 2030, where policy predictions are more challenging, the costs for carbon emissions are estimated based on the expected costs of abatement technologies required for 2050. The estimated cost is trending towards $50 to $230 per tonne (RT24), depending on the country, in 2050. See "The resilience of Shell's strategy" on page 103 for more information on how carbon costs impact our resilience to climate-related risks, including sensitivity analysis. See Shell's "Climate and Energy Transition Lobbying Report 2024", which will be published in May 2025, for more information on Shell's advocacy across a range of issues including carbon pricing. | |
| | |
Carbon pricing and discount rate sensitivities
The risk of stranded assets may increase in a higher-carbon-price scenario. Sensitivities of our asset carrying values to carbon prices have been based on the IEA NZE50 scenario to illustrate the resilience of asset carrying values to higher long-term carbon prices than those included in the Shell mid-price outlook.
Applying the IEA NZE50 carbon price scenario to Integrated Gas assets of $74 billion and Upstream assets of $77 billion, up to the end of life of these assets, shows recoverable amounts that are $1-2 billion and up to $1 billion lower, respectively, than the carrying values as at December 31, 2024.
Applying the IEA NZE50 carbon price scenario to Chemicals and Products assets of $38 billion shows recoverable amounts that are up to $1-2 billion lower than the carrying values as at December 31, 2024. For Chemicals and Products, increased carbon costs could potentially be recovered partially through increased product sales prices.
See "Carbon pricing" above for more information on our carbon price assumptions.
Strategic Report | Performance in the year | Our journey to net zero continued
The discount rate applied for impairment testing is based on a nominal post-tax weighted average cost of capital (WACC) and is determined at 7.5%, except for power activities in the Renewables and Energy Solutions segment where 6% is applied. The discount rate includes generic systematic risk for energy transition risk. In addition, cash flow projections applied in individual assets include specific asset risks, including risk of transition. An increase in generic systematic energy transition risk could lead to a higher WACC and consequently to a higher discount rate to be applied in impairment testing. We have used a 1% shift in discount rate for sensitivity analysis purposes as an indicator of the resilience of our asset base to incremental increases in our cost of capital.
An increase of the WACC of 1% under the assumption that all other factors in the models used to calculate recoverability of carrying values remain unchanged would lead to a change in the carrying value of $1-3 billion for Integrated Gas and Upstream and no significant impairment in other segments.
| | | | | |
| |
| See Note 4 to the "Consolidated Financial Statements" on pages 237-249 for further information on climate-related impacts in key areas of the financial statements. |
| |
Delivering progress in the energy transition
To ensure the resilience of our strategy, our responses to the risks and opportunities identified are:
○delivery through our integrated business model;
○decarbonisation of our energy value chains and operations; and
○a focus on demand-driven decarbonisation – recognising that we need to work with our customers to identify low-carbon energy solutions for their energy demands in the sectors where we have competitive advantages.
Our integrated approach allows us to withstand volatility in oil and gas markets. Our financial framework aims to enhance shareholder distributions, maintain discipline in capital allocation and targets a strong credit investment grade rating.
○In Integrated Gas, we are growing our world-leading liquefied natural gas (LNG) business. We plan to grow LNG sales by 4-5% a year through to 2030. LNG provides energy security and flexibility because it can be easily transported to places where it is needed most. Gas is a critical fuel in the energy transition and plays an important role as a lower-carbon alternative to coal for industry, and provides grid stability alongside wind and solar power in electricity generation.
○In Upstream, we continue to focus on more value and less emissions. The oil we are producing will increasingly come from our world-class deep-water business. Through innovative designs, our deep-water platforms are producing higher-margin and lower-carbon barrels. As we work towards net-zero emissions, we will continue to approach capital and carbon allocation with discipline and focus.
○In Downstream, Renewables and Energy Solutions, we are making clear choices and changes to enable this business to thrive through the energy transition. We are focusing on developing low-carbon energy and solutions where we have competitive advantages and are starting to see increasing demand. We are focusing on value over volume across all our businesses in Downstream, Renewables and Energy Solutions, while driving down our emissions and helping to drive down our customers' emissions.
○We are progressing the repurposing of our energy and chemical parks; these key focused assets allow us to underpin our hydrocarbon energy sales and the sales of lower carbon energy products. Our energy transition plans for this decade across our Downstream, Renewables and Energy Solutions business are focused on: growing our electric vehicle charging business; investing in biofuels; continuing to grow our integrated power positions, and developing technologies related to CCS and carbon removals.
| | | | | |
| |
| See "Outlook" on page 23. |
| |
Our research and development (R&D) activities are an important contributor to achieving our net-zero emissions target. They are an important way to address the technology risk as mentioned in "Transition risks" on page 98 and "Transition opportunities" on page 101.
In 2024, our R&D expenditure on projects that contributed to decarbonisation was around $497 million, representing about 45% of our total R&D spend, compared with around 49% in 2023. This includes expenditure on reducing GHG emissions:
○from our own operations, for example, by improving energy efficiency and electrification;
○from the fuels and other products we sell to our customers - for example, biofuels, synthetic fuels and products made from low-carbon electricity, and hydrogen produced using renewable sources;
○by carbon capture, utilisation and storage applied to hydrogen production from natural gas and other carbon emissions;
○by researching nature-based solutions to offset emissions; and
○for our customers, through renewable power generation, storage,
e-mobility and other electrification solutions.
Examples of R&D areas other than decarbonisation include safety, performance products, such as lubricants and polymers, automation and artificial intelligence.
Decarbonising our value chains and operations
We seek to base the decarbonisation of our value chains and operations on an understanding of the decarbonisation strategies and plans of our customers and users of our energy products. We are focused on decarbonising our own operations by:
○making portfolio changes such as acquisitions and investments in low-carbon intensity projects, decommissioning plants, divesting assets, while sustaining our oil production with increasingly lower carbon intensity;
○progressing the repurposing of our energy and chemicals parks;
○improving the energy efficiency of our operations;
○using more renewable electricity to power our operations; and
○developing CCS for some of our facilities.
If required, we may choose to use high-quality carbon credits to offset any remaining emissions from our operations, in line with the carbon mitigation hierarchy of avoid, reduce and compensate or to meet local regulatory requirements.
Strategic Report | Performance in the year | Our journey to net zero continued
We have set an interim target to achieve a 50% reduction in absolute Scope 1 and 2 emissions under our operational control by 2030 on a net basis, when compared with 2016.
We set a target to eliminate routine flaring from our upstream-operated assets by 2025 [A]. With effect from January 1, 2025, SPDC has ceased routine flaring of associated gas, with the completion of essential gas capture projects and the shut-in of remaining facilities that do not yet meet the applicable emissions standards. We have therefore met our target to eliminate routine flaring from our upstream-operated assets by 2025 as of this date. We also aim to maintain methane emissions intensity for operated oil and gas assets below 0.2% and achieve near-zero methane emissions intensity by 2030.
[A]This target was subject to the completion of the sale of The Shell Petroleum Development Company of Nigeria Limited (SPDC). As detailed elsewhere in this report, on March 13, 2025, Shell completed the sale of SPDC to Renaissance.
| | | | | |
| |
| See "Working to reduce our absolute Scope 1 and 2 emissions" on page 120. |
| |
Supporting our customers in achieving net-zero emissions
The transport sector is by far the largest market for our oil products. We are building on our customer relationships and expertise to help drive the decarbonisation of passenger cars, heavy-duty trucks, planes and ships. Changes to the supply of energy products and decarbonising the energy system require structural changes in the end-use of energy.
This requires energy users to improve, update or replace equipment so that they can use carbon-based energy more efficiently, or switch to low- and zero-carbon energy. For example, replacing internal combustion engine vehicles with electric vehicles, converting heavy-duty transport to biofuels such as renewable diesel, and, in the future, hydrogen and its derivatives.
Such structural changes are expected to help to trigger transitions along the supply chain of individual sectors and across sectors, including the production of energy and emissions over time. The IEA estimates that these changes in the end use of energy will require substantial investment.
The World Energy Outlook 2024 report by the IEA includes an estimate that by 2035 for every one US dollar spent on fossil fuels, a further $20 will need to be spent on clean energy (low-emissions fuels, and energy-efficient and low-emissions power) under the NZE50 Scenario.
We are seeking and will continue to seek to change the mix of energy products we sell to our customers as their needs for energy change. Emissions resulting from customer use of our energy products make up a large proportion of Shell's reported emissions. We believe we can make the greatest contribution to the energy transition by helping to enable our customers to switch to low-carbon energy products and services. We are working to:
○develop low- and zero-carbon alternatives to traditional fuel, including biofuels, and other low- and zero-carbon gases;
○provide more renewable power solutions to customers by growing our portfolio in select markets;
○work with customers across different sectors to help them decarbonise their use of energy, for example by substituting the use of coal with LNG; and
○address any remaining emissions from conventional fuels with solutions such as CCS and high-quality carbon credits.
Strategic Report | Performance in the year | Our journey to net zero continued
| | | | | | | | | | | | | | |
| | | | |
| Energy transition in action - selection of portfolio changes and actions in 2024 | |
| Reducing emissions from the products we sell By the end of 2024, the number of Shell-branded electric vehicle charge points was almost 73,000 compared with 54,000 in 2023. We reached our goal of installing 70,000 public electric vehicle charge points globally by 2025 one year ahead of schedule. Shell and our non-operated joint venture Raízen (Shell interest 44%) are, together, one of the world's largest blenders and distributors of biofuels. In 2024, Raízen commissioned the second and third of eight world-scale second-generation biofuel plants, which it aims to build in Brazil, and its first biomethane plant to produce RNG made from waste in sugar ethanol production. In March 2024, Hollandse Kust Noord, our offshore wind park in the Netherlands (Shell interest 79.9%), achieved commercial operations. In March 2024, we started operations at Shell Downstream Bovarius, which is one of two facilities at the Bettencourt Dairies in Wendell, Idaho, USA, where we are converting dairy manure to RNG. Bovarius is expected to produce around 400,000 MMBtu a year of RNG. The second facility, Shell Downstream Friesian, is expected to produce around 350,000 MMBtu a year of RNG and operations are expected to start in 2025. In September 2024, our Northern Lights joint venture (Shell interest 33.3%) with Equinor and TotalEnergies completed the onshore and offshore facilities for the world's first carbon transport and storage project in Norway. The first shipments are expected in 2025. Northern Lights has the capacity to store around 1.5 million tonnes of CO2 per year. In April 2024, we opened our bioLNG liquefaction plant at the Shell Energy and Chemicals Park Rheinland. This can produce 100,000 tonnes of bioLNG per annum, which will help around 5,000 LNG trucks a year reduce their carbon emissions. In July 2024, we announced that we had paused on-site construction work at the biofuels facility at the Shell Energy and Chemicals Park Rotterdam in the Netherlands to assess the most commercial way forward for the project. Nature Energy is one of Europe's largest producers of RNG. In 2024, Nature Energy opened its first biogas plant in France. The Sécalia plant is operated in partnership with the Dijon Céréales consortium of 150 farmers. It is France's largest renewable gas plant with annual production of 230 GWh of biogas. Together with its partners, Nature Energy also owns and operates 13 biogas plants in Denmark and one in the Netherlands. In October 2024, we announced the acquisition of RISEC Holdings, LLC (RISEC), which owns a 609-megawatt (MW) two-unit combined-cycle gas turbine power plant in Rhode Island, USA. RISEC's combined-cycle gas turbine power plant supplies power to the ISO New England power market, where demand is expected to increase due to growing decarbonisation efforts in sectors such as home heating and transport.
| | Rotterdam-Singapore Green and Digital Shipping Corridor (GDSC) partners conducted a successful pilot for the bunkering of mass-balanced liquefied bio-methane (LBM) at the Port of Rotterdam in October 2024. A total of 100 tonnes of mass-balanced LBM was supplied by Shell to CMA CGM's liquefied natural gas-powered. In December 2024, a consortium led by Eku Energy and Shell Energy successfully completed the Rangebank Battery Energy Storage System (BESS) in Melbourne's Rangebank Business Park, marking the second-largest battery storage project in Victoria. With a capacity of 200 MW and 400 MWh of storage, the facility can power up to 80,000 homes. Reducing emissions from our own operations In January 2024, we announced our investment decision to convert the hydrocracker at our Energy and Chemicals Park Rheinland in Germany into a unit that will produce premium base oils. The hydrocracker at the Wesseling site near Cologne will stop processing crude oil into petrol, jet fuel and diesel in 2025. The planned changes are expected to reduce Shell's Scope 1 and 2 carbon emissions by around 620,000 tonnes a year. In May 2024, the Petrobras-operated Atapu consortium (Shell interest 16.7%) announced a final investment decision (FID) for the Atapu-2 project. The new unit is expected to feature all-electric capability, aimed at lowering carbon intensity for production processes. In June 2024, we took an FID for Polaris, a carbon capture project at the Shell Energy and Chemicals Park Scotford in Alberta, Canada. Polaris is designed to capture approximately 650,000 tonnes of CO2 annually from the Shell-owned Scotford refinery and chemicals complex. We also took an FID to proceed with the Atlas Carbon Storage Hub which will store CO2 captured by the Polaris project. Polaris and Atlas will build on the success of the Quest carbon capture and storage (CCS) facility at Scotford, which has safely captured and stored more than nine million tonnes of CO2 since 2015 that would otherwise have been released into the atmosphere. In July 2024, we signed an agreement to invest in the Abu Dhabi National Oil Company's (ADNOC) Ruwais LNG project through a 10% participating interest. The deal is still subject to completion. The Ruwais LNG facility is set to have an electric-powered liquefaction system and will utilise access to a renewable power supply. This design supports lower operational emissions compared to traditional gas-powered LNG facilities. In July 2024, we took the final investment decision to build REFHYNE II, a 100 MW electrolyser to produce renewable hydrogen, in Germany. We plan to use this hydrogen to partially decarbonise the Shell Energy and Chemicals Park Rheinland. In October 2024, Shell NBS formed a joint venture with New Forests Company: Tausi Forests Limited. Operating in Tanzania and Uganda, Tausi is dedicated to establishing certified commercial plantations and to initiating afforestation projects, creating reforestation and restoration carbon credits, and enhancing climate resilience, community well-being, and biodiversity in the areas that it operates in. | |
| | | | |
Strategic Report | Performance in the year | Our journey to net zero continued
Our climate-related metrics and targets
This section describes our performance against our climate-related targets and ambition, including those reflected in the remuneration of senior management and employees.
[A] This target was subject to the completion of the sale of The Shell Petroleum Development Company of Nigeria Limited (SPDC). With effect from January 1, 2025, SPDC ceased routine flaring. Our target is therefore met. As detailed elsewhere in this report, on March 13, 2025, Shell completed the sale of SPDC to Renaissance.
[B]On an intensity basis. Methane intensity is measured separately for oil and gas assets with marketed gas (gas, LNG and GTL available for sale) and assets without marketed gas (oil and gas assets where gas is reinjected).
[C]Average intensity, weighted by sales volume, of the energy products we sell, on an equity boundary, net of carbon credits. Estimated total GHG emissions included in NCI reflect well-to-wheel emissions associated with energy products sold by Shell. This includes the well-to-tank emissions associated with the manufacturing of energy products by others that are sold by Shell. In 2024, we revised the 2016 baseline NCI values and other historical NCI values. As a result, the percentage reduction achieved in 2023 was revised from 6.3% to 7.7%. (See "NCI baseline and restatement policy" on page 115).
[D]In March 2024, we set an ambition to reduce absolute emissions related to the use of our oil products by 15–20% by 2030, compared with 2021 (Scope 3 Category 11). Customer emissions from the use of our oil products (Scope 3, Category 11) were 517 million tonnes carbon dioxide equivalent (CO2e) in 2023 and 569 million tonnes CO2e in 2021.
Strategic Report | Performance in the year | Our journey to net zero continued
Metrics used by Shell to assess climate-related risks and opportunities in line with our strategy and risk management process This section sets out the key metrics we use to track progress against our energy transition targets and ambition. These metrics are as follows.
○Metrics related to our own operations:
–absolute Scope 1 and 2 emissions under operational control, with a 2016 baseline; and
–routine flaring and methane emissions intensity under our operational control.
○Metrics related to emissions from the products we sell:
–the NCI of the energy products we sell (equity basis), with a 2016 baseline; and
–customer emissions from the use of our oil products (Scope 3, Category 11, equity basis), with a 2021 baseline.
○Performance indicators for the energy transition performance condition reflected in the remuneration of senior management and employees as set out in "Linking Shell's emissions targets to remuneration" on page 121.
○Additional metrics associated with the resilience of Shell's strategy to climate-related risks and opportunities, including information on capital allocation between our business segments and the sensitivity of our assets to carbon pricing, discount rate and commodity price assumptions as set out in "Resilience of Shell's strategy to different climate-related scenarios" on page 103.
○Metrics and targets in respect of climate-related environmental risks as set out in "Metrics and targets in respect of climate-related environmental risks" page 118.
Scope 1, 2 and 3 emissions and related risks In assessing progress against our target to be a net-zero emissions energy business by 2050, we report our performance against Scope 1, 2 and 3 emissions.
| | | | | |
| |
| See "Climate-related risks and opportunities identified by Shell over the short, medium and long term" on pages 97-101. |
| |
Scope 1 and 2 emissions
In 2024, total combined Scope 1 and 2 GHG emissions (net) from assets and activities under Shell operational control were 58 million tonnes of carbon dioxide equivalent (CO2e), reflecting a 30% reduction compared with 2016, the base year for our target to halve these emissions by 2030.
Total combined Scope 1 and 2 GHG emissions (net) were 2% higher compared with 2023 due to higher utilisation and production, offset by reductions from abatement projects.
Drivers of Scope 1 and 2 emissions
Gross direct GHG emissions (Scope 1, operational control boundary) were stable in 2024 compared with 2023, at 50 million tonnes of CO2e, as the effect of higher Chemicals utilisation and Integrated Gas production was offset by reductions from GHG abatement projects and reduction activities.
Gross indirect GHG emissions (Scope 2, operational control boundary, using a market-based method) increased from 7 million tonnes of CO2e, in 2023 to 8 million tonnes CO2e in 2024. This increase was driven by higher electricity consumption and reduced purchases of renewable electricity in Australia following regulatory changes for purchasing and reporting renewable energy. We present examples of our energy efficiency projects on page 125.
In 2024, carbon credits were used for compliance with the requirements of the Australian Safeguard Mechanism, resulting in an offset of 0.1 million tonnes CO2e related to Scope 1 emissions under our operational control.
| | |
Scope 1 and 2 emissions [D, E] |
| | | | | | | | | | | | | | | | | |
| | million tonnes of CO2e |
| (operational control boundary) | 2024 | 2023 | 2022 | 2016 |
| Scope 1 emissions (gross) [A] | 50 | 50 | 51 | 72 |
| Scope 2 emissions (gross) [B] | 8 | 7 | 7 | 11 |
| Carbon credits [C] | 0.1 | — | — | — |
Total Scope 1 and 2 emissions (net) [F] | 58 | 57 | 58 | 83 |
[A]Total direct GHG emissions from assets and activities under our operational control. It includes emissions from production of energy and non-energy products. Scope 1 emissions are reported gross without the inclusion of carbon credits.
[B]Total indirect GHG emissions from imported energy from assets and activities under our operational control using a market-based method. It includes imported energy used for production of energy and non-energy products. Scope 2 emissions are reported gross without the inclusion of carbon credits.
[C]In 2024, carbon credits were used for compliance with the requirements of the Australian Safeguard Mechanism, resulting in an offset of 0.1 million tonnes CO2e related to Scope 1 emissions under our operational control.
[D]Oil and gas industry guidelines from Ipieca indicate that several sources of uncertainty can contribute to the overall uncertainty in Scope 1 and 2 emissions inventories.
[E]Figures disclosed are rounded. Rounding differences can occur between the total combined Scope 1 and 2 absolute GHG emissions disclosed in this Report and the sum of components individually rounded to the nearest million tonnes.
[F]We measure total combined Scope 1 and 2 GHG emissions compared with a 2016 baseline, on a net basis. The 2016 baseline may be recalculated if an acquisition or a divestment has an impact of more than 10% on total Scope 1 and 2 emissions. There was no such event in 2024.
| | |
Scope 1 and 2 emissions (net) by business [A, B] million tonnes carbon dioxide equivalent (CO2e) |
[A]Total direct (Scope 1) and energy indirect (Scope 2) GHG emissions from assets and activities under the operational control boundary, net of carbon credits. It includes emissions from production of energy and non-energy products. For Scope 2, we used a market-based method.
[B]Figures disclosed are rounded. The split between Scope 1 and 2 may not add up to the total due to rounding.
[C]Renewables and Energy Solutions, Marketing, P&T and Real Estate.
Strategic Report | Performance in the year | Our journey to net zero continued
Drivers of absolute Scope 1 and 2 emissions change
| | |
Scope 1 and Scope 2 GHG emissions (net): Changes from 2016 to 2023 and from 2023 to 2024 million tonnes carbon dioxide equivalent (CO2e) |
[A]Total Scope 1 and Scope 2 emissions, rounded to the nearest million tonnes. Scope 2 emissions were calculated using a market-based method.
[B]In addition to reductions from GHG abatement and energy efficiency projects, this category includes reductions from permanent shutdowns and conversion of existing assets.
[C]Excludes 7.8 million tonnes of CO₂ captured and sequestered by the Shell-operated Quest CCS facility in Canada in 2016-2023.
[D]Excludes 1.0 million tonnes of CO₂ captured and sequestered by the Shell-operated Quest CCS facility in Canada in 2024.
[E]Of the 1,028 thousand tonnes of reduction activities and purchased renewable electricity in 2024, around 20 thousand tonnes related to purchased renewable electricity.
[F]Change in output relates to changes in production levels, including those resulting from shutdowns and turnarounds as well as production from new facilities.
[G]In 2024, carbon credits were used for compliance with the requirements of the Australian Safeguard Mechanism, resulting in an offset of 0.1 million tonnes CO2e related to Scope 1 emissions under our operational control.
[H]In 2024, category Other represents the regulatory change for purchasing and reporting renewable energy in Australia and inclusion of emissions from Shell-owned, but third-party operated Mobility retail stations.
Routine flaring
Routine flaring of associated gas occurs during normal oil production where it is not possible to transport the gas to market, use it on-site or reinject it.
Routine flaring from The Shell Petroleum Development Company of Nigeria Limited (SPDC) was 0.1 million in 2024, comparable with 2023.
With effect from January 1, 2025, SPDC has ceased routine flaring of associated gas, with the completion of essential gas capture projects, such as the Forcados Yokri Gas Project, and the shut-in of remaining facilities from which gas cannot be transported to market. We have therefore met our target to eliminate routine flaring from our upstream-operated assets by 2025 as of this date.
Total routine and non-routine flaring at our Integrated Gas and Upstream facilities was 0.6 million tonnes in 2024, compared with 0.7 million tonnes in 2023. Around 50% of total flaring in 2024 occurred in assets operated by SPDC and SNEPCo.
On March 13, 2025, Shell completed the sale of SPDC to Renaissance, a consortium of five companies. SPDC will continue to operate the SPDC joint venture (SPDC JV [A]) on behalf of all the joint-venture partners, who together will continue to make decisions relating to work programmes for the SPDC JV's assets and infrastructure.
[A]The SPDC JV comprises SPDC (30%), the government-owned NNPC (55%), Total Exploration and Production Nigeria Ltd (10%) and Nigeria Agip Oil Company Ltd (5%).
| | |
Total routine flaring [A] |
| | | | | | | | | | | | | | |
| million tonnes |
| (operational control boundary) | 2024 | 2023 | 2022 | 2016 |
Total hydrocarbons flared in routine flaring | 0.1 | 0.1 | 0.1 | 1.1 |
[A]Routine flaring of associated gas occurs during normal oil production where it is not possible to transport the gas to market, use it on site or reinject it.
Methane intensity
In 2024, we continued to deliver methane emissions intensities well below our 0.2% target, with overall methane emissions intensity at 0.04% for Shell-operated oil and gas assets with marketed gas and 0.001% for Shell-operated oil and gas assets without marketed gas.
Total methane emissions from assets under Shell operational control (including Integrated Gas and Upstream, and Downstream, Renewables and Energy Solutions assets) were 33 thousand tonnes in 2024 compared with 41 thousand tonnes in 2023 due to lower venting (e.g. in 2023 venting occurred due to the maintenance of our Prelude floating LNG asset and operational issues in assets operated by Sarawak Shell Berhad).
We believe our methane emissions are quantified according to industry best practice. Methane emissions include those from unintentional leaks, venting and incomplete combustion, for example in flares and turbines.
| | |
Methane emissions intensity |
| | | | | | | | | | | | | | | | | |
| | % |
| (operational control boundary) | 2024 | 2023 | 2022 | 2016 |
Methane emissions intensity - assets with marketed gas [A] | 0.04% | 0.05% | 0.05% | 0.10% |
| Methane emissions intensity - assets without marketed gas [B] | 0.001% | 0.001% | 0.01% | 0.03% |
[A]Methane emissions intensity from all Shell-operated oil and gas assets that market their gas (including LNG and GTL assets), defined as the total volume of methane emissions in normal cubic metres (Nm3) per total volume of gas available for sale in Nm3.
[B]Methane emissions intensity from all Shell-operated oil and gas assets that do not market their gas (such as where gas is reinjected), defined as the total mass of methane emissions in tonnes per total mass of oil and condensate available for sale in tonnes.
Strategic Report | Performance in the year | Our journey to net zero continued
Scope 3 and NCI
NCI performance
In 2024, Shell's NCI was 71 grams of carbon dioxide equivalent per megajoule of energy (gCO2e/MJ), a 1.4% decrease from the previous year and a 9.0% reduction compared with the 2016 baseline. We therefore met our interim target to reduce our NCI by 9-12% in 2024. The decrease in our NCI in 2024 was mainly achieved through a reduction in sales of oil products, continued growth in power sales and a reduction in the average intensity of the oil products we sell.
| | | | | | | | | | | | | | | | | | |
(equity boundary) | 2024 | 2023 | 2022 | | 2016 |
NCI [A] [B] [C] | gCO2e/MJ | 71 | 72 | 75 | | 78 |
Estimated total energy delivered by Shell [D] [E] | trillion (10^12) MJ | 15.85 | 16.13 | 16.34 | | 20.80 |
Estimated total GHG emissions included in NCI (net) [F] [G] | million tonnes CO2e | 1,122 | 1,158 | 1,220 | | 1,615 |
| Carbon credits | million tonnes CO2e | 16.4 | 20.0 | 4.1 | | 0 |
Estimated total GHG emissions (gross) [G] [H] | million tonnes CO2e | 1,139 | 1,178 | 1,225 | | 1,615 |
[A]Rounded to the nearest gram of carbon dioxide equivalent per megajoule.
[B]We measure our NCI performance compared with a 2016 baseline. The NCI targets and baseline are not adjusted for the impact of acquisitions and divestments, which could have a material impact on meeting the NCI targets.
[C]In 2024, we revised the 2016 baseline NCI values from 79gCO2e/MJ (g) to 78g. The 2022 and 2023 values were revised from 76g to 75g and from 74g to 72g respectively. (See "NCI baseline and restatement policy" on page 115.
[D]Volume of energy products sold, aggregated on an energy basis, with power represented as fossil equivalent. Energy products consist of energy oil products (gasoline, diesel, kerosene, fuel oil and LPG), GTL, biofuels, liquefied natural gas, pipeline gas and power.
[E]In 2024, consistent with revisions of NCI values, we revised the estimated total energy delivered by Shell from 16.07 trillion (10^12) MJ (t MJ) to 16.13t MJ for 2023, from 16.29t MJ to 16.34t MJ for 2022 and from 20.93t MJ to 20.80t MJ for 2016. (See "NCI baseline and restatement policy" on page 115).
[F]In 2024, consistent with revisions of NCI values, we revised the estimated total GHG emissions included in NCI (net) from 1,185 million tonnes CO2e (mt) to 1,158mt for 2023, from 1,240mt to 1,220mt for 2022 and from 1,645 to 1,615mt for 2016. (See "NCI baseline and restatement policy" on page 115).
[G]Estimated total GHG emissions included in NCI (net) are the product of the NCI and the total energy delivered by Shell. Adding emissions offset using carbon credits gives the Estimated total GHG emissions included in NCI (gross).
[H]In 2024, consistent with revisions of NCI values, we revised the estimated total GHG emissions (gross) from 1,205 million tonnes CO2e (mt) to 1,178mt for 2023, from 1,244mt to 1,225mt for 2022 and from 1,645mt to 1,615mt for 2016. (See "NCI baseline and restatement policy" on page 115).
As part of our strategy, we aim to increase the share of low-carbon products in our energy product sales, which is the biggest driver for reducing our NCI.
| | |
Share of estimated total energy delivered per energy product type [A, B, C] |
[A]Percentage of delivered energy may not add up to 100% because of rounding.
[B]Total volume of energy products sold, aggregated on an energy basis (lower heating value) with power represented as fossil equivalents.
[C]In 2024, consistent with revisions of NCI values, the share of energy delivered through sales of biofuels was revised from 1% to 2% in 2023 and 2022. The share delivered through gas sales was revised from 20% to 19% for 2023. See "NCI baseline and restatement policy" on page 115.
Our ability to change the emissions intensity of each energy product varies, depending on the product type:
○Hydrocarbon fuels - emissions from end use by customers are by far the biggest contributors to the carbon intensity of the product. As a result, the emissions intensity of hydrocarbon fuels is expected to stay relatively unchanged over time. This is why we are focused on helping our customers decarbonise.
○Biofuels - can vary significantly in intensity depending on the feedstock and production process used.
○Power - the emissions intensity of power can be highly variable depending on how it has been generated. The proportion of our renewable power sales and the generation mix in countries where we sell power to the market both affect Shell's overall power mix and its resulting emissions intensity.
We sell more energy products than we produce ourselves. Therefore, when we calculate our emissions, we include emissions from energy products that we produce ourselves and from the products that we purchase from others for resale. This is reflected in the scope for calculation of our emissions shown in the chart on page 116.
Life-cycle carbon intensities for energy product categories included in the NCI calculation are summarised in the table below:
| | |
Carbon intensity of energy products [A] |
| | | | | | | | | | | | | | |
| gCO2e/MJ |
| 2024 | 2023 | 2022 | 2016 |
Oil products and gas-to-liquids [B] | 86 | 87 | 87 | 87 |
Gas [C] | 66 | 66 | 66 | 66 |
Liquefied natural gas (LNG) [D] | 70 | 70 | 71 | 73 |
Biofuels [E] | 34 | 34 | 37 | 38 |
Power [F, G] | 48 | 49 | 57 | 60 |
[A]In 2024, consistent with NCI value revisions, we revised the intensities of individual products in this table. See "NCI baseline and restatement policy" on page 115.
[B]Revised from 91gCO2e/MJ (g) to 87g for 2023, from 91g to 87g for 2022 and from 89g to 87g for 2016.
[C]Revised from 65gCO2e/MJ(g) to 66g for 2022 and from 67g to 66g for 2016.
[D]Revised from 70gCO2e/MJ(g) to 71g for 2022 and from 71g to 73g for 2016.
[E]Revised from 39gCO2e/MJ(g) to 34g for 2023, from 39g to 37g for 2022 and from 40g to 38g for 2016.
[F]Revised from 58gCO2e/MJ(g) to 57g for 2022 and from 59g to 60g for 2016.
[G]Emissions included in the carbon intensity of power have been calculated using a market-based method.
Strategic Report | Performance in the year | Our journey to net zero continued
Drivers of absolute Scope 3 emissions change in 2024
Scope 3 emissions associated with our energy product sales were 1,084 million tonnes CO2e, compared with 1,123 million tonnes CO2e in 2023, driven by lower sales of oil products.
Emissions from Scope 3 categories 1, 3, 9 and 11, related to the sale of energy products, are the most significant categories for Shell. Emissions from the use of our energy products (Category 11) form the largest component of our indirect Scope 3 emissions. As we sell more products than we produce or refine ourselves, the emissions associated with the products we purchase from third parties are also material, as reported under Category 1 for hydrocarbon products such as oil products, gas and LNG, and Category 3 for power. Although quantitatively less significant, emissions reported under Category 9 are significant to Shell for consistency with the boundaries of our net carbon intensity measure. Other Scope 3 categories have been assessed to be quantitatively and qualitatively insignificant.
| | |
Scope 3 emissions by category [A], [B], [C] |
| | | | | | | | | | | | | | | |
| million tonnes CO2e | |
(equity boundary) | 2024 | 2023 | 2022 | 2016 | |
Scope 3, Category 1: purchased goods and services [D] | 119 | 130 | 136 | 179 | |
| Scope 3, Category 3: fuel and energy-related activities | 117 | 112 | 115 | 89 | |
Scope 3, Category 9: downstream transport and distribution [E, F] | 3 | 3 | 3 | — | |
Scope 3, Category 11: use of sold products [G] | 845 | 878 | 909 | 1,252 | |
| 1,084 | 1,123 | 1,163 | 1,520 | |
[A]Categorised using the definitions from the GHG Protocol's Corporate Value Chain (Scope 3) Standard.
[B]Ipieca notes that due to the diversity of Scope 3 emissions, sources and the fact that these emissions occur outside the company's boundaries, the emissions estimates may be less accurate or may have a high uncertainty.
[C]In 2024, the total of Scope 3 Categories 1,3,9 and 11 was revised for 2023 (from 1,147 million tonnes CO2e to 1,123 million tonnes CO2e), for 2022 (from 1,174 million tonnes CO2e to 1,163 million tonnes CO2e) and for 2016 (from 1,545 million tonnes CO2e to 1,520 million tonnes CO2e). See "Basis of preparation – absolute Scope 1, 2 and 3 emissions" on page 117-118.
[D]In 2024, we revised Scope 3 Category 1 for 2023 (from 154 million tonnes CO2e to 130 million tonnes CO2e), for 2022 (from 144 million tonnes CO2e to 136 million tonnes CO2e) and for 2016 (from 172 million tonnes CO2 to 179 million tonnes CO2e). See "Basis of preparation – absolute Scope 1, 2 and 3 emissions" on page 117-118.
[E]In 2024, we revised Scope 3 Category 9 for 2022 (from 5 million tonnes CO2e to 3 million tonnes CO2e). See "Basis of preparation – absolute Scope 1, 2 and 3 emissions" on page 117-118.
[F]An estimate of Scope 3, Category 9 could not performed for 2016.
[G]In 2024, we revised Scope 3 Category 11 for 2022 (from 910 million tonnes CO2e to 909 million tonnes CO2e) and for 2016 (from 1,284 million tonnes CO2e to 1,252 million tonnes CO2e). See "Basis of preparation – absolute Scope 1, 2 and 3 emissions" on page 117-118.
Drivers of absolute Scope 3 Category 11 oil products emissions change in 2024
In 2024, Scope 3 Category 11 emissions from the use of our oil products were 491 million tonnes CO2e, a reduction of 5.0% compared with 2023. This reduction was driven by lower sales in our Mobility and Products businesses.
At the end of 2024, we achieved a reduction of 13.7% compared with 2021, and are progressing towards our ambition to reduce customer emissions from the use of our oil products (Scope 3, Category 11) by 15-20% by 2030 compared with 2021.
| | |
Customer emissions from the use of our oil products |
| | | | | | | | | | | | | | |
| million tonnes CO2e |
(equity boundary) | 2024 | 2023 | 2022 | 2021 |
Scope 3, Category 11: use of sold products (oil products) | 491 | 517 | 527 | 569 |
Carbon credits
In 2024, Shell accounted for the retirement of 17.3 million carbon credits, of which 16.4 million were related to our NCI (including 2.4 million linked to the sale of energy products).
Of our total carbon credit retirements for 2024, 74% were certified by the Verra, Verified Carbon Standard Program (VCS), 10% by the ACR (formerly American Carbon registry), 15% by Gold Standard, and 1% via Australian Carbon Credit Units.
We carefully source and screen the credits we purchase and retire from the market.
| | |
Carbon credit retirements [A] |
| | | | | | | | | | | | | | |
| Million carbon credits [B] |
(equity boundary) | 2024 | 2023 | 2022 | 2016 |
Included in Shell's NCI metric [C] | 16.4 | 20.0 | 4.1 | 0.0 |
Excluded from Shell's NCI metric [D] | 0.9 | 1.8 | 1.7 | 0.0 |
| 17.3 | 21.8 | 5.8 | 0.0 |
[A]Represent credits related to transactions occurring in the financial year irrespective of the actual retirement date. Retirements from registries may take place after the year-end. Excludes carbon credits transactions executed by Shell on behalf of/with third parties without a link to Shell activities.
[B]One carbon credit represents the avoidance or removal of one metric tonne of CO2 equivalent.
[C]Carbon credits associated with the sale of energy products and carbon credits used to compensate for Shell Group emissions including operational emissions and emissions associated with the use of sold products.
[D]Carbon credits retired in relation to sales of non-energy products and Shell's internal activity like corporate travel.
Strategic Report | Performance in the year | Our journey to net zero continued
Basis of preparation
NCI
Shell's NCI is the average intensity, weighted by sales volumes, of the energy products sold by Shell. It is tracked, measured and reported using Shell's Net Carbon Footprint (NCF) methodology.
NCI objective
Shell's NCI provides an annual measure of the life-cycle emissions intensity of the portfolio of energy products sold. The intended use of the NCI metric is to track progress in reducing the overall carbon intensity of the energy products sold by Shell. NCI measures emissions associated with each unit of energy we sell, compared with a 2016 baseline. It reflects changes in sales of oil and gas products, and changes in sales of low- and zero-carbon products such as biofuels and renewable electricity.
NCI definition
The NCI is calculated on a life-cycle basis and as such includes GHG emissions – on an equity basis – from several sources, including:
○direct GHG emissions from Shell operations;
○indirect GHG emissions from the generation of energy consumed by Shell; and
○indirect GHG emissions from the use of the products we sell.
The NCI is not a mathematical derivation of total emissions divided by total energy, nor is it an inventory of absolute emissions. It is a weighted average of the life-cycle CO2 intensities of different energy products, normalising them to the same point relative to their final enduse. The use of a consistent functional unit, grams of carbon dioxide equivalent per megajoule (gCO2e/MJ), allows like-for-like comparisons and the aggregation of individual life-cycle intensities for a range of energy products including renewable power.
Emissions from other parts of the product life cycle are also included, such as those from the extraction, transport and processing of crude oil, gas or other feedstocks and the distribution of products to our customers. Also included are emissions from parts of this life cycle not owned by Shell, such as the extraction of oil and gas processed by Shell but not produced by Shell; or from the production of oil products and electricity marketed by Shell that have not been processed or generated at a Shell facility.
We also take into account emissions offset through the use of carbon credits and mitigation actions such as the use of CCS technology.
See "Scope of NCI" on page 116 for details of the supply chains and steps in the product life cycles that are included in the Net Carbon Footprint methodology.
The following GHG emissions are not included in the NCI:
○emissions from production, processing, use and end-of-life treatment of non-energy products, such as chemicals and lubricants;
○emissions from third-party processing of sold intermediate products, such as the manufacture of plastics from feedstocks sold by Shell;
○emissions associated with the construction and decommissioning of production and manufacturing facilities;
○emissions associated with the production of fuels purchased to generate energy on-site at a Shell facility;
○other indirect emissions from waste generated in operations, business travel, employee commuting, transmission and distribution losses associated with imported electricity, franchises and investments; and
○emissions from capital goods, defined by the GHG Protocol as including fixed assets or property, plant and equipment, and other goods and services not related to purchased energy feedstocks sourced from third parties or energy products manufactured by third parties and sold by Shell.
The NCI calculation uses Shell's energy product sales volumes data, as disclosed in this Report. This excludes certain sales volumes such as:
○certain contracts held for trading purposes reported net rather than gross. Business-specific methodologies to net volumes have been applied in oil products and pipeline gas and power. Paper trades that do not result in physical product delivery are excluded; and
○retail sales volumes from markets where Shell operates under trademark licensing agreements.
The energy products included in the NCI calculation are oil products, (gasoline, diesel, kerosene, fuel oil and LPG), GTL, biofuels, LNG, pipeline gas and power.
We review the NCI methodology annually to ensure it reflects changing energy products, relevant data inputs and simplification opportunities. See our Net Carbon Footprint (NCF) methodology documentation on shell.com for further information.
NCI baseline and restatement policy
We measure our NCI performance compared with a 2016 baseline. The NCI targets and baseline are not adjusted for the impact of acquisitions and divestments, which could have a material impact on meeting the NCI targets. The 2016 baseline may be recalculated as a result of changes in estimates with a cumulative impact of 2% or more on the NCI value in any historically disclosed year.
In 2024, the 2% cumulative restatement threshold was met, triggered by changes in external data sources for the third-party upstream and refining intensities used in our calculation of life-cycle product intensities.
Accordingly NCI values were revised for the following years:
○2016: from 79g to 78gCO2e/MJ (Baseline)
○2017: from 79g to 78gCO2e/MJ
○2018: from 79g to 78gCO2e/MJ
○2019: from 78g to 77gCO2e/MJ
○2020: from 75g to 74gCO2e/MJ
○2021: from 77g to 76gCO2e/MJ
○2022: from 76g to 75gCO2e/MJ
○2023: from 74g to 72gCO2e/MJ
These changes did not impact the NCI performance outcomes compared with interim reduction targets in 2022 and 2023 or preceding years. Compared with the revised 2016 baseline, the percentage reduction achieved in 2022 remains 3.8%, within the target of 3-4% for that year. The percentage reduction achieved in 2023 was revised from 6.3% to 7.7%, still within the target of 6–8% for that year.
Strategic Report | Performance in the year | Our journey to net zero continued
Scope of NCI
Strategic Report | Performance in the year | Our journey to net zero continued
Basis of preparation – absolute Scope 1, 2 and 3 emissions
We follow the GHG Protocol's Corporate Accounting and Reporting Standard, which defines three scopes of GHG emissions:
○Scope 1: direct GHG emissions from sources under Shell's operational control.
○Scope 2: indirect GHG emissions from the generation of purchased energy consumed by Shell assets under operational control.
○Scope 3: other indirect GHG emissions, including emissions associated with the use of energy products sold by Shell.
GHG emissions comprise CO2, methane, nitrous oxide, hydrofluorocarbons, perfluorocarbons, sulphur hexafluoride and nitrogen trifluoride, with CO2 and methane being the most significant contributors.
Scope 1 and 2 emissions
Our GHG inventory is prepared in line with the requirements outlined in the ISO 14064-1:2018 Specification with Guidance at the Organizational Level for Quantification and Reporting of Greenhouse Gas Emissions and Removals and the GHG Protocol's Corporate Accounting and Reporting Standard.
In line with external standards, we aggregate GHG emissions into tonnes of CO2 equivalent by applying global warming potential (GWP) factors to non-CO2 GHGs. With effect from 2023, these factors are taken from the IPCC's Fifth Assessment Report (AR5) over a 100-year time period, as required by the UK Government GHG Conversion Factors for Company Reporting. GHG emissions are aggregated and consolidated from emission source. All operated assets are included in our GHG inventory.
Scope 1 emissions
All significant sources were included in our Scope 1 inventory. Sources included comprise:
○combustion of carbon-containing fuels in stationary equipment
(e.g. boilers and gas turbines) for energy generation;
○combustion of carbon-containing fuels in mobile equipment
(e.g. trucks, vessels and mobile rigs);
○flares;
○venting and emissions from industrial processes (e.g. hydrogen plants and catalytic cracking units); and
○fugitive emissions, including piping and equipment leaks and
non-routine events.
Our Scope 1 emissions follow the GHG Protocol guidance. As a result,
the following are not included in our reported Scope 1 emissions:
○CO2 emissions from biogenic sources such as biofuels or biomass (however methane and nitrous oxide emissions from biogenic sources are included);
○captured CO2 that was subsequently sold or otherwise transferred to third parties;
○CO2 captured and sequestered using CCS technologies; and
○carbon credits.
Scope 2 emissions
All significant sources were included in our Scope 2 inventory. Sources included comprise indirect emissions from purchased and consumed electricity, steam and heat. We did not identify any assets with imported cooling or compressed air used for energy purposes.
Scope 2 emissions are calculated using the market- and location-based methods separately as defined by the GHG Protocol Scope 2 Guidance. Scope 2 emissions are presented on a gross basis.
Carbon credits
Our target to halve total Scope 1 and 2 GHG emissions by 2030 has been set on a net basis, including emissions offset by carbon credits.
In 2024, carbon credits were used for compliance with the requirements of the Australian Safeguard Mechanism, resulting in an offset of 0.1 million tonnes CO2e related to Scope 1 emissions under our operational control.
Baseline and restatement policy
We measure our total combined Scope 1 and 2 GHG emissions performance compared with a 2016 baseline, on a net basis. The 2016 baseline may be recalculated if an acquisition or a divestment has an impact of more than 10% on total Scope 1 and 2 emissions. There was no such event in 2024.
Scope 3 emissions
This Report provides Scope 3 emissions associated with our energy product sales. Emissions were consolidated using the equity boundary approach. Under this approach, we reported the Shell share of emissions from energy products sold, including those sourced from third parties.
Emissions from Scope 3 categories 1, 3, 9 and 11, related to the sale of energy products, are the most significant categories for Shell. Emissions from the use of our energy products (Category 11) form the largest component of our indirect Scope 3 emissions. As we sell more products than we produce or refine ourselves, the emissions associated with the products we purchase from third parties are also material, as reported under Category 1 for hydrocarbon products such as oil products, gas and LNG, and Category 3 for power. Although quantitatively less significant, emissions reported under Category 9 are significant to Shell for consistency with the boundaries of our net carbon intensity measure. Other Scope 3 categories have been assessed to be quantitatively and qualitatively insignificant.
Consistent with our revisions of NCI historical data, we revised Scope 3 emissions under Categories 1, 9 and 11, as applicable, for years 2016, 2022 and 2023 in this Report. There was no change to previously published Scope 3 emissions Category 11 Oil products. See "NCI baseline and restatement policy" on page 115 for details.
The calculation of Scope 3 Category 11 emissions uses energy product sales volumes data, disclosed in this Report where relevant. These sales volumes exclude certain contracts held for trading purposes and reported net rather than gross. Business-specific methodologies have been applied to net volumes of oil products, pipeline gas and power. Paper trades that do not result in physical product delivery are excluded. Retail sales volumes from markets where Shell operates under trademark licensing agreements are not included in the sales volumes reported by Shell and are therefore excluded from Scope 3 emissions.
Scope 3, Category 1: purchased goods and services
This category includes well-to-tank emissions from purchased third-party unfinished and finished energy products excluding electricity (which is reported separately under Category 3: fuel and energy-related activities and not included in Scope 1 or Scope 2). Emissions from purchased non-energy products are not included.
Emissions in this category are estimated using well-to-tank emission factors for crude oil, natural gas, refined oil products (such as gasoline, and diesel), LNG and biofuels. Because the emission factors include transport, we do not estimate emissions from the transport of purchased third-party products separately.
In 2024, Category 1 emissions were revised for the following years:
○2016: from 172 million tonnes CO2e to 179 million tonnes CO2e
○2020: from 147 million tonnes CO2e to 150 million tonnes CO2e
○2021: from 147 million tonnes CO2e to 142 million tonnes CO2e
○2022: from 144 million tonnes CO2e to 136 million tonnes CO2e
○2023: from 154 million tonnes CO2e to 130 million tonnes CO2e
Strategic Report | Performance in the year | Our journey to net zero continued
Scope 3, Category 3: fuel and energy-related activities (not included in Scope 1 and 2)
This category includes well-to-wire emissions from purchased third-party electricity sold by Shell, calculated using a market-based method. Emissions are not adjusted for any potential double-counting of sold natural gas that may have been used for generating this electricity.
This category does not include:
○indirect emissions from the generation of imported energy (steam, heat or electricity consumed by our assets). These emissions are reported separately as Scope 2 emissions; and
○well-to-tank emissions from purchased electricity, steam and heat consumed by our assets (i.e. Scope 3 emissions from the extraction, refining and transport of primary fuels before their use in the generation of electricity or steam).
Following the NCI restatement in 2024, Scope 3, Category 3 emissions remained unchanged at:
○For 2016 at 89 million tonnes CO2e
○For 2020 at 103 million tonnes CO2e
○For 2021 at 136 million tonnes CO2e
○For 2022 at 115 million tonnes CO2e
○For 2023 at 112 million tonnes CO2e
Scope 3, Category 9: downstream transport and distribution
This category includes estimated emissions from the transport and distribution of energy products produced or refined by Shell. It does not include the emissions associated with transporting third-party products, which are included in Scope 3, Category 1. To avoid double counting across emission scopes, emissions from transport activities which are already included in our Scope 1 and 2 equity emissions are excluded from this category.
In 2024, Category 9 emissions were revised for the year 2022, from 5 million tonnes CO2e to 3 million tonnes CO2e. Scope 3 Category 9 emissions remained unchanged for 2021 (at 6 million tonnes CO2e) and for 2023 (at 3 million tonnes CO2e). An estimate of Scope 3 Category 9 was not performed for 2016 and 2020.
Scope 3, Category 11: use of sold products
This category includes estimated emissions from the use of sold energy products, such as LNG, GTL, pipeline gas, refined oil products and biofuels. These emissions relate to products manufactured and sold by Shell and third-party products sold by Shell.
This category does not include non-energy products that may have been combusted during use (for example, lubricants).
In 2024, Category 11 emissions were revised for the following years:
○2016: from 1,284 million tonnes CO2e to 1,252 million tonnes CO2e
○2020: from 1,054 million tonnes CO2e to 1,028 million tonnes CO2e
○2021: from 1,010 million tonnes CO2e to 963 million tonnes CO2e
○2022: from 910 million tonnes CO2e to 909 million tonnes CO2e
For 2023, Scope 3 Category 11 remained unchanged at 878 million tonnes CO2e.
Revisions did not impact Category 11 emissions from the use of oil products.
Biogenic emissions
CO2 emissions from biogenic sources related to the combustion of sold biofuels are estimated but, in line with GHG Protocol guidance and ISO 14064-1:2018, not included in Scope 3, Category 11. Methane and nitrous oxide emissions from biogenic sources are included in Scope 3, Category 11.
It is assumed that the presence of biogenic emissions associated with other Scope 3 categories is negligible at present.
Customer emissions from the use of our oil products
Our ambition to reduce customer emissions from the use of our oil products is a subset of Scope 3, Category 11 emissions, focusing on the use of refined oil products.
We measure these emission reductions compared with a 2021 baseline. The 2021 baseline may be recalculated in the event of a revision of our sales of oil products, or in the event of other changes to emissions factors subject to a 2% cumulative threshold.
Metrics and targets in respect of climate-related environmental risks We monitor physical risk exposures, whether climate-related or not, water use, emissions to air and water, biodiversity, and waste generated from our operations. Where relevant, we may manage our environmental performance by establishing specific targets. See 'Respecting nature' on page 126 for more information.
| | | | | |
| |
| See "Respecting nature" on pages 124-128. |
| |
Targets used by Shell to manage climate-related risks and opportunities and performance against targets Our response to the energy transition risk focuses on decarbonising our value chain. This section sets out our climate targets which are focused on reducing our NCI and our absolute emissions, as presented on pages 119-120. Shell's material climate-related risks and opportunities are set out in the "Climate-related risks and opportunities identified by Shell over the short, medium and long term" section on pages 97-101.
We have set intensity targets and absolute targets and an ambition over the short, medium and long term to track our performance over time (as summarised below). The targets are forward-looking targets based on management's current expectations and certain material assumptions and, accordingly, involve risks and uncertainties that could cause actual results, performance or events to differ materially from those expressed or implied herein.
We believe our total net absolute emissions peaked in 2018 at 1.7 gigatonnes of carbon dioxide equivalent (GtCO2).
Our net-zero target includes emissions from our operations, as well as from the end use of all the energy products we sell. We are seeking to reduce emissions from our own operations, including the production of oil and gas. More than 90% of the total emissions we include within our NCI boundary are indirect emissions associated with third-party products and end-use emissions of energy products we sell, so we are also working with our customers to support them in transitioning to low-carbon products and services.
In October 2021, in support of our 2050 net-zero emissions target, we set a target to reduce Scope 1 and 2 absolute emissions from assets and activities under our operational control (including divestments) by 50% by 2030 compared with the 2016 baseline, on a net basis.
We aim to maintain methane emissions intensity for operated oil and gas assets below 0.2% and achieve near-zero methane emissions by 2030. We were aiming to eliminate routine flaring from our upstream-operated assets by 2025 [A] and Shell has delivered this target.
[A]This target was subject to the completion of the sale of The Shell Petroleum Development Company of Nigeria Limited (SPDC). With effect from January 1, 2025, SPDC ceased routine flaring. As detailed elsewhere in this report, on March 13, 2025, Shell completed the sale of SPDC to Renaissance.
Strategic Report | Performance in the year | Our journey to net zero continued
In March 2024, we set revised targets to reduce the NCI of the energy products we sell in 2024 by 9-13% by 2025, 15-20% by 2030 and 100% by 2050. In recognition of the uncertainty in the pace of change in the energy transition, we retired our 2035 target of a 45% reduction in NCI.
The NCI metric measures the pace of transition by tracking our progress in reducing the overall carbon intensity of the energy products sold by Shell. NCI measures emissions associated with each unit of energy we sell, compared with a 2016 baseline. It reflects changes in sales of oil and gas products, and changes in sales of low- and zero-carbon products -- such as biofuels and renewable electricity. Unlike Scope 1 and 2 emissions, reducing the NCI of the products we sell requires action by both Shell and our customers, with the support
of governments and policymakers to create the right conditions
for change.
In March 2024, we set an ambition to reduce customer emissions from the use of our oil products (Scope 3, Category 11) by 15-20% by 2030 compared with 2021 [B]. This level of ambition is in line with the EU's climate goals in the transport sector, among the most progressive in the world. Achieving this ambition will mean reducing sales of oil products, such as gasoline and diesel, as we support customers as they move to electric mobility and lower-carbon fuels.
[B]Customer emissions from the use of our oil products (Scope 3, Category 11) were 517 million tonnes carbon dioxide equivalent (CO2e) in 2023 and 569 million tonnes CO2e
in 2021.
In the short and medium term, we have set climate targets for emissions that we are able to control, namely our Scope 1 and 2 emissions, methane emissions and flaring. We have also set climate targets and an ambition for emissions that are outside our control. These include our ambition to reduce the Scope 3, Category 11 customer emissions from the use of our oil products, and our target to reduce the net carbon intensity of all the energy products we sell.
Setting targets for NCI
Shell's target is to become a net-zero emissions energy business by 2050. We also have short-, medium- and long-term targets to reduce the carbon intensity of the energy products we sell, measured using our NCI metric. We believe these targets are aligned with the more ambitious goal of the Paris Agreement, which is to limit the rise in global average temperature this century to 1.5°C above pre-industrial levels. There is no established standard for aligning an energy supplier's decarbonisation targets within the 1.5°C temperature goal of the Paris Agreement. For this reason, we have defined our NCI target using 1.5°C scenarios developed for the IPCC's AR6.
We start with the complete set of 1.5°C scenarios and then exclude scenarios which are too reliant on carbon removals or use of bioenergy before removing outliers. We then calculate an emissions intensity for each scenario which is comparable to our own NCI. Finally, we produce a 1.5°C pathway based on the reductions in emissions intensity over time. We have chosen to use a range instead of any individual scenario to better reflect the uncertainty of the energy transition.
We believe that using this pathway to set our targets demonstrates that they are aligned with the more ambitious 1.5°C goal of the Paris Agreement. This is illustrated in the chart below. We also believe that the pace of change will vary around the world by region and by sector, taking into consideration the time needed for energy users to invest in large-scale equipment and the energy infrastructure changes needed for Shell to deliver more low- and zero-carbon energy.
| | |
Shell's Paris-aligned targets |
Progress towards our Scope 1 and 2 target
The chart below shows our progress since 2016 in reducing our Scope 1 and 2 emissions and gives an indication of how we expect to achieve our target in 2030. The actions we take to achieve our target will depend on the evolution of our asset portfolio and the continued development of technologies which reduce carbon emissions. We expect that, on a net portfolio basis, reductions predominantly from abatement projects including carbon capture and storage and electrification, may outweigh increases in our Scope 1 and 2 emissions from new investments between 2025 and 2030. Our investments in producing low-carbon energy will increase our Scope 1 and 2 emissions, while reducing the NCI of the products we sell. Subsequent reductions in our emissions are reflected in the mechanisms outlined below and reflect an expected path to meeting our target by 2030.
To decarbonise our operations, we are focusing on:
○making portfolio changes such as acquisitions and investments in low-carbon intensity projects, decommissioning plants, divesting assets, while sustaining our oil production with increasingly lower carbon intensity;
○progressing the repurposing of our energy and chemicals parks;
○improving the energy efficiency of our operations;
○using more renewable electricity to power our operations; and
○developing CCS for some of our facilities.
If required, we may choose to use high-quality carbon credits to offset any remaining emissions from our operations, in line with the carbon mitigation hierarchy of avoid, reduce and compensate.
Strategic Report | Performance in the year | Our journey to net zero continued
| | |
| Working to reduce our absolute Scope 1 and 2 emissions |
Scope 1 and 2 emissions in million tonnes of CO2e [A],[B] |
[A]The 2016 baseline may be recalculated if an acquisition or a divestment has an impact of more than 10% on total Scope 1 and 2 emissions. There was no such event in 2024.
[B]Operational control boundary and presented on a net basis (i.e. inclusive of any use of carbon credits).
[C]Including compliance and voluntary carbon credits as required.
Progress towards our NCI target
Unlike Scope 1 and 2 emissions, reducing the NCI of the products we sell requires action by both Shell and our customers, with the support of governments and policymakers to create the right conditions for change. The biggest driver for reducing our NCI is increasing the sales of and demand for low-carbon energy. The chart below illustrates how changes in the volume of products and services we sell could result in NCI reductions towards 2030. The change in our sales of these products and services will also reflect the development and adoption of new technologies and infrastructure, and the adoption of public policies designed to encourage the energy transition.
| | |
Working to reduce our NCI |
NCI in gCO2e/MJ [A], [B] |
[A]Grams of carbon dioxide equivalent per megajoule.
[B]In 2024, we revised the 2016 baseline NCI value from 79gCO2e/MJ (g) to 78g. The 2022 and 2023 values were respectively revised from 76g to 75g and from 74g to 72g.
[C]Hydrocarbon sales reflect the effect of lower sales of oil products, and higher sales of natural gas. Emissions associated with gas are lower than those of oil products.
[D]Power sales show the expected growth of our integrated power business and increasing sales of renewable power.
[E]Sales of low-carbon fuels reflect higher sales of biofuels and hydrogen, which are low- and zero-carbon products.
[F]CCS reduces carbon emissions by capturing them at source.
[G]High-quality carbon credits such as nature-based solutions can be used to offset remaining carbon emissions, particularly in hard-to-abate sectors such as aviation and industries including cement and steel.
Strategic Report | Performance in the year | Our journey to net zero continued
Linking Shell's emissions targets to remuneration
We have established remuneration structures to support us in reducing our operational emissions and to support customers in reducing their emissions. The majority of employees participate in the annual bonus scheme which is linked to the Group scorecard. From 2025, the Long-Term Incentive Plan (LTIP) is referred to as the Performance Share Awards (PSA) and no further Performance Share Plan (PSP) awards will be made. Our annual bonus scorecard and PSA include "Shell's journey in the energy transition" performance metrics, which are designed to ensure that remuneration is aligned with Shell's Operating Plan and longer-term strategic ambitions.
PSA will be awarded to Executive Directors and around 120 senior executives. Circa 12,000 employees will receive PSA and/or Restricted Share Awards (RSA), which are time-based, based on seniority.
| | | | | |
| |
| See "Directors' Remuneration Report" on pages 180-182. |
| |
Energy transition performance condition and the vesting of the 2022 LTIP and PSP awards
The following performance outcomes for the energy transition performance condition were considered in the vesting assessment of the 2022 LTIP and PSP awards, covering the performance cycle 2022-2024:
| | |
2022 LTIP energy transition performance condition: outcome |
| | | | | |
| Outcome |
Net carbon intensity (NCI) | Performance indicator met |
Growing the power business | Performance indicator met |
Growing new lower-carbon product offerings
| Performance indicator partially met |
Develop emissions sinks
| Performance indicator partially met |
In addition to the above, a number of broader indicators of Shell's progress in the energy transition were considered. Overall, it was determined that the energy transition measure (accounting for 20% of the LTIP award and 10% of the PSP award) should vest at 130% of the target. See "Long-term Incentive Plan vesting: 2022 LTIP - 2022 LTIP energy transition performance conditions outcome" on pages 190-192 for more information.
| | | | | |
| |
| See "Annual Report on Remuneration" on pages 183-199. |
| |
Energy transition performance condition in the 2024 LTIP and PSP awards
For LTIP and PSP awards granted in 2024, the energy transition performance condition had a weighting of 25% in the LTIP and 12.5% in the PSP. Determination of the extent to which awards will vest will be based on its holistic assessment of progress towards reducing emissions from our operations and supporting customers to reduce their emissions.
Energy transition performance condition for 2025 PSA
For the 2025 PSA, the "Shell's journey in the energy transition" performance condition retains the same weighting and performance assessment framework as for 2024. The determination of the extent to which awards will vest will be based on an holistic assessment of progress towards reducing emissions from our operations and supporting our customers to reduce their emissions. This will be based on climate-related targets for our own operations of:
○halving Scope 1 and 2 emissions by 2030 under operational control on a net basis (2016 baseline);
○eliminating routine flaring from upstream operations by 2025 [A]; and
○maintaining methane emissions intensity below 0.2% and achieving near-zero methane emissions by 2030 [B].
[A]This target was subject to the completion of the sale of The Shell Petroleum Development Company of Nigeria Limited (SPDC). With effect from January 1, 2025, SPDC ceased routine flaring. As detailed elsewhere in this report, on March 13, 2025, Shell completed the sale of SPDC to Renaissance.
[B]On an intensity basis.
It will also take into account progress in developments that support the energy transition to 2030 and beyond, such as the development of our Power business (including renewables), lower-carbon LNG, biofuels, electric vehicle charging, hydrogen and CCS.
Additionally, progress towards achieving a 15-20% reduction in NCI by 2030 (2016 baseline) and a 15-20% reduction in customer emissions from the use of our oil products by 2030 (2021 baseline) [C], as well as Shell's wider performance in helping to accelerate the energy transition, such as by demonstrating leadership and advocacy in standard-setting, alongside any other factors considered material will be taken into account.
[C]This ambition was set in March 2024. Customer emissions from the use of our oil products (Scope 3, Category 11) were 517 million tonnes CO2e in 2023 and 569 million tonnes CO2e in 2021.
| | | | | |
| |
| See "Annual Report on Remuneration" on page 197 for more information on the proposed performance framework. |
| |
Energy transition targets in the annual bonus scorecard
Delivering on our net-zero emissions target is a part of the annual bonus scorecard, which helps determine annual performance bonus outcomes for senior management and the majority of Shell's employees.
The energy transition progress measures are shown in the table below.
| | |
2024 scorecard: Shell's journey in the energy transition |
| | | | | | | | | | | | | | |
| | 2024 Target | 2024 Performance | 2024
Status |
LNG volumes [A]
| million tonnes per annum | 28.7 | 29.1 | Above target |
Reducing operational emissions | thousand tonnes of CO2 | 700 | 1,028 | Outstanding [B] |
Supporting customer decarbonisation | Number of EV charge points | 70,000 | 72,800 | Above target |
[A]Equity liquefaction.
[B]Above the maximum target
Our score for LNG volumes in 2024 was above target, reflecting strong operational performance. This was driven mainly by volume increases in Australia and the Atlantic region, partly offset by feedgas constraints in Nigeria and Egypt.
The 2024 outcome for operational emissions reductions was outstanding with 1,028 thousand tonnes of GHG emissions reductions from abatement, renewable energy and permanent shutdowns or conversions ("right-sizing"). This was driven by catalyst improvements in Pearl, Forcados Yokri Gas Project in Nigeria and optimisation of liquefaction control system in QGC.
We have continued to grow our network of electric vehicle charge points, exceeding our 2024 target. In 2024, we added around 19,000 charge points, which brings the total number to around 73,000.
There is no change to the energy transition measure in our annual bonus scorecard for 2025.
| | | | | |
| |
| See "Annual Report on Remuneration" on page 195. |
| |
Strategic Report | Performance in the year | Our journey to net zero continued
Other regulatory disclosures
GHG emissions and energy consumption data - information provided in accordance with UK regulations
Data in this section are consolidated using the operational control approach. Under this approach, we account for 100% of the GHG emissions and energy consumption in respect of activities where
we are the operator, irrespective of our ownership percentage.
Reporting on this operational control basis differs from that applied
for financial reporting purposes in the "Consolidated Financial Statements".
See "Basis of preparation – absolute Scope 1, 2 and 3 emissions" on pages 117-118.
| | |
GHG emissions in million tonnes of CO2 equivalent |
| | | | | | | | | | | | |
| (operational control boundary) | 2024 | 2023 | 2022 | |
| Total global direct (Scope 1) [A] | 50 | 50 | 51 | |
| UK including offshore area [B] | 1.6 | 1.7 | 1.7 | |
| Market-based | | | | |
| Total global energy indirect (Scope 2) [C] | 8 | 7 | 7 | |
| UK including offshore area | — | — | — | |
| Location-based | | | | |
| Total global energy indirect (Scope 2) [D] | 8 | 8 | 8 | |
| UK including offshore area | 0.04 | 0.04 | 0.04 | |
Shell GHG intensity in tonnes per tonne | | | | |
Shell GHG intensity [E] | 0.27 | 0.27 | 0.27 | |
[A]Emissions from the combustion of fuels and the operation of our facilities globally, calculated using global warming potential (GWP) factors from the IPCC's Fifth Assessment Report.
[B]Emissions from the combustion of fuels and the operation of our facilities in the UK and its offshore area, calculated using GWP factors from the IPCC's Fifth Assessment Report.
[C]Emissions from the purchase of electricity, heat, steam and cooling for our own use globally, calculated using a market-based method as defined by the GHG Protocol Corporate Accounting and Reporting Standard.
[D]Emissions from the purchase of electricity, heat, steam and cooling for our own use globally, calculated using a location-based method as defined by the GHG Protocol Corporate Accounting and Reporting Standard.
[E]In tonnes of total Scope 1 and Scope 2 gross emissions per tonne of crude oil and feedstocks processed and petrochemicals produced in downstream manufacturing and, oil and gas available for sale, LNG and GTL production in Integrated Gas and Upstream.
Data inputs used in the calculation of Shell's GHG intensity are as follows:
| | |
Inputs used for calculating Shell's GHG emissions intensity |
| | | | | | | | | | | | | | | |
| (operational control boundary) | 2024 | 2023 | 2022 | |
| A | Scope 1 emissions (gross) [A] | 50 | 50 | 51 | |
| B | Scope 2 emissions (gross) [A] | 8 | 7 | 7 | |
| C=A+B | Total Scope 1 and 2 GHG emissions (gross) [A] | 58 | 57 | 58 | |
| D | Total oil and gas production available for sale [B] | 114 | 111 | 111 | |
| E | Refinery crude and feedstock processed [B] | 60 | 62 | 63 | |
| F | Chemicals total production [B] | 25 | 21 | 23 | |
| G | LNG production [B] | 12 | 10 | 9 | |
| H | GTL production [B] | 6 | 6 | 6 | |
| I=D+E+F+G+H | Total Upstream, Integrated Gas and Downstream activity [B] | 217 | 210 | 212 | |
| J=C/I | Shell GHG intensity [C] | 0.27 | 0.27 | 0.27 | |
[A]In million tonnes CO2 equivalent.
[B]In million metric tonnes of production. The production data in this table (operational control basis) are not directly comparable with the production data reported elsewhere in this Report (reflecting the sum of production financial control and share of joint ventures and associates).
[C]In tonnes of CO2 equivalent per tonne of production.
Energy use in our operations
The energy consumption data provided below comprises own energy, generated and consumed by our facilities, and energy purchased (electricity, steam and heat) by our facilities for our use.
Energy consumption data reflects primary (thermal) energy (including the energy content of fuels used to generate electricity, steam, heat, mechanical energy). This includes energy from renewable and
non-renewable sources.
Own energy generated is calculated by multiplying the volumes of fuels consumed for energy purposes by their respective lower heating values. Own energy generated that is exported to third-party assets or to the power grid is excluded.
Thermal energy for purchased and consumed electricity is calculated using actual electricity purchased multiplied by country-specific electricity generation efficiency factors (from IEA statistics).
Thermal energy for purchased and consumed steam or heat is calculated from actual steam or heat purchased multiplied by a supplier-specific conversion efficiency, or a generic efficiency factor where supplier-specific data are not available.
Strategic Report | Performance in the year | Our journey to net zero continued
Our energy consumption increased from 205 billion kilowatt-hours (kWh) in 2023 to 212 billion kWh in 2024, in line with the increase in our Scope 2 GHG emissions. Around 1% of the energy we used in 2024 for our operations came from renewable sources.
| | |
| Energy consumption in billion kilowatt-hours |
| | | | | | | | | | | | |
| 2024 | 2023 | 2022 | |
| Own energy generated and consumed | | | | |
Total energy generated and consumed | 179 | 174 | 177 | |
| UK including offshore area | 6.2 | 6.1 | 6.1 | |
| Purchased and consumed energy | | | | |
Total purchased and consumed energy | 33 | 31 | 32 | |
| UK including offshore area | 0.2 | 0.2 | 0.2 | |
| Energy consumption | | | | |
Total energy consumed | 212 | 205 | 209 | |
| UK including offshore area | 6.4 | 6.3 | 6.3 | |
In 2024, we implemented a variety of measures to reduce the energy use and increase the energy efficiency of our operations.
Examples of some of the principal measures taken in 2024 to reduce energy use and improve efficiency (with estimated total savings of around 1,233 million kWh in 2024) are:
○At our Rheinland site in Germany: replacement of liquid fuel fired boilers with gas fired boilers.
○At our QGC site in Australia: implementation of advanced process control for liquefaction at the QGC Midstream LNG facility and a reduction in required hydraulic power motor speed at well sites.
○At our Prelude site in Australia: optimisation of process resulting in reduced steam consumption and flaring and reduced fuel gas use.
○At our GTL asset in Qatar: reduction of minimum flow of fuel gas to the cogeneration system, allowing fuel gas to be used in other furnaces replacing natural gas usage.
○At our Sarawak Shell Berhad assets in Malaysia: upgrading a gas turbine air intake filter to a high efficiency particulate air (HEPA) filter.
○At our upstream operations in the UK: flare optimisation, which resulted in less fuel gas that needed to be mixed with flare gas to make it combustible.
○At our Gulf of America Mars site: savings of fuel gas combustion as a result of operating the gas compression system with only one field gas compressor.
○At our Gulf of America Perdido site: reduction of the electrical power demand through reduction of production separation pressure.
Examples of some of the principal measures that were taken in 2023 are listed below (with estimated total savings of around 999 million kWh in 2023):
○At our Geismar site in the USA: idling the furnace when not required.
○At our Rheinland site in Germany: optimising the amount of steam required depending on use and load.
○At our Sarnia site in Canada: replacing an existing reaction furnace with a new high-intensity burner.
○At our Scotford complex in Canada: optimisation which enables a reduction in electricity and excess hydrogen vented to flare.
○At our Prelude site in Australia: optimisation of the process and operating conditions to reduce flaring.
○At our Pearl site in Qatar: reducing steam generation requirements via steam balance optimisation.
○At our GTL asset in Malaysia: optimising fuel flows to the boiler unit.
○At our UK Upstream operations: reducing compression power requirements between our Shearwater platform and St Fergus gas terminal.
○At our Gulf of America operations in the USA: optimising power generation between platform and rig and upgrading existing equipment.
○At our Sarawak Shell Berhad assets in Malaysia: optimising the use of gas turbine generators from four to three units.
EU Taxonomy Regulation
The EU Taxonomy Regulation is a classification system for determining when an economic activity can be considered environmentally sustainable according to EU standards. It aims to encourage investment in a low-carbon economy by creating common definitions of sustainability and mandatory disclosures to help investors make informed decisions. In anticipation of the transposition by the Netherlands of the EU Corporate Sustainability Reporting Directive (CSRD) into national law, a key development for Shell in 2024 has been the voluntary implementation of the CSRD and the accompanying European Sustainability Reporting Standards (ESRS). This means Shell plc will come fully into scope of the EU Taxonomy Regulation upon the transposition of the CSRD by the Netherlands into law. The CSRD extends the EU Taxonomy Regulation's reporting obligation to third-country issuers that are listed on European exchanges.
| | | | | |
| |
| See "EU Taxonomy disclosure" on pages 317-330. |
| |
Strategic Report | Performance in the year
| | | | | |
| |
| Respecting nature |
| We seek to protect the environment, increase our reuse and recycling, make a positive contribution to biodiversity and use water and other resources efficiently. |
| |
Strategic Report | Performance in the year | Respecting nature continued
We seek to protect the environment, increase our reuse and recycling, make a positive contribution to biodiversity and use water and other resources efficiently. Our activities can impact nature through discharges and emissions to the environment, and through changes to the use of land and water.
In 2024, we have:
○continued to embed our respect for nature into our activities, standards and business processes;
○expanded our data reporting capabilities to help meet regulatory requirements;
○continued to build employees' awareness, knowledge and skills to deepen their understanding of respecting nature; and
○continued to meet our commitments to reduce fresh-water consumption in water-stressed areas and to use packaging for our products that is designed to be reusable or recyclable.
Our approach is underpinned by the Shell Commitment and Policy on Health, Security, Safety, the Environment and Social Performance (HSSE & SP), and our Safety, Environment and Asset Management (SEAM) Standards, which are part of the Shell Performance Framework.
We require our operated assets to be certified to an independent and internationally recognised standard for environmental management systems, such as ISO 14001 or equivalent, if they have significant environmental risks.
We report data in this section on a 100% basis for companies and joint ventures in which Shell is the operator, unless stated otherwise.
| | | | | |
| |
| See "Our approach to sustainability" on page 145. |
| |
Biodiversity and ecosystems
We aim to manage the impact of our activities on the environment and to make a positive contribution to biodiversity in our operations.
○Forest habitats: We are replanting forests and working to achieve net-zero deforestation from new activities while maintaining biodiversity and conservation value.
○Critical habitats: Our new projects in areas rich in biodiversity, known as critical habitats, are designed to achieve a net positive impact on biodiversity.
○World Heritage Sites: Since 2003, we do not explore for, or develop, oil and gas resources in natural and mixed World Heritage Sites.
When planning a project, our standards require us to assess the potential impact of projects on biodiversity and communities as part of our impact assessment process. We then apply the mitigation hierarchy, a decision-making framework that involves a sequence of four key actions: avoid, minimise, restore and offset.
Achieving a positive impact on biodiversity can take many years because complex ecosystems need time to develop after conservation efforts. We believe it is important to involve communities in conservation projects, so we often work in collaboration with local organisations.
Photo: Reforestation programme, Canada, 2024.
Forest habitats
Deforestation occurs when forests are converted to non-forest uses. We apply the definition of forest used by the UN's Food and Agriculture Organization (FAO). Our commitment to net-zero deforestation commenced in 2022.
Our aim is to avoid deforestation, in line with the mitigation hierarchy. Where avoidance is not achievable, we require our assets, projects and businesses to develop and implement reforestation plans. These plans include measures designed to achieve net-zero deforestation, while maintaining biodiversity and conservation value. We work with partners and stakeholders to develop robust and credible plans unique to each reforestation project.
There is typically a time lag between the deforestation of an area and the start of the replanting process, which can range from months to years. As a result, there is often a difference in the number of hectares deforested and the number of hectares replanted within a single year.
In 2024, around 214 hectares were deforested as a result of our activities. This occurred largely in Australia, Canada and Nigeria where we are preparing for or implementing reforestation programmes in line with local plans. We reforested 64 hectares in 2024 in Canada.
Critical habitats
Critical habitats are specific areas of high biodiversity value in which receptors are particularly sensitive to development.
When undertaking a project in a critical habitat, we aim to go beyond compensating for a residual adverse impact to deliver an overall conservation gain to or net positive impact on biodiversity.
If a project is located in a critical habitat, we develop and implement a biodiversity action plan. This sets out the actions needed to follow the mitigation hierarchy and includes measures to achieve a net positive impact on biodiversity.
At the end of 2024, 62 new projects for which the final investment decision had been taken after February 2021 were located in critical habitats. Of these, 61 have a biodiversity action plan in place to work towards a net positive impact.
Strategic Report | Performance in the year | Respecting nature continued
Examples of activities in development or under way in 2024 include:
○in partnership with a local university, we are executing an ecological restoration programme on Browse Island, Australia, to help eradicate invasive alien species, improve reef health and promote the return of breeding seabirds to enhance regional resilience;
○on Príncipe Island, São Tomé and Príncipe, we helped implement a turtle conservation programme in partnership with a local conservation organisation; and
○in partnership with the Marine Alliance for Science and Technology for Scotland (MASTS), and its member institutions, including Scottish government stakeholders, we helped to set up a multi-year research programme to gain insights into the ecology of skates and sharks in Scottish waters to help develop effective conservation strategies.
Photo: Turtle conservation, São Tomé and Príncipe, 2024.
Resource use and circular economy
We aim to use water and other resources efficiently, and to increase our reuse and recycling.
○Waste and circularity: Our businesses are deepening their efforts to better understand the types of waste we generate and identify options to increase circular approaches.
○Water: We are implementing water stewardship principles across our businesses and developing water stewardship management plans. This includes focusing on the sustainable management of fresh water resources, particularly in water-stressed areas.
○Packaging: We have a priority to increase the amount of recycled plastic in Shell-branded packaging to 30% by 2030, based on the reference year of 2022, and to ensure that the packaging we use for our products is reusable or recyclable by design. These priorities apply to Shell-branded Mobility and Lubricants products.
Waste and circularity
In 2024, we introduced a new requirement within our SEAM Standards for our assets, projects or businesses to develop strategies to identify circularity-related risks and opportunities. Through this, we aim to encourage the development of fit-for-purpose objectives and strategies based on the principles of rethink, refuse, reduce, reuse, recycle and repair.
Since 2021, we have completed 26 detailed assessments across our businesses to better understand the types of waste we generate and identify options to increase circular approaches. Using these results, our assets are improving local waste management practices by prioritising waste prevention, reuse and recycling over energy
recovery and disposal.
Key developments related to waste and circularity in 2024 include:
○at the Pearl gas-to-liquids facility in Qatar, we have diverted waste to local cement kilns for use as clinker in cement production, thereby reducing use of raw materials and the amount of waste sent to landfill;
○our Gulf of America operations are finding ways to reduce disposal of unused chemicals, for example, by testing and treating them so that they can be returned to the supplier for reuse; and
○at our Brazos wind farm upgrade in Texas, we sent decommissioned turbine blades to be recycled for use as a component in construction materials.
We are working to reduce waste and increase circularity in those parts of our business where it is possible to do so. In 2024, we concluded our aim for zero waste is technically unfeasible. We continue to improve waste and circularity plans at the asset level to drive fit-for-purpose waste reduction and optimise local circular economies.
In 2024, we disposed of 1,933 thousand tonnes of waste, compared with 2,251 thousand tonnes in 2023.
Water
We require our assets, projects or businesses to manage sourcing,
use, treatment and disposal of water based on recognised water stewardship principles and to implement this through a water stewardship management plan. These plans help us to move away
from a traditional inside-out approach focusing on our impact on the environment to an outside-in approach that considers how we impact, and are impacted by, the environment. They also help us to reduce consumption in water-stressed areas.
Since 2021, we have conducted water stewardship assessments at 18 assets across different businesses and regions, with a priority on operations in areas of high water stress and those that use significant quantities of fresh water. The insights gained from these assessments have moved us towards a more holistic stewardship approach. This goes beyond only focusing on water use to also considering factors such as water footprint, regional water stress, water quality, catchments, governance and stakeholder engagement. Building on these efforts, our Mobility and US Midstream businesses developed water stewardship plans in 2024.
In 2021, we set a voluntary commitment to reduce our consumption
of fresh water by 15% by 2025 compared with 2018 levels in areas where there is high fresh-water stress. We achieved this commitment ahead of time in 2022. In 2024, our consumption of fresh water in areas of high water stress was 16 million cubic metres compared with 25 million cubic metres in the base year of 2018, a 36% reduction over the period.
Discharges to water
We track pollutants in water returned to the environment from the day-to-day running of our facilities (referred to as "discharges to surface water"). We work to minimise these discharges according to local regulatory requirements and our SEAM Standards.
Plastics
Shell supports the need for improved circularity of the global plastics market. We encourage reduction, reuse and recycling of plastics and are a founding member of the Alliance to End Plastic Waste, which helps governments to assess and improve waste collection and waste management. We are working with partners across the plastic waste value chain, such as the waste management industry and pyrolysis
oil producers, to encourage the development of a more circular
value chain.
Strategic Report | Performance in the year | Respecting nature continued
Since 2019, Shell has been processing pyrolysis oil made from mixed plastic waste at the Shell Norco Energy and Chemicals Park in the USA. In 2024, we began production at our new pyrolysis oil upgrader at the Shell Chemicals Park Moerdijk in the Netherlands. The upgrader improves the quality of pyrolysis oil, a liquid made from hard-to-recycle plastic waste, and turns it into chemical feedstock. The plant has the capacity to process up to 50,000 tonnes of pyrolysis oil per year.
Packaging
Shell has a priority to increase the amount of recycled plastic in Shell-branded packaging to 30% by 2030 based on the reference year of 2022 and to use packaging for our products that is reusable or recyclable by design. These priorities apply to Shell-branded Mobility and Lubricants products.
○Packaging classified as reusable or recyclable: In 2024, we continued to meet our priority to use packaging for our products that is reusable or recyclable by design. We maintained 99% total Shell-branded product packaging classified as reusable or recyclable in our Lubricants business and achieved 92% in our Mobility business, compared with 79% in the base year of 2022.
○Recycled plastic content in packaging: By the end of 2024, we had achieved a level of 17% recycled plastic content by weight in Shell-branded plastic packaging compared with 10% in the base year of 2022.
Air quality
We follow the most stringent of either the SEAM Standards or local regulations to manage airborne pollutants in our operations, including emissions of nitrogen oxides (NOx), sulphur oxides (SOx) and volatile organic compounds (VOCs).
There are often synergies to be achieved between greenhouse gas improvement opportunities and reducing emissions of other air pollutants. For example, operational efficiencies that reduce site power generation can also reduce emissions of VOCs, SOx and NOx. In 2024, we continued to implement leak detection and repair programmes to reduce emissions of volatile organic compounds,
with a focus on sources exceeding 100 tonnes per year.
We are developing a range of choices for customers to help people and companies reduce their transport emissions. This includes building our electric vehicle charging business. For heavy-duty road transport, LNG as a fuel and GTL fuel and motor oils help reduce sulphur emissions, particulates and nitrogen oxide compared with
oil-based products.
Our key metrics in 2024 include:
○SOx emissions in 2024 decreased to 21 thousand tonnes, compared with 31 thousand tonnes in 2023.
○NOx emissions in 2024 increased to 92 thousand tonnes compared with 88 thousand tonnes in 2023.
○VOC emissions in 2024 were 32 thousand tonnes compared with 32 thousand tonnes in 2023 (restated from 36 thousand tonnes following a review of the performance data).
| | | | | |
| |
| See "Our journey to net zero" on page 93. |
| |
Spills
Our assets are designed to avoid discharges to soil or groundwater. However, spills can occur due to operational failure, accidents, unusual corrosion, or theft and sabotage. Large spills of crude oil, oil products and chemicals can harm the environment. They can also result in major clean-up costs, fines and other damages. Spills can affect our licence to operate and harm our reputation.
Spill prevention and response
Our policies on asset integrity and process safety are in place to prevent losses of containment from happening. We design, operate and maintain our facilities with the intention of preventing spills, by identifying potential hazards and implementing controls that can prevent them from occurring. This is integral to our Goal Zero ambition of doing no harm to people and to have no leaks across our operations. If a spill or a leak occurs, we use barriers that operate independently of each other to reduce the likelihood of a release becoming catastrophic. Such barriers are designed so that, if the failure of one occurs, it does not lead to the failure of others. Our policies on soil and groundwater are designed to manage the potential health and environmental impacts should spills occur.
Our business units are responsible for organising and executing spill responses in line with the SEAM Standards and relevant legal and regulatory requirements. Our assets have spill response plans, based on worst-case spill scenarios, should an incident occur. We also continue to be involved in industry groups to improve well-containment capabilities. These include the Marine Well Containment Company in the Gulf of America and Oil Spill Response Limited, a global industry group. For oil spills, we have a global response network that enables us to deal more effectively with oil spills, supplementing local response capability.
| | | | | |
| |
| See "Safety" on page 138. |
| |
In 2024, there were 69 operational spills of more than 100 kilograms compared with 71 in 2023 (restated from 70 operational spills of more than 100 kilograms following a review of the performance data). The volume of operational spills of oil and oil products in 2024 was 1.23 thousand tonnes, compared with 0.37 thousand tonnes in 2023. The increase in operational spill volumes is partly attributable to a spill that occurred during severe weather in the Gulf of America, as well as incidents in Singapore, Canada and Nigeria.
Spills in Nigeria
SPDC JV - Nigeria: operational spills
In 2024, The Shell Petroleum Development Company of Nigeria Limited (SPDC) [A], as operator of the SPDC joint venture (SPDC JV, Shell interest 30%), reported 20 operational spill incidents of more than 100 kilograms of crude oil, compared with 9 reported in 2023. The increase in the number of operational spill incidents was largely because of a rise in cases of failure due to factory defects in a locally manufactured clamp used in pipeline repairs following the removal of illegal connections. The company that manufactured the clamps has recalled the affected batch, and SPDC has commenced the replacement of the clamps.
In 2024, the volume of operational spills of oil and oil products was 0.37 thousand tonnes compared with 0.005 thousand tonnes reported in 2023. The majority (89%) of the 2024 volume relates to two significant incidents, one onshore on the Trans Niger Pipeline and the other offshore at a terminal loading buoy.
[A]Unless otherwise stated, all activities reported for or as relating to The Shell Petroleum Development Company of Nigeria Limited (SPDC) in this section should be understood as SPDC acting as the operator of the SPDC joint venture (SPDC JV). SPDC, as the corporate entity, owns 30% of the joint venture.
Strategic Report | Performance in the year | Respecting nature continued
SPDC JV has an ongoing work programme to appraise, maintain and replace key sections of pipelines and flow lines to reduce the number of operational spills.
On March 13, 2025, Shell completed the sale of SPDC to Renaissance. By preserving the full range of SPDC's operating capabilities, the transaction has been designed to ensure that the company can continue to perform its role as operator and to meet its share of commitments within the joint venture, including those relating to health, safety, security and environment.
| | | | | |
| |
| See "Upstream" on page 60. |
| |
SPDC JV - Nigeria: spills caused by crude theft and sabotage
In 2024, about 81% of crude oil spill incidents of more than 100 kilograms from SPDC JV facilities were caused by the illegal activities of third parties. In 2024, the volume of crude oil spills of more than 100 kilograms caused by crude theft and sabotage was 2.0 thousand tonnes (84 incidents), compared with 1.4 thousand tonnes (139 incidents) in 2023. The decrease in the number of incidents in 2024 shows an increased effectiveness of anti-theft protection mechanisms.
Prevention
In 2024, SPDC JV continued on-ground surveillance of its areas of operation, including its pipeline network, to mitigate third-party interference and ensure that spills are detected and responded
to as quickly as possible.
Regular surveillance flights and drones are used to inspect the most vulnerable segments of the pipeline network, monitor security and identify any new spills or illegal activity. SPDC JV continued to install and improve anti-theft protection mechanisms for key infrastructure, such as wellheads and manifolds. These include protective measures such as cages, anti-theft nuts and improved CCTV and networking capabilities. These measures continue to help deter theft and improve response.
SPDC JV continued to work with the government security agencies in 2024 to maintain surveillance and address illegal activities of third parties, primarily along the SPDC JV pipelines and their operational areas.
Response and remediation
Regardless of the cause, SPDC JV cleans up and remediates areas affected by spills originating from its facilities. Clean-up activities include bio-remediation which stimulates micro-organisms that naturally break down and use carbon-rich oil, effectively removing it. Once clean-up and soil remediation operations are completed, the work is inspected and, if satisfactory, approved and certified by the Nigerian regulators. In the event of operational spills, SPDC JV also pays compensation to affected people and communities.
SPDC JV works with a range of stakeholders in the Niger Delta to monitor biodiversity recovery at remediated sites and to build greater trust in spill response and clean-up processes.
The clean-up programme established following the 2011 United Nations Environment Programme (UNEP) report on Ogoniland is executed by the Hydrocarbon Pollution Remediation Project (HYPREP), an agency of the Nigerian government. Completion of remediation under this programme is verified and certified by the National Oil Spill Detection and Response Agency (NOSDRA). HYPREP has reported progress of the execution of its programme during 2024 with clean-up efforts for 18 sites continuing, and remediation plans being developed for the remaining 15 sites. SPDC has fully funded its share of the HYPREP programme.
In 2015, SPDC JV and the Bodo community in Ogoniland signed a memorandum of understanding, granting the remediation team access to begin cleaning up areas affected by two operational spills that occurred in 2008. Phase 1 of an agreed three-phase clean-up and remediation programme, which involved removal of oil from shoreline surfaces and mud flatbeds, was completed in 2018. In 2024, SPDC JV remediated soil and sediments in an additional 106 hectares, bringing Phase 2 to 99% completion. SPDC JV also planted about 1.7 million mangrove seedlings in 2024 as part of Phase 3, achieving 85% of the project's revegetation goal, up from 17% in 2023. SPDC JV is seeking certification of remediated areas from NOSDRA.
SPDC JV continues to raise awareness of and counter the negative effects of crude oil theft and illegal oil refining.
Strategic Report | Performance in the year
| | | | | |
| |
| Powering lives |
| We power lives through our products and activities, and by supporting an inclusive society. |
| |
Strategic Report | Performance in the year | Powering lives continued
Shell strives to make a positive impact on people around the world and this includes providing the energy people need, contributing to local economies and communities, championing inclusion and respecting human rights.
We help ensure energy security in our key markets and invest in businesses that supply energy access in emerging markets. Through our social investments, we also provide funds, expertise and resources to increase energy access outside of our commercial business. The supply of affordable and secure energy is crucial for addressing global challenges, including those related to poverty and inequality.
Our activities contribute to economies and communities around the world through job creation, spending on goods and services, and through the payment of taxes and royalties to governments. Across more than 70 countries, we employ thousands of people and provide them with opportunities to develop their careers.
As we transform into a net-zero emissions energy business, we work with governments and society to support positive economic and social impacts of the transition on our workforce, communities, suppliers and customers.
Our core values of honesty, integrity and respect for people underpin everything we do. We aim to become one of the world's most diverse and inclusive organisations, a place where everyone feels valued, respected and has a strong sense of belonging.
The importance of respecting people also extends to our suppliers. Shell's Supplier Principles outline our expectations for business integrity, health, safety, security, labour and human rights, and environmental and social performance.
Many of our operations are located close to communities and we aim to be a good neighbour. This includes strong community engagement, managing the negative social impacts of our operations and delivering a range of benefits through jobs, local business opportunities and social investment programmes. This engagement enables us to identify and manage impacts from our activities and provide access to remedy.
Our people
Our people are essential to our purpose of powering progress together. They are key to delivering our strategy and we believe in helping them to develop their skills.
All metrics throughout this section exclude employees in portfolio companies [A], except for the metrics reflecting total employee number by gender and region, percentage of women employees, and certain mandatory training courses.
[A]Portfolio companies are non-integrated entities within the Shell Group. To give these companies the flexibility they need, they operate as subsidiaries while generally retaining their own processes and systems. Portfolio companies comply with Shell's minimum requirements for controls and compliance. This includes the Shell Performance Framework and mandatory requirements for ethics and compliance, risk management and safety.
Photo: Staff at Karachaganak, Kazakhstan.
Employee overview
We employed 96,000 people on a full- or part-time basis as of December 31, 2024. This compares with 103,000 at the end of 2023 and 93,000 at the end of 2022.
The reduced number of employees in 2024 compared with 2023 reflects our focus on performance, discipline and simplification as we implement our strategy. We improved efficiencies, and divested and ended some activities in our Downstream, Renewables and Energy Solutions business. We also improved efficiencies in our Projects & Technology, Human Resources, Legal and Corporate Relations functions.
Employee overview figures include people working for Shell companies and Shell-operated joint ventures, as well as those seconded to non-operated joint ventures, but exclude contingent workers, otherwise referred to as contractors. Contractors are external workers who are engaged directly or through third parties to provide services to Shell. They work alongside Shell employees in divisions such as Information and Digital Technology.
Changes in headcount
We employed 81,000 people in Shell, excluding portfolio companies, at the end of December 2024. This is fewer than the 84,000 at the end of 2023. Shell's portfolio companies, which generally maintain their own HR systems, employed 15,000 at the end of 2024 compared with 19,000 at the end of 2023.
| | | | | |
| |
| See Note 33 to the "Consolidated Financial Statements" on page 295 for the average number of employees by business segment. |
| |
Strategic Report | Performance in the year | Powering lives continued
[A]Numbers presented are as of December 31, 2024.
The table below presents the total employee number by gender and region as of December 31, 2024.
| | |
Number of employees by gender and region |
| | | | | | | | | | | | | | | | | | | | | | | |
| Thousand |
2024 | | 2023 | | 2022 |
Men | Women | Total | | Total | | Total |
Number of employees | 63 | 33 | 96 | | 103 | | 93 |
Breakdown by region | | | | | |
| Africa | 2.5 | 0.9 | 3 | | 4 | | 4 |
| Asia | 21.7 | 14.0 | 36 | | 38 | | 32 |
| Europe | 19.1 | 10.7 | 30 | | 31 | | 30 |
| North America | 16.7 | 6.2 | 23 | | 24 | | 23 |
| Oceania | 1.9 | 0.9 | 3 | | 4 | | 3 |
| South America | 0.9 | 0.6 | 2 | | 2 | | 1 |
The table below presents the distribution of employee contract type, by gender and region as of December 31, 2024.
| | |
Employee contract type by gender and region [A] |
| | | | | | | | | | | | | | | |
| Permanent contract/Employment at-will [B] | | Fixed-term contract |
Men | Women | | Men | Women |
Number of employees | 52,000 | 28,000 | | 763 | 344 |
| Breakdown by region | |
| Africa | 4% | 3% | | 7% | 15% |
| Asia | 38% | 44% | | 36% | 40% |
| Europe | 31% | 34% | | 50% | 40% |
| North America | 22% | 15% | | 1% | 1% |
| Oceania | 3% | 2% | | 6% | 4% |
| South America | 2% | 2% | | — | — |
[A]Excludes employees in portfolio companies.
[B]Employment at-will is used in the USA to describe employment contracts.
The table below presents the number of employees by age group.
| | |
Employees by age group [A] [B] |
| | | | | | | | | | | | | | |
Thousand |
| % of employees | 2024 | 2023 | 2022 |
| Under 30 years old | 13% | 10 | 12 | 11 |
Between 30 and 50 years old | 64% | 52 | 54 | 51 |
| Above 50 years old | 23% | 19 | 18 | 17 |
Total employees | 100% | 81 | 84 | 79 |
[A]Excludes employees in portfolio companies.
[B]Includes employees seconded to joint ventures.
Shell aims to be an attractive employer to its existing and prospective employees. We offer employees the opportunity to develop their careers within Shell, including rotations across different parts of the business to grow their skills and progress.
People development remains a priority for our organisation. We proactively identify skill and capability gaps for traditional and emerging businesses; offer training to address these gaps; and if needed recruit talent externally to add to the skills and experiences of our workforce. To enable our leaders to lead this change, we support them through targeted interventions including leadership development and coaching. Our mindset and behaviours, which emphasise psychological safety, are at the heart of our leadership programmes. Training courses are accessible to all employees, either online or in person. In 2024, 264,000 formal training days were delivered to employees and joint-venture partners. This compares with 295,000 training days in 2023 and reflects staff reductions in 2024.
Shell's employee turnover as of December 31, 2024 was 7.6%; 6,227 employees left Shell of which 2,931 resigned voluntarily. This compares with 5.7% in 2023, during which 4,685 employees left Shell of which 2,669 voluntarily.
Strategic Report | Performance in the year | Powering lives continued
Employee engagement
Insight into employee needs and perspectives enables Shell to continually learn and improve our policies, processes and practices.
Management regularly engages with employees through elected employee representatives and a range of local formal and informal channels. These channels include webcasts and all-employee messages from our CEO and other senior leaders, as well as town halls, team meetings and site visits by the Board and EC.
In 2024, members of the Board and EC visited Shell sites in the Netherlands where they engaged with employees on our strategy and the energy transition. Board members and Chair, Sir Andrew Mackenzie, also met with employees in Qatar, Oman and Brazil.
| | | | | |
| |
| See "Board activities" on page 156. |
| |
We seek to comply with applicable local laws and regulations, including those on working hours. Shell is committed to respecting human rights. This includes, but is not limited to, the elimination of forced and child labour, respect for freedom of association and the effective recognition of the right to collective bargaining. Where appropriate, engagements take place with union and employee representatives at asset and country level, as well as with the Shell European Works Council. Employees have access to senior leaders, local employee forums and employee resource groups. We believe these engagements enable Shell to maintain a constructive employee and industrial relations environment.
Photo: In June 2024, Shell's Board of Directors visited Holland Hydrogen 1, one of Europe's largest renewable hydrogen plants, which is under construction in the Netherlands.
The Shell People Survey
The Shell People Survey is one of the key tools we use to measure employee engagement, motivation, affiliation and commitment to Shell. External and internal research shows that increased employee engagement can result in better business performance and improved safety. In 2024, the response rate to the survey was 86%, compared with 88% in 2023 which indicates our people's desire to provide feedback. The overall employee engagement score decreased to 75 (compared with the top quartile 80 points) from 79 points in 2023, which we believe reflects the level of changes introduced in the organisation as we transform our business to deliver more value with less emissions.
Pay, benefits and well-being
Our Fair Pay Principles are designed to manage pay at Shell and help us ensure that employees are valued, respected and recognised for the work they do. Shell's pay is designed to be market competitive and free from bias. The basis for paying fairly is equal pay for equal work, taking into account factors such as performance and experience. Through regular benchmarking, Shell's compensation is typically higher than the minimum wage level observed locally, including in countries without legislation on minimum wage. Pay adjustment at Shell is linked to performance and we share this information with employees to help them understand how their pay adjustments are made. We continue to engage employees transparently and openly about our pay policies to help build understanding, trust and confidence in our approach.
Shell provides a range of benefits, such as global minimum standards for life, accident and disability cover, as well as maternity and parental leave, except in certain cases where we are precluded from offering this. Our benefit packages are tailored to each country to meet the requirements of local laws and regulations.
Flexible work
We seek to build a sense of community and collaboration within Shell's sites where we want employees to feel welcome and valued. By enabling people to balance their work and personal lives, we can help them perform at their best. Our Future of Work guide advises employees and team leaders on hybrid working options.
Employee well-being
Our goal is to empower our employees to feel their best and perform at their best. We do this by promoting mindsets and behaviours that support good health, by protecting our people from illness by mitigating known risk factors. We use evidence-based tools and provide access to timely support and care for those who are injured, ill or struggling.
Interventions to promote mental, physical and social well-being are delivered via a mix of measures. For example, through the design of our workspaces, through local benefit offerings such as gyms and health checks, and through our country-based employee networks, group activities and events. Our global campaigns such as I'm Not OK and World Mental Health Day, help develop individual and team well-being skill sets, to create healthy and psychologically safe working environments, and to nurture a culture of care.
Mental well-being
We work to reduce the stigma associated with mental ill health through open conversations, global and country-level campaigns, senior leader communications, engagements with elected employee representatives, and through our experience-sharing portal for employees. This commitment is underscored by our CEO signing a leadership pledge with MindForward Alliance and the launch of our Global Mental Well-being Programme in 2023. The programme's interventions focus on developing a workplace culture that supports good mental health and offers employees the opportunity to complete an anonymous and voluntary survey in which they can voice their experience of well-being at Shell. We monitor the survey results to identify opportunities to improve employee well-being. In 2024, we continued to improve the programme, introducing new resources such as those that address financial well-being.
Diversity, equity and inclusion
We have ambitions around diversity, equity and inclusion and monitor these on a regular basis. We also continually assess our culture and employee engagement through tools such as the annual Shell People Survey.
Strategic Report | Performance in the year | Powering lives continued
We promote equal opportunity and aim to create an environment where people feel included. Our approach seeks to reinforce respect for people and seeks to provide psychological safety for all our employees.
Shell employees and contractors are required to complete training courses that reinforce expected behaviours for a respectful, inclusive workplace, and build our stance against discrimination and harassment, including bullying and sexual harassment. Employees and contractors are required to take these courses every two years.
In 2024, our Shell People Survey showed a result of 81 points out of 100 for all questions relating to DE&I. This is a decrease of two points from 2023 and puts us below the top quartile (85 points). We will continue to focus on improving these efforts in the workplace.
As of 2024, Shell is able to provide 93% of employees where legally permissible with the option to voluntarily declare their gender identity, sexual orientation, race and ethnicity, and disability, via the HR system. Data from this self-identification initiative allow us to monitor progress against our DE&I aspirations.
Gender
We strive to achieve gender equality. We have signed the World Economic Forum declaration on closing the gender gap in the oil and gas sector and have endorsed the Catalyst CEO Champions for Change initiative for the advancement of women, especially those from ethnic minorities, into senior leadership and board positions.
In line with the UK Listing Rules, the Board of Shell plc aims for gender balance on the Board, with at least one senior Board position [A] held by a woman. To provide flexibility for periods of change, we aim to maintain the representation of both men and women at, or above, a minimum of 40%. As of December 31, 2024, women made up 42% of the Board and the position of CFO was held by a woman.
[A]Senior Board position means Chair, CEO, Senior Independent Director, or CFO.
Over the years, Shell has progressively increased the representation of women on the EC and in senior leadership roles. As of January 1, 2024, we had 57% women and 43% men on our EC. We aim to achieve 35% representation of women in our senior leadership positions by 2025, and 40% by 2030. The table below shows the representation of women as of December 31, 2024.
| | | | | | | | | | | | | | |
Gender diversity at Board and management level [A] |
| | | | | | | | | | | | | | |
| Men | Women |
| Level | 2024 | 2023 | 2024 | 2023 |
Board | 58% | 58% | 42% | 42% |
Executive Committee | 43% | 57% | 57% | 43% |
Senior Leadership roles [A] | 67% | 68% | 33% | 32% |
[A]Senior Leadership is a Shell measure based on compensation grade levels. This measure is distinct from "senior manager" as per statutory disclosure requirements set out in the table below.
| | |
Gender diversity data (at December 31, 2024) |
| | | | | | | | | | | | | | |
| Men | Women |
| Gender diversity data | Number | % | Number | % |
| Directors of the Company | 7 | 58% | 5 | 42% |
| Senior managers [A] | 774 | 65% | 413 | 35% |
| Employees (thousand) | 63 | 65% | 33 | 35% |
[A]Senior manager is defined in section 414C(9) of the Companies Act 2006 and, accordingly, the number disclosed comprises the Executive Committee members who were not Directors of the Company, and other directors of Shell subsidiaries (excluding Directors of portfolio companies).
As of December 31, 2024, 35% of Shell employees were women. Of the experienced hires who joined Shell as of December 31, 2024, 37% were women compared with 38% in 2023. Of the graduate hires who joined Shell as of December 31, 2024, 57% were women compared with 40% in 2023.
A crucial element of achieving gender balance is addressing any pay gap [A] and we continue to work towards improvements in this area. The basis for paying fairly is equal pay for equal work, taking into account factors such as performance and experience. At Shell, we monitor pay equity [B] through regular analysis to be confident that we have pay equity between genders for performing the same jobs. We address any unexplained pay differences related to gender through rigorous internal processes and apply our Fair Pay Principles. We continue to make progress in our gender ambitions at Shell, but a gender pay gap exists for several reasons, including fewer women in senior leadership positions and fewer women in higher-paid specialist roles.
[A]Shell seeks to comply with applicable requirements and regulation on pay gap reporting.
[B]Men and women who are paid the same for doing similar jobs, at similar level, responsibility, tenure and performance.
Race and ethnicity
Through racial and ethnic representation across our workforce we aim to reflect the communities in which we work. Shell's Global Council for Race is supported by an Employee Advisory Board which aims to advance diversity in our workforce.
Shell aims to maintain or exceed having at least one Board member from an ethnic minority background, while acknowledging that in periods of Board change this may not be achieved. As of December 31, 2024, the Board had three members who identify as being from an ethnic minority group and one EC member who identifies as being from an ethnic minority group [A].
In support of the Parker Review recommendations, Shell aims to achieve 15% ethnic minority group representation in its Senior Management [B] by 2027. As of the end of 2024, 15% of Shell's Senior Management identifies as being from an ethnic minority group.
[A]Ethnic minority refers to an individual who self-identifies as Asian, Black, Mixed/multiple, or other ethnic minority group, in line with UK Office for National Statistics classifications.
[B]As per Parker Review recommendations, Senior Management refers to senior leadership based in the UK and is a Shell measure based on compensation grades. We have moved to this Shell definition of Senior Management for 2024 onwards to align with our self-identification data collection and processes.
| | | | | |
| |
| See "Nomination and Succession Committee" on pages 163-166 for our current talent management and succession process. |
| |
In some countries, there are local restrictions on collecting and reporting race and ethnicity data. Shell offers employees the option to voluntarily declare their race and ethnicity via our self-identification initiative.
| | | | | |
| |
| See shell.com for more information on our DE&I progress in the UK, the USA and the Netherlands. |
| |
Strategic Report | Performance in the year | Powering lives continued
LGBT+
We are working to advance lesbian, gay, bisexual and transgender plus (LGBT+) inclusion within Shell and the communities where we work. Most of our work around LGBT+ inclusion happens at a country level, in line with local policies, laws and regulations.
Disability inclusion and accessibility
We are working to advance an inclusive, psychologically safe and accessible environment where people with disabilities can excel. We provide support and adjustments for people with disabilities during the recruitment process. For example, candidates with a disability or long-term health condition can indicate whether they require adjustments to our facilities or our job application process. Our support teams and systems are equipped to make these adjustments if required. We also support employees throughout their careers with Shell, including access to educational resources, training programmes and personal and professional development. Our Disability, Accessibility and Inclusion portal provides comprehensive guidance and tools for line managers, leaders, people with disabilities and employees to be active allies. Shell's enABLE employee resource groups provide expertise and advice to Shell leaders and our businesses on accessibility and disability inclusion. We also offer a workplace accessibility service which covers 68 locations in 33 countries. The team is supported by functions such as Shell Health, Human Resources, Real Estate and IT.
Shell is part of the Valuable 500, which comprises 500 of the world's largest companies and organisations that are working collectively to progress disability inclusion. We are also an active member of the Business Disability Forum and PurpleSpace.
Employee share plans
Our share plans align employees' interests with our performance through share ownership.
| | | | | |
| |
| See the "Directors' Remuneration Report" on pages 180-199. |
| |
Discretionary share awards
For 2024, Long-term Incentive Plan (LTIP) awards were made to Executive Directors and Senior Management, and Performance Share Plan (PSP) awards to nominated employees on a highly selective basis. These plans were designed to ensure that remuneration is clearly aligned with Shell's Operating Plan and/or longer-term strategic ambitions. Half of the performance conditions applied to the PSP are the same as those applied to the LTIP, and performance is measured over three years under both plans.
* Non-GAAP measure (see page 337).
For the 2024 LTIP, 25% of the award is linked to organic free cash flow and 25% to the energy transition, with the remaining 50% linked to comparative performance conditions. For the 2024 PSP, 50% of the award is linked to certain indicators described in "Performance indicators" on pages 35-36, averaged over the performance period, with the remaining 50% linked to the same performance conditions as for the LTIP.
| | | | | |
| |
| See the "Directors' Remuneration Report" on pages 180-199. |
| |
For 2025, Restricted Share Awards (RSA) and/or Performance Share Awards (PSA) may be awarded to nominated employees on a highly selective basis. RSAs support employee retention over a three-year period and provide a stake in the Company's future. PSAs ensure that remuneration is clearly aligned with Shell's strategic ambitions and are measured over a three-year performance period.
| | | | | |
| |
| See "Annual Report on Remuneration" on page 198 for further information on the performance conditions. |
| |
Separately, following the BG acquisition, certain employee share awards made in 2015 under BG's Long-term Incentive Plan were automatically exchanged for equivalent awards of shares in the Company. The outstanding awards take the form of nil-cost options.
Under all plans, vesting shares are increased by notional dividends accrued during the period from award to vesting. In certain circumstances, awards may be adjusted before delivery or be subject to clawback after delivery. None of the awards result in beneficial ownership until the shares vest.
| | | | | |
| |
| See Note 28 to the "Consolidated Financial Statements" on page 289. |
| |
Global Employee Share Purchase Plan
Eligible employees in participating countries may participate in the Global Employee Share Purchase Plan. This plan enables them to make contributions from net pay towards the purchase of the Company's shares at a discount to the market price.
UK Shell All Employee Share Ownership Plan
Eligible employees of participating Shell companies in the UK may participate in the Shell All Employee Share Ownership Plan, under which monthly contributions from gross pay are made towards the purchase of the Company's shares with a matching element.
Strategic Report | Performance in the year | Powering lives continued
Contribution to society
People's lives are better with energy. We help to power lives by providing vital energy for homes, businesses and transport, including for cooking, heating and lighting. Energy is also used to provide essential services, such as health care, and manufactured products which society consumes daily. Shell delivers energy for millions of people around the world every day and is working to help provide energy to those who do not yet have it.
For example, in November 2024, we joined forces with bp, Equinor and TotalEnergies to announce a $500 million joint investment commitment to help address the challenges of energy access. This joint investment seeks to support promising, high-impact projects, primarily in Sub-Saharan Africa, and South and South-east Asia, that are working to bring access to electricity and improved cooking conditions to underserved communities.
We want to help communities benefit from having us as their neighbour. Some of the ways in which we make a meaningful contribution are by generating jobs and supporting start-ups and local businesses. In 2024, our operated and non-operated ventures spent around $42 billion on goods and services* from suppliers around the world, compared with $49 billion in 2023. This reduction is mainly driven by structural cost reductions and discipline and focus in cash capital expenditure as we implement our strategy.
Photo: For more than 40 years, Shell LiveWire has helped entrepreneurs start and/or grow their businesses. Its biennial Top Ten Innovators awards selects young businesses that excel in social impact, environmental sustainability and business innovation. Camila de Araujo Reveles Barreira of Brazil was a Top Ten winner in 2023.
Our activities also generate revenues for governments through the taxes and royalties we pay, which can help governments to fund health care, education and other essential services. We publish an annual Tax Contribution Report which sets out the corporate income tax that Shell companies paid in the countries and locations where we have a taxable presence. In 2024, Shell paid $18 billion in taxes* to governments, of which $12 billion was paid in corporate income taxes and $6 billion in government royalties.
| | | | | |
| |
| See shell.com for the Tax Contribution Report. |
| |
* Non-GAAP measure (see page 337).
Supply chain
Our business activities depend on a competitive and resilient supply chain. Suppliers play an important role in helping to deliver our strategy and helping to create value for our stakeholders.
As part of Shell's responsible sourcing approach, we aim to work with suppliers that behave in an economically, environmentally and socially responsible manner. Shell partners with suppliers who adhere to our Shell General Business Principles and Shell Supplier Principles. The Shell Supplier Principles set out our expectations of suppliers with respect to business integrity; health, safety, security, environment and social performance (HSSE & SP); and labour and human rights. Our standard contract terms require adherence to these or equivalent principles.
Worker welfare
Our approach to worker welfare focuses on the well-being of supplier staff on Shell sites and dedicated supplier staff on non-Shell sites, where we have the most ability to influence safety, working conditions and labour rights. We also work with our partners and peers to include worker welfare in industry standards, guidance and best practice. This helps raise expectations and levels of consistency across the industry. Our approach is based on the principles established by Building Responsibly, an alliance of companies that seeks to promote the rights and welfare of workers in the engineering and construction industry.
In 2024, we continued to collaborate with peers and suppliers to drive consistency across the industry on worker welfare.
| | | | | |
| |
| See shell.com for more information about how we engage with contractors and suppliers. |
| |
Working with communities
We engage with communities to help us understand their needs and expectations. This engagement enables us to identify and manage impacts from our activities and provide access to remedy. Engagement is a continuous process that helps us improve our decision-making and performance. Shell's Safety, Environment and Asset Management (SEAM) Standards are designed to help us to operate responsibly and avoid or minimise any potentially negative environmental and social impacts that may result from our operations.
Communities can raise concerns in a number of ways. At large projects and assets, community engagement practitioners act as a bridge between local communities and our operations. Community feedback mechanisms allow us to receive, track and respond to questions and complaints. In 2024, we improved our internal tools to make it easier to track community satisfaction with the remedy offered by the process. Communities can also raise concerns anonymously through the Shell Global Helpline.
Our SEAM Standards require us to apply special procedures in situations involving involuntary resettlement, cultural heritage, Indigenous Peoples or operations in environments with high or unusual social risks. In 2024, we engaged with communities who were impacted by our business activities through involuntary resettlement which restricted their access to some areas on which they depend for their livelihoods. This occurred in Albania, Norway, South Korea, Trinidad and Tobago, and the UK. Our engagement involved plans to manage these impacts. We also provided support to help avoid or manage involuntary resettlement impacts in our non-operated ventures.
| | | | | |
| |
| See "Our approach to sustainability" on page 145. See shell.com for more information about our work with communities. |
| |
Strategic Report | Performance in the year | Powering lives continued
Social investment
Our activities contribute to economies through taxes, jobs and business opportunities. We also make social investments in areas determined by local community needs and priorities. These investments are sometimes voluntary, sometimes required by governments, or part of a contractual agreement. Shell has three priority areas for social investment: access to energy; skills and enterprise development; and science, technology, engineering and mathematics (STEM) education.
In 2024, we spent $165 million on social investment, of which $87 million (53%) was required by government regulations or contractual agreements. We spent the remaining $78 million (47%) on voluntary social investment.
| | | | | |
| |
| See shell.com for more information about our social investment. |
| |
Human rights
Human rights are fundamental to Shell's core values of honesty, integrity and respect for people. Respect for human rights is embedded in the Shell General Business Principles and our Code of Conduct. Shell is committed to respecting human rights, as set out in the United Nations Universal Declaration of Human Rights and the International Labour Organization's Declaration on Fundamental Principles and Rights at Work. Our approach is informed by the UN Guiding Principles on Business and Human Rights. We work closely with various organisations to improve how we apply these UN guiding principles.
In 2024, we continued to work on salient human rights issues (salient human rights are those that are most at risk from our operations). We prioritise four focus areas where respect for human rights is critical to how we operate: at the workplace including labour rights, in supply chains, communities and security. For each of these areas, we have systems to identify potential impacts and to avoid and mitigate them. Shell employees working in these focus areas need to complete mandatory human rights training. In addition, we encourage all employees to complete the course regardless of their role, to build greater understanding of human rights across Shell.
Human rights focus areas
| | | | | |
| |
| See "Safety" on pages 137-139. See shell.com for more information about our approach to human rights. |
| |
Strategic Report | Performance in the year
Safety, along with our core values, underpins our strategy.
We aim to do no harm to people and to have no leaks across
our operations. We call this our Goal Zero ambition.
The nature of our operations exposes us to a wide range of safety risks. We plan and execute our work with the aim of preventing harm to people or leaks to the environment and to be prepared to respond if something goes wrong.
We seek to improve safety by focusing on the three areas where the safety risks associated with our activities are highest: personal safety, process safety and transport safety. We strive to reduce risks and to minimise the potential impact of any incident. We place a particular emphasis on the risks that could lead to the most serious consequences if they materialised.
We continue our multi-year process of refreshing our approach to safety for all employees and contractors. This approach is rooted in a consistent focus on human performance. We ask people at Shell to apply a learner mindset, by which we mean the belief that we can always improve, enhance individual capabilities, learn from mistakes and successes, and speak up freely without repercussions.
In practice, our refreshed approach to safety is about enhancing how we prepare for and conduct high-risk activities by:
○improving our preparation and execution of frontline work, building an environment of trust and learning;
○moving to industry-wide tools so that Shell and contractors work on the same basis to manage risks; and
○using technology to reduce exposure and identify conditions that could lead to serious incidents.
It is also about capturing more insights by:
○focusing on serious injuries, illness and fatalities (SIF) and the lessons we can derive from high-potential incidents where the most serious consequences that could have led to SIF did not materialise;
○focusing on learning from losses or potential losses of containment, and on any degradation of barriers designed to prevent or minimise the consequences of leaks;
○capturing underlying causes through incident investigations; and
○embedding lessons learned in our training and instructions for future work.
Our approach is governed by our Safety, Environment and Asset Management (SEAM) Standards, which set out our detailed requirements for personal, process and transport safety.
| | | | | |
| |
| See "Our approach to sustainability" on page 145. |
| |
Assurance activities play a key role for Shell in providing real-time feedback about our assets, businesses and functions regarding the health of critical human and technical safeguards that help prevent a safety incident. Our assurance activities aim to verify the design and functioning of controls, validate the overall efficiency of risk management, and highlight areas for improvement.
We report data in this section on a 100% basis for companies and joint ventures in which Shell is the operator, unless stated otherwise.
Technology and safety
We are using digitalisation and artificial intelligence to gather and process data from our equipment and improve analysis and reporting. This enables remote support and allows us to take action quickly in unsafe situations.
For example, we have installed T-Pulse, an AI-automated safety monitoring solution developed by Detect Technologies, at 26 sites.
T-Pulse uses CCTV to identify and report real-time safety issues and unsafe behaviours. Since we began using T-Pulse in 2020, it has generated alerts for more than 20,000 potential safety issues. In more than 1,300 of those cases, interventions helped prevent significant harm to people or leaks into the environment.
We are installing active fatigue and distraction detection (AFDD) devices in vehicles operated by Shell employees or our contractors in countries where road transport risks are highest. These devices help us intervene earlier to prevent accidents by detecting the conditions that can lead to them.
Personal safety
We continue to strengthen the safety culture and leadership among our employees and contractors. This aligns with our focus on caring for people.
Our SEAM Standards establish requirements for occupational health and safety hazards that have the potential to result in harm to people. When our employees and contractors perform tasks, we expect them to consider the hazards that could potentially cause harm and the effectiveness of the barriers in place to prevent incidents and manage the consequences should an event occur. We establish and maintain competence management systems to help ensure people are competent to perform their roles and responsibilities.
We run safety awareness programmes and hold an annual global Safety Day to give employees and contractors time to discuss safety culture on the frontline, reflect on how to prevent incidents, and how to improve performance. In 2024, the focus was on "Before I start work", which means pausing to reflect on what needs to be in place before we start work, for that work to be done safely.
Strategic Report | Performance in the year | Safety continued
Process safety
Process safety management is about keeping hazardous substances inside pipes, tanks and vessels, and ensuring that well fluids are contained during construction, interventions (such as maintenance) and incidents. Our SEAM Standards establish requirements from project design and construction throughout the life cycle of the asset to keep sites, employees, contractors and communities safe.
Our SEAM Standards set the steps we take to manage process safety risks, from identifying potential safety hazards to designing the controls that prevent them from occurring. Our standards require the use of barriers that operate independently of each other to reduce the likelihood of a release becoming catastrophic. Such barriers are designed so that if one fails, this does not lead to the failure of others.
We are focusing on standardising our risk assessment tools, improving human performance, working to mitigate process safety risks and moving from lagging indicators (measuring past outcomes) to leading indicators (predicting future performance). With the implementation of the SEAM Standards, our assurance methodologies for process safety have been updated to provide more insight on the health of barriers designed to reduce the likelihood of leaks and mitigate any potential consequences should a leak occur.
We continue to learn from investigations into industry incidents and embed this knowledge into our process safety standards and training programmes.
Preparing for emergencies
We prepare and practise our emergency response to incidents, such as a spill or a fire. This involves working closely with local emergency services and regulatory agencies to jointly test our plans and procedures. Shell requires key operating facilities to test their emergency response preparedness as per regulatory requirements and aligned to industry best practices. In 2024, we held large-scale emergency response exercises at Shell Energy and Chemicals Park Rotterdam in the Netherlands and in Perth, Australia for offshore exploration to support our Prelude floating LNG facility.
We manage three regional Emergency Response Leadership Councils for the Americas; Asia-Pacific; and Europe, the Middle East and Africa. The councils bring together experts from different teams that need to be able to work together seamlessly in case of emergencies. In 2024, the councils' annual regional conferences covered a variety of topics such as lessons learned, dynamic risk assessments, new response technology, non-fluorinated firefighting foam tactics and response preparedness.
Transport safety
Transporting large numbers of people, products and equipment poses safety risks. We seek to reduce these risks by developing best-practice standards within Shell. We also work with specialist contractors, industry bodies, non-governmental organisations and governments to find ways of reducing transport safety risks.
Road safety
In 2024, we continued to focus on strengthening our controls and implementing technologies that help us to better detect the conditions which can lead to incidents. Our SEAM Standards require Shell employees and contractors who are identified as driving on work-related business to receive defensive driver training.
In 2024, Shell employees and contractors drove around 424 million kilometres on company business, equivalent to around 10,580 times around the world. Commercial road transport accounts for most of the kilometres driven. There were 17 severe motor vehicle incidents (SMVIs). An SMVI is defined as a motor vehicle incident resulting in a fatality, serious injury or a rollover of a vehicle. There were no road transport-related fatalities in 2024.
Maritime safety
At the end of 2024, we managed and operated a global fleet of 22 tankers, liquefied natural gas carriers and the world's first liquefied hydrogen carrier. We are one of the world's largest charterers of oil and gas vessels. We work with our global maritime partners through our Maritime Partners in Safety Programme to improve the safety performance of the shipping industry.
Air safety
In 2024, for Shell-operated ventures, our owned and contracted aircraft flew around 37,000 hours and carried around 292,000 Shell and contractor passengers to destinations across the world. In addition, remotely piloted aircraft completed flights on surveys, inspections, emissions surveillance, and security and incident response.
| | | | | |
| |
| See shell.com for more information on transport safety. |
| |
Working with others
We work with contractors and suppliers to help them understand our safety requirements. We strive to improve the energy industry's safety performance by sharing safety standards and experience with other operators, joint-venture partners, contractors and professional organisations.
Executives from Shell and our major contractor companies have collaborated on Shell's contractor safety leadership programme since 2014. The programme seeks to identify strategies and practical ways to improve a shared safety culture and achieve our Goal Zero ambition of no harm and no leaks.
Photo: A safety briefing for a maintenance and operations crew at the 731.5 megawatt Borssele III and IV offshore wind farm, the Netherlands, which is owned and operated by the Blauwwind joint venture (Shell interest 20%).
Strategic Report | Performance in the year | Safety continued
Safety performance
Tragically, two of our contractor colleagues in Shell-operated ventures lost their lives in incidents which happened in 2024 while working for us. One contractor colleague in the Netherlands lost his life in an accident at Shell Energy and Chemicals Park Moerdijk in June 2024. Another contractor colleague in India was bitten by a snake in May 2024 and subsequently passed away in January 2025.
We sadly note that a contractor who sustained burn injuries in a flash fire at our EcoOils facility in Malaysia in February 2025 passed away later that month. The investigation into the incident remained under way at the time of publishing this report.
The death in February 2024 of a contractor colleague in Nigeria, who was injured in a fire incident in December 2023, was reported in our 2023 Annual Report.
Shell is profoundly impacted by these losses. We are resolutely committed to learn from these incidents and we aim to take all necessary measures to prevent anything similar from happening again. We continue to work closely with our contractors to help build a strong safety culture at the frontline.
We use serious injury, illness and fatality (SIF) and serious injury, illness and fatality frequency (SIF-F) to measure our safety performance. SIF is defined as a serious work-related injury or illness that resulted in a fatality or a permanent impairment, which is defined as a long-term or permanent injury or illness with a significant impact on daily activities. SIF-F is calculated by dividing the number of employee and contractor SIF by 100 million working hours. SIF-F enables us to focus our investigations on the most serious incidents. The aim is to collect and analyse relevant, high-quality data that can help us improve our efforts to prevent serious injuries and fatalities.
In 2024, the number of serious work-related injuries or illnesses, including those that resulted in fatality or permanent impairment, decreased to 7 from 12 in 2023. The SIF-F was 1.5 cases per 100 million working hours compared with 2.6 in 2023.
For reporting on process safety, we combine Tier 1 and 2 events. A Tier 1 process safety event is an unplanned or uncontrolled release of any material from a process, including non-toxic and non-flammable materials, with the greatest actual consequence resulting in harm to employees, contract staff or a neighbouring community, damage to equipment, or exceeding a defined threshold quantity. A Tier 2 process safety event is a release of lesser consequence.
The number of Tier 1 and 2 operational process safety events in 2024 increased compared with 2023. There were 90 events reported during the year compared with 63 in 2023. The increase in process safety tiered events was driven by our Downstream, Renewables and Energy Solutions business. We are actively addressing these challenges by refining our operational strategies, renewing our focus on fundamentals and leveraging new technologies to return to the downward trend of previous years.
A well control incident is defined as a well set-up with fewer than two barriers in place to protect it against a release through any potential path. In 2024, there were no Level 1 or Level 2 well control incidents in Shell-operated ventures. There were also no events in 2023.
As part of our learner mindset approach, we investigate serious incidents so we can understand the underlying causes, including technical, behavioural, organisational and human factors. We share what we learn, including with contractors. We implement mitigations at the site and in the country and business where the incident occurred. We seek to turn incident findings into improved standards or better ways of working that can be applied widely across similar facilities.
Security
Our operations expose us to criminality, civil unrest, activism, terrorism, cyber disruption and acts of war that could have a material adverse effect on our business. Our security risk mitigations follow the principles of "deter, detect, delay and respond". We strengthen the security of our assets, people and operations to reduce our exposure as appropriate, for example, by conducting site security risk assessments, using journey management plans and performing travel risk assessments. We also invest in information risk management capabilities and crisis management and business continuity measures.
Shell is a member of the Voluntary Principles on Security and Human Rights (VPSHR), a multi-stakeholder initiative that gives guidance on how to respect human rights while providing security for business operations. We implement this guidance within our own operations, concentrating on countries where the risks of working with government and private security providers are identified as greatest.
Strategic Report | Performance in the year
Our core values of honesty, integrity and respect for people, as well as our focus on safety and sustainability are critical to our strategy. We are committed to doing business in an ethical and transparent way.
Ethics and transparency
Our core values underpin our work with employees, customers, investors, contractors, suppliers, non-governmental organisations, the communities where we operate and others. The Shell General Business Principles (SGBP), Code of Conduct, and Ethics and Compliance Manual are designed to help everyone at Shell to act in line with our values. The Chief Ethics and Compliance Officer (CECO) reports to the Shell Legal Director. The CECO is the custodian of Shell's Code of Conduct, and oversees ethics and compliance activities.
Shell General Business Principles
The SGBP set out our responsibilities to shareholders, customers, employees, business partners and society. They set the standards for how we conduct business with integrity, care and respect for people. As part of these principles, we commit to contribute to sustainable development. All Shell employees and contractors, and those working at joint ventures we operate, are expected to behave in line with these principles. We undertake a range of activities to help embed the SGBP and the Code of Conduct throughout the organisation. This includes training and encouraging people to discuss the dilemmas they face in their work.
Code of Conduct
Our Code of Conduct explains how employees, contractors and anyone else acting on Shell's behalf must behave to live up to our business principles. It addresses key topics including safety, anti-bribery and corruption, fair competition and human rights.
Shell employees, contractors and third parties with whom Shell has a business relationship can report any potential breaches of the Code of Conduct confidentially through several channels, including anonymously through a global helpline operated by an independent provider. We maintain a stringent no retaliation policy to protect any person making an allegation in good faith. This protection extends to those who participate in or conduct an investigation. We investigate allegations of potential violations of the Code of Conduct or applicable laws promptly and independently of the management line concerned.
In 2024, there were 2,025 reports to the Shell Global Helpline. We confirmed 343 breaches of the Code of Conduct, 367 employees
or contractors were subject to disciplinary action, and of those 110 people were dismissed. Confirmed breaches include cases in which
an allegation received in 2024 or a prior year was substantiated
and closed.
Ethics and compliance
Shell's Ethics and Compliance Manual defines the detailed requirements for our businesses and functions to comply with laws on anti-bribery and corruption, anti-money laundering, preventing the facilitation of tax evasion, antitrust, data privacy and trade compliance.
Our employees receive guidance on the requirements listed in our Ethics and Compliance Manual -- including via a dedicated website, and training modules where completion is monitored -- which is reinforced by messages from Shell leaders on these requirements. This manual also includes the Protect Shell Policy, which explains Shell's position on managing antitrust risks in engagements with parties external to Shell. In response to fast-moving external antitrust developments and trends, internal guidance is continually being monitored to ensure that it remains relevant.
The type and depth of training is dependent on the level of risk. Training is repeated every three years, or more frequently for positions where the risk exposure is higher. Those considered to be higher risk for exposure to bribery include, but are not limited to, persons involved in procurement and contracting, new business development and engaging with government officials. Shell Internal Audit and Investigations (SIAI) conducts risk-based audits of potential ethics and compliance issues across its operations in support of our Group-wide ethics and compliance programme.
To help manage antitrust, competition, anti-bribery, tax evasion, anti-money laundering and trade compliance risks with adequate resources we maintain risk-based compliance programmes, a comprehensive governance structure, established reporting lines and policies and procedures, including mandatory due diligence, counterparty-screening and regular risk assessments.
Compliance in our Trading and Supply business
We maintain a Trading Compliance function managed by a Chief Compliance Officer, as regulated by the UK Financial Conduct Authority, the US Commodities Futures Trading Commission and the Securities Commission of The Bahamas, with adequate resources, including employees and a budget; a comprehensive governance structure, controls, policies and procedures and established reporting lines. Employees in Shell's trading organisation receive clear guidance through the Code of Conduct; the organisation's Trading and Supply Compliance Manual, supplemented with specific policies; a specific compliance website; mandatory training modules where completion is monitored; and other relevant training.
Strategic Report | Performance in the year | Living by our values continued
Shell leaders reinforce the importance of managing compliance and conduct risk in the trading organisation through monitoring risk metrics, reporting to compliance risk management and governance committees, setting clear expectations via townhall meetings and other channels, and enforcing consequences for non-compliance.
Shell's Trading Compliance function has systems for trade surveillance and monitoring communication, in addition to a dedicated conduct and ethics investigation function to assess breaches of non-compliance and thematic trends.
Data protection
With regard to the protection of personal data, we continue to invest in and develop a mature and robust privacy compliance programme based on our Binding Corporate Rules (BCRs). Every Shell company is required to manage personal data in a professional, ethical and lawful manner. We have a robust "privacy by design" process, which includes the monitoring of data privacy regulations, to help ensure that necessary controls are built into our IT systems and solutions to protect personal data.
Shell's Chief Privacy Officer serves as the Data Protection Officer (DPO) under the EU's General Data Protection Regulation (GDPR) and other applicable data privacy laws, except where there is a requirement to have a locally based DPO, such as in China and the Philippines.
We monitor new data privacy legislation and seek to ensure we have a robust impact assessment process in place for the relevant businesses. We design our operations and processes based on relevant data privacy requirements and we build controls into our processes and practices which cover the handling of personal data.
We maintain a Group-wide incident management process designed to identify and remediate data privacy breaches. The process also helps us to comply with country-level requirements for reporting breaches. Some of our acquired companies are not yet in full compliance with our BCRs. Following assessments for each of those companies, specific actions are planned and put in place to achieve compliance, with regular updates made on their progress to management.
Reputation and brand
We continually assess and monitor the external environment for potential risks to our reputation. We engage in dialogue with our key stakeholders, such as investors, industry and trade groups, academics, governments and non-governmental organisations to gain greater insights into societal expectations of the Shell Group. We make efforts to explain to our stakeholders what the Company is doing and why, the validity of our energy transition targets and our progress towards meeting them. We take proactive steps when appropriate through legal means to protect our reputation from unwarranted accusations.
Strategic Report | Performance in the year
| | |
|
Our approach to sustainability |
|
Our commitment to contribute to sustainable development has been part of the Shell General Business Principles since 1997. We have embedded this sustainability commitment into our strategy, business processes and decision-making, supported by comprehensive governance structures, policies and standards.
Our approach to sustainability takes into account the impacts, risks and opportunities related to climate, nature, safety, ethics, people and communities -- from the global to the local level. For 2024 progress in each of these areas, refer to the Our journey to net zero, Respecting nature, Powering lives, Safety, and Living by our values sections.
In anticipation of the transposition by the Netherlands of the EU Corporate Sustainability Reporting Directive (CSRD) into national law, a key development for Shell in 2024 has been the voluntary implementation of the CSRD and the accompanying European Sustainability Reporting Standards (ESRS). The CSRD requires certain European and non-European companies (including Shell plc due to its listing on Euronext Amsterdam) to make disclosures on environmental, social and governance topics in accordance with reporting standards set out in the ESRS.
Photo: Shell's Board of Directors visited Raízen facilities in Brazil in April 2024.
Governance
Board oversight of sustainability including
climate-related impacts, risks and opportunities Our governance framework is designed to effectively deliver our strategy, which is to deliver more value with less emissions, while powering lives and respecting nature.
| | | | | |
| |
| See "Our strategy" on pages 19-22. |
| |
We describe Shell's overall governance framework on pages 149-154 and provide information on the roles of the Board of Directors, Board Committees and the Executive Committee (EC).
| | | | | |
| |
| See "Sustainability including climate governance" on page 144. |
| |
The Board has primary oversight of the delivery of Shell's strategy and monitors performance against our longer-term business targets. This includes the management of sustainability-related impacts, risks and opportunities.
The Board periodically reviews our energy transition plans and oversees their implementation and delivery. In March 2024, Shell published the updated Energy Transition Strategy 2024, as endorsed by the Board, which included our four climate targets and ambition. The progress on these longer-term climate-related targets and ambition can be found in "Climate-related metrics and targets" on pages 110-121.
In 2024, the Board considered sustainability-related matters throughout the year, such as the assessment of sustainability-related risks and the effectiveness of corresponding risk management activities. The Board also challenged and endorsed business plans, with consideration of major capital expenditures, acquisitions and divestments. In 2024, the Board convened nine times and continued to oversee our strategy and sustainability initiatives, including at the Board off-site days in June 2024.
The nature of topics discussed by the Board in 2024 can be found in "Board activities" on pages 156-156. A full description of sustainability-related principal risks can be found in the "Risk factors" on pages 25-34.
Strategic Report | Performance in the year | Our approach to sustainability continued
Board committees
The Board is supported by four standing committees: the Sustainability Committee (SUSCO), the Remuneration Committee (REMCO), the Audit and Risk Committee (ARC), and the Nomination and Succession Committee (NOMCO). Sustainability-related matters are considered by the Board or the relevant committee, as appropriate. Committees, comprising Non-executive Directors, provide regular updates to the Board, including from committee meetings and stakeholder engagements.
The SUSCO reviews the performance of Shell with respect to sustainability and the non-financial elements of Shell's strategy, with a focus on nature and social elements. The SUSCO also reviews selected sustainability topics and matters of public concern. The SUSCO met four times in 2024 with sustainability-related matters discussed at each meeting. Details on focus areas and meetings in 2024 can be found in the SUSCO report on page 167.
The REMCO develops the remuneration policy and schemes for Executive Directors, EC members and the majority of Shell's employees, and sets performance conditions designed to challenge and support the EC in meeting our strategy of more value with less emissions, while respecting nature and powering lives. The REMCO met five times during 2024, with sustainability-related matters relevant to remuneration being regularly addressed. Details of the REMCO's focus areas and meetings in 2024 can be found in the Directors' Remuneration Report on pages 180-182.
The NOMCO leads the process for appointments to the Board and Senior Management and oversees the development of a diverse succession line of candidates. The NOMCO also reviews the Company's policy, targets and strategy on diversity, equity and inclusion (DE&I), and monitors the effectiveness of these initiatives. The NOMCO met four times, with sustainability-related matters regularly addressed. Details on the NOMCO's focus areas and meetings in 2024 can be found in the NOMCO report on pages 163-166.
The ARC assists the Board in fulfilling its oversight responsibilities in areas such as the effectiveness of our risk management and internal controls. The ARC also provides oversight in respect of material non-financial reporting disclosures with respect to corporate sustainability as applicable to the Company's annual reports, half-yearly reports and quarterly results releases. Significant issues identified by the business or functional owners are escalated to and reviewed by the ARC as required. The ARC met six times in 2024, with sustainability-related matters regularly addressed. Details on the ARC's focus areas and meetings in 2024 can be found in the ARC report on pages 168-179.
Performance and remuneration
Our remuneration schemes, including the annual bonus and long-term incentive awards, are designed to support Shell in achieving our strategy. Almost all employees participate in the annual bonus scheme. Executive Directors, senior executives and certain key employees participate in the long-term incentive awards, which aim to retain and ensure recipients have a greater investment in Shell's future.
In respect of 2024 outcomes, Shell's safety and energy transition-related performance metrics each form 15% of the annual bonus scorecard. A metric for "Shell's journey in the energy transition" forms 20% of the long-term incentive awards for Executive Directors and senior executives and 10% for all other employees.
The remuneration schemes are all linked to sustainability elements, including climate and safety. The Directors' Remuneration Report provides further details on key sustainability-related performance indicators.
Supporting governance committees
There are three key supporting management committees, with representatives from across Shell, which play a critical role in driving sustainability-related elements of our strategy. These committees each have direct lines of reporting to the Board and its committees.
○The Capital Investment Committee (CIC) facilitates portfolio management and capital allocation decisions, and reviews each investment opportunity that is, due to its size or risk profile, subject to approval by the CEO or the Board. These reviews ensure that
risk-reward trade-offs and other defined criteria (including carbon emissions impacts) are embedded in investment decision-making. The CIC is sponsored by the CEO and is accountable to the Board. This committee is made up of senior executives, including the CEO, CFO and individual business directors.
○The Carbon Reporting Committee (CRC) is sponsored by the CFO and includes senior management representatives focusing on climate-related matters from across the businesses, Projects & Technology climate-related disciplines, and functions including Finance, Legal and Strategy. The CRC is responsible at the Group level for the Carbon Reporting Control Framework, the calculation methodologies and reporting of GHG emissions metrics, and the review and approval of external GHG-related disclosures to ensure compliance.
○The Sustainability Management Committee (SMC), established in October 2024, is sponsored by the CFO and includes senior management representatives with exposure to material sustainability areas from the businesses and functions, including Supply Chain, Finance, Legal and Human Resources. The SMC aims to provide an integrated approach to sustainability by addressing cross-directorate risks and dilemmas, and driving the co-ordination, simplification and performance improvement of nature and social sustainability topics, focusing on regulatory compliance and value protection and creation. The SMC will also maintain a forward view on emerging themes to ensure Shell's future competitiveness and resilience through the energy transition.
In addition to these committees, our network of country chairs supports the overall governance, development and deployment of sustainability-related initiatives. They facilitate the setting of each country's plans and their engagement with external stakeholders in support of our strategy.
Business assurance
Each EC member must submit an annual assurance letter to the CEO that their business or function's activities have been conducted in accordance with the requirements set out in our Commitment and Policy on Health, Safety, Security, Environment & Social Performance (HSSE & SP) and our Safety, Environment and Asset Management (SEAM) Standards. This assurance includes an assessment of the effectiveness of our internal controls in managing sustainability-related risks.
Independent assurance
Shell Internal Audit and Investigations (SIAI) provides independent assurance of sustainability-related risks as part of its broader mandate and advises management and the Board on the effectiveness of internal controls. For further information, see "Internal Audit" on page 176.
Strategic Report | Performance in the year | Our approach to sustainability continued
Management's role in assessing and managing sustainability including climate-related impacts,
risks and opportunities
Sustainability including climate governance
[A]See pages 154-155 for details of changes to the Executive Committee.
Strategic Report | Performance in the year | Our approach to sustainability continued
Processes by which management is informed about sustainability including climate-related issues
We have several processes to help ensure that management teams can effectively monitor and manage sustainability matters. Our response to the evolving risk outlook requires transparency and clarity around our plans and actions to achieve our sustainability targets.
We have established a number of policies, standards, frameworks, internal forums and capability development programmes related to sustainability, climate change and the energy transition. These are employed at all levels of the organisation and seek to monitor, manage and review sustainability issues.
Each business and function regularly reviews its risk profile, risk responses and assurance activities throughout the year to ensure sustainability-related risks are effectively addressed and managed. These reviews and insights are also used to provide management with regular updates on the operational management of sustainability and to help us to update our plans and guide our day-to-day operational decisions and our risk response plans.
Policies and standards
Our commitment to contribute to sustainable development has been part of the Shell General Business Principles (SGBP) since 1997. These principles are supported by our Code of Conduct, which describe the behaviours expected of our employees with regard to sustainability-related matters including health, safety, security, environment and social performance (HSSE & SP), human rights and equal opportunities.
The Shell Performance Framework (SPF) is the overarching framework adopted by Shell to deliver on its strategy and business objectives. It applies to all Shell companies and provides a consistent approach for how each company in Shell operates. This framework includes our risk management and internal control procedures to support adherence to the SGBP and Code of Conduct.
| | | | | |
| |
| See "Living by our values" on pages 140-148 and "Shell Performance Framework" on page 159. |
| |
| | |
Shell's policies and standards aligned with the Shell Performance Framework (SPF) |
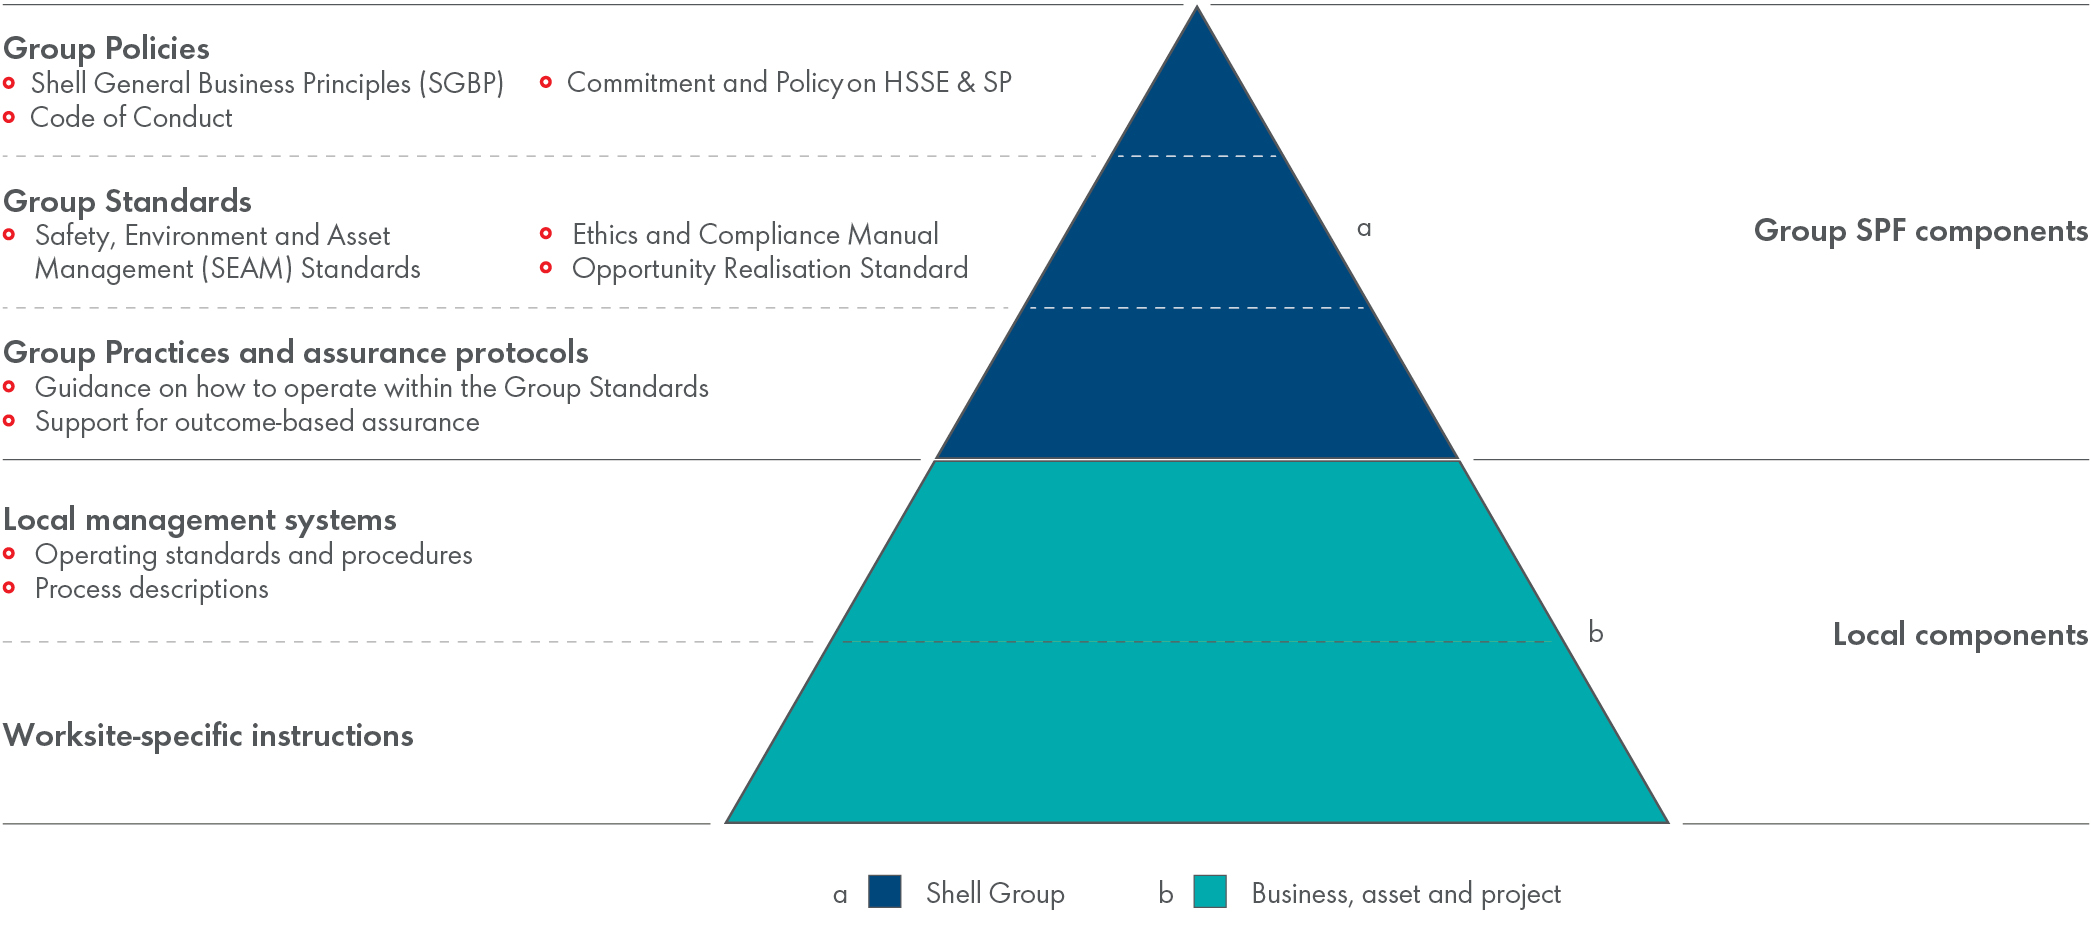
Commitment and Policy on HSSE & SP
The Shell Commitment and Policy on HSSE & SP is a set of core principles intended to ensure the health and safety of our workforce, minimise environmental impact, respect our neighbours and contribute to sustainable development.
SEAM Standards
We have implemented the Commitment and Policy on HSSE & SP into a set of five standards under the SPF collectively referred to as the Safety, Environment and Asset Management (SEAM) Standards. The SEAM Standards require the businesses, projects and assets we operate to identify and manage impacts, risks and opportunities so their activities can be carried out in a safe, environmentally responsible and consistent way.
We seek to avoid HSSE impacts and risks where we are able to. We follow requirements set out in our SEAM Standards to develop suitable governance structures and mitigation strategies aimed at ensuring that if an HSSE risk materialises, we avoid the worst possible consequences and have ways to remediate any environmental damage. For example, requirements in the SEAM Standards describe the key controls to be implemented to ensure safe production and equipment care, and the type of skills and training that are required for relevant staff.
Each project, asset or business is accountable to assess which mandatory requirements are relevant based on their objectives, risk profile and activities, and apply these via their local management system. The requirements are designed to be outcome-based -- meaning they define the desired results and allow the business to determine a fit-for-purpose process to achieve them. They are supported by practice documents, which share best practices for implementation, as well as assurance protocols to assist in testing the health of controls.
Strategic Report | Performance in the year | Our approach to sustainability continued
The requirements align with industry standards where practicable. Where applicable, we follow the most stringent of either our SEAM Standards or local regulations. In some cases, where no local regulation exists, our standards set mandatory requirements based on internationally accepted standards or practices.
Requests for exceptions from the SEAM Standards must be reviewed and advised on by subject matter experts and authorised by a senior
executive for the relevant business, asset or function. Permanent exceptions are reviewed on an annual basis and are subject to conditions.
The SEAM Standards came into effect in July 2024, replacing the former HSSE & SP Control Framework and Asset Management System (AMS). The five SEAM Standards are described below.
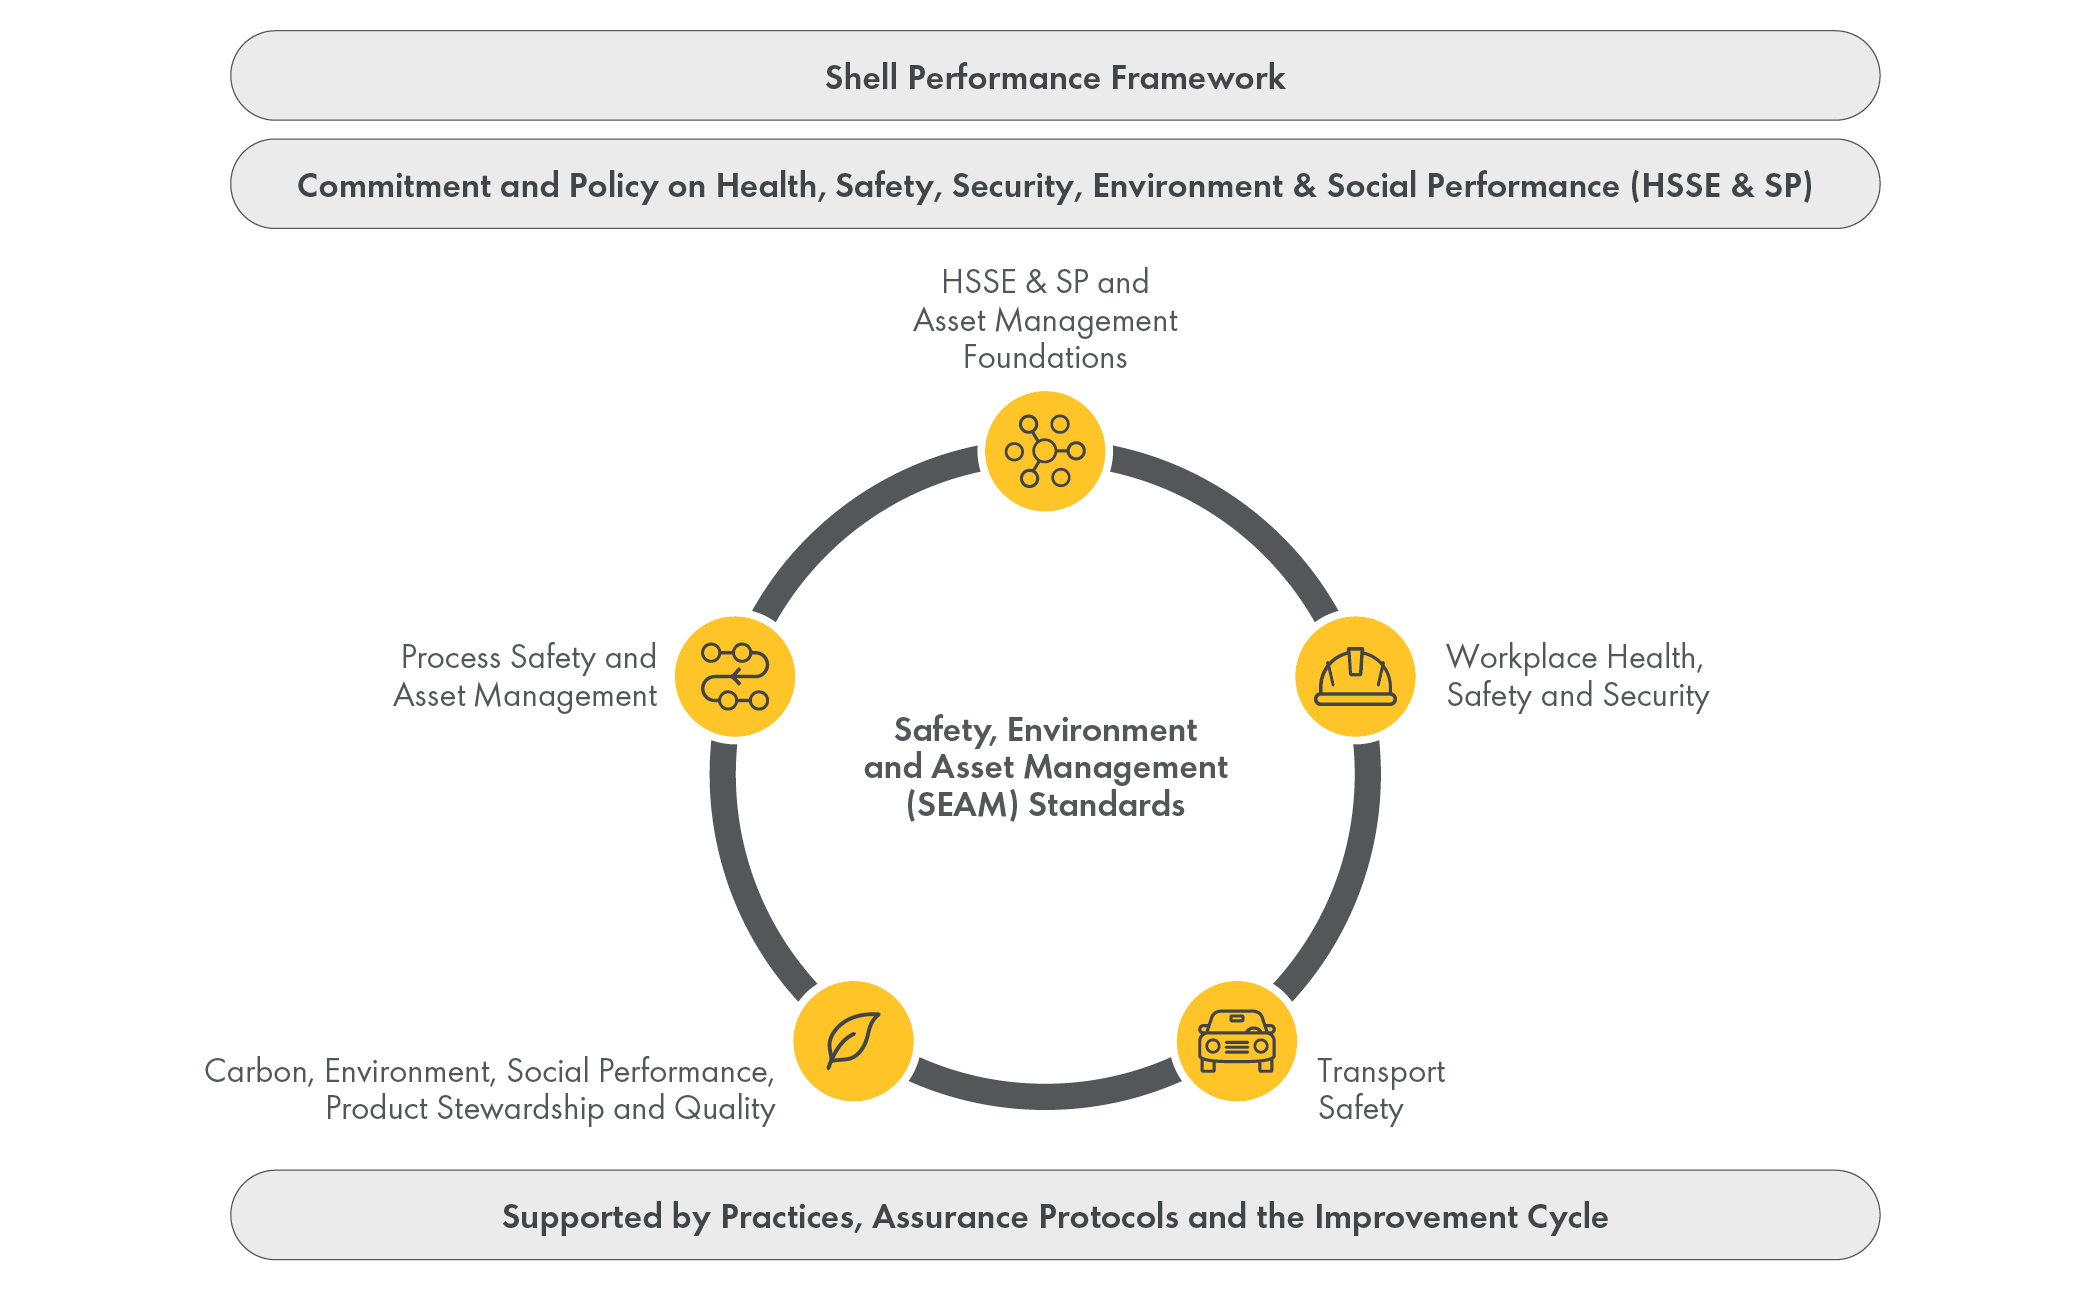
HSSE & SP and Asset Management Foundations
This standard includes requirements intended to manage the common elements of our processes and management systems. This includes our assurance processes, HSSE & SP risk management practices, impact assessments, contractor HSSE management, performance monitoring and reporting, and learning and improvement, among others.
Carbon, Environment, Social Performance, Product Stewardship and Quality
This standard includes managing our decarbonisation targets, protecting biodiversity, preserving water quality, improving air quality and increasing circularity. It also covers the mitigation of social impacts arising from our business activities and management of any adverse effects of the products we make, buy, sell or handle.
| | | | | |
| |
| See "Our journey to net zero" on page 97, "Respecting nature" on page 124 and "Powering lives" on page 129. |
| |
Workplace Health, Safety, and Security
This standard is about protecting workers involved in our activities from potential health and safety hazards that may cause harm to them or others. It includes worker welfare and labour rights, and contains requirements intended to protect our people and assets from adversarial activities.
Process Safety and Asset Management
This standard is about keeping hazardous substances contained in wells, pipes, tanks and vessels. In the SEAM Standards, we have integrated Asset Management work processes with Asset Integrity-Process Safety Management, which streamlines requirements and recognises the alignment of operating safely and optimising production in our assets.
Transport Safety
This standard is about reducing the safety risks posed during transport of people, products and materials by road, rail, sea or air.
| | | | | |
| |
| See "Safety" on pages 137-139. |
| |
Strategic Report | Performance in the year | Our approach to sustainability continued
| | | | | | | | |
| | |
| Sustainability impact, risk and opportunity management We use two key processes for assessing and managing sustainability including climate-related impacts, risks and opportunities — Impact Assessments and the Hazards and Effects Management Process (HEMP). These are covered in the HSSE & SP and Asset Management Foundations Standard in alignment with our broader risk management practice in the SPF. For more information on our risk management processes, see "Risk management" on page 34. When planning projects, we conduct impact assessments, which help us to identify and assess a project's potential impact on the environment, people and communities. Once identified, we apply a mitigation hierarchy, which is a sequence of actions to manage potential impacts and risks. For example, in a biodiversity context we seek to avoid, minimise, restore and offset. HEMP is applied to identify, assess and manage HSSE & SP risks in our projects and operations. This systemic approach starts with the identification of potential hazards (such as working at heights) and evaluation of their likelihood and potential impact. We then implement controls (such as fall protection) to reduce the risks to as low as reasonably practicable (ALARP). In doing this, we apply the hierarchy of controls, which prioritises the elimination, substitution and isolation of hazards, before implementing engineered safeguards, administrative controls and personal protective equipment. We monitor the effectiveness of these controls via regular assurance activities. | |
| | |
| | | | | | | | |
| | |
| Non-operated ventures More than half of Shell's joint ventures are not operated by Shell. As per our SGBP, Commitment and Policy on HSSE & SP and our joint venture requirements in the HSSE & SP and Asset Management Foundations Standard, we request non-operated ventures (NOVs) to apply policies and principles materially equivalent to our own and, in relation to particular (higher impact) risks implement materially equivalent standards or standards acceptable to us. We do not have direct control over how these ventures embed sustainability in their operations, but we do seek to influence and offer support. We periodically evaluate the sustainability including climate-related impacts, risks and opportunities within our NOVs, and if an NOV does not meet our expectations, we seek to influence them to implement performance improvement plans. | |
| | |
Sustainability including climate through the life cycle
Our principles, policies and standards regarding sustainability, including climate, extend across the entire lifespan of a project or the facility -- from initial design and construction or acquisition to operation over many years and, finally, divestment or decommissioning.
Acquisitions and divestments
Shell considers new business investment opportunities and divesting from existing opportunities in all relevant contexts including regulations, sustainability and alignment with our strategy. Sustainability considerations, including emissions, are considered during the due diligence process and in negotiations for material acquisitions and divestments. Comprehensive stakeholder engagement plans are developed, as appropriate, in parallel to the negotiations.
We take care to invest and divest responsibly and screen our transactions against multiple criteria. Before acquiring or divesting a business, we assess the counterparty's financial strength; operating culture; policies governing HSSE & SP; ethics and compliance; and, where relevant, the effectiveness of its social performance programmes.
Within each divestment proposal, we consider if the potential purchaser has the capability to manage the assets and surrounding environment. When we divest assets or exit areas, we apply well-established processes to guide our risk assessment and the transition of sustainability-related responsibilities and commitments, including those relating to health, safety, security and environment. Where applicable, we also share our emissions reduction plans with the purchaser in relation to compliance with regulations and commitments, for the purchaser's consideration.
Decommissioning and restoration
Decommissioning is part of the normal life cycle of every asset or operation. We aim to abandon wells and decommission installations in a safe, efficient, cost effective and environmentally responsible manner while meeting regulatory requirements. This includes restoring the surroundings of these installations in line with relevant legislation, while taking our own environmental standards into account. We seek to reuse, repurpose and recycle materials in decommissioning. Current and non-current decommissioning liabilities and other provisions are accounted for on our balance sheet.
| | | | | |
| |
| See Note 25 to the "Consolidated Financial Statements" on page 281. |
| |
Working with others
Shell understands the need to work with others to achieve our commercial, environmental and social goals. We engage with local communities and other stakeholders in all our activities. We listen to their ideas and the concerns they might have so these can be addressed in the design and operation of our assets.
Shell participates in external collaborations, industry associations and partnerships. We do this in compliance with antitrust rules and regulations. These engagements are a proven way to learn and share best practices, achieve specific objectives and build trust with the many different stakeholders who have an interest in Shell. Our key sustainability, including climate, partnerships include the International Union for the Conservation of Nature (IUCN), Ipieca (the global oil and gas industry association for advancing environmental and social performance across the energy transition), the Energy Transitions Commission (ETC), Business for Social Responsibility (BSR) and World Business Council for Sustainable Development (WBCSD). These organisations, and many others, help inform our thinking on sustainability including climate-related risks, opportunities and good practices.
Strategic Report | Performance in the year | Our approach to sustainability continued
Non-Financial and Sustainability Information Statement
The table below constitutes Shell's Non-Financial and Sustainability Information Statement, produced to comply with sections 414CA and 414CB of the Companies Act 2006 (as amended by The Companies (Strategic Report) (Climate-related Financial Disclosure) Regulations 2022).
| | |
Non-Financial and Sustainability Information Statement |
| | | | | | | | |
| Reporting requirement | Where to read more in this Report | Page |
Business model | Our strategy | 19 |
| Non-financial KPIs | Performance indicators | 35 |
Environmental matters
| Our journey to net zero Respecting nature | 93 124 |
|
Sustainability and climate change and TCFD disclosures | Our journey to net zero | 93 |
Employees
| Powering lives Directors' Remuneration Report | 129 180 |
|
| Social matters | Powering lives | 129 |
| Respect for human rights | Powering lives | 129 |
| Anti-corruption and anti-bribery matters | Living by our values | 140 |
Risk
| Risk management and risk factors Our journey to net zero Audit and Risk Committee Report | 25 93 168 |
Task Force on Climate-related Financial Disclosures (TCFD)
Shell supports the recommendations of the TCFD. In accordance with the UK Listing Rule 6.6.6R, and set out below, we report our climate-related financial disclosures consistent with all the TCFD Recommendations and Recommended Disclosures [A]. We also consider relevant supplemental guidance including, for example, the TCFD's additional guidance "Implementing the Recommendations of the Task Force on Climate-related Financial Disclosures" (also known as the 2021 TCFD Annex) published in October 2021 by the TCFD. We continue to align and enhance our climate-related disclosures.
| | | | | | | | | | | | | | |
| TCFD Pillars | TCFD Recommendations | | | Reference |
| Governance | Describe the board's oversight of climate-related risks and opportunities | | | Board oversight of sustainability including climate-related risks and opportunities is described on page 149. |
Describe management's role in assessing and managing climate-related risks and opportunities | | | Management's role in assessing and managing sustainability including climate-related risks and opportunities is described on page 144. |
| Strategy | Describe the climate-related risks and opportunities the organisation has identified over the short, medium and long term | | | See page 97. |
Describe the impact of climate-related risks and opportunities on the organisation's business, strategy, and financial planning | | | See page 102. |
Describe the resilience of the organisation's strategy, taking into consideration different climate-related scenarios, including a 2°C or lower scenario | | | See page 103. |
| Risk Management | Describe the organisation's processes for identifying and assessing climate-related risks | | | Descriptions of the company's processes used to identify and assess risks, including climate-related risks, can be found on page 34 under the paragraphs "Risk identification" and "Risk assessment". |
Describe the organisation's processes for managing climate-related risks | | | Descriptions of the company's processes used to manage risks, including climate-related risks, are described on page 34 under the paragraphs "Risk Response" and "Management and Board risk reviews". |
Describe how processes for identifying, assessing, and managing climate-related risks are integrated into the organisation's overall risk management | | | Our climate-related risk management process follows the approach set out by the Shell Performance Framework, ensuring that it is integrated into the Company's overall risk management processes, and is described on page 34 in the section "Risk Management". |
| Metrics and Targets | Disclose the metrics used by the organisation to assess climate-related risks and opportunities in line with its strategy and risk-management process | | | See page 111. |
Disclose Scope 1, Scope 2, and, if appropriate, Scope 3 greenhouse gas (GHG) emissions, and the related risks | | | See page 111. |
Describe the targets used by the organisation to manage climate-related risks and opportunities and performance against targets | | | See page 118. |
Information that supports TCFD disclosures is indicated with . [A]By this we mean the four recommendations and the 11 recommended disclosures set out in Figure 4 of Section C of the report entitled "Recommendations of the Task Force on Climate-related Financial Disclosures" published in June 2017 by the TCFD.
The Board of Shell plc
| | | | | | | | | | | | | | | | | | | | |
| | | | | | |
Sir Andrew Mackenzie Chair
Board Committee membership:
NOMCO (Chair) British, 68. Appointed October 1, 2020; Chair from May 18, 2021. Career Prior to joining Shell, Sir Andrew was CEO of BHP from 2013 to 2019 after joining BHP in 2008. As BHP CEO, he simplified and strengthened the business, and made it the first miner to pledge to tackle emissions caused when customers use its products. From 2004 to 2007, he held various executive positions at Rio Tinto, including Head of Industrial Minerals and Diamonds. Prior to this, Sir Andrew spent 22 years with bp, during which he worked across most business streams and functions – principally in exploration and production, and petrochemicals – and held senior and executive positions, including as Chief Reservoir Engineer and Chief Technology Officer. From 2005 to 2013, Sir Andrew served as a Non-executive Director of Centrica. He has also served on many
not-for-profit boards, including public policy think tanks in the UK and Australia. Relevant skills and experience Sir Andrew has more than 30 years' experience in the mining and energy industries. In 2014, he was made a Fellow of the Royal Society, a Fellowship of many of the world's most eminent scientists. Sir Andrew has applied his deep understanding of the energy business and geopolitical outlook to create public-private partnerships and advise governments around the world. He continues to advocate for sustainable action on climate change, including access to affordable energy. His expertise is helping Shell navigate the energy transition. Sir Andrew also champions gender balance, the rights of Indigenous Peoples, and the power of large companies to make a positive contribution to society. External appointments ○Chair of UK Research and Innovation (UKRI) | | | Dick Boer Deputy Chair and Senior Independent Director
Board Committee membership:
ARC | NOMCO | REMCO Dutch, 67. Appointed May 20, 2020; Deputy Chair and Senior Independent Director from May 23, 2023. Career Dick was President and CEO of Ahold Delhaize from 2016 to 2018. Prior to the merger between Ahold and Delhaize, he served as President and CEO of Royal Ahold from 2011 to 2016. From 2006 to 2011, he was a member of the Executive Board of Ahold and served as Chief Operating Officer of Ahold Europe. Dick joined Ahold in 1998 as CEO of Ahold Czech Republic and was appointed President and CEO of Albert Heijn in 2000. In 2003, he also became President and CEO of Ahold's Dutch businesses. Before joining Ahold, Dick spent more than 17 years in various retail positions, for SHV Holdings N.V. in the Netherlands and abroad, and for Unigro N.V. Dick has chaired the Remuneration Committee of Nestlé since April 2024 Relevant skills and experience Dick has a deep understanding of brands and consumers, and extensive knowledge of the US and European markets, from his time leading one of the world's largest food retail groups. He has considerable experience at the forefront of retailing and customer service, which extended in more recent years to
e-commerce and the digital arena. This experience is most timely as Shell focuses on the growth of our marketing activities and increasing consumer choices in energy products. Dick brings sound business judgement and a proven track record in strategic delivery to Shell, evidenced by the combination of Ahold and Delhaize. He is also passionate about sustainability and is well informed about the importance of the various stakeholder interests in this area. External appointments ○Non-executive Director of Nestlé and SHV Holdings. ○Chair of the Supervisory Board of Just Eat Takeaway.com | | | Wael Sawan Chief Executive Officer Board Committee membership:
N/A Lebanese and Canadian, 50. Appointed January 1, 2023. Career Wael began his career at Shell in 1997 as an engineer with Petroleum Development Oman. By the mid-2000s, Wael was Managing Director and Chairman of Shell Qatar, where he oversaw Shell's business in Qatar, including its LNG and GTL divisions. Wael then became Executive Vice President of Deep Water, where he was responsible for driving its transformation into a leading business for Shell. Prior to being appointed CEO at the start of 2023, Wael joined the Executive Committee in 2019 as Upstream Director and in 2021, he became Shell's Director of Integrated Gas, and Renewables and Energy Solutions. Wael was a trustee of Shell Foundation from 2019 to the end of 2022. Relevant skills and experience Wael holds an MEng from McGill University in Montreal, Canada, and an MBA from Harvard Business School. During his Shell career, spanning more than 25 years, he has worked in Europe, Africa, Asia and the Americas, and has held roles across all of Shell's businesses. He has led several major commercial transactions, including mergers, acquisitions and divestments, as well as new business development projects. Wael is an exceptional leader, with all the qualities needed to drive Shell safely and profitably through its next phase of transition and growth. His track record of commercial, operational and transformational success reflects not only his broad, deep experience and understanding of Shell and the energy sector, but also his strategic clarity. He combines these qualities with a passion for people, which enables him to get the best from those around him. External appointments ○No external appointments |
Governance | The Board of Shell plc continued
| | | | | | | | | | | | | | | | | | | | |
| | | | | | |
Sinead Gorman Chief Financial Officer
Board Committee membership:
N/A British, 47. Appointed April 1, 2022. Career Sinead joined Shell in 1999 and has held key leadership roles in Finance. She started her Shell career in the Shell International Trading and Shipping Company based in London, UK, and then moved to the Coral Energy joint venture, in Houston, Texas, USA. Sinead worked in Mergers and Acquisitions and Treasury, based in the Netherlands, before moving back to Houston as Vice President Finance for Shales. Prior to her appointment as CFO, Sinead held the positions of Executive Vice President Finance for Upstream; Projects & Technology, as well as Integrated Gas and New Energies (now Renewables and Energy Solutions). Relevant skills and experience Sinead has an MEng from the University of Oxford, and an MSc in Finance from London Business School. Sinead has more than two decades' experience of working for Shell and has held regional and global finance leadership roles across Europe and the USA. She has built a deep understanding of finance across the industry, spanning a wide range of businesses, and possesses a breadth of experience in trading, new business development and capital projects. Highly regarded for her commercial abilities and external focus, Sinead has a strong track record in cost leadership, principle-based decision-making and detailed capital stewardship. External appointments ○No external appointments | | | Neil Carson OBE Independent Non-executive Director
Board Committee membership:
REMCO (Chair) | SUSCO British, 67. Appointed June 1, 2019. Career Neil is a former FTSE 100 CEO. He joined Johnson Matthey in 1980 where he held several senior management positions in the UK and the USA, before being appointed CEO in 2004. Since retiring from Johnson Matthey in 2014, Neil has focused on his
non-executive roles. He was Chair of TT Electronics plc from 2015 until May 2020. Relevant skills and experience Neil has an engineering degree, considerable operational experience and a strong understanding of capital-intensive businesses. He has a broad industrial outlook and a thorough commercial approach combined with a practical perspective on businesses. His intuitive international point of view helps drive value in complex environments. Neil was awarded an OBE for services to the chemical industry in 2016. Neil uses his experience to bring fresh insight and industry understanding to Board discussions. External appointments ○Non-executive Chair of Oxford Instruments plc | | | Ann Godbehere Independent Non-executive Director
Board Committee membership:
ARC (Chair) | NOMCO Canadian and British, 69. Appointed May 23, 2018. Career Ann started her career with Sun Life of Canada in 1976 in Montreal, Canada. She joined M&G Group in 1981, where she served as Senior Vice President and Controller for both life and health, and property and casualty businesses throughout North America. She joined Swiss Re in 1996, after it acquired the M&G Group and served as Chief Financial Officer from 2003 to 2007. From 2008 to 2009, she was interim CFO and an Executive Director of Northern Rock bank in the initial period following its nationalisation. Ann has held non-executive director positions at Prudential plc, British American Tobacco plc, UBS AG, and UBS Group AG. Ann served as a Non-executive Director of Rio Tinto plc and Rio Tinto Limited from 2010 until May 2019 and was also Senior Independent Director of both entities. In January 2021, Ann joined the Board of Stellantis N.V., and she chairs its Audit Committee. Ann joined the Board of HSBC Holdings plc in September 2023 and HSBC Bank plc in January 2025. Relevant skills and experience Ann is a former CFO and a Fellow of the Institute of Chartered Professional Accountants and a Fellow of the Certified General Accountants Association of Canada. She has more than 25 years of experience in the financial services sector. Ann's extensive international business experience enables her to make significant and valuable contributions and bring a global perspective to Board discussions. Ann's long and varied international business career powered by her financial acumen is reflected in the insights and constructive challenges she brings to the boardroom. As ARC Chair, Ann leverages her background to ensure robust discussions are consistently held as the ARC delivers its remit. External appointments ○Non-executive Director and Audit Committee Chair of Stellantis N.V. ○Senior Independent Director of HSBC Holdings plc ○Independent Non-executive Director of HSBC Bank plc |
Governance | The Board of Shell plc continued
| | | | | | | | | | | | | | | | | | | | |
| | | | | | |
Jane Holl Lute Independent Non-executive Director
Board Committee membership:
REMCO | SUSCO American, 68. Appointed May 19, 2021. Career Jane was President and Chief Executive Officer of SICPA Securink Corporation's North American operations from 2017 to 2021, when she assumed the role of Non-executive Strategic Director. From 2018 to 2021, Jane was a Non-executive Director of Atlas Air Worldwide Holdings Inc. In 2013, she established and led the Council on CyberSecurity, an independent not-for-profit organisation with a global scope, committed to the security of an open internet. From 2015 to 2016, Jane was Chief Executive Officer of the Center for Internet Security, an independent not-for-profit organisation that works to improve cyber security worldwide. From 2009 to 2013, Jane served as Deputy Secretary of the US Department of Homeland Security. From 2003 to 2009, she held various senior political and peacekeeping roles at the United Nations. Jane started her career in the US Army in 1978, serving in Berlin during the Cold War, on the US Central Command Staff during Operation Desert Storm, and on the National Security Council Staff under Presidents George H.W. Bush and William J. Clinton. After retiring from the military in 1994, she joined the Carnegie Corporation as an Executive Director of its Commission on Preventing Deadly Conflict. Relevant skills and experience Jane is a proven and effective leader, who has held significant leadership roles in public service, the military, and the private sector. She brings a wealth of expertise in matters of public policy, cyber security, and risk management to our Board. Jane is an experienced board director, having served on the boards of large companies since 2016. These appointments have given her business perspectives across different sectors and geographical regions. She has also served on various committees including those which focus on audit, environmental and sustainability, nomination, and governance issues. External appointments ○Non-executive Director of Marsh & McLennen ○Non-executive Director of Union Pacific Corporation ○Strategic Director of SICPA Securink Corporation | | | Catherine J. Hughes Independent Non-executive Director
Board Committee membership:
ARC | SUSCO (Chair) Canadian and French, 62. Appointed June 1, 2017. Career Catherine was Executive Vice President International at Nexen Inc. from January 2012 until her retirement in April 2013, where she was responsible for all oil and gas activities including exploration, production, development, and project activities outside Canada. She joined Nexen in 2009 as Vice President Operational Services, Technology and Human Resources. Prior to this, Catherine was Vice President Oil Sands at Husky Oil from 2007 to 2009 and Vice President Exploration & Production Services, from 2005 to 2007. She started her career with Schlumberger in 1986 and held key positions in various countries, including France, Italy, Nigeria, the UK, Canada, and the USA. Catherine has held non-executive director positions at SNC-Lavalin Group Inc, Statoil ASA and Precision Drilling Inc. Relevant skills and experience Catherine contributes through her knowledge of industry and the ease with which she engages with other Directors and managers in the boardroom. With over 30 years of industry experience, she brings a geopolitical outlook and deep understanding of the industry. An engineer by training, she has also spent significant time working in senior human resources roles. The Board highly regards her perspectives on our industry and people. Catherine has a strong track record of executing operational discipline with a focus on performance metrics and a drive for excellence. Her knowledge of the technology underpinning oil and gas operations, logistics, procurement and supply chains benefits the Board as it considers projects and investment and divestment proposals. She uses her industry knowledge, combined with her commitment to the highest standards of corporate governance and safety, ethics and compliance, in her role as Chair of SUSCO. External appointments ○Non-executive Director of Valaris Limited | | | Sir Charles Roxburgh Independent Non-executive Director
Board Committee membership:
ARC British, 65. Appointed March 13, 2023. Career Sir Charles was Non-executive Chair of Legal and General America from 2023 to 2025. From July 2016 to June 2022, he was Second Permanent Secretary, one of the most senior positions within the UK's Treasury. In this role, he was responsible for policy and oversight across a range of functions including financial services, financial stability, infrastructure, energy, science and research and development, business investment, venture and growth capital, transport, and culture and creative industries. He was also Chair of the HMT Operating Committee. Sir Charles was Director General, Financial Services at HMT from 2013 to 2016 and led the legislative process for the biggest reforms in the UK banking sector in a generation before being appointed Second Permanent Secretary. Prior to HMT, Sir Charles spent over 25 years at McKinsey & Company and obtained an MBA from Harvard Business School. While at McKinsey, he held a range of senior positions. Sir Charles has worked for large banks, insurance companies, hedge funds and private-equity investors in strategy, risk management, and organisation roles. Sir Charles also led major research efforts at McKinsey and authored articles on strategy and scenario planning. Relevant skills and experience Sir Charles' succession of roles placed him at the nexus between industry and government, and have included his active involvement in forging and delivering energy policies. He was an influential figure within HMT in pioneering energy policy, including for COP26, and providing funding for innovative organisations to support the energy transition. External appointments ○Chair of Lloyd's of London (effective
May 1, 2025) ○Non-executive member of Global Council, Herbert Smith Freehills |
Governance | The Board of Shell plc continued
| | | | | | | | | | | | | | | | | | | | |
| | | | | | |
Abraham Schot Independent Non-executive Director
Board Committee membership:
REMCO | SUSCO Dutch, 63. Appointed October 1, 2020. Career Abraham ("Bram") has been on the Board of Volkswagen AG, responsible for the Premium Car Group, CEO of Audi AG, Chair of Lamborghini and Ducati, responsible for the VW Group Commercial Operations and Vice-Chair of Porsche Holding Salzburg. From 2011 to 2016, he was a member of the Board of Volkswagen Commercial Vehicles and Executive Vice President responsible for Global Marketing, Sales & Services, New Business Models. In 2017, he became a member of the Board of Audi AG. From 2006 to 2011, Bram was President and CEO of Daimler/Mercedes-Benz Italia & Holding S.p.A. From 2003 to 2006, he was President and CEO of DaimlerChrysler in the Netherlands. Prior to this, Bram held a number of director and senior leadership roles within Mercedes-Benz in the Netherlands, having joined the business in 1987 on an executive management programme. Relevant skills and experience Bram has over 30 years' experience working in the automotive industry. He was part of the transformation journey at Audi AG, which saw the car company become a provider of electric vehicles that offered sustainable mobility. He is able to leverage this knowledge as Shell navigates its own journey through the energy transition. Bram brings his high regard for integrity and compliance to board meetings. His studies have encompassed innovation and organisational effectiveness, geopolitical environments, shareholder value, corporate social responsibility and risk management, which are all valued management tools. External appointments ○Non-executive Director of Signify N.V ○Non-executive Director of Cognizant Technology Solutions Corporation ○Non-executive Director of Compagnie Financière Richemont SA | | | Leena Srivastava Independent Non-executive Director
Board Committee membership:
SUSCO Indian, 64. Appointed March 13, 2023. Career Leena has dedicated her career to sustainability research and policy matters, and has held positions on boards of scale. She was Deputy Director General for Science at the International Institute for Applied Systems Analysis. Prior to this, she was an Executive Director at The Energy and Resources Institute (TERI), a not-for-profit policy research organisation working on energy, environment and sustainable development, and then Vice Chancellor of the TERI School of Advanced Studies – a research university focused on sustainability education based in India. Leena is a member of the UN Technical Advisory Group on SDG 7, a Scientific Advisory Board Member of the European Forum Alpbach, and an advisory Board Member of NAMTECH, an Indian technical education institute. She has served committees and organisations at international and national levels, including as energy and climate adviser for the United Nations and Member of the Advisory Committee at Future Earth. She has also been a non-executive director of companies, including companies involved in manufacturing and infrastructure. Relevant skills and experience Leena has served on sustainability advisory boards of multinational companies, such as The Coca-Cola Company, Caterpillar Inc. and Suez Environment. She recognises the challenges large organisations face in managing stakeholder priorities, including balancing business, government and societal needs, while pursuing a sustainability agenda. As a member of the Cement Sustainability Initiative of the World Business Council for Sustainable Development, she provided a pragmatic perspective on how to support the sector through its decarbonisation journey. She has a strong network of relationships in multiple global institutions focused on sustainability and an understanding of the issues the energy sector faces. External appointments ○Member of the Independent Council of Climate Experts of Edelman | | | Cyrus Taraporevala Independent Non-executive Director
Board Committee membership:
ARC | REMCO American, 58. Appointed March 2, 2023. Career Cyrus was President and Chief Executive Officer of State Street Global Advisors from 2017 to 2022. Cyrus has held numerous leadership roles in asset management including at Fidelity, BNY Mellon, Legg Mason, and Citigroup. Cyrus was previously a partner at McKinsey & Company, based in New York and Copenhagen. He serves on the Board of two non-profit organisations: The Trustees of Reservations, a Massachusetts-based conservation organisation, and GBH, a public media producer, distributor, broadcaster and content creator. He joined the Board of Pfizer Inc. in July 2024. Relevant skills and experience Cyrus brings a unique mix of strategic perspectives and business skills. He has significant experience in driving organic and inorganic growth, and company transformations. He is one of the most senior professionals in the asset management industry and has successfully led and grown global businesses of scale. He played a critical role in affirming State Street's reputation as both a stalwart and a pioneer within the sector. At times, Cyrus was helping to implement change amid market uncertainty caused by geopolitical tensions and an evolving regulatory environment. Cyrus also possesses a unique vantage point on core board-related issues impacting public companies including sustainability. He has spoken about and published multiple articles on climate risk and other aspects of sustainability. He is credited with strengthening the sustainability credentials of State Street Global Advisors. External appointments ○Non-executive Director of Bridgepoint Group plc ○Non-executive Director of Pfizer Inc. |
Governance | The Board of Shell plc continued
Sean Ashley
Company Secretary
British, 54. Appointed July 1, 2024.
Career
Sean qualified as a solicitor in 1998 and has significant experience across a broad range of legal, regulatory, governance and compliance matters, including UK listed company securities and disclosure laws, UK corporate governance and reporting requirements as well as public company M&A.
Relevant skills and experience
Sean leads the Corporate Secretariat and the Group Disclosures and Securities Team in the UK, USA and the Netherlands.
Sean has held a variety of roles in the Shell Group since joining from private practice in 2006, including most recently as Associate General Counsel Conventional Oil and Gas. Previous roles include leading the Shell Legal team on Shell's recommended combination with BG Group plc.
| | | | | | | | | | | | | | | | | | | | | | | | | | | | | | | | |
| | | | | | | | | | |
| | | | | | | | | | |
| | Attendance The Board met nine times during 2024. Five of the nine meetings were held physically, one meeting in the Netherlands, and four in London, United Kingdom. Four meetings were held virtually. Attendance during 2024 for all Board meetings is given in the table [A]. | | | | | | | | |
| | | Board member | Meetings attended | | Board member | Meetings attended | | |
| | | Dick Boer | 9/9 | | Sir Andrew Mackenzie | 9/9 | | |
| | | Neil Carson [B] | 8/9 | | Sir Charles Roxburgh | 9/9 | | |
| | | Ann Godbehere | 9/9 | | Wael Sawan | 9/9 | | |
| | | Sinead Gorman [C] | 8/9 | | Bram Schot [E] | 8/9 | | |
| | | Jane Holl Lute [D] | 8/9 | | Leena Srivastava | 9/9 | | |
| | | Catherine J. Hughes | 9/9 | | Cyrus Taraporevala | 9/9 | | |
| | | | | | | | | |
| | [A]For attendance at Committee meetings during the year, please refer to individual Committee Reports. [B]Neil Carson was absent from the May 2024 Board meeting due to a scheduled business commitment. [C]Sinead Gorman was absent from the July 2024 Board meeting due to personal circumstances. [D]Jane Holl lute was absent from the March 2024 Board meeting due to personal circumstances. [E]Bram Schot was absent from the September 2024 Board meeting due to a scheduled business commitment. | | |
| | | | | | | | | | |
| | | | | | | | | | |
| Director independence All Non-executive Directors are considered by the Board to be independent in character and judgement. The Chair is not subject to the UK Corporate Governance Code's independence test other than on appointment. | | |
| | | | | | | | | | |
Executive Committee
The Executive Committee of the Company comprises the Executive Directors, Wael Sawan and
Sinead Gorman, and those listed below (see "Governance Framework" on page 149).
| | | | | | | | | | | | | | | | | | | | | | | | | | | | | | | | | | | | | | |
| | | | | | | | | | | | |
Philippa Bounds Legal Director
British, 54.
Appointed July 2023. Career Philippa was previously General Counsel for Trading and Supply, based in London. She joined Shell in 2005 after a decade of working at English and American law firms, specialising in structured finance. She has held legal roles across Shell's businesses, including Senior Legal Counsel in Gas and Power and in Corporate. She has also held several advisory roles, including special adviser to the EU Commission's Director General Internal Markets on securities laws. She has represented Shell on a committee that worked with the UK government on the introduction of the Companies Act 2006. | | | Robin Mooldijk Projects & Technology Director
Dutch, 58.
Appointed July 2023. Career Robin was previously Executive Vice President of Shell Chemicals and Products. He was appointed to that role in August 2021, following the integration of Shell's chemicals and manufacturing businesses. Robin began his career at Shell in 1991 at its Research Laboratory in Amsterdam, the Netherlands, and since then he has held critical roles, including General Manager of Shell Chemicals Europe, Managing Director South African Petroleum and Vice President of Manufacturing Americas. In 2018, he was appointed Shell's Executive Vice President for Manufacturing. | | | Rachel Solway Chief Human Resources and Corporate Officer
British, 51.
Appointed January 2024. Career Rachel joined Shell in 1995 in Upstream in Aberdeen, Scotland. She has since held HR roles in manufacturing, LPG, lubricants and chemicals. In 2016, Rachel was appointed Executive Vice President HR Integrated Gas. She became the Executive Vice President HR Upstream in 2020 before being appointed interim Executive Vice President HR Organisation Development & Learning in May 2023. | | | Huibert Vigeveno Downstream, Renewables and Energy Solutions Director
Dutch, 55.
Appointed January 2020. Career Huibert was previously Executive Vice President Global Commercial. He joined Shell in 1995 as a business analyst and led Downstream businesses across Shell in Europe, Africa, North and South America, as well as Asia. In 2009, Huibert was appointed Vice President Supply & Distribution, Europe and Africa. In 2012, he became Executive Chair of Shell in China, and in 2016 led the integration of BG Group. | | | Zoë Yujnovich Integrated Gas and Upstream Director
Australian, 49.
Appointed October 2021. Career Zoë has held various management positions in Downstream, Integrated Gas and Upstream. She served as Upstream Director, and was previously Executive Vice President Conventional Oil and Gas and prior to that Chair and Executive Vice President Shell Australia Pty Ltd. She joined Shell from Rio Tinto in 2014 to lead Shell's Oil Sands business in Canada. Zoë joined the Board of Unilever plc in March 2025 as an independent Non-Executive Director and member of the Nominating and Corporate Governance Committee and Corporate Responsibility Committee. |
Governance | Executive Committee continued
Changes to the Executive Committee
On January 23, 2025, Shell announced that Huibert Vigeveno, Downstream, Renewables and Energy Solutions Director, will step down effective March 31, 2025. It was also announced that Andrew Smith will be appointed Director, Trading and Supply, and Machteld de Haan will be appointed Director, Downstream, Renewables and Energy Solutions.Their appointments are effective from April 1, 2025. On March 4, 2025, Shell announced that Zoë Yujnovich, Integrated Gas and Upstream Director, will step down effective March 31, 2025.
On March 4, 2025, Shell also announced that from April 1, 2025, leaders on the Executive Committee representing Integrated Gas; Upstream; Downstream, Renewables and Energy Solutions; Trading and Supply; and Projects & Technology, will each be referred to as President of their respective organisations, rather than Director. Functional leaders on the Executive Committee will be referred to as Chief Officer of their respective functions. The changes to the Executive Committee structure are designed to support our strategy to deliver more value with less emissions, and as part of our ongoing transformation.
Cederic Cremers will be appointed President, Integrated Gas, and Peter Costello will be appointed President, Upstream. Both Cederic and Peter will join the Executive Committee from April 1, 2025. We thank Huibert and Zoë for their outstanding service and wish them success in all that lies ahead.
Shell's financial reporting segments remain Integrated Gas; Upstream; Marketing, Chemicals and Products; Renewables and Energy Solutions; and Corporate.
| | | | | | | | |
| | |
| Andrew Smith President, Trading and Supply
Australian, 60. Appointment effective April 2025. | Career Andrew was appointed Executive Vice President, Trading and Supply in 2017. Prior to his current role, Andrew was Vice President, Downstream in Australia and subsequently became the Executive Vice President, Upstream and Country Chair, leading the expansion of Shell's Liquid Natural Gas and Onshore Gas businesses in Australia. Andrew joined Shell in 1986 as a refinery engineer and has worked across all of Shell's integrated value chains including leading Shell's petrochemical manufacturing business in Singapore. |
| | |
| | |
| Machteld de Haan President, Downstream, Renewables and Energy Solutions
Dutch, 51. Appointment effective April, 2025. | Career Machteld joined Shell in 1998 and has had several leadership and geographically diverse roles across the Downstream portfolio including Mobility, Strategy, Fleet Solutions, Lubricants and most recently Chemicals and Products. Prior to being appointed to lead Chemicals and Products, Machteld was Senior Vice President, Lubricants Americas, which included being the CEO of Pennzoil Quaker State Company, and subsequently became Executive Vice President, Global Lubricants. |
| | |
| | |
| Cederic Cremers President, Integrated Gas
Dutch, 46. Appointment effective April 2025. | Career Cederic was appointed Executive Vice President, Liquefied Natural Gas in August 2021. He joined Shell's Retail business in 2002 and has held a variety of finance and commercial roles across Shell upstream and downstream businesses, including General Manager, Shell Chemicals Europe; Vice President, Commercial and New Business Development, Asia; and Executive Vice President and Country Chair, Russia. |
| | |
| | |
| Peter Costello President, Upstream
British, 59. Appointment effective April 2025. | Career Peter was appointed Executive Vice President, Conventional Oil and Gas in November 2021 after serving as Senior Vice President of that same business. Peter joined Shell in 2016 as Vice President, Nigeria and Gabon following the company's combination with BG Group, where he held geographically diverse senior roles across Downstream, Midstream, and Upstream, including President and Country Head, Kazakhstan. |
Board activities
Management and Directors
The Company has a single-tier Board of Directors headed by a Chair, with management led by a CEO. See "The Board of Shell plc" on pages 149-153 and "Executive Committee" on pages 154-155.
Executive Committee
The current composition of the Executive Committee is as follows:
| | |
Executive Committee [A][E] |
| | | | | |
| Wael Sawan | CEO [B] |
| Sinead Gorman | CFO [B] |
Philippa Bounds | Legal Director |
Robin Mooldijk | Projects & Technology Director |
Rachel Solway | Chief Human Resources & Corporate Officer |
| Huibert Vigeveno | Downstream Director [C] |
| Zoë Yujnovich | Upstream Director [D] |
[A]Designated an Executive Officer pursuant to US Exchange Act Rule 3b-7. Beneficially owns less than 1% of outstanding classes of securities.
[B]Director of the Company.
[C]As announced on January 23, 2025, Huibert Vigeveno will step down effective March 31, 2025. Andrew Smith will be appointed Director, Trading and Supply, and Machteld de Haan will be appointed Director, Downstream, Renewables and Energy Solutions. Both will join the Executive Committee from April 1, 2025, and will be designated an Executive Officer pursuant to US Exchange Act Rule 3b-7 effective April 1, 2025.
[D]As announced on March 4, 2025, Zoë Yujnovich will step down effective March 31, 2025. Cedric Cremers will be appointed President, Integrated Gas, and Peter Costello will be appointed President, Upstream. Both will join the Executive Committee from April 1, 2025, and will be designated an Executive Officer pursuant to US Exchange Act Rule 3b-7 effective April 1, 2025.
[E]As announced on March 4, 2025, from April 1, 2025, leaders on the Executive Committee representing Integrated Gas; Upstream; Downstream, Renewables and Energy Solutions; Trading and Supply; and Projects and Technology, will each be referred to as President of their respective organisations, rather than Director. Functional leaders on the Executive Committee will be referred to as Chief Officer of their respective functions.
Corporate governance requirements outside the UK
In addition to complying with applicable corporate governance requirements in the UK, the Company complies with the rules of Euronext Amsterdam and Dutch securities laws because of its listing on that exchange. The Company, likewise, adheres to US securities laws and the New York Stock Exchange (NYSE) rules and regulations because its securities are registered in the USA and listed on the NYSE.
Board activities
The Board works to a yearly meeting plan with corresponding agendas and reading materials, provided digitally in advance of meetings, to support the Board in its oversight of the Group's operations and management. Standing agenda items include reports from the CEO, the CFO and the Chair of each Board committee. Other updates throughout the year come from various businesses and key functions, including Investor Relations; Health and Safety, Security and Environment; Information Technology; Human Resources; and Legal, as well as the Company Secretary. The Board also considers and approves the quarterly, half-year and full-year financial results, shareholder distributions and the associated announcements, and, at most meetings, considers investment, divestment and/or financing proposals and tracks performance. Additionally, the Board reviews the Group's annual Operating Plan, including activities undertaken designed to meet the Group's carbon reduction targets. To enable purposeful discussion and focus on particular aspects of agenda topics, including the impact on key stakeholders, Directors have an opportunity to specify information they require to be provided in advance of Board meetings.
During the year, where possible, Non-executive Directors conduct site visits. The visits are designed to provide them with a deeper insight into certain business operations.
Board off-site
Each June, the Board and Executive Committee participate in a three-day programme, known as the "Board off-site", which takes place in a priority country setting and serves to improve Board effectiveness and strategic decision-making. The 2024 Board off-site was held in person in the Netherlands over three days. The event sought to deliver insights into business strategy and operations. It also incorporated a visit to one or more strategic assets and facilitated dialogue with the Netherlands country chair, employees, contractors, regional country chairs, and external stakeholders, including customers and suppliers.
The Netherlands is an important heartland for Shell. The Board and EC members conducted a deep dive into each of Shell's businesses in the country. Around this theme, the event provided for the following key discussion and engagement opportunities:
○visits to the Shell Energy and Chemicals Park Rotterdam and the Holland Hydrogen I construction site;
○engagements with staff; and
○discussions with global energy-geopolitical experts and engagement with the Prime Minister at that time.
| | | | | | | | |
| | |
| Director induction and training After being appointed to the Board, Directors receive a comprehensive induction tailored to their individual needs. This normally includes site visits and meetings with senior management to enable them to build up a detailed understanding of Shell's business and strategy, and the key risks and issues that Shell faces. Existing Directors are also able to join these visits to keep abreast of business developments and progress. Onboarding will continue to be phased and prioritised based on forthcoming Board agenda items. A digital onboarding book is provided to each new Non-executive Director. These onboarding books complement the existing digital Directors' Handbook and feature: ○Overviews of scheduled briefing meetings customised to the Non-executive Directors' needs and linked to upcoming Board agenda items; ○Hyperlinks to key Shell publications (external and internal); ○Lists of common Shell acronyms; ○Key current materials on: –Shell's safety and core values; –Board governance; –Group strategy and portfolio; –Key businesses and functions; and –Climate change and energy transition. ○Biographies of key executives; ○Other elements of the onboarding programme for Non-executive Directors include: –Briefing meetings with key executives (both business and functional) customised to Non-executive Directors' needs and phased based on forthcoming Board agenda items; –Pairing up new Non-executive Directors in onboarding briefings to optimise learning while also providing opportunities for collegial relationship-building and increasing efficiencies for the executives; and –Site visits (either specifically for onboarding or by inviting the new Directors to committees' site visits). | |
| | |
Governance framework
| | | | | | | | | | | | | | |
| | | | |
| Board of Directors | | |
| | | | |
| | | | |
| | The Company has a single-tier Board of Directors headed by a Chair, with executive management led by the Chief Executive Officer. The names of the Directors who held office during the year can be found on pages 149-153. Information on the Directors who are seeking appointment or reappointment is included in the Notice of Annual General Meeting. There is no fixed number of times that the Board may meet in one year. During 2024, the Board met nine times (nine times during 2023). Further information on the Board's work and assessments in relation to strategy, culture, engagement with stakeholders, and its workforce can be found in this section. The Board's responsibilities are governed by a formal schedule of matters reserved to it and include: ○Approval of overall strategy and oversight of management. ○Changes to the corporate and capital structure. ○Approval of financial reporting and controls, including interim dividends. ○Oversight of risk management and internal control. ○Approval of significant contracts. ○Determining succession planning and new Board appointments. ○Remuneration for the Chair and Executive Directors. ○Corporate governance matters. Board Committees | | |
| | | | | | | | | | | | | | | | | | | | | | | | | | | | | | | | |
| | | | | | | | | | |
| | | Audit and Risk Committee ("ARC") | | | | Sustainability Committee ("SUSCO") | | | |
| | | | | | | | | | |
| | | | | | | | | | |
| | | | | | | | | | |
| | | Nomination and Succession Committee ("NOMCO") | | | | Remuneration Committee ("REMCO") | | | |
| | | | | | | | | | |
| | | | | | | | | | |
| | | | | | | | | | | | | | | | | | | | | | | | | | |
| | More information on the composition of each of the Board committees, their purpose, roles and activities during the year is provided on the following pages: | | |
| | | | | | | | |
| | ARC | 168-179 | | SUSCO | 167-167 | | |
| | NOMCO | 163-166 | | REMCO | 180-182 | | |
| | | | | | | | |
| | | | | | | | |
Governance | Governance framework continued
| | | | | | | | | | | | | | |
| | | | |
| Board of Directors continued | | |
| | | | |
| | | | |
| | Division of responsibilities The roles of the Chair, a non-executive role, and the CEO are separate and clearly defined. The Board has agreed on their respective responsibilities and set these out in writing. These documents are available on request from the Company Secretary. Chair ○Responsible for ensuring that the Board and its committees function effectively. One way in which this is achieved is by ensuring Directors receive accurate, timely and clear information; and ○Responsible for making sure that there is an adequate induction and training programme followed by all Directors (see page 156), with assistance from the Company Secretary. Deputy Chair/Senior Independent Director ○Sounding board for the Chair; ○Serves as an intermediary for the other Directors and shareholders; and ○Leads the annual appraisal of the Chair's performance. Non-executive Directors ○Appointed by the Board or by shareholders at general meetings and, in accordance with the Code, seek re-election by shareholders on an annual basis; ○Letters of appointment refer to a specific term of office in accordance with the provisions of the Code and the Company's Articles of Association; ○Upon appointment, Non-executive Directors confirm they are able to allocate sufficient time to meet the expectations of the role. Appointments are subject to a minimum of three months' notice of termination, and there is no compensation provision for early termination; ○The Non-executive Directors bring a wide range and balance of skills and international business experience. Through their contribution to the Board and Board committee meetings, respectively, they are expected to challenge and help develop proposals on strategy and bring independent judgement on issues of performance and risk; and ○At every Board meeting, time is set aside for the Chair and Non-executive Directors to meet without the Executive Directors being present. The Non-executive Directors discuss, among other matters, the performance of individual Executive Directors. A number of Non-executive Directors also meet major shareholders over the course of the year. | | |
| | | | |
| | | | |
| | | | | | | | | | | | | | | | | | | | | | | | | | |
| Executive Management | | | | | | |
| | | | | | | | |
| | | | | | | | |
| | Chief Executive Officer (CEO) ○Has overall responsibility for the implementation of the strategy approved by the Board, the operational management of the Company and the business enterprise connected with it; and ○Is supported in this by the EC that he chairs. | | | | Executive Committee (EC) ○Operates under the direction of the CEO in support of his responsibility for the overall management of Shell's business. The CEO has final authority in all matters of management that are not within the duties and authorities of the Board or of the shareholders' general meeting; and ○EC members are listed in the Executive Committee biographies on pages 154-155. | | |
| | | | | | | | |
| | | | | | | | |
| | | | | | | | | | | | | | |
| | | | |
| | | | |
| Governance documents available on shell.com/investors: | | |
| | | | |
| | | | |
| | ○Articles of Association ○Matters Reserved for the Board ○Board Committee Terms of Reference ○Modern Slavery Act Statement ○Shell General Business Principles ○Shell Code of Conduct ○Code of Ethics for Executive Directors and Senior Financial Officers | | |
| | | | |
| | | | |
Governance | Governance framework continued
| | |
| Senior Succession and Resourcing Review |
| The annual Senior Succession and Resourcing Review focused on the strength of senior leadership and plans for its development and succession, while highlighting the breadth, depth and diversity of its pipeline, the developing profile of the leadership cadre, and recruitment and attrition levels. |
The Senior Succession and Resourcing Review also highlighted the effectiveness of succession planning, the impact of its associated execution, and the data-driven, integrated approach to leadership and leadership development. The review continues to focus on proactive management of Shell's talent pipeline, and on advancing Shell's diversity agenda with increased attention on gender, race and ethnicity, LGBT+ and disabilities. |
Shell Performance Framework
The Shell Performance Framework is the overarching framework we use to deliver our strategy. It applies to all Shell companies and provides a consistent approach for how each company in Shell operates. It seeks to empower each company in a way that is fit for purpose, while delivering on our overall objectives. It emphasises the value of a holistic or "whole systems" approach to business activities along with the important role that culture plays in achieving Shell's objectives.
The Shell Performance Framework
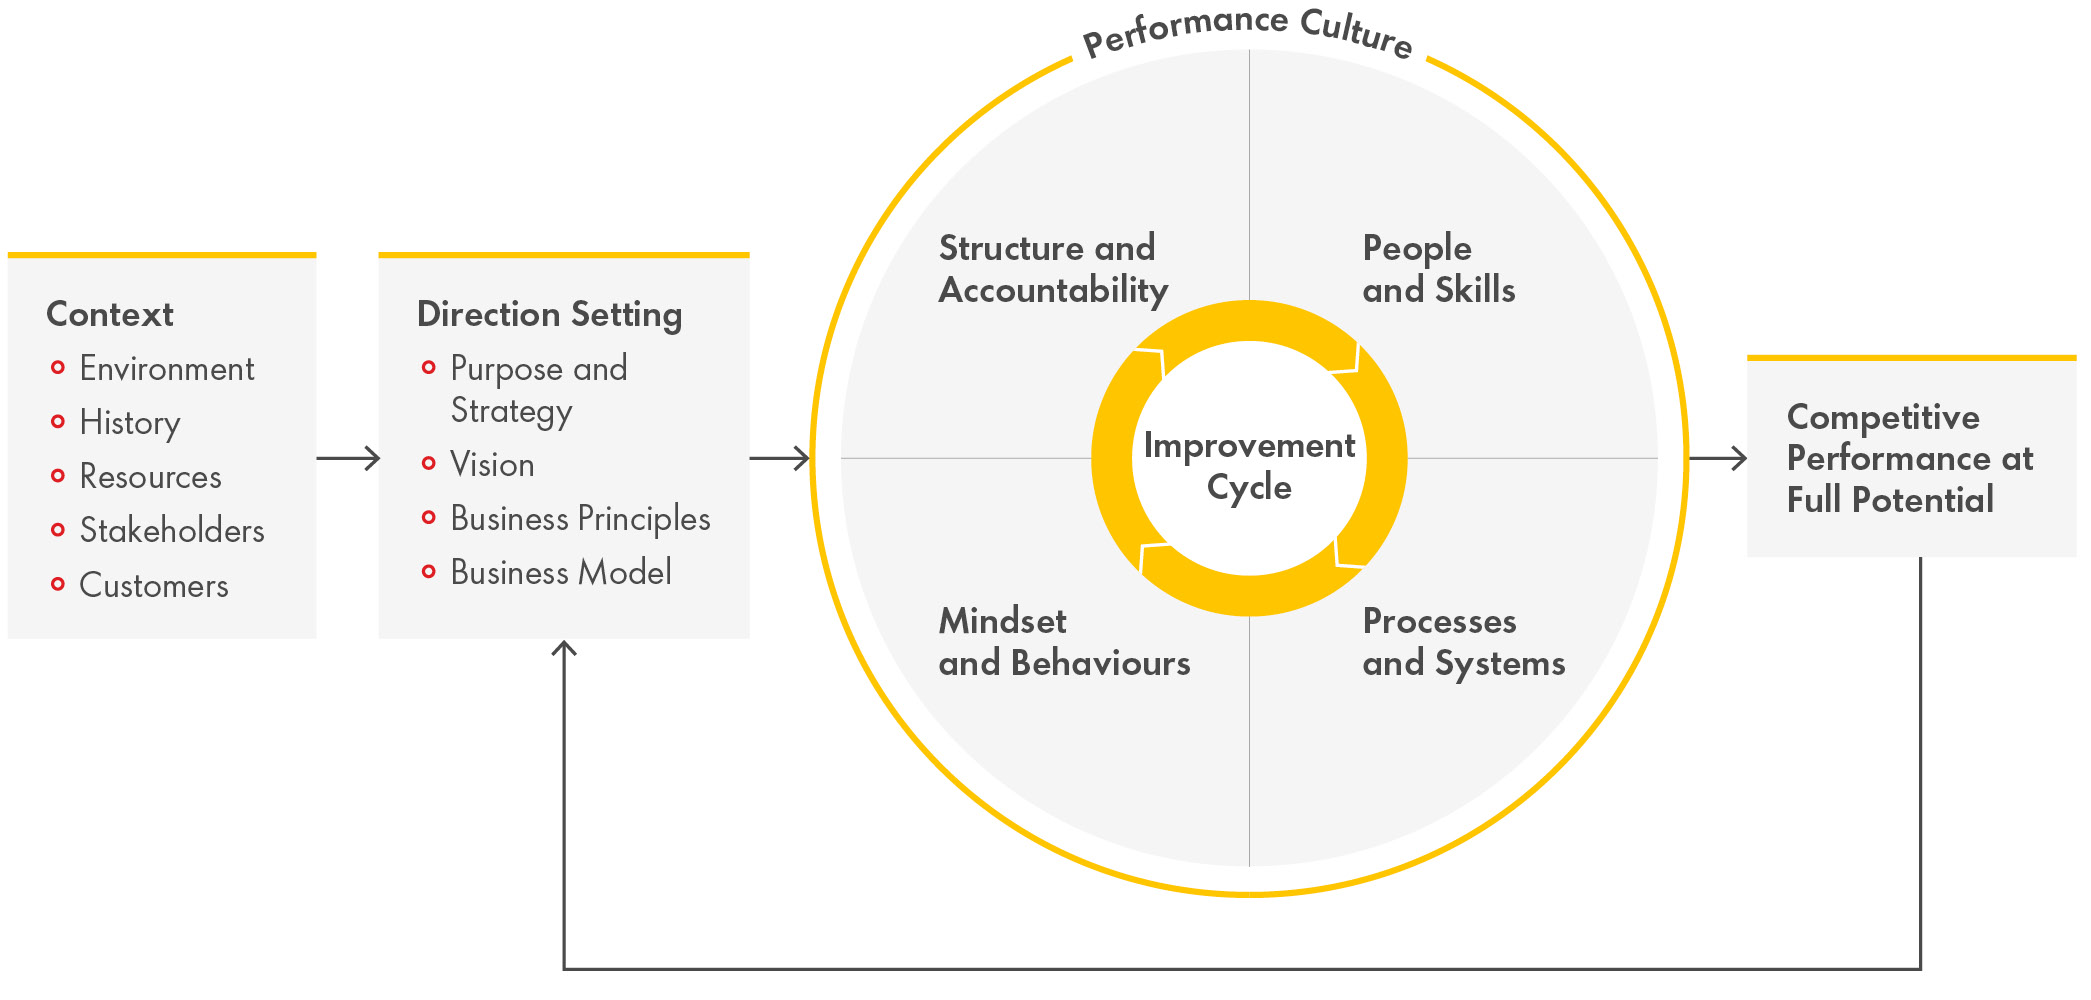
| | | | | | | | |
| | |
| The Shell Performance Framework supports the delivery of sustainable business outcomes. In pursuit of this, consideration is given to both the context in which Shell operates and key elements of direction-setting, including, for example, Shell's strategy and the Shell General Business Principles. Delivery of the desired outcomes is then pursued by leveraging our Performance Culture, i.e., the shared values, practices and beliefs of our employees. This is influenced by decisions on: ○Structure and Accountability – how we are organised and governed and the associated roles and responsibilities; ○People and Skills – our workforce composition, such as its size, diversity and location, and the skills required to deliver Shell's objectives; ○Processes and Systems – how we transform inputs into outputs in a controlled manner, leveraging data and systems as appropriate. This also includes the standards that further define the boundaries within which Shell operates; ○Mindset and Behaviours – this includes the role of leadership and Shell's values, beliefs and behaviours, as set out, for example, in the Code of Conduct. At the heart of the Shell Performance Framework is the Improvement Cycle, which integrates performance management, risk management, including controls and assurance, learning and improvement. It follows a "Plan-Do-Check-Adjust" approach and helps to drive a consistent way of working and improving. | |
| | |
Governance | Governance framework continued
Risk management and controls
The Board is responsible for establishing and maintaining procedures to manage risk, overseeing the internal control framework, and determining the nature and extent of the principal risks that Shell is willing to take in order to achieve its long-term strategic objectives.
The Shell Performance Framework sets out the overarching approach to how we manage risks in Shell. This approach, together with Shell's principal and emerging risks, is described on Page25
Board review of principal and emerging risks
The Board confirms it has carried out a robust assessment of Shell's principal risks, including a robust process for identifying, evaluating and managing these principal risks. The Board also confirms it has carried out a robust assessment of Shell's emerging risks. These assessments have been in place throughout 2024 and up to the date of this Report, are reviewed by the Board and accord with the Financial Reporting Council guidance on risk management, internal control and related financial and business reporting.
Review of the effectiveness of the system of risk management and internal control
The Audit and Risk Committee (ARC) assists the Board in fulfilling its responsibilities in relation to the effectiveness of the risk management and internal control system, the integrity of financial reporting, and consideration of compliance matters.
| | | | | |
| |
| See "Audit and Risk Committee Report" on pages 168-179. |
| |
The ARC receives regular reports from the Chief Internal Auditor on notable internal audits and those with a significant impact on the effectiveness of controls. The ARC reviews significant incidents involving financial, operational and compliance controls and receives regular reports on business integrity issues. The ARC also requests updates on specific financial, operational and compliance control issues throughout the year. It is helped with its monitoring and review responsibilities by summaries of the Annual Proved Reserves Disclosure as well as the reports of:
○the Executive Vice President Controller;
○the Chief Internal Auditor;
○the external auditor;
○the Chairs of the Disclosure Committee and the External Reporting Control Committee; and
○the Chief Ethics and Compliance Officer.
The Chair of the ARC provides regular updates to the Board after each of its meetings. These updates cover, among other matters, the respective aspects of controls that it monitors in accordance with its Terms of Reference. During and after such sessions, the Board has the opportunity to request further information and ask clarifying questions. The Board also receives the approved minutes of the ARC. This helps the Board with its ongoing monitoring and annual review of material controls.
The Executive Committee and the ARC conduct an annual review of the effectiveness of the system of risk management and internal control. This is based on their own insights and experience during the year, the outcomes of Group-level risk reviews and the Group Assurance Letter process. As part of the latter, each Executive Director conducts a structured internal assessment of compliance with legal, ethical and other requirements of the Shell Performance Framework.
As part of their annual review, the Executive Committee and ARC also consider input from the Chief Internal Auditor, Chief Ethics and Compliance Officer, Executive Vice President Controller and the external auditor. The Board reviews and discusses the insights and conclusions from this annual assessment.
The Board confirms that it has conducted its annual review of the effectiveness of Shell's system of risk management and internal control in respect of 2024, and that this review covered all material controls, including financial, operational and compliance controls.
| | |
| Risks |
The Board reviewed reports on Shell's top risks, external and internal trends and emerging risks. |
| Chief Ethics and Compliance Officer Report |
Data and insights include information from the Global Helpline, the Shell Ethics and Compliance organisation and the Shell People Survey. |
| The ARC is kept updated when matters highlighted through the Global Helpline are investigated. The ARC is also informed about the associated remediation. See "Audit and Risk Committee Report" on page 168-179. |
| Assurance activities |
Assurance activities, including items raised by businesses and functions (through the Group Assurance Letters process) and assurance (from Internal Audit, HSSE, Ethics and Compliance, Reserves Assurance and Reporting, Financial and Non-Financial Reporting), provide additional evidence to the Board of the commitment to high standards of risk management and internal control. The assurance activities ensure that work can be done safely, within regulatory frameworks. |
| The information provided within these reports further supports the Board's annual review of the effectiveness of the Group's system of risk management and internal control, and feeds into the Group scorecard, against which staff bonuses are calculated. |
Governance | Governance framework continued
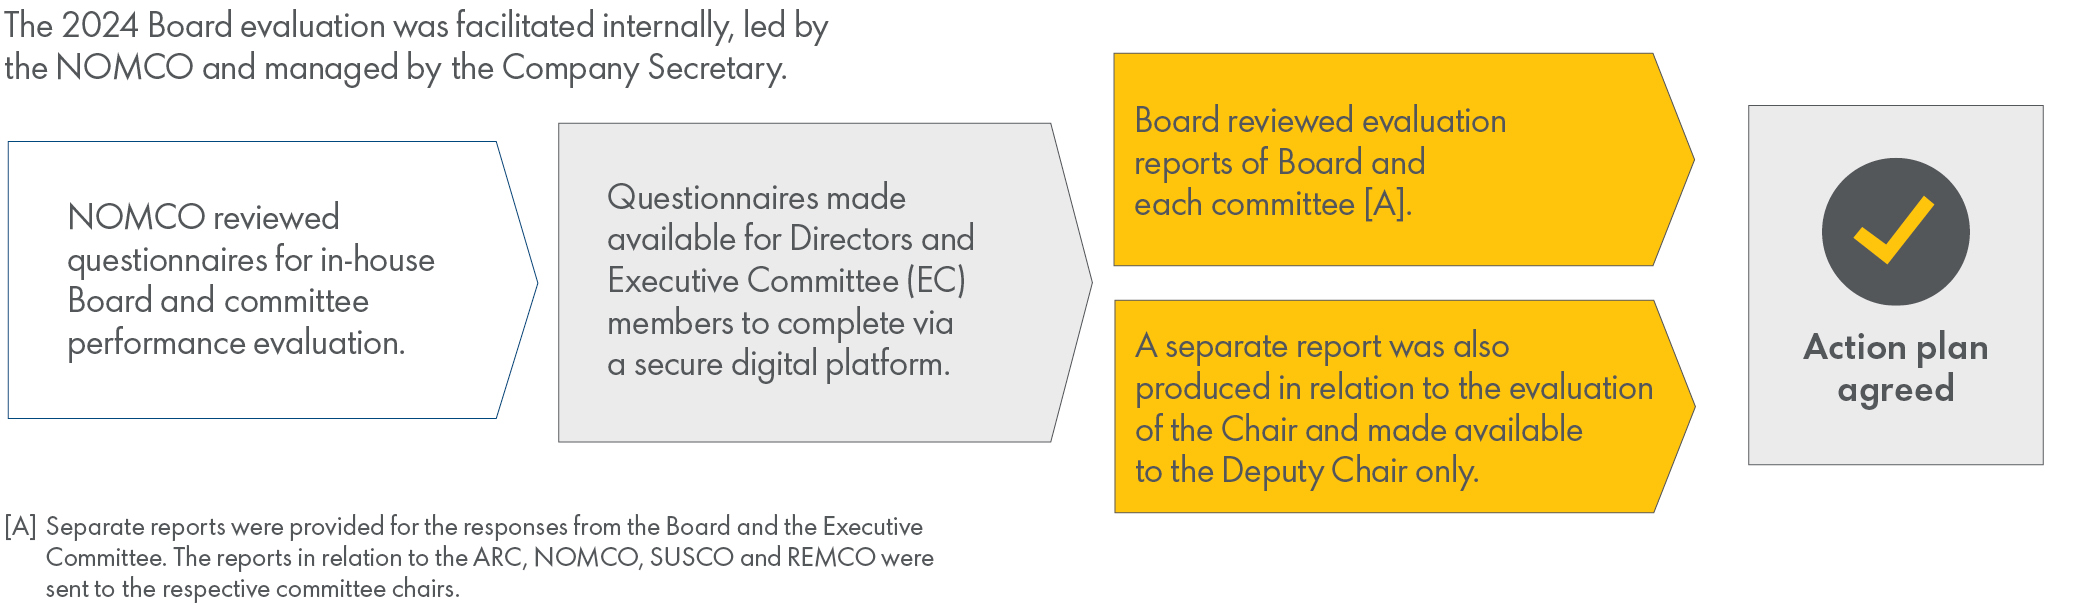
Board review process
The 2024 Board evaluation process comprised:
(a) Board Dynamics review
The review, which took place in September 2024, was structured to reflect on the current state of Board practices, focusing on opportunities for the Board to further elevate its collective performance, noting where there are strengths as well as opportunities to develop. The review, supported by the Chief Human Resources Officer and the Company Secretary, involved one-to-one discussions between the Chair and each Non-executive Director as well as plenary discussions with the Board and Executive Committee. A number of key themes and focus areas were identified as part of the review, including: (i) preparing for the next phase of key strategic decision points for the Company; (ii) deepening the Board's relationship with non-Board members of the Executive Committee; (iii) balancing how the Board continues to best act as a collective, while recognising the strengths and diversity of individual members needed to maximise performance; and (iv) continuing to sharpen the onboarding process. A number of actions to address these findings are under way.
(b) Internally facilitated questionnaire-based Board and Committee evaluation
Taking into account the structure and output from the 2024 Board Dynamics review, it was recommended that NOMCO conduct an
in-house review (similar to the 2023 process). The form of the questionnaires were appropriately adjusted to reflect the output from the Board Dynamics review and Board members responded to those questionnaires, which were shared at the end of 2024, with results discussed at the January 2025 Board and committee meetings. Separate questionnaires were produced for the evaluation of the Chair, and the Board committees. In addition, the Chair held separate one-to-one discussions with each of the Non-executive Directors to assess their individual performance during the year. To broaden the inputs into the evaluation process, members of the EC participated in the evaluation process, also completing questionnaires relating to their attendance at Board meetings. The Company Secretary produced a feedback summary providing recommendations to the Directors. This report was shared with the Chair, NOMCO and subsequently all Board members.
Insight
The feedback from Board Directors was positive throughout their responses to the evaluation. Views were provided on a number of topics including: composition and diversity; skills, capabilities and competencies; engagement with, and/or challenge of, management; atmosphere in the room; management of meetings; the support the Board and Board committees receive; strategic focus; oversight of risk and risk management; stakeholder engagement; and any priorities for 2025.
Board dynamics
Noting also the Board Dynamics review, the Non-Executive Directors' support and challenge of management rated well, with the Non-Executive Directors welcoming extra informal time with the EC as planned for future meetings.
Board oversight
The Board's oversight in framing and setting the Group's strategy rated highly, as did the Board's understanding of the capacity of the Group to deliver and its monitoring of external developments. Strategy was identified as a continued area of focus for 2025. The Board's oversight of risk and risk management rated highly, with risk appetite and risk mitigation continuing to be a priority. The Board's oversight of the development of senior talent and success planning rated highly, with the process considered to be well organised.
Management of meetings
Themes included continued: (i) focus on interaction between Non-executive Directors and EC members to more fully leverage the skills of individual Non-executive Directors as appropriate outside of the formal Board setting; and (ii) engagement with external speakers to bring diverse and external perspectives into the boardroom on key issues facing Shell.
Overall, the Board was found to be functioning well, with a high level of commitment from both the Non-executive and Executive Directors. There are good personal relationships, amid a collegial spirit, with a high degree of mutual respect. Directors are able to share opinions and offer guidance and feel that they are heard. The agenda has been broad and the committees have complemented the Board agenda to ensure that the Board has covered the areas viewed to be key.
Governance | Governance framework continued
Feedback themes for the committees
The committees were considered to be well chaired and well operated and received excellent input from senior management. All committee reviews provided focus on meeting management and effectiveness, oversight, and performance improvement opportunities. Each committee analysed topics specific to their respective forum. The committees also provided feedback on the implementation of recommendations from the 2023 evaluation process.
Chair evaluation
The Deputy Chair communicated feedback to the Chair, who was considered to have built and maintained strong relationships with the Executive and Non-executive Directors. He was also thought to communicate well, be constructive and open at all times, encouraging all Board members to make a full contribution to discussions. References to his accessibility and openness to input from others were made and these are valued across the Board.
Delivery against the 2024 ambitions
The Board continued to focus on being a well-functioning Board and spent additional time on strategic matters, including with respect to the implementation of ETS24 and the continued delivery on CMD23, focusing on shareholder value and operating expenditure efficiencies. With respect to risk oversight, the Board continued to optimise the work of both the Board and the Audit and Risk Committee on risk-related matters.
Planned enhancements for 2025
The 2024 Board evaluation provided areas of focus or priorities for 2025, including: (i) CMD25 and longer-term strategy; (ii) continued Non-executive Director engagement with members of the EC outside the formal Board setting; and (iii) continued engagement with external speakers to bring diverse and external perspectives to the boardroom on key issues facing Shell. Other items identified which are already being progressed in 2025 include enhancement of Board skills and capabilities; further focus on risk appetite and risk mitigation; and continued improvement to pre-read materials.
Nomination and Succession Committee
| | | | | | | | |
| | |
| Focus areas for 2024 ○Non-executive Director and Executive Committee succession. ○In-depth Board Dynamics review, as part of annual Board and Committee evaluation, to accelerate effectiveness. ○Continued talent engagements with key staff and succession candidates. | |
| | |
| | | | | | | | |
| | |
| Priorities for 2025 ○Non-executive Director and Executive Committee succession. ○Continued talent engagements with key staff and succession candidates. ○Externally facilitated Board and committee evaluation. | |
| | |
Sir Andrew Mackenzie
Chair of the Nomination and Succession Committee
| | | | | | | | | | | | | | | | | | | | |
| | | | | | |
| Committee membership and attendance for 2024 | |
| | | |
| | | |
| | | | | | |
| Committee member | Member since | Meetings attended | % of meetings attended | |
| Sir Andrew Mackenzie (Chair of the Committee) | October 1, 2020 | 4/4 | 100% | |
| Dick Boer | May 19, 2021 | 4/4 | 100% | |
| Ann Godbehere | October 27, 2021 | 4/4 | 100% | |
| | | | | | |
Purpose
The Nomination and Succession Committee (the "NOMCO") leads the process for appointments to the Board and Senior Management [A] positions, ensures plans are in place for orderly, well-planned succession, and oversees the development of a diverse succession pipeline of candidates. It also reviews the Company's policy, targets and strategy on diversity, equity and inclusion (DE&I), and monitors the effectiveness of these initiatives. It makes recommendations to the Board on corporate governance guidelines, as referred to in the Chair's introduction.
[A]In this section of the report, "Senior Management" refers to the Executive Committee and the Company Secretary, as defined by the UK Corporate Governance Code.
Talent management and succession
The NOMCO is fully engaged with the end-to-end talent management and senior succession planning approach that is deployed within Shell. It plays a key role in senior succession and resourcing. Retaining in-depth knowledge of the individuals within the talent pipeline is a NOMCO priority. The NOMCO makes time to personally meet and engage with numerous individuals within the pipeline. The NOMCO's oversight and input extend from recruitment to leadership identification and from leadership development to leadership appointment, all of which are underpinned by clearly articulated talent priorities and a commitment to advancing DE&I across Shell.
The NOMCO manages Board and supports Senior Management succession under a structured, proactive methodology. The processes have clear and agreed selection principles for short-, medium- and long-term succession and are aligned with Shell's strategic priorities.
For Non-executive Director succession, the NOMCO continues to follow its Principles for the Strategic Composition of the Board, adding factors as they evolve. These principles include both quantitative and qualitative principles, considering:
○the overall aspired Board composition and diversity of age; gender; race; ethnicity; educational, social, geographical and professional backgrounds; skills; knowledge; and experience that align with the Company's strategy including among other criteria consideration of the skills and strengths needed for the energy transition; and
○the values, attitudes, and behaviours expected of Directors.
Governance | Nomination and Succession Committee continued
During the year, the Principles for the Strategic Composition of the Board were reviewed and updated. The NOMCO also focused on the future needs for the Board's composition, including size and tenure, skills and experience, and the DE&I requirements of the UK Listing Rules, FTSE Women Leaders and the Parker Review. The current size of the Board was considered to be appropriate, also taking account of Committee memberships. Greater flexibility around Non-executive tenure continues to be an area of focus. Although Shell does not publish its Principles for the Strategic Composition of the Board, its Board Diversity Policy (which was first published in March 2024) is available on the Company's website. This Policy highlights that Shell aims for a gender balance on the Board, with at least one senior Board position (Chair, CEO or CFO) held by a woman. In addition, Shell's target is to maintain the representation of both men and women at, or above, a minimum of 40% [B].We believe that this allows Shell to be truly representative of all genders and gender identities and provides flexibility during periods of change. Further, Shell aims to maintain or exceed having at least one Board member from a minority ethnic background. For more details on the progress against these targets see page 165.
[B]These targets align with those set by the FCA under the UK Listing Rules, and all such targets on Board diversity remain subject to applicable equalities legislation, including the Equality Act 2010 (as amended from time to time) and its provisions on discrimination.
| | | | | |
| |
| See "Our People" on page 133. |
| |
For Senior Management succession, the selection principles include process-specific elements, such as a clear and proactive approach to identifying and developing succession candidates. The principles also outline the long-term structured nature of the succession planning process. There is also strong focus on ensuring that the principles reflect the leadership qualities required for future business success and that they advance the progress of diversity in all its forms.
Senior Management principles feature in the NOMCO's review of the succession plans which occurs in every committee meeting. Using the principles, the NOMCO implements any changes through a well-defined and diligent process with overall Board engagement. The NOMCO agrees on candidate profiles and meets prospective candidates well ahead of any selection decision being necessary. It also engages the Board early in the process to ensure all Directors have an opportunity to meet and assess prospective candidates. Consequently, some of the leaders with whom the NOMCO and Board engaged extensively in the past became or are about to become members of the Board (Wael Sawan and Sinead Gorman) or the Executive Committee (most recently, Andrew Smith, Machteld de Haan,Cederic Cremers and Peter Costello whose appointments are effective April 1, 2025).
During 2024, the NOMCO's annual in-depth look at the status and succession plans for Senior Management within Shell, along with the review of the talent pipeline in line with the business, was undertaken by the full Board. The Board reflected on the simplification of the senior leadership structure with clear accountabilities achieved in 2024 with a view to the further evolvement of the composition of the total workforce and of the organisation's culture as an enabler for performance.
Diversity of leadership
The NOMCO recognises that continuing to improve all types of diversity at each level of the Shell Group is crucial. Shell aims to be an inclusive workplace where everyone feels valued and respected and has a strong sense of belonging. The NOMCO's review of diversity objectives and strategies for the Shell Group as a whole also monitors the impact of diversity and inclusion initiatives.
In February 2021, Shell published its aspirations for DE&I under the Powering lives goal, with a focus on four areas of gender, race and ethnicity, LGBT+ and disability inclusion. For more details on the progress against our ambitions for women hired and women in Senior Leadership, see pages 132-133.
"Senior Leadership" is a Shell-specific measure based on compensation grade levels. This is different from what we are required to report under the Code, which is female representation in Senior Management and their direct reports, where the percentage is 32%.
Nationality diversity, such as Asian and American talent, continues to be managed in accordance with the business outlook and we have a strong focus on progressing race and ethnic minority representation.
In line with the recommendations from the 2023 Parker Review, Shell has reviewed its ambitions for ethnic minority representation at the Senior Management level and aims for 15% Senior Management positions [C] to be occupied by ethnic minority executives by December 2027. As at the end of 2024, 15% of Shell's Senior Management identifies as being from an ethnic minority group.
[C]Senior Management here refers to senior leadership based in the UK and is a Shell measure based on compensation grade levels. We have moved to this Shell definition of Senior Management for 2024 onwards to align with our self-identification data collection and processes.
Although the NOMCO monitors Shell's organisational DE&I strategies and initiatives, it also holds itself accountable for the Board's own diversity and inclusion. Back in 2020, the Board's diverse composition met the Hampton Alexander requirements (now FTSE Women Leaders) and, in 2024, it met the Parker Reviews' objectives by reflecting 42% women representation with three Directors from a minority ethnic background. Shell's Board diversity is aligned with the targets set by UK Listing Rules. The position of CFO is held by a woman and three Directors are from a minority ethnic background.
| | | | | |
| |
| See "Powering lives" on pages 132-134 for more information on DE&I in Shell. |
| |
Governance | Nomination and Succession Committee continued
The People Strategy and diversity, equity and inclusion
Diversity continued to be a key area of focus during the year. In 2024, Shell published a new Board Diversity Policy further to a recommendation by the NOMCO. The policy is aligned to the requirements of the UK Corporate Governance Code and includes our targets for Board diversity, as well as complementing Shell's wider diversity policies and embracing Shell's values, Code of Conduct and sustainability goals. Currently, this policy is not applied to the individual Committees, although we strive to apply diverse representation across the Committees. DE&I across Committee membership remains an ongoing consideration. A copy of the Board Diversity Policy is available on our website, shell.com/investors/environmental-social-and-governance/board-of-directors.
In relation to Board director appointments and diversity, the NOMCO oversees the development of a diverse pipeline for succession to the Board and monitors that all Board appointments are subject to a formal, rigorous and transparent procedure and that such appointments are based on merit and objective criteria taking into account (among other things) factors such as diversity of gender, age, educational and professional background, social, ethnic and geographical background and cognitive and personal strengths.
To this end, the NOMCO is responsible for engaging an independent executive search consultant, who assists in preparing shortlists of candidates, co-ordinating interviews and seeking references. In accordance with the Board Diversity Policy, the NOMCO only engages with external search firms who are able to align with Shell's approach to DE&I in identifying suitable individuals from diverse pools of candidates.
Under the Board Diversity Policy, the Board commits to:
○Ensuring an inclusive environment: Through inclusive behaviours and practices, we aim to create an environment in which every Board member feels valued, respected and empowered to contribute fully.
○Ensuring support for External Best Practices: The Board endorses and supports external best practices, such as the FTSE Women Leaders Review, Parker Review and others, to maintain and enhance diversity within the Board.
○Ensuring that Board appointments are managed with rigour and transparency: Candidates are evaluated based on merit, skills, experience, qualifications, performance and business considerations, with due regard for diversity factors.
○Ensuring regular Board composition reviews: The Board regularly assesses the composition of the Board, including age, gender, race, ethnicity, educational, social, geographical and professional backgrounds, skills, knowledge and experience, making recommendations for necessary adjustments.
Shell has an inclusive Board environment, comprising individuals that are suitably qualified. They have the required skills, industry expertise, breadth of perspective and high-quality decision-making capabilities to support the strategy and overall direction of Shell.
| | | | | |
| |
| See "The Board of Shell plc" on pages 149-153 for details about the skills and backgrounds of individual members. |
| |
From a gender perspective, the Board comprises five female directors and seven male directors, which equates to 42% female representation (2023: 42%, 2022: 55%). Two of the four main Board committees are chaired by a female director.
While the Board aspires to achieve gender parity, progress against diversity targets is sensitive to the size of the Board. In respect of other forms of diversity, three members of the Board self-identify as being from an ethnic minority background [D]. In accordance with the Board Diversity Policy, the Board firmly believes that diversity fosters a broader range of perspectives, resulting in improved Board effectiveness, decision-making and outcomes.
[D]Ethnic minority refers to an individual who self-identifies as Asian, Black, Mixed/multiple, or other ethnic minority group, in line with UK Office for National Statistics classifications
Governance | Nomination and Succession Committee continued
In addition to its considerations regarding succession, the NOMCO made recommendations on corporate governance guidelines, monitored compliance with corporate governance requirements and made recommendations on corporate governance-related disclosures.
The NOMCO continues to monitor and review this area, considering whether and how current Company governance matters should be strengthened. Further insight on some of the NOMCO's areas of consideration in 2024 is provided below.
| | | | | |
| Topic of discussion/example of Committee activity |
Succession [A] |
| Recommendation | ○Changes to the composition of the Board committees. ○Appointment of Company Secretary. |
| Oversight | ○Shell diversity, equity and inclusion and the Board Diversity Policy. |
| Engagement | ○Talent engagements. |
| | | | | |
| Topic of discussion/example of Committee activity |
| Talent overview and senior succession review |
Shell Senior Succession and Resourcing Review covering Executive Director and EC succession, EC direct reports, the senior executive group and the overall talent pipeline | ○Enhanced insight on Shell talent and future leaders. ○Assurance of robust succession and contingency plans. |
| | | | | |
| Topic of discussion/example of Committee activity |
| Board membership and other appointments |
Directors' tenure, external commitments, conflicts of interest and succession planning | ○Non-executive Director appointments and changes to committee membership. |
| | | | | |
| Topic of discussion/example of Committee activity |
| Governance |
| Regulation, legislation and other governance-related guidance | ○Reviewed its Terms of Reference, and the Terms of Reference for other Board committees and the Matters Reserved for the Board. ○Received corporate governance updates, including with respect to the UK Corporate Governance Code. |
| Shell plc matters | ○Considered any potential conflicts of interest and the independence of the Non-executive Directors. ○Reviewed additional external appointments requested by Directors, with specific focus on the time allocated to all commitments. ○Determined the process for the 2024 Board Dynamics review and internal Board Evaluation (see page 161 for an overview of the process and the outcome of the evaluation). |
[A]The NOMCO was assisted during 2024 by Russell Reynolds Associates ("Russell Reynolds") and, more recently, by Korn Ferry (UK) Limited ("Korn Ferry"), both of which are external global search companies whose main role was to propose suitable candidates. Neither Russell Reynolds nor Korn Ferry has any connection with the Company other than that of search consultants. The Chair does not participate in discussions regarding his own succession. Russell Reynolds and Korn Ferry are signatories to The Voluntary Code of Conduct for Executive Search Firms, which aims to improve board diversity.
| | | | | | | | |
| | |
| Executive Committee succession The NOMCO undertakes comprehensive engagement to understand who the candidates are for senior roles, what personally drives them and how they will ensure Shell achieves its strategic ambitions. Succession for senior roles is planned well in advance and reviewed regularly. Succession planning is a crucial, ongoing consideration and not just an area of focus when an Executive Committee (EC) member change is anticipated. The Board oversees Shell's succession planning process in which selection is the final step of a rigorous, sophisticated and well-planned process. For Executive Director and EC appointments, the NOMCO has set a structured process: ○Before any potential decision on resourcing, it explicitly describes the requirements of the role and the candidate profile. ○By working in a planned, consistent manner, last-minute surprises are avoided and well-considered decisions are made in line with evolving business requirements. ○It also plans for the unexpected and maintains a list of candidates capable of stepping into senior roles to provide cover if necessary. The NOMCO spends time getting to know the candidates to ensure that the pipeline is robust, diverse and adaptive. The NOMCO ensures it has visibility of today's and tomorrow's leaders. Over the last few years, the NOMCO has met many leaders and had extensive engagements with each of them. Some of these leaders now sit on the EC, others were appointed to the Board (Wael Sawan and Sinead Gorman). The NOMCO engages across the executive talent pipeline to ensure it interacts with and becomes familiar with talent at different levels of the organisation; for example, on a regular basis informal engagements are held with employees from a range of businesses, functions and backgrounds prior to a Board meeting. Not only does this engagement support senior succession, it also provides a helpful element of the NOMCO's workforce engagement. The Board is proud that candidates for the most senior leadership roles have primarily come from within the business, demonstrating that the leadership development and succession process remains effective. | |
| | |
Sustainability Committee
| | | | | | | | |
| | |
| Focus areas for 2024 ○Shell's sustainability progress. ○Respecting nature. ○Powering lives. ○Emerging non-financial risks. | |
| | |
| | | | | | | | |
| | |
| Priorities for 2025 ○Shell's sustainability performance. ○Respecting nature. ○Powering lives. ○Emerging non-financial risks with a focus on nature and social elements. | |
| | |
Purpose
The roles and responsibilities of the Sustainability Committee (the "SUSCO") are set out in its Terms of Reference, which were last reviewed and revised in December 2024. A copy is available on shell.com.
The updated Terms of Reference revise the SUSCO's Purpose to assist
the Board of Directors in fulfilling its responsibilities by reviewing the performance of Shell with respect to sustainability, reviewing and monitoring relevant emerging trends including regulatory developments in sustainability, and reviewing and monitoring the non-financial elements of Shell's strategy, with a focus on nature and social elements.
"The SUSCO focused on Shell's sustainability progress in 2024, with particular attention to Respecting nature and Powering lives."
Catherine J. Hughes
Chair of the Sustainability Committee
| | | | | | | | | | | | | | | | | | | | |
| | | | | | |
| Committee membership and attendance for 2024 | |
| | | |
| | | |
| | | | | |
| | | | | | |
| Committee member | Member since | Meetings attended | % of meetings attended | |
| Catherine J. Hughes (Chair) | November 1, 2017 | 4/4 | 100% | |
| Neil Carson OBE | June 1, 2019 | 4/4 | 100% | |
| Bram Schot | October 1, 2020 | 4/4 | 100% | |
| Jane Holl Lute | May 24, 2022 | 4/4 | 100% | |
| Leena Srivastava | March 13, 2023 | 4/4 | 100% | |
| | | | | | |
Overview
The SUSCO meets regularly to review performance on sustainability with focus on Respecting nature and Powering lives.
The SUSCO also reviews selected sustainability topics and matters of public concern and helps the Board review existing and emerging impacts, risks and opportunities including regulatory developments.
As directed by the Board, the SUSCO may also review environmental, social and governance (ESG) and safety matters in more detail.
The SUSCO also reviews and considers external stakeholder perspectives on sustainability issues of relevance to the Group's business.
In line with the strategic importance of the SUSCO's agenda, the Chair of the Board and the CFO attend committee meetings.
Activities
During 2024, the SUSCO reviewed the progress made on sustainability including progress on Respecting nature and Powering lives.
The sustainability topics and matters of public concern considered in particular depth by the committee included biodiversity, nature-based solutions and methane emissions.
The SUSCO provided input to Shell's annual reporting and disclosures on sustainability. The SUSCO Chair held meetings during the year with senior leaders to discuss specific topics.
Site visits
In 2024, members of the SUSCO visited Brazil, Qatar and Oman as part of Board site visits. These visits deepen directors' understanding of how the Company's strategy is being implemented. Members of the SUSCO give particular attention to sustainability topics during these visits. See Board activities on pages 156-156 for further information in relation to Board site visits.
Audit and Risk Committee Report
Dear Shareholders,
I am pleased to present our Audit and Risk Committee (the ARC) Report for 2024.
The ARC assists the Board in fulfilling its oversight responsibilities in areas such as the integrity of financial reporting, the effectiveness of risk management and internal controls, as well as the consideration of ethics and compliance matters. We are responsible for assessing the quality of the audit performed by, and the independence and objectivity of, the external auditor. The ARC also makes a recommendation to the Board on the appointment or reappointment of the external auditor. In addition, we oversee the work and quality of the internal audit function.
Our work programme over the course of a year focuses on a variety of matters that involve a high degree of judgement and/or are significant to Shell's Consolidated Financial Statements. We review with management the sources of estimation uncertainty and other key assumptions against the backdrop of economic and market uncertainty and volatility, climate risk and the energy transition and evolving stakeholder expectations. In addition, we consider the robustness of the risk and internal control framework, results of internal control testing performed throughout the year, and remediation activities.
"The primary role of the ARC is to assist the Board in fulfilling its oversight responsibilities in areas such as the integrity of financial reporting, the effectiveness of risk management and internal controls, as well as the consideration of ethics and compliance matters."
Ann Godbehere
Chair of the Audit and Risk Committee
Topics addressed in 2024 included: deferred taxes and tax exposures; the impact on tax balances and disclosures as a result of windfall and minimum taxes around the world; significant portfolio developments; litigation; impairment trigger assessments; impairment charges and reversals; accounting for complex contracts; dividend distribution capacity; and mark-to-market derivatives accounting, including the impact of volatile gas and power markets.
We received briefings from the Chief Internal Auditor on the outcomes of significant audits and notable control matters. We also received briefings from the Chief Internal Auditor and the Executive Vice President (EVP) Controller on the effectiveness of Shell's risk management and internal control system.
The impacts of climate change and the energy transition continue to touch on many aspects of the ARC's work, including the financial statement impacts. The ARC also considered sustainability-related disclosures required in accordance with the Corporate Sustainability Reporting Directive (CSRD)
The ARC, recognising the evolving nature of climate change risks and responses, concluded that climate change has been appropriately considered by management in key judgements and estimates and agreed with the disclosure made by management.
As noted in last year's report, during 2023, the tender process for the appointment of the external auditor was commenced, with a view to reaching a conclusion during 2024. We completed the process during 2024 and the ARC recommended to the Board that EY be re-appointed as the Company's external auditor in respect of the financial year ending December 31, 2026. Further information with respect to this process is set out on page 178.
During 2024, the ARC received updates on the implementation of the Shell Performance Framework. Focus topics for 2024 included Trading and Supply; CSRD implementation, Shell's Carbon Management Framework, regulatory developments, for example in relation to UK corporate governance reforms, fraud and sustainability reporting regulations; information risk management, including cyber security; and pensions.
As part of its oversight of compliance with applicable legal and regulatory requirements, including monitoring ethics and compliance risks, the ARC discussed with the Group Chief Ethics and Compliance Officer activities undertaken in the ethics and compliance programme related to compliance with data privacy laws and regulations and artificial intelligence (AI), and steps taken to manage those risks.
In 2024, members of the ARC visited Oman, Qatar and Brazil as part of Board site visits. These site visits deepen directors' understanding of risks and opportunities, as well as their understanding of how the Company's strategy is being implemented.
On a final note, the ARC recognises the strong commitment and dedication of the financial and non-financial reporting teams and would like to thank them for all their efforts during 2024.
Ann Godbehere
Chair of the Audit and Risk Committee
March 25, 2025
Governance | Audit and Risk Committee Report continued
| | | | | | | | |
| | |
| Focus areas for 2024 ○External audit tender. ○Information risk management, including cyber security. ○CSRD implementation. ○Regulatory developments, including corporate governance reforms, fraud and sustainability reporting regulations. ○Trading and Supply. ○Carbon Management Framework. ○Pensions. | |
| | |
| | | | | | | | |
| | |
| Priorities for 2025 ○Trading and Supply. ○Regulatory developments, including corporate governance reforms, fraud and sustainability reporting regulations. ○Information risk management, including cyber security. ○Pensions. ○Treasury. | |
| | |
| | | | | | | | | | | | | | | | | | | | |
| | | | | | |
| Committee membership and attendance for 2024 | |
| | | |
| | | |
| | | | | |
| | | | | | |
| During 2024, the members and meeting attendance of the ARC were as follows: | |
| Committee member | Member since | Meetings attended | % of meetings attended | |
| Ann Godbehere (Chair) | May 23, 2018 | 6/6 | 100% | |
| Dick Boer | May 20, 2020 | 6/6 | 100% | |
| Cyrus Taraporevala | March 2, 2023 | 6/6 | 100% | |
| Sir Charles Roxburgh | March 13, 2023 | 6/6 | 100% | |
| Catherine J. Hughes | May 23, 2023 | 6/6 | 100% | |
| [A]In addition to the six meetings, as part of its activities in 2024, the ARC held additional meetings in relation to the external audit tender process. | |
| | | | | | |
All ARC members are financially literate, independent Non-executive Directors. In respect of the year ended December 31, 2024, for the purposes of the UK Corporate Governance Code, Ann Godbehere qualifies as: a person with "recent and relevant financial experience" and competence in accounting, and, for the purposes of US securities laws, an "audit committee financial expert".
The experience of the ARC members outlined on pages 149-153 demonstrates that the ARC as a whole has competence relevant to the sector in which Shell operates, and the necessary commercial, regulatory, financial and audit expertise required to fulfil its responsibilities. The ARC members have gained further knowledge and experience of the sector as a result of their Board membership and through various in-person and virtual site visits since their respective appointments.
The ARC invites the CFO, the Legal Director, the Chief Internal Auditor, the EVP Controller, the Vice President Group Appraisal and Reporting and Deputy Controller and the external auditor to attend each meeting. The CEO, the Chair of the Board and the Company Secretary may also attend ARC meetings. Other members of management attend when requested on specific topics or to provide input on more detailed technical matters that may arise. The ARC regularly holds private sessions separately with the Chief Internal Auditor and the external auditor without members of management present (except for the Legal Director who may attend). Outside of the formal ARC meetings, the Chair of the ARC meets regularly with each of the following: the CFO, the EVP Controller, the Chief Internal Auditor and the external auditor.
Committee remit
The roles and responsibilities of the ARC are set out in its Terms of Reference and are reviewed annually (last reviewed and updated in December 2024, a copy of which can be found on shell.com). The key responsibilities of the ARC include, but are not limited to:
Risk management and internal control
○assisting the Board in reviewing the emerging, principal and other significant risks facing the Group;
○monitoring the effectiveness of the risk management and internal control framework;
○reviewing proposed related party transactions as described within the Terms of Reference.
Financial reporting
○reviewing the integrity of the financial statements, including annual reports, half-year reports and quarterly financial statements;
○reviewing the potential impacts on the consolidated financial statements of the implementation of the Company's strategy, climate change and the energy transition;
○advising the Board whether, in the ARC's view, the Annual Report taken as a whole is fair, balanced and understandable and provides the information necessary for shareholders to assess the Company's position and performance, business model and strategy;
○reviewing and discussing with management the appropriateness of judgements involving the application of accounting principles and disclosure rules;
○providing oversight in respect of material non-financial reporting disclosures with respect to corporate sustainability as applicable to the Company's annual reports, half-yearly reports and quarterly results releases;
○reviewing management's assessment of going concern and longer-term viability;
○reviewing, in conjunction with management, the Company's policies with respect to earnings releases, financial and non-financial performance information and earnings guidance provided to investors and financial markets.
Governance | Audit and Risk Committee Report continued
Compliance and governance
○reviewing the functioning of the Shell Global Helpline and reports arising from its operation;
○overseeing compliance with applicable legal and regulatory requirements, including monitoring ethics and compliance risks.
Internal audit
○monitoring the qualifications, expertise, resources and independence of the internal audit function;
○approving the internal audit function's charter and the annual internal audit plan to ensure alignment with the key risks of the business;
○reviewing with the Chief Internal Auditor, the Company's management and the external auditors any significant matters arising from internal audits and assessing management's response to internal audit findings and control weaknesses as appropriate, including potential improvements and agreed actions;
○assessing internal audit's performance and effectiveness each year.
External audit
○reviewing and monitoring the independence and objectivity of the external auditor;
○considering the annual external audit plan and approving related remuneration, including fees for audit and non-audit services;
○assessing the performance and effectiveness of the external auditor and the audit process, including an assessment of the quality of the audit; and
○recommending to the Board that it put to the Company's shareholders for approval at the Annual General Meeting (AGM) a resolution to appoint, reappoint, or remove the external auditor.
The ARC's responsibilities as set out in its Terms of Reference form the basis of the ARC's annual work plan, which is adjusted as appropriate throughout the year. In addition, the ARC annually identifies certain business and function areas to focus on during that year. The focus areas generally encompass aspects of risk management and internal control, financial reporting and compliance. The ARC is authorised to seek any information it requires from management and external parties and to investigate issues or concerns as it deems appropriate. The ARC may also obtain independent professional advice at the Company's expense. No such independent advice was requested in 2024.
The ARC keeps the Board informed of its activities and recommendations, and the Chair of the ARC provides an update to the Board after every ARC meeting. The ARC discusses with the Board if it is not satisfied with or believes that action or improvement is required concerning any aspect of financial reporting, risk management and internal control, compliance or audit-related activities.
The ARC met with senior leaders from various business and function areas to discuss the adequacy, design and operational effectiveness of risk management and controls related to the critical activities carried out by their respective business or function. The discussions included information on any enhancements to strengthen controls and how areas identified for improvement had been addressed; the monitoring of activities around key risks; and the steps being taken to identify new or emerging areas of risk.
In addition to the significant accounting and reporting considerations discussed on pages 173-174 the business and function areas reviewed by the ARC in 2024 included the following:
○Shell Performance Framework -- the ARC received updates on progress with the implementation of the Shell Performance Framework (SPF) following its introduction in July 2023. The ARC discussed with management how the SPF is being applied in practice, including simplification of standards and cultural change from a performance, discipline and simplification perspective.
○Trading and Supply (T&S) – the ARC was briefed in relation to the T&S organisational mandate, governance and oversight committees, including in relation to financial risk management and stress-testing. The ARC also received an update regarding process, data and transformation systems.
○CSRD implementation -- the ARC received regular updates in relation to the additional disclosures required by the CSRD, including the challenges with the reporting, the double materiality assessment and assurance requirements.
○Regulatory developments – the ARC was briefed regularly regarding regulatory developments and their implications for Shell, including for example, in the UK, in relation to the 2024 Corporate Governance Code and the Economic Crime and Corporate Transparency Act 2023. In addition to CSRD, the ARC was briefed in relation to other UK, US and EU sustainability reporting developments.
○Pensions – the ARC received an overview of the pensions landscape, including the defined benefit landscape, and was updated in relation to the transfer of certain US pensions liabilities which was completed in January 2024 and proposals in relation to the Dutch pension arrangements.
Site visits
During the year, members of the ARC visited Oman, Qatar and Brazil as part of Board site visits.
Governance | Audit and Risk Committee Report continued
| | | | | | | | |
Risk management and internal control | | |
The ARC assists the Board in reviewing the emerging, principal and other significant risks facing the Group and in fulfilling its responsibilities in relation to risk management and internal control. In order to monitor the effectiveness of the procedures for internal control over financial reporting, compliance and operational matters, the ARC reviews reports on risks, controls and assurance, including the annual assessment of the system of risk management and internal control. The ARC also reviews management's evaluation of the internal control of financial reporting as required under Section 404 of the Sarbanes-Oxley Act (SOX 404). The ARC updated the Board on compliance with internal controls across the Shell Group and on any major matters for which action or improvement was recommended.
| | | | | |
| Activities performed | Frequency |
| Risk management and internal control | |
Review the emerging, principal and other significant risks facing the Group. | P |
| Review the policies and practices and monitor the effectiveness relating to Shell's risk management and internal control system. | P |
| Receive briefings on regulatory developments. | P |
| Review management's SOX 404 assessment. | P |
Discuss significant matters arising from completed internal audits with the Chief Internal Auditor, management and the external auditors. | Q |
| Assess management's responses to significant audit findings, recommendations and notable control weaknesses, including potential improvements and agreed actions. | P |
| Review significant legal matters with Shell's Legal Director. | P |
| Review the oil and gas reserves control framework. | A |
| Review Shell's information risk management. | P |
Review Shell's tax function, key tax risks and Shell's approach to the evolving area of tax transparency. | P |
A = Annually Q = Quarterly P = Periodically
Throughout the year, the ARC and management discuss Shell's overall approach to risk management and internal control, including compliance, tax and information risk management matters and the adequacy of disclosure controls and procedures. The ARC receives regular reports from the EVP Controller on the status of actions to address control weaknesses identified via business control incidents and the trends in other measures used to monitor the robustness of the risk management framework and internal control systems.
| | | | | |
| |
| The ARC is also briefed on litigation and other matters (see Note 32 to the "Consolidated Financial Statements" on pages 292-294 and "Governance framework" on page 160). |
| |
For 2024, reviews included overall assessment of the risk landscape, including controls, exception reporting and SIAI observations as well as deep dives on specific areas. The ARC also regularly reviews the status of management's SOX 404 testing of controls and remediation actions to address any identified weaknesses. The ARC and management also discussed the steps taken to maintain an effective control environment and to further demonstrate "management in control" during the year.
It is important that the ARC monitors and learns about relevant evolving external developments in a timely fashion. Accordingly, the ARC is regularly briefed on developments in the legal, regulatory and financial reporting landscape that could affect the Company.
In 2024, the ARC dedicated time to the following topics:
○Tax risks – In addition to the regular review of Shell's tax provisions, the ARC received updates regarding developments in the external tax landscape, including windfall and minimum taxes and how different jurisdictions are seeking to incentivise investment when entering new markets and businesses. Management outlined for the ARC the steps being taken to manage tax risks and exposures arising from differing viewpoints on complex tax laws.
○Information risk management, including cyber security – The ARC was briefed in relation to Shell's information risk management framework, against the backdrop of a deteriorating external threat environment and evolving global regulatory landscape, including SEC cyber-security disclosure rules.
○Oil and gas reserves control framework – The ARC annually reviews the framework that supports Shell's internal reporting and external disclosures of oil and gas reserves. The ARC also reviews the processes and controls that prevent and/or mitigate the risks of
non-compliance with regulatory reporting requirements. This annual review of Shell's oil and gas reserves control framework supports the ARC's review of Shell's reported proved oil and gas reserves discussed later in this report.
In addition to the above, the ARC also had quarterly discussions with the Chief Internal Auditor regarding the Company's risk management and internal control system, significant matters arising from the internal audit assurance programme and management's response to internal audit findings and control weaknesses, including potential improvements and agreed actions.
The ARC similarly holds discussions with EY, the external auditor, on a quarterly basis regarding how risks to audit quality are addressed, key accounting and audit judgements, results from audit procedures and management's response to any significant audit findings and any material communications between EY and management.
Governance | Audit and Risk Committee Report continued
The ARC receives comprehensive reports from management and the external auditor on quarterly, half-yearly and annual financial reporting, accounting policies and areas of significant judgements and other reporting matters.
| | | | | |
| Activities performed | Frequency |
| Financial reporting | |
| Review Shell's accounting policies and practices, including compliance with accounting and reporting standards. | Q |
| Assess the appropriateness of key judgements and the interpretation and application of accounting principles. | Q |
| Review the potential impact on the consolidated financial statements of the implementation of the Company's strategy, climate change and the energy transition. | P |
| Consider the integrity of the year-end financial statements and recommend to the Board whether the audited financial statements should be included in the annual and statutory reports. | A |
Consider the integrity of the half-year report and quarterly financial statements. | Q |
| Review management's assessment of going concern and longer-term viability. | Q |
| Review Shell's policies with respect to earnings releases; financial and non-financial performance information and earnings guidance; and significant financial reporting matters. | Q |
| Review Shell's policies with respect to oil and gas reserves accounting and reporting including the outcome of the oil and gas reserves booking/debooking process. | A |
| Review the internal controls for financial reporting. | P |
Advise the Board of the ARC's view on whether, taken as a whole, the Annual Report is fair, balanced and understandable and provides the information necessary for shareholders to assess Shell's position and performance, business model and strategy. | A |
A = Annually Q = Quarterly P = Periodically
The ARC reviewed the Company's 2024 quarterly unaudited interim financial statements, half-year report, Annual Report and Form 20-F with management and the external auditor.
Shell uses alternative performance measures (APMs) to provide greater insights into its financial and operating results. The ARC regularly considers the APMs used in Shell's reporting, the reconciliations to IFRS financial statements and explanations for changes from the previous quarter and year. The ARC reviews the overall presentation of APMs with management to ensure they are not given undue prominence. The ARC discusses adjusting items with management including any changes to methodology.
The APMs disclosed by Shell are subject to the same internal control process as applied for other financial reporting.
The Committee discussed the audited financial statements with management and the external auditor. The Committee advised the Board that in its view the 2024 Form 20-F including the financial statements for the year ended December 31, 2024, taken as a whole, provides the information necessary for shareholders to assess Shell's position and performance, business model and strategy. The Committee also advised the Board that in its view, the inclusion of the audited financial statements in the 2024 Form 20-F is appropriate. To reach this conclusion, the Committee critically assessed drafts of the 2024 Form 20-F including the financial statements and reviewed with management the process for ensuring compliance with applicable requirements. This process included: verifying that the contents of the 2024 Form 20-F are consistent with the information shared with the Board during the year to support their assessment of Shell's position and performance; ensuring that consistent materiality thresholds are applied for favourable and unfavourable items; considering comments from the external auditor; and receiving assurance from the Executive Committee (EC). The Committee also reviewed and considered the Directors' half-year and full-year statements with respect to the going concern basis of accounting. The Committee and the external auditor also discussed matters regarding the audit and the quality of the accounting judgements employed by management.
Governance | Audit and Risk Committee Report continued
| | | | | | | | |
Financial Reporting continued | | |
Significant accounting and reporting considerations
The ARC assessed the following significant accounting and reporting areas, including those related to Shell's 2024 Consolidated Financial Statements. The ARC was satisfied with how each of the areas below was addressed. As part of this assessment, the ARC received reports, requested and received clarifications from management, and sought assurance and received input from the internal and external auditors.
| | | | | | | | |
Issue | | Committee activity and outcome |
| Climate change and energy transition | | |
Risks related to climate change and the energy transition are regularly monitored to ensure impacts are reflected within Shell's financial statements. The external landscape related to non-financial disclosures continues to evolve. In the absence of one global standard for climate-related reporting there are growing demands from various regulatory and voluntary bodies all with their own expectations for disclosures. | | The ARC discussed with management key regulatory requirements including (but not limited to) the EU, ISSB, and SEC disclosure requirements and their implications or potential implications for Shell's external disclosures. The ARC reviewed Note 4 to the "Consolidated Financial Statements" summarising the key climate risk impacts on the Consolidated Financial Statements as well as the impairment sensitivity disclosures using price outlooks based on different climate change scenarios, including external scenarios. |
| See Note 4 to the "Consolidated Financial Statements" on pages 237-249. |
| The ARC was briefed on the non-financial reporting external landscape developments and regulatory requirements. In this connection, the ARC considered the potential implications required for Shell's external disclosures going forward. The ARC reviewed regulatory sustainability disclosures including the new CSRD disclosures within the "Sustainability Statements" section, and other non-financial disclosures as part of the Annual Report review. The ARC was also briefed on the EU Taxonomy disclosures included within the "Supplementary Information" section. |
| Updates regarding climate change and energy transition risk factor have been included on pages 27-28. |
Impairment and impairment reversals | | |
The carrying amount of an asset should be tested for impairment or impairment reversal whenever events or changes in circumstances indicate that the recoverable amount for that asset may have changed, for example if there is a change in the outlook for commodity prices or refining margin assumptions, or in the event of revisions to future activity plans and developments. On classification as held for sale, the carrying amounts of property, plant and equipment (PP&E) and intangible assets must also be reviewed. | | The ARC reviewed the impairment assessments that were performed each quarter, and the methodology applied in conducting impairment assessments. The ARC considered continued volatility in global risk-free interest rates, alongside other input assumptions, in assessing market expectations of the expected rate of return on various assets for the purposes of impairment testing. This included reviewing the outcomes of periodic reassessments of the weighted average cost of capital during the year, including management's conclusion on the reasonability of the discount rate applied as at December 31, 2024. The ARC was satisfied the discount rate applied throughout the period was appropriate. The ARC considered the updated oil and gas price outlooks against market developments and benchmarks. The 2024 commodity price outlook was reassessed to determine whether revised price premises would result in a trigger for impairment or impairment reversal. Based on the analysis performed, no triggers were identified. The ARC also reviewed other circumstances that may indicate that the recoverable amount of assets have changed, such as those related to revision of future plans and developments, exploration and evaluation assets, held-for-sale classification for asset disposals and margin assumptions. The ARC also reviewed the outcomes of goodwill testing. |
| See Notes 2, 11, 12 and 13 to the "Consolidated Financial Statements" on pages 227-237, 258-259, 259-260 and 261-263. |
Gas and power markets and derivatives accounting |
External events during the year affected trading activities. The impacts on financial outcomes of Integrated Gas, and Renewables and Energy Solutions included, for example, significant derivatives movements. | | The ARC reviewed Trading and Supply activities and developments, including analysis of the trading strategies employed, their impact on financial metrics, and the associated accounting treatment applied. The ARC reviewed the impacts of volatile gas and power markets including the impact on mark-to-market valuation of derivatives, income for the period and adjusted earnings, as well as the resulting cash flow movements. |
| See Note 26 to the "Consolidated Financial Statements" on pages 282-288. |
Governance | Audit and Risk Committee Report continued
| | | | | | | | |
Financial Reporting continued | | |
| | | | | | | | |
Issue | | Committee activity and outcome |
| Taxation |
The determination of tax assets and liabilities requires the application of judgement as to the ultimate outcome, which can change over time. In particular, uncertain tax treatments require management to assess the more-likely-than-not outcome, and the recognition of deferred tax assets requires management to make assumptions regarding future profitability. As a result, they are inherently uncertain.
| | The ARC considered the uncertain tax positions and discussed management's assumptions of future taxable profits. The ARC also evaluated the appropriateness of the recognition of deferred tax assets and tax liabilities. The ARC recognises that assumptions regarding future taxable profits are inherently uncertain because they involve assessing factors such as the potential impacts of climate change and the energy transition. The ARC deemed the assessments of uncertain tax exposures and the recognition of deferred tax assets and tax liabilities to be reasonable. On June 20, 2023, the UK substantively enacted the OECD Pillar Two Model Rules (Rules), effective as from January 1, 2024. The ARC has been updated on the implementation of the rules and the Pillar Two tax charges throughout the year. |
| See Notes 2 and 23 to the "Consolidated Financial Statements" on pages 227-237 and 271-274. |
| Portfolio activities | | |
In implementing our strategy, several portfolio developments occurred in 2024. | | The ARC discussed the accounting implications of these developments and the recognition of: (i) decommissioning and restoration provisions; (ii) deferred tax balances; (iii) impairment; and (iv) assets held for sale. The ARC also considered complex accounting treatments arising from acquisitions and divestments, including the proposed sale of Shell Energy and Chemicals Park Singapore and the recognition of UK North Sea assets as held for sale at December 31, 2024. |
| | See Notes 2 and 25 to the "Consolidated Financial Statements" on pages 227-237 and 281. |
Provisions, contingent liabilities and disclosures |
Provisions, including decommissioning and restoration provisions, are one of the main components of the balance sheet liabilities. The quantification of these provisions requires judgements on input parameters which include, but are not limited to, discount rates and estimated future decommissioning and restoration costs. Contingent liabilities, arising from uncertain future events, are assessed for recognition or disclosure in line with reporting standards. | | The ARC reviewed the input parameter assumptions and judgements used in arriving at the decommissioning and restoration provisions. The discount rate is reviewed regularly and the ARC considered the extent to which the rate applied remained appropriate in the context of volatile US Treasury yields. The ARC was satisfied that the rate applied remained appropriate as at December 31, 2024. The ARC reviewed provisions, contingent liabilities and disclosures related to litigation, based on quarterly updates, for inclusion in the quarterly unaudited interim financial statements, half-year report, Annual Report and Form 20-F. The ARC also reviewed other provisions. The ARC has continued to receive updates on the withdrawal from Russian oil and gas activities throughout 2024 including implications for the financial statements. |
| Retirement benefit obligations | | |
Retirement benefits are an important component of both assets and liabilities on the balance sheet. The quantification of these assets and liabilities requires judgements on input parameters which include, but are not limited to, actuarial assumptions and discount rates. | | The ARC reviewed the management of risks in relation to retirement benefits in 2024, including financial, operational and regulatory developments. The ARC reviewed the key assumptions (including discount rates and inflation) and sensitivities as part of the Annual Report review and the enhanced disclosures made in this Report. The ARC also considered the accounting treatment for complex retirement benefit transactions, including the buy-out of pension liabilities in the USA and anticipated changes arising from the Future of Pensions Act in the Netherlands. |
| See Note 24 to the "Consolidated Financial Statements" on pages 274-280. |
Other matters | | |
Other significant accounting and reporting matters assessed. | | The ARC considered segmentation requirements under IFRS 8 following the change announced to the Executive committee. The ARC also reviewed: the year-end reported proved oil and gas reserves, including management judgements and adjustments made to reflect changes in geological, technical, contractual and economic information (including yearly average price assumptions) and the effectiveness of financial controls. |
Governance | Audit and Risk Committee Report continued
| | | | | | | | |
Compliance and governance | | |
| | | | | |
| Activities performed | Frequency |
| Compliance and governance | |
| Monitor the receipt, retention, investigation and follow-up actions of complaints received, including those from the Shell Global Helpline. | P |
| Review with the Chief Ethics and Compliance Officer the implementation and effectiveness of the ethics and compliance programme and function. | A |
| Consider compliance with applicable external legal and regulatory requirements. | P |
| Perform an evaluation of the ARC's performance and effectiveness and report the results to the Board. | A |
| Review and, if required, update the ARC's Terms of Reference. | A |
| Review the Chief Financial Officer's significant business and investment transactions for potential conflicts or related party transactions. | A |
| Assess the Chief Financial Officer's performance. | A |
A = Annually Q = Quarterly P = Periodically
Ethics and compliance
In 2024, the ARC received an update from the Chief Ethics and Compliance Officer on how a range of macro factors and external trends and developments were affecting conduct risk at Shell. The Chief Ethics and Compliance Officer summarised the specific emerging ethics and compliance risks, with a particular focus on trade compliance and data privacy, and management's actions to manage and mitigate them. The Chief Ethics and Compliance Officer briefed the ARC on communications to staff from both senior leaders and mid-level management reinforcing the importance of adherence to and affirming Shell's commitment to the Ethics and Compliance framework and Code of Conduct throughout the year.
As part of the overall assessment of the system of risk management and internal control, the ARC discussed with the Chief Ethics and Compliance Officer their annual report on compliance matters. The report included an overview of the effectiveness of the Shell ethics and compliance programme in managing ethics and compliance risk in Shell's business activities, regulatory developments and compliance activities. The ARC also reviewed investigations of cases involving ethics and compliance concerns. The ARC discussed management's findings in such cases to satisfy itself that a rigorous process had been followed, with appropriate disciplinary action being taken where necessary, and that management had embedded learnings into Shell's systems and controls.
Whistleblowing investigations
The ARC is responsible for establishing and monitoring the implementation of procedures for the receipt, retention, investigation and follow-up actions of complaints received, including those from the Shell Global Helpline. The ARC reviewed whistleblowing reports and internal audit reports and considered management's responses to the findings in these reports. In 2024, 2,025 allegations and enquiries were made through the Shell Global Helpline (2023: 2,134), of which approximately 39% were submitted anonymously (2023: 41%). In 2024, a total of 555 investigations were closed (2023: 470), of which 62% were found substantiated (2023: 54%) and were highest in the areas involving harassment, information and records management, conflicts of interest and protection of assets.
Regulatory developments
The ARC was briefed on regulatory developments in areas including:
(i) sustainability and climate-related disclosures; (ii) accounting and reporting developments; (iii) environmental liabilities; (iv) treasury activities; and (v) the 2024 UK Corporate Governance Code.
ARC annual evaluation
The ARC undertakes an annual evaluation of its performance and effectiveness. As in 2023, in 2024 the Company Secretary facilitated the ARC's performance evaluation. Each ARC member responded to a confidential anonymised questionnaire about the ARC's performance covering questions on: the management of the ARC in areas such as the annual cycle of work and the agenda for meetings; the quality of the information provided to the ARC; the effectiveness of the ARC's oversight in areas such as financial reporting, risk management policies and practices and internal controls, and the work of internal and external audit; rating the ARC's performance in reviewing and assessing significant accounting/reporting issues; and how to improve the ARC's performance. The ARC considered that there had been significant progress on the feedback from the 2023 evaluation, including with respect to risk management and presentation; structure of internal audit updates and further enhancement of pre-read for ARC meetings. See also the Board evaluation section on page 161. Two themes from the 2024 evaluation process were identified as areas of focus for 2025, including further focus on litigation risk and Trading and Supply risk in a more challenging environment and continued enhancement of pre-read for ARC meetings. The ARC concluded that its performance in 2024 had been effective and that it had fulfilled its role in accordance with its Terms of Reference.
In preparing its work plan for 2025, the ARC has included the following focus areas in addition to the standing items: Trading and Supply; regulatory developments, including corporate governance reforms, fraud and sustainability reporting regulations; information risk management, including cyber security; Pensions and Treasury.
Governance | Audit and Risk Committee Report continued
| | | | | |
| Activities performed | Frequency |
| Internal Audit | |
| Evaluate the quality, efficiency and effectiveness of the internal audit function including the competence, qualifications, expertise, compensation and budget. | A |
Review and approve the internal audit function's remit, charter and audit plan. | A |
| Assess the performance of the Chief Internal Auditor. | A |
A = Annually Q = Quarterly P = Periodically
Each quarter, the ARC discusses with the Chief Internal Auditor the Company's risk management and internal control system, any significant matters arising from the internal audit assurance programme and management's response to significant audit findings and notable control weaknesses, including planned improvements and agreed actions. In 2024, the Chief Internal Auditor's reports were developed with the use of artificial intelligence (AI). The ARC also holds private sessions separately with the Chief Internal Auditor without members of management, except for the Legal Director, who may attend. Outside of the formal ARC meetings, the Chair of the ARC meets regularly with the Chief Internal Auditor.
Internal audit remit
The internal audit function is an independent assurance function which supports Shell's continuous efforts to improve its overall control framework. The internal audit function contributes to the maintenance of a systematic and disciplined approach to evaluate and improve the design and effectiveness of Shell's risk management, and control and governance processes. The primary role of the internal audit function's assurance and investigation activities is to safeguard value by protecting Shell's assets, reputation and sustainability in relation to the organisation's defined goals and objectives.
The ARC defines the responsibility and scope of the internal audit function and approves its annual plan. The Chief Internal Auditor reports functionally to the Chair of the ARC and administratively to the Chief Financial Officer. The Chair of the ARC approves, in consultation with the Chief Financial Officer, all decisions regarding the performance evaluation, appointment or removal of the Chief Internal Auditor. A new Chief Internal Auditor was appointed with effect from March 2025.
Annual internal audit plan and assessment of internal audit's effectiveness
The ARC considered and approved the internal audit function's annual audit plan, including these focus areas for 2024:
○People -- talent and capability (professional audit development and technical capabilities).
○Operational excellence -- further enhance the planning, execution and reporting processes.
○Competitiveness -- increase value by tailoring its structure and targeting critical risks areas.
○Innovative technology -- further leveraging innovation and new technologies, such as AI and data analytics.
The Chief Internal Auditor updated the ARC quarterly on the approved 2024 internal audit plan and discussed whether the plan remained fit for purpose in addressing the most critical areas of risk. The ARC assessed the performance of the internal audit function as effective. The ARC also assessed the performance of the Chief Internal Auditor as effective.
The Chief Internal Auditor periodically assesses whether the purpose, authority and responsibilities of the internal audit function continue to enable it to accomplish its objectives. The results of this periodic assessment are communicated to the EC and the ARC. The Chief Internal Auditor also confirms to the ARC the continued validity of the charter of the internal audit function or puts forward proposals for updates to it. The Chief Internal Auditor maintains an internal quality assurance and improvement programme, including an annual assessment of the effectiveness and efficiency of the internal audit function's activities and evaluations of conformance with the standards of the Chartered Institute of Internal Auditors (CIIA). The Chief Internal Auditor discusses the results of this annual assessment with the EC and the ARC. The Chief Internal Auditor also provided the ARC with an update on the status of implementation of the Institute of Internal Auditors new Global Internal Audit Standards which took effect on January 9, 2025, and noted the steps taken to meet the intent of these new standards.
At least every five years, the effectiveness and quality of the internal audit function are independently assessed externally, and the Chief Internal Auditor reviews the report with the EC and the ARC. An independent assessment of the internal audit was conducted at the end of 2022. The 2022 assessment confirmed that the internal audit conformed with the CIIA standards and the 2020 Internal Audit code of practice and identified some opportunities for further improvement. The next external assessment is planned to take place in 2027.
Governance | Audit and Risk Committee Report continued
| | | | | |
| Activities performed | Frequency |
| External Audit | |
Review and approve the engagement letter for the external auditor's annual audit of the Company's consolidated and parent company financial statements. | A |
| Approve the remuneration for audit and non-audit services, including pre-approval of permissible non-audit services. | Q |
| Consider the annual external audit plan and monitor the execution and results of the audit. | P |
Monitor the qualifications, expertise, resources and independence of the external auditor. | A |
Review the Company's representation letter prior to signing by management. | P |
Assess the performance, objectivity and effectiveness of the external auditor, the audit process, the quality of the audit, the external auditor's handling of key judgements and the external auditor's response to questions from the ARC. | P |
| Recommend to the Board that the reappointment of the external auditor be put to the Company's shareholders for approval at the AGM. | A |
A = Annually Q = Quarterly P = Periodically Annual external audit plan and assessment of external audit's effectiveness
EY reviewed with the ARC its audit strategy, scope and plan for the 2024 audit, highlighting areas which would receive special consideration. In particular, the ARC and EY discussed how the audit would take into consideration risks associated with:
○Trading and Supply complexity;
○Revenue recognition fraud risk (unauthorised trading and management override);
○Climate change and the energy transition;
○Oil and gas reserves;
○Impairment assessments;
○Litigation;
○Decommissioning and restoration obligations;
○Accounting for divestments;
○Pensions; and
○Taxation.
EY defines significant audit risks as those areas where there is a higher likelihood of a material error and which therefore require special audit attention. In EY's view, the significant audit risks are Trading and Supply complexity and the risk of unauthorised trading or management override.
The ARC considered the annual audit plan, which included assessing whether the planned materiality levels and proposed resources to execute the audit plan were consistent with the scope of the audit.
EY regularly updated the ARC on the status of its procedures and preliminary findings, providing an opportunity for the ARC to monitor the execution and results of the audit. The ARC and EY discussed how risks to audit quality were addressed, key accounting and audit judgements, material communications between EY and management and any issues arising from them. EY also reviewed with the ARC its risk assessments, materiality, scope and observations and conclusions in relation to Shell's CSRD disclosures.
Quarterly, the ARC meets privately with EY representatives without management (except for the Legal Director who may attend) being present in order to encourage open and transparent feedback from both parties. In addition, the Chair of the ARC meets separately with the external auditor on a regular basis.
As part of its oversight of the external auditor, the ARC annually assesses the performance and effectiveness of the external auditor and the audit process. This includes assessing the quality of the audit, how the auditor handled key judgements, and the auditor's response to the ARC's questions. The assessment also involves the ARC evaluating the objectivity and independence of EY and the quality and effectiveness of the external audit process.
The ARC's evaluation of the performance and effectiveness of the external auditor and the audit process includes the following key criteria:
○professionalism, competence, integrity and objectivity during the audit, including handling of areas involving judgement and estimates;
○EY's quality assurance procedures and internal quality control procedures;
○audit quality priorities and actions taken as part of maintaining a sustainable audit quality programme;
○constructive challenge of management and key judgements;
○efficiency, covering aspects such as service level and innovation in the audit process, use of data analytical and digital audit tools, and opportunities for improvement;
○quality of the audit team's leadership;
○the most recent EY Transparency Report;
○thought leadership and actions, especially in the areas of climate change; and
○compliance with relevant legislative, regulatory and professional requirements.
In addition to reflecting on its own experiences, including interactions with the external auditor throughout the year, the ARC considered and discussed the results of management's internal survey relating to EY's performance over the financial year 2024, which reflected a broadly comparable performance to 2023 and the views and recommendations from management and the Chief Internal Auditor.
As part of the current assessment of effectiveness, the ARC has taken into consideration the guidance issued by the FRC, including the guidance on oversight of the external audit set out in "Audit Committees and the External Audit: Minimum Standard".
Taking into account the above, the ARC is satisfied that EY continued to provide a high-quality and effective audit in its ninth year as auditor and maintained its objectivity, integrity and impartiality. As required under UK and US auditing standards, the ARC received a letter on independence-related matters from EY. EY also informed the ARC in writing of any significant relationships and matters that may reasonably be thought to affect its objectivity and independence. The ARC and EY discussed such relationships and matters and determined that they did not impair EY's objectivity, integrity and impartiality.
Governance | Audit and Risk Committee Report continued
| | | | | | | | |
External Auditor continued | | |
Audit Committees and the External Audit:
Minimum Standard
In May 2023, the FRC published "Audit Committees and the External Audit: Minimum Standard". This Audit and Risk Committee Report describes how the ARC has complied, to the extent applicable, with the provisions of the Minimum Standard during the year (in particular the "External Auditor" section of this report). There were no shareholder requests for certain matters to be covered in the audit during the year and there were no regulatory inspections of the quality of the Company's audit. An explanation of the Group's accounting policies is provided on pages 227-237.
Reappointment 2025
The ARC is responsible for considering whether there should be a rotation of the independent registered public accounting firm in order to ensure continuing auditor quality and/or independence, including consideration of the advisability and potential impact of conducting a tender process for the appointment of a different independent public accounting firm. The ARC is also responsible for making a recommendation to the Board, for it to put to the Company's shareholders for approval in the General Meeting, on the appointment, reappointment, or removal of the external auditor.
At the AGM in May 2024, shareholders approved a resolution to reappoint EY as external auditor until the conclusion of the next AGM. EY was first appointed at the AGM in May 2016 after a competitive tender process. The lead audit partner, Gary Donald, has been in post since the start of the 2021 audit. Under UK legal requirements, the Company may retain EY as its external auditor for 20 years (see External audit tender below). For the 2024 financial year, the Company has complied with The Statutory Audit Services for Large Companies Market Investigation (Mandatory Use of Competitive Tender Processes and Audit Committee Responsibilities) Order 2014.
In its oversight of the external audit, the ARC considered whether it would be appropriate to conduct an audit tender in respect of the 2025 audit.
The ARC reflected on:
○its continued satisfaction with the quality and independence
of EY's audit;
○any new external auditor would need a transition period to develop sufficient understanding of the business given Shell's size and complexity;
○frequent changes of external auditor would be inefficient and could lead to increased risk and the loss of cumulative knowledge;
○a change in auditor would be expected to have a significant impact on Shell, including on the Finance function; and
○any change in auditor should be scheduled to limit operational disruption.
The ARC also considered EY's leadership and activities in the area of climate change.
After due consideration the ARC determined that it would not be appropriate to re-tender for the 2025 external audit at this time. The ARC has recommended to the Board that at the 2025 AGM the Board should propose that EY be reappointed as the external auditor of the Company for the year ending December 31, 2025. The ARC's recommendation is free from third-party influence and there are no contractual obligations that restrict the ARC's ability to make such a recommendation.
External audit tender
The ARC acknowledges the UK legal requirements relating to mandatory audit rotation and audit tendering (with a requirement to undertake a formal process after ten years). As EY was appointed in 2016, the Company was required to tender for the audit no later than the financial year commencing January 1, 2026. The tender process, led by the ARC, was commenced during 2023 and completed in 2024. The ARC believes that this timeline for the re-tender was in the best interests of shareholders in order to provide enough time for an orderly transition in the event that a new audit firm was selected. In conducting the tender process, the ARC considered the guidance on tendering set out in the FRC's "Audit Committees and the External Audit: Minimum Standard". All members of the ARC were involved throughout the external audit tender process.
Selection criteria
To enable an objective selection, weighted selection criteria were endorsed by the ARC in advance, with the choice of auditor being based on quality, including independence, challenge and technical competence and not price or perceived cultural fit. Minimum requirements which had to be met were independence; ethics and compliance; investigations by regulators; and legal terms and conditions. Whilst the audit fee was considered as part of the criteria, it was not a decisive factor, with the commercial scoping assessed subsequent to and separately from the quality assessment.
Selection process
The ARC gave careful consideration to the potential candidate firms which included UK challenger firms with a "public interest entity" auditor registration. A request for information (RFI) was submitted
to six shortlisted firms in November 2023.
Following evaluation of the responses to the RFI, as well as the ARC having met in February 2024 with the proposed lead partners from firms which responded positively to the RFI, the ARC chose candidate firms for the next stage. This decision was based on quality, team and relevant experience for a company the size, scale and complexity as Shell.
Governance | Audit and Risk Committee Report continued
| | | | | | | | |
External Auditor continued | | |
At its meeting in March 2024, the ARC discussed and endorsed the selection criteria and weighting for the audit tender. A Request for Proposal was issued to candidate firms in May 2024, followed by a series of management information sessions. The candidate firms had access to a data room, management across the organisation and visited various locations. The ARC met with representatives from the candidate firms in July 2024 to address any queries which the firms wished to raise and provide an opportunity for the ARC to raise any queries.
In September 2024, final proposals were submitted by the candidate firms. To support the ARC, scoring was performed on all criteria by a steering committee headed by the VP Group Appraisal and Reporting and Deputy Controller and comprising of (E)VPs of businesses and functions. The ARC received input from management, including on the scoring criteria, ahead of final meetings between the ARC and the candidate firms in December 2024. As part of the process, public reports published by the FRC and other regulators were also considered.
ARC Recommendation
Following the meetings and review of each of the candidate firms' proposals and presentations, the ARC made its selection on the basis of its assessment of the abilities of each of the candidate firms. At the Board meeting in December 2024, the ARC recommended two possible audit firm options to the Board, with the ARC's preference to appoint EY, and supporting justifications. The ARC's recommendation was accepted by the Board and a resolution proposing the appointment of EY as the external auditor for the financial year 2026 will be put forward to the shareholders for approval at the 2026 AGM.
Non-audit services
The ARC maintains an auditor independence policy (AIP) in respect of the provision of services by the external auditor. Under the AIP, the ARC will only approve services to be carried out by the external auditor or its affiliates where such services do not present a conflict of interest risk in fact or in appearance. The ARC regularly reviews this policy for necessary changes in response to changes in related standards and regulatory requirements.
This policy is designed to safeguard auditor objectivity and independence. It addresses the provision of audit services, audit-related services and other non-audit services and stipulates which services require specific prior approval by the ARC.
The policy also defines prohibited services in line with applicable rules and regulations. Our external auditors are not allowed to provide prohibited services due to independence concerns. For certain non-prohibited services, because of the knowledge and experience of the external auditor and/or for reasons of confidentiality, it may be more efficient or prudent for the external auditor to provide such services.
The ARC reviews quarterly reports from management on the audit and non-audit services reported in accordance with the policy or for which specific prior approval from the ARC is being sought. Under the AIP, no prior approval by the ARC is required for any additional audit service contract not individually exceeding $500,000. All non-audit services where the fee for an individual contract exceeds $100,000, including audit-related services, require individual prior approval by the ARC. For audit or non-audit service contracts that do not exceed the relevant threshold, the matter is approved by management by delegated authority from the ARC and is subsequently presented for approval by the ARC. The ARC is mindful of the overall proportion of fees for audit and non-audit services in determining whether to approve such services.
Fees
After due consideration, the ARC approved the auditor's remuneration, satisfying itself that the level of fees payable in respect of the audit and non-audit services provided was appropriate and that an effective, high-quality audit could be conducted for such fees.
The total auditor's remuneration of $66 million (2023: $66 million, 2022: $69 million) is categorised as follows: audit $62 million (2023: $64 million, 2022: 65 million); audit-related $4 million (2023: $2 million, 2022: $3 million); and all other fees $0 million (2023: $0 million, 2022: $1 million).
The scope of audit-related services contracted with the external auditor in 2024 consisted mainly of assurance and other attest services related to financial reporting.
| | | | | |
| |
| See Note 35 to the "Consolidated Financial Statements" on page 296 for details of the auditor's remuneration. |
| |
Directors' Remuneration Report
This report
The Directors' Remuneration Report for 2024 has been prepared in accordance with relevant UK corporate governance and legal requirements, in particular Schedule 8 of The Large and Medium-sized Companies and Groups (Accounts and Reports) Regulations 2008 (as amended). The Board has approved this report.
As in previous years, this report is split into three sections: Chair's letter, Annual Report on Remuneration and Directors' Remuneration Policy (Policy). The Policy was last approved by shareholders at the 2023 AGM with 94.6% support. No changes are being proposed to the Policy this year and it is reproduced in full on pages 200-207 for ease of reference, and to provide context to the decisions taken
by the Remuneration Committee (REMCO) during the year.
"2024 saw a sharpened focus on performance, discipline and simplification."
Neil Carson
Chair of the Remuneration Committee
Dear Shareholders,
Almost two years ago, at Capital Markets Day 2023 (CMD23), we set out how we will deliver more value with less emissions through our guiding principles of performance, discipline and simplification. In 2024, Shell delivered another set of strong financial results, with income of $16.5 billion, cash flow from operations (CFFO) of $54.7 billion, our second best year on record, and free cash flow* (FCF) of $39.5 billion. These results have enabled us to deliver consistent distributions to shareholders, while also continuing to strengthen our financial resilience. We set four financial targets at CMD23, and have made progress against each of them, including reducing structural costs* by $3.1 billion since 2022 and delivering total shareholder distributions* of 41% of CFFO for the year, at the upper end of the 30-40% of CFFO range set out at CMD23.
Strong operational performance across our portfolio underpinned our financial results. In Integrated Gas and Upstream, performance has increased year-on-year. At Prelude and QGC in Australia, we achieved record availability, resulting in our highest ever production. In Chemicals, utilisation improved thanks to the ramp-up of operations at Shell Polymers Monaca in the USA. In Marketing, we achieved the strongest annual Adjusted Earnings* since 2020 at $3.9 billion.
We have continued to grow our LNG portfolio and made good progress against the commitment to bring projects online with a total peak production of more than 500 thousand barrels of oil equivalent a day by 2025. We have also focused on high-grading our mobility network, increased our margins in lubricants and, when it comes to power generation, focused on areas where we have a competitive advantage.
At Shell, safety is extremely important and we continually work to keep our people safe. I am saddened by the tragic incidents that occurred at Shell-operated ventures in 2024. One person lost their life in the Netherlands in 2024 and another in India in 2025, following an incident in 2024. In late 2023, an incident occurred in Nigeria which resulted in a fatality in early 2024. The REMCO agreed this would be assessed as part of 2024's reflections on safety. The REMCO reflected on all three tragic incidents and Shell's broader safety performance, as it always does, when it determined the final pay outcomes for 2024, and applied downward discretion to the annual bonus outcome.
* Non-GAAP measure (see page 337).
2024 remuneration outcomes
2024 annual bonus
The overall mathematical outcome of the annual bonus scorecard was above target at 1.66, adjusted to 1.64 to reflect a delayed tax payment due to a third-party error. After careful consideration of the factors leading to the tragic fatalities in respect of the year and reflection on Shell's overall performance in 2024, including safety performance, the REMCO used downward discretion to determine a final bonus outcome for Executive Directors of 1.61. Further information is on page 186.
| | | | | |
| |
| See pages 185-187 for the complete scorecard with all targets, ranges and weightings, and a detailed discussion of performance against targets. |
| |
Governance | Directors' Remuneration Report continued
Vesting of the 2022 LTIP awards
Overall, the mathematical outcome of the Long-term Incentive Plan (LTIP) was 136% of target. The REMCO was satisfied that no windfall gain had arisen. The REMCO also believes the vesting outcome to be representative of Shell's performance over the period.
| | | | | |
| |
| See page 188 for full details of LTIP targets and weightings, and a discussion of performance against targets. |
| |
Finalising the 2024 pay outcomes
In finalising pay outcomes, the REMCO considered Shell's wider performance and context during 2024 and over the LTIP performance period, paying particular attention to:
○The strong financial performance in 2024, with CFFO of $54.7 billion and FCF* of $39.5 billion, which has enabled Shell to invest in its businesses, reduce debt and enhance shareholder distributions.
○The shareholder experience, including cash dividends of $8.7 billion and share repurchases of $13.9 billion in 2024, resulting in total shareholder distributions* of $22.6 billion for the year and $71.4 billion over the LTIP performance period (2022-2024), and absolute and relative total shareholder return (TSR) performance over the same periods.
○Shell's performance beyond the formulaic outcomes of the variable pay structures, including safety (and fatalities), reputation, ethics and compliance, and feedback from the Audit and Risk Committee (ARC) and the Sustainability Committee (SUSCO).
○Shareholders' views on remuneration matters, as shared with the REMCO during engagements in March 2024, including positive feedback on the safety framework.
○The employee experience, where the REMCO noted the above-target vesting outcome for 2024 under the Performance Share Plan (PSP), used to make discretionary share awards below Senior Executive level and the average employee salary increases.
○Comparisons between the 2024 outcomes and historical remuneration levels.
○The alignment of the 10-year average outcomes of the annual bonus scorecard (1.13) and LTIP (96% of target) to the target level, demonstrating the effective design of the structures and the integrity of the target-setting process.
This resulted in a single figure outcome of £8.6 million for the CEO and £7.3 million for the CFO. The REMCO was satisfied that the shareholder-approved Remuneration Policy had operated as intended, and these outcomes were appropriate in the context of Company performance and the target pay opportunity.
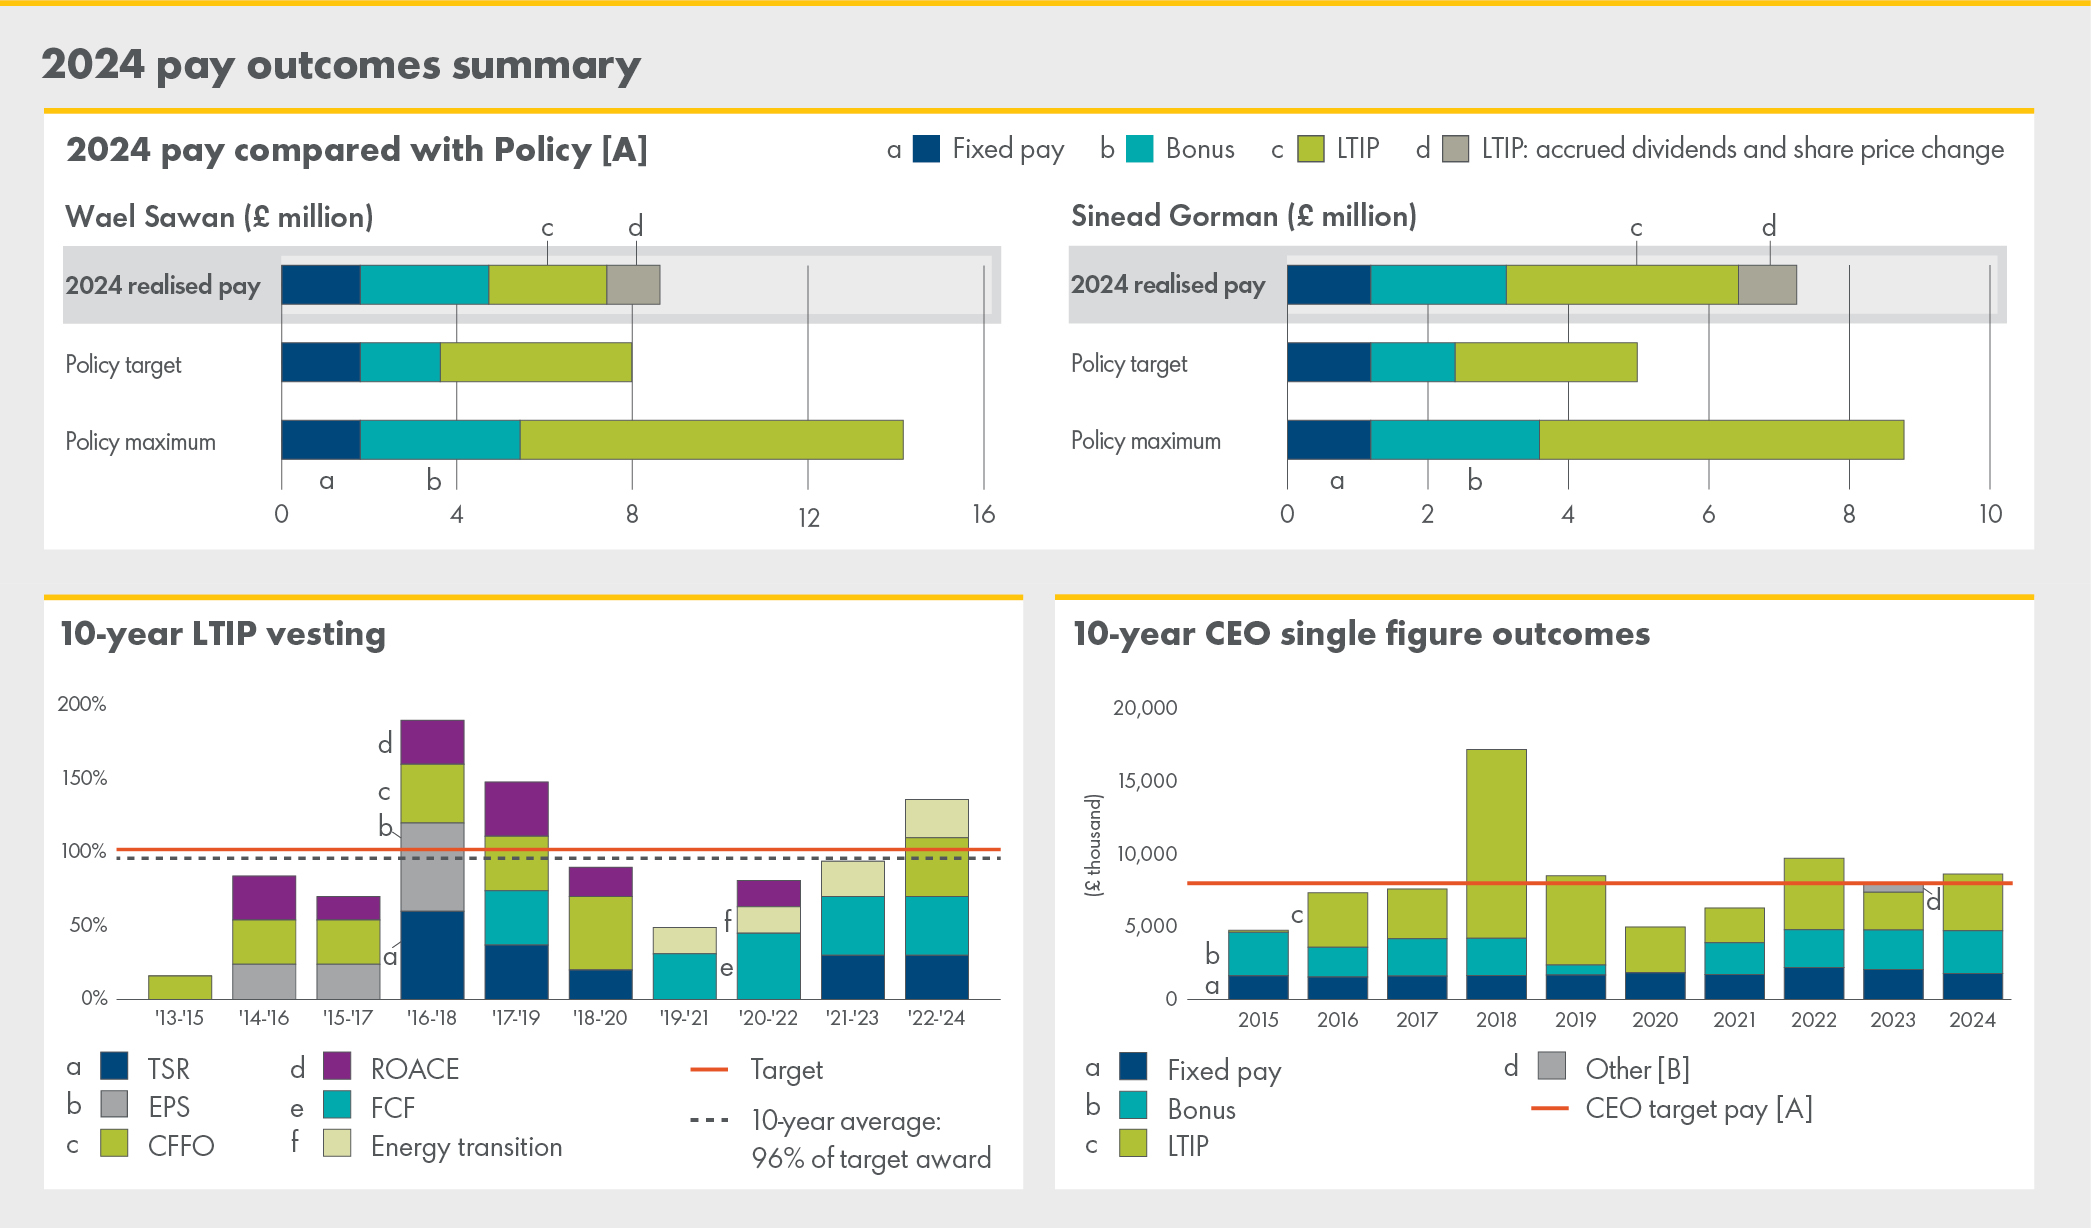
[A]Policy target and maximum based on the shareholder-approved 2023 Remuneration Policy in respect of the annual bonus and the LTIP. Salary, pension and benefits are based on latest data.
[B]Incremental remuneration in respect of 2022 for services as CEO Designate, in anticipation of becoming CEO in 2023.
* Non-GAAP measure (see page 337).
Governance | Directors' Remuneration Report continued
2025 remuneration
2025 salaries
Effective January 1, 2025, Wael Sawan and Sinead Gorman received a salary increase of 5.5%, and their salaries for 2025 are £1,535,000 and £1,014,000, respectively. In reviewing their salaries, the REMCO considered carefully the external environment, including the increases provided to Shell's workforce in the key markets of the UK (5.5%), the USA (3.0%) and the Netherlands (3.6%). The Executive Directors' increases for 2025 were positioned in line with the average UK increase. The REMCO also recognised the multiplier effect on total remuneration.
2025 annual bonus
The REMCO is satisfied that the current mix of financial and non-financial measures remains well aligned with Shell's strategic and operational priorities. No change is proposed for 2025.
2025 Performance Share Award performance conditions
From 2025, performance-related long-term incentive awards under the Shell Share Plan will be referred to as Performance Share Awards (PSA). Other than the name, the terms and conditions of the awards remain unchanged. The performance conditions and weightings will be unchanged for the 2025 awards. The measures will be cash generation, TSR, organic free cash flow (OFCF) and "Shell's journey in the energy transition", and they will be weighted equally. Cash generation and TSR performance will be measured against the energy majors as before, and OFCF will be measured on an absolute basis against annual operating plans.
2026 Remuneration Policy
The current Remuneration Policy (the Policy) was last approved at the 2023 AGM, and a new Policy will be put to a shareholder vote at the 2026 AGM. A new Policy provides an opportunity for the REMCO to reflect deeply on the nature of Shell's business and how to best position remuneration to support Shell's strategic objectives, including CMD25. Deliberations on Policy design have started, with discussions around structure, the appropriate level of quantum, and governance. The REMCO intends to begin engaging with shareholders this summer.
Looking ahead
The 2025 AGM will be my last as the REMCO Chair, as I will be stepping down from the REMCO following the AGM. It has been a privilege to chair the REMCO over the past five years, and I wish my successor, Cyrus Taraporevala, every success for the future.
I hope that you find that this report presents a clear account of the REMCO's decisions for the year. I thank shareholders for their support and am grateful for their ongoing dialogue.
Neil Carson
Chair of the Remuneration Committee
March 25, 2025
Annual Report on Remuneration
Governance | Annual Report on Remuneration continued
| | | | | | | | |
| | |
| The Annual Report on Remuneration sets out: ○remuneration at a glance, page 183; ○the REMCO's responsibilities and activities, page 184; ○Directors' remuneration for 2024, pages 185 and 192; and ○the statement of the planned implementation of Policy in 2025, page 197. | |
| | |
The REMCO is not proposing any changes to the Policy this year. It is reproduced in full [A] over pages 200-207 for ease of reference and to provide context to the decisions taken by the REMCO.
[A]The Non-executive Directors' letters of appointment table was updated in early 2024.
The base currency in the Directors' Remuneration Report is British pound sterling (GBP), which is the base salary currency for the Executive Directors. Where amounts are shown in other currencies, an average exchange rate for the relevant year is used, unless a specific date is stated, in which case the exchange rate for the specific date is used.
| | | | | | | | | | | | | | | | | | | | |
| | | | | | |
| REMCO membership and attendance for 2024 | |
| | | |
| | | |
| | | | | |
| | | | | | |
| Biographies can be found on pages 149-153; and the REMCO meeting attendance is set out below: | |
| REMCO member | Member since | Meetings attended | % of meetings attended | |
| Neil Carson (Chair) | June 1, 2019 | 5/5 | 100% | |
| Dick Boer | May 23, 2023 | 5/5 | 100% | |
| Jane Holl Lute | May 23, 2023 | 5/5 | 100% | |
| Bram Schot | May 24, 2022 | 5/5 | 100% | |
| Cyrus Taraporevala | October 30, 2024 | 1/1 | 100% | |
| | |
The REMCO's key responsibilities include determining:
| | | | | | | | | | | |
| Senior Management [A] |
| Executive Directors | Executive Committee | Company Secretary
and EVP Controller |
| Performance framework | P | r | r |
| Remuneration Policy | P | P | r |
| Actual remuneration and benefits | P | P | P |
| Annual bonus and long-term incentive measures and targets | P | P | P |
[A]In the Directors' Remuneration Report, Senior Management is defined as Executive Directors, other EC members, Company Secretary, and EVP Controller.
The REMCO is also responsible for determining the Chair of the Board's remuneration. The REMCO monitors the level and structure of remuneration for senior executives below Senior Management. When setting the Policy for Executive Director remuneration, the REMCO reviews and considers workforce remuneration and related policies, and how pay and benefits align with culture. In exercising its responsibilities, the REMCO takes into account a variety of stakeholder considerations.
The REMCO operates within its Terms of Reference, which are reviewed annually (last reviewed in December 2024), and are available on shell.com.
A perspective on Shell was provided by:
○Chief Executive Officer (CEO);
○Chief Human Resources and Corporate Officer, who also acted as Secretary to the REMCO; and
○Executive Vice President Performance and Reward.
The Chair of the Board was consulted on remuneration proposals affecting the CEO. The CEO was consulted on proposals relating
to the Chief Financial Officer (CFO) and Senior Management.
The REMCO met five times in 2024 and its activities included:
○determining vesting of the 2021 LTIP award for Senior Management;
○determining 2024 target bonus opportunities and 2024 LTIP awards for Senior Management;
○setting 2024 annual bonus and LTIP performance measures and targets;
○approving the 2023 Directors' Remuneration Report;
○reviewing 2025 bonus and PSA performance measures and targets;
○reviewing the Remuneration Policy ahead of renewal at the 2026 AGM;
○engaging with major shareholders and proxy bodies on remuneration matters;
○setting exit and appointment remuneration in relation to changes in the Executive Committee; and
○monitoring external developments and assessing the impact on remuneration decisions.
After a competitive tender process during the year, Ellason was chosen to provide external advice on developments in market practice around remuneration. The choice of Ellason was based on its knowledge of investors' expectations and familiarity with UK market practices. Ellason is a member of the Remuneration Consultants Group and operates according to that group's code of conduct when advising clients. The REMCO is satisfied that the advice provided was objective and independent. The total fees in relation to the advice were £38,770 (excluding value-added tax). The REMCO also reviewed market benchmarking data and analysis prepared by Shell's internal HR function on market developments in executive pay.
Governance | Annual Report on Remuneration continued
Directors' remuneration for 2024
| | |
| Single figure of total remuneration for Executive Directors (audited) |
| | | | | | | | | | | | | | | | | |
| £ thousand |
| Wael Sawan [A] | | Sinead Gorman |
| 2024 | 2023 | | 2024 | 2023 |
| Salaries [B] | 1,455 | 1,400 | | 961 | 925 |
| Taxable benefits [C] | 45 | 378 | | 32 | 197 |
| Pension [D] | 291 | 280 | | 192 | 185 |
| Total fixed remuneration | 1,791 | 2,058 | | 1,186 | 1,307 |
Annual bonus [E] | 2,925 | 2,710 | | 1,930 | 1,720 |
| LTIP [F] | 3,899 | 2,601 | | 4,136 | 834 |
| Total variable remuneration | 6,824 | 5,311 | | 6,066 | 2,554 |
| Other [G] | — | 571 | | — | — |
| Total remuneration | 8,615 | 7,940 | | 7,251 | 3,861 |
in US dollars | 11,012 | 9,873 | | 9,269 | 4,801 |
in euros | 10,177 | 9,128 | | 8,566 | 4,439 |
[A]Wael Sawan was appointed CEO and a Board Director effective January 1, 2023.
[B]Base salary: Wael Sawan's base salary for 2024 was set at £1,455,000 (+3.9% from 2023). Sinead Gorman's base salary for 2024 was set at £961,000 (+3.9% from 2023).
[C]Benefits: in respect of 2024, Wael Sawan's benefits included car allowance (£29,890) and travel-related benefits (£12,107). Sinead Gorman's benefits included car allowance (£29,890).
[D]Pension: Wael Sawan and Sinead Gorman received cash in lieu of pension contributions equal to 20% of base salary in 2024.
[E]Annual bonus: the full value of the bonus in respect of performance in 2024, comprising both the 50% delivered in cash and 50% bonus delivered in shares. For 2025, the market price of shares on February 26, 2025 for London-listed shares (£26.30) was used to determine the number of shares delivered, resulting in 29,479 ordinary shares for Wael Sawan and 19,451 ordinary shares for Sinead Gorman, net of tax.
[F]LTIP: the amounts reported for 2024 relate to the 2022 LTIP award, which vested on March 6, 2025, at the market price of €30.74 and £25.52 for Amsterdam-listed and London-listed ordinary shares, respectively. The value in respect of the LTIP is calculated as the product of: (i) the number of shares of the original award multiplied by the vesting percentage, plus accrued dividend shares, and (ii) the market price of ordinary shares at the vesting date. The market price of the Amsterdam-listed shares is converted into GBP using the exchange rate on the vesting date. Share price appreciation accounted for €887,645 for Wael Sawan and £362,888 for Sinead Gorman. The amount shown for Wael Sawan relates to an award made prior to his appointment to the Board, and is shown here for transparency. The performance measures are the same as those applying to LTIP awards made to Executive Directors.
[G]Incremental remuneration in respect of 2022 for services as CEO Designate, in anticipation of becoming CEO in 2023. Wael Sawan did not perform the role of CEO during the CEO Designate time period. Amount includes pro rata salary and performance bonus, plus time-limited relocation-related costs.
Notes to the table: Single figure of total remuneration
for Executive Directors (audited)
Pension
During the year, Wael Sawan and Sinead Gorman were eligible to participate in the defined contribution UK Shell Pension Plan with an employer contribution rate of up to 20% of salary, or take this as a pension cash alternative. The UK Shell Pension Plan or associated pension cash alternative is available to new Shell employees in the UK at the same contribution levels and currently around two-thirds of UK employees participate in these arrangements. The majority of the remainder participate in a legacy defined benefit plan, which closed to new members in March 2013.
Annual bonus
The annual bonus is intended to reward the delivery of short-term targets derived from the Operating Plan. The REMCO reviews the bonus measures, weightings and targets annually to evolve with Shell's strategy and circumstances, and to ensure that the targets remain stretching but realistic. For 2024, the mathematical bonus outcome was 1.66, adjusted to 1.64 to reflect a delayed tax payment due to a third-party error. The REMCO reviewed performance against the scorecard, as below. Further information is on page 187.
Financial delivery (35% weighting): We delivered $54.7 billion of CFFO against our target of $46 billion, driven by strong operational performance and price impact. For the purpose of the scorecard, the CFFO for 2024 was reduced to $54.2 billion to reflect a delayed tax payment due to a third-party error. As a reminder, the REMCO has a long-standing policy of not adjusting CFFO to take account of changes in energy prices and currency fluctuations. This policy supports alignment between pay outcomes and the shareholder experience.
Operational excellence (35%): A key underpin of our performance, operational excellence ensures we deliver for our customers and drive financial performance:
○Asset management excellence: Upstream controllable availability was outstanding, particularly in Kazakhstan, Nigeria, Norway, Oman and the USA, partially offset by lower performance in the UK. Midstream availability was also outstanding, thanks to excellent performance in Australia, Qatar and Oman. Refining and Chemicals availability exceeded the plan, mainly due to improvements at Shell Polymers Monaca in the US and Bukom refinery in Singapore.
○Project delivery excellence: The overall score for project delivery was slightly above target. Highlights for the year include the successful start-up of 10 projects, half of which came on-stream ahead of schedule. This was offset by the project delivery on budget being below target.
○Customer excellence: Customer satisfaction index was above target, following our focus on prioritisation and continuous improvement of e-commerce platforms. Our Brand share preference continued to be outstanding, performing ahead of target in all regions.
Overall the outcome for operational excellence was above target.
Governance | Annual Report on Remuneration continued
"Shell's journey in the energy transition" (15%):
○LNG volumes [A]: Performance is measured based on liquefaction volumes. The score was above target, reflecting strong operational performance. This was driven mainly by volume increases in Australia and Atlantic LNG, partly offset by lower volumes in Nigeria and Egypt due to feedgas constraints.
○Reducing operational emissions: Performance is assessed based on GHG abatement projects that result in ongoing Scope 1 and 2 emission reductions such as flare reduction and energy efficiency projects, site closures, decommissioning and transformations, and increasing the use of renewable energy in our operations. This metric does not include the impact of divestments and acquisitions. We had an outstanding outcome, with 1,028 thousand tonnes of GHG emission reductions from abatement, renewable energy, and permanent shutdowns or conversions ('right-sizing'). This was mainly due to catalyst improvements at Pearl GTL in Qatar, the Forcados Yokri Gas Project in Nigeria, and optimisation of a liquefaction control system at QGC in Australia.
○Supporting customer decarbonisation: We have continued to grow our network of electric vehicle charge points, exceeding our 2024 scorecard target. In 2024, we added 19,100 charge points, which brings the total number to around 73,000.
[A]Equity liquefaction.
Overall the score on the "Shell's journey in the energy transition" measure was above target.
Safety (15%): It remains our priority to run our day-to-day operations safely and ensure the well-being of all our people.
○Process safety continues to be measured through the number of
Tier 1 and 2 operational safety incidents. The score for 2024 was slightly ahead of target. There were 90 Tier 1 and 2 operational process safety events (compared with 63 in 2023).
○Personal safety SIF-F performance is assessed based on the number of serious incidents which might occur in Shell's businesses based on the work plan for the year and our knowledge of industry incident rates. Our ultimate goal is zero harm to people working for Shell. Overall, 2024 SIF-F performance showed an improvement compared with 2023, which is testament to the ongoing focus of our employees on keeping colleagues safe.
Overall, the score on the safety measure was above target. While the underlying safety performance was strong, we tragically lost colleagues during 2024. The REMCO reflected carefully on these events and Shell's broader safety performance and determined that the bonus outcome should be adjusted downwards to 1.61 (see "The REMCO's reflections on safety" below).
| | | | | | | | | | | | | | |
| | | | |
| The REMCO's reflections on safety Safety is Shell's first priority and our strategy is underpinned by this. It is critical that our operations run safely every day and that we strive to ensure the well-being of all of our people. In 2024, Shell used serious injury, illness and fatality frequency (SIF-F) as our scorecard measure for personal safety performance. SIF-F tracks the frequency at which injuries with life-changing consequences occur under Shell operational control. This allows us to focus the attention of management and the organisation on the most serious incidents. To be clear, our ultimate goal has been and remains zero harm to people. Following discussions with shareholders in 2023, the REMCO adopted a discretionary framework to guide its decisions regarding the impact of fatalities on remuneration. The framework takes account of multiple reflection points, as set out below. This framework supports holistic and detailed consideration of the circumstances of each incident, and consistent and fair judgement of safety performance over time. Circumstances There were two recordable fatalities under Shell's operational control in respect of 2024. There was a fatal incident in the Netherlands at Shell Energy and Chemicals Park Moerdijk in June 2024, which remains under investigation. A colleague injured in a snake bite incident in India in May 2024 tragically died in January 2025. This incident also remains under investigation. Further, in Nigeria, a vessel crew member who was injured in a fire incident in December 2023 died in February 2024. There have been no regulatory consequences and the outcome of the investigation was that the incident was not considered a repetitive failure.
| | Wider safety context Safety performance has improved significantly over time. The 2024 results support our belief that structural improvements have been made. The focus has continued to be on strengthening controls for routine activities, simplifying pre-work assessments, and leveraging technology for risk identification. Beyond the metrics, management has worked to continue to embed the Safety Refresh in Shell assets and businesses, and good results have been observed. There were no material safety events outside of the reporting framework. Personal safety performance 2003–2024 Conclusions The scorecard result on safety is a strong outcome which reflects the work throughout the organisation on the Safety Refresh, which promotes a learner mindset through deeper understanding of human performance principles and destigmatising errors. The sustained performance over the past few years demonstrates potentially lasting improvement. After careful consideration of Shell's holistic safety performance in 2024 including the outcome of the formal metrics, the in-year fatalities and the incident in December 2023, and Shell's long-term progress on safety, the REMCO has determined that the scorecard outcome for Executive Directors should be adjusted downwards to 1.61. The reduction in the bonus outcome as a result of the adjustment is equal to about 4% of salary for both Executive Directors. Safety incidents that occur in 2025 will be assessed as part of the REMCO's considerations of performance outcomes for 2025. | |
| | | | |
Governance | Annual Report on Remuneration continued
The table below summarises the 2024 annual bonus scorecard measures including their weightings, targets and outcomes.
| | |
2024 annual bonus scorecard measures and weightings |
[A]In determining the CFFO outcome, a discretionary adjustment was made to reflect a tax payment scheduled for the end of December 2024, which was unintendedly delayed until early January 2025 due to a third-party error. This has a downward impact of 0.02 on the 2024 scorecard.
[B]Upstream controllable availability: 88.0% (Threshold 82.6%, Target 84.6%, Outstanding 86.6%); Midstream availability: 91.4% (Threshold 86.1%, Target 88.1%, Outstanding 90.1%); Chemicals and Refinery availability: 92.1% (Threshold 90.7%, Target 91.7%, Outstanding 92.7%). Performance assessment is equally weighted between Upstream, Midstream, and Chemicals and Refining.
[C]Projects delivered on schedule: 81% (Threshold 40%, Target 70%, Outstanding 100%); project delivery on budget: 104% (Threshold 108%, Target 102%, Outstanding 96%). Performance assessment is equally weighted between projects delivered on schedule and on budget.
[D]Customer Satisfaction Index: 8.3 (Threshold 7.6, Target 8.1, Outstanding 8.6); Brand Share Preference: 15.0% (Threshold 13.1%, Target 13.7-13.8%, Outstanding 14.5%). Performance assessment is equally weighted between Customer Satisfaction Index and Brand Share Preference.
[E]Equity liquefaction.
Accordingly, the REMCO decided the final bonus outcome should be 161% of target and 80.5% of maximum. This results in a bonus of £2,925,000 for Wael Sawan and £1,930,000 for Sinead Gorman.
| | |
| 2024 bonus outcome calculation |
Governance | Annual Report on Remuneration continued
Long-term Incentive Plan vesting: 2022 LTIP
In 2022, Wael Sawan and Sinead Gorman were granted conditional share awards under the LTIP [A]. The table below summarises the performance conditions, weightings, targets and outcomes.
[A]Wael Sawan was not an Executive Director at the time of the award, but his award is disclosed here for transparency. Ben van Beurden, the CEO at the time, was also granted an award under the LTIP in 2022. The vesting of this award is discussed in the "Payments to past Directors" section on page 194.
| | |
2022 LTIP vesting outcomes – performance measures |
[A]TSR over the performance period was 54.6%.
The REMCO reviewed Shell's broader performance over the performance period, and also reflected on the share price at award and on vesting, noting that the share price had increased by 28% in respect of the CEO's award, and that appreciation accounted for 19% of the total value of the CEO's LTIP at vesting, and was satisfied that no windfall gain had arisen.
The REMCO decided that the LTIP outcome was consistent with the target opportunity and intended operation of the plan under the Policy and appropriate, and therefore no adjustment to the vesting outcome was required. Accordingly, the REMCO decided that the LTIP should vest at 136% of target (equivalent to 68% of maximum).
| | |
| 2022 LTIP vesting outcome |
Governance | Annual Report on Remuneration continued
In 2024, we continued on our path to become a net-zero emissions energy business by 2050. At the end of 2024, we had reduced our Scope 1 and 2 operational emissions by 30%, and the NCI of our energy products by 9.0% from our 2016 baseline.
[A]Average intensity, weighted by sales volume, of the energy products we sell, on an equity boundary, net of carbon credits. Estimated total GHG emissions included in NCI reflect well-to-wheel emissions associated with energy products sold by Shell. This includes the well-to-tank emissions associated with the manufacturing of energy products by others that are sold by Shell. In 2024, we revised the 2016 baseline NCI values and other historical NCI values. As a result, the percentage reduction achieved in 2023 was revised from 6.3% to 7.7%. (See "NCI baseline and restatement policy" on page 115).
[B]Targets set by the REMCO. Shell continually evaluates and updates its energy transition strategy, including its interim targets.
| | |
| 2022 LTIP energy transition performance condition: outcome |
Outcomes for the energy transition performance condition are determined by the REMCO based on quantitative performance and a qualitative assessment focused on Shell's short-term NCI reduction target and those elements that we understood at the time would make the most impact on achieving our goals over the three-year performance period relating to NCI: the growth of our power business, the growth of lower-carbon products, and the development of systems to absorb, capture and store carbon. This approach to the LTIP is intended to support experimentation and learning as to what actions will help deliver net-zero emissions in a profitable way. Accordingly, the REMCO uses the performance indicators as guidance, rather than applying a formulaic vesting outcome, when making its decisions.
| | | | | | | | |
| | Net carbon intensity (NCI) -- performance indicator met We achieved our short-term target for the 2022-2024 LTIP cycle to reduce our NCI by 9-12% compared with the 2016 baseline, with a 9.0% reduction by 2024, demonstrating strong year-on-year progress towards our longer-term targets. In making its decision, the REMCO reviewed how the target was met including changing product sales mix, the use of emission offsets, such as carbon credits, and the retirement of Renewable Energy Certificates, recognising the importance of these in the energy transition. |
| | Growing the power business -- performance indicator met A key element of the early cycles of the LTIP was to encourage learning about how to profitably decarbonise and the REMCO paid close attention to how management has refined the strategy for renewable power generation, energy marketing, and gas and power trading over the performance period. The emphasis has changed from a focus on growing the customer base and creating renewable generation capacity to a capital-light, sales-led strategy focusing on the Trading and Energy Marketing business as drivers of value creation. We are applying a more selective and disciplined approach to investment, prioritising investments that enable our trading and optimisation capabilities, especially in the area of flexible power management. Shell has further developed its marketing (B2B) and power trading businesses in key markets in Europe, the USA, Australia and Brazil over the performance cycle. This focus has also seen Shell divest its consumer power retail business in Europe and step back from renewable power generation opportunities that no longer fit our strategy or deliver sufficient returns. In considering the vesting outcome, the REMCO noted the work done to pivot the renewable generation, energy marketing, and gas and power trading strategy to deliver value for shareholders, the steps taken to bring renewable electrons to market, as well as the outcomes of 306 TWh/yr of total power sales achieved against an original target of 310-380 TWh/yr, of which 21% was renewable power (target 21%-31%), and considered the target as met. |
| | Growing new lower-carbon product offerings -- performance indicator partially met Shell is one of the world's largest energy traders and blenders of biofuels and is continuing to invest in low- and zero-carbon products such as hydrogen and biofuels, working closely with customers to identify the products they need to decarbonise. Metrics for the performance cycle were designed to encourage development across this range of offerings, with ambitious targets set for developing advanced biofuels and hydrogen. For advanced biofuels, the REMCO originally set a target of investment in five or six advanced biofuels projects by the end of the performance period. While two were achieved, the pipeline of opportunities did not convert into commercially viable projects as technology derisking proved costly and demand for these products did not materialise as expected. Shell continues to invest in new technologies, but with discipline and a focus on the most viable markets to ensure we deliver value for shareholders. The decision to pause on-site construction work at the biofuel facility at the Shell Energy and Chemicals Park Rotterdam (the Netherlands) is a reminder of the importance of ensuring we get the basics right. On hydrogen, the REMCO originally set a target of 750 MW of capacity to be achieved by the end of the performance period. The Holland Hydrogen I (the Netherlands) and Refhyne II (Germany) projects together provide 300 MW of production capacity and are important platforms for future hydrogen development. This is below the 750 MW target; however, in taking a balanced view on the outcome, the REMCO considered this a good result as the regulatory frameworks and business models for hydrogen continue to develop. An important element of the REMCO's deliberations has been reflection on the fact that the policy environment and market for many of these offerings are emerging more slowly than anticipated, which speaks to the overall pace of the energy transition. The REMCO needs therefore to find the right balance between holding management accountable to targets versus supporting commercial decision-making to ensure shareholder value creation. Overall, the REMCO assessed the outcome on this metric as partially met. |
Governance | Annual Report on Remuneration continued
| | | | | | | | |
| | Develop emission sinks -- performance indicator partially met The development of systems that capture and store or absorb carbon is required as part of the global response to climate change to reduce and compensate for emissions where there are not currently scalable low-carbon alternatives. The REMCO originally set a target of 25-30 mtpa CO2e offset by carbon credits through carbon-neutral customer offerings. The outcome was 2 mtpa, as low customer demand and also operational challenges contributed to a target miss on this sub-metric. Technologies related to carbon capture and storage are necessary to reduce emissions where there are few low-carbon alternatives and a target of four-five was also set for maturing CCS projects. This was achieved with four projects: Northern Lights Phase 1B (Norway), Porthos (the Netherlands), where Shell is a launch customer, Polaris, and Atlas (both Canada). The REMCO considered this a positive result and evidence of Shell developing the organisational capability to develop this type of large-scale project, which will play an important role in Shell decarbonising its operations. The REMCO considered the overall outcome on this metric to be partially met. |
Overall, the REMCO determined that the energy transition measure (accounting for 20% of the award) should vest at 130% of target. |
Consideration of 2024 single figure outcomes
In determining the final single figure outcomes for 2024, the REMCO also considered the personal performance of the Executive Directors.
2024 was another year of strong and decisive leadership from the Executive Directors. A key deliverable for the year was the Energy Transition Strategy 2024 (ETS24), published in March 2024, setting out the important role Shell intends to play in providing the energy the world needs today, and in helping to build the low-carbon energy system of the future. The Executive Directors played a pivotal role in the shaping of the strategy, and communicating it to our shareholders and other key stakeholders. The resolution was supported by 78% of shareholders who voted through an advisory vote at the 2024 AGM.
Performance, discipline and simplification continued to be our guiding principles during 2024, and the Executive Directors have modelled these values in their leadership, improving how we work across the organisation. Key successes are noted throughout this report, particularly on page 185 on the 2024 annual bonus and page 188 on the 2022 LTIP vesting outcome, and additional comments are provided below.
Wael Sawan has steered Shell through another successful year. The focus has been on delivering against the financial and climate targets set out at Capital Markets Day 2023 (CMD23), establishing a track record in consistently meeting our external commitments. In Integrated Gas and Upstream, we have seen improvement in operational performance and the successful start to a number of projects. In Downstream and Renewable Energy Solutions, there has been continuous high-grading of the portfolio to support a profitable energy transition. Wael Sawan has demonstrated clear and decisive leadership, driving growth where we have a competitive advantage, and making tough decisions to pause and address performance challenges where needed (for example, pausing the biofuels project in the Netherlands). By the end of 2024, key achievements included:
○delivery against CMD23 commitments, including total shareholder distributions* in 2024 of 41% of CFFO ($22.6 billion), at the upper end of the promised 30-40% of CFFO through the cycle, and structural cost reduction* of $3.1 billion since 2022 against the commitment of $2-3 billion by the end of 2025;
○continued high-grading of the portfolio, including agreement to sell our Energy and Chemicals Park in Singapore and our Nigerian onshore subsidiary, The Shell Petroleum Development Company of Nigeria Limited (SPDC);
○delivery of improved operational performance, including Prelude significantly increasing its controllable availability since its turnaround last year;
○final investment decisions made across a number of low-carbon projects, including the Polaris and Atlas (Phase 1) CCS projects in Canada, and the hydrogen project Refhyne II in Germany;
○continuing Shell's role in shaping the broader energy conversation through engagements at events including CERAWeek, ROG.e, ADIPEC, and the Center for Strategic and International Studies;
○continued focus on safety and climate performance, including the achievement of a 30% reduction of Scope 1 and 2 operational emissions, and a 9.0% reduction in NCI vs. the 2016 baseline; and
○driving Shell's performance, discipline and simplification, growing business empowerment across all organisational levels.
Working closely with the CEO, Sinead Gorman has continued to demonstrate her skills as a leader, helping to drive a high-performance culture and a learner mindset. The year is characterised by strong financial results, a healthy balance sheet and capital discipline. Sinead Gorman has steered the Finance function's disciplined capital stewardship and effective management of Shell's financial framework, allowing Shell to meet its organisational objectives and commitments to shareholders. By the end of 2024, Sinead Gorman's key achievements included:
○together with the CEO, delivery of strong financial results with net income of $16.5 billion, Adjusted Earnings* of $23.7 billion, and CFFO of $54.7 billion, our second best year on record, against plan target of $46 billion;
○strengthening the balance sheet by reducing net debt* to $38.8 billion, and enhancing the resilience of the Company;
○playing a critical role in shaping ETS24, securing the advisory vote from shareholders in support of this strategy at the 2024 AGM;
○continuing to drive capital discipline, with cash capital expenditure in 2024 below the target range for the year and creating a culture in which a focus on value creation is central; and
○continued focus on climate performance, including the achievement of a 30% reduction of Scope 1 and 2 operational emissions, and a 9.0% reduction in NCI vs. the 2016 baseline.
* Non-GAAP measure (see page 337).
Governance | Annual Report on Remuneration continued
The REMCO also considered a range of other factors in finalising its remuneration decisions for 2024, including:
○Shell's performance in 2024 and over the LTIP performance period 2022-2024, and the formulaic outcomes of the bonus and the LTIP performance conditions;
○the impact of fatalities on the formulaic scorecard outcome;
○absolute and relative TSR performance over the period;
○a range of factors that take account of Shell's performance beyond the formulaic outcomes of the variable pay structures, including safety, reputation, ethics and compliance, and feedback from the ARC and SUSCO; and
○the external environment and wider stakeholder experience, including shareholders' expectations with regard to executive pay decision-making and the employee experience;
○the Executive Directors' remuneration compared with the variable pay outcomes for the general workforce;
○the alignment of the Executive Directors with the shareholder experience through their high shareholding requirements; and
○the Executive Directors' remuneration compared with historical outcomes.
After reflecting on the above factors, the REMCO was satisfied with the single figure outcomes for the CEO and the CFO.
Malus and clawback
No malus or clawback provisions were applied during 2024.
2024 LTIP
| | |
| Scheme interests awarded to Executive Directors in 2024 (audited) |
In 2024, the Executive Directors were awarded conditional share awards under the LTIP as set out in the table below. In approving the awards, the REMCO considered Shell's historical share price, including the share price over the prior year, and noted that the share price at award was in line with that in 2023 and was higher than average historical levels. The REMCO determined that the risk of windfall gain was limited, and therefore no adjustment was made to the award size.
| | | | | | | | | | | | | | | | | |
| Scheme interest type | Type of interest awarded | End of performance period | Target award [A] | Potential amount vesting |
Minimum performance
(% of shares awarded) [B] | Maximum performance (% of shares of the target award) |
| LTIP | Performance shares | December 31, 2026 | Wael Sawan: 169,937 London-listed ordinary shares, equivalent to 3.0 x base salary or £4,200,000. Sinead Gorman: 101,051 London-listed ordinary shares, equivalent to 2.7 x base salary or £2,497,500. | 0 | Maximum number of shares vesting is 200% of the shares awarded, before dividends. |
[A]The awards for both Executive Directors were made based on the closing market price on the date of award, February 2, 2024, for ordinary shares of £24.72.
[B]Minimum performance relates to the lowest level of achievement, for which there is no vesting.
The performance conditions and weightings applying to LTIP awards made in 2024 were: relative cash generation (25% weighting), relative TSR (25%), absolute OFCF (25%), and energy transition (25%).
Relative performance conditions
The relative performance conditions are based on our performance on key financial and external measures against our closest comparators.
Cash generation is defined as CFFO divided by average capital employed, and measures Shell's ability to generate the top-line cash flow to finance investment in our business and shareholder distributions.
TSR measures actual value created for shareholders (i.e. change in share price plus dividends) and, as in prior years, is calculated in US dollars using a 90-day averaging period.
Vesting under each relative performance condition is assessed independently, with the vesting outcome ranging from 0% to 200% of the target award in respect of the measure, in accordance with the following vesting schedule:
○ranking first equals 200% vesting;
○ranking second equals 150% vesting;
○ranking third equals 80% vesting; and
○ranking fourth or fifth equals 0% vesting.
Outperforming Shell's closest competitors on key financial metrics is challenging. The REMCO is aware that vesting for median performance is generally set at a limit of 25% of maximum for other UK companies, but notes that this is typically applied against a larger comparator group. A vesting outcome of 80% for median performance (40% of maximum) in a small comparator group is considered appropriate by the REMCO.
Governance | Annual Report on Remuneration continued
Absolute measures
Organic free cash flow (OFCF)
The OFCF performance condition supports the delivery of our cash flow priorities, which are to service and reduce debt, pay dividends, buy back shares and make future capital investments.
The performance targets for OFCF are set by reference to Shell's annual operating plans, based on the sum of plan OFCF targets over the three-year performance period, and updating the plan each year to reflect a changing price premise. The REMCO has a long-standing no-adjustments policy, and believes it is more appropriate to set the target based on the aggregation of the annual operating plans rather than setting a three-year target at the outset and making necessary adjustments at the end. OFCF targets are disclosed retrospectively and in aggregate, following the conclusion of the three-year period.
Under the OFCF performance condition, achievement of threshold performance will result in 40% of the target award (20% of maximum) in respect of the OFCF vesting, increasing to full vesting for achievement of outstanding performance. A straight-line vesting schedule will apply for performance between threshold and outstanding.
Energy transition
For the 2024 award, the REMCO's determination of the extent to which awards will vest will be based on its holistic assessment of progress towards reducing emissions from our operations and supporting customers to reduce their emissions. For more information, see the 2023 Directors' Remuneration Report. The key factors in the REMCO's decision will be disclosed at the end of the performance period (unless commercially sensitive).
| | | | | |
| |
| For information on Shell's energy transition, see the Energy Transition Strategy 2024 on shell.com. |
| |
Performance update on OFCF
2023 LTIP award
At December 31, 2024, OFCF* performance was above target, with a strong outcome of $35.9 billion for 2023 (target $22.0 billion), and $37.5 billion for 2024 (target $24.0 billion). As one year of OFCF performance remains, and 75% of the award is subject to relative and energy transition performance conditions, this does not reflect the potential vesting of the award.
2024 LTIP award
At December 31, 2024, OFCF* performance was above target, based on $37.5 billion for 2024 (target $24.0 billion). As two years of OFCF performance remain, and 75% of the award is subject to relative and energy transition performance conditions, this does not reflect the potential vesting of the award.
| | |
| Single figure of total remuneration for Non-executive Directors (audited) |
| | | | | | | | | | | | | | | | | | | | | | | | | | | | | |
| £ thousand |
| Fees | | Taxable benefits [A] | | Total |
| 2024 | | 2023 | | 2024 | 2023 | | 2024 | 2023 |
| Dick Boer | 220 | | 192 | | 9 | 20 | | 229 | 212 |
| Neil Carson | 177 | | 171 | | 9 | 11 | | 186 | 182 |
| Ann Godbehere | 186 | | 184 | | 36 | 68 | | 222 | 252 |
| Jane Holl Lute | 166 | [B] | 164 | | 59 | 35 | | 225 | 199 |
| Catherine Hughes | 196 | [B] | 190 | | 31 | 50 | | 227 | 240 |
| Sir Andrew Mackenzie | 850 | [C] | 785 | | 1 | 2 | | 851 | 787 |
Sir Charles Roxburgh [D] | 165 | [B] | 126 | | 116 | 2 | | 281 | 128 |
Bram Schot | 150 | | 150 | | 10 | 15 | | 160 | 165 |
Leena Srivastava [D] | 155 | [B] | 120 | | 15 | — | | 170 | 120 |
Cyrus Taraporevala [E] | 168 | [B] | 134 | | 44 | 1 | | 211 | 135 |
[A]UK regulations require the inclusion of benefits where these would be taxable in the UK, on the assumption that Directors are tax residents in the UK. On this premise, the taxable benefits include the cost of a Non-executive Director's occasional business-required partner travel. Shell also pays for travel between home and the head office, where Board and committee meetings are typically held, and related hotel and subsistence costs. For consistency, business expenses for travel between home and the head office are not reported as taxable benefits because for most Non-executive Directors this is international travel and hence would not be taxable in the UK.
[B]Fees disclosed are those in respect of 2024, of which £12,000 was paid in 2025.
[C]Fees disclosed are those in respect of 2024, of which £65,000 was paid in 2025.
[D]Appointed as a Director with effect from March 13, 2023.
[E]Appointed as a Director with effect from March 2, 2023.
* Non-GAAP measure (see page 337). The most comparable GAAP financial measure for organic free cash flow is cash flow from operating activities of $54.7 billion for 2024.
Governance | Annual Report on Remuneration continued
Statement of Directors' shareholding and share
interests (audited)
Shareholding guidelines
The REMCO believes that Executive Directors should align their interests with those of shareholders by holding shares in Shell plc.
Only unfettered shares count towards an Executive Director's shareholding. Shares delivered that are subject to holding requirements also count towards the guidelines. The CEO and the CFO have five years from their respective appointment to the Board to achieve their respective shareholding requirements.
There is a Company-sponsored nominee account for each employee which allows for restrictions to be applied on the sale or transfer of shares that are subject to holding periods. The restrictions remain in force beyond the Executive Director's employment.
| | | | | |
| |
| See page 202 for further details of the shareholding guidelines. |
| |
Directors' share interests
The interests, in shares of the Company or calculated equivalents, of the Directors in office during 2024, including any interests of their connected persons, are set out in the table below.
| | |
| Directors' share and scheme interests (audited) |
| | | | | | | | | | | | | | | | | | | | | | | |
| Ordinary shares held at January 1, 2024 | | Ordinary shares held at December 31, 2024 | | Unvested and subject to performance conditions [A] | Shareholding guideline as % of salary | Current shareholding
as % of salary [B] |
| Executive Directors | | | | | | | |
Wael Sawan | 179,406 | | 266,533 | | 476,070 | 700% | 454% |
| Sinead Gorman | 65,519 | | 105,589 | | 335,425 | 500% | 272% |
| Non-executive Directors | | | | | | | |
| Dick Boer | 10,000 | | 10,000 | | | | |
| Neil Carson | 16,000 | | 16,000 | | | | |
| Ann Godbehere | 10,000 | [C] | 10,000 | [C] | | | |
| Jane Holl Lute | 7,332 | [D] | 7,332 | [D] | | | |
Catherine Hughes | 55,984 | [E] | 55,984 | [E] | | | |
| Sir Andrew Mackenzie | 37,175 | [F] | 37,175 | | | | |
Sir Charles Roxburgh | 2,000 | | 5,000 | | | | |
| Bram Schot | — | | — | | | | |
Leena Srivastava | — | | — | | | | |
Cyrus Taraporevala | 10,000 | [G] | 10,000 | [G] | | | |
[A]Includes unvested long-term incentive awards and notional dividend shares accrued at December 31, 2024. Interests are shown on the basis of the original awards, which can vest at between 0% and 200% based on performance. Dividend shares accumulate each year on an assumed notional LTIP award. Such dividend shares are disclosed and recorded on the basis of the number of shares conditionally awarded but, when an award vests, dividend shares will be awarded only in relation to vested shares as if the vested shares were held from the award date.
[B]Calculated using the £24.76 per share closing price on December 31, 2024, the last market day of 2024.
[C]Held as 5,000 ADS. Each ADS represents two ordinary shares.
[D]Held as 3,666 ADS. Includes purchases pursuant to a Dividend Reinvestment Scheme.
[E]Held as 50,984 ordinary shares and 2,500 ADS.
[F]Revised from 35,858 ordinary shares (as at December 31, 2023) in the 2023 Directors' Remuneration Report.
[G]Held as 5,000 ADS.
The changes to Directors' shareholdings as at March 7, 2025,
are as follows:
○Wael Sawan's share interest increased by 108,275 ordinary shares after the delivery of the 2024 annual bonus shares and the vesting of the 2022 LTIP award; and
○Sinead Gorman's share interest increased by 105,341 ordinary shares after the delivery of the 2024 annual bonus shares and the vesting of the 2022 LTIP award.
At March 7, 2025, the Directors and Senior Management (pages 149 and 154) of the Company beneficially owned, individually and in aggregate (including shares under option), less than 1% of Company shares. These shareholdings are not considered sufficient to affect
the independence of the Directors.
Governance | Annual Report on Remuneration continued
Dilution
In any 10-year period, no more than 5% of the issued ordinary share capital of the Company may be issued or issuable under executive (discretionary) share plans adopted by the Company, or 10% when aggregated with awards under any other employee share plan operated by the Company. To date, no shareholder dilution has resulted from these plans, although it is permitted under the rules
of the plans, subject to these limits.
Payments for loss of office
There were no payments for loss of office to Executive Directors in 2024 (audited). During 2024, the former Company Secretary received €1,040,470 gross in voluntary severance payment, in line with local Dutch policy.
Payments to past Directors (audited)
Former CEO Ben van Beurden received an LTIP award of 209,131 ordinary shares in 2022, which has been pro-rated. The pro-rated award vested at 136% of target based on performance to December 31, 2024. Therefore, 161,777 ordinary shares (including accrued dividends) vested on March 6, 2025, with a value at vesting of £4,128,548. A three-year holding period applies, which remains in
force after termination. In respect of 2024, Ben van Beurden also received taxable benefits totalling £18,532, including £8,362 in gross-up costs.
Former CFO Jessica Uhl received taxable benefits of £38,046 in respect of 2024, the majority of which related to gross-up costs.
Payments below £5,000 are not reported as they are considered de minimis.
TSR performance and CEO pay
Performance graph
The graph below compares the TSR performance of Shell plc over the past 10 financial years with that of the FTSE 100 Index. The Board regards this index as the most appropriate broad market equity index for comparison, following the move of Shell's headquarters to the UK.
CEO pay outcomes
The table below the graphs sets out (i) the single figure of total remuneration, (ii) the annual bonus outcome, and (iii) the LTIP vesting outcome for the CEO for the past 10 years.
| | |
Historical TSR performance Value of hypothetical £100 holding |
| | | | | | | | | | | | | | | | | | | | | | | | | | | | | | | | |
| Year | 2015 | 2016 | 2017 | 2018 | 2019 | 2020 | 2021 | 2022 | 2023 | 2024 |
| CEO | Ben van Beurden | Wael Sawan |
Single figure of total remuneration (£000) [B] | 4,049 | 7,046 | 7,811 | 17,817 | 8,746 | 5,197 | 6,344 | 9,698 | 7,940 | 8,615 |
Annual bonus award (% of maximum opportunity) | 98% | 66% | 81% | 79% | 21% | — | 64% | 73% | 78% | 81% |
LTIP vesting (% of maximum opportunity) | 8% | 42% | 35% | 95% | 74% | 45% | 25% | 41% | 47% | 68% |
[A]Data shown are for the performance of RDS B shares prior to the assimilation of Shell's shares into a single line of ordinary shares on January 29, 2022.
[B]Prior to 2022, the CEO's remuneration was denominated in EUR. Each year's single figure of total remuneration has been converted to GBP using the 12-month average exchange rates for the year.
Governance | Annual Report on Remuneration continued
Percentage change in remuneration of the Directors and employees
The table below compares the remuneration of the Executive and Non-executive Directors of Shell plc with an employee comparator group consisting of local employees in the UK, the USA and the Netherlands. The local employee population of these countries is considered to be a suitable employee comparator group because: these are countries with a significant Shell employee base; a large proportion of senior managers come from these countries; and the REMCO considers remuneration levels in these countries when setting base salaries for Executive Directors. For the purposes of comparison, the change in employee remuneration is calculated by reference to the change in salary scale, benefits and annual bonus for a notional employee in each of the base countries, not by reference to the actual change in pay for a group of employees.
Taxable benefits are those that align with the definition of taxable benefits applying in the respective country. In line with the "Single figure of total remuneration for Executive Directors" table, the annual bonus is included in the year in which it was earned (rather than paid).
| | |
| Percentage change in remuneration of Directors and employees [A] |
| | | | | | | | | | | | | | | | | | | | | | | | | | | | | | | | | | | | | | | | | | | | | | | | | | | | | |
| Salary/fees (% change) | | Benefits (% change) | | Annual bonus (% change) |
| 2023- 24 | 2022- 23 | 2021- 22 | 2020- 21 | 2019- 20 | | 2023- 24 | 2022- 23 | 2021- 22 | 2020- 21 | 2019- 20 | | 2023- 24 | 2022- 23 | 2021- 22 | 2020- 21 | 2019- 20 |
| Employees [B] | 3.7% | 5.7% | 2.4% | 0.6% | 3.0% | | 13.7% | (10.2%) | (8.4%) | 0% | 0% | | 7.5% | 14.3% | (0.4%) | — | (100.0%) |
| Executive Directors | |
| Wael Sawan | 3.9% | — | — | — | — | | (88.2%) | — | — | — | — | | 7.9% | — | — | — | — |
| Sinead Gorman [C] | 3.9% | 37.0% | — | — | — | | (83.5%) | (39.7%) | — | — | — | | 12.2% | 45.8% | — | — | — |
| Non-executive Directors [D] | |
| Dick Boer | 14.7% | 25.4% | 6.3% | 70.4% | — | | (58.0%) | 389.8% | — | — | — | | | | | | |
| Neil Carson | 3.5% | — | 3.6% | 4.3% | 85.6% | | (19.4%) | 593.0% | — | — | — | | | | | | |
| Ann Godbehere | 1.1% | — | 0.8% | 2.9% | 15.8% | | (46.8%) | 829.4% | 1286.7% | — | — | | | | | | |
| Jane Holl Lute | 1.1% | 6.7% | 80.4% | — | — | | 67.0% | 155.0% | 1893.8% | — | — | | | | | | |
| Catherine Hughes | 3.0% | 4.6% | 14.1% | 2.8% | (10.0%) | | (37.3%) | 435.0% | 868.8% | — | — | | | | | | |
| Sir Andrew Mackenzie | 8.3% | — | 57.0% | 1473.0% | — | | (30.2%) | (57.5%) | (69.3%) | — | — | | | | | | |
| Sir Charles Roxburgh | 31.2% | — | — | — | — | | 5,453.1% | — | — | — | — | | | | | | |
| Bram Schot | — | 4.1% | 10.1% | 300.0% | — | | (32.4%) | 702.6% | — | — | — | | | | | | |
| Leena Srivastava | 29.0% | — | — | — | — | | — | — | — | — | — | | | | | | |
| Cyrus Taraporevala | 25.1% | — | — | — | — | | 3139.1% | — | — | — | — | | | | | | |
[A]Where the value for the preceding year was zero or the individual was not in post and therefore no comparison data are available, '-' is recorded.
[B]Relates to change in pay for local employees in the UK, the USA and the Netherlands.
[C]Sinead Gorman was appointed as CFO effective April 1, 2022. The changes in remuneration shown for 2022-2023 are based on the period April 1, 2022 to December 31, 2022 for 2022, and a full year for 2023.
[D]Non-executive Directors do not receive any short-term incentives. The increases shown reflect the individuals' appointment to the Board part-way through the prior year, or additional fees payable for joining Board committees. For details of Board appointment and departure dates, see "Single figure of total remuneration for Non-executive Directors" on page 192.
Relative importance of spend on pay
The table below sets out distributions to shareholders by way of dividends and share buybacks, and remuneration paid to or receivable by employees for the last five years, together with annual percentage changes.
| | | | | | | | | | | | | | | | | |
| Year | Dividends and share buybacks [A] | | Spend on pay (all employees) [B] |
| $ billion | Annual change | | $ billion | Annual change |
| 2024 | 22.6 | (2)% | | 13.5 | (1)% |
| 2023 | 23.0 | (11)% | | 13.6 | (2)% |
| 2022 | 25.8 | 183% | | 14.0 | 16% |
| 2021 | 9.1 | — | | 12.1 | — |
| 2020 | 9.1 | (64)% | | 12.1 | (8)% |
[A]Dividends paid and repurchases of shares as reported in the "Consolidated Statement of Changes in Equity".
[B]Employee costs, excluding redundancy costs, as reported in Note 33 to the "Consolidated Financial Statements".
Spend on pay can be compared with the major costs associated with generating income by referring to the "Consolidated Statement of Income". Over the last five years, the average spend on pay was around 5% of the major costs of generating income. These costs are considered to be the sum of: purchases; production and manufacturing expenses; selling, distribution and administrative expenses; research and development; exploration; and depreciation, depletion and amortisation.
External appointments
Neither Wael Sawan nor Sinead Gorman held any external
Non-executive Director positions during 2024.
Governance | Annual Report on Remuneration continued
Statement of voting at AGMs
Shell's 2024 AGM was held on May 21, 2024. The result of the poll in respect of the 2023 Annual Report on Remuneration was as follows:
| | |
| Approval of 2023 Annual Report on Remuneration |
| | | | | | | | | | | |
| Votes | Number | | Percentage |
| For | 3,837,712,517 | | 94.83% |
| Against | 209,399,986 | | 5.17% |
| Total cast | 4,047,112,503 | [A] | 100.00% |
| Withheld [B] | 23,487,236 | | |
[A]Representing 63.47% of issued share capital.
[B]A vote withheld is not a vote under UK law and is not counted in the calculation of the proportion of the votes for and against a resolution.
The 2023 Directors' Remuneration Policy was approved at the 2023 AGM. The result of the poll was as follows:
| | |
| Approval of 2023 Directors' Remuneration Policy |
| | | | | | | | | | | |
| Votes | Number | | Percentage |
| For | 3,931,530,222 | | 94.60% |
| Against | 224,454,202 | | 5.40% |
| Total cast | 4,155,984,424 | [A] | 100.00% |
| Withheld [B] | 29,173,157 | | |
[A]Representing 60.97% of issued share capital.
[B]A vote withheld is not a vote under UK law and is not counted in the calculation of the proportion of the votes for and against a resolution.
| | | | | | | | | | | | | | | | | |
| Option [A] | 25th percentile pay ratio | Median
pay ratio | 75th percentile pay ratio |
| 2024 | A | 83:1 | 61:1 | 40:1 |
Total pay and benefits:
Salary: | £103,390 £54,327 | £141,334 £88,049 | £216,048 £104,877 |
| 2023 | A | 80:1 | 58:1 | 39:1 |
Total pay and benefits:
Salary: | £99,599 £70,000 | £136,066 £76,444 | £205,115 £102,634 |
| 2022 | A | 134:1 | 80:1 | 50:1 |
Total pay and benefits:
Salary: | £72,632
£45,904 | £121,847
£56,302 | £192,995
£96,790 |
| 2021 | A | 97:1 | 57:1 | 37:1 |
Total pay and benefits:
Salary: | £65,123 £43,550 | £111,912 £68,238 | £170,289 £101,000 |
| 2020 | A | 93:1 | 57:1 | 38:1 |
Total pay and benefits:
Salary: | £55,584 £49,117 | £90,972 £75,365 | £136,007 £118,291 |
| 2019 | A | 147:1 | 87:1 | 54:1 |
Total pay and benefits:
Salary: | £59,419 £40,417 | £100,755 £56,721 | £161,717 £79,991 |
| 2018 | A | 202:1 | 143:1 | 92:1 |
Total pay and benefits:
Salary: | £88,112 £53,528 | £124,459 £80,407 | £193,027 £96,074 |
[A]Shell has chosen to use option A (as defined in UK reporting regulations) to calculate the CEO pay ratio in accordance with guidance from the UK government that this is the preferred approach and the most statistically accurate method for identifying the ratios. Under option A, a comparable single figure for all UK employees has been calculated in order to identify the employees whose pay and benefits are at the 25th, 50th (median) and 75th percentiles for comparison with the CEO. Employee pay has been calculated based on the total pay and benefits paid in respect of 2024 for all employees who were employed on December 31, 2024. For part-time workers and joiners in the year, pay and benefits have been annualised based on the proportion of their working time in the UK during the year. This is calculated with an approach consistent with the methodology for determining annual bonuses. The REMCO believes that this provides a fair and reasonable calculation of the pay ratios for Shell employees in the UK.
The ratio of the CEO's pay to the median UK employee is 61. The ratio at median for 2024 is higher than for 2023, reflecting higher variable pay outcomes. While variable pay outcomes have also increased for other UK employees, a higher proportion of the CEO's remuneration is variable, meaning the pay ratio is higher in years of higher variable pay outcomes. The REMCO believes the CEO pay ratio for 2024 is consistent with Shell's philosophy of pay for performance.
Directors' employment arrangements and letters of appointment
Executive Directors are employed for an indefinite period. Non-executive Directors, including the Chair, have letters of appointment. Details of Executive Directors' employment arrangements can be found in the Policy on pages 205-206.
| | | | | |
| |
| Further details of Non-executive Directors' terms of appointment can be found in the "Other regulatory and statutory information" on page 211 and the "Governance framework" report on page 149. |
| |
Compensation of Directors and Senior Management
During the year ended December 31, 2024, Shell paid and/or accrued compensation totalling $46 million (2023: $57 million) to Directors and Senior Management for services in all capacities while serving as a Director or member of Senior Management, including $2 million (2023: $2 million) accrued to provide pension, retirement and similar benefits. The amounts stated are those recognised in Shell's income attributable to Shell plc shareholders on an IFRS basis. See Note 34 to the "Consolidated Financial Statements". Personal loans or guarantees were not provided to Directors or Senior Management.
Workforce engagement on remuneration matters
Workforce engagement
Our employees are fundamental to our success. Fostering a collaborative culture and reinforcing a learner mindset is central to delivering our strategy. The Board's view is that all Directors have a collective responsibility for workforce engagement, ensuring that employees' voices are heard on all business matters, including pay, and that the Company communicates effectively to employees on our remuneration policies and practices.
The Board and management regularly engage with the workforce through a range of formal and informal channels. These include webcasts and all-employee messages from our CEO and other senior leaders; town halls and team meetings; virtual coffee connects; interviews with senior management; internal social platforms; and focused engagements. During interactive sessions, employees have the opportunity to ask about any topic, including pay. The Board's preference is to build on existing, long-standing channels of engagement for discussions around remuneration. During the year, management engaged with the workforce on what the 2024 performance metrics meant for each of us, giving employees the opportunity to ask any questions on this topic. We also conduct annual employee surveys; further information is on page 132.
Wider employee context
The REMCO receives annual updates on workforce remuneration topics, including employees' views on pay matters; CEO pay ratio; workforce reward philosophy and principles; alignment of Shell values and behaviours with remuneration practices; and general employee salary planning and variable pay outcomes, taking into account the cost of living environment and the impact of this on our colleagues. The REMCO is also periodically updated on wider employee matters such as the UK gender and ethnicity pay gap analyses. In this way, the REMCO is able to satisfy itself that reward across Shell is aligned to our strategy, culture, and long-term sustainable success.
Governance | Annual Report on Remuneration continued
Shell adheres to its fair pay principles in all remuneration-related matters. Pay in Shell is market-competitive, free from bias, and provides security to our employees. Shell sets clear performance expectations, gives employees the opportunity to share in Shell's success through
a variety of variable pay schemes, and is transparent and clear in its communication of remuneration. For more information, visit the "Careers" section of shell.com.
How executive remuneration aligns with wider Company pay policy
Executive remuneration structures in Shell are strongly aligned with the structures for the broader workforce, as set out in the table below.
| | | | | |
| Element | Comparison of Executive Director and wider workforce arrangements |
| Salary | The Executive Directors' salaries are reviewed with reference to the factors set out in the Policy, against defined comparator groups. The market-competitiveness of wider workforce salaries is assessed at a base country level. |
| Pension and benefits | The Executive Directors' pension benefits are aligned with those offered to employees who joined Shell from 2013 onwards in the UK. Shell does not operate separate executive pension arrangements. All Group employees participate in the relevant pension plan for their base country based on their date of joining. The Executive Directors are eligible to receive the same benefits available to the broader workforce. |
Annual
bonus | The Group scorecard applicable to Group employees is identical to that applicable to Executive Directors in terms of performance measures, weightings and targets. For the wider workforce, an additional multiplier applies based on individual performance during the year. No individual multiplier applies to Executive Directors, and further, 50% of the bonus is paid in shares, and the bonus is subject to malus and clawback provisions. |
| Long-term incentives | In 2025, Executive Directors and around 120 senior executives received Performance Share Awards (PSA) on the same terms. Executive Directors' awards are subject to a three-year holding period. Around 12,000 employees received a mix of PSAs and Restricted Share Awards, with the split based on seniority. Further information is on page 134. |
| Shareholding guidelines | The Executive Directors have the highest shareholding guidelines in the Company, which are set at 700% and 500% of salary for the CEO and the CFO, respectively. These guidelines continue post termination for a period of two years. Shareholding guidelines extend into the organisation to senior manager level. Employees are required to achieve their individual guideline within a specified timeframe, as is the case for Executive Directors. |
Statement of planned implementation of Policy in 2025
A summary of how the shareholder-approved Policy will be applied to Directors' remuneration for 2025 is set out below.
Executive Directors
Comparator group
The benchmarking comparator group for 2025 remains consistent with that used in prior years, and consists of other oil majors (bp, Chevron, ExxonMobil and TotalEnergies) and a selection of major Europe-based companies. The oil majors are included in the comparator group as these represent our closest direct competitors operating in similar market conditions. The Europe-based companies are selected based on their size, complexity and global reach. The REMCO retains the right to alter the comparator group as it sees fit to ensure it remains an appropriate and relevant benchmark.
The REMCO uses benchmark data from these companies only as a guide to the competitiveness of the remuneration packages. The REMCO does not seek to position remuneration at any defined point against the comparator data.
| | |
European comparator group |
| | | | | | | | |
| Allianz | Glencore | Rio Tinto |
| AstraZeneca | GSK | Roche |
| BAT | Mercedes-Benz | Siemens |
| Bayer | Nestlé | Unilever |
Diageo | Novartis | Vodafone |
Salaries
Effective January 1, 2025, Wael Sawan and Sinead Gorman received a salary increase of 5.5%, and salaries for 2025 are £1,535,000 and £1,014,000, respectively.
In reviewing the Executive Directors' salaries, the REMCO carefully considered the external environment, and the increases provided to the Shell workforce in the key markets of the UK (5.5%), the USA (3.0%) and the Netherlands (3.6%). The Executive Directors' increases for 2025 were positioned in line with other UK employees and the REMCO recognised the multiplier effect on total remuneration. Executive Directors' salary increases for 2024 were positioned below that for other UK employees.
Annual bonus
The REMCO reviewed the bonus scorecard during the year and considered that it remained well aligned with our strategic and operational priorities. There are no changes for 2025, except that the personal safety metric will be renamed fatality and permanent impairment, replacing serious injury, illness and fatality frequency. This is part of Shell's commitment to transition to industry standards defined by the industry association, International Oil & Gas Producers. The scope and definition of the metric remain unchanged.
Some shareholders have commented on the use of LNG in the energy transition performance measure in the bonus. The REMCO reviewed this matter during the year. LNG has a critical role to play in Shell's energy transition strategy by producing less carbon emissions than coal when used to generate electricity, helping to maintain grid stability as the share of renewable energy grows, increasingly powering transport and shipping, and providing energy security in the coming decades. Therefore, the REMCO believes it is important that LNG is appropriately captured in the scorecard.
Governance | Annual Report on Remuneration continued
| | |
2025 annual bonus measures, weightings,
and link to strategy |
[A]Equity liquefaction.
Scorecard targets will be disclosed in the subsequent Directors' Remuneration Report when they are no longer deemed to be commercially sensitive.
Performance Share Awards
On January 31, 2025, Performance Share Awards (PSA) were made to the Executive Directors resulting in 162,964 Shell plc shares being awarded to Wael Sawan and 96,871 to Sinead Gorman. The awards had a face value of 300% (maximum performance outcome 600%) of salary for Wael Sawan and 270% (maximum performance outcome 540%) of salary for Sinead Gorman, excluding potential share price appreciation and dividends. The 2025 PSAs to Executive Directors are based on salaries as at December 31 of the prior year, consistent with the rest of the organisation.
The REMCO reviewed the award levels in the context of share price movement over the year prior to award, and determined that the risk of windfall gain was limited and therefore no adjustment was made.
Performance is measured over the three-year period January 1, 2025, to December 31, 2027. The performance measures, weightings and link to strategy for the 2025 award are set out on this page.
| | |
2025 PSA performance conditions, weightings,
and link to strategy |
Performance framework for the 2025 PSA "Shell's journey
in the energy transition" performance condition
The REMCO's determination of the vesting outcome will be based on its holistic assessment of progress towards reducing emissions from our operations and supporting our customers to reduce their emissions. This will be based on our journey to net-zero climate targets for our own operations of:
○halving Scope 1 and 2 emissions by 2030 under operational control on a net basis (2016 baseline);
○eliminating routine flaring from Upstream operations by 2025 [A]; and
○maintaining methane emissions intensity below 0.2% and achieving near-zero methane emissions by 2030 [B].
[A]This target was subject to the completion of the sale of The Shell Petroleum Development Company of Nigeria Limited (SPDC). With effect from January 1, 2025, SPDC ceased routine flaring. As detailed elsewhere in this report, on March 13, 2025, Shell completed the sale of SPDC to Renaissance.
[B]On an intensity basis.
Governance | Annual Report on Remuneration continued
The REMCO will also take account of progress in developments that support the energy transition to 2030 and beyond, such as the development of our Power business (including renewables), lower-carbon LNG, biofuels, electric vehicle charging, hydrogen and CCS.
We will take into account progress towards achieving a 15-20% reduction in NCI by 2030 (2016 baseline), a 15-20% reduction in customer emissions from the use of our oil products by 2030 (2021 baseline) [A], as well as Shell's wider performance in accelerating the energy transition, e.g. demonstrating leadership and advocacy in standard setting, alongside any other factors that the REMCO considers relevant.
[A]This ambition was set in March 2024. Customer emissions from the use of our oil products (Scope 3, Category 11) were 517 million tonnes CO2e in 2023 and 569 million tonnes CO2e in 2021.
The REMCO will provide a full disclosure of all material factors, both quantitative and qualitative, that it took into account in reaching the vesting decision.
Malus and clawback
The annual bonus is subject to malus provisions before it is delivered, and to clawback thereafter for a period of three years. The PSA is subject to malus provisions before vesting, and to clawback provisions thereafter for a period of three years. Shell's chosen malus and clawback periods align with the performance and holding periods, respectively, for simplicity. A full description of the circumstances under which malus and clawback might be applied to a variable pay award is set out in the Policy.
Pension
There are no changes to pension benefits for 2025.
Benefits
Executive Directors are provided with a chauffeured car for business travel, including home-to-office commuting. Other benefits, such as medical and other risk benefits are in line with those provided to the general workforce.
Non-executive Directors' fees
| | |
| 2025 Non-executive Directors' fees |
| | | | | | | | | | | |
| £ | | Other fees |
| Chair of the Board | 850,000 | | Non-executive Directors receive an additional fee of £4,000 for any Board meeting involving intercontinental travel – except for one meeting a year held in a location other than London. |
| Non-executive Director | 120,000 | |
| Senior Independent Director | 49,000 | |
Audit and Risk Committee | | |
| Chair [A] | 55,000 | |
| Member | 25,000 | |
Sustainability Committee | |
| Chair [A] | 31,000 | |
| Member | 15,000 | |
| Nomination and Succession Committee | |
| Chair [A] | 22,000 | |
| Member | 11,000 | |
| Remuneration Committee | |
| Chair [A] | 42,000 | |
| Member | 15,000 | |
[A]The chair of a Committee does not receive an additional fee for membership of that Committee.
The Company Chair fee is determined by the REMCO, and for 2025 remains £850,000. The Chair of the Board does not receive any additional fee for chairing the Nomination and Succession Committee or attending any other Board Committee meeting.
The Non-executive Directors receive a basic fee. There are additional fees for the Senior Independent Director, a Board Committee chair or a Board Committee member, and for most Board meetings involving intercontinental travel. Business expenses (including transport between home and office and occasional business-required partner travel) and associated tax are paid or reimbursed by Shell.
The Board reviews Non-executive Directors' fees periodically to ensure that they are aligned with those of other major listed companies. During these reviews the Board considers fees in the top 30 companies within the FTSE 100 index and the European comparator group as its primary points of reference. For 2025, fees remain unchanged.
Directors' Remuneration Policy
| | | | | | | | |
| | |
| The Directors' Remuneration Policy sets out:
○A summary of shareholder-approved changes to the Directors' Remuneration Policy, page 200. ○Executive Directors' Remuneration Policy, page 201. ○Non-executive Directors' Remuneration Policy, page 206. | |
| | |
This section describes the Directors' Remuneration Policy (the Policy) which, following shareholder approval at the 2023 Annual General Meeting (AGM), came into effect from May 23, 2023, and will be effective until the 2026 AGM, unless a revised Policy is proposed by the Company and approved by shareholders in the meantime.
The principles underpinning the REMCO's approach to executive remuneration are the foundation for everything we do and are:
○Alignment with Shell's strategy and sustainability: the Executive Directors' compensation package should promote the long-term, sustainable success of Shell, and be strongly linked to the achievement of stretching targets that are indicators of the
execution of Shell's strategy.
○Pay for performance: the majority of the Executive Directors' compensation, (excluding benefits and pensions), should be linked directly to Shell's performance through variable pay instruments.
○Competitiveness: remuneration levels should be determined by reference internally against Shell's Senior Management and externally against companies of comparable size, complexity
and global scope.
○Long-term creation of shareholder value: Executive Directors should align their interests with those of shareholders by holding shares
in Shell.
○Consistency: the remuneration structure for Executive Directors should generally be consistent with the remuneration structure for Shell's Senior Management. This consistency builds a culture of alignment with Shell's purpose and a common approach to sharing in Shell's success.
○Risk assessment: decisions should be made in the context of the Shell General Business Principles and Code of Conduct. The remuneration structures and rewards should meet risk assessment tests to ensure that shareholders' interests are safeguarded and that inappropriate actions are avoided.
The Executive Directors' remuneration structure is made up of a fixed element of basic pay and two variable elements: the annual bonus (50% delivered in shares) and the Long-term Incentive Plan (LTIP). Variable pay outcomes are conditional on the successful execution of the Operating Plan in the short term, and the delivery of strategic goals and financial and share price outperformance over the longer term.
The award of shares under the bonus and LTIP, along with significant shareholding requirements, are intended to ensure executives have a sizeable shareholding in the Company and experience the same outcomes as our shareholders.
During 2022, the REMCO reviewed the Policy to ensure that it continued to support Shell's strategy. The REMCO determined that the 2020 Policy remained appropriate in most respects, and required changes only to reflect the transition of our Executive Directors to the UK to align with market practice and for simplification. For each area of the Policy, the REMCO reviewed the alignment with strategy, market practice, the corporate governance environment, and feedback from shareholders, and additionally spent time updating the selection and calibration of performance metrics in variable pay schemes. Any potential conflict of interest was mitigated by the independence of the REMCO members and the REMCO Terms of Reference. The REMCO also considered the provisions of the UK Corporate Governance Code when reviewing the Policy, and sought to reflect the principles of clarity, simplicity, risk management, predictability, proportionality and alignment with culture.
A comparison of the 2023 and 2020 Policies is set out below.
| | | | | | | | | | | | | | |
| Remuneration element | | Changes to 2020 Policy | | Rationale for the change |
| Executive Directors |
| Base salary | | ○Salary cap amended from €2 million to £2 million. | | ○To reflect the transition of the Executive Directors to the UK. |
| Pension | | ○Move from base country arrangements to defined contribution pension arrangements applicable to the wider Shell workforce in the UK. | |
| Severance policy | | ○New service contracts under which both the employee and the employer can terminate employment by giving 12 months' written notice, replacing the previous provision which reflected Dutch statutory provisions. | |
| Annual bonus and LTIP rules | | ○REMCO discretion to suspend annual bonus or share award vesting pending the outcome of an investigation in exceptional circumstances. | | ○To allow sufficient time for investigation, as required. |
| Leaver treatment | | ○REMCO discretion to waive remaining bonus/LTIP holding period in exceptional circumstances (primarily death). | | ○To align with market practice. |
TSR underpin
in LTIP | | ○TSR underpin to be removed from the LTIP. | | ○To simplify the plan and align with market practice. |
| Non-executive Directors |
| Retirement gift | | ○Maximum value amended from €300 to £300. | | ○To reflect the transition to the UK. |
Governance | Directors' Remuneration Policy continued
Executive Directors' Remuneration Policy table
| | | | | | | | | | | |
| Purpose and link to strategy | | Maximum opportunity | Operation and performance measurement |
| Base salary |
| Provides a fixed level of earnings to attract and retain Executive Directors. | | £2,000,000 | Reviewed annually with adjustments effective from January 1. In making salary determinations, the REMCO will consider: ○the market positioning of the compensation packages; ○comparison with Senior Management salaries; ○the employee context, and planned average salary increase for other employees across the UK, the Netherlands and the USA; ○the experience, skills and performance of the Executive Director, or any change in the scope and responsibility of their role; ○general economic conditions, Shell's financial performance and governance trends; and ○the impact of salary increases on pension benefits and other elements of the package. |
| Benefits |
| Provides benefits, typically in line with those applicable to the wider workforce, in order to attract and retain Executive Directors. | | Determined by the nature of the benefit itself and costs of provision, and may depend on external factors, such as insurance costs. | Typical benefits include car allowances, home-to-office transport, risk benefits (for example ill health, disability or death-in-service), security provision, and employer contributions to insurance plans (such as medical) including Directors' liability insurance. In the event an international relocation is required either prior to appointment or while appointed, Shell's mobility policies may apply and the REMCO may offer appropriate provisions in respect of items including, but not limited to, relocation, assistance with visa/immigration/tax issues, and tax return support. It may also provide housing and education assistance for a specified period of time, expected to be no more than two years. Tax equalisation related to expatriate employment prior to Board appointment, or in other limited circumstances to offset double taxation, may also be provided. Precise benefits will depend on the Executive Director's specific circumstances and may include any tax liabilities relating to business-related benefits such as in the case of security or relocation provisions. The REMCO may adjust the range and scope of the benefits offered in the context of developments for other employees in the country which the Executive Director is based. Personal loans or guarantees are not provided to Executive Directors. |
| Pension |
| Provides a competitive defined contribution pension provision applicable to the wider workforce in the UK to attract and retain Executive Directors. | | Determined by the rules of the defined contribution UK pension arrangements. | Executive Directors' retirement benefits are maintained in line with those of the wider Shell workforce in the UK. Only base salary is pensionable, unless plan regulations specify otherwise and cannot legally be disapplied. The rules of the relevant plan detail the pension benefits which members can receive. The REMCO retains the right to amend the form of any Executive Director's pension arrangements where appropriate, for example in response to changes in legislation to ensure the original objective of this element of remuneration is preserved. New Executive Directors based in the UK, whether internal appointees or external hires, will be provided with the defined contribution arrangement, applicable to the wider Shell workforce in the UK, which currently includes the flexibility to take this as a pension cash alternative. |
| Annual bonus |
Rewards the delivery of short-term operational targets as derived from Shell's Operating Plan. Aligns the interests of Executive Directors and shareholders, and supports retention, through long-term holding in shares. | | Target bonus: 125% of base salary.
Maximum bonus: 200% of target. | ○The bonus is determined by reference to performance from January 1 to December 31 each year. ○Annual bonus = base salary x target bonus % x scorecard result (0–2). ○The scorecard is reviewed each year, taking account of Shell's operating plan, to ensure that the performance measures, targets and weightings are appropriate. Performance measures typically relate to financial delivery, operational excellence, progress in the energy transition, and safety, with indicative weightings of 35%, 35%, 15% and 15% respectively. This helps to balance short-term financial performance with the achievement of a broader set of strategic and operational objectives to support long-term shareholder value creation. The REMCO retains the flexibility to adjust performance measures, weightings and targets on a year-by-year basis, within the terms of the Policy. ○Scorecard targets are disclosed on a retrospective basis in a subsequent Annual Report on Remuneration, when they are no longer deemed commercially sensitive. ○To reinforce alignment with shareholder interests, 50% of any bonus earned is delivered in cash and 50% is delivered in net-of-tax shares. The shares are subject to a three-year holding period from the end of the performance period the award relates to, which applies beyond an Executive Director's tenure. The REMCO retains discretion to waive any part of this holding period in exceptional circumstances (primarily death). ○The bonus is subject to malus provisions before it is delivered, and to clawback thereafter for a period of three years. |
Governance | Directors' Remuneration Policy continued
Executive Directors' Remuneration Policy table continued
| | | | | | | | | | | |
| Purpose and link to strategy | | Maximum opportunity | Operation and performance management |
| Long-term Incentive Plan (LTIP) |
Rewards longer-term value creation linked to Shell's strategy. The measures focus on financial performance, capital discipline and the achievement of Shell's ambitions in the energy transition.
Aligns the interests of Executive Directors and shareholders, and supports retention through long-term holding in shares. | | Target award: 300% of base salary. Awards may vest at up to 200% of the shares originally awarded, plus dividends. | ○Award levels are determined in respect of any financial year by the REMCO within the Policy maximum. ○Awards may vest at between 0% and 200% of the initial award, depending on Shell's performance, assessed over a three-year performance period, on an absolute basis and/or on a relative basis against an appropriate comparator group. ○Performance measures and weightings are reviewed and set by the REMCO at the beginning of each three-year performance period, taking account of Shell's strategic priorities. ○Notional dividends accrue over the vesting period in respect of awards that vest. ○To reinforce alignment with shareholder interests, net of tax shares delivered from vested awards are subject to a three-year holding period from the end of the performance period the award relates to, which applies beyond an Executive Director's tenure. The REMCO retains discretion to waive any part of this holding period in exceptional circumstances (primarily death). ○Dividends accrue over the vesting period in respect of awards that vest. ○The award is subject to malus provisions before vesting, and to clawback provisions thereafter for a period of three years. |
| Discretion, malus and clawback |
| Enables the management of risks from behaviour-based incentive schemes and the REMCO to manage the range of pay outcomes. | | Adjustment events exist for the purposes of applying malus and clawback.
The REMCO retains discretion to adjust pay outcomes. | ○The REMCO retains the discretion to adjust mathematical outcomes of the annual bonus scorecard and/or LTIP vesting for any Executive Director if and to the extent that it considers this appropriate at their sole discretion. ○The REMCO may adjust pay outcomes for the purposes of managing quantum. This would be done at the REMCO's discretion after considering single figure outcome for the year, taking into account Shell's performance, the operation of the remuneration structures and any other relevant considerations. ○In exceptional circumstances, the REMCO may determine that the vesting of an annual bonus or a share award should be suspended pending the outcome of an investigation. The suspension may be for such period as the REMCO considers sufficient to permit the investigation to be concluded. ○The use of any discretion will be disclosed and explained. |
| Shareholding requirements |
| Aligns interests of Executive Directors with those of shareholders by creating a connection between individual wealth and Shell's long-term performance. | | Shareholding (% of base salary): ○CEO: 700% ○CFO: 500% | ○Executive Directors are expected to build up their shareholding to the required level over a period of five years from appointment and, once reached, to maintain this level for the full period of their appointment. The intention is for the shareholding guideline to be reached through retention of vested shares from share plans. The REMCO will monitor progress and retains the ability to adjust the guideline in special circumstances on an individual basis. ○In the event of an increase to the guideline, this timeframe is increased by one year for every additional multiple of salary required, subject to a maximum of five years from the date of the change. ○The Executive Director will be required to maintain their shareholding requirement (or existing shareholding if lower) for a period of two years from the date they cease to be an employee. Post-termination holding is enforced through the arrangements put in place with the employee on termination. ○In the event that another Executive Director joins the Board, the REMCO will determine their shareholding requirement level, which will not be less than 200% of salary, in line with corporate governance best practice. ○Vested shares from incentive plans (including bonus and LTIP shares subject to holding period) count towards the requirement. The REMCO monitors individual progress and retains the ability to adjust the guideline in special circumstances on an individual basis. |
Governance | Directors' Remuneration Policy continued
Notes to the Policy table
Executive Directors outside of the UK
In respect of salary, benefits and pension, in the event that an Executive Director is based outside of the UK, the REMCO reserves the right to determine the individual's remuneration arrangements in line with their base or host country, within the spirit of the Policy.
Payments from previously agreed remuneration arrangements
The REMCO reserves the right to make any remuneration payments where the terms of the payment were agreed: (i) before the Policy
came into effect, or (ii) at a time when the relevant individual was
not a Director of the Company and, in the opinion of the REMCO,
the payment was not in consideration for the individual becoming
a Director of the Company. The REMCO also reserves the right to
honour pre-existing contractual obligations in accordance with the terms of the service contract and relevant incentive plan. Details
of any such payments will be set out in the Annual Report on Remuneration as they arise.
Selection of performance measures
For the 2023 performance year, the annual bonus scorecard will consist of financial delivery (35%), operational excellence (35%), progress in the energy transition (15%), and safety (15%). Targets are derived from the annual business plan. These measures are designed to drive focus on the financial and operational performance critical to our success in delivering our strategy. The REMCO believes it is important for annual variable pay to remain balanced, with short-term operational components complementing the LTIP's focus on longer-term financial and strategic outcomes. The same annual bonus scorecard applies to the majority of Group employees, supporting consistency of remuneration and alignment of objectives across employees and senior management.
For 2023 LTIP awards, performance will be assessed based on 75% financial metrics (relative CFFO divided by average capital employed, relative TSR, absolute OFCF, equally weighted) and 25% on a strategic measure focused on Shell's journey in the energy transition. These metrics are designed to support our strategic ambition of accelerating our transition to be a net-zero emissions business while creating value for our shareholders.
For the relative measures, 200% vests for first position, 150% for second, 80% for third, and 0% for ranking fourth or fifth. The comparator group consists of four of the strongest companies in our industry (bp, Chevron, ExxonMobil and TotalEnergies). Outperforming Shell's closest competitors on key financial metrics is challenging. A vesting outcome of 80% of target (40% of maximum) for median performance in a small comparator group is considered appropriate by the REMCO. The REMCO is aware that vesting for median performance is generally set at a limit of 25% of maximum for other UK companies. However, these are typically applied against a larger comparator group.
To simplify the plan and align with market practice, the TSR underpin has been removed from the plan effective from 2024 awards.
Discretion
There are a number of specific areas in which the REMCO may exercise discretion, including:
○To review the specific measures, weightings and targets for the annual bonus scorecard and LTIP award annually and adjust accordingly to evolve with Shell's strategy and circumstances to ensure that the targets remain stretching but realistic. If the REMCO were to propose any material changes to the LTIP performance metrics, it would consult with major shareholders.
○To adjust mathematical variable pay outcomes if and to the extent that it considers this appropriate. This power to adjust the outcomes is broad and includes adjusting the outcomes to zero. For example, an adjustment might be made if the REMCO considers:
–the mathematical outcomes do not reflect the wider financial or non-financial performance of the Company or the participant over the performance period;
–the LTIP vesting percentage is not appropriate in the context of circumstances that were unexpected or unforeseen at award; and
–there is any other reason why an adjustment is appropriate.
It is not anticipated that discretion would be used for upwards adjustment. If, in exceptional circumstances, it was considered, this would be done only after consultation with major shareholders.
Performance outcomes and/or share price movements make it difficult to predict the final amounts delivered under the LTIP at the time of award. Each year, the REMCO reviews the LTIP vesting values and single figure outcomes for the Executive Directors to ensure that they are appropriate. The REMCO will review the formulaic single figure outcomes relative to the quality of performance outcomes and adjust these, taking into account Shell's performance, shareholder experience, the operation of the remuneration structures and any other relevant factors to ensure that the highest variable pay outcomes are only achieved in years with the highest quality performance. In years where the vesting outcome makes the total remuneration inappropriate for any Executive Director, the REMCO will consider an adjustment to the annual bonus outcome and/or the LTIP vesting outcome for the purposes of managing remuneration quantum. In making any adjustment to the annual bonus and/or LTIP vesting outcome for this purpose, REMCO will consider the overall level of remuneration for the Executive Director, the operation of the annual bonus, the operation of the LTIP, the wider performance of Shell over the performance periods, as well as the internal context for other employees. An explanation of any discretionary adjustment would be set out in the relevant year's Directors' Remuneration Report.
Malus and clawback
Variable pay awards may be made subject to adjustment events. At the discretion of the REMCO, such an award may be adjusted before delivery (malus) or reclaimed after delivery (clawback) if an adjustment event occurs.
Adjustment events will be specified in award documentation and it is intended that they will, for example, relate to restatement of financial statements due to material non-compliance with a financial reporting requirement; misconduct by an Executive Director or misconduct through their direction or non-direction; any material breach of health and safety or environment regulations; serious reputational damage to Shell; material failure of risk management; corporate failure; or other exceptional events as determined at the discretion of the REMCO. The REMCO retains the right to alter the list of adjustment events in respect of future awards.
Governance | Directors' Remuneration Policy continued
Differences in Remuneration Policy for Executive Directors from that for other employees
The remuneration policies, structure, and approach to setting remuneration levels are consistent across organisational levels at Shell, with consideration given to location, seniority and responsibilities. A higher proportion of total remuneration is tied to variable pay for Executive Directors and members of Senior Management, to reflect these individuals' positions of influence and accountability.
| | | | | |
| |
| Detailed discussion of how executive remuneration aligns with wider Company pay policy may be found in the "Workforce engagement on remuneration matters" section of the Annual Report on Remuneration on page 196. |
| |
Illustration of potential remuneration outcomes
The charts on this page illustrate the potential future value and composition of the Executive Directors' total remuneration opportunities under four performance scenarios ("Minimum", "On-target", "Maximum" and "Maximum +50% share price appreciation between award and vest"). The remuneration opportunities are based on those set out in the Policy table, applied to 2023 base salaries. The majority of the Executive Directors' remuneration is delivered through variable pay elements, which are conditional on the achievement of stretching performance targets.
For simplicity, the charts exclude dividend accrual, and exclude the effect of any Company share price movement except in the "Maximum +50%" scenario.
| | | | | | | | | | | |
| Minimum | Target | Maximum |
Base salary (2023) | P | P | P |
Benefits (2022 actual) [A] | P | P | P |
Pension (2023) | P | P | P |
Bonus (2023) | NIL | 125% CEO | 250% CEO |
| | 120% CFO | 240% CFO |
LTIP (2023) | NIL | 300% CEO | 600% CEO |
| | 270% CFO | 540% CFO |
[A]Excluding one-off benefits related to the move to the UK.
Recruitment
The REMCO determines the remuneration package for new Executive Director appointments. These appointments may involve external or internal recruitment, or reflect a change in role of a current Executive Director.
When determining remuneration packages for new Executive Directors, the REMCO will seek a balanced outcome which allows Shell to:
○attract and motivate candidates of the right quality;
○take into account the individual's current remuneration package
and other contractual entitlements;
○seek a competitive pay position relative to our comparator group, without overpaying;
○encourage relocation if required; and
○honour entitlements (for example, variable remuneration) of internal candidates before their promotion to the Board, with the exception of any previous pension arrangements.
The REMCO will follow the approach set out below when determining the remuneration package for a new Executive Director.
| | | | | | | | | | | | | | |
| Component | | Approach | | Maximum |
| Ongoing remuneration | | The salary, benefits, annual bonus, long-term incentives and pension benefits will be positioned and delivered within the framework of the Policy. | | As stated in the Executive Directors' Remuneration Policy table, and notes to the table. |
| Compensation for the forfeiture of any awards under variable remuneration arrangements | | To facilitate external recruitment, one-off compensation in consideration for forfeited awards under variable remuneration arrangements entered into with a previous employer may be required. The REMCO will use its judgement to determine the appropriate level of compensation by matching the value of any lost awards under variable remuneration arrangements with the candidate's previous employer. This compensation may take the form of a one-off cash payment or an additional award under the LTIP. The compensation can alternatively be based on a newly created long-term incentive plan arrangement where the only participant is the new Director. The intention is that any such compensation would, as far as possible, align to the duration and structure of the award being forfeited. Where appropriate, performance conditions, holding periods, and malus and clawback provisions will apply. | | An amount equal to the value of the forfeited variable remuneration awards, as assessed by the REMCO. Consideration will be given to appropriate performance conditions, performance periods and clawback arrangements. |
| | | | |
Governance | Directors' Remuneration Policy continued
| | | | | | | | | | | | | | |
| Component | | Approach | | Maximum |
| Replacement of forfeited entitlements other than any awards under variable remuneration arrangements | | There may also be a need to compensate a new Executive Director in respect of forfeited entitlements other than any awards under variable remuneration arrangements. This could include, for example, contractual entitlements or other benefits. On recruitment, these entitlements may be replicated within the Executive Director's remuneration package or valued by the REMCO and compensated in cash. In cases of internal promotion to the Board, any commitments made which cannot be effectively replaced within the Executive Director's remuneration package may, at the REMCO's discretion, continue to be honoured. | | An amount equal to the value of the forfeited entitlements, as assessed by the REMCO. |
| Exceptional recruitment incentive | | Apart from the ongoing annual remuneration package and any compensation in respect of the replacement of forfeited entitlements, there may be circumstances in which the REMCO needs to offer a one-off recruitment incentive in the form of cash or shares to ensure the right external candidate is attracted (e.g. to the industry). The REMCO recognises the importance of internal succession planning but it must also have the ability to compete for talent with other global companies. The necessity and level of this incentive will depend on the individual's circumstances. The intention will be that this is only used in genuinely exceptional circumstances. | | A one-off amount up to the limits set out in the Executive Directors' Remuneration Policy table, in addition to the ongoing package. |
| Relocation | | In the event that an internal or external candidate were required to relocate internationally to take up the Executive Director position, the REMCO may offer appropriate relocation provisions in respect of items including, but not limited to, relocation, assistance with visa/immigration issues, housing, and education assistance. If provided, these will be for a specified period of time, expected to be no more than two years. | | The level of such benefits would be set at an appropriate level by the REMCO, taking into account the circumstances, provisions applicable to the wider internationally mobile workforce, and typical market practice. |
| | |
| Executive Directors' service contracts and end of employment arrangements (including change of control provisions) |
| | | | | | | | |
| Provision | | Policy |
| Service contracts | | Executive Directors are employed for an indefinite period. Executive Directors based in the UK will be employed on service contracts governed by the laws of England and Wales. |
| Notice period | | The Executive Director or the Company may terminate employment by giving 12 months' written notice. The Company may require the Executive Director to be on garden leave during all or any of the notice period (whether notice is given by the Company or the Executive Director). |
| Payment in lieu of notice (PILON) | | The Company may terminate an Executive Director's service contract at any time with immediate effect and pay a sum in lieu of the unexpired portion of any notice period to the value of no more than 12 months' fixed pay (salary and regular allowances) and other benefits (unless statutory requirements to pay additional sums apply). The Company has the contractual right to make any PILON in monthly instalments in its discretion. Once the right to make a PILON is exercised, its delivery in instalments is mitigated by a contractual obligation on the Executive Director to seek alternative employment. |
| Compensation for loss of office | | Executive Directors will not usually receive additional payments for loss of office, other than, as appropriate, payments in lieu of notice as described above or payments in respect of damages if the Company terminates an Executive Director's employment in breach of contract (taking into account, as appropriate, the Executive Director's responsibility to mitigate any losses). The REMCO reserves the right to make payments it considers reasonable in settlement of potential legal claims taking into account contractual provisions, applicable law, corporate governance provisions, the applicability of any statutory compensation and the best interests of Shell and shareholders as a whole. |
| Dismissal | | The Company may terminate employment immediately in particular defined circumstances such as gross misconduct, with no further payment or PILON. |
| Annual bonus accrued prior to termination | | The following provisions will normally apply: ○In the event of death, disability, injury or ill health, retirement, redundancy, completion of a fixed-term contract, and other circumstances at the REMCO's discretion, any annual bonus in the year of departure is pro-rated based on service. Depending on the timing of the departure, the REMCO may consider the latest scorecard position or defer payment until the full-year scorecard result is known. ○In the event of a change of control, the REMCO will assess the most appropriate treatment for the outstanding bonus period according to the circumstances. ○Bonuses delivered in shares represent the bonus which a participant has already earned, and carry no further performance conditions. Therefore, these shares will normally be unrestricted at the conclusion of the normal holding period otherwise, and no pro-ration will apply. ○In other circumstances (including resignation), no award will be made unless statutory requirements apply. ○The REMCO retains discretion to waive any part of a bonus holding period in exceptional circumstances (primarily death). |
| | |
Governance | Directors' Remuneration Policy continued
| | | | | | | | |
| Provision | | Policy |
| LTIP awards | | Share awards will be treated in accordance with the relevant plan rules. The following provisions will normally apply: ○In the event of disability, injury or ill health, retirement, redundancy, completion of a fixed-term contract, and other circumstances at the REMCO's discretion: outstanding awards are reduced pro-rata (on a monthly basis) for time elapsed during the performance period. They will generally survive the end of employment and remain subject to the same vesting performance conditions, holding period and malus and clawback provisions, as if the Executive Director had remained in employment. The extent to which awards vest will be determined by the REMCO, taking into account the extent to which the performance conditions have been satisfied. ○In the event of death: the award will vest in full on the date of death or, if there is a target level set out in the performance condition, then at that target level, unless the REMCO determines otherwise. ○Change of control: awards will be exchanged for equivalent new awards issued by the acquirer, if agreed to by the acquirer and the Board. If there is no agreement to exchange awards, awards will (i) vest immediately in full if there is no performance condition, or (ii) vest immediately to the extent that any performance condition has been satisfied to the date of vesting. Such awards will be reduced pro-rata for time elapsed during the performance period unless agreed otherwise. ○Other circumstances (including resignation): awards will lapse on cessation of employment unless statutory requirements apply. ○The REMCO retains discretion to waive any part of a holding period in exceptional circumstances (primarily death). |
| Other | | The provision of end-of-employment benefits such as a contribution to the Executive Director's legal fees for the review of any settlement agreement, repatriation costs, and outplacement support may also be included, as deemed reasonable by the REMCO. The Executive Director may also remain eligible for other benefits, such as security provision or tax return preparation, in line with policies for the wider workforce. The Company may pay the Executive Director's tax on such benefits. The REMCO may adjust the range and scope of the benefits offered in the context of developments for other employees in relevant countries. |
In the event an Executive Director is based outside of the UK, the REMCO will determine the appropriate service contract and end of employment arrangements.
The table below sets out the effective dates of the Executive Directors' service contract.
| | | | | |
| Executive Director | Date of contract |
| Wael Sawan | January 1, 2023 |
| Sinead Gorman | April 1, 2022 |
| | | | | |
| |
| Executive Directors' employment arrangements are available for inspection at the AGM or on request. For further details on the appointment and re-appointment of Directors, see "Governance Framework" on page 149 and "Other regulatory and statutory information" on page 211. |
| |
| | |
| Non-executive Directors' Remuneration Policy table |
| | | | | | | | | | | | | | |
| Fee structure | | Approach to setting fees | | Other remuneration |
Non-executive Directors (NEDs) receive a fixed annual fee for their Directorship. The Chair receives a Chair of the Board fee, and other NEDs receive a base fee for membership of the Board. Additional annual fees are payable to any NED (other than the Chair of the Board) who serves as Senior Independent Director, a Board Committee Chair, or a Board committee member. Any individual receives either a Chair or member fee in respect of each committee they sit on. The Chair of a committee does not receive both fees. NEDs receive an additional fee for any Board meeting involving intercontinental travel, with the exception of one meeting a year held in a location other than London. | | The Chair of the Board fee is determined by the REMCO. The Board determines the fees payable to NEDs. The maximum aggregate annual fees will be within the limit specified by the Articles of Association and in accordance with the NEDs' responsibilities and time commitments. The Board reviews NED fees periodically to ensure that they are appropriate in the context of fee levels at other major listed companies. | | Business expenses incurred in respect of the performance of their duties as a NED will be paid or reimbursed by Shell. Such expenses could include transport between home and office, and occasional business-required partner travel. NEDs may receive a token of recognition on retirement from the Board. The maximum value for this is £300. The REMCO has the discretion to offer other benefits as appropriate to the circumstances. Where business expenses or benefits create a personal tax liability to the NED, Shell may cover the associated tax. The Chair and other NEDs are not eligible to receive awards under any incentive or performance-based remuneration plans, and personal loans or guarantees are not granted to them. NEDs do not accrue any retirement benefits as a result of their Non-executive Directorships with Shell. NEDs are encouraged to hold Shell shares with a value equivalent to 100% of their annual base fee and maintain that holding during their tenure. |
Governance | Directors' Remuneration Policy continued
Non-executive Directors' letters of appointment
NEDs, including the Chair of the Board, have letters of appointment. NEDs' letters of appointment are available for inspection at the AGM or on request. The table below shows the effective dates for the NEDs' appointments:
| | | | | |
| Non-executive Director | Effective date of appointment |
| Sir Andrew Mackenzie | October 1, 2020 |
| Dick Boer | May 20, 2020 |
| Neil Carson | May 21, 2019 |
| Ann Godbehere | May 23, 2018 |
| Jane Holl Lute | May 19, 2021 |
| Catherine J. Hughes | June 1, 2017 |
| Sir Charles Roxburgh | March 13, 2023 |
| Bram Schot | October 1, 2020 |
| Leena Srivastava | March 13, 2023 |
| Cyrus Taraporevala | March 2, 2023 |
| | | | | |
| |
| See "Governance framework" on page 149 and "Other regulatory and statutory information" on page 211 for further details on the appointment and re-appointment of NEDs. |
| |
Non-executive Director recruitment
The remuneration package for new NEDs is determined within the confines of the Policy table for NED fees, and subject to the Articles of Association. NEDs are not offered variable remuneration or retention awards.
When determining the benefits for a new Chair of the Board, the individual circumstances of the future Chair will be taken into account.
Non-executive Director termination of office
No payments for loss of office will be made to NEDs.
Consideration of wider employee views
The REMCO takes account of the pay and employment conditions of the broader workforce when setting the Policy for Executive Directors.
While no specific employee groups were consulted as part of the 2023 Policy review, Shell promotes and maintains good relations with employee representative bodies as part of its employee engagement programme, and operates multiple forums through which employees can engage on various business matters, including pay.
When determining Executive Directors' remuneration structure and outcomes, the REMCO reviews a set of information, including relevant reference points and trends, which includes internal data on employee remuneration (for example, employee relations matters in respect of remuneration, and average salary increases applying in the Netherlands, the UK and the USA). During the Policy review, pay and employment conditions of the wider Shell employee population were taken into account by adhering to the same performance, rewards and benefits philosophy for the Executive Directors, as well as overall benchmarking principles. Furthermore, any potential differences from other employees (see "Differences in Remuneration Policy for Executive Directors from that for other employees") were taken into account when providing the REMCO with advice in the formation of the Policy.
The REMCO is kept informed by the CEO, the Chief Human Resources and Corporate Officer, and the Executive Vice President Performance and Reward on the bonus scorecard and any relevant remuneration matters extending below the Board and Executive Committee.
| | | | | |
| |
| See "Workforce engagement on remuneration matters" in "Annual Report on Remuneration" on page 196 for more information on how Shell considers and engages with the broader workforce on remuneration matters. |
| |
Consideration of shareholder views
The REMCO engages with major shareholders regularly throughout the year. Such engagement allows the REMCO to hear shareholders' views on Shell's approach to executive remuneration, and test proposals when developing or evolving the Policy. In recent years, the REMCO has responded to shareholder views, including the approach to energy transition metrics in the LTIP, the quantum of executive pay and the broader use of discretion to manage remuneration outcomes. In developing the proposed Policy, the REMCO again consulted with shareholders and received a diverse range of views that have helped to determine which proposals to refine and which to discard. For example, as a result of shareholder feedback in the fourth quarter of 2022, the REMCO determined not to proceed with seeking support for recruitment provision that would permit an extended notice period on hiring. Shareholders have been helpful in emphasising the need for balanced metrics in the LTIP to help avoid unintended consequences as Shell progresses through the energy transition. In 2022, the continued interest in the energy transition LTIP measure directly influenced increased transparency in Shell's reporting on the progress of its energy transition journey.
It was clear to the REMCO that while there were inevitably contrasting views around the different aspects of the Policy, shareholders are supportive of Shell's overall approach to remuneration and the REMCO's careful deliberations in decision-making. The REMCO will continue to review the Policy regularly to ensure it continues to reinforce Shell's long-term strategy and closely aligns with shareholders' interests.
Additional Policy statement
The REMCO reserves the right to make payments outside of the Policy in limited, exceptional circumstances, such as for regulatory, tax or administrative purposes, or to take account of a change in legislation or exchange controls, and only where the REMCO considers such payments are necessary to give effect to the intent of the Policy.
Signed on behalf of the Board
Sean Ashley
Company Secretary
March 25, 2025
Other Regulatory and Statutory Information
Management's evaluation of disclosure controls and procedures of Shell
Shell's management, including the CEO and CFO, has evaluated the effectiveness of Shell's disclosure controls and procedures at December 31, 2024. Based on that evaluation, they concluded that Shell's disclosure controls and procedures are effective.
Management's report on internal control over financial reporting of Shell
Management, including the CEO and CFO, is responsible for establishing and maintaining adequate internal control over Shell's financial reporting and the preparation of the "Consolidated Financial Statements".
Management conducted an evaluation of the effectiveness of Shell's internal control over financial reporting and the preparation of the "Consolidated Financial Statements" based on the Internal Control - Integrated Framework (2013) issued by the Committee of Sponsoring Organizations of the Treadway Commission (COSO). On the basis of this evaluation, management concluded that, at December 31, 2024, the Company's internal control over financial reporting and the preparation of the "Consolidated Financial Statements" was effective.
Changes in internal control over financial reporting
There has not been any change in the internal control over financial reporting of Shell that occurred during the period covered by this Report that has materially affected, or is reasonably likely to materially affect, the internal control over financial reporting of Shell.
Material financial information of the Royal Dutch Shell Dividend Access Trust is included in the "Consolidated Financial Statements" and is therefore subject to the same controls and procedures.
Financial Statements, Dividends and Dividend Policy
| | | | | |
| |
| The "Consolidated Statement of Income" and "Consolidated Balance Sheet" can be found on pages 223 and 224 respectively. |
| |
Subject to Board approval, Shell aims to grow the dividend per share by 4% per annum. As announced as part of Capital Markets Day 2025, in total, Shell targets the distribution of 40-50% of cash flow from operations through the cycle to shareholders. The Board may choose to return cash to shareholders through a combination of dividends and share buybacks.
When setting the level of shareholder distributions, the Board looks at a range of factors, including the macro environment, the earnings and cash flow of the Group, the balance sheet strength, future investment, acquisition and divestment plans, and existing commitments.
The Board currently resolves to pay interim dividends on a quarterly basis. Shell does not currently pay a "final" dividend, which would need to be voted on by shareholders, requiring the introduction of a resolution at the AGM. This would delay the payment of the fourth quarter dividend (currently paid in late March) until after the AGM. This approach to dividend payments is not uncommon for companies distributing returns to shareholders on a quarterly basis.
Shell pays its dividend in USD, EUR or GBP fully electronically either in CREST or via interbank transfers.
The Directors have announced a fourth quarter interim dividend payable on March 24, 2025, to shareholders on the Register of
Members at the close of business on February 14, 2025. The closing date for dividend currency elections was February 28, 2025 [A] and the euro and sterling equivalents announcement date was March 10, 2025.
[A]A different dividend currency election date may apply to shareholders holding shares in a securities account with a bank or financial institution ultimately through Euroclear Nederland. This may also apply to other shareholders who do not hold their shares either directly on the Register of Members or in the corporate sponsored nominee arrangement. Such shareholders can contact their broker, financial intermediary, bank or financial institution for the election deadline that applies.
Repurchases of shares
As announced as part of Capital Markets Day 2025, Shell targets the distribution of 40-50% of our cash flow from operations through the cycle to shareholders. The Board may choose to return cash to shareholders through a combination of dividends and share buybacks. For all share buyback programmes mentioned below, Shell entered into irrevocable, non-discretionary arrangements with a broker in order to reduce the issued share capital of the Company.
On November 2, 2023, under shareholder authorities granted at the 2023 AGM, Shell announced the commencement of a $3.5 billion share buyback programme which was completed on January 26, 2024. On February 1, 2024, Shell announced the commencement of a share buyback programme of a further $3.5 billion which was completed on April 26, 2024; and on May 2, 2024, Shell announced the commencement of a share buyback programme of a further $3.5 billion which was completed on July 26, 2024.
At the May 21, 2024, AGM, shareholders granted the Company the authority to repurchase (i) up to 644.2 million ordinary shares "on-market" (excluding any treasury shares), less any "off-market" purchases made under the authority in (ii); and (ii) up to 644.2 million ordinary shares off-market (excluding any treasury shares), less any on-market purchases made under the authority in (i). The authorities for both on-market and off-market purchases will expire at the earlier of the close of business on August 20, 2025, and the end of the AGM of the Company to be held in 2025. On August 1, 2024, Shell announced the commencement of a $3.5 billion share buyback programme which was completed on October 25, 2024; on October 31, 2024, Shell announced the commencement of a $3.5 billion share buyback programme which was completed on January 24, 2025; and on January 30, 2025, Shell announced the commencement of a share buyback programme of a further $3.5 billion which is expected to be completed by May, 2025. This means that, as at close of March 4, 2025, approximately 390 million further shares could still be repurchased under the current AGM authorities.
More information, including the number and nominal value of the shares repurchased in 2024, can be found in Note 27 to the "Consolidated Financial Statements".
The Board continues to regard the ability to repurchase issued shares in suitable circumstances as an important part of Shell's financial management. New resolutions will be proposed at the 2025 AGM to renew the authorities for the Company to purchase its own share capital, up to specified limits, for a further year. These proposals will be described in more detail in the 2025 Notice of Annual General Meeting.
Qualifying third-party indemnities
The Company has entered into a Deed of Indemnity (Deed) with each Director of the Company who served during the year. The Deeds were in force during the 2024 financial year and are currently in force. The terms of each of these Deeds are identical and they reflect the statutory provisions on indemnities contained in the Companies Act 2006 (CA 2006). Under the terms of each Deed, the Company has agreed to indemnify the Director, to the fullest extent permitted by the CA 2006, against any loss, liability or damage, howsoever caused (including in
Governance | Other Regulatory and Statutory Information continued
respect of a Director's own negligence), suffered or incurred by a Director in respect of their acts or omissions while or in the course of acting as a Director or employee of the Company, any associated company or affiliate (within the meaning of the CA 2006). In addition, the Company shall lend funds to Directors as required to meet reasonable costs and expenses incurred or to be incurred by them in defending any criminal or civil proceedings brought against them in their capacity as a Director or employee of the Company, associated company or affiliate, or, in connection with certain applications brought under the CA 2006. The provisions in the Company's Articles of Association (Articles) relating to arbitration and exclusive jurisdiction are incorporated, mutatis mutandis, into the Deeds entered into by each Director and the Company.
The Company has provided both indemnities and Directors' and Officers' insurance to the Directors in connection with the performance of their responsibilities, both of which were in force during the 2024 financial year and are currently in force. Copies of these indemnities and the Directors' and Officers' insurance policies are open to inspection. A copy of the form of these indemnities is filed with the US Securities and Exchange Commission.
Related party transactions
In addition to the disclosures given in Notes 14 and 34 to the "Consolidated Financial Statements" on pages 264 and 295, the following related party transactions took place in 2024.
Indemnification Agreements
As noted in the Qualifying Third-Party Indemnities, the Company provides both indemnities and Directors' and Officers' insurance to the Directors in connection with the performance of their responsibilities. The Company has entered into a Deed of Indemnity with each Director of the Company who served during the year. A form of Director Indemnity Agreement is filed with the US Securities and Exchange Commission. See "Other Regulatory and Statutory Information – Qualifying Third-Party Indemnities" for more information.
Agreements with Non-Executive Directors and Executive Officers
Non-executive Directors, including the Chair, receive a letter of appointment upon joining the Company's Board. A form of Letter of appointment for Non-executive Directors and amendment thereto is filed with the US Securities and Exchange Commission.
| | | | | |
| |
| See "Other Regulatory and Statutory Information - Articles of Association" on page 211 and "Governance framework" on page 149 for further details of Non-executive Directors' terms of appointment. |
| |
| | | | | |
| |
| See "Annual Report on Remuneration – Non-executive Directors' fees" on page 192 for information on Non-executive Directors' compensation. |
| |
Executive Directors are employed pursuant to a contract of employment. A form of contract of employment for Executive Directors is filed with the US Securities and Exchange Commission.
| | | | | |
| |
| See Directors' Remuneration Policy on pages 200-207 for details of Executive Directors' employment arrangements. |
| |
Related Party Transactions Procedures
The Audit and Risk Committee's Terms of Reference, which was updated in December 2024, provides that in advance of entering into any related party transactions, as defined under Item 7.B. of Form 20-F, the Audit and Risk Committee shall review, if no other independent committee has reviewed, all such proposed related party transactions for potential conflicts of interest and consistency with the interests of the Company and its shareholders.
Political contributions
No payments were made by Shell companies to political parties, organisations or their representatives during the year. Shell USA, Inc. administers the non-partisan Shell USA, Inc. Employees' Political Awareness Committee (SEPAC), a political action committee registered with the US Federal Election Commission. Eligible employees may make voluntary personal contributions to the SEPAC. All employees' contributions comply with federal and state law and are publicly reported in accordance with US election laws. Shell USA, Inc. does not exercise control over SEPAC's funding decisions.
Recent developments and post-balance sheet events
See Note 36 to the "Consolidated Financial Statements" on page 296.
Share capital
The Company's issued share capital at December 31, 2024, is set
out in Note 27 to the "Consolidated Financial Statements" on page 289. The percentage of the total issued share capital is given below.
| | |
Share capital percentage as at December 31, 2024 |
Transfer of securities
There are no restrictions on transfer or limitations on the holding of the ordinary shares other than under the Articles, restrictions imposed by law or regulation (for example, insider trading laws) or pursuant to the Company's Share Dealing Code.
Share ownership trusts and trust-like entities
Shell has three primary employee share ownership trusts and trust-like entities: a Dutch foundation (stichting) and two US Rabbi Trusts. The shares held by the Dutch foundation are voted by its Board and the shares in the US Rabbi Trusts are voted by the Voting Trustee, Newport Trust Company. Both the Board of the Dutch foundation and the Voting Trustee are independent of Shell.
The UK Shell All Employee Share Ownership Plan has a separate related share ownership trust. Shares held by the trust are voted by its trustee, Computershare Trustees Limited, as directed by the participants.
An evergreen dividend waiver is in place in respect of 20 unallocated shares held in a legacy employee share trust.
Auditor
A resolution relating to the appointment of Ernst & Young LLP as auditor for the financial year 2025 will be proposed at the 2025 AGM.
Annual General Meeting
The AGM will be held on May 20, 2025, at the Sofitel London Heathrow Hotel - Terminal 5, London Heathrow Airport, London TW6 2DG, United Kingdom. The Notice of Annual General Meeting will include details of the business to be put to shareholders at the AGM.
Conflicts of interest
In accordance with CA 2006 and the Company's Articles, the Board may authorise any matter that otherwise may involve any Directors breaching their duty to avoid conflicts of interest. The Board has adopted a procedure to address these requirements. Detailed conflict of interest questionnaires are reviewed by the Board and, if considered appropriate, authorised. Conflicts of interest as well as any gifts and hospitality received by and provided by Directors are kept under review by the Board. Further information relating to conflicts of interest can be found in the Articles, available on the Shell website.
Governance | Other Regulatory and Statutory Information continued
Shell General Business Principles
The Shell General Business Principles define how all employees and contractors and those working in joint ventures we operate, are expected to conduct their affairs and are underpinned by the Shell core values of honesty, integrity and respect for people. These principles include, among other things, Shell's commitment to support fundamental human rights in line with the legitimate role of business and to contribute to sustainable development. They are designed to mitigate the risk of damage to our business reputation and to prevent violations of local and international legislation. They can be found at shell.com/sgbp.
| | | | | |
| |
| See "Risk factors and risk management" on pages 25-34. |
| |
Shell Code of Conduct
Directors, officers, employees and contract staff are required to comply with the Shell Code of Conduct, which instructs them on how to behave in line with the Shell General Business Principles. This Code clarifies the basic rules and standards they are expected to follow and the behaviour expected of them. These individuals must also complete mandatory Code of Conduct training.
Designated individuals are required to complete additional mandatory training on antitrust and competition laws, anti-bribery, anti-corruption and anti-money laundering laws, financial crime, data protection laws and trade compliance requirements.
| | | | | |
| |
| See "Risk factors and risk management" on pages 25-34. |
| |
| | | | | |
| |
| See shell.com/codeofconduct. |
| |
Code of Ethics
Executive Directors and Senior Financial Officers of Shell must also comply with the Code of Ethics. In 2024 we updated the conflict of interest reporting lines and made other non-substantive revisions to the Code of Ethics. This Code is specifically intended to meet the requirements of Section 406 of the Sarbanes-Oxley Act. It can be found at shell.com/codeofethics.
Malus and Clawback Policy
In line with SEC and NYSE requirements, the REMCO adopted a Malus and clawback policy for Executive Directors and other Executive Committee members in 2023. A copy of this policy was previously filed as an exhibit with the US Securities and Exchange Commission.
Insider trading policy
The Company has adopted a Securities Dealing Code that governs the purchase, sale, and/or other transactions of our securities by its employees and a Dealing Guidance for Directors and Other PDMRs, which includes persons discharging managerial responsibilities. A copy of both the Securities Dealing Code and the Dealing Guidance for Directors and Other PDMRs are filed as exhibits with the US Securities and Exchange Commission.
Independent professional advice
All Directors may seek independent professional advice in connection with their role as a Director. All Directors have access to the advice and services of the Company Secretary. The Company has provided both indemnities and Directors' and Officers' insurance to the Directors in connection with the performance of their responsibilities. Copies of these indemnities and the Directors' and Officers' insurance policies are open to inspection. A copy of the form of these indemnities has been previously filed with the US Securities and Exchange Commission.
Directors' shareholding qualification
While the Articles do not require Directors to hold shares in the Company, the REMCO believes that Executive Directors should align their interests with those of shareholders by holding shares in the Company. The CEO is expected to build up a shareholding of seven times base salary over five years from appointment and the CFO is expected to build up a shareholding of five times base salary over the same period. In the event that another Executive Director joins the Board, the REMCO will determine their shareholding requirement, which will not be less than 200% of their base salary.
Executive Directors will be required to maintain their requirement (or existing shareholding if less than the guideline) for a period of two years post employment. Non-executive Directors are encouraged to hold shares with a value equivalent to 100% of their base fee
and to maintain that holding during their tenure.
| | | | | |
| |
| See "Directors' Remuneration Report" on pages 180-182 for information on the Directors with shares in the Company. |
| |
Non-executive Director independence
The Board follows the provisions of the Code in determining Non-executive Director independence, which states that at least half of the Board, excluding the Chair, should comprise Non-executive Directors determined by the Board to be independent. In the case of the Company, the Board has determined that all the Non-executive Directors at the end of 2024 are independent.
Nominating/Corporate Governance Committee and Compensation Committee
The NYSE listing standards require that a listed company maintain a nominating/corporate governance committee and a compensation committee, both composed entirely of independent directors and with certain specific responsibilities. The Company's Nomination and Succession Committee and Remuneration Committee both comply with these requirements, except that the terms of reference of the Nomination and Succession Committee require only a majority of the committee members to be independent.
Audit and Risk Committee
As required by NYSE listing standards, the Company maintains an Audit and Risk Committee for the purpose of assisting the Board's oversight of its financial statements, its internal audit function and its independent auditors. The Company's Audit and Risk Committee is in full compliance with US Exchange Act Rule 10A-3 and Section 303A.06 of the NYSE Listed Company Manual.
The Company's Audit and Risk Committee is not directly responsible for the appointment of independent auditors. However, the Company's Audit and Risk Committee makes recommendations to the Board on the appointment or reappointment of the external auditor to put to shareholders for approval in the Annual General Meetings. UK legislation provides that it is for shareholders to agree the appointment, reappointment and removal of the Company's independent auditors.
Governance | Other Regulatory and Statutory Information continued
Shareholder approval of share-based
compensation plans
The Company complies with the Listing Rules published by the Financial Conduct Authority (FCA), which require shareholder approval for the adoption of share-based compensation plans which are either long-term incentive plans in which one or more Directors can participate or plans which involve or may involve the issue of new shares or the transfer of treasury shares. Under the FCA rules, such plans cannot be changed to the advantage of participants without shareholder approval, except for certain minor amendments, such as to benefit the administration of the plan or to take account of tax benefits. The rules on the requirements to seek shareholder approval for share-based compensation plans, including those in respect of material revisions to such plans, may deviate from the NYSE listing standards.
Change of control
There are no provisions in the Articles that would delay, defer or prevent a change of control.
NYSE Governance Standards
In accordance with the NYSE rules for foreign private issuers, the Company follows home-country practice in relation to corporate governance. However, foreign private issuers are required to have an audit committee that satisfies the requirements of the US Exchange Act Rule 10A-3. The Company's Audit and Risk Committee satisfies such requirements. The NYSE also requires a foreign private issuer to provide certain written affirmations and notices to the NYSE, as well as a summary of the significant ways in which its corporate governance practices differ from those followed by domestic US companies under NYSE listing standards (see Section 303A.11 of the NYSE Listed Company Manual). The Company's summary of its corporate governance differences is given below and can be found at
shell.com/investors.
Appointment and retirement of Directors
The Company's Articles, the Corporate Governance Code and the Companies Act 2006 govern the appointment and retirement of Directors. Board membership and biographical details of the Directors are provided on pages 149-153. However, Directors follow the direction laid out in the Corporate Governance Code and stand
for re-election annually.
Articles of association
The Company's Articles were amended and adopted on May 23, 2023. The Articles may only be amended by a special resolution of the shareholders in a general meeting. A full version of the Company's Articles can be found at shell.com/investors.
The following summarises certain provisions of the Articles [A] and of the applicable corporate legislation, including the Act (the legislation). This summary is qualified in its entirety by reference to the Articles and the Act. The information provided under this section is applicable to the Articles, which were in effect during the 2024 financial year to which this Report relates.
[A]A copy of the Articles has been previously filed with the SEC and is incorporated by reference as an exhibit to this Report. It can also be found at shell.com/investors.
Number of Directors
The Articles provide that the Company must have a minimum of three and can have a maximum of 20 Directors (disregarding alternate directors), but these restrictions can be changed by the Board.
Appointment of Directors
The Company can, by passing an ordinary resolution, appoint any willing person to be a Director, either as an extra director or to fill a vacancy where a director has stopped being a director for some reason. The Board can appoint any willing person to be a Director, either as an extra director or as a replacement for another director.
Any Director appointed in this way must retire from office at the first AGM after his appointment. A Director who retires in this way is then eligible for reappointment. At the general meeting at which a Director retires, shareholders can pass an ordinary resolution to reappoint the Director or to appoint some other eligible person in their place.
The only people who can be appointed as Directors at a general meeting are the following: (i) Directors retiring at the meeting; (ii) anyone recommended by a resolution of the Board; and (iii) anyone nominated by a shareholder (not being a person to be nominated), where the shareholder is entitled to vote at the meeting and delivers to the Company's registered office, not less than six but not more than 21 days before the day of the meeting, a letter stating that he intends to nominate another person for appointment as a Director and written confirmation from that person that he is willing to be appointed.
Retirement of Directors
At every AGM, the following Directors, at the date of the notice convening the AGM, shall retire from office: (i) any Director who has been appointed by the Board since the last AGM; (ii) any Director who held office at the time of the two preceding AGMs and who did not retire at either of them; and (iii) any Director who has been in office, other than as a Director holding an executive position, for a continuous period of nine years or more at the date of the meeting.
Notwithstanding the Articles, the Company complies with the Code which contains, among other matters, provisions regarding the composition of the Board and re-election of the Directors. As a result, the Company's current policy is that Directors are subject to annual re-election by shareholders. Any Director who retires at an AGM may offer themselves for reappointment by the shareholders.
Removal of Directors
In addition to any power to remove Directors conferred by the legislation, the Company can pass a special resolution to remove a Director from office, even though his time in office has not ended, and can (subject to the Articles) appoint a person to replace a Director who has been removed in this way by passing an ordinary resolution.
Vacation of office by Directors
Any Director automatically stops being a Director if: (i) he gives the Company a written notice of resignation and that resignation becomes effective; (ii) he gives the Company a written notice in which he offers to resign and the Board decides to accept this offer and that resignation becomes effective; (iii) all of the other Directors (who must comprise at least three people) pass a resolution or sign a written notice requiring the Director to resign; (iv) he is or has been suffering from mental or physical ill-health and the Board passes a resolution removing the Director from office; (v) he has missed Directors' meetings (whether or not an alternate director appointed by him attends those meetings) for a continuous period of six months without permission from the Board and the Board passes a resolution removing the Director from office; (vi) a bankruptcy order is made against him or he makes any arrangement or composition with his creditors generally; (vii) he is prohibited from being a Director under the legislation; or (viii) he ceases to be a Director under the legislation or he is removed from office under the Articles. If a Director stops being a Director for any reason, he will also automatically cease to be a member of any committee or sub-committee of the Board.
Alternate directors
Any Director can appoint any person (including another Director) to act in his place as an alternate director. That appointment requires the approval of the Board, unless previously approved by the Board or unless the appointee is another Director.
Governance | Other Regulatory and Statutory Information continued
Proceedings of the Board
The Board will decide in each case when and where to have meetings and how they will be conducted. The Board can also adjourn its meetings. A Board meeting can be called by any Director. The secretary must call a directors' meeting if asked to by a director. If no other quorum is fixed by the Board, two Directors are a quorum. A Directors' meeting at which a quorum is present can exercise all the powers and discretions of the Board.
All or any of the Directors can take part in a meeting of the Directors by way of a conference telephone or any communication equipment which allows everybody to take part in the meeting by being able to hear each of the other people at the meeting and by being able to speak to all of them at the same time. A person taking part in this way will be treated as being present at the meeting and will be entitled to vote and be counted in the quorum. Any such meeting will be deemed to take place where the largest group of Directors participating is assembled or, if there is no such group, where the Chair of the meeting then is.
The Board can appoint any Director as Chair or as Deputy Chair and can remove him from that office at any time. Matters to be decided at a Directors' meeting will be decided by a majority vote. If votes are equal, the Chair of the meeting has a second, casting vote.
The Board will manage the Company's business. It can use all the Company's powers, except where the Articles or the legislation say that powers can only be used by shareholders voting to do so at a general meeting. The Board is, however, subject to the provisions of the legislation, the requirements of the Articles, and any regulations laid down by the shareholders by passing a special resolution at a general meeting.
The Board can exercise the Company's powers: (i) to borrow money; (ii) to guarantee; (iii) to indemnify; (iv) to mortgage or charge all or any of the Company's undertaking, property and assets (present and future) and uncalled capital; (v) to issue debentures and other securities; and (vi) to give security, either outright or as collateral security, for any debt, liability or obligation of the Company or of any third party. The Board must limit the borrowings of the Company and exercise all voting and other rights or powers of control exercisable by the Company in relation to its subsidiary undertakings so as to ensure that no money is borrowed if the total amount of the group's borrowings (as defined in the Articles) then exceeds, or would as a result of such borrowing exceed, two times the Company's adjusted capital and reserves (as defined in the Articles). This limit can be exceeded if the consent of the shareholders has been given in advance by passing an ordinary resolution.
The Board can delegate any of its powers or discretions to committees of one or more persons. Any committee must comply with any regulations laid down by the Board. These regulations can require or allow people who are not Directors to be members of the committee, and can give voting rights to such people, but there must be more Directors on a committee than persons who are not Directors and a resolution of the committee is only effective if a majority of the members of the committee present at the time of the resolution were Directors.
Fees
The total fees paid to all the Directors (excluding any payments made under any other provision of the Articles) must not exceed £3,444,000 a year, or any higher sum decided on by an ordinary resolution at a general meeting. It is for the Board to decide how much to pay each Director by way of fees. The Board, or any committee authorised by the Board, can award extra fees to any Director who serves on any committee or who devotes special attention to the business of the company or who otherwise, in its view, performs any special or extra
services for the Company. The extra fees can take the form of salary, commission, profit-sharing or other benefits (and can be paid partly in one way and partly in another).
The Company can pay the reasonable travel, hotel and incidental expenses of each Director incurred in attending and returning from general meetings, meetings of the Board or committees of the Board or any other meetings which, as a Director, he is entitled to attend. The Company will pay all other expenses properly and reasonably incurred by each Director in connection with the Company's business or in the performance of his duties as a Director. The Company can also fund a Director's or former Director's expenditure and that of a Director or former Director of any holding company of the Company for the purposes permitted by the legislation and can do anything to enable a Director or former Director of the Company or any holding company of the Company to avoid incurring such expenditure all as provided in the legislation.
Pensions and gratuities
The Board or any committee authorised by the Board can decide whether to provide pensions, annual payments or other benefits to any Director or former Director of the company, or any relation or dependant of, or person connected to, such a person. The Board can also decide to contribute to a scheme or fund or to pay premiums to a third party for these purposes. The Company can only provide pensions and other benefits to people who are or were Directors but who have not been employed by, or held an office or executive position in, the Company or any of its subsidiary undertakings or former subsidiary undertakings or any predecessor in business of the Company or any such other company or to relations or dependants of, or persons connected to, these Directors or former Directors if the shareholders approve this by passing an ordinary resolution.
Directors' interests
Conflicts of interest requiring authorisation by Directors
The Board may, subject to the relevant quorum and voting requirements set out in the relevant Article, authorise any matter which would otherwise involve a Director breaching his duty under the legislation to avoid conflicts of interest. A Director seeking authorisation in respect of such a conflict of interest must tell the Board the nature and extent of his interest in the conflict of interest as soon as possible.
The Director must give the Board sufficient details of the relevant matter to enable it to decide how to address the conflict of interest, together with any additional information which it may request. Any Director (including the relevant Director) may propose that the relevant Director be authorised in relation to any matter which is the subject of such a conflict of interest. Such proposal and any authority given by the Board shall be effected in the same way as any other matter may be proposed to and resolved upon by the Board under the provisions of the Articles, except that: (i) the relevant Director and any other Director with a similar interest will not count in the quorum and will not vote on a resolution giving such authority; and (ii) the relevant Director and any other Director with a similar interest may, if the other members of the Board so decide, be excluded from any meeting of the Board while the conflict of interest is under consideration.
Where the Board gives authority in relation to a conflict of interest or where any of the situations described in (i) to (v) of "Other conflicts of interest" below applies in relation to a Director: (i) the Board may (whether at the relevant time or subsequently) (a) require that the relevant Director is excluded from the receipt of information, the participation in discussion and/or the making of decisions (whether at Directors' meetings or otherwise) related to the conflict or the relevant situation and (b) impose upon the relevant Director such other terms for the purpose of dealing with the conflict or relevant situation as they think fit; (ii) the relevant Director will be obliged to conduct himself in
Governance | Other Regulatory and Statutory Information continued
accordance with any terms imposed by the Board in relation to the conflict or relevant situation; (iii) the Board may also provide that, where the relevant Director obtains (other than through his position as a Director of the Company) information that is confidential to a third party, the Director will not be obliged to disclose that information to the Company, or to use or apply the information in relation to the Company's affairs, where to do so would amount to a breach of that confidence; (iv) the terms of the authority shall be recorded in writing (but the authority shall be effective whether or not the terms are so recorded); and (v) the Board may revoke or vary such authority at any time but this will not affect anything done by the relevant Director prior to such revocation in accordance with the terms of such authority.
Other conflicts of interest
If a Director knows that he or she is in any way directly or indirectly interested in a proposed contract with the Company or a contract that has been entered into by the Company, he must tell the other Directors of the nature and extent of that interest in accordance with the legislation. If the Director has so disclosed the nature and extent of his interest, a Director can do one or more of the following: (i) have any kind of interest in a contract with or involving the Company or another company in which the Company has an interest; (ii) hold any other office or place of profit with the Company (except that of auditor) in conjunction with his office of Director for such period and upon such terms, including as to remuneration, as the Board may decide; (iii) alone, or through a firm with which he is associated, do paid professional work for the Company or another company in which the Company has an interest (other than as auditor); (iv) be or become a Director or other officer of, or employed by a party to a transaction or arrangement with, or otherwise be interested in, any holding company or subsidiary company of the Company or any other company in which the Company has an interest; and (v) be or become a Director of any other company in which the Company does not have an interest and which cannot reasonably be regarded as giving rise to a conflict of interest at the time of his appointment as a Director of that other company.
Benefits
A Director does not have to hand over to the Company or the shareholders any benefit he receives or profit he makes as a result of any matter which would otherwise involve a direct breach of his or her duty under the legislation to avoid conflicts of interest but which has been authorised or anything allowed under (i) to (v) of "Other conflicts of interest" above, nor is any type of contract so authorised or so allowed liable to be avoided.
Quorum and voting requirements
Subject to certain exceptions, a Director cannot vote or be counted in the quorum on a resolution of the Board relating to appointing that Director to a position with the Company or a company in which the Company has an interest or the terms or the termination of the appointment, and a Director cannot vote or be counted in the quorum on a resolution of the Board about a contract in which he has an interest and, if he does vote, his vote will not be counted.
The Company can, by ordinary resolution, suspend or relax the provisions of the relevant article in the Articles to any extent or ratify any contract which has not been properly authorised in accordance with that relevant article.
Directors' indemnities
As far as the legislation allows this, the Company can indemnify any Director or former Director of the Company, of any associated company or of any affiliate against any liability and can purchase and maintain insurance against any liability for any Director or former Director of the Company, of any associated company or of any affiliate. A Director or former Director of the Company, of any associated company or of any affiliate will not be accountable to the Company or the shareholders for any benefit so provided. Anyone
receiving such a benefit will not be disqualified from being or becoming a Director of the Company.
Rights attaching to shares
The Company can issue shares with any rights or restrictions attached to them as long as this is not restricted by any rights attached to existing shares. These rights or restrictions can be decided either by an ordinary resolution passed by the shareholders or by the Board as long as there is no conflict with any resolution passed by the shareholders.
Dividends
Currently, only ordinary shares are entitled to a dividend.
Under the legislation, dividends are payable only out of profits available for distribution, as determined in accordance with the Act and under IFRS. Subject to the Act, if the Directors consider that the Company's financial position justifies the payment of a dividend, the Company can pay a fixed or other dividend on any class of shares on the dates prescribed for the payments of those dividends and pay interim dividends on shares of any class of any amounts and on any dates and for any periods which it decides. Shareholders can declare dividends in accordance with the rights of shareholders by passing an ordinary resolution, although such dividends cannot exceed the amount recommended by the Board.
Dividends are payable to persons registered as the holder(s) of shares, or to anyone entitled in any other way, at a particular time on a particular day selected by the Board. All dividends will be declared and paid in proportions based on the amounts paid up on the relevant shares during any period for which that dividend is paid. Any dividend or other money payable in cash relating to a share can be paid: (i) by inter-bank transfer or by other electronic means (including payment through CREST) directly to an account with a bank or other financial institution (or other organisations operating deposit accounts if allowed by the Company) named in a written instruction from the persons entitled to receive the payment under the Articles, such account is to be an account in the United Kingdom unless the share on which the payment is to be made is held by Euroclear Nederland and the Dutch Securities Giro Act (Wet giraal effectenverkeer); (ii) by sending a cheque, warrant or similar financial instrument payable to the shareholder who is entitled to it by post addressed to his registered address; (iii) by sending a cheque, warrant or similar financial instrument payable to someone else named in a written instruction from the shareholder (or all joint shareholders) and sent by post to the address specified in that instruction; or (iv) in some other way if requested in writing by the shareholder (or all joint shareholders) and agreed with the Company. In respect of the payment of any dividend or other money, the Directors can decide and notify shareholders that: (i) one or more of the payment means described in paragraph above will be used for payment and, where more than one means will be used, a shareholder (or all joint shareholders) may elect to receive payment by one of the means so notified in the manner prescribed by the directors; (ii) one or more of such means will be used for the payment unless a shareholder (or all joint shareholders) elects for another means of payment in the manner prescribed by the Directors; or (iii) one or more of such means will be used for the payment and that shareholders will not be able to elect to receive the payment by any other means.
And for these purposes the Directors can decide that different means of payment will apply to different shareholders or groups of shareholders. If: (i) a shareholder (or all joint shareholders) does not specify an address, or does not (i) specify an account of a type prescribed by the Directors, or does not specify other details, and in each case that information is necessary in order to make a payment of a dividend or other money in the way in which, under the Article, the directors have decided that the payment is to be made or by which the shareholder
Governance | Other Regulatory and Statutory Information continued
(or all joint shareholders) has validly elected to receive the payment; or (ii) payment cannot be made by the company using the information provided by the shareholder (or all joint shareholders), then the dividend or other money will be treated as unclaimed for the purposes of these articles.
The Company will not be responsible for a payment which is lost or delayed. Unless the rights attached to any shares, the terms of any shares or the Articles say otherwise, a dividend or any other money payable in respect of a share can be declared and paid in whatever currency or currencies the Board decides using an exchange rate or exchange rates selected by the Board for any currency conversions required. The Board can also decide how any costs relating to the choice of currency will be met. The Board can offer shareholders the choice to receive dividends and other money payable in respect of their shares in alternative currencies on such terms and conditions as the Board may prescribe from time to time. Where any dividends or other amounts payable on a share have not been claimed, the Board can invest them or use them in any other way for the Company's benefit until they are claimed. The Company will not be a trustee of the money and will not be liable to pay interest on it. If a dividend or other money has not been claimed for 6 years after being declared or becoming due for payment, it will be forfeited and go back to the Company, unless the Board decides otherwise. If the company sells shares under the relevant Article, any dividend or other money unclaimed in respect of those shares will also be forfeited and go back to the Company when those shares are sold unless the Directors decide otherwise.
Prior to January 29, 2022, dividends in respect of B shares were paid under the dividend access mechanism described below. The Articles provide that if any amount paid by way of dividend by a subsidiary of the Company was received by the dividend access trustee on behalf of any holder of former B shares and paid by the dividend access trustee to such holder, the entitlement of such holder of former B shares to be paid any dividend declared pursuant to the Articles was reduced by the corresponding amount that has been paid by the dividend access trustee to such holder. Where amounts are paid by the dividend access trustee in one currency and a dividend was declared by the Company in another currency, the amounts so paid by the dividend access trustee was, for the purposes of the comparison required by the two immediately preceding sentences, converted into the currency in which the Company declared the dividend at such rate as the Board considered appropriate. For the purposes of the provisions referred to in this paragraph, the amount that the dividend access trustee has paid to any holder of B shares in respect of any particular dividend paid by a subsidiary of the Company (a "specified dividend") will be deemed to include: (i) any amount that the dividend access trustee may be compelled by law to withhold; (ii) a pro rata share of any tax that the subsidiary paying the specified dividend is obliged to withhold or to deduct from the same; and (iii) a pro rata share of any tax that is payable by the dividend access trustee in respect of the specified dividend.
The Board can offer shareholders of ordinary shares (excluding any shareholder holding shares as treasury shares) the right to choose to receive extra ordinary shares, which are credited as fully paid up, instead of some or all of their cash dividend. Before the Board can do this, shareholders must have passed an ordinary resolution authorising the Board to make this offer.
Dividend access mechanism for B shares
General
On January 29, 2022 one line of shares was established through assimilation of each A share and each B share into one ordinary share of the Company. This assimilation had no impact on voting rights or dividend entitlements. Dutch withholding tax, applied previously on dividends on A shares, no longer applies on dividends paid on the
ordinary shares following the assimilation. Prior to January 29, 2022, our A and B shares were identical, except for the dividend access mechanism, which only applied to B shares.
In relation to the assimilation of the Company's Class A and B shares, the Royal Dutch Shell Dividend Access Trust will continue in existence for the foreseeable future to facilitate the payment of unclaimed dividend liabilities for B shareholders, until these are either claimed or forfeited. Dividends which are unclaimed after 6 years will be forfeited and unconditionally revert to Shell Transport and BG, as appropriate.
Prior to January 29, 2022, it was the expectation and the intention, although there could be no certainty, that holders of B shares would receive dividends through the dividend access mechanism. Any dividends paid on the dividend access shares would have a UK source for UK and Dutch tax purposes. There would be no Dutch withholding tax on such dividends. For further details regarding the tax treatment of dividends paid, refer to "Shareholder information".
Description of dividend access mechanism
The "Shell" Transport and Trading Company, p.l.c., now The Shell Transport and Trading Company Limited (Shell Transport), and BG Group plc, now BG Group Limited (BG), have each issued a dividend access share to Computershare Trustees (Jersey) Limited as Trustee. Pursuant to a declaration of trust, the Trustee will hold any dividends paid in respect of the dividend access shares on trust for the holders of B shares and will arrange for prompt disbursement of such dividends to such holders. Interest and other income earned on unclaimed dividends will be for the account of Shell Transport and BG and any dividends which are unclaimed after 6 years will unconditionally revert to Shell Transport and BG, respectively, as appropriate. Holders of B shares will not have any interest in either dividend access share and will not have any rights against Shell Transport and BG as issuers of the dividend access shares. The only assets held on trust for the benefit of these holders will be dividends paid to the Trustee in respect of the dividend access shares.
The declaration and payment of dividends on the dividend access shares will require board action by Shell Transport and BG (as applicable) and will be subject to any applicable limitations in law or in the Shell Transport or BG (as appropriate) articles of association in effect. In no event will the aggregate amount of the dividend paid by Shell Transport and BG under the dividend access mechanism for a particular period exceed the aggregate of the dividend announced by the Board of the Company on B shares in respect of the same period (after giving effect to currency conversions).
In particular, under their respective articles of association, Shell Transport and BG are each only able to pay a dividend on their respective dividend access share which represents a proportional amount of the aggregate of any dividend announced by the Company on the B shares in respect of the relevant period, where such proportions are calculated by reference to, in the case of Shell Transport, the number of B shares in existence prior to completion of the Company's acquisition of BG (the Acquisition) and, in the case of BG, the number of B shares issued as part of the Acquisition, in each case as against the total number of B shares in issue immediately following completion of the Acquisition.
Operation of the dividend access mechanism
If, in connection with the announcement of a dividend by the Company on B shares, the Board of Shell Transport and/or the Board of BG elects to declare and pay a dividend on their respective dividend access shares to the Trustee, the holders of B shares will be beneficially entitled to receive their share of those dividends pursuant to the declaration of trust (and arrangements will be made to ensure that the
Governance | Other Regulatory and Statutory Information continued
dividend is paid in the same currency in which they would have received a dividend from the Company).
If any amount is paid by Shell Transport or BG by way of a dividend on the dividend access shares and paid by the Trustee to any holder of B shares, the dividend which the Company would otherwise pay on B shares will be reduced by an amount equal to the amount paid to such holders of B shares by the Trustee.
The Company will have a full and unconditional obligation, in the event that the Trustee does not pay an amount to holders of B shares on a cash dividend payment date (even if that amount has been paid to the Trustee), to pay immediately the dividend announced on B shares. The right of holders of B shares to receive distributions from the Trustee will be reduced by an amount equal to the amount of any payment actually made by the Company on account of any dividend on B shares. If for any reason no dividend is paid on the dividend access shares, holders of B shares will only receive dividends from the Company directly. Any payment by the Company will be subject to Dutch withholding tax (unless an exemption is obtained under Dutch law or under the provisions of an applicable tax treaty).
The Dutch tax treatment of dividends paid under the dividend access mechanism has been confirmed by the Dutch Revenue Service in an agreement (vaststellingsovereenkomst) with the Company and N.V. Koninklijke Nederlandsche Petroleum Maatschappij (Royal Dutch Petroleum Company) dated October 26, 2004, as supplemented and amended by an agreement between the same parties dated April 25, 2005, and a final settlement agreement in connection with the Acquisition dated November 9, 2015. The agreements state, among other things, that dividend distributions on the dividend access shares by Shell Transport and/or BG will not be subject to Dutch withholding tax provided that the dividend access mechanism is structured and operated substantially as set out above.
The dividend access mechanism may be suspended or terminated at any time by the Company's Directors or the Directors of Shell Transport or BG, for any reason and without financial recompense. This might, for instance, occur in response to changes in relevant tax legislation.
The daily operations of the Trust are administered on behalf of the Company by the Trustee. Material financial information of the Trust is included in the "Consolidated Financial Statements" and is therefore subject to the same disclosure controls and procedures as Shell.
Pre-emption rights
Subject to the Act and the Listing Rules published by the UK's Financial Conduct Authority (FCA), any equity securities allotted by the Company for cash must first be offered to shareholders in proportion to their holdings. The Act and the Listing Rules allow for the disapplication of pre-emption rights which may be waived by a special resolution of the shareholders, either generally or specifically.
Voting
Subject to applicable law and the Articles, the ordinary shares have voting rights on all matters that are subject to shareholder approval including the election of directors. Currently, the voting rights of each ordinary share carry one vote at a general meeting of the Company.
Major shareholders have no differing voting rights.
Changing the rights attached to the shares
The Act provides that the Articles can be amended by a special resolution.
The Articles provide that, if the legislation allows this, the rights attached to any class of shares can be changed in such manner as those rights may provide or (if no such provision is made) if this is approved either in writing by shareholders holding at least three-quarters of the issued shares of that class by amount (excluding any shares of that class held as treasury shares) or by a special resolution passed at a separate meeting of the relevant shareholders. At each such separate meeting, all of the provisions of the Articles relating to proceedings at a general meeting apply, except that: (i) a quorum will be present if at least one shareholder who is entitled to vote is present in person or by proxy who owns at least one-third in amount of the issued shares of the relevant class (excluding any shares of that class held as treasury shares); (ii) any shareholder who is present in person or by proxy and entitled to vote can demand a poll; and (iii) at an adjourned meeting, one person entitled to vote and who holds shares of the class, or his proxy, will be a quorum. These provisions are not more restrictive than required by law in England.
If new shares are created or issued which rank equally with any other existing shares, or if the company purchases or redeems any of its own shares, the rights of the existing shares will not be regarded as changed or abrogated unless the terms of the existing shares expressly say otherwise.
Redemption provisions
The Company's shares are not subject to any redemption provisions.
Disputes between a shareholder or American Depositary Share holder and Shell plc, any subsidiary, Director or professional service provider
The Articles generally require that, except as noted below, all disputes: (i) between a shareholder in such capacity and the Company and/or its Directors, arising out of or in connection with the Articles or otherwise; (ii) so far as permitted by law, between the Company and any of its Directors in their capacities as such or as the Company's employees, including all claims made by the Company or on behalf of the Company against any or all of its Directors; (iii) between a shareholder in such capacity and the Company's professional service providers (which could include the Company's auditors, legal counsel, bankers and ADS depositaries); and/or (iv) between the Company and its professional service providers arising in connection with any claim within the scope of (iii) above, shall be exclusively and finally resolved by arbitration under the Rules of Arbitration of the International Chamber of Commerce (ICC), as amended from time to time. This would include all disputes arising under UK, Dutch or US law (including securities laws), or under any other law, between parties covered by the arbitration provision. Accordingly, the ability of shareholders to obtain monetary or other relief, including in respect of securities law claims, may be determined in accordance with these provisions, and the ability of shareholders to obtain monetary or other relief may therefore be limited and their cost of seeking and obtaining recoveries in a dispute may be higher than otherwise would be the case.
The tribunal shall consist of three arbitrators to be appointed in accordance with the ICC rules. The chairman of the tribunal must have at least 20 years' experience as a lawyer qualified to practise in a common-law jurisdiction which is within the Commonwealth (as constituted on May 12, 2005) and each other arbitrator must have at least 20 years' experience as a qualified lawyer. The place of arbitration must be London, United Kingdom; and the language of the arbitration must be English.
Governance | Other Regulatory and Statutory Information continued
Pursuant to the exclusive jurisdiction provision in the Articles, if a court or other competent authority in any jurisdiction determines that the arbitration requirement described above is invalid or unenforceable in relation to any particular dispute in that jurisdiction, then that dispute can only be brought in the courts of England and Wales, as is the case with any derivative claim brought under the Act. The governing law of the Articles is the substantive law of England.
Disputes relating to the Company's failure or alleged failure to pay all or part of a dividend which has been announced and which has fallen due for payment will not be subject to the arbitration and exclusive jurisdiction provisions of the Articles. Any derivative claim brought under the Act will not be subject to the arbitration provisions of the Articles.
Pursuant to the relevant depositary agreement, each holder of ADSs is bound by the arbitration and exclusive jurisdiction provisions of the Articles as described in this section as if that holder were a shareholder.
Calls on shares
The Board can call on shareholders to pay any money which has not yet been paid to the Company for their shares. This includes the nominal value of the shares and any premium which may be payable on those shares. The Board can also make calls on people who are entitled to shares by law.
Winding-up of the Company
If the Company is voluntarily wound up, the liquidator can distribute to shareholders any assets remaining after the liquidator's fees and expenses have been paid and all sums due to prior-ranking creditors (as defined under the laws of England) have been paid.
Sinking fund provisions
The shares are not subject to any sinking fund provision under the Articles or as a matter of the laws of England.
Discriminating provisions
There are no provisions in the Articles discriminating against a shareholder because of his ownership of a particular number of shares.
Limitations on rights to own shares
There are no limitations imposed by the Articles or the legislation on the rights to own shares, including the right of non-residents or foreign persons to hold or vote shares, other than limitations that would generally apply to all shareholders.
Transfer of shares
There are no significant restrictions on the transfer of shares.
Except as set out below, any shareholder can transfer some or all of his certificated shares to another person. A transfer of certificated shares must be made in writing and either in the usual standard form or in any other form approved by the Board. Except as set out below, any shareholder can transfer some or all of his CREST shares to another person. A transfer of CREST shares must be made through CREST and must comply with the uncertificated securities rules.
The Board can refuse to register the transfer of any shares which are not fully paid. Further rights to decline registration are as follows:
Certificated shares
A share transfer form cannot be used to transfer more than one class of share. Each class needs a separate form. Transfers cannot be in favour of more than four joint holders. The share transfer form must be properly stamped to show payment of any applicable stamp duty or certified or otherwise shown to the satisfaction of the Board to be exempt from stamp duty and must be delivered to the Company's registered office, or any other place decided on by the Board. The transfer form must be accompanied by the share certificate relating to the share being transferred, unless the transfer is being made by a person to whom the Company was not required to, and did not send, a certificate. The Board can also ask (acting reasonably) for any other evidence to show that the person wishing to transfer the share is entitled to do so and, if the share transfer form is signed by another person on behalf of the person making the transfer, evidence of the authority of that person to do so.
CREST shares
Registration of a transfer of CREST shares can be refused in the circumstances set out in the uncertificated securities rules. Transfers cannot be in favour of more than four joint holders. Where a share has not yet been entered on the register, the Board can recognise a renunciation by that person of his right to the share in favour of some other person. Such renunciation will be treated as a transfer and the Board has the same powers of refusing to give effect to such a renunciation as if it were a transfer.
Partly paid shares
If a shareholder fails to pay the Company any amount due on his partly paid shares, the Board can enforce the Company's lien by selling all or any of the partly paid shares in any way they decide (subject to certain conditions).
Capital changes
The conditions imposed by the Articles for changes in capital are not more stringent than those required by the applicable laws of England.
Accordingly, the ability of shareholders to obtain monetary or other relief, including in respect of securities law claims, may be determined in accordance with these provisions, and the ability of shareholders to obtain monetary or other relief may therefore be limited and their cost of seeking and obtaining recoveries in a dispute may be higher than otherwise would be the case.
The tribunal shall consist of three arbitrators to be appointed in accordance with the ICC rules. The chairman of the tribunal must have at least 20 years' experience as a lawyer qualified to practise in a common-law jurisdiction which is within the Commonwealth (as constituted on May 12, 2005) and each other arbitrator must have at least 20 years' experience as a qualified lawyer. The place of arbitration must be London, United Kingdom; and the language of the arbitration must be English.
Pursuant to the exclusive jurisdiction provision in the Articles, if a court or other competent authority in any jurisdiction determines that the arbitration requirement described above is invalid or unenforceable in relation to any particular dispute in that jurisdiction, then that dispute may only be brought in the courts of England and Wales, as is the case with any derivative claim brought under the Act. The governing law of the Articles is the substantive law of England.
Governance | Other Regulatory and Statutory Information continued
Disputes relating to the Company's failure or alleged failure to pay all or part of a dividend which has been announced and which has fallen due for payment will not be subject to the arbitration and exclusive jurisdiction provisions of the Articles. Any derivative claim brought under the Act will not be subject to the arbitration provisions of the Articles.
Pursuant to the depositary agreement, each holder of ADSs is bound by the arbitration and exclusive jurisdiction provisions contained in the relevant depositary agreement, which are substantially similar to the Articles as described in this section as if that holder were a shareholder.
General Meetings
Under the applicable laws of England, the Company is required in each year to hold an AGM of shareholders in addition to any other meeting of shareholders that may be held. Each AGM must be held in the period six months from the date following the Company's accounting reference date.
Additionally, shareholders may submit resolutions in accordance with Section 338 of the Act.
Directors have the power to convene a general meeting of shareholders at any time. In addition, Directors are required to call a general meeting once requests to do so have been received by the Company from shareholders representing at least 5% of such paid-up capital of the Company as carries voting rights at general meetings of the Company (excluding any paid-up capital held as treasury shares) pursuant to Section 303 of the Act. A request for a general meeting must state the general nature of the business to be dealt with at the meeting and must be authenticated by the requesting shareholders. If Directors fail to call such a meeting within 21 days from receipt of such requests, and on a date not more than 28 days after the date of the notice convening the meeting, the shareholders that requested the general meeting, or any of them representing more than half of the total voting rights of all shareholders that requested the meeting, may themselves convene a general meeting which must be called for a date not more than three months after the date upon which the Directors became subject to the requirement to call a general meeting. Any such meeting must be convened in the same manner, as nearly as possible, as that in which meetings are required to be convened by the Directors of the Company.
Under the Act, the Company is required to give at least 21 clear days' notice of any AGM or, except where the conditions in Section 307A of the Act apply, any other general meeting of the Company. In addition, the Company complies with the Financial Reporting Council guidance which currently states that notices of AGMs should be sent to shareholders at least 20 working days before the meeting.
The Articles require that, in addition to any requirements under the legislation, the notice for any general meeting must state where the meeting is to be held (the principal meeting place) and the location of any satellite meeting place, which shall be identified as such in the notice as well as details of any arrangements made for those persons not entitled to attend a general meeting to be able to view and hear the proceedings (making it clear that participation in those arrangements will not amount to attendance at the meeting to which the notice relates).
A shareholder is entitled to appoint a proxy (who is not required to be another shareholder) to represent and vote on behalf of the shareholder at any general meeting of shareholders, including the AGM, if a duly completed form of proxy has been received by the Company within the relevant deadlines (in general, where a poll is not demanded, 48 hours (or such shorter time as the Board decides) before the meeting).
Before a general meeting starts to do business, there must be a quorum present. Save as in relation to adjourned meetings, a quorum for all purposes is two people who are entitled to vote. They can be shareholders who are personally present, proxies for shareholders, or a combination of both. If a quorum is not present, a chairman of the meeting can still be chosen and this will not be treated as part of the business of the meeting. If a quorum is not present within five minutes of the time fixed for a general meeting to start or within any longer period not exceeding one hour which the chairman of the meeting can decide, or if a quorum ceases to be present during a general meeting: (i) if the meeting was called by shareholders, it will be cancelled; (ii) any other meeting will be adjourned to a day (being not less than 10 days later, excluding the day on which it is adjourned and the day for which it is reconvened) with the time and place decided upon by the chairman of the meeting; and (iii) one shareholder present in person or by proxy and entitled to vote will constitute a quorum at any such adjourned general meeting and any notice of such adjourned meeting will say this.
Deemed delivery of documents
Under the Articles, if any notice, document or other information is given, sent or supplied by the Company by inland post, it is treated as being received the day after it was posted if first class post (or a service similar to first class post) was used, or 48 hours after it was posted if first class post (or a service similar to first class post) was not used. If a notice or document is sent by the Company by airmail, it is treated as being received 72 hours after it was posted. Any notice, document or other information left at a shareholder's registered address or a postal address notified to the Company in accordance with the Articles by a shareholder or a person entitled to a share by law is treated as being received on the day on which it was left.
Threshold for disclosure of share ownership
The Disclosure Guidance and Transparency Rules of the FCA impose an obligation on persons [A] to notify the Company of the percentage of voting rights held as a shareholder, or through the direct or indirect holding of financial instruments, if the percentage of voting rights held in the Company reaches, exceeds or falls below 3% or any 1% threshold above 3%.
[A]For this purpose “persons” includes companies, natural persons, legal persons and partnerships.
As noted in the Articles, Section 793 of the Act governs the Company’s right to investigate who has an interest in its shares. Under that section, a public company may give notice to any person it knows or has reasonable cause to believe is, or was at any time in the preceding three years, interested in its shares in order to obtain certain information about that interest.
The Articles provide that, when a person receives a statutory notice, he has the time stated in such notice to comply with it. If he does not do so or if he makes a statement in response to the notice which is false or inadequate in some important way, the Company can decide to restrict the rights relating to the identified shares and send out a further notice to the shareholder, known as a restriction notice, which will take effect when delivered. The restriction notice will state that the identified shares no longer give the shareholder any right to attend or vote either personally or by proxy at a shareholders' meeting or to exercise any right in relation to shareholders' meetings. Where the identified shares make up 0.25% or more (in amount or in number) of the existing shares of a class at the date of delivery of the restriction notice, the restriction notice can also contain the following further restrictions: (i) the Board can withhold any dividend or part of a dividend (including scrip dividend) or other money which would otherwise be payable in respect of the identified shares without any liability to pay interest when such money is finally paid to the shareholder; and (ii) the Board can refuse to register a transfer of any of the identified shares which are certificated shares unless the Board is satisfied that they have been sold
Governance | Other Regulatory and Statutory Information continued
outright to an independent third party (as specified in the Articles). Once a restriction notice has been given, the Board is free to cancel it or exclude any shares from it at any time the Board thinks fit. In addition, the Board must cancel the restriction notice within seven days of being satisfied that all of the information requested in the statutory notice has been given. Also, where any of the identified shares are sold and the Board is satisfied that they were sold outright to an independent third party, it must cancel the restriction notice within seven days of receipt of notification of the sale. The Articles do not restrict in any way the provision of the legislation which applies to failures to comply with notices under the legislation.
The UK City Code on Takeovers and Mergers (the Takeover Code) imposes disclosure obligations on parties subject to the Takeover Code's disclosure regime. The Takeover Code requires that an opening position disclosure be made by: (i) an offeror company after the announcement that first identifies it as an offeror and after the announcement that first identifies a competing securities exchange offeror; and (ii) an offeree company after the commencement of an offer period and, if later, after the announcement that first identifies any securities exchange offeror. An opening position disclosure must be made by any person that is interested in 1% or more of any class of relevant securities of the offeree company or any securities exchange offeror. The Takeover Code also requires any person who is, or becomes, interested in 1% or more of any class of relevant securities of an offeree company or any securities exchange offeror to make a dealing disclosure if the person deals in any relevant securities of the offeree company or any securities exchange offeror during an offer period. Where two or more persons act together pursuant to an agreement or understanding, whether formal or informal, to acquire or control an interest in relevant securities, they will normally be deemed to be a single person for the purpose of the relevant provisions of the Takeover Code.
Rule 13d-1 of the US Securities Exchange Act of 1934 requires that a person or group that acquires beneficial ownership of more than 5% of equity securities registered under the US Securities Exchange Act, and that is not eligible to file a short-form report, disclose such information to the SEC within five business days after the acquisition.
Financial Statements and Supplements
Report of Independent Registered Public Accounting Firm
To the Shareholders and Board of Directors of Shell plc
Opinion on the Consolidated Financial Statements
We have audited the accompanying consolidated balance sheets of Shell plc (Shell or the Company) as of December 31, 2024 and 2023, and the related consolidated statements of income, comprehensive income, changes in equity and cash flows for each of the three years in the period ended December 31, 2024, and the related notes (collectively referred to as the "Consolidated Financial Statements"). In our opinion, the Consolidated Financial Statements present fairly, in all material respects, the financial position of the Company at December 31, 2024 and 2023, and the results of its operations and its cash flows for each of the three years in the period ended December 31, 2024, in conformity with International Financial Reporting Standards (IFRS) as issued by the International Accounting Standards Board (IASB) and in conformity with UK adopted international accounting standards.
We also have audited, in accordance with the standards of the Public Company Accounting Oversight Board (United States) (PCAOB), the Company's internal control over financial reporting as of December 31, 2024, based on criteria established in Internal Control Integrated Framework issued by the Committee of Sponsoring Organizations of the Treadway Commission (2013 framework), and our report dated March 25, 2025, expressed an unqualified opinion thereon.
Basis for Opinion
These financial statements are the responsibility of the Company's management. Our responsibility is to express an opinion on the Company's financial statements based on our audits. We are a public accounting firm registered with the PCAOB and are required to be independent with respect to the Company in accordance with the U.S. federal securities laws and the applicable rules and regulations of the Securities and Exchange Commission (SEC) and the PCAOB.
We conducted our audits in accordance with the standards of the PCAOB. Those standards require that we plan and perform the audit to obtain reasonable assurance about whether the financial statements are free of material misstatement, whether due to error or fraud. Our audits included performing procedures to assess the risks of material misstatement of the financial statements, whether due to error or fraud, and performing procedures that respond to those risks. Such procedures included examining, on a test basis, evidence regarding the amounts and disclosures in the financial statements. Our audits also included evaluating the accounting principles used and significant estimates made by management, as well as evaluating the overall presentation of the financial statements. We believe that our audits provide a reasonable basis for our opinion.
Critical audit matters
The critical audit matters communicated below are matters arising from the current period audit of the financial statements that were communicated or required to be communicated to the Audit and Risk Committee and that: (1) relate to accounts or disclosures that are material to the financial statements and (2) involved our especially challenging, subjective, or complex judgements. The communication of critical audit matters does not alter in any way our opinion on the Consolidated Financial Statements, taken as a whole, and we are not, by communicating the critical audit matters below, providing separate opinions on the critical audit matters or on the accounts or disclosures to which they relate.
| | | | | | | | |
| The estimation of oil and gas reserves |
Description of the matter
| | As described in Notes 12 and 14 to the Consolidated Financial Statements, at December 31, 2024, production assets amounted to $102.2 billion and had an associated depreciation, depletion and amortisation (DD&A) charge of $15.0 billion. Joint venture and associates (JVAs) amounted to $23.4 billion. As further described in Note 13, exploration and production impairment losses of $0.8 billion and exploration and production impairment reversals of $74 million were recorded during the year. Oil and gas reserves estimates are used in the calculation of DD&A and impairment testing. The risk is the inappropriate recognition of reserves that impacts these accounting estimates. Auditing the estimation of oil and gas reserves is complex. There is significant estimation uncertainty in assessing the quantities of reserves and resources in place. The estimates are based on the Company’s central group of experts’ assessments of petroleum initially in place, production curves and certain other inputs, including prices, license expiration date, capex and opex. Estimation uncertainty is further elevated given the transition to a low-carbon economy, which increases the risk of under-utilised or stranded oil and gas assets. |
| How we addressed the matter in our audit | | We obtained an understanding of the controls over Shell's oil and gas reserves' estimation process. We then evaluated the design of these controls and tested their operating effectiveness. For example, we tested management's review controls over changes to year-on-year estimated oil and gas reserves volumes. We involved professionals with oil and gas reserves audit experience to assist us in evaluating the key assumptions and methodologies applied by management. Our procedures included, amongst others, observing the internal review and endorsement process at Shell’s Upstream Reserves Committee meetings. These meetings are part of Shell's proved reserves assurance process. Testing that significant additions or reductions in reserves had been made in the period in which new information became available, and assessing whether they were in compliance with Shell's reserves and resources guidance and SEC regulation. Evaluating the professional qualifications and objectivity of management's internal qualified professionals who performed the preparation of the reserve estimates and who are primarily responsible for providing independent review and challenge, and ultimately endorsement of, the reserve estimates. We also assessed the completeness and accuracy of the inputs used by management in estimating the oil and gas reserves by agreeing the inputs to source documentation. We also performed back testing of historical data to identify indications of estimation bias over time and a sensitivity analysis of the oil and gas reserves balance and its impacts on DD&A. We evaluated management's estimation of the point at which the operating cash flow from a project becomes negative (the economic limit), as this impacts DD&A and impairment. Where relevant, we assessed whether the economic limit test incorporated Shell's estimate of future carbon costs to reflect the potential impact of climate change and the energy transition. In order to address the risk of stranded assets, among other procedures, we estimated the carbon intensity of Shell's Upstream and Integrated Gas fields to analyse assets that are currently forecast to be producing beyond 2030 and 2050 and the expected carbon intensity per barrel of those fields. For assets that we identified as carbon intensive that are expected to have material carrying value in 2030 and 2050, we evaluated the risk that the carrying value of these assets will not be recovered. This included considering the decarbonisation plans of these assets and alignment to Shell's strategy. |
Financial Statements and Supplements | Report of Independent Registered Public Accounting Firm continued
| | | | | | | | |
Impairment of Property, plant & equipment (PP&E) and Joint venture and associates (JVA) |
Description of the matter
| | As described in Notes 12 and 14 to the Consolidated Financial Statements, at December 31, 2024 Shell recognised $102.2 billion of production assets, $50.8 billion of manufacturing, supply and distribution assets (PP&E) (primarily refineries and petrochemical plants) and $23.4 billion of joint ventures and associates (JVAs). As disclosed in Note 13 and 14, in 2024, Shell recognised $1.3 billion and $0.9 billion of impairment losses relating to manufacturing, supply and distribution assets and JVAs respectively. The recoverable amounts of PP&E and JVAs are sensitive to changes in key assumptions, therefore our audit effort was focused on the completeness and timely identification of indicators of impairment charges or impairment reversals. Auditing the impairment assessments of PP&E and JVAs is subjective due to the judgement involved in determining whether indicators of impairment or impairment reversal exist, particularly for longer term assets, and the extent of any impairment loss or its reversal. The key assumptions underpinning the impairment assessments include changes in future commodity price and refining and petrochemical margin assumptions. In addition, management forecast carbon prices, expected production volumes, the assumed weighted average cost of capital (WACC), changes in asset performance and future development plans and the expected useful lives of assets. The estimation of forecast commodity prices and refining and petrochemical margins are particularly judgmental because of, among other factors, increased demand uncertainty and pace of decarbonisation due to climate change and the energy transition. |
How we addressed the matter in our audit
| | We obtained an understanding of the controls over Shell's asset impairment process. We then evaluated the design of these controls and tested their operating effectiveness. For example, we tested the controls over management's identification of indicators of impairment and reversals of impairment and the approval of oil and gas prices and refining margins. We evaluated Shell's assessment of impairment and impairment reversal triggers, including changes in the forecast commodity price assumptions, movements in oil and gas reserves (see oil and gas reserves critical audit matter), changes in asset performance and changes in Shell's business and operating plan assumptions. We further considered assets with high carbon intensity as a potential indicator of impairment, given Shell's climate-related targets and ambitions. We considered potential impairment triggers related to climate change and energy transition by estimating the carbon intensity of Shell's Upstream and Integrated Gas fields and identifying the most carbon intensive assets. We performed correlation between reserves, production and emissions data and assessed management's plans to reduce the carbon intensity of these assets in the future to determine whether there is a material risk that reserves recognised will not be produced or if the carbon intensity limited the expected useful lives of the assets. We assessed consistency of Shell's plans to reduce the carbon intensity of these assets with their climate-related targets and ambitions and whether these actions have been reflected in Shell's operating plan, which impact Shell's financial statements and disclosures. Also, we assessed the incremental carbon cost that would be incurred if all decarbonisation projects at highly carbon intensive assets were to be removed from Shell's operating plan. In addition, we considered contradictory evidence, such as the results of comparable market transactions by other energy companies in jurisdictions with similar environmental and regulatory focus that could indicate a material increase or decrease in the recoverable amount of Shell's assets. We also considered Shell's climate-related targets and ambitions and whether these could impact the future potential value of any assets. We performed a risk assessment on Shell's assets from a climate change physical risk perspective, considering asset and geographical specific factors to assess whether the existence of any increased physical risks represented a trigger for impairment. We then obtained an understanding of how management has incorporated historic, current and potential future asset integrity plans in the Shell operating plan. We also assessed potential operational changes that have or are expected to have a significant adverse effect on an asset and whether such unplanned shutdowns should be considered as impairment triggers. To test Shell's commodity price assumptions, amongst other procedures, we compared future short and long-term oil and gas prices to an independently developed reasonable range of forecasts based on consensus analysts' forecasts and those adopted by other international oil companies. To evaluate the impact of energy transition on Shell's commodity price forecasts applied in the preparation of the financial statements, we compared Shell's oil and gas price scenarios to the IEA's Net Zero Emissions 2050 (NZE) and to the IEA's Announced Pledges Scenario (APS) price assumptions. We evaluated the reasonableness of Shell's refining margin assumptions by comparing these to independent market and consultant forecasts. Through the IEA scenarios on World Energy Consumption, we considered the expected impact on demand for oil products and chemicals in a transition to a net zero economy. We also involved our oil and gas valuations specialists to assess the reasonableness of Shell's refining margin estimation methodology and assumptions, including evaluating long-run demand forecasts, incorporating the impacts of the energy transition, supply dynamics, and the speed of the industry's response to changing demand through either constructing new refineries or closing older refineries. Given the downward pressure on refining margins, we assessed whether this represented a trigger for impairment by assessing the impact of reduced margins in the context of the overall lives of Shell's petrochemicals facilities. To evaluate the accuracy of significant assumptions we performed a lookback by comparing actual performance of assets to the forecasts made in the prior year. We assessed the adequacy of Shell's disclosure of information about the assumptions Shell makes that could, in the future, have a significant risk of material adjustments to the carrying amounts of assets and liabilities, including sensitivity disclosures. This included evaluating the sensitivity disclosures in Note 4 of the carrying value of Shell's Upstream, Integrated Gas and Chemicals and Products PP&E assets against a range of future oil and gas price assumptions, reflecting reduced demand scenarios due to climate change and the energy transition, including the IEA Net Zero Emissions by 2050 scenario. |
Financial Statements and Supplements | Report of Independent Registered Public Accounting Firm continued
| | | | | |
| Accounting for complex transactions within Shell's Trading and Supply (T&S) function and the valuation of financial derivatives |
Description of the matter
| As described in Note 26, Shell recognised derivative financial instrument assets of $10.0 billion and derivative financial instrument liabilities of $9.6 billion. As described in Note 7 of the Consolidated Financial Statements, at December 31, 2024 Shell recognised $284 billion of revenue. A subset of the consolidated revenue relates to Gas & Power transactions, where there is a risk of unrealised revenues being inappropriately recorded. Shell executes and settles standard and non-standard complex trades. Auditing complex trades is challenging due to the significant judgement needed to determine the appropriate accounting treatment, and the key assumptions used in valuing the trades. Further, trading often does not take place in active markets where prices are readily available, especially for longer-dated contracts. This increases the subjectivity in determining the pricing curve and volatility assumptions, which are essential inputs for valuing the trades and in determining unrealised gains and losses. |
How we addressed the matter in our audit
| We obtained an understanding of the controls over Shell's process for the recognition of revenue relating to unrealised trading gains and losses, including controls over management's complex deals accounting and valuations. We then evaluated the design of these controls and tested their operating effectiveness. Amongst other procedures, we involved audit professionals with experience auditing large commodity trading organisations. We obtained an understanding of the commercial rationale of complex deals by analysing the executed agreements and through discussions with management. We assessed the accounting treatment of each of the complex deals taking into consideration actual contract terms and previous accounting judgements. We assessed the completeness of the list of complex deals and performed external confirmation procedures for the existence and completeness of contract terms. We assessed the reasonableness of Shell's derivative valuation methodology by comparing it to market practice, analysing whether a consistent framework was applied and assessed the consistency of inputs used in deal valuations and other assumptions. We tested the forward pricing curve and volatility assumptions in management's valuation models, including comparison to external broker quotes, market consensus providers, and our independent assessments and recalculated the mark to market valuation including reserves if any, against validated forward pricing curves to ensure it is consistent with Shell’s mark to market valuation. We involved EY valuation specialists to assist us in testing management's valuation models of Level 3 contracts, including the valuation of long-dated offtake contracts and those with illiquid tenor or price components. Our valuations were established using externally sourced inputs, where available. |
We have served as the Company's auditor since 2016.
London, United Kingdom
March 25, 2025
Financial Statements and Supplements | Report of Independent Registered Public Accounting Firm continued
To the shareholders and Board of Directors of Shell plc
Opinion on Internal Control over Financial Reporting
We have audited Shell plc's internal control over financial reporting as of December 31, 2024, based on criteria established in Internal Control—Integrated Framework issued by the Committee of Sponsoring Organizations of the Treadway Commission (2013 framework) (the COSO criteria). In our opinion, Shell plc (the Company) maintained, in all material respects, effective internal control over financial reporting as of December 31, 2024, based on the COSO criteria.
We also have audited, in accordance with the standards of the Public Company Accounting Oversight Board (United States) (PCAOB), the Consolidated Financial Statements of the Company, and our report dated March 25, 2025, expressed an unqualified opinion thereon.
Basis for Opinion
The Company's management is responsible for maintaining effective internal control over financial reporting and for its assessment of the effectiveness of internal control over financial reporting included in the accompanying Management's Report on Internal Control over Financial Reporting as set out in the Other regulatory and statutory information section. Our responsibility is to express an opinion on the Company's internal control over financial reporting based on our audit. We are a public accounting firm registered with the PCAOB and are required to be independent with respect to the Company in accordance with the U.S. federal securities laws and the applicable rules and regulations of the Securities and Exchange Commission and the PCAOB.
We conducted our audit in accordance with the standards of the PCAOB. Those standards require that we plan and perform the audit to obtain reasonable assurance about whether effective internal control over financial reporting was maintained in all material respects. Our audit included obtaining an understanding of internal control over financial reporting, assessing the risk that a material weakness exists, testing and evaluating the design and operating effectiveness of internal control based on the assessed risk, and performing such other procedures as we considered necessary in the circumstances. We believe that our audit provides a reasonable basis for our opinion.
Definition and Limitations of Internal Control over Financial Reporting
A company's internal control over financial reporting is a process designed to provide reasonable assurance regarding the reliability of financial reporting and the preparation of financial statements for external purposes in accordance with generally accepted accounting principles. A company's internal control over financial reporting includes those policies and procedures that (1) pertain to the maintenance of records that, in reasonable detail, accurately and fairly reflect the transactions and dispositions of the assets of the company; (2) provide reasonable assurance that transactions are recorded as necessary to permit preparation of financial statements in accordance with generally accepted accounting principles, and that receipts and expenditures of the company are being made only in accordance with authorisations of management and directors of the company; and (3) provide reasonable assurance regarding prevention or timely detection of unauthorised acquisition, use, or disposition of the company's assets that could have a material effect on the financial statements.
Because of its inherent limitations, internal control over financial reporting may not prevent or detect misstatements. Also, projections of any evaluation of effectiveness to future periods are subject to the risk that controls may become inadequate because of changes in conditions, or that the degree of compliance with the policies or procedures may deteriorate.
/s/Ernst & Young LLP
London, United Kingdom
March 25, 2025
Financial Statements and Supplements | Consolidated Financial Statements
Consolidated Statement of Income
for the year ended December 31, 2024
| | | | | | | | | | | | | | |
| $ million |
| Notes | 2024 | 2023 | 2022 |
| Revenue | 8 | 284,312 | 316,620 | 381,314 |
| Share of profit of joint ventures and associates | 14 | 2,993 | 3,725 | 3,972 |
| Interest and other income | 9 | 1,724 | 2,838 | 915 |
| Total revenue and other income | | 289,029 | 323,183 | 386,201 |
| Purchases | | 188,120 | 212,883 | 258,488 |
| Production and manufacturing expenses | 7 | 23,379 | 25,240 | 25,518 |
| Selling, distribution and administrative expenses | 7 | 12,439 | 13,433 | 12,883 |
| Research and development | 7 | 1,099 | 1,287 | 1,075 |
| Exploration | 7 | 2,411 | 1,750 | 1,712 |
| Depreciation, depletion and amortisation | 7 | 26,872 | 31,290 | 18,529 |
| Interest expense | 10 | 4,787 | 4,673 | 3,181 |
| Total expenditure | | 259,107 | 290,556 | 321,386 |
Income before taxation | | 29,922 | 32,627 | 64,815 |
Taxation charge | 23 | 13,401 | 12,991 | 21,941 |
Income for the period | 7 | 16,521 | 19,636 | 42,874 |
| Income attributable to non-controlling interest | 7 | 427 | 277 | 565 |
Income attributable to Shell plc shareholders | 7 | 16,094 | 19,359 | 42,309 |
| Basic earnings per share ($) | 31 | 2.55 | 2.88 | 5.76 |
| Diluted earnings per share ($) | 31 | 2.53 | 2.85 | 5.71 |
Consolidated Statement of Comprehensive Income
for the year ended December 31, 2024
| | | | | | | | | | | | | | |
| $ million |
| Notes | 2024 | 2023 | 2022 |
Income for the period | 7 | 16,521 | 19,636 | 42,874 |
| Other comprehensive income/(loss) net of tax | | | | |
| Items that may be reclassified to income in later periods: | | | | |
| Currency translation differences | 29 | (3,248) | 1,397 | (2,986) |
| Debt instruments remeasurements | 29 | 5 | 41 | (78) |
Cash flow hedging gains/(losses) | 29 | 216 | 71 | (232) |
Net investment hedging (losses)/gains | 29 | — | (44) | 180 |
| Deferred cost of hedging | 29 | (73) | (148) | 200 |
Share of other comprehensive (loss)/income of joint ventures and associates | 14 | (118) | 18 | 274 |
| Total | | (3,218) | 1,335 | (2,642) |
| Items that are not reclassified to income in later periods: | | | | |
| Retirement benefits remeasurements | 29 | 1,407 | (1,083) | 5,466 |
| Equity instruments remeasurements | 29 | 28 | (99) | (491) |
Share of other comprehensive income/(loss) of joint ventures and associates | 14 | 47 | (201) | (253) |
| Total | | 1,482 | (1,383) | 4,722 |
Other comprehensive (loss)/income for the period | | (1,736) | (48) | 2,080 |
Comprehensive income for the period | | 14,785 | 19,588 | 44,954 |
| Comprehensive income attributable to non-controlling interest | | 406 | 312 | 621 |
Comprehensive income attributable to Shell plc shareholders | | 14,379 | 19,276 | 44,333 |
Financial Statements and Supplements | Consolidated Financial Statements
Consolidated Balance Sheet
as at December 31, 2024
| | | | | | | | | | | |
| $ million |
| Notes | Dec 31, 2024 | Dec 31, 2023 |
| Assets | | | |
| Non-current assets | | | |
| Goodwill | 11 | 16,032 | 16,660 |
| Other intangible assets | 11 | 9,480 | 10,253 |
| Property, plant and equipment | 12 | 185,219 | 194,835 |
| Joint ventures and associates | 14 | 23,445 | 24,457 |
| Investments in securities | 15 | 2,255 | 3,246 |
| Deferred tax | 23 | 6,857 | 6,454 |
| Retirement benefits | 24 | 10,003 | 9,151 |
| Trade and other receivables | 16 | 6,018 | 6,298 |
| Derivative financial instruments | 26 | 374 | 801 |
| | 259,683 | 272,155 |
| Current assets | | | |
| Inventories | 17 | 23,426 | 26,019 |
| Trade and other receivables | 16 | 45,860 | 53,273 |
| Derivative financial instruments | 26 | 9,673 | 15,098 |
| Cash and cash equivalents | 18 | 39,110 | 38,774 |
| | 118,069 | 133,164 |
| Assets classified as held for sale | 19 | 9,857 | 951 |
| | 127,926 | 134,115 |
| Total assets | | 387,609 | 406,270 |
| Liabilities | | | |
| Non-current liabilities | | | |
| Debt | 21 | 65,448 | 71,610 |
| Trade and other payables | 20 | 3,290 | 3,103 |
| Derivative financial instruments | 26 | 2,185 | 2,301 |
| Deferred tax | 23 | 13,505 | 15,347 |
| Retirement benefits | 24 | 6,752 | 7,549 |
| Decommissioning and other provisions | 25 | 21,227 | 22,531 |
| | 112,407 | 122,441 |
| Current liabilities | | | |
| Debt | 21 | 11,630 | 9,931 |
| Trade and other payables | 20 | 60,693 | 68,237 |
| Derivative financial instruments | 26 | 7,391 | 9,529 |
| Income taxes payable | 23 | 4,648 | 3,422 |
| Decommissioning and other provisions | 25 | 4,469 | 4,041 |
| | 88,831 | 95,160 |
| Liabilities directly associated with assets classified as held for sale | 19 | 6,203 | 307 |
| | 95,034 | 95,467 |
| Total liabilities | | 207,441 | 217,908 |
| | | |
| Equity | | | |
| Share capital | 27 | 510 | 544 |
| Shares held in trust | | (803) | (997) |
| Other reserves | 29 | 19,766 | 21,145 |
| Retained earnings | | 158,834 | 165,915 |
| Equity attributable to Shell plc shareholders | | 178,307 | 186,607 |
| Non-controlling interest | | 1,861 | 1,755 |
| Total equity | | 180,168 | 188,362 |
| Total liabilities and equity | | 387,609 | 406,270 |
Signed on behalf of the Board
Sinead Gorman
Chief Financial Officer
March 25, 2025
Financial Statements and Supplements | Consolidated Financial Statements
Consolidated Statement of Changes in Equity
for the year ended December 31, 2024
| | | | | | | | | | | | | | | | | | | | | | | |
| | $ million |
| Equity attributable to Shell plc shareholders | | |
| Share capital (see Note 27) | Shares
held in trust | Other reserves (see Note 29) | Retained
earnings | Total | Non-
controlling
interest | Total
equity |
| At January 1, 2024 | 544 | (997) | 21,145 | 165,915 | 186,607 | 1,755 | 188,362 |
| Comprehensive income for the period | — | — | (1,715) | 16,094 | 14,379 | 406 | 14,785 |
| Transfer from other comprehensive income | — | — | 193 | (193) | — | — | — |
Dividends (see Note 30) [A] | — | — | — | (8,668) | (8,668) | (308) | (8,976) |
| Repurchases of shares [B] | (34) | — | 34 | (14,057) | (14,057) | — | (14,057) |
| Share-based compensation | — | 194 | 109 | (354) | (51) | — | (51) |
| Other changes | — | — | — | 97 | 97 | 8 | 105 |
| At December 31, 2024 | 510 | (803) | 19,766 | 158,834 | 178,307 | 1,861 | 180,168 |
| At January 1, 2023 | 584 | (726) | 21,132 | 169,482 | 190,472 | 2,125 | 192,597 |
| | | | | | | |
| | | | | | | |
| Comprehensive income for the period | — | — | (83) | 19,359 | 19,276 | 312 | 19,588 |
| Transfer from other comprehensive income | — | — | (112) | 112 | — | — | — |
Dividends (see Note 30) [A] | — | — | — | (8,389) | (8,389) | (764) | (9,153) |
| Repurchases of shares | (40) | — | 40 | (14,571) | (14,571) | — | (14,571) |
| Share-based compensation | — | (271) | 168 | (85) | (188) | — | (188) |
| Other changes | — | — | — | 7 | 7 | 82 | 89 |
December 31, 2023 | 544 | (997) | 21,145 | 165,915 | 186,607 | 1,755 | 188,362 |
| At January 1, 2022 | 641 | (610) | 18,909 | 153,026 | 171,966 | 3,360 | 175,326 |
Comprehensive income for the period | — | — | 2,024 | 42,309 | 44,333 | 621 | 44,954 |
| Transfer from other comprehensive income | — | — | (34) | 34 | — | — | — |
Dividends (see Note 30) [A] | — | — | — | (7,283) | (7,283) | (206) | (7,489) |
| Repurchases of shares | (57) | — | 57 | (18,547) | (18,547) | — | (18,547) |
| Share-based compensation | — | (116) | 176 | 131 | 191 | — | 191 |
| Other changes | — | — | — | (188) | (188) | (1,650) | (1,838) |
| At December 31, 2022 | 584 | (726) | 21,132 | 169,482 | 190,472 | 2,125 | 192,597 |
[A]The amount charged to retained earnings is based on prevailing exchange rates on the payment date.
[B]Includes shares committed to repurchase under irrevocable contracts and repurchases subject to settlement at the end of the year. (See Note 27).
Financial Statements and Supplements | Consolidated Financial Statements
Consolidated Statement of Cash Flows
for the year ended December 31, 2024
| | | | | | | | | | | | | | |
| $ million |
| | Notes | 2024 | 2023 | 2022 |
Income before taxation for the period | | 29,922 | 32,627 | 64,815 |
| Adjustment for: | | | | |
| Interest expense (net) | | 2,415 | 2,360 | 2,135 |
| Depreciation, depletion and amortisation | | 26,872 | 31,290 | 18,529 |
| Exploration well write-offs | 12 | 1,622 | 868 | 881 |
Net losses/(gains) on sale and revaluation of non-current assets and businesses | | 288 | (246) | (642) |
| Share of profit of joint ventures and associates | | (2,993) | (3,725) | (3,972) |
| Dividends received from joint ventures and associates | | 3,632 | 3,674 | 4,398 |
Decrease/(increase) in inventories | | 1,273 | 6,325 | (8,360) |
Decrease/(increase) in current receivables | | 6,578 | 12,401 | (8,989) |
(Decrease)/increase in current payables [A] | | (5,789) | (11,581) | 12,329 |
| Derivative financial instruments | | 2,484 | (5,723) | (2,619) |
| Retirement benefits | | (326) | (37) | 417 |
Decommissioning and other provisions [A] | | (828) | 220 | (379) |
| Other | | 1,539 | (550) | 2,991 |
| Tax paid | | (12,002) | (13,712) | (13,120) |
| Cash flow from operating activities | | 54,687 | 54,191 | 68,414 |
Cash capital expenditure | | (21,085) | (24,392) | (24,833) |
| Capital expenditure | 7 | (19,601) | (22,993) | (22,600) |
| Investments in joint ventures and associates | 7 | (1,404) | (1,202) | (1,973) |
Investments in equity securities | 7 | (80) | (197) | (260) |
| Proceeds from sale of property, plant and equipment and businesses | | 1,621 | 2,565 | 1,431 |
Proceeds from joint ventures and associates from sale, capital reduction and repayment of long-term loans | | 590 | 474 | 511 |
| Proceeds from sale of equity securities | | 582 | 51 | 117 |
| Interest received | | 2,399 | 2,124 | 906 |
| Other investing cash inflows | | 4,576 | 4,269 | 2,060 |
| Other investing cash outflows | | (3,838) | (2,825) | (2,640) |
| Cash flow from investing activities | | (15,155) | (17,734) | (22,448) |
Net (decrease)/increase in debt with maturity period within three months | | (310) | (211) | 318 |
| Other debt: | | | | |
| New borrowings | | 363 | 1,029 | 269 |
| Repayments | | (9,672) | (10,650) | (8,459) |
| Interest paid | | (4,557) | (4,441) | (3,677) |
| Derivative financial instruments | | (594) | 723 | (1,799) |
| Change in non-controlling interest | | (15) | (22) | (1,965) |
| Cash dividends paid to: | | | | |
Shell plc shareholders | | (8,668) | (8,393) | (7,405) |
| Non-controlling interest | | (295) | (764) | (206) |
| Repurchases of shares | | (13,898) | (14,617) | (18,437) |
| Shares held in trust: net purchases and dividends received | | (789) | (889) | (593) |
| Cash flow from financing activities | | (38,435) | (38,235) | (41,954) |
| Effects of exchange rate changes on cash and cash equivalents | | (761) | 306 | (736) |
(Decrease)/increase in cash and cash equivalents | | 336 | (1,472) | 3,276 |
| Cash and cash equivalents at beginning of year | | 38,774 | 40,246 | 36,970 |
| Cash and cash equivalents at end of year | 18 | 39,110 | 38,774 | 40,246 |
[A]To further enhance consistency between working capital in the Balance Sheet and the Statement of Cash Flows, from January 1, 2024, onwards movements in current other provisions are recognised in 'Decommissioning and other provisions' instead of '(Decrease)/increase in current payables'. Comparatives have been reclassified accordingly for 2023 by $693 million and for 2022 by $414 million to conform with current year presentation.
Financial Statements and Supplements
Notes to the Consolidated Financial Statements
1. Basis of preparation
The Consolidated Financial Statements of Shell plc (the "Company") and its subsidiaries (collectively referred to as "Shell") have been prepared in accordance with UK-adopted international accounting standards and with the requirements of the UK Companies Act 2006 as applicable to companies reporting under those standards. As applied to Shell, there are no material differences from the International Financial Reporting Standards (IFRS) as issued by the International Accounting Standards Board (IASB); therefore, the Consolidated Financial Statements have been prepared in accordance with the IFRS as issued by the IASB.
As described in the accounting policies in Note 2, the Consolidated Financial Statements have been prepared under the historical cost convention except for certain items measured at fair value. Those accounting policies have been applied consistently in all periods.
The Consolidated Financial Statements were approved and authorised for issue by the Board of Directors on March 25, 2025.
These Consolidated Financial Statements have been prepared on the going concern basis of accounting. In assessing the appropriateness of the going concern assumption over the period to June 30, 2026 (the "going concern period"), management has stress-tested Shell's most recent financial projections to incorporate a range of potential future outcomes by considering Shell's principal risks, potential downside pressures on commodity prices and long-term demand, and cash preservation measures, including reduced future cash capital expenditure and shareholder distributions. This assessment confirmed that Shell has adequate cash, other liquid resources and undrawn credit facilities to enable it to meet its obligations as they fall due in order to continue its operations during the going concern period. Therefore, the Directors consider it appropriate to continue to adopt the going concern basis of accounting in preparing the audited Consolidated Financial Statements.
2. Material accounting policies, judgements and estimates
This Note describes Shell's material accounting policies. It allows for an understanding as to how material transactions, other events and conditions are reported. It also describes: (a) judgements, apart from those involving estimations, that management makes in applying the policies that have the most significant effect on the amounts recognised in the Consolidated Financial Statements; and (b) estimations, including assumptions about the future, that management makes in applying the policies. The sources of estimation uncertainty that have a significant risk of a material adjustment to the carrying amounts of assets and liabilities within the next financial year are specifically identified as a significant estimate.
The accounting policies applied are consistent with those of the previous financial year.
Nature of the Consolidated Financial Statements
The Consolidated Financial Statements are presented in US dollars (dollars) and comprise the financial statements of the Company and its subsidiaries, being those entities over which the Company has control, either directly or indirectly, through exposure or rights to their variable returns and the ability to affect those returns through its power over the entities. Information about subsidiaries at December 31, 2024, can be found in "Exhibit 8.1: Significant subsidiaries and other related undertakings (audited)".
Financial Statements and Supplements | Notes to the Consolidated Financial Statements continued
2. Material accounting policies, judgements and estimates continued
Subsidiaries are consolidated from the date on which control is obtained until the date that such control ceases, using consistent accounting policies. All inter-company balances and transactions, including unrealised profits arising from such transactions, are eliminated. Unrealised losses are also eliminated unless the transaction provides evidence of an impairment of the asset transferred. Non-controlling interest represents the proportion of income, other comprehensive income and net assets in subsidiaries that is not attributable to the Company's shareholders.
Currency translation
Foreign currency transactions are translated using the exchange rate at the dates of the transactions or valuation where items are remeasured. Foreign exchange gains and losses resulting from the settlement of such transactions and from the translation at quarter-end exchange rates of monetary assets and liabilities denominated in foreign currencies (including those in respect of inter-company balances, unless related to loans of a long-term investment nature) are recognised in income unless when recognised in other comprehensive income in respect of cash flow or net investment hedges. Foreign exchange gains and losses in income are presented within interest and other income or within purchases where not related to financing. Share capital issued in currencies other than the dollar is translated at the exchange rate at the date of issue.
On consolidation, assets and liabilities of non-dollar entities are translated to dollars at year-end rates of exchange, while their statements of income, other comprehensive income and cash flows are translated at monthly average rates. Prior to January 1, 2023, these currency translations were performed at quarterly average rates. This change has no significant impact on Shell's financial reporting. The resulting translation differences are recognised as currency translation differences within other comprehensive income. Upon sale of all or part of an interest in, or upon liquidation of, an entity, the appropriate portion of cumulative currency translation differences related to that entity is generally recognised in income.
Revenue recognition
Revenue from sales of oil, natural gas, chemicals and other products is recognised at the transaction price to which Shell expects to be entitled, after deducting sales taxes, excise duties and similar levies. For contracts that contain separate performance obligations, the transaction price is allocated to those separate performance obligations by reference to their relative stand-alone selling prices.
Revenue is recognised when control of the products has been transferred to the customer. For sales by Integrated Gas and Upstream operations, this generally occurs when the product is physically transferred into a vessel, pipe or other delivery mechanism; for sales by refining operations, it is either when the product is placed onboard a vessel or offloaded from the vessel, depending on the contractually agreed terms; and for sales of oil products and chemicals, it is either at the point of delivery or the point of receipt, depending on contractual conditions.
Revenue resulting from hydrocarbon production from properties in which Shell has an interest with partners in joint arrangements is recognised on the basis of Shell's volumes lifted and sold. Revenue resulting from the production of oil and natural gas under production-sharing contracts (PSCs) is recognised for those amounts relating to Shell's cost recoveries and Shell's share of the remaining production. Gains and losses on derivative contracts and the revenue and costs associated with other contracts that are classified as held primarily for the purpose of being traded are reported on a net basis in the Consolidated Statement of Income. Purchases and sales of hydrocarbons under exchange contracts that are necessary to obtain or reposition feedstocks for the refinery operations are presented net in the Consolidated Statement of Income.
Revenue resulting from arrangements that are not considered contracts with customers is presented as revenue from other sources.
Research and development
Development costs that are expected to generate probable future economic benefits are capitalised as intangible assets. All other research and development expenditure is recognised in the Consolidated Statement of Income as incurred.
Exploration costs
Hydrocarbon exploration costs are accounted for under the successful efforts method: exploration costs are recognised in the Consolidated Statement of Income when incurred, except that exploratory drilling costs, including in respect of the recapitalisation of depreciation, are included in property, plant and equipment pending determination of proved reserves. Exploration costs capitalised in respect of exploration wells that are more than 12 months old are written off unless: (a) proved reserves are booked; or (b) (i) they have found commercially producible quantities of reserves; and (ii) they are subject to further exploration or appraisal activity in that either drilling of additional exploratory wells is under way or firmly planned for the near future or other activities are being undertaken to sufficiently progress the assessing of reserves and the economic and operating viability of the project.
Property, plant and equipment and intangible assets other than goodwill
Recognition
Property, plant and equipment comprise assets owned by Shell, assets held by Shell under lease contracts, and assets operated by Shell as contractor in PSCs. They include rights and concessions in respect of properties with proved reserves ("proved properties") and with no proved reserves ("unproved properties"). Property, plant and equipment, including expenditure on major inspections, and intangible assets are initially recognised in the Consolidated Balance Sheet at cost where it is probable that they will generate future economic benefits. This includes capitalisation of decommissioning and restoration costs associated with provisions for asset retirement (see "provisions"), certain development costs (see "research and development") and the effects of associated cash flow hedges (see "financial instruments") as applicable. Interest is capitalised as an increase in property, plant and equipment on major capital projects during construction. The accounting for exploration costs is described separately (see "exploration costs"). Intangible assets other than goodwill include acquired liquefied natural gas (LNG)
off-take and sales contracts, environmental certificates, power purchase agreements, software costs, retail customer relationships and trademarks.
Property, plant and equipment and intangible assets other than goodwill are subsequently carried at cost less accumulated depreciation, depletion and amortisation (including any impairment). Gains and losses on sale are determined by comparing the proceeds with the carrying amounts of assets sold and are recognised in the Consolidated Statement of Income, within interest and other income.
Financial Statements and Supplements | Notes to the Consolidated Financial Statements continued
2. Material accounting policies, judgements and estimates continued
An asset is classified as held for sale if its carrying amount will be recovered principally through sale rather than through continuing use, which is when the sale is highly probable, and it is available for immediate sale in its present condition subject only to terms that are usual and customary for sales of such assets. Assets classified as held for sale are measured at the lower of the carrying amount upon classification and the fair value less costs to sell. Assets classified as held for sale and the associated liabilities are presented separately from other assets and liabilities in the Consolidated Balance Sheet. Once assets are classified as held for sale, property, plant and equipment and intangible assets other than goodwill are no longer subject to depreciation or amortisation.
Depreciation, depletion and amortisation
Property, plant and equipment related to hydrocarbon production activities are in principle depreciated on a unit-of-production basis over the proved developed reserves of the field concerned, other than assets whose useful lives differ from the lifetime of the field which are depreciated applying the straight-line method. For certain Integrated Gas and Upstream assets, the use of proved developed reserves, which are determined using the Securities and Exchange Commission (SEC) mandated yearly average oil and gas prices, could result in depreciation charges for these assets which do not reflect the pattern in which their future economic benefits are expected to be consumed as, for example, it may result in assets with long-term expected lives having accelerated or being fully depreciated within one year. Therefore, in these instances, other approaches are applied to determine a reserves base for the purpose of calculating depreciation, such as using management's expectations of future oil and gas prices rather than yearly average prices and using total proved reserves to provide a phasing of periodic depreciation charges that more appropriately reflects the expected utilisation of the assets concerned. (See Note 12).
Rights and concessions in respect of proved properties are depleted on the unit-of-production basis over the total proved reserves of the relevant area. Where individually insignificant, unproved properties may be grouped and depreciated based on factors such as the average concession term and past experience of recognising proved reserves.
Property, plant and equipment held under lease contracts, capitalised LNG off-take and sales contracts and power purchase agreements are depreciated or amortised over the term of the respective contract. Other property, plant and equipment and intangible assets other than goodwill are depreciated or amortised on a straight-line basis over their estimated useful lives. They include energy and chemicals parks (for which the useful life is generally 20 years), retail service stations (for which the useful life is generally 15 years) and major inspection costs, which are depreciated over the estimated period before the next planned major inspection (three to five years). Estimates of the useful lives and residual values of property, plant and equipment and intangible assets other than goodwill are reviewed annually and adjusted if appropriate.
On classification of an asset as held for sale, depreciation ceases.
Impairment
Intangible assets other than goodwill and assets other than unproved properties (see "Exploration costs") are tested for impairment whenever events or changes in circumstances indicate that the carrying amounts for those assets may not be recoverable. If any such indication of impairment exists, the carrying amounts of those assets are written down to their recoverable amount, which is the higher of fair value less
costs of disposal (see "Fair value measurements") and value in use.
Value in use is determined as the amount of estimated risk-adjusted discounted future cash flows. For this purpose, assets are grouped into cash-generating units based on separately identifiable and largely independent cash inflows. Estimates of future cash flows used in the evaluation of impairment of assets are made using management's forecasts of commodity prices, market supply and demand, potential costs associated with operational greenhouse gas (GHG) emissions, mainly related to CO₂, and forecast product, refining and chemical margins. In addition, management takes into consideration the expected useful lives of the manufacturing facilities, exploration and production assets, and expected production volumes. The latter takes into account assessments of field and reservoir performance and includes expectations about both proved reserves and volumes that are expected to constitute proved reserves in the future (unproved volumes), which are risk-weighted utilising geological, production, recovery and economic projections. Cash flow projections are based on management's most recent Operating Plan that represents management's best estimate and are risked as appropriate. The discount rate is based on a nominal post-tax weighted average cost of capital (WACC). Using a post-tax discount rate to calculate value in use does not result in a materially different outcome than using a pre-tax discount rate. (See Note 13).
Impairments are reversed as applicable to the extent that the events or circumstances that triggered the original impairment have changed.
Impairment losses and reversals are reported within depreciation, depletion and amortisation.
Upon classification of an asset as held for sale, the carrying amount is impaired if this exceeds the fair value less costs to sell.
Financial Statements and Supplements | Notes to the Consolidated Financial Statements continued
2. Material accounting policies, judgements and estimates continued
| | | | | | | | |
| | |
| Judgements and estimates Proved oil and gas reserves Unit-of-production depreciation, depletion and amortisation charges are principally measured based on management's estimates of proved developed oil and gas reserves. Exploration drilling costs are capitalised pending the results of further exploration or appraisal activity (successful efforts method), which may take place for several years before the final investment decision on a development project is taken and before any related proved reserves can be booked. Proved reserves are estimated by internal qualified professionals. The proved reserves are estimated with reasonable certainty by analysis of available geological and engineering data at the time of the estimation, and only include volumes for which access to market is assured with reasonable expectation. Yearly average oil and gas prices are used for the estimation of proved reserves unless prices are defined by contractual arrangements, excluding escalations based upon future conditions. Proved reserves are subject to regular revision, both upward or downward, based on new information from the drilling of additional wells, observation of long-term reservoir performance under producing conditions, updates of development plans and changes in economic factors, including product prices, contract terms, legislation or development plans. Changes to estimates of proved developed reserves affect prospectively the amounts of depreciation, depletion and amortisation charged and, consequently, the carrying amounts of exploration and production assets. Generally, in the normal course of business the diversity of the asset portfolio will limit the net effect of such revisions. The outcome of, or assessment of plans for, exploration or appraisal activity may result in the related capitalised exploration drilling costs being recognised in the Consolidated Statement of Income in that period. Judgement is involved in determining when to use an alternative reserves base in order to appropriately reflect the expected utilisation of the assets concerned (see "Depreciation, depletion and amortisation"). Information about the carrying amounts of exploration and production assets and the amounts charged to the Consolidated Statement of Income, including depreciation, depletion and amortisation and the quantitative impact of the use of an alternative reserves base, is presented in Note 12. Impairment For the purposes of determining whether impairment of assets has occurred, and the extent of any impairment loss or its reversal, the key assumptions management uses in estimating risk-adjusted future cash flows for value in use measures are future oil and gas prices and product margins, including refining and chemical margins. In addition, management uses other assumptions, such as potential costs associated with operational GHG emissions, market supply and demand, expected production volumes and forecast expenditure. These assumptions and the judgements of management that are based on them are subject to change as new information becomes available. Changes in assumptions could affect the carrying amounts of assets, and any impairment losses and reversals will affect income. Changes in economic conditions can affect the rate used to discount future cash flow estimates or the risk adjustment in the future cash flows. Judgement is applied to conclude whether changes in assumptions or economic conditions are an indicator that an asset may be impaired or that an impairment loss recognised in prior periods may no longer exist, or may have decreased. Expected production volumes, which comprise proved reserves and unproved volumes, are used for impairment testing because management believes this to be the most appropriate indicator of expected future cash flows. Reserves estimates are inherently imprecise. Furthermore, projections about unproved volumes are based on information that is necessarily less robust than that available for mature reservoirs. Estimation is involved with respect to the expected life of energy and chemicals parks, including management's view on the future development of refining margins. The determination of cash-generating units requires judgement. Changes in this determination could impact the calculation of value in use and therefore the conclusion on the recoverability of assets' carrying amounts when performing an impairment test. Judgement, which is subject to change as new information becomes available, can be required in determining when an asset is classified as held for sale. A change in that judgement could result in impairment charges affecting income, depending on whether classification requires a write-down of the asset to its fair value less costs to sell. Significant estimates In assessing the value in use, the estimated risk-adjusted future post-tax cash flows are discounted to their present value using a post-tax discount rate that reflects Shell's post-tax WACC. (See Note 13). The level of risking reflected in the cash flow assumptions is a consideration in management's assessment of the discount rate to be applied in order to avoid duplication of systemic and asset-specific risking in calculating value in use, and to ensure the discount rate applied is commensurate with risks included in forecast cash flows. Assumptions about future commodity prices and refining and chemical margins used in the impairment testing in, respectively, Integrated Gas and Upstream, and Chemicals and Products (see Note 13) are regularly assessed by management, noting that management does not necessarily consider short-term increases or decreases in prices as being indicative of long-term levels. The price methodology applied is based on Shell management's understanding and interpretation of demand and supply fundamentals in the near term, taking into account various other factors such as industry rationalisation and energy transition in the long term. The discount rate, future commodity prices and refining margins used in impairment testing provide a source of estimation uncertainty as referred to in paragraph 125 of IAS 1 Presentation of Financial Statements (IAS 1.125). Information about the carrying amounts of assets and impairments and their sensitivity to changes in significant estimates is presented in Note 13. | |
| | |
Financial Statements and Supplements | Notes to the Consolidated Financial Statements continued
2. Material accounting policies, judgements and estimates continued
Goodwill
Goodwill is initially measured as the excess of the aggregate of the consideration transferred and the amount recognised for any non-controlling interest over the fair value of the identifiable assets acquired and liabilities assumed in a business combination at the acquisition date. The amount recognised for any non-controlling interest is measured as a percentage of the identified net assets of the acquiree based on the present ownership's proportionate share. At the acquisition date, acquired goodwill is allocated to each cash-generating unit (CGU), or groups of CGUs, expected to benefit from the combination's synergies. The CGU to which goodwill is allocated represents the lowest level at which the goodwill will be monitored and managed.
Goodwill is not amortised and is subsequently measured at the initial amount recognised less any accumulated impairment losses. (See Note 11).
Impairment
The carrying amount of goodwill is tested for impairment at least annually. Impairment is determined for goodwill by assessing the recoverable amount of each CGU to which the goodwill relates. An impairment loss is recognised when the CGU's recoverable amount is lower than its carrying amount. (See Note 13).
Previously recognised impairment losses of goodwill are not reversed subsequently.
Leases
A contract, or part of a contract, that conveys the right to control the use of an identified asset for a period of time in exchange for payments to be made to the owners (lessors) is accounted for as a lease. Contracts are assessed to determine whether a contract is, or contains, a lease at the inception of a contract or when the terms and conditions of a contract are significantly changed. The lease term is the non-cancellable period of a lease, together with contractual options to extend or to terminate the lease early, where it is reasonably certain that an extension option will be exercised or a termination option will not be exercised.
At the commencement of a lease contract, a lease liability and a corresponding right-of-use asset are recognised, unless the lease term is 12 months or less. The commencement date of a lease is the date on which the underlying asset is made available for use. The lease liability is measured at an amount equal to the present value of the lease payments during the lease term that are not paid at that date. The lease liability includes contingent rentals and variable lease payments that depend on an index, rate, or where they are fixed payments in substance. The lease liability is remeasured when the contractual cash flows of variable lease payments change due to a change in an index or rate when the lease term changes following a reassessment.
Lease payments are discounted using the interest rate implicit in the lease. If that rate is not readily available, the incremental borrowing rate is applied. The incremental borrowing rate reflects the rate of interest that the lessee would have to pay to borrow over a similar term, with a similar security, the funds necessary to obtain an asset of a similar nature and value to the right-of-use asset in a similar economic environment.
In general, a corresponding right-of-use asset is recognised for an amount equal to each lease liability, adjusted by the amount of any pre-paid lease payment relating to the specific lease contract. The depreciation on right-of-use assets is recognised in the Consolidated Statement of Income unless capitalised as exploration drilling cost (see "exploration cost") or capitalised when the right-of-use asset is used to construct another asset.
Where Shell is the lessor in a lease arrangement at inception, the lease arrangement will be classified as a finance lease or an operating lease. Classification is based on the extent to which the risks and rewards incidental to ownership of the underlying asset lie with the lessor or the lessee.
Where Shell, usually in its capacity as operator, has entered into a lease contract on behalf of a joint arrangement, a lease liability is recognised to the extent that Shell has primary responsibility for the lease liability. A finance sublease is subsequently recognised if the related right-of-use asset is subleased to the joint arrangement. This is usually the case when the joint arrangement has the right to direct the use and obtains substantially all of the economic benefits from using the asset.
Impairment of the right-of-use asset
Right-of-use assets are subject to existing impairment requirements as set out in "Property, plant and equipment", above, and as presented
in Note 13.
| | | | | | | | |
| | |
| Judgements and estimates A lease term includes optional lease periods where it is reasonably certain Shell will exercise the option to extend or not exercise the option to terminate the lease. Determination of the lease term is subject to judgement and has an impact on the measurement of the lease liability and related right-of-use asset. When assessing the lease term at the commencement date, Shell takes into consideration the broader economics of the contract. Reassessment of the lease term is performed upon changes in circumstances that may affect the probability that an option to extend or to terminate the lease will be exercised. Where the rate implicit in the lease is not readily available, an incremental borrowing rate is applied. This incremental borrowing rate reflects the rate of interest that the lessee would have to pay to borrow over a similar term, with a similar security, the funds necessary to obtain an asset of a similar nature and value to the right-of-use asset in a similar economic environment. Determination of the incremental borrowing rate requires estimation. | |
| | |
Financial Statements and Supplements | Notes to the Consolidated Financial Statements continued
2. Material accounting policies, judgements and estimates continued
Joint arrangements and associates
Arrangements under which Shell has contractually agreed to share control (see "Nature of the Consolidated Financial Statements" for the definition of control) with another party or parties are joint ventures where the parties have rights to the net assets of the arrangement, or joint operations where the parties have rights to the assets and obligations for the liabilities relating to the arrangement. Investments in entities over which Shell has significant influence but neither control nor joint control are classified as associates. Information about incorporated joint arrangements and associates at December 31, 2024, can be found in "Exhibit 8.1: Significant subsidiaries and other related undertakings (audited)".
Investments in joint ventures and associates are accounted for using the equity method, under which the investment is initially recognised at cost and subsequently adjusted for the Shell share of post-acquisition income less dividends received and the Shell share of other comprehensive income and other movements in equity, together with any loans of a long-term investment nature. Where necessary, adjustments are made to the financial statements of joint ventures and associates to bring the accounting policies used into line with those of Shell. In an exchange of assets and liabilities for an interest in a joint venture, the non-Shell share of any excess of the fair value of the assets and liabilities transferred over the pre-exchange carrying amounts is recognised in the Consolidated Statement of Income. Unrealised gains on other transactions between Shell and its joint ventures and associates are eliminated to the extent of Shell's interest in them; unrealised losses are treated similarly but may also result in an assessment of whether the asset transferred is impaired.
Shell recognises its assets and liabilities relating to its interests in joint operations, including its share of assets held jointly and liabilities incurred jointly with other partners.
Inventories
Inventories are stated at cost or net realisable value, whichever is lower. Cost comprises direct purchase costs (including transportation), and associated costs incurred in bringing inventories to their present condition and location, and is determined using the first-in, first-out (FIFO) method for oil, gas and chemicals and by the weighted average cost method for materials.
Taxation
The charge for current tax is calculated based on the income reported by the Company and its subsidiaries, as adjusted for items that are
non-taxable or disallowed and using rates that have been enacted or substantively enacted by the balance sheet date.
Deferred tax is determined, using the liability method, on temporary differences arising between the tax bases of assets and liabilities and their carrying amounts in the Consolidated Balance Sheet and on unused tax losses and credits carried forward.
Deferred tax assets and liabilities are calculated using the enacted or substantively enacted rates that are expected to apply when an asset is realised or a liability is settled. They are not recognised where they arise on the initial recognition of goodwill or of an asset or liability in a transaction (other than in a business combination) that, at the time of the transaction, affects neither accounting nor taxable profit, or in respect of taxable temporary differences associated with subsidiaries, joint ventures and associates where the reversal of the respective temporary difference can be controlled by Shell and it is probable that it will not reverse in the foreseeable future.
Deferred tax assets are recognised to the extent that it is probable that future taxable profits will be available against which the deductible temporary differences, unused tax losses and credits carried forward can be utilised.
Income tax receivables and payables as well as deferred tax assets and liabilities include provisions for uncertain income tax positions/treatments.
Income taxes are recognised in income except when they relate to items recognised in other comprehensive income, in which case the tax is recognised in other comprehensive income. Income tax assets and liabilities are presented separately in the Consolidated Balance Sheet except where there is a right of offset within fiscal jurisdictions and an intention to settle such balances on a net basis.
| | | | | | | | |
| | |
| Judgements and estimates Tax liabilities are recognised when it is probable that there will be a future outflow of funds to a taxing authority. In such cases, a provision is made for the amount expected to be settled, provided it can be reasonably estimated. Provisions for uncertain income tax positions/treatments are measured at the most likely amount or the expected value method, depending on which method better predicts the resolution of the uncertainty. Generally, uncertain tax treatments are assessed on an individual basis unless they are expected to be settled collectively. It is assumed that taxing authorities will examine positions taken if they have the right to do so and have full knowledge of the relevant information. Changes in estimates regarding the likelihood of a future outflow of funds or the expected amount to be settled are recognised in the Consolidated Statement of Income in the period in which the change occurs. This process requires the application of judgement, which can change over time depending on new facts and circumstances. Judgements primarily relate to transfer pricing, including inter-company financing, interpretation of PSCs, deductible expenditure for tax purposes, and taxation arising from disposal. | |
| | |
Financial Statements and Supplements | Notes to the Consolidated Financial Statements continued
2. Material accounting policies, judgements and estimates continued
| | | | | | | | |
| | |
| Judgements and estimates continued | |
| Deferred tax assets are recognised only to the extent it is considered probable that those assets will be recoverable. This involves an assessment of when those assets are likely to reverse, and a judgement as to whether or not there will be sufficient taxable profits available to offset the assets when they do reverse. This requires assumptions regarding future profitability and is therefore inherently uncertain. To the extent assumptions regarding future profitability change, there can be an increase or decrease in the amounts recognised in respect of deferred tax assets as well as in the amounts recognised in income in the period in which the change occurs. Taxation information, including charges and deferred tax assets and liabilities, is presented in Note 23. Income taxes include certain charges at higher rates levied on income from certain Integrated Gas and Upstream activities. | |
| | |
Retirement benefits
Benefits in the form of retirement pensions and health care and life insurance are provided to certain employees and retirees under defined benefit and defined contribution plans.
Obligations under defined benefit plans are calculated annually by independent actuaries using the projected unit credit method, which takes into account employees' years of service and, for pensions, average or final pensionable remuneration, and are discounted to their present value using interest rates of high-quality corporate bonds denominated in the currency in which the benefits will be paid and of a duration consistent with the plan obligations. Where plans are funded, payments are made to independently managed trusts; assets held by those trusts are measured at fair value. Defined benefit plan surpluses are recognised as assets to the extent that they are considered recoverable, which is generally by way of a refund or lower future employer contributions.
The amounts recognised in income in respect of defined benefit plans mainly comprise service cost and net interest. Service cost comprises principally the increase in the present value of the obligation for benefits resulting from employee service during the period (current service cost) and also amounts relating to past service and settlements or amendments of plans. Plan amendments are changes to benefits and are generally recognised when all legal and regulatory approvals have been received and the effects have been communicated to members. Net interest is calculated using the net defined benefit liability or asset matched against the discount rate yield curve at the beginning of each year for each plan. Remeasurements of the net defined benefit liability or asset resulting from actuarial gains and losses, and the return on plan assets excluding the amount recognised in income, are recognised in other comprehensive income.
For defined contribution plans, pension expense represents the amount of employer contributions payable for the period.
| | | | | | | | |
| | |
| Significant judgements and estimates Defined benefit obligations and plan assets, and the resulting liabilities and assets that are recognised, require significant estimation as these are subject to volatility as (actuarial) assumptions regarding future outcomes and market values change. Significant judgement is required in determining the actuarial assumptions, which vary for the different plans to reflect local conditions but are determined under a common process in consultation with independent actuaries. The assumptions applied in respect of each plan are reviewed annually and adjusted where necessary to reflect changes in experience and actuarial recommendations. Actuarial assumptions applied in determining defined benefit obligations provide a source of estimation uncertainty as referred to in IAS 1.125. Information about the amounts reported in respect of defined benefit pension plans, assumptions applicable to the principal plans and their sensitivity to changes in significant estimates is presented in Note 24. | |
| | |
Provisions
Provisions are recognised at the balance sheet date at management's best estimate of the expenditure required to settle the present obligation. Non-current amounts are discounted at a rate intended to reflect the time value of money. The carrying amounts of provisions and the discount rate applied are regularly reviewed and adjusted for new facts or changes in law, technology or financial markets.
Financial Statements and Supplements | Notes to the Consolidated Financial Statements continued
2. Material accounting policies, judgements and estimates continued
Provisions for decommissioning and restoration costs, which arise principally in connection with hydrocarbon production facilities, oil products manufacturing facilities and pipelines, are measured on the basis of current requirements, technology and price levels; the present value is calculated using amounts discounted over the useful economic life of the assets. The liability is recognised (together with a corresponding amount as part of the related property, plant and equipment) once a legal or constructive obligation arises to dismantle an item of property, plant and equipment and to restore the site on which it is located and when a reasonable estimate can be made. The effects of changes resulting from revisions to the timing or the amount of the original estimate of the provision are reflected on a prospective basis, generally by adjustment to the carrying amount of the related property, plant and equipment. However, where there is no related asset, or the change reduces the carrying amount to nil, the effect, or the amount in excess of the reduction in the related asset to nil, is recognised in income.
Shell reviews its energy and chemicals parks on a regular basis to determine whether any changes in assumptions, including expected life, trigger the need to recognise a provision for decommissioning and restoration.
Redundancy provisions are recognised when a detailed formal plan identifies the business or part of the business concerned, the location and number of employees affected, a detailed estimate of the associated costs and an appropriate timeline, and the employees affected have been notified of the plan's main features.
An onerous contract provision is recognised when the unavoidable cost of meeting the obligations under the contract exceeds the economic benefits expected to be received under it. The unavoidable cost under a contract is the lower of the cost of fulfilling the contract and any compensation or penalties arising from failure to fulfil it. The cost of fulfilling a contract comprises the costs that relate directly to the contract. Before an onerous provision is recognised Shell first recognises any impairment loss that has occurred on assets dedicated to that contract.
Other provisions are recognised in the Consolidated Statement of Income in the period in which an obligation arises and the amount can be reasonably estimated. Provisions are measured based on current legal requirements and existing technology where applicable. Recognition of any joint and several liability is based on management's best estimate of the final pro rata share of the liability. Provisions are determined independently of expected insurance recoveries. Recoveries are recognised when virtually certain of realisation.
| | | | | | | | |
| | |
| Estimates Estimates of provisions for future decommissioning and restoration costs are recognised and based on current legal and constructive requirements, technology and price levels. Because actual cash outflows can differ from estimates due to changes in laws, regulations, public expectations, technology, prices and conditions, and can take place many years in the future, the carrying amounts of provisions are regularly reviewed and adjusted to take account of such changes. Significant estimate The discount rate applied to reflect the time value of money in the carrying amount of provisions requires estimation. The discount rate used in the calculation of provisions is the pre-tax rate that reflects current market assessments of the time value of money. Generally, the market assessments of the time value of money can be reflected in the risk-free rate and given the long-term investment nature of oil and gas business, Shell considers it appropriate to use the 20-year US Treasury bond yield return as the risk-free rate. The discount rate applied is reviewed regularly and adjusted following changes in market rates. The discount rate applied to determine the carrying amount of provisions provides a source of estimation uncertainty as referred to in IAS 1.125. Information about decommissioning and restoration provisions and their sensitivity to changes in estimates is presented in Note 25. | |
| | |
Financial instruments
Financial assets and liabilities are presented separately in the Consolidated Balance Sheet except where there is a legally enforceable right of offset and Shell has the intention to settle on a net basis or realise the asset and settle the liability simultaneously.
Financial assets
Financial assets are classified at initial recognition and subsequently measured at amortised cost, fair value through other comprehensive income or fair value through profit or loss. The classification of financial assets is determined by the contractual cash flows and where applicable the business model for managing the financial assets.
Debt instruments are measured at amortised cost, if the objective of the business model is to hold the financial asset in order to collect contractual cash flows and the contractual terms give rise to cash flows that are solely payments of principal and interest. It is initially recognised at fair value plus or minus transaction costs that are directly attributable to the acquisition or issue of the financial asset. Subsequently, the financial asset is measured using the effective interest method less any impairment. Gains and losses are recognised in profit or loss when the asset is derecognised, modified or impaired.
All equity instruments and other debt instruments are recognised at fair value. For equity instruments, on initial recognition, an irrevocable election (on an instrument-by-instrument basis) can be made to designate these as at fair value through other comprehensive income instead of fair value through profit or loss. Dividends received on equity instruments are recognised as other income in profit or loss when the right of payment has been established, except when Shell benefits from such proceeds as a recovery of part of the cost of the financial asset, in which case such gains are recorded in other comprehensive income.
Financial Statements and Supplements | Notes to the Consolidated Financial Statements continued
2. Material accounting policies, judgements and estimates continued
Investments in securities
Investments in securities ("securities") comprise equity and debt securities. Equity securities are carried at fair value. Generally, unrealised holding gains and losses are recognised in other comprehensive income. On sale, net gains and losses previously accumulated in other comprehensive income are transferred to retained earnings. Debt securities are generally carried at fair value with unrealised holding gains and losses recognised in other comprehensive income. On sale, net gains and losses previously accumulated in other comprehensive income are recognised in income.
Impairment of financial assets
The expected credit loss model is applied for recognition and measurement of impairments in financial assets measured at amortised cost or at fair value through other comprehensive income. The expected credit loss model is also applied for financial guarantee contracts to which IFRS 9 applies and which are not accounted for at fair value through profit or loss. The loss allowance for the financial asset is measured at an amount equal to the 12-month expected credit losses. If the credit risk on the financial asset has increased significantly since initial recognition, the loss allowance for the financial asset is measured at an amount equal to the lifetime expected credit losses. Changes in loss allowances are recognised in profit or loss. For trade receivables, a simplified impairment approach is applied recognising expected lifetime losses from initial recognition.
Cash and cash equivalents
Cash and cash equivalents comprise cash at bank and in hand, including offsetting bank overdrafts, short-term bank deposits, money market funds, reverse repos and similar instruments that generally have a maturity of three months or less at the date of purchase.
Financial liabilities
Financial liabilities are measured at amortised cost, unless they are required to be measured at fair value through profit or loss, such as instruments held for trading, or Shell has opted to measure them at fair value through profit or loss. Debt and trade payables are recognised initially at fair value based on amounts exchanged, net of transaction costs, and subsequently at amortised cost except for fixed rate debt subject to fair value hedging which is remeasured for the hedged risk (see below). Interest expense on debt is accounted for using the effective interest method, and other than interest capitalised, is recognised in income. For financial liabilities that are measured under the fair value option, the change in the fair value related to own credit risk is recognised in other comprehensive income. The remaining fair value change is recognised at fair value through profit or loss.
Derivative contracts and hedges
Derivative contracts are used in the management of interest rate risk, foreign exchange risk, commodity price risk, and foreign currency cash balances. Derivatives that are not closely related to the host contract in terms of economic characteristics and risks and the host contract of which is not a financial asset are separated from their host contract and recognised at fair value with the associated gains and losses recognised in income.
Contracts to buy or sell a non-financial item that can be settled net in cash are accounted for as financial instruments, with the exception of those contracts that were entered into and continue to be held for the purpose of the receipt or delivery of a non-financial item in accordance with Shell's expected purchase, sale or usage requirements. Gains or losses arising from changes in the fair value of derivatives that are not designated as effective hedging instruments are recognised in income.
Certain derivative contracts qualify and are designated either: as a fair value hedge of the change in fair value of a recognised asset or liability or an unrecognised firm commitment; or as a cash flow hedge for the change in cash flows to be received or paid relating to a recognised asset or liability or a highly probable forecast transaction; or as a net investment hedge of the change in foreign exchange rates associated with net investments in foreign operations with a different functional currency than Shell's functional currency.
A change in the fair value of a hedging instrument designated as a fair value hedge is recognised in income, together with the consequential adjustment to the carrying amount of the hedged item. The effective portion of a change in fair value of a derivative contract designated as a cash flow hedge is recognised in other comprehensive income until the hedged transaction occurs; any ineffective portion is recognised in income. Where the hedged item is a non-financial asset or liability, the amount in accumulated other comprehensive income is transferred to the initial carrying amount of the asset or liability (reclassified to the balance sheet); a net investment hedge is accounted for similarly to a cash flow hedge. Gains or losses on the hedging instrument relating to the effective portion of the hedge are recognised in other comprehensive income while any gains or losses relating to the ineffective portion are recognised in the Consolidated Statement of Income. On disposal of the foreign operation, the cumulative value of any such gains or losses recorded in other comprehensive income is reclassified to the Consolidated Statement of Income.
The effective portion of a change due to retranslation at quarter-end exchange rates in the carrying amount of debt and the principal amount of derivative contracts used to hedge net investments in foreign operations is recognised in other comprehensive income until the related investment is sold or liquidated; any ineffective portion is recognised in income.
All relationships between hedging instruments and hedged items are documented, as well as risk management objectives and strategies for undertaking hedge transactions. The effectiveness of hedges is also continually assessed and hedge accounting is discontinued when there is a change in the risk management strategy.
Unless designated as hedging instruments, contracts to sell or purchase non-financial items that can be settled net as if the contracts were financial instruments and that do not meet expected own-use requirements (typically, forward sale and purchase contracts for commodities in trading operations), and contracts that are or contain written options, are recognised at fair value; associated gains and losses are recognised in income.
Derivatives that are held primarily for the purpose of trading are presented as current in the Consolidated Balance Sheet.
Financial Statements and Supplements | Notes to the Consolidated Financial Statements continued
2. Material accounting policies, judgements and estimates continued
| | | | | | | | |
| | |
| Judgement Judgement is required to determine whether contracts to buy or sell LNG are capable of being settled on a net basis. Due to the limited liquidity in the LNG market and the lack of net settlement history, contracts to buy or sell LNG are not considered capable of being settled on a net basis. As a result, these contracts are accounted for on an accrual basis and not as a financial instrument. | |
| | |
Fair value measurements
Fair value measurements are estimates of the amounts for which assets or liabilities could be transferred at the measurement date, based on the assumption that such transfers take place between participants in principal markets and, where applicable, taking highest and best use into account.
| | | | | | | | |
| | |
| Estimate Where available, fair value measurements are derived from prices quoted in active markets for identical assets or liabilities. In the absence of such information, other observable inputs are used to estimate fair value. Inputs derived from external sources are corroborated or otherwise verified, as appropriate. In the absence of publicly available information, fair value is determined using estimation techniques that take into account market perspectives relevant to the asset or liability, in as far as they can reasonably be ascertained, based on predominantly unobservable inputs. For derivative contracts where publicly available information is not available, fair value estimations are generally determined using models and other valuation methods, the key inputs for which include future prices, volatility, price correlation, counterparty credit risk and market liquidity, as appropriate; for other assets and liabilities, fair value estimations are generally based on the net present value of expected future cash flows. | |
| | |
Share-based compensation plans
The fair value of share-based compensation expense arising from the Performance Share Plan (PSP) and the Long-term Incentive Plan (LTIP) -- Shell's main equity-settled plans - is estimated using the average Monte Carlo fair values and is recognised in income from the date of grant over the vesting period with a corresponding increase directly in equity. The model projects and averages the results for a range of potential outcomes for the vesting conditions, the principal assumptions for which are the share price volatility and dividend yields for Shell and four of its main competitors using respectively three years and 10 years of historical data.
Shares held in trust
Shares in the Company, which are held by employee share ownership trusts and trust-like entities, are not included in assets but are reflected at cost as a deduction from equity as shares held in trust.
Acquisitions and sales of interests in a business
Assets acquired and liabilities assumed when control is obtained over a business, and when an interest or an additional interest is acquired in a joint operation which is a business, are recognised at their fair value at the date of the acquisition; the amount of the purchase consideration above this value is recognised as goodwill. When control is obtained, any non-controlling interest is recognised as the proportionate share of the identifiable net assets. The acquisition of a non-controlling interest in a subsidiary and the sale of an interest while retaining control are accounted for as transactions within equity. The difference between the purchase consideration or sale proceeds after tax and the relevant proportion of the non-controlling interest, measured by reference to the carrying amount of the interest's net assets at the date of acquisition or sale, is recognised in retained earnings as a movement in equity attributable to Shell plc shareholders.
Emission schemes and related environmental programmes
Emission certificates, biofuel certificates and renewable power certificates (together "environmental certificates") held for trading purposes are recognised at cost or net realisable value, whichever is lower, and classified under inventory.
Emission trading schemes
Emission certificates acquired for compliance purposes are initially recognised at cost and classified under intangible assets. In the schemes where a cap is set for emissions, the associated emission certificates granted are recognised at cost, which may be zero. An emission liability is recognised under other liabilities when actual emissions occur that give rise to an obligation. To the extent the liability is covered by emission certificates held for compliance purposes, the liability is measured with reference to the value of these emission certificates held and for the remaining uncovered portion at market value. The associated expense is presented under "Production and manufacturing expenses". Both the emission certificates and the emission liability are derecognised upon settling the liability with the respective regulator.
Biofuel programmes
Biofuel certificates acquired that are held for compliance purposes are initially recognised at cost under intangible assets. Self-generated biofuel certificates are recognised at nil value, as they primarily offset the obligation. A biofuel liability is recognised under other liabilities when the obligation arises under local regulations. To the extent covered by biofuel certificates held for compliance purposes, the liability is measured with reference to the value of these certificates held and for the remaining uncovered portion at market value. The associated expense is presented under "purchases". Biofuel certificates and the biofuel liability are both derecognised upon settling the liability with the respective regulator.
Financial Statements and Supplements | Notes to the Consolidated Financial Statements continued
2. Material accounting policies, judgements and estimates continued
Renewable power programmes
Renewable power certificates acquired for compliance purposes are initially recognised at cost as an intangible asset. Self-generated renewable power certificates are generally transferred to the customer upon sales of electricity. A renewable power liability is recognised under other liabilities when electricity sales take place that give rise to an obligation to retire renewable power certificates. The associated cost is recognised in "purchases" in the income statement. If the obligation relates to power consumed in business operations, it is presented in other liabilities with cost reflected in "Production and manufacturing expenses". To the extent covered by renewable power certificates held for compliance purposes, the liability is measured with reference to the value of these renewable power certificates and for the remaining uncovered portion at market value. Renewable power certificates and the renewable power liability are derecognised upon settling the liability with the respective regulator.
Consolidated Statement of Income presentation
Purchases reflect all costs related to the acquisition of inventories and the effects of the changes therein, and include associated costs incurred in conversion into finished or intermediate products. Production and manufacturing expenses are the costs of operating, maintaining and managing production and manufacturing assets. Selling, distribution and administrative expenses include direct and indirect costs of marketing and selling products.
3. Changes to IFRS not yet adopted
IFRS 18 Presentation and Disclosure in Financial Statements ("IFRS 18")
IFRS 18 was issued in April 2024 and will replace IAS 1 Presentation of Financial Statements. IFRS 18 will be effective for reporting periods beginning on or after January 1, 2027. This standard sets out requirements for the presentation and disclosure of information in financial statements, particularly the Consolidated Statement of Income. The standard introduces a defined structure for the Consolidated Statement of Income, additional defined subtotals, new principles for aggregation and disaggregation of information, and it mandates disclosures about management-defined performance measures.
IFRS 18 will have no impact on recognition and measurement. From Shell's initial impact assessment, it has concluded that the impact will be limited to disclosure and presentation in the Consolidated Financial Statements. The primary change will be that the share of profit from joint ventures and associates will be classified in the Consolidated Statement of Income under the investing category (income generated by the investment) instead of the operating category. As a result of this change, the dividends received from joint ventures and associates will be reclassified in the Consolidated Statement of Cash Flows from cash flow from operating activities (CFFO) to cash flow from investing activities (CFFI).
4. Climate change and energy transition
This note describes how Shell has considered climate-related impacts in key areas of the financial statements and how this translates into the valuation of assets and measurement of liabilities as Shell makes progress in the energy transition. The note is structured as follows:
Climate change and energy transition
Financial Statements and Supplements | Notes to the Consolidated Financial Statements continued
4. Climate change and energy transition continued
Note 2 Material accounting policies, judgements and estimates describes uncertainties, including those that have the potential to have a material effect on the Consolidated Balance Sheet in the next 12 months. This note describes the key areas of climate impacts that potentially have short-, medium- and longer-term effects on amounts recognised in the Consolidated Balance Sheet at December 31, 2024. Where relevant, this note contains references to other notes to the Consolidated Financial Statements and aims to provide an overarching summary of the energy transition impact.
In 2021, Shell launched its strategy to become a net-zero emissions energy business by 2050. The strategy aims to deliver more value with less emissions. Shell's targets include those related to its own operations: halve Scope 1 and 2 emissions on a net basis under operational control by 2030, compared with 2016 baseline, achieve methane emissions intensity below 0.2% and achieve near-zero methane emissions by 2030 and eliminate routine gas flaring by 2025. [A] In relation to emissions from the products we sell, Shell has a target to reduce the net carbon intensity of energy products sold by 9-13% by 2025, 15-20% by 2030 and 100% by 2050, compared with a 2016 baseline and an ambition, set in March 2024, to reduce customer emissions (Scope 3, Category 11) related to the use of oil products sold by 15-20% by 2030, compared with 2021. [B]
[A]This target was subject to the completion of the sale of The Shell Petroleum Development Company of Nigeria Limited (SPDC). With effect from January 1, 2025, SPDC ceased routine flaring. On March 13, 2025, Shell completed the sale of SPDC to Renaissance.
[B]Customer emissions from the use of our oil products (Scope 3, Category 11) were 517 million tonnes carbon dioxide equivalent (CO2e) in 2023 and 569 million tonnes CO2e in 2021.
Financial planning and assumptions
This section provides an overview of key assumptions used for financial planning related to climate change and the energy transition. These assumptions that underpin the amounts recognised in these financial statements -- such as future oil and gas prices, future chemical and refining margins, discount rates, future costs of decommissioning and restoration, carbon emission cost and deferred tax assets -- take climate change and energy transition into account and are similarly used for impairment testing of carrying values of assets. The areas described focus on those most pertinent to Shell's business and how financial planning and assumptions interact with scenarios. Subsequently, the sensitivity of carrying values to commodity prices, carbon emission costs, chemical and refining margins, discount rates and demand, if different assumptions were applied, is described.
There is no one single scenario that underpins the financial statements. Shell Scenarios are not predictions. They are designed to stretch management's thinking when it comes to considering events that may be possible, even if only remotely. As a result, these scenarios are not intended to be predictions of likely future events or outcomes and are not the basis for Shell's financial statements and Operating Plans.
Shell Scenarios and the range of possible outcomes inform the development of Shell's strategy and Shell's view on future oil and gas price outlooks, refining margins and chemical margins. The oil and gas price outlooks are one of the key assumptions that underpin Shell's financial statements. Shell's scenarios inform high-, mid- and low-price outlooks. The mid-price outlook represents management's reasonable best estimate and is the basis for Shell's financial statements, Operating Plans and impairment testing. Impairment testing applies management's reasonable best estimates across the full life cycle of assets, which may go beyond the Operating Plan period.
Shell's targets — including to reduce absolute Scope 1 and 2 emissions on a net basis [C] by 50% by 2030, compared with 2016 baseline, and a 15-20% reduction of net carbon intensity [D] by 2030 — have been included in the Operating Plan. The Operating Plan also includes expected costs for evolving carbon regulations (see "Carbon price sensitivities" below) based on a forecast of Shell's equity share of emissions from operated and non-operated assets, also taking into account the estimated impact of free allowances. For impairment testing purposes, key assumptions that underpin the amounts recognised in the Consolidated Balance Sheet, such as future oil and gas prices, refining margins, chemical margins, discount rates, future costs of decommissioning and restoration, carbon emission cost and tax rates, all go beyond the planning horizon in the Operating Plan and do take climate change and energy transition into account.
[C]Operational control boundary.
[D]GHG emissions based on the energy product sales included in the net carbon intensity (NCI) using equity boundary.
Goodwill, other intangible assets, property, plant and equipment, and joint ventures and associates
The carrying value of goodwill, other intangible assets, property plant and equipment, and joint ventures and associates by segment as at December 31 was as follows:
| | | | | | | | | | | | | | | | | |
| 2024 | | | | | |
| | | | | $ billion |
| Goodwill | Other intangible assets | Property, plant and equipment | Joint ventures and associates | Total |
| Integrated Gas | 4.9 | 2.6 | 60.0 | 6.4 | 73.9 |
| Upstream | 5.3 | 0.1 | 63.4 | 8.0 | 76.8 |
| Chemicals and Products | 0.3 | 1.0 | 32.6 | 4.0 | 37.9 |
| Marketing | 4.3 | 4.6 | 21.4 | 3.9 | 34.2 |
| Renewables and Energy Solutions | 1.2 | 1.2 | 5.7 | 1.0 | 9.1 |
| Corporate | — | — | 2.1 | 0.1 | 2.2 |
| Total | 16.0 | 9.5 | 185.2 | 23.4 | 234.1 |
Financial Statements and Supplements | Notes to the Consolidated Financial Statements continued
4. Climate change and energy transition continued
| | | | | | | | | | | | | | | | | |
| 2023 | | | | | |
| | | | | $ billion |
| Goodwill | Other intangible assets | Property, plant and equipment | Joint ventures and associates | Total |
| Integrated Gas | 4.9 | 3.2 | 57.7 | 6.1 | 71.9 |
| Upstream | 5.4 | 0.3 | 70.9 | 7.6 | 84.2 |
| Chemicals and Products [A] | 0.3 | 0.9 | 35.5 | 4.0 | 40.7 |
| Marketing [A] | 4.4 | 4.4 | 23.6 | 4.7 | 37.1 |
| Renewables and Energy Solutions | 1.7 | 1.5 | 4.8 | 2.0 | 10.0 |
| Corporate | — | — | 2.3 | 0.1 | 2.4 |
| Total | 16.7 | 10.3 | 194.8 | 24.5 | 246.3 |
[A]Following resegmentation in 2024 (see Note 7), prior period comparatives have been revised to conform with current year presentation with an offsetting impact between Marketing and Chemicals & Products segments.
For Integrated Gas and Upstream, sensitivity to commodity prices and carbon prices has been tested (see below) covering the carrying amount of goodwill, other intangible assets, property, plant and equipment, and joint ventures and associates. Sensitivity testing was performed applying alternative price scenarios to the forecasted cash flows for the whole period until the end of life of the asset tested. For Chemicals and Products, sensitivity to chemical margins, refining margins and carbon prices has been tested (see below). Marketing and Renewables and Energy Solutions are expected to be resilient through the energy transition with limited exposure of stranded assets.
In addition, sensitivity to changes in the discount rate applied in impairment testing has also been tested (see below).
In calculating recoverable value, key assumptions are not determined in isolation to ensure relevant interdependencies are appropriately reflected. In particular, management considers the relationship between discount rates, forecast commodity prices and cash flow risking to ensure impairment testing assumptions result in an implicit expected return that is balanced and appropriate for the asset under review. Each of the sensitivities described above has been tested under a ceteris paribus assumption where all other factors remain unchanged, and, as such, does not reflect the potential offsetting effects of corresponding changes in other assumptions.
Carrying value of Integrated Gas and Upstream assets
| | |
Carrying value of Integrated Gas and Upstream assets $ billion as at December 31 |
| | |
Carrying value of production assets $ billion as at December 31
|
| | |
Carrying value of exploration and evaluation assets $ billion as at December 31 |
| | |
| Carrying amount of Integrated Gas and Upstream assets |
| | | | | | | | | | | | | | | | | | | | | | | | | | | | | |
| | | | | | | $ billion |
| 2016 | 2017 | 2018 | 2019 | 2020 | 2021 | 2022 | 2023 | 2024 |
| Integrated Gas | 95 | 94 | 91 | 93 | 79 | 75 | 75 | 72 | 74 |
| Upstream | 136 | 128 | 123 | 119 | 106 | 91 | 88 | 84 | 77 |
| Total at December 31 | 231 | 222 | 214 | 212 | 185 | 166 | 163 | 156 | 151 |
Financial Statements and Supplements | Notes to the Consolidated Financial Statements continued
4. Climate change and energy transition continued
| | |
| Carrying amount of production assets |
| | | | | | | | | | | | | | | | | | | | | | | | | | | | | |
| | | | | | | $ billion |
| 2016 | 2017 | 2018 | 2019 | 2020 | 2021 | 2022 | 2023 | 2024 |
| At December 31 | 169 | 154 | 149 | 141 | 125 | 112 | 111 | 105 | 96 |
| Right of use assets | | | | 9 | 7 | 6 | 6 | 6 | 6 |
| Total at December 31 | 169 | 154 | 149 | 150 | 132 | 118 | 117 | 111 | 102 |
| | |
| Carrying amount of exploration and evaluation assets |
| | | | | | | | | | | | | | | | | | | | | | | | | | | | | |
| | | | | | | $ billion |
| 2016 | 2017 | 2018 | 2019 | 2020 | 2021 | 2022 | 2023 | 2024 |
| At December 31 | 19 | 19 | 18 | 15 | 9 | 7 | 6 | 5 | 4 |
Within Integrated Gas and Upstream, the assets potentially most sensitive to the energy transition are production assets and exploration and evaluation assets. Both production assets of $102 billion and exploration and evaluation assets of $4 billion are recognised within Property, plant and equipment within Integrated Gas and Upstream.
Portfolio composition and changes
Since 2016, the carrying value of production assets in Integrated Gas and Upstream decreased from $169 billion as at December 31, 2016, to$102 billion as at December 31, 2024. Over this period, depreciation was higher than additions for each year, and disposals of property, plant and equipment with a carrying value of $26 billion occurred. The carrying value of capitalised exploration and evaluation expenses decreased from $19 billion as at December 31, 2016, to $4 billion at December 31, 2024. This is the result of final investment decisions, reclassifications to production assets and amounts charged to expenses exceeding additions.
Estimated useful life
The energy transition and the pace at which it progresses may impact the remaining life of assets. Integrated Gas and Upstream assets are generally depreciated using a unit-of-production methodology where depreciation generally depends on production of SEC proved reserves. (See Note 2). Based on production plans of existing assets, 49%, 7% and 1% of SEC proved reserves as at December 31, 2024, would currently be left by 2030, 2040 and 2050, respectively. Based on the unit-of-production depreciation methodology applied, the carrying value for individual assets are depreciated to nil in the same pattern as the depletion of reserves towards nil. An analysis of Integrated Gas and Upstream production assets of $102 billion as at December 31, 2024, based on planned reserves depletion shows that these assets would be significantly further depreciated under the unit-of-production method by 2030 and nearly fully depreciated by 2050. This provides a further perspective on the risk of stranded assets carried in the Consolidated Balance Sheet as at December 31, 2024.
Price sensitivities using climate pricelines
As noted, in accordance with IFRS, Shell's financial statements are based on reasonable and supportable assumptions that represent management's current best estimate of the range of economic conditions that may exist in the foreseeable future. The mid-price outlook informed by Shell's scenario planning represents management's best estimate. A change of -10% or +10% to the mid-price outlook, as an average percentage over the whole life cycle of assets, would result in around $5-9 billion (2023: $5-8 billion) impairment or $2-5 billion
(2023: $2-5 billion) impairment reversal respectively in Integrated Gas and Upstream (see Note 13).
The energy transition will continue to bring volatility and there is significant uncertainty as to how commodity prices will develop over the next decades. Some pricelines see a structurally lower price during the transition period, while other pricelines see structurally higher commodity prices as a result of changes in supply and demand. As the risk of stranded assets is prevalent with downside price risk in energy transition scenarios, sensitivities have only been undertaken for such downside scenarios. If different price outlooks from external and often normative climate change scenarios were used, this would impact the recoverability of certain assets recognised in the Consolidated Balance Sheet as at December 31, 2024. These external scenarios are not representative of management's mid-price reasonable best estimate.
Sensitivity of carrying value to commodity prices described below is under the assumption that all other factors in the models used -- such as cost levels, volumes, mid-price CO2 assumptions and the discount rate -- to calculate recoverability of carrying value remains unchanged. Sensitivity testing has been performed by applying the alternative commodity price scenarios to cash flows for the whole period until the end of life of the assets tested, which may extend beyond the Operating Plan period. The alternative commodity prices were applied in the local cash flow models and thereafter aggregated by segment. Changes to commodity prices are applied because of the significant impact on Shell's business. It should be noted that a significant decrease in long-term forecasted commodity prices would probably lead to further changes, such as in portfolio choices and cost levels.
Sensitivity to changes in commodity prices in value in use calculations has been tested as follows:
Priceline 1 – Average prices from three 1.5-2°C external climate change scenarios: in view of the broad range of price outlooks across the various scenarios, the average of three external price outlooks was taken.
Financial Statements and Supplements | Notes to the Consolidated Financial Statements continued
4. Climate change and energy transition continued
○IHS Markit/ACCS 2024 – under this scenario oil prices (real terms 2024 (RT24)) decrease from $110 per barrel (/b) in 2025 to around $100/b in 2026-2027. From 2028 prices gradually decrease from $50/b towards $31/b in 2037, gradually recovering to $92/b in 2048 with a subsequent decrease towards $90/b in 2050. Gas prices (RT24) are around $3 per million British thermal units (/MMBtu) until 2042 and gradually increase towards $4/MMBtu until 2050 for Henry Hub. For Europe, prices decrease from $10/MMBtu in 2025 towards around $4/MMBtu in 2032, with a subsequent increase to some $5 /MMBtu until 2050. For Asia, prices decrease from $11/MMBtu in 2025 towards around $6/MMBtu in 2033, and gradually increase towards $7/MMBtu until 2050.
○Woodmac WM AET-1.5 degree – under this scenario oil prices (RT24) gradually decrease from $64/b in 2025 towards $28/b in 2050. Gas prices (RT24) increase from $3/MMBtu in 2025 towards around $4/MMBtu until 2035, staying on that level until 2050 for Henry Hub. For Europe, gas prices (RT24) decrease gradually from around $13/MMBtu in 2025 to some $6/MMBtu in 2030, then gradually increase towards $9/MMBtu in 2035 and subsequently decrease towards $6/MMBtu in 2050. For Asia, gas prices decrease from $14/MMBtu in 2025 to $7/MMBtu in 2030, subsequently increasing to $10/MMBtu around 2036 and subsequently decreasing towards$7/MMBtu in 2050.
○IEA NZE50 – under this scenario oil prices (RT24) gradually decrease from $72/b in 2025 towards some $26/b in 2050. Gas prices (RT24) decrease from some$3/MMBtu in 2025 to around $2/MMBtu until 2050 for Henry Hub. For Europe and Asia, gas prices (RT24) decrease from some $10/MMBtu and $11/MMBtu respectively in 2025 to some $4/MMBtu in 2050 for Europe and $5/MMBtu around 2030, for Asia staying at that level until 2050.
This average priceline provides an external view of the development of commodity prices under 1.5-2°C external climate change scenarios over the whole period under review.
Applying this priceline to Integrated Gas assets of $74 billion (2023: $72 billion) and Upstream assets of $77 billion (2023: $84 billion) as at December 31, 2024, shows recoverable amounts that are $11-15 billion (2023: $12-16 billion) and $1-3 billion (2023: $3-5 billion) lower, respectively, than the carrying value as at December 31, 2024.
Priceline–2 - Hybrid Shell Plan and IEA NZE50: this priceline applies Shell's mid-price outlook for the first 10 years (see Note 13). Because of the greater uncertainty for the period after 10 years, the International Energy Agency (IEA) normative Net Zero Emissions scenario is applied. This gives less weight to the price-risk uncertainty in the first 10 years reflected in the Operating Plan period and applies more risk to the more uncertain subsequent periods.
Applying this priceline to Integrated Gas assets of $74 billion (2023: $72 billion) and Upstream assets of $77 billion (2023: $84 billion) as at December 31, 2024, shows recoverable amounts that are $7--10 billion (2023: $8-10 billion) and up to $1 billion (2023: $1-3 billion) lower, respectively, than the carrying value as at December 31, 2024.
Priceline–3 - IEA NZE50: this priceline applies the International Energy Agency normative Net Zero Emissions by 2050 (IEA NZE50) scenario over the whole period under review. This priceline has been applied in order to also reflect the sensitivity to a pure net-zero emissions scenario from the IEA.
Applying this priceline to Integrated Gas assets of $74 billion (2023: $72 billion) and Upstream assets of $77 billion (2023: $84 billion) as at December 31, 2024, shows recoverable amounts that are $21-27 billion (2023: $15-20 billion) and $5-7 billion (2023: $3-5 billion) lower, respectively, than the carrying value as at December 31, 2024. For Integrated Gas the change in sensitivity compared with 2023 is largely driven by lower oil and Asia gas prices applied in sensitivity testing for the whole period under review.
Financial Statements and Supplements | Notes to the Consolidated Financial Statements continued
4. Climate change and energy transition continued
[A]The Network for Greening the Financial System (NGFS) is a group of 143 central banks and supervisors and 21 observers committed to sharing best practices, contributing to the development of climate– and environment–related risk management in the financial sector and mobilising mainstream finance to support the transition toward a sustainable economy. This scenario results from the NGFS GCAM model. This model embodies certain assumptions on the relationships between economic and energy output and climate interactions. This NGFS scenario shows a decline in world oil demand relative to the current policies baseline, in part a response to substitution away from fossil fuels. At the same time prices increase due to supply constraints.
[B]All figures are presented on RT24 basis unless noted differently.
The graph above shows the oil pricelines on a real-terms basis applied for the period until 2050 for Shell's mid-price outlook in comparison with the IEA announced pledges (IEA APS) scenario, the NGFS GCAM NZE 2050 scenario, the average prices from three 1.5-2°C external climate change scenarios (Priceline 1, above) and the IEA Net Zero Emissions by 2050 scenario (IEA NZE50, Priceline 3 above). The development of future oil prices is uncertain and oil prices have been subject to significant volatility in the past. Future oil prices may be impacted by future changes in macroeconomic factors, available supply, demand, geopolitical and other factors. The pricelines as per the scenarios NGFS GCAM NZE 2050, IEA APS, the average prices from three 1.5-2°C external climate change scenarios and IEA NZE50 differ from Shell's best estimate and view of the future oil price.
| | | | | | | | | | | | | | | | | | | | |
| | | | | | RT24 $/b |
| 2025 | 2030 | 2035 | 2040 | 2045 | 2050 |
| Shell mid-price | 69 | 70 | 70 | 70 | 70 | 70 |
| Average prices from four 1.5-2°C external climate change scenarios | 82 | 50 | 41 | 39 | 48 | 48 |
| IEA NZE50 | 72 | 43 | 37 | 31 | 28 | 26 |
| NGFS GCAM NZE 2050 | 77 | 79 | 82 | 85 | 94 | 114 |
| IEA APS | 81 | 73 | 69 | 64 | 62 | 59 |
Financial Statements and Supplements | Notes to the Consolidated Financial Statements continued
4. Climate change and energy transition continued
| | |
| Sensitivity + 10% to the mid-price outlook |
| | | | | | | | | | | | | | | | | | | | | | | |
| | | | $ billion |
| Carrying value | | Sensitivity |
| Dec 31, 2024 | Dec 31, 2023 | | 2024 | 2023 |
| Integrated Gas | 74 | 72 | | 2 | 4 | 2 | 4 |
| Upstream | 77 | 84 | | — | 1 | — | 1 |
| Total | 151 | 156 | | 2 | 5 | 2 | 5 |
| | |
| Sensitivity averaged from three 1.5-2°C external climate change scenarios |
| | | | | | | | | | | | | | | | | | | | | | | |
| | | | $ billion |
| Carrying value | | Sensitivity |
| Dec 31, 2024 | Dec 31, 2023 | | 2024 | 2023 |
| Integrated Gas | 74 | 72 | | (11) | (15) | (12) | (16) |
| Upstream | 77 | 84 | | (1) | (3) | (3) | (5) |
| Total | 151 | 156 | | (12) | (18) | (15) | (21) |
| | | | | | | | | | | | | | | | | | | | | | | |
| | | | $ billion |
| Carrying value | | Sensitivity |
| Dec 31, 2024 | Dec 31, 2023 | | 2024 | 2023 |
| Integrated Gas | 74 | 72 | | (21) | (27) | (15) | (20) |
| Upstream | 77 | 84 | | (5) | (7) | (3) | (5) |
| Total | 151 | 156 | | (26) | (34) | (18) | (25) |
| | |
| Sensitivity - 10% to the mid-price outlook |
| | | | | | | | | | | | | | | | | | | | | | | |
| | | | $ billion |
| Carrying value | | Sensitivity |
| Dec 31, 2024 | Dec 31, 2023 | | 2024 | 2023 |
| Integrated Gas | 74 | 72 | | (4) | (6) | (4) | (6) |
| Upstream | 77 | 84 | | (1) | (3) | (1) | (2) |
| Total | 151 | 156 | | (5) | (9) | (5) | (8) |
| | |
Sensitivity Hybrid Shell Plan + IEA NZE50
|
| | | | | | | | | | | | | | | | | | | | | | | |
| | | | $ billion |
| Carrying value | | Sensitivity |
| Dec 31, 2024 | Dec 31, 2023 | | 2024 | 2023 |
| Integrated Gas | 74 | 72 | | (7) | (10) | (8) | (10) |
| Upstream | 77 | 84 | | — | (1) | (1) | (3) |
| Total | 151 | 156 | | (7) | (11) | (9) | (13) |
Carbon price sensitivities
Carbon costs in the Operating Plan
The Operating Plan includes capital expenditure and operating costs to achieve Scope 1 and 2 emission reduction targets (see above). These include asset level abatement project costs that drive efficiencies and reduce emissions, expected costs for evolving carbon regulations based on a forecast of Shell's equity share of emissions and costs of offsets for any residual amounts.
The total capital expenditure for abatement projects which includes energy efficiency improvements, the transformation of energy and chemicals parks, CCS facilities and electrification of our facilities included in the Operating Plan is in excess of $6 billion. Total yearly carbon emission costs in Shell's Operating Plan gradually increase from $1 billion in 2025 to $5 billion in 2034 using the mid-price scenario. The sensitivity of carrying value of assets to changes in carbon prices is described in the section below.
Methods for estimating costs vary, depending on the nature of the cost. Abatement project costs to improve efficiencies and reduce emissions are estimated by applying a bottom-up approach where individual opportunities on an asset-level, project-by-project basis are identified.
Costs for evolving carbon regulations are based on a forecast of Shell's equity share of emissions and are included in the Operating Plan at Shell's mid-price outlook on a country-by-country basis and represent management's best estimate. In the short and near term, up to around 2030, costs for carbon emissions estimates are largely policy driven, through emissions trading schemes or taxation levied by governments which currently vary significantly on a country-by-country basis. Beyond 2030, where policy predictions are more challenging, the costs for carbon emissions are estimated based on the expected costs of abatement technologies required for 2050. The estimated costs are trending towards $50 to $230 per tonne (RT24), depending on the country, in 2050.
Financial Statements and Supplements | Notes to the Consolidated Financial Statements continued
4. Climate change and energy transition continued
Sensitivity to changes in carbon price assumptions
There is significant uncertainty as to how carbon costs will develop over the next decades. These will depend on policies set by countries and the pace of the energy transition. In accordance with IFRS, Shell's financial statements are based on reasonable and supportable assumptions that represent management's current best estimate, which is policy based up to 2030 and then based on the mid-price outlook beyond 2030. As the risk of stranded assets is prevalent with higher carbon emission prices than anticipated, sensitivity analyses have only been undertaken for such a downside scenario. If the IEA NZE50 outlook is applied, this would impact the recoverability of certain assets recognised in the Consolidated Balance Sheet as at December 31, 2024. This scenario is not representative of management's mid-price reasonable best estimate.
Sensitivity of carrying value to carbon emission costs as described below is under the assumption that all other factors in the value in use models used to calculate recoverability of carrying value remain unchanged. Changes to carbon emission costs are applied for Integrated Gas, Upstream and Chemicals and Products because of the potential impact on Shell's business.
Applying the IEA NZE50 carbon price scenario to Integrated Gas assets of $74 billion (2023: $72 billion) and Upstream assets of $77 billion (2023: $84 billion), up to the end of life of these assets, shows recoverable amounts that are $1-2 billion (2023: $2-4 billion) lower for Integrated Gas and up to $1 billion lower for Upstream than the carrying value as at December 31, 2024.
Applying the IEA NZE50 carbon price scenario to Chemicals and Products assets of $38 billion shows recoverable amounts that are $1-2 billion lower than the carrying value as at December 31, 2024. For Chemicals and Products, increased carbon cost could however potentially be recovered partially through increased product sale prices.
| | |
| Sensitivity IEA NZE 2050 carbon price scenario |
| | | | | | | | | | | | | | | | | | | | | | | | |
| | | | | $ billion |
| Carrying value | | | Sensitivity |
| Dec 31, 2024 | Dec 31, 2023 | | | 2024 | 2023 |
| Integrated Gas | 74 | 72 | | | (1) | (2) | (2) | (4) |
| Upstream | 77 | 84 | | | — | (1) | — | (1) |
| Chemicals and Products | 38 | 44 | | | (1) | (2) | (3) | (4) |
| Total | 189 | 200 | | | (2) | (5) | (5) | (9) |
For the key regions and countries the following carbon prices per tonne (RT24) have been assumed in the Operating Plan:
| | | | | | | | | | | |
| Operating plan period | | Subsequent period |
| Region | 2025-2034 | | 2035-2050 |
| European Union [A] | $92-$133 | | $136-$185 |
| Norway | $181-$230 | | $230-$230 |
| United Kingdom | $62-$133 | | $136-$185 |
| Canada (Federal) | $69-$115 | | $115-$125 |
| United States of America (Federal) | $0-$25 | | $31-$125 |
| Australia | $32-$76 | | $80-$150 |
| All other countries | $0-$65 | | $13-$150 |
[A]Except for the Netherlands where the ranges are $94-163 per tonne (2025-2034) and $164-185 per tonne (2035-2050).
Financial Statements and Supplements | Notes to the Consolidated Financial Statements continued
4. Climate change and energy transition continued
The graph below shows the carbon pricelines per tonne for the European Union on an RT24 basis under Shell's mid-price outlook that represents the best estimate as required to be applied under IFRS, in comparison with the IEA NZE50 scenario. The IEA NZE50 scenario differs from Shell's best estimate and view of future CO2 prices. Sensitivity of carrying value to the IEA NZE50 carbon price scenario is provided above.
| | |
CO2 prices - European Union RT24 $/tonne |
| | | | | | | | | | | | | | | | | | | | |
| | | | | RT24 $/tonne |
| 2025 | 2030 | 2035 | 2040 | 2045 | 2050 |
| Shell mid-price | 92 | 120 | 136 | 153 | 169 | 185 |
| | | | | | |
| IEA NZE50 | 86 | 143 | 184 | 209 | 232 | 255 |
| | | | | | |
| | | | | | |
| | |
Carrying value of Chemicals and Products assets $ billion as at December 31 |
[A]Following resegmentation in 2024 (see Note 7), prior period comparatives have been revised to conform with current year presentation with an offsetting impact between Marketing and Chemicals & Products segments
| | |
| Carrying amount of Chemicals and Production assets |
| | | | | | | | | | | | | | | | | | | | | | | | | | | | | |
| | | | | | | $ billion |
| 2016 | 2017 | 2018 | 2019 | 2020 | 2021 | 2022 | 2023 | 2024 |
| Chemicals | 15 | 16 | 18 | 22 | 25 | 27 | 28 | 25 | 24 |
| Refineries | 10 | 14 | 14 | 14 | 8 | 6 | 6 | 6 | 6 |
| Other | 1 | 7 | 6 | 9 | 9 | 9 | 9 | 10 | 8 |
| Total at December 31 | 26 | 37 | 38 | 45 | 42 | 42 | 43 | 41 | 38 |
Financial Statements and Supplements | Notes to the Consolidated Financial Statements continued
4. Climate change and energy transition continued
Within Chemicals and Products, the assets potentially most sensitive to the energy transition are refineries.
Portfolio composition and changes
Since 2016, Shell's Chemicals and Products portfolio has evolved, shifting from 15 refineries at the end of 2016 to eight (of which one is classified as held for sale) at the end of 2024. During that period, Shell assumed the sole ownership of two refineries through the dissolution of the Motiva joint venture, and disposed of, converted or closed nine refineries. Further, during 2024 Shell agreed to sell one refinery (classified as assets held for sale at the end of 2024, see Note 19). The carrying value of refineries decreased from $10 billion as at December 31, 2016, to less than $6 billion as at December 31, 2024. In line with Shell's strategy, it is progressing the repurposing of its energy and chemicals parks; these key focused assets allows Shell to underpin its hydrocarbon energy sales and the sales of lower carbon products.
Estimated useful life
Refineries in the Chemicals and Products segment (carrying value as at December 31, 2024, $6 billion (2023: $6 billion)) may be impacted under a 2°C or less external climate scenario.
For refineries in Chemicals and Products, depreciation of assets is on a straight-line basis over the life of the assets, starting at the date the asset becomes available for use, over a period of 20 years (see Note 2). Over the course of the energy transition, the current carrying value of refineries will be fully depreciated, offset by anticipated investments in assets that are expected to be resilient in the energy transition as described above. Based on current depreciation of the carrying value as at December 31, 2024, and assuming no further investment, all refineries would be fully depreciated between four and 11 years.
In addition to refineries, further assets of $32 billion include $24 billion of assets in relation to Chemicals. This includes $14 billion for the Pennsylvania chemical plant, which started operations in November 2022 and being a more efficient plant, it is expected to be more resilient in the energy transition. Chemical products are not produced with the aim to combust and consequently do not generate GHG emissions. Under the IEA NZE50 scenario chemical production volumes are not expected to decrease towards 2050, compared with current levels and hence chemical assets are expected to be resilient through the energy transition.
Other assets of $8 billion include $5 billion of assets mainly related to storage tanks, vessels, pipelines in trading and supply that are also expected to be resilient in the energy transition.
Price sensitivities
Where available Shell uses external climate scenarios for sensitivity testing. In relation to chemical and refining margin forecasts, no credible climate scenarios have been identified and consequently sensitivity testing is performed by providing sensitivity to changes in margins.
Chemical margins applied for impairment testing by reference to value in use are at an average of $197.5/tonne (20-year average). A change of -$30/tonne or +$30/tonne in long-term chemical margins over the entire cash flow projection period would ceteris paribus result in up to $0.5 billion (2023: up to $2 billion)impairment or no impairment reversal, respectively, in Chemicals and Products (see Note 13).
Refining margins applied for impairment testing by reference to value in use are at an average of $10/bbl (20-year). A change of -$1/bbl or +$1/bbl to the refining margin outlook over the entire cash flow projection period would ceteris paribus result in no impairment (2023: $1-2 billion) or up to $0.5 billion (2023: up to $1 billion) impairment reversal respectively in Chemicals and Products (see Note 13).
Sensitivities to carbon prices are described in the section above.
Financial Statements and Supplements | Notes to the Consolidated Financial Statements continued
4. Climate change and energy transition continued
Carrying value of Marketing assets
| | |
Carrying value of Marketing assets $ billion as at December 31 |
[A]Following resegmentation in 2024 (see Note 7), prior period comparatives have been revised to conform with current year presentation with an offsetting impact between Marketing and Chemicals & Products segments.
| | |
| Carrying amount of Marketing assets |
| | | | | | | | | | | | | | | | | | | | | | | | | | | | | |
| | | | | | | $ billion |
| | 2017 | 2018 | 2019 | 2020 | 2021 | 2022 | 2023 | 2024 |
| At December 31 | | 17 | 16 | 22 | 24 | 27 | 30 | 37 | 34 |
| | | | | | | | | |
| | | | | | | | | |
Portfolio composition and changes
Assets in the Marketing segment are expected to be resilient through the energy transition with a change in the product mix as the energy transition progresses. The demand for products sold — such as chemicals, lubricants, biofuels, bitumen, electric vehicle charging and convenience retail -- is not expected to decrease and is expected to increase for a variety of these products in many markets. Shell is expanding networks of refuelling stations offering low-carbon fuels, including biofuels and various gaseous fuels, such as LNG and bio-LNG. As a result, the carrying value of these assets is not expected to be impacted by the energy transition or lower commodity price scenarios.
Carrying value of Renewables and Energy Solutions assets
| | |
Carrying value of Renewables and Energy Solutions assets $ billion as at December 31 |
F | | |
| Carrying amount of Renewables and Energy Solutions assets |
| | | | | | | | | | | | | | | | | | | | | | | | | | | | | |
| | | | | | | $ billion |
| | 2017 | 2018 | 2019 | 2020 | 2021 | 2022 | 2023 | 2024 |
| At December 31 | | 1 | 1 | 3 | 3 | 5 | 9 | 10 | 9 |
| | | | | | | | | |
| | | | | | | | | |
Financial Statements and Supplements | Notes to the Consolidated Financial Statements continued
4. Climate change and energy transition continued
Portfolio composition and changes
In 2024 Shell refreshed its renewable generation, energy marketing, and gas and power trading strategy, shifting Shell's asset portfolio towards energy storage and flexible generation with an increased focus on power trading and minimising new investments in offshore wind projects. The aim is to maximise returns from onshore positions using capital-light business models, debt finance and partnerships. The carrying value of assets in the Renewables and Energy Solutions segment in the balance sheet at December 31, 2024, is expected to be resilient through the energy transition.
Other energy transition considerations
Discount rate sensitivity
The discount rate applied for value in use impairment testing is based on a nominal post-tax weighted average cost of capital (WACC) and is determined at 7.5% except for the power activities in the Renewables and Energy Solutions segment where 6% is applied. The discount rate includes generic systematic risk for energy transition risk. In addition, cash flow projections applied in individual assets include specific asset risks, including risk of transition. An increase in systematic energy transition risk could lead to a higher WACC and consequently to a higher discount rate to be applied in impairment testing. An increase of the discount rate applied for impairment testing of 1% under the assumption that all other factors (such as commodity prices, product margins and carbon prices) in the models used to calculate recoverability of carrying value remain unchanged would lead to a change in the carrying value of $1-3 billion (2023: $2-4 billion) in Integrated Gas and Upstream, and no significant impairment in other segments (2023: up to $1 billion in Chemicals and Products).
Global oil and gas demand considerations
A decrease in global demand and unchanged supply of oil and gas would probably lead to a decrease in price (see price sensitivity above). During 2024 Shell's production of oil and gas accounted for some 1.5% and 2% of total global production of oil and gas respectively. Changes in global oil and gas demand are therefore not expected to directly impact the ability to sell volumes of oil and gas produced by Shell at market prices.
Deferred tax assets
In general, it is expected that sufficient deferred tax liabilities and forecasted taxable profits within the planning period of 10 years are available for recovery of the deferred tax assets recognised at December 31, 2024. Integrated Gas and Upstream deferred tax assets recognised are expected to be recovered within the period of production of each asset. For deferred tax assets of $625 million as at December 31, 2024 (2023: $241 million) this period extends beyond 10 years. Deferred tax assets in Chemicals and Products and in Marketing expected to be recovered in more than 10 years (between 11 and 20 years) are $315 million as at December 31, 2024 (2023: $455 million) for which the forecasted taxable profits to determine recoverability have been risked. (See Note 23).
Decommissioning and other provisions
The energy transition may result in decommissioning and restoration occurring earlier than expected. The risk on the timing of decommissioning and restoration activities for Integrated Gas and Upstream fields is limited, supported by production plans in the foreseeable future (see "Estimated useful life" above). Acceleration of decommissioning and restoration activities has also been reflected in the assessment of the appropriate discount rate. On an undiscounted basis the provision for decommissioning and restoration as at December 31, 2024 was $32 billion (2023: $33 billion), recognised on a discounted basis in the Consolidated Balance Sheet as at December 31, 2024 at $18 billion (2023: $19 billion). Sensitivity to changes in the discount rate is provided in Note 25.
Historically, in Chemicals and Products, it was industry practice not to recognise decommissioning and restoration provisions associated with manufacturing facilities. This was on the basis that these assets were considered to have indefinite lives, so it was considered remote that an outflow of economic benefits would be required. In 2020, Shell considered the changed macroeconomic fundamentals, together with Shell's plans to rationalise the Group's manufacturing portfolio. Shell also reconsidered whether it remained appropriate not to recognise decommissioning and restoration provisions for manufacturing facilities. Since 2020, decommissioning and restoration provisions are recognised for certain shorter-lived manufacturing facilities (see Notes 25 and 32). The energy and chemicals parks are considered longer-lived facilities that are expected to be resilient in the energy transition, and decommissioning would generally be more than 50 years away.
Onerous contracts
Closure or early termination of activities may lead to supply contracts becoming onerous. Onerous contract provisions (see Note 25) have been recognised as at December 31, 2024, to reflect changes in expected future utilisation of certain assets. These include contracts in relation to unused terminals and refineries. The total carrying value of the provision for onerous contracts as at December 31, 2024 was $1.1 billion (2023: $1.1 billion) principally related to contracts in relation to unused terminals and refineries.
Dividend resilience
External stakeholders have requested disclosures on how climate change affects dividend-paying capacity. If a further impairment had been recognised in 2024 using any of the climate change scenarios described above, this would not have impacted the ability to pay dividends in this financial year because of strong cash flow generation and financial reserves. Had Shell applied the IEA NZE50 scenario (see above), and if this had led to a decrease in the recoverable amount of Integrated Gas and Upstream assets of $26-34 billion and recognition of an equivalent impairment, this would not have impacted the distributable reserves available to Shell from which to pay dividends in 2024. This is on the basis that such impairment would have resulted in part-realisation of the merger reserve recognised by the Company of $234 billion
as at December 31, 2024.
A forward-looking statement regarding future dividend-paying capacity cannot be provided because of unknown risks and uncertainties that could cause actual results, performance or events to differ materially from those expressed or implied in these statements.
Financial Statements and Supplements | Notes to the Consolidated Financial Statements continued
4. Climate change and energy transition continued
Physical risks
The potential impact of physical risks comes from both acute and chronic climate hazards. Acute hazards, such as flooding and droughts, wildfires and more severe tropical storms, and chronic hazards, such as rising temperatures and rising sea levels, could impact some of Shell's facilities, operations and supply chains. The frequency of these hazards and impacts is expected to increase in certain locations. Extreme weather events, whether or not related to climate change, could have a negative impact on Shell's earnings, cash flows and financial condition. Mitigation of physical risks, whether or not related to climate change, is considered and embedded in the design and construction of Shell's projects, and/or operation of its assets to minimise the risk of adverse incidents to Shell's employees and contractors, the communities where Shell operates, and Shell's equipment.
In 2023, Shell carried out a detailed review to assess the impact of a range of changing climatic conditions, including projected changes in temperature, precipitation, wind and sea levels, across segments and geographies for Shell's significant assets. Shell used IPCC climate modelling data covering three exploratory climate scenarios (RCP2.6, RCP4.5 and RCP8.5) across the time-horizons 2025, 2030 and 2050. These scenarios were selected to ensure a broad range of risks and uncertainties were assessed. There have been no changes to the climate modelling data that would require a full update of the 2023 assessment. Shell has confirmed there are no changes to the risk profile of Shell's significant assets and accounted for portfolio changes. In the short to medium term, the risks identified were found to be related to factors that Shell is already aware of (whether or not related to climate change) and that the assets are actively managing to mitigate, e.g. hurricane impacts in the US Gulf Coast, rising air temperatures in the Middle East and water scarcity in Europe and Asia. As an example, in recent years the Rhine river in Europe has seen historic lows during the summer months leading to challenges in the use of barges for transportation of Shell's products. Dredging of harbours and investment in shallower-draft barges have helped to mitigate the risk. In the long term, the results of the exercise indicated that while have evaluated against current climate modelling projections and Shell's current asset portfolio, by 2050 the frequency and severity of the climate hazards may differ from current projections. The level of predictability is such that the need for investment in climate adaptation measures at the assets is not immediate and the results mean Shell is in a position to monitor the assets and determine whether there is any need for adaptation action, e.g. the impact of potential water scarcity on various assets. Shell's testing to assess the potential impact of climate-related changes on its significant assets covers over 70% of the carrying value of Shell's physical assets as at December 31, 2023. Over 12% (based on the carrying value) of physical assets tested are considered to be exposed to climate-related physical risks in the short to medium term which the assets are already actively managing to mitigate. In addition, Shell reviewed significant acquisitions made in 2023 and 2024, none of which were found to have significant climate-related physical risks in the short to medium term. Shell's plan reflects the impact of mitigating actions in the short to medium term for the assets assessed. Shell will continue to monitor and assess the future exposure of Shell's assets in the longer term to changing climatic conditions to establish the need for any further adaptation actions and related metrics.
The impact of physical climate change on Shell's operations is unlikely to be limited to the boundaries of Shell's assets. For example, the downstream transportation and distribution of Shell's products from its own operations could potentially be exposed to climate-related hazards that ultimately impact Shell's operations. The overall impact, including how supply chains, resource availability and markets may be affected, also needs to be considered for a holistic assessment of this risk. Shell's assets manage this risk as part of broad risk and threat management processes as required by Shell's Environment and Asset Management (SEAM) standards, part of the wider Shell Performance Framework.
Financial Statements and Supplements | Notes to the Consolidated Financial Statements continued
5. Emission schemes and related environmental programmes
Emission trading and related schemes
In general, emission trading schemes (ETS) are mandated governmental schemes to control emission levels and enhance clean energy transition, allowing for the trading of emission certificates. In most ETS, governments set an emission cap for one or more sectors. Generally, entities in scope of the scheme are allowed to buy emission certificates to cover shortages or sell surplus emission certificates. In certain countries, emissions are priced through a carbon tax. For Shell, the most significant carbon pricing mechanisms are established in Europe, Canada and Singapore.
Biofuel programmes
Biofuel programmes are mandated governmental schemes that set binding national targets on the share of renewables in fuel consumption or measures on reducing GHG emissions by fuel suppliers. Biofuels are blended with existing fuels, such as gasoline and diesel, to reduce net emissions. The share of biofuels in the total sales mix of fuel is used to comply with regulatory requirements. This can be achieved by the blending of biofuels in refineries and/or distribution depots (self-blending), through import of biofuels (for jurisdictions that grant biofuels certificates at the point of import) or by the purchasing of certificates from third parties (for jurisdictions that have a tradable biofuel certificates mechanism). Biofuel programmes also include regulatory requirements to pay a levy for the combustion of fossil fuels, based on CO₂ emitted – mainly related to the German Fuel Emissions Trading Act (BEHG) which has applied since January 1, 2021.
Renewable power programmes
Renewable power programmes create a financial incentive to consume power that is sourced from renewable origins or require that a minimum percentage of power sold meets the green definition of the relevant standard. These regulations are typically accompanied by schemes supporting investments in the renewable technology. Renewable power programmes generally use certificates to monitor compliance, where renewable power certificates are granted for each MWh of energy generated that meets the predefined renewable criteria. Shell's compliance obligation under renewable power programmes comes primarily from energy supply and results from regulations applying in Europe, North America and Australia.
| | |
| Cost of emission schemes and related environmental programmes recognised in the Consolidated Statement of Income |
| | | | | | | | | | | |
| $ million |
| 2024 | 2023 | 2022 |
| ETS and related schemes | 381 | 493 | 493 |
| Biofuels [A] | 2,942 | 2,581 | 2,918 |
| Renewable power | 623 | 552 | 594 |
| Total | 3,946 | 3,626 | 4,005 |
[A]Represents the cost of biofuel certificates required for compliance purposes over and above those generated from self-blending activities.
| | |
Purchased environmental certificates (presented under Other intangible assets, see Note 11) [A] |
| | | | | | | | | | | | | | |
| $ million |
| ETS and related schemes | Biofuels | Renewable power | Total |
| At January 1, 2024 | 441 | 1,805 | 145 | 2,391 |
| Additions | 299 | 3,146 | 417 | 3,862 |
| Settlements | (392) | (2,804) | (411) | (3,607) |
| Other movements | (47) | (65) | (20) | (132) |
| At December 31, 2024 | 301 | 2,082 | 131 | 2,514 |
| At January 1, 2023 | 440 | 1,601 | 160 | 2,201 |
| Additions | 396 | 2,955 | 486 | 3,837 |
| Settlements | (413) | (2,783) | (451) | (3,647) |
| Other movements | 18 | 32 | (50) | — |
| At December 31, 2023 | 441 | 1,805 | 145 | 2,391 |
[A]Relates to environmental certificates held for compliance purposes.
Financial Statements and Supplements | Notes to the Consolidated Financial Statements continued
5. Emission schemes and related environmental programmes continued
| | |
Obligation (presented under Other payables, see Note 20) |
| | | | | | | | | | | | | | | | | |
| $ million |
| ETS and related schemes | | Biofuels | Renewable power | Total |
| At January 1, 2024 | | | | | |
| Current | (498) | | (3,012) | (343) | (3,853) |
| Non-current | — | | (105) | (88) | (193) |
| (498) | | (3,117) | (431) | (4,046) |
| Additions | (1,051) | | (2,981) | (612) | (4,644) |
| Additions covered by government grants | 675 | [A] | | | 675 |
| Settlements | 453 | | 3,011 | 467 | 3,931 |
| Other movements | 33 | | 85 | 31 | 149 |
| 110 | | 115 | (114) | 111 |
| | | | | |
| At December 31, 2024 | | | | | |
| Current | (388) | | (2,594) | (536) | (3,518) |
| Non-current | — | | (408) | (9) | (417) |
| (388) | | (3,002) | (545) | (3,935) |
| At January 1, 2023 | | | | | |
| Current | (458) | | (3,424) | (350) | (4,232) |
| Non-current | — | | (422) | (56) | (478) |
| (458) | | (3,846) | (406) | (4,710) |
| Additions | (1,244) | | (2,593) | (597) | (4,434) |
| Additions covered by government grants | 762 | [A] | | | 762 |
| Settlements | 479 | | 3,386 | 492 | 4,357 |
| Other movements | (37) | | (64) | 80 | (21) |
| (40) | | 729 | (25) | 664 |
| | | | | |
| At December 31, 2023 | | | | | |
| Current | (498) | | (3,012) | (343) | (3,853) |
| Non-current | — | | (105) | (88) | (193) |
| (498) | | (3,117) | (431) | (4,046) |
[A]Emission certificates that were allocated free of charge at an equivalent fair value at grant date.
Environmental certificates acquired that are held for compliance purposes are recognised at cost under other intangible assets (see Note 11). In addition, a portfolio of environmental certificates is held for trading purposes and classified under inventory (see Note 2 and Note 17). Environmental certificates held for trading purposes can be redesignated for compliance purposes and then used to settle compliance obligations.
Cost recognised in the Consolidated Statement of Income represents the compliance cost associated with emissions or with products sold during the year. The liability at year-end represents the compliance cost recognised over current and past compliance periods to the extent not settled to date. Liabilities are settled in line with compliance periods, which depend on the scheme and may not coincide with the calendar year.
The figures present compliance schemes only, excluding voluntary activities.
Financial Statements and Supplements | Notes to the Consolidated Financial Statements continued
6. Capital management
Shell manages its businesses to deliver strong cash flows to sustain its strategy and for profitable growth. Management's current priorities for applying Shell's cash are:
| | | | | | | | | | | |
| | Balanced capital allocation |
|
| |
| | | | | | | | | | | | | | |
| | | | |
| Total distributions [A] Enhanced shareholder distributions* 40%-50% of CFFO through the cycle
| | | Cash capital expenditure (cash capex) Disciplined investment $20-22 billion p.a. 2025-2028
|
| | | | |
| | | | | | | | | | | | | | | | | | | | |
| | |
Buybacks 13 consecutive quarters >$3 billion | | Dividend consistency +4% announced at Q4 2024 | | Integrated Gas and Upstream cash capex [B] ~$12-14 billion | | Downstream, Renewables and Energy Solutions cash capex [B] ~$8 billion |
| | |
| | | | | | | | | | | | | | | | | | | | |
Intrinsic value creation >10% p.a. normalised free cash flow growth per share*through to 2030 | | Progressive dividend 4% annual increase [C] | | Capital reallocation ≥10% ROACE* across all segments [D] |
| | | | | | | | |
| Balance sheet Maintain strong investment grade rating | |
[A]Total shareholder distributions (dividends + share buybacks) based on cash generation, macro-outlook and balance sheet trajectory.
[B]The Integrated Gas and Upstream cash capex includes expenditures related to the Integrated Gas and Upstream segments. The Downstream, Renewables and Energy Solutions cash capex includes expenditures for the Marketing, Chemicals and Products, and Renewables and Energy Solutions segments. (See Note 7)
[C]Subject to Board approval as well as shareholder approval at the 2025 Annual General Meeting.
[D]Price normalised ROACE on an Adjusted Earnings plus non-controlling interest basis.
* Non-GAAP measure (see page 337).
7. Segment information
General information
Shell is an international energy company engaged in the principal aspects of the energy and petrochemical industries and reports its business through segments: Integrated Gas, Upstream, Marketing, Chemicals and Products, Renewables and Energy Solutions, and Corporate.
With effect from January 1, 2024, Wholesale Commercial Fuels forms part of Mobility with inclusion in the Marketing segment (previously Chemicals and Products segment). The change in segmentation reflects the increasing alignment between the economic characteristics of wholesale commercial fuels and other Mobility businesses, and is consistent with changes in the information provided to the Chief Executive Officer, who serves as the Chief Operating Decision Maker. Prior period comparatives have been revised to conform with current year presentation with an offsetting impact between the Marketing and the Chemicals and Products segments. Also, from January 1, 2024, Shell's longer-term innovation portfolio is managed centrally and hence reported as part of the Corporate segment (previously all other segments). Prior period comparatives have been revised to conform with current year presentation with an offsetting impact on all the other segments.
The Integrated Gas segment includes liquefied natural gas (LNG), conversion of natural gas into gas-to-liquids (GTL) fuels and other products. It includes natural gas and liquids exploration and extraction, and the operation of the upstream and midstream infrastructure necessary to deliver these to market. The segment also includes the marketing, trading and optimisation of LNG.
The Upstream segment includes exploration and extraction of crude oil, natural gas and natural gas liquids. It also markets and transports oil and gas, and operates the infrastructure necessary to deliver them to the market.
The Marketing segment comprises the Mobility, Lubricants, and Sectors & Decarbonisation businesses. The Mobility business operates Shell's retail network, including electric vehicle charging services and the wholesale commercial fuels business which provides fuels for transport, industry and heating. The Lubricants business produces, markets and sells lubricants for road transport and machinery used in manufacturing, mining, power generation, agriculture and construction. The Sectors & Decarbonisation business sells fuels, speciality products and services, including
low-carbon energy solutions, to a broad range of commercial customers, including the aviation, marine and agricultural sectors.
The Chemicals and Products segment includes chemical manufacturing plants, with their own marketing network, and refineries, which turn crude oil and other feedstocks into a range of oil products which are moved and marketed around the world for domestic, industrial and transport use. The segment also includes the pipeline business, trading and optimisation of crude oil, oil products and petrochemicals, and oil sands activities (the extraction of bitumen from mined oil sands and its conversion into synthetic crude oil).
Financial Statements and Supplements | Notes to the Consolidated Financial Statements continued
7. Segment information continued
The Renewables and Energy Solutions segment includes activities such as renewable power generation, the marketing and trading and optimisation of power and pipeline gas, as well as carbon credits and digitally enabled customer solutions. The segment also includes production and marketing of hydrogen, development of commercial carbon capture and storage hubs, investment in nature-based projects that avoid or reduce carbon emissions, and Shell Ventures, which invests in companies that work to accelerate the energy and mobility transformation.
The Corporate segment covers the non-operating activities supporting Shell. The segment comprises Shell's holdings and treasury organisation, its self-insurance activities, headquarters and central functions, and centrally managed longer-term innovation portfolio. All finance expense and income and related taxes are included in Corporate segment earnings rather than in the earnings of business segments.
Basis of segmental reporting
Sales between segments are based on prices generally equivalent to commercially available prices. Third-party revenue and non-current assets information by geographical area are based on the country of operation of the Group subsidiaries that report this information. Separate disclosure is provided for the UK as this is the Company's country of domicile.
Segment earnings are presented on a current cost of supplies basis (CCS earnings), which was the earnings measure used by the Chief Executive Officer for the purposes of making decisions about allocating resources and assessing performance. On this basis, the purchase price of volumes sold during the period is based on the current cost of supplies during the same period after making allowance for the tax effect. CCS earnings therefore exclude the effect of changes in the oil price on inventory carrying amounts.
Finance expense and income related to core financing activities, as well as related taxes, are included in the Corporate segment earnings rather than in the earnings of the business segments.
Information by segment on a current cost of supplies basis is as follows:
| | | | | | | | | | | | | | | | | | | | | | | | | | |
| | | | | | | $ million |
| Integrated Gas | Upstream | Marketing | Chemicals and Products | Renewables and Energy Solutions | Corporate | Total | |
| Revenue: | | | | | | | | |
| Third-party | 37,290 | 6,606 | 120,089 | 90,918 | 29,366 | 43 | 284,312 |
|
| Inter-segment | 8,715 | 39,939 | 4,938 | 38,381 | 4,971 | — | 96,944 | |
| Share of profit/(loss) of joint ventures and associates (CCS basis) | 1,931 | 1,189 | 6 | 648 | (807) | — | 2,967 | |
| Interest and other income, of which: | 48 | 609 | (432) | 121 | 242 | 1,136 | 1,724 | |
| Interest income | 8 | 18 | 1 | 79 | 2 | 2,264 | 2,372 | |
Net (losses)/gains on sale and revaluation of non-current assets and businesses | (100) | 89 | (399) | 6 | 119 | (3) | (288) | |
| Other | 140 | 502 | (34) | 36 | 121 | (1,125) | (360) | |
| Third-party and inter-segment purchases (CCS basis) | 24,055 | 7,368 | 107,210 | 114,972 | 31,074 | (3) | 284,676 | |
Operating expenses, of which: | 4,442 | 9,790 | 10,681 | 8,392 | 2,915 | 697 | 36,917 | |
| Production and manufacturing expenses | 4,153 | 9,351 | 1,322 | 6,605 | 1,934 | 14 | 23,379 | |
| Selling, distribution and administrative expenses | 164 | 176 | 9,150 | 1,636 | 887 | 426 | 12,439 | |
| Research and development expenses | 125 | 263 | 209 | 151 | 94 | 257 | 1,099 | |
| Exploration expenses | 414 | 1,997 | — | — | — | — | 2,411 | |
Depreciation, depletion and amortisation charge, of which: | 6,150 | 11,223 | 3,866 | 4,700 | 907 | 26 | 26,872 | |
| Impairment losses | 564 | 327 | 1,633 | 1,319 | 658 | 1 | 4,502 | [A] |
| Impairment reversals | (9) | (75) | (1) | (114) | (134) | — | (333) | [B] |
| Interest expense | 189 | 806 | 56 | 70 | 6 | 3,660 | 4,787 | |
| Taxation charge/(credit) (CCS basis) | 3,144 | 9,387 | 894 | 177 | 99 | (209) | 13,492 | |
| CCS earnings | 9,590 | 7,772 | 1,894 | 1,757 | (1,229) | (2,992) | 16,792 | |
[A]Impairment losses comprise Property, plant and equipment ($3,673 million), Goodwill ($510 million) and Other intangible assets ($319 million). (See Note 13).
[B]Impairment reversals comprise Property, plant and equipment ($333 million). (See Note 13).
Financial Statements and Supplements | Notes to the Consolidated Financial Statements continued
7. Segment information continued
| | | | | | | | | | | | | | | | | | | | | | | | | | | | | |
| | | | | | | | | | $ million |
| Integrated Gas | | Upstream | Marketing [A] | | Chemicals and Products [A] | | Renewables and Energy Solutions | Corporate | Total | |
| Revenue: | | | | | | | | | | | |
| Third-party | 37,645 | | 6,475 | 130,559 | | 97,080 | | 44,819 | 42 | 316,620 |
|
| Inter-segment | 11,560 | | 41,230 | 5,299 | | 42,816 | | 4,707 | — | 105,612 | [A] |
Share of profit/(loss) of joint ventures and associates (CCS basis) | 1,951 | | 768 | 561 | | 577 | | (96) | (3) | 3,758 | |
| Interest and other income, of which: | 137 | | 671 | 73 | | 64 | | 75 | 1,818 | 2,838 | |
| Interest income | 6 | | 27 | 9 | | 57 | | 12 | 2,202 | 2,313 | |
Net gains/(losses) on sale and revaluation of non-current assets and businesses | (22) | | 209 | 1 | | (46) | | 110 | 5 | 257 | |
| Other | 153 | | 435 | 63 | | 53 | | (47) | (389) | 268 | |
| Third-party and inter-segment purchases (CCS basis) | 27,356 | | 7,890 | 118,912 | | 123,337 | | 40,170 | 15 | 317,680 | [A] |
Operating expenses, of which: [B] | 4,809 | | 9,830 | 11,142 | | 9,598 | | 3,763 | 818 | 39,960 | |
| Production and manufacturing expenses | 4,529 | | 9,186 | 1,463 | | 7,394 | | 2,610 | 58 | 25,240 | |
Selling, distribution and administrative expenses [B] | 154 | | 326 | 9,427 | | 2,022 | | 1,058 | 446 | 13,433 | |
Research and development expenses [B] | 126 | | 318 | 252 | | 182 | | 95 | 314 | 1,287 | |
| Exploration expenses | 216 | | 1,534 | — | | — | | — | — | 1,750 | |
| Depreciation, depletion and amortisation charge, of which: | 8,903 | | 12,463 | 2,477 | | 6,269 | | 1,159 | 19 | 31,290 | |
| Impairment losses | 3,472 | | 1,360 | 430 | | 2,777 | | 908 | — | 8,947 | [C] |
| Impairment reversals | (324) | | (206) | (1) | | (90) | | (141) | — | (762) | [D] |
| Interest expense | 146 | | 507 | 53 | | 61 | | 4 | 3,902 | 4,673 | |
Taxation charge/(credit) (CCS basis) [B] | 2,806 | | 8,380 | 851 | | (210) | | 1,320 | 47 | 13,194 | |
CCS earnings [B] | 7,057 | | 8,540 | 3,057 | | 1,482 | | 3,089 | (2,944) | 20,281 | |
[A]From January 1, 2024, Wholesale Commercial Fuels has been reallocated from the Chemicals and Products segment to the Marketing segment. Comparatives for the year 2023 have been reclassified accordingly for each of the above financial parameters to conform with current period presentation. The net impact on CCS earnings is $104 million.
[B]From January 1, 2024, costs for Shell's centrally managed longer-term innovation portfolio are reported as part of the Corporate segment. Comparatives for Corporate for the year 2023 have been reclassified accordingly to conform with current period presentation. The net impact on CCS earnings is $133 million with offsetting impact in all other segments.
[C]Impairment losses comprise Property, plant and equipment ($8,182 million), Goodwill ($635 million) and Other intangible assets ($130 million). (See Note 13).
[D]Impairment reversals comprise Property, plant and equipment ($627 million) and Other intangible assets ($135 million). (See Note 13).
Financial Statements and Supplements | Notes to the Consolidated Financial Statements continued
7. Segment information continued
| | | | | | | | | | | | | | | | | | | | | | | | | | | | | | | |
| | | | | | | | | | $ million |
| Integrated Gas | | Upstream | Marketing [A] | | Chemicals and Products [A] | | Renewables and Energy Solutions | Corporate | Total | |
| Revenue: | | | | | | | | | | | |
| Third-party | 54,751 | | 8,352 | 149,439 | | 115,541 | | 53,190 | 41 | 381,314 |
|
| Inter-segment | 18,412 | | 52,285 | 6,195 | | 48,999 | | 6,791 | — | 132,682 | [A] |
Share of profit/(loss) of joint ventures and associates (CCS basis) | 1,219 | | 2,111 | 249 | | 362 | | (7) | (4) | 3,930 | |
| Interest and other income, of which: | (714) | | 726 | (82) | | 222 | | 57 | 706 | 915 | |
| Interest income | 43 | | 22 | — | | 24 | | (2) | 959 | 1,046 | |
Net gains/(losses) on sale and revaluation of non-current assets and businesses | 101 | | 437 | (169) | | 265 | | 8 | — | 642 | |
| Other | (858) | [C] | 267 | 87 | | (67) | | 51 | (253) | (773) | |
| Third-party and inter-segment purchases (CCS basis) | 37,785 | | 10,666 | 140,368 | | 147,069 | | 57,024 | (28) | 392,884 | [A] |
Operating expenses, of which: [B] | 5,226 | | 10,321 | 10,149 | | 9,564 | | 3,547 | 669 | 39,476 | |
| Production and manufacturing expenses | 4,907 | | 9,676 | 1,293 | | 7,100 | | 2,520 | 22 | 25,518 | |
Selling, distribution and administrative expenses [B] | 207 | | 327 | 8,631 | | 2,303 | | 972 | 443 | 12,883 | |
Research and development expenses [B] | 112 | | 318 | 225 | | 161 | | 55 | 204 | 1,075 | |
| Exploration expenses | 240 | | 1,472 | — | | — | | — | — | 1,712 | |
| Depreciation, depletion and amortisation charge, of which: | 2,211 | | 10,334 | 2,027 | | 3,162 | | 777 | 18 | 18,529 | |
| Impairment losses | 115 | | 950 | 479 | | 357 | | 412 | — | 2,313 | [D] |
| Impairment reversals | (3,449) | | (2,504) | (151) | | (73) | | — | — | (6,177) | [E] |
| Interest expense | 84 | | 345 | 47 | | 21 | | 2 | 2,682 | 3,181 | |
Taxation charge/(credit) (CCS basis) [B] | 5,901 | | 14,078 | 918 | | 928 | | (292) | (36) | 21,497 | |
CCS earnings [B] | 22,221 | | 16,258 | 2,292 | | 4,380 | | (1,027) | (2,562) | 41,562 | |
[A]From January 1, 2024, Wholesale Commercial Fuels has been reallocated from the Chemicals and Products segment to the Marketing segment. Comparatives for the year 2023 have been reclassified accordingly for each of the above financial parameters to conform with current period presentation. The net impact on CCS earnings is $158 million.
[B]From January 1, 2024, costs for Shell's centrally managed longer-term innovation portfolio are reported as part of the Corporate segment. Comparatives for Corporate for the year 2023 have been reclassified accordingly to conform with current period presentation. The net impact on CCS earnings is $101 million with offsetting impact in all other segments.
[C]Includes the full write-down of the Nord Stream 2 loan amounting to $1,126 million as a result of the withdrawal from Russian oil and gas activities.
[D]Impairment losses comprise Property, plant and equipment ($1,799 million), Goodwill ($361 million) and Other intangible assets ($153 million). (See Note 13).
[E]Impairment reversals fully comprise Property, plant and equipment. (See Note 13).
| | |
| Reconciliation of CCS earnings to income for the period |
| | | | | | | | | | | |
| $ million |
| | 2024 | 2023 | 2022 |
| Income attributable to Shell plc shareholders | 16,094 | 19,359 | 42,309 |
| Income attributable to non-controlling interest | 427 | 277 | 565 |
Income for the period | 16,521 | 19,636 | 42,874 |
| Current cost of supplies adjustment: | | | |
| Purchases | 388 | 815 | (1,714) |
| Taxation | (91) | (203) | 444 |
| Share of profit of joint ventures and associates | (26) | 33 | (42) |
| Current cost of supplies adjustment | 271 | 645 | (1,312) |
| Of which: | | | |
| Attributable to Shell plc shareholders | 257 | 650 | (1,196) |
| Attributable to non-controlling interest | 14 | (5) | (116) |
| CCS earnings | 16,792 | 20,281 | 41,562 |
| Of which: | | | |
| CCS earnings attributable to Shell plc shareholders | 16,351 | 20,008 | 41,113 |
| CCS earnings attributable to non-controlling interest | 441 | 273 | 449 |
Financial Statements and Supplements | Notes to the Consolidated Financial Statements continued
7. Segment information continued
Information by geographic area is as follows:
| | | | | | | | | | | | | | | | | | | | |
| | | | | | $ million |
| Europe | | Asia,
Oceania,
Africa | USA | Other
Americas | Total |
| Third-party revenue, by origin | 92,480 | [A] | 98,343 | 65,089 | 28,400 | 284,312 |
| Goodwill, other intangible assets, property, plant and equipment, joint ventures and associates at December 31 | 40,971 | [B] | 88,588 | 55,245 | 49,372 | 234,176 |
[A]Includes $28,011 million that originated from the UK.
[B]Includes $15,822 million located in the UK (excluding assets reclassified as held for sale). (See Note 19).
| | | | | | | | | | | | | | | | | | | | |
| | $ million |
| Europe | | Asia,
Oceania,
Africa | USA | Other
Americas | Total |
| Third-party revenue, by origin | 118,135 | [A] | 99,967 | 70,291 | 28,227 | 316,620 |
| Goodwill, other intangible assets, property, plant and equipment, joint ventures and associates at December 31 | 48,008 | [B] | 91,374 | 57,261 | 49,562 | 246,205 |
[A]Includes $44,815 million that originated from the UK.
[B]Includes $21,478 million located in the UK.
| | | | | | | | | | | | | | | | | | | | |
| | | | | | $ million |
| Europe | | Asia,
Oceania,
Africa | USA | Other
Americas | Total |
| Third-party revenue, by origin | 135,975 | [A] | 126,643 | 87,085 | 31,611 | 381,314 |
| Goodwill, other intangible assets, property, plant and equipment, joint ventures and associates at December 31 | 40,161 | [B] | 97,019 | 59,233 | 51,794 | 248,207 |
[A]Includes $50,236 million that originated from the UK.
[B]Includes $20,772 million located in the UK.
Cash capital expenditure
Cash capital expenditure is a measure used by the Chief Executive Officer for the purposes of making decisions about allocating resources and assessing performance.
| | | | | | | | | | | | | | | | | | | | | | | | |
| | | | | | | $ million |
| Integrated Gas | Upstream | Marketing | Chemicals and Products | Renewables and Energy Solutions | Corporate | Total [A] | |
Capital expenditure | 4,095 | 7,739 | 2,357 | 2,943 | 2,338 | 129 | 19,601 | |
Investments in joint ventures and associates | 672 | 150 | 88 | 347 | 138 | 9 | 1,404 | |
Investments in equity securities | — | 1 | — | — | 73 | 6 | 80 | |
Cash capital expenditure | 4,767 | 7,890 | 2,445 | 3,290 | 2,549 | 144 | 21,085 | |
[A]See Consolidated Statement of Cash Flows.
Financial Statements and Supplements | Notes to the Consolidated Financial Statements continued
7. Segment information continued
| | | | | | | | | | | | | | | | | | | | | | | |
| | | | | | | $ million |
| Integrated Gas | Upstream | Marketing [A] | Chemicals and Products [A] | Renewables and Energy Solutions | Corporate | Total [B] |
Capital expenditure | 3,491 | 8,249 | 5,741 | 2,928 | 2,314 | 270 | 22,993 |
Investments in joint ventures and associates | 705 | 94 | 49 | 84 | 261 | 9 | 1,202 |
Investments in equity securities | — | — | — | 2 | 106 | 89 | 197 |
Cash capital expenditure | 4,196 | 8,343 | 5,790 | 3,014 | 2,681 | 368 | 24,392 |
[A]Revised to conform with reporting segment changes applicable from 2024.
[B]See Consolidated Statement of Cash Flows.
| | | | | | | | | | | | | | | | | | | | | | | |
| | | | | | | $ million |
| Integrated Gas | Upstream | Marketing [A] | Chemicals and Products [A] | Renewables and Energy Solutions | Corporate | Total [B] |
Capital expenditure | 3,433 | 8,020 | 4,674 | 3,688 | 2,610 | 175 | 22,600 |
Investments in joint ventures and associates | 832 | 123 | 304 | 2 | 703 | 9 | 1,973 |
Investments in equity securities | — | — | — | 1 | 156 | 103 | 260 |
Cash capital expenditure | 4,265 | 8,143 | 4,978 | 3,691 | 3,469 | 287 | 24,833 |
[A]Revised to conform with reporting segment changes applicable from 2024.
[B]See Consolidated Statement of Cash Flows.
8. Revenue [A]
| | | | | | | | | | | |
| | | $ million |
| 2024 | 2023 | 2022 |
| Crude oil | 40,625 | 39,609 | 46,523 |
| Oil products | 129,554 | 144,985 | 173,840 |
| Natural gas and NGL | 19,309 | 28,010 | 42,598 |
| LNG | 30,923 | 32,976 | 44,967 |
| Power | 11,566 | 11,822 | 5,801 |
| Lubricants | 11,511 | 11,548 | 11,195 |
| Chemicals products | 8,529 | 8,360 | 11,524 |
| Other [B] | 22,330 | 23,703 | 33,158 |
| Revenue from contracts with customers | 274,347 | 301,013 | 369,606 |
| Revenue from other sources | 9,965 | 15,607 | 11,708 |
| Total revenue | 284,312 | 316,620 | 381,314 |
[A]Note 7 contains a detailed analysis of the total revenue from customer contracts and other sources, broken down by segment and geographic area.
[B]Other primarily includes sales of Naphtha, LPG, Condensate, (refined) Bitumen, and revenue from smaller sales of various other products.
Revenue from other sources related to fair value accounting of commodity derivatives
Financial Statements and Supplements | Notes to the Consolidated Financial Statements continued
9. Interest and other income
| | | | | | | | | | | | | | |
| $ million |
| 2024 | | 2023 | 2022 |
| Interest income | 2,372 | | 2,313 | 1,046 |
| Dividend income (from investments in equity securities) | 83 | | 49 | 216 |
Net (losses)/gains on sale and revaluation of non-current assets and businesses | (288) | | 257 | 642 |
Net foreign exchange losses on financing activities | (1,025) | [A] | (458) | (340) |
| Other | 582 | | 677 | (649) |
| Total | 1,724 | | 2,838 | 915 |
[A]Net foreign exchange losses on financing activities include a $1,124 million loss from cumulative currency translation differences reclassified to profit and loss. This reclassification was mainly due to changes in the funding structure of Shell's UK businesses. These differences were previously recognised in equity as part of accumulated other comprehensive income.
Other includes amounts recognised in respect of sublease income from partners in joint operations (2024: $493 million, 2023: $418 million, 2022: $319 million).
In 2022, Other included the full write-down of the Nord Stream 2 loan amounting to $1,126 million as a result of Shell's withdrawal from Russian oil and gas activities.
10. Interest expense
| | | | | | | | | | | |
| $ million |
| 2024 | 2023 | 2022 |
| Interest incurred and similar charges | 2,800 | 2,669 | 1,971 |
| Interest expense related to leases | 1,722 | 1,772 | 1,724 |
| Less: interest capitalised | (638) | (532) | (950) |
Other net (gains)/losses on fair value and cash flow hedges of debt | (71) | 45 | (71) |
| Accretion expense | 974 | 719 | 507 |
| Total | 4,787 | 4,673 | 3,181 |
The rate applied in determining the amount of interest capitalised in 2024 was 4.0% (2023: 4.0%; 2022: 4.0%).
11. Goodwill and other intangible assets
| | | | | | | | | | | | | | | | | | | | | | |
| $ million |
| | | Other intangible assets |
| Goodwill | | LNG off-take
and sales contracts | | Environmental certificates | Other | | Total |
| Cost | | | | | | | | |
| At January 1 | 18,542 | | 9,734 | | 2,391 | 9,642 | | 21,767 |
| Additions | 155 | | — | | 3,862 | 594 | | 4,456 |
Sales, retirements and other movements [A] | (195) | | (3,147) | | (3,668) | (180) |
| (6,995) |
| Currency translation differences | (220) | | — | | (71) | (258) | | (329) |
| At December 31 | 18,282 | | 6,587 | | 2,514 | 9,798 | | 18,899 |
| Depreciation, depletion and amortisation, including impairments | | | | | | | | |
| At January 1 | 1,882 | | 6,751 | | | 4,763 | | 11,514 |
Charge for the year [B] | 510 | | 590 | | | 744 | | 1,334 |
Sales, retirements and other movements [A] | (101) | | (3,147) | | | (169) | | (3,316) |
| Currency translation differences | (41) | | — | | | (113) | | (113) |
| At December 31 | 2,250 | | 4,194 | | | 5,225 | | 9,419 |
| Carrying amount at December 31 | 16,032 | | 2,393 | | 2,514 | 4,573 | [C] | 9,480 |
[A]Includes the reclassification of assets classified as held for sale. (See Note 19).
[B]Includes impairment losses and reversals (except for Goodwill). (See Note 13).
[C]Includes software ($1,013 million), power purchase agreements, retail customer relationships and trademarks.
Financial Statements and Supplements | Notes to the Consolidated Financial Statements continued
11. Goodwill and other intangible assets continued
| | | | | | | | | | | | | | | | | | | | | | | | |
| $ million |
| | | Other intangible assets |
| Goodwill | | LNG off-take
and sales contracts | Environmental certificates | | Other | | Total |
| Cost | | | | | | | | |
| At January 1 | 17,557 | | 9,833 | 2,201 | | 8,158 | | 20,192 |
| Additions | 1,436 | | — | 3,837 | | 1,721 | [C] | 5,558 |
Sales, retirements and other movements [A] | (506) | | (99) | (3,714) | | (376) |
| (4,189) |
| Currency translation differences | 55 | | — | 67 | | 139 | | 206 |
| At December 31 | 18,542 | | 9,734 | 2,391 | | 9,642 | | 21,767 |
| Depreciation, depletion and amortisation, including impairments | | | | | | | | |
| At January 1 | 1,518 | | 6,060 | | | 4,470 | | 10,530 |
Charge for the year [B] | 635 | | 790 | | | 442 | | 1,232 |
Sales, retirements and other movements [A] | (296) | | (99) | | | (222) | | (321) |
| Currency translation differences | 25 | | — | | | 73 | | 73 |
| At December 31 | 1,882 | | 6,751 | | | 4,763 | | 11,514 |
| Carrying amount at December 31 | 16,660 | | 2,983 | 2,391 | | 4,879 | [D] | 10,253 |
[A]Includes the reclassification of assets classified as held for sale. (See Note 19).
[B]Includes impairment losses and reversals. (See Note 13).
[C]Includes feedstock supply contracts and intellectual property rights ($948 million) from an acquisition in Marketing and software ($357 million) primarily in Integrated Gas and Marketing.
[D]Includes software ($829 million), power purchase agreements, retail customer relationships and trademarks.
Goodwill at December 31, 2024, related principally to the acquisition of BG Group plc in 2016, allocated to Integrated Gas ($4,945 million) and Upstream ($5,294 million) at the operating segment level, and to Pennzoil-Quaker State Company ($1,605 million), a lubricants business in the Marketing segment based largely in North America.
12. Property, plant and equipment
| | | | | | | | | | | | | | | | | |
| $ million |
| Exploration and production | Manufacturing,
supply and
distribution | | |
| Exploration
and evaluation | Production | Other | Total |
| Cost | | | | | |
| At January 1 | 8,635 | 285,670 | 113,069 | 47,696 | 455,070 |
| Additions | 1,174 | 12,835 | 8,256 | 4,181 | 26,446 |
| Sales, retirements and other movements [B] | (2,390) | (22,324) | (15,636) | (3,430) | (43,780) |
| | | | | |
| Currency translation differences | (205) | (3,156) | (1,782) | (1,847) | (6,990) |
| At December 31 | 7,214 | 273,025 | 103,907 | 46,600 | 430,746 |
| Depreciation, depletion and amortisation, including impairments | | | | | |
| At January 1 | 3,323 | 174,973 | 63,826 | 18,113 | 260,235 |
Charge for the year [C] | 159 | 15,004 | 6,652 | 3,739 | 25,554 |
| Sales, retirements and other movements [B] | (243) | (17,540) | (16,096) | (2,618) | (36,497) |
| | | | | |
| Currency translation differences | (133) | (1,591) | (1,281) | (760) | (3,765) |
| At December 31 | 3,106 | 170,846 | 53,101 | 18,474 | 245,527 |
| Carrying amount at December 31 | 4,108 | 102,179 | 50,806 | 28,126 | 185,219 |
[A]Includes right-of-use assets under leases. (See Note 22).
[B]Includes the reclassification of assets classified as held for sale. (See Note 19).
[C]Includes impairment losses and reversals. (See Note 13).
Financial Statements and Supplements | Notes to the Consolidated Financial Statements continued
12. Property, plant and equipment continued
| | | | | | | | | | | | | | | | | |
| $ million |
| Exploration and production | Manufacturing, supply and distribution | | |
| Exploration
and evaluation | Production | Other | Total |
| Cost | | | | | |
| At January 1 | 11,565 | 277,016 | 106,785 | 39,595 | 434,961 |
| Additions | 2,161 | 10,731 | 5,910 | 7,029 | 25,831 |
| Sales, retirements and other movements [B] | (5,164) | (1,153) | (1,016) | (1,387) | (8,720) |
Reclassifications [C] | — | (2,779) | 527 | 2,252 | — |
| Currency translation differences | 73 | 1,855 | 863 | 207 | 2,998 |
| At December 31 | 8,635 | 285,670 | 113,069 | 47,696 | 455,070 |
| Depreciation, depletion and amortisation, including impairments | | | | | |
| At January 1 | 5,162 | 159,662 | 56,901 | 14,594 | 236,319 |
Charge for the year [D] | 731 | 18,202 | 8,295 | 2,687 | 29,915 |
| Sales, retirements and other movements [B] | (2,609) | (2,000) | (2,083) | (1,394) | (8,086) |
Reclassifications [C] | — | (2,217) | 63 | 2,154 | — |
| Currency translation differences | 39 | 1,326 | 650 | 72 | 2,087 |
| At December 31 | 3,323 | 174,973 | 63,826 | 18,113 | 260,235 |
| Carrying amount at December 31 | 5,312 | 110,697 | 49,243 | 29,583 | 194,835 |
[A]Includes right-of-use assets under leases. (See Note 22).
[B]Includes the reclassification of assets classified as held for sale. (See Note 19).
[C]Reclassifications of right-of-use assets. (See Note 22).
[D]Includes impairment losses and reversals. (See Note 13).
The carrying amount of property, plant and equipment at December 31, 2024, included $27,852 million (2023: $28,135 million) of assets under construction. This amount excludes exploration and evaluation assets. Assets under construction mainly include projects in Integrated Gas in Canada and Australia and projects in Upstream in the USA and Malaysia.
The carrying amount of exploration and production assets at December 31, 2024, included rights and concessions in respect of proved and unproved properties of $5,411 million (2023: $6,097 million). Exploration and evaluation assets principally comprise rights and concessions in respect of unproved properties and capitalised exploration drilling costs.
The total contractual commitments for the purchase and lease of property, plant and equipment at December 31, 2024, amounted to $7,815 million of which $2,914 million related to lease commitments.
| | |
| Capitalised exploration drilling costs |
| | | | | | | | | | | |
| $ million |
| 2024 | 2023 | 2022 |
| At January 1 | 3,136 | 2,911 | 3,015 |
| Additions pending determination of proved reserves | 1,104 | 1,967 | 1,298 |
| Amounts charged to expense | (1,622) | (868) | (881) |
| Reclassifications to productive wells on determination of proved reserves | (333) | (874) | (531) |
Other movements [A] | (231) | — | 10 |
| At December 31 | 2,054 | 3,136 | 2,911 |
[A] Includes the reclassification of assets classified as held for sale. (See Note 19).
| | | | | | | | | | | | | | | | | |
| Projects | | Wells |
| Number | $ million | | Number | $ million |
| Between 1 and 5 years | 15 | 388 | | 28 | 388 |
| Between 6 and 10 years | 14 | 778 | | 22 | 720 |
| Between 11 and 15 years | 10 | 214 | | 17 | 260 |
| Between 16 and 20 years | 3 | 34 | | 4 | 46 |
Total [A] | 42 | 1,414 | | 71 | 1,414 |
[A] Number of projects increased by 13 as some of the individual wells moved to stand-alone projects.
Exploration drilling costs capitalised for periods greater than one year at December 31, 2024, analysed according to the most recent year of activity, are presented in the table above. These comprise $116 million relating to four projects where drilling activities were under way or firmly planned for the future, and $1,298 million relating to 38 projects awaiting development concepts.
Financial Statements and Supplements | Notes to the Consolidated Financial Statements continued
13. Impairment of property, plant and equipment, goodwill and other intangible assets
| | | | | | | | | | | |
| $ million |
| 2024 | 2023 | 2022 |
| Impairment losses | | | |
Goodwill | 510 | 635 | 361 |
Intangible assets other than goodwill | 319 | 130 | 153 |
Property, plant and equipment, of which [A] | 3,673 | 8,182 | 1,799 |
| Exploration and production | 783 | 4,820 | 868 |
| Manufacturing, supply and distribution | 1,278 | 2,785 | 474 |
| Other | 1,612 | 577 | 457 |
| Total [B] | 4,502 | 8,947 | 2,313 |
| Impairment reversals | | | |
Intangible assets other than goodwill | — | 135 | — |
Property, plant and equipment, of which [A] | 333 | 627 | 6,177 |
| Exploration and production | 74 | 528 | 5,954 |
| Manufacturing, supply and distribution | 114 | 91 | 72 |
| Other | 145 | 8 | 151 |
Total [B] | 333 | 762 | 6,177 |
[A]Includes right-of-use assets under leases. (See Note 22).
[B]See Note 7.
Discount rate and other assumptions
The discount rates applied in determining value in use reflect a current market assessment of the time value of money, adjusted for risks not included in forecast cash flows. The discount rate applied is based on a nominal post-tax weighted average cost of capital (WACC), derived from the following key assumptions:
| | | | | | | | | | | | | | | | | | | | | | | | | | | | | | | | | | | | | | |
| | | | | | | | | | | | |
| WACC assumptions | | | | | | | | | | |
| | | | | | | | | | | | |
| | | | | | | | | | | | |
| | Risk-free rate Derived from a range of benchmark US Treasury yields of varying maturities, to reflect the range of useful economic lives of Shell's assets and to appropriately adjust, where relevant, for pricing anomalies and short-term volatility of specific tenors. | | | | Cost of debt [A] Derived from observable risk premiums on corporate debt issued by a group of comparable energy companies, adjusted for a blended statutory tax rate. | | | | Cost of equity [A] Calculated per the capital asset pricing model. Equity risk premiums are derived from a range of published sources, adjusted to reflect a beta derived from a peer group of comparable energy companies, and subsequently calibrated to ensure that total cost of equity is consistent with market practice. | | |
| | | | | | | | | | | | |
| | | | | | | | | | | | |
[A]The peer group of comparable energy companies is tailored to reflect relevant integrated power companies (for power activities in the Renewables and Energy Solutions segment) and integrated oil and gas companies (for the rate applied to all other assets). The proportion of debt and equity in the WACC calculation reflects a target gearing ratio, tailored for power activities and oil and gas activities as appropriate.
This rate is reassessed throughout the reporting period, with adjustments made when changes in assumptions applied would lead to a change in an investor's expected rate of return on a portfolio of similar assets. This assessment considers a range of factors, including macroeconomic forecasts, the historical volatility of key assumptions and the level of risking reflected in cash flow forecasts, including the extent to which systemic risks have been reflected in Shell's Operating Plan, which forms the basis of forecast cash flows in determining value in use.
Cash flow projections used in the determination of value in use were made using management's forecasts of commodity prices, market supply and demand, forecast expenditures, potential costs associated with operational GHG emissions, product margins including forecast refining margins, chemical margins and expected production volumes (see Note 2). The level of risking reflected in these assumptions is a consideration in management's assessment of the discount rate to be applied in order to avoid duplication of systemic and asset-specific risking in calculating value in use, and to ensure the discount rate applied is commensurate with risks included in forecast cash flows.
The discount rate applied was a nominal post-tax WACC of 6% (2023: 6%) for the power activities in the Renewables and Energy Solutions segment and a nominal post-tax WACC of 7.5% (2023: 7.5%) for all other businesses. Management assessed the appropriateness of these discount rates as a result of rising bond yields towards the end of 2024. Management concluded that the discount rates remain appropriate and materially commensurate with other significant cash flow assumptions.
Financial Statements and Supplements | Notes to the Consolidated Financial Statements continued
13. Impairment of property, plant and equipment, goodwill and other intangible assets continued
Recoverable value was predominantly assessed by reference to value in use in segments other than the Renewables and Energy Solutions segment. The pre-tax discount rates applied for value in use impairment testing vary according to the characteristics of the asset, including its useful life and cash flow profiles. The weighted average pre-tax discount rate applied in the recognition of impairment charges during the year was 9.0% for segments other than the Renewables and Energy Solutions segment.
The near-term commodity price assumptions applied in impairment testing were as follows:
| | |
| Commodity price assumptions [A] |
| | | | | | | | | | | | | | |
| 2024 | 2025 | 2026 | 2027 | 2028 |
| Brent crude oil ($/b) | 70 | 70 | 70 | 74 |
| Henry Hub natural gas ($/MMBtu) | 3.30 | 4.00 | 4.00 | 4.24 |
| | | | | | | | | | | | | | |
| 2023 | 2024 | 2025 | 2026 | 2027 |
| Brent crude oil ($/b) | 70 | 70 | 70 | 74 |
| Henry Hub natural gas ($/MMBtu) | 4.00 | 4.00 | 4.00 | 4.00 |
[A]Money of the day.
For periods after 2028, the real-term price assumptions applied were: $70 per barrel (/b) (2023: $70/b) for Brent crude oil, and a linear increase from $4.05 per million British thermal units (/MMBtu) to $5.00/MMBtu in 2048 (2023: $4.00/MMBtu) for Henry Hub natural gas.
Oil and gas price assumptions applied for impairment testing are reviewed and, where necessary, adjusted on a periodic basis. Reviews include comparison with available market data and forecasts that reflect developments in demand such as global economic growth, technology efficiency, policy measures and, in supply, consideration of investment and resource potential, cost of development of new supply, and behaviour of major resource holders.
For certain assets in the Chemicals and Products and Renewables and Energy Solutions segments, the recoverable value was determined by reference to fair value less costs of disposal. In determining fair value, adjustments are made to forecast cash flows to reflect assumptions used by market participants. These adjustments predominantly relate to the discount rate applied and commodity price assumptions. For certain assets in the Renewables and Energy Solutions segment, the valuation methodology incorporates other adjustments to reflect comparable transactions.
The total carrying value of property, plant and equipment, goodwill and other intangible assets at December 31, 2024, for which recoverable value was tested in 2024 by reference to fair value less costs of disposal was $0.9 billion related to assets in Renewables and Energy Solutions and $1 billion in Marketing. The majority of the assets for which the recoverable value was determined by reference to fair value less costs of disposal are related to assets classified as held for sale (see Note 19).
The total carrying value of property, plant and equipment, goodwill and other intangible assets at December 31, 2023, for which recoverable value was tested in 2023 by reference to fair value less costs of disposal was $2.6 billion related to assets in Renewables and Energy Solutions and $2.5 billion in Chemicals and Products. The weighted average post-tax discount rate applied to impairments recognised during 2023 is 12% for Renewables and Energy Solutions and 10% for Chemicals and Products.
Goodwill
Goodwill impairments of $510 million in 2024 are mainly recognised in Renewables and Energy Solutions, triggered by a portfolio choice regarding renewable generation assets in North America.
Goodwill impairments of $635 million in 2023 were mainly recognised in Renewables and Energy Solutions primarily related to an asset in North America, triggered by annual goodwill impairment testing reflecting factors including the impact of the deteriorated macro environment.
Property, plant and equipment
Exploration and production
Impairment losses recognised in Exploration and production in 2024 of $783 million related to various assets in Integrated Gas ($543 million) and Upstream ($240 million). Impairments recognised in Integrated Gas mainly related to an asset located in Australia, triggered by factors including revised price, production and cost estimates. Impairment losses recognised in Upstream principally relate to projects in North America and Europe, triggered by portfolio choices.
Impairment losses recognised in Exploration and production in 2023 of $4,820 million related to various assets in Integrated Gas ($3,472 million) and Upstream ($1,348 million). Impairments recognised in Integrated Gas mainly related to an asset located in North America, triggered by a change in the discount rate applied, and a project in Australia, triggered by factors including revised production estimates and regulatory changes. Impairment losses recognised in Upstream principally relate to projects in North America, Nigeria and the UK triggered by factors including revised reserves estimates and portfolio choices.
Manufacturing, supply and distribution
Impairment losses recognised in Manufacturing, supply and distribution in 2024 of $1,278 million mainly related to an energy and chemicals park located in Singapore, due to remeasurement of the fair value less costs of disposal triggered by a sales agreement reached, and to various smaller assets in Chemicals and Products.
Financial Statements and Supplements | Notes to the Consolidated Financial Statements continued
13. Impairment of property, plant and equipment, goodwill and other intangible assets continued
Impairment losses recognised in Manufacturing, supply and distribution in 2023 of $2,785 million mainly related to chemical assets in Singapore in Chemicals and Products, triggered by lower expected chemical margins and associated with portfolio choices.
Other
Other impairment losses in 2024 of $1,612 million mainly related to the impairments in Marketing ($1,518 million), assets in Renewables and Energy Solutions ($52 million) and various smaller assets in Integrated Gas, Upstream and Chemicals and Products. The impairment in Marketing principally relates to a biofuels facility located in the Netherlands, triggered by a temporary pause of on-site construction work.
Other impairment losses in 2023 of $577 million related to various assets in Marketing ($292 million) and assets in Renewables and Energy Solutions mainly in Europe ($273 million).
Impairment reversals in 2024 of $333 million are mainly triggered by the reassessment of value in use in Renewables and Energy Solutions ($134 million) and divestments in Chemicals and Products ($114 million).
Impairment reversals in 2023 of $627 million were mainly triggered by the reassessment of fair value less costs of disposal in Integrated Gas
($325 million) and revised reserves estimates in Upstream ($203 million).
Impairment losses in 2022 mainly related to the withdrawal from Russia ($854 million), the classification of an Upstream asset as held for sale ($320 million) and an impairment of capital expenditure additions in fully impaired sites in Chemicals and Products ($257 million).
The recognition of impairment reversals in 2022 was mainly triggered by the revision of Shell's mid- and long-term commodity price assumptions reflecting the energy market demand and supply fundamentals. They are related to: i) Integrated Gas for $3,449 million, mainly relating to the Queensland Curtis LNG asset; and ii) Upstream for $2,504 million, mainly related to two offshore projects in Brazil and an asset in the Gulf of America.
Sensitivities
The main sensitivities in relation to value in use impairment assessment are the commodity price assumptions in Integrated Gas and Upstream, refining and chemical margins in Chemicals and Products, and discount rates in all segments.
Commodity price assumptions
A change of -10% or +10% in the commodity price assumptions over the entire cash flow projection period would ceteris paribus result in $5-9 billion in impairments or $2-5 billion in impairment reversal, respectively, in Integrated Gas and Upstream.
Refining margins
Refining margins applied for impairment testing by reference to value in use are at an average of $10/bbl. A change of -$1/bbl or +$1/bbl
in long-term refining margins over the entire cash flow projection period would ceteris paribus result in no impairments or up to $0.5 billion in impairment reversal, respectively, in Chemicals and Products.
Chemical margins
Chemical margins applied for impairment testing by reference to value in use are at an average of $197.5/tonne. A change of -$30/tonne or +$30/tonne in long-term chemical margins over the entire cash flow projection period would ceteris paribus result in up to $0.5 billion in impairments or no impairment reversal, respectively, in Chemicals and Products.
Discount rates
A change of +1% in the discount rate would ceteris paribus result in $1-3 billion in impairments in Integrated Gas and Upstream, and would have no significant impact in other segments.
Where applicable, the above sensitivities include impairment charges that would arise in respect of associates and joint ventures. Where carrying values have been supported by reference to fair value less costs of disposal, recoverable amounts are less sensitive to Shell's planning assumptions. This is on the basis that key assumptions (including discount rates and commodity prices) have been adjusted to reflect those used by market participants.
In calculating recoverable value, key assumptions are not determined in isolation, to ensure relevant interdependencies are appropriately reflected. In particular, management considers the relationship between discount rates, forecast commodity prices and cash flow risking to ensure impairment testing assumptions result in an implicit expected return which is balanced and appropriate for the asset under review. Each of the sensitivities described above has been tested under a ceteris paribus assumption where all other factors remain unchanged, and as such does not reflect the potential offsetting effects of corresponding changes in other assumptions.
Financial Statements and Supplements | Notes to the Consolidated Financial Statements continued
14. Joint ventures and associates
| | |
| Shell share of comprehensive income of joint ventures and associates |
| | | | | | | | | | | | | | | | | | | | | | | | | | | | | | | | | | | | | | | | | | | |
| | $ million |
| 2024 | | 2023 | | 2022 |
| Joint
ventures | | Associates | Total | | | Joint
ventures | Associates | | Total | | Joint
ventures | Associates | | Total |
| Income for the period | 970 | | 2,023 | 2,993 | [A] | | 1,619 | 2,106 | | 3,725 | | 2,589 | 1,383 | [B] | 3,972 |
Other comprehensive (loss)/income for the period | (71) | | — | (71) | | | (183) | — | | (183) | | 21 | — | | 21 |
| Comprehensive income for the period | 899 | | 2,023 | 2,922 | | | 1,436 | 2,106 | | 3,542 | | 2,610 | 1,383 | | 3,993 |
[A]Includes impairment charges of $873 million, mainly related to joint ventures and associates in the Renewables and Energy Solutions segment.
[B]Includes an impairment charge of $1,614 million related to Sakhalin-2 following the withdrawal from Russia.
| | |
| Carrying amount of interests in joint ventures and associates |
| | | | | | | | | | | | | | | | | | | | | | | |
| $ million |
| Dec 31, 2024 | | Dec 31, 2023 |
| Joint
ventures | Associates | Total | | Joint
ventures | Associates | Total |
| Net assets | 15,783 | 7,662 | 23,445 | | 17,382 | 7,075 | 24,457 |
| | |
| Transactions with joint ventures and associates [A] |
| | | | | | | | | | | |
| $ million |
| 2024 | 2023 | 2022 |
| Sales and charges to joint ventures and associates | 9,652 | 10,223 | 12,230 |
| Purchases and charges from joint ventures and associates | 13,076 | 15,084 | 22,286 |
[A]Includes 19% (2023: 25%) of sales and 14% (2023: 19%) purchases in transactions with one joint venture operating in the oil trading business.
These transactions principally comprise sales and purchases of goods and services in the ordinary course of business. Related balances outstanding at December 31, 2024, and 2023, are presented in Notes 16 and 20.
| | |
| Other arrangements in respect of joint ventures and associates |
| | | | | | | | |
| $ million |
| Dec 31, 2024 | Dec 31, 2023 |
| Commitments to make purchases from joint ventures and associates [A] | 1,078 | 1,397 |
| Commitments to provide debt or equity funding to joint ventures and associates | 323 | 405 |
[A]Commitments to make purchases from joint ventures and associates mainly relate to contracts associated with LNG processing fees and transportation capacity. Shell has other purchase obligations related to joint ventures and associates that are not fixed or determinable and are principally intended to be resold in a short period of time through sales agreements with third parties. These include long-term LNG and natural gas purchase commitments and commitments to purchase refined products or crude oil at market prices.
Financial Statements and Supplements | Notes to the Consolidated Financial Statements continued
15. Investments in securities
| | |
Investments in securities |
| | | | | | | | |
| $ million |
| Dec 31, 2024 | Dec 31, 2023 |
| Equity securities: | 1,104 | 1,605 |
| Equity securities at fair value through other comprehensive income | 1,104 | 1,605 |
| | |
| Debt securities: | 1,151 | 1,641 |
| Debt securities at amortised cost | 37 | 28 |
| Debt securities at fair value through other comprehensive income | 1,017 | 1,285 |
| Debt securities at fair value through profit or loss | 97 | 328 |
| Total | 2,255 | 3,246 |
| At fair value | | |
| Measured by reference to prices in active markets for identical assets | 1,197 | 1,983 |
| Measured by reference to other observable inputs | 95 | 92 |
| Measured using predominantly unobservable inputs | 926 | 1,143 |
| Total | 2,218 | 3,218 |
| At cost | 37 | 28 |
| Total | 2,255 | 3,246 |
As at December 31, 2024, investments included equity securities comprising interests in which Shell has no significant influence; debt securities, principally comprising a portfolio required to be held by the Company's internal insurance entities as security for their activities; and assets held in escrow in relation to the Group's UK pension arrangements.
| | |
| Investments in securities measured using predominantly unobservable inputs [A] |
| | | | | | | | |
| $ million |
| 2024 | 2023 |
| At January 1 | 1,143 | 1,299 |
Losses recognised in other comprehensive income | (16) | (126) |
| Purchases | 63 | 146 |
| Sales | (260) | (207) |
| Other movements | (4) | 31 |
| At December 31 | 926 | 1,143 |
[A]Based on expected dividend flows, adjusted for country and other risks as appropriate and discounted to their present value.
Financial Statements and Supplements | Notes to the Consolidated Financial Statements continued
16. Trade and other receivables
| | | | | | | | | | | | | | | | | |
| $ million |
| Dec 31, 2024 | | Dec 31, 2023 |
| Current | Non-current | | Current | Non-current |
| Trade receivables | 31,041 | — | | 36,273 | — |
| Lease receivables | 189 | 875 | | 188 | 1,032 |
| Other receivables | 8,014 | 3,528 | | 9,642 | 2,801 |
| Amounts due from joint ventures and associates | 903 | 152 | | 1,014 | 278 |
| Prepayments and deferred charges | 5,713 | 1,463 | | 6,156 | 2,187 |
| Total | 45,860 | 6,018 | | 53,273 | 6,298 |
The fair value of financial assets included above approximates the carrying amount and was determined from predominantly unobservable inputs.
Other receivables at December 31, 2024, included current indirect tax receivables of $1.5 billion (2023: $1.5 billion), government subsidies of $795 million (2023:$484 million), non-current income tax receivables of $680 million (2023: $568 million) and current income tax receivables of $391 million (2023: $558 million).
Provisions for impairments deducted from trade and other receivables amounted to $1,253 million at December 31, 2024 (2023: $1,251 million).
Allowance for expected credit losses -- trade receivables
Shell uses a provision matrix to calculate expected credit losses (ECLs) for trade receivables. The provision matrix is initially based on Shell's historical observed default rates. Shell calculates the ECL to adjust the historical credit loss experienced with forward-looking information.
The ECL at December 31, 2024, was $113 million (2023: $185 million), which represents 0.36-0.51% (2023: 0.51-0.54%) of all trade receivables.
A loss allowance provision of $414 million (2023: $415 million) was established in addition to all other impairments to trade receivables
as at December 31, 2024, that are outside of the provision matrix calculations.
Lease contracts where Shell is the lessor are classified as finance leases or operating leases. Receivables for lease contracts classified as finance leases are as follows:
| | | | | | | | |
| | $ million |
| Dec 31, 2024 | Dec 31, 2023 |
| Less than one year | 234 | 238 |
| Between 1 and 5 years | 732 | 848 |
| 5 years and later | 316 | 453 |
| Total undiscounted lease payments receivable | 1,282 | 1,539 |
| Unearned finance income | 218 | 260 |
| Net investment in leases | 1,064 | 1,279 |
In addition, at December 31, 2024, Shell is entitled to future contractual payments under operating leases of $277 million (2023: $312 million).
17. Inventories
| | | | | | | | |
| $ million |
| Dec 31, 2024 | Dec 31, 2023 |
| Oil, gas and chemicals | 20,211 | 22,232 |
| Environmental certificates | 1,602 | 2,108 |
| Materials | 1,613 | 1,679 |
| Total | 23,426 | 26,019 |
Inventories at December 31, 2024, included write-downs to net realisable value of $483 million (2023: $1,567 million).
Financial Statements and Supplements | Notes to the Consolidated Financial Statements continued
18. Cash and cash equivalents
| | | | | | | | |
| $ million |
| Dec 31, 2024 | Dec 31, 2023 |
| Cash | 5,551 | 5,886 |
| Short-term bank deposits | 10,706 | 6,590 |
| Money market funds, reverse repos and other cash equivalents | 22,853 | 26,298 |
| Total | 39,110 | 38,774 |
In 2024, cash continued to be invested with an emphasis on capital preservation. Information about credit risk is presented in Note 26. Included in cash and cash equivalents at December 31, 2024, were amounts totalling $1,274 million (2023: $460 million) subject to currency controls or other legal restrictions. The increase mainly relates to cash recognised in respect of joint arrangements.
19. Assets held for sale
| | | | | | | | | | | | | | | | | | | | | | | |
| | | $ million |
| | Dec 31, 2024 | | | Dec 31, 2023 [A] |
| Current | Non-current | Total | | Current | Non-current | Total |
| Intangible assets | — | 67 | 67 | | — | 71 | 71 |
| Property, plant and equipment | — | 8,283 | 8,283 | | — | 250 | 250 |
| Joint ventures and associates | — | — | — | | — | 19 | 19 |
| | | | | | | |
Deferred tax | — | — | — | | — | 10 | 10 |
Retirement benefits | — | — | — | | — | 1 | 1 |
| Trade and other receivables | 276 | 47 | 323 | | 103 | 34 | 137 |
Derivative financial instruments | 4 | — | 4 | | — | — | — |
| Inventories | 1,180 | — | 1,180 | | 463 | — | 463 |
| Assets classified as held for sale | 1,460 | 8,397 | 9,857 | | 566 | 385 | 951 |
| Debt | 49 | 575 | 624 | | 2 | 82 | 84 |
| Trade and other payables | 476 | 8 | 484 | | 94 | — | 94 |
| | | | | | | |
Deferred tax | — | 2,042 | 2,042 | | — | — | — |
| Retirement benefits | — | — | — | | — | 53 | 53 |
| Decommissioning and other provisions | 134 | 2,919 | 3,053 | | 7 | 68 | 75 |
| Income taxes payable | — | — | — | | 1 | — | 1 |
| Liabilities directly associated with assets classified as held for sale | 659 | 5,544 | 6,203 | | 104 | 203 | 307 |
[A]In 2024, Shell ceased to classify an energy and chemicals park in Europe in Chemicals and Products as held for sale as it no longer met the criteria. All other assets classified as held for sale at December 31, 2023, were sold in 2024.
At December 31, 2024, assets held for sale mainly related to Shell's UK offshore oil and gas assets in Upstream, and mining interests in North America and an energy and chemicals park in Singapore, both in Chemicals and Products. The disposal of assets classified as held for sale at December 31, 2024, are expected to be completed in 2025.
20. Trade and other payables
| | | | | | | | | | | | | | | | | |
| $ million |
| Dec 31, 2024 | | Dec 31, 2023 |
| Current | Non-current | | Current | Non-current |
| Trade payables | 29,767 | — | | 34,591 | — |
| Other payables [A] | 9,838 | 2,990 | | 9,887 | 2,835 |
| Sales taxes, excise duties and similar levies | 3,439 | — | | 3,105 | — |
| Amounts due to joint ventures and associates | 6,410 | 67 | | 7,519 | 33 |
| Accruals and deferred income | 11,239 | 233 | | 13,135 | 235 |
| Total | 60,693 | 3,290 | | 68,237 | 3,103 |
[A]Includes obligations under environmental compliance schemes of $3,935 million as at December 31, 2024 (2023: $4,046 million). (See Note 5).
The fair value of financial liabilities included above approximates the carrying amount and was determined from predominantly
unobservable inputs.
Other payables include amounts due to joint arrangement partners and in respect of other project-related items.
Information about offsetting, collateral and liquidity risk is presented in Note 26.
Financial Statements and Supplements | Notes to the Consolidated Financial Statements continued
21. Debt
| | | | | | | | | | | | | | | | | | | | | | | |
| $ million |
| Dec 31, 2024 | | Dec 31, 2023 |
| Debt (excluding
lease liabilities) | Lease
liabilities [A] | Total | | Debt (excluding
lease liabilities) | Lease
liabilities [A] | Total |
| Current debt: | 6,920 | 4,710 | 11,630 | | 5,288 | 4,643 | 9,931 |
| Short-term debt | 642 | | 642 | | 845 | | 845 |
| Long-term debt due within 1 year | 6,278 | 4,710 | 10,988 | | 4,443 | 4,643 | 9,086 |
| Non-current debt | 41,456 | 23,992 | 65,448 | | 48,544 | 23,066 | 71,610 |
| Total | 48,376 | 28,702 | 77,078 | | 53,832 | 27,709 | 81,541 |
[A]Further analysis of lease liabilities is provided in Note 22.
Net debt is the sum of current and non-current debt, less cash and cash equivalents, adjusted for the fair value of derivative financial instruments used to hedge the volatility caused by fluctuations in foreign exchange and interest rates relating to debt, and associated collateral balances. Net debt is a non-GAAP measure, providing additional information to help demonstrate the economic impacts of debt, associated hedges, and cash and cash equivalents.
| | | | | | | | | | | | | | | | | | | | |
| | | | | | $ million |
| (Asset)/liability |
| Current
debt | Non-current
debt | | Derivative
financial
instruments | Cash and cash equivalents (see Note 18) | Net debt* |
| At January 1, 2024 | 9,931 | 71,610 | | 775 | (38,774) | 43,542 |
| Cash flow | (9,653) | 35 | | (594) | (1,097) | (11,309) |
| Lease additions [A] | 763 | 5,083 | | | | 5,846 |
| Other movements | 10,909 | (10,040) | | (319) | — | 550 |
Currency translation differences and foreign exchange losses/(gains) | (320) | (1,240) | | 979 | 761 | 180 |
| At December 31, 2024 | 11,630 | 65,448 | | 841 | (39,110) | 38,809 |
| At January 1, 2023 | 9,001 | 74,794 | | 1,288 | (40,246) | 44,837 |
| Cash flow | (9,617) | (215) | | 723 | 1,778 | (7,331) |
| Lease additions [A] | 1,021 | 3,321 | | | | 4,342 |
| Other movements | 9,619 | (7,184) | | (481) | — | 1,954 |
| Currency translation differences and foreign exchange (gains)/losses | (93) | 894 | | (755) | (306) | (260) |
| At December 31, 2023 | 9,931 | 71,610 | | 775 | (38,774) | 43,542 |
[A]Further analysis of lease liabilities is provided in Note 22.
| | |
| Borrowing facilities and amounts undrawn |
| | | | | | | | | | | | | | | | | |
| $ million |
| Facility | | Amount undrawn |
| Dec 31, 2024 | Dec 31, 2023 | | Dec 31, 2024 | Dec 31, 2023 |
| CP programmes | 20,000 | 20,000 | | 20,000 | 20,000 |
| EMTN programme | N/A | unlimited | | N/A | N/A |
| US shelf registration | unlimited | unlimited | | N/A | N/A |
| Committed credit facilities | 8,000 | 9,920 | | 8,000 | 9,920 |
* Non-GAAP measure (see page 337).
Financial Statements and Supplements | Notes to the Consolidated Financial Statements continued
21. Debt continued
During 2024, Shell had access to international debt capital markets via two commercial paper (CP) programmes, a US universal shelf (US shelf) registration and a Euro medium-term note (EMTN) programme. Issuances under the CP programmes are supported by a committed credit facility and cash.
Under the CP programmes, Shell can issue debt of up to $10,000 million with maximum maturities ranging between 183 days and 364 days depending on the form of the notes issued; and $10,000 million with maturities not exceeding 397 days.
The US shelf registration provides Shell with the flexibility to issue debt securities, ordinary shares, preferred shares and warrants. The registration is updated once every three years and was last updated in December 2023. During 2024, no debt was issued under this registration (2023: no debt issued).
The EMTN programme lapsed in November 2024 and will be renewed during 2025. During 2024, no debt was issued under this programme
(2023: no debt issued).
On December 13, 2019, Shell refinanced its revolving credit facility (RCF), which is linked to the Secured Overnight Financing Rate (SOFR),
at pre-agreed margins. Shell elected not to extend the short-dated tranche of $1,920 million in 2024. The remaining $8,000 million expires in 2026 (2023: $8,000 million expiring in 2026). The terms and availability are not conditional on Shell's financial ratios nor its credit ratings. The interest and fees related to these facilities are linked to Shell's progress towards reaching its short-term Net Carbon Intensity target.
The following tables compare contractual cash flows for debt, excluding lease liabilities at December 31, with the carrying amount in the Consolidated Balance Sheet. Contractual amounts reflect the effects of changes in foreign exchange rates; differences from carrying amounts reflect the effects of discounting, premiums and, where fair value hedge accounting is applied, fair value adjustments. Interest is estimated assuming that interest rates applicable to variable-rate debt remain constant and there is no change in aggregate principal amounts of debt other than repayment at scheduled maturity, as reflected in the table.
| | | | | | | | | | | | | | | | | | | | | | | | | | | | | |
| $ million |
| Contractual payments | | |
| Less than
1 year | Between
1 and 2
years | Between
2 and 3 years | Between
3 and 4
years | Between
4 and 5
years | 5 years
and later | Total | Difference
from carrying
amount | Carrying
amount |
| | | | | | | | | |
| Bonds | 6,036 | 3,792 | 2,344 | 5,207 | 2,333 | 27,369 | 47,081 | (395) | 46,686 |
EMTN | 3,286 | 1,042 | 2,344 | 3,707 | 833 | 6,469 | 17,681 | (260) | 17,421 |
US shelf | 2,750 | 2,750 | — | 1,500 | 1,500 | 20,900 | 29,400 | (135) | 29,265 |
| Bank and other borrowings | 885 | 169 | 69 | 289 | 32 | 246 | 1,690 | — | 1,690 |
| Total (excluding interest) | 6,921 | 3,961 | 2,413 | 5,496 | 2,365 | 27,615 | 48,771 | (395) | 48,376 |
| Interest | 1,437 | 1,265 | 1,184 | 1,162 | 1,055 | 12,214 | 18,317 | | |
| | | | | | | | | | | | | | | | | | | | | | | | | | | | | |
| $ million |
| Contractual payments | | |
| Less than
1 year | Between
1 and 2
years | Between
2 and 3 years | Between
3 and 4
years | Between
4 and 5
years | 5 years
and later | Total | Difference
from carrying
amount | Carrying
amount |
| | | | | | | | | |
| Bonds | 4,292 | 6,194 | 3,856 | 2,489 | 5,442 | 30,049 | 52,322 | (567) | 51,755 |
EMTN | 3,042 | 3,444 | 1,106 | 2,489 | 3,942 | 7,649 | 21,672 | (414) | 21,258 |
US shelf | 1,250 | 2,750 | 2,750 | — | 1,500 | 22,400 | 30,650 | (153) | 30,497 |
| Bank and other borrowings | 1,060 | 230 | 73 | 346 | 53 | 316 | 2,078 | (1) | 2,077 |
| Total (excluding interest) | 5,352 | 6,424 | 3,929 | 2,835 | 5,495 | 30,365 | 54,400 | (568) | 53,832 |
| Interest | 1,569 | 1,452 | 1,285 | 1,207 | 1,177 | 13,366 | 20,056 | | |
Interest rate swaps have been entered into against certain fixed rate debt affecting the effective interest rate on these balances (see Note 26).
The fair value of debt excluding lease liabilities at December 31, 2024, was $44,119 million (2023: $50,866 million), mainly determined from
the prices quoted for those securities. The difference between the fair value of debt and the carrying amount is predominantly related to the difference between the fixed rate and the current market rate.
Financial Statements and Supplements | Notes to the Consolidated Financial Statements continued
22. Leases
Shell has lease contracts in Integrated Gas and Upstream, principally for floating production storage and offloading units, pipeline assets, subsea equipment, drilling and ancillary equipment, service vessels, LNG vessels and land and buildings; in Marketing, principally for land and retail sites; in Chemicals and Products, principally for plant pipeline and machinery, tankers and storage capacity; in Renewables and Energy Solutions, principally for power generation assets, storage capacity and land; and in Corporate, principally for land and buildings. Shell's obligations under its leases are secured on the leased assets.
Right-of-use assets
Right-of-use assets are included in property, plant and equipment for the following amounts:
| | | | | | | | | | | | | | | |
| | $ million |
| | | Manufacturing,
supply and
distribution | | |
| | Production | Other [C] | Total |
| Cost | | | | | |
| At January 1 | | 12,597 | 19,485 | 12,151 | 44,233 |
| Additions | | 1,669 | 4,912 | 660 | 7,241 |
| Sales, retirements and other movements [A] | | (554) | (565) | (2,463) | (3,582) |
| | | | | |
| Currency translation differences | | (147) | (94) | (421) | (662) |
| At December 31 | | 13,565 | 23,738 | 9,927 | 47,230 |
| Depreciation, depletion and amortisation, including impairments | | | | | |
| At January 1 | | 7,146 | 8,049 | 4,959 | 20,154 |
Charge for the year [B] | | 1,525 | 2,837 | 1,066 | 5,428 |
| Sales, retirements and other movements [A] | | (891) | (1,552) | (2,130) | (4,573) |
| | | | | |
| Currency translation differences | | (26) | (29) | (177) | (232) |
| At December 31 | | 7,754 | 9,305 | 3,718 | 20,777 |
| Carrying amount at December 31 | | 5,811 | 14,433 | 6,209 | 26,453 |
[A]Includes the reclassification of right-of-use assets to assets held for sale.
[B]Includes impairment losses ($438 million) and reversals ($11 million).
[C]Other mainly includes lease contracts for retail sites, land, and buildings in Marketing, Renewables and Energy Solutions and Corporate.
| | | | | | | | | | | | | | | |
| | $ million |
| | | Manufacturing,
supply and
distribution | | |
| | Production | Other [D] | Total |
| Cost | | | | | |
| | | | | |
| | | | | |
| At January 1 | | 14,675 | 16,463 | 9,899 | 41,037 |
| Additions | | 790 | 2,442 | 1,308 | 4,540 |
| Sales, retirements and other movements [A] | | (116) | 29 | (1,040) | (1,127) |
| Reclassifications [B] | | (2,779) | 527 | 2,252 | — |
| Currency translation differences | | 27 | 24 | (268) | (217) |
| At December 31 | | 12,597 | 19,485 | 12,151 | 44,233 |
| Depreciation, depletion and amortisation, including impairments | | | | | |
| At January 1 | | 8,275 | 6,695 | 2,950 | 17,920 |
Charge for the year [C] | | 1,382 | 2,428 | 998 | 4,808 |
| Sales, retirements and other movements [A] | | (303) | (1,149) | (1,042) | (2,494) |
Reclassifications [B] | | (2,217) | 63 | 2,154 | — |
| Currency translation differences | | 9 | 12 | (101) | (80) |
| At December 31 | | 7,146 | 8,049 | 4,959 | 20,154 |
| Carrying amount at December 31 | | 5,451 | 11,436 | 7,192 | 24,079 |
[A]Includes the reclassification of right-of-use assets to assets held for sale.
[B]Reclassification from Production to Manufacturing, supply and distribution and Other.
[C]Includes impairment losses ($72 million) and reversals ($2 million).
[D]Other mainly includes lease contracts for retail sites, land, and buildings in Marketing, Renewables and Energy Solutions and Corporate.
Financial Statements and Supplements | Notes to the Consolidated Financial Statements continued
22. Leases continued
Lease arrangements
Shell also has certain lease contracts of items with lease terms of 12 months or less. For these lease contracts, Shell applies the short-term lease recognition exemption. Lease expenses not included in the measurement of lease liability are:
| | |
| Lease expenses not included in the measurement of lease liability |
| | | | | | | | |
| | $ million |
| 2024 | 2023 |
| Expense relating to short-term leases | 360 | 495 |
| Expense relating to variable lease payments | 1,448 | 1,415 |
The total cash outflow in respect of leases representing repayments of principal and payment of interest in 2024 was $6,891 million (2023: $7,512 million), recognised in Repayment and interest paid in the Consolidated Statement of Cash Flows.
The future lease payments under lease contracts and the carrying amounts at December 31, by payment date are as follows:
| | | | | | | | | | | | | | |
| $ million |
| Contractual
lease payments | | Interest | Lease
liabilities |
| Less than 1 year | 6,367 | | 1,657 | 4,710 |
| Between 1 and 5 years | 15,772 | | 4,662 | 11,110 |
| 5 years and later | 19,814 | | 6,932 | 12,882 |
| Total | 41,953 | [A] | 13,251 | 28,702 |
[A]Future cash outflows in respect of leases may differ from lease liabilities recognised due to future decisions that may be taken by Shell in respect of the use of leased assets. These decisions may result in variable lease payments being made. In addition, Shell may reconsider whether it will exercise extension options or termination options, which are not reflected in the lease liabilities. There is no exposure to these potential additional payments in excess of the recognised lease liabilities until these decisions have been taken by Shell.
| | | | | | | | | | | |
| $ million |
| Contractual lease payments | Interest | Lease
liabilities |
| Less than 1 year | 6,182 | 1,539 | 4,643 |
| Between 1 and 5 years | 16,105 | 4,443 | 11,662 |
| 5 years and later | 16,794 | 5,390 | 11,404 |
| Total | 39,081 | 11,372 | 27,709 |
23. Taxation
| | | | | | | | | | | |
| $ million |
| 2024 | 2023 | 2022 |
| Current tax: | | | |
| Charge in respect of current period | 13,648 | 13,066 | 16,383 |
| Adjustments in respect of prior periods | 58 | (422) | (947) |
| Total | 13,706 | 12,644 | 15,436 |
| Deferred tax: | | | |
| Relating to the origination and reversal of temporary differences, tax losses and credits | (491) | (305) | 5,196 |
| Relating to changes in tax rates and legislation | 112 | 242 | 785 |
| Adjustments in respect of prior periods | 74 | 410 | 524 |
| Total | (305) | 347 | 6,505 |
Total taxation charge | 13,401 | 12,991 | 21,941 |
Financial Statements and Supplements | Notes to the Consolidated Financial Statements continued
23. Taxation continued
Adjustments in respect of prior periods relate to events in the current period and reflect the effects of changes in rules, facts or other factors compared with those used in establishing the current tax position or deferred tax balance in prior periods.
In 2022, adjustments in respect of changes in tax rates and legislation of $524 million principally relate to the introduction of the UK Energy Profits Levy Act 2022 (EPL).
| | | | | | | | | | | |
| Pillar Two |
| $ million |
| 2024 | 2023 | 2022 |
Taxation charge | 13,401 | 12,991 | 21,941 |
| Of which: | | | |
Income tax excluding Pillar Two income tax | 13,150 | 12,991 | 21,941 |
Income tax related to Pillar Two income tax | 251 | — | — |
On June 20, 2023, the UK substantively enacted Pillar Two Model Rules, effective as from January 1, 2024. The Pillar Two rules are designed to ensure large multinational enterprises (meeting certain conditions) pay a minimum level of tax on the income arising in each jurisdiction where they operate. Shell has applied the exception, as set out in the amendments to IAS 12 Income Taxes, to recognising and disclosing information about deferred tax assets and liabilities related to Pillar Two income taxes.
| | |
| Reconciliation of applicable tax charge at statutory tax rates to taxation charge |
| | | | | | | | | | | |
| | | $ million |
| 2024 | 2023 | 2022 |
Income before taxation | 29,922 | 32,627 | 64,815 |
| Less: share of profit of joint ventures and associates | (2,993) | (3,725) | (3,972) |
Income before taxation and share of profit of joint ventures and associates | 26,929 | 28,902 | 60,843 |
Applicable tax charge at standard statutory tax rates | 11,782 | 11,921 | 22,170 |
| Adjustments in respect of prior periods | 132 | (12) | (424) |
| Tax effects of: | | | |
| Expenses not deductible for tax purposes | 747 | 1,225 | 849 |
| Incentives for investment and development | (374) | (553) | (1,388) |
| Derecognition/(recognition) of deferred tax assets | 255 | 243 | (457) |
| Changes in tax rates and legislation | 112 | 242 | 785 |
| Income not subject to tax at standard statutory rates | 360 | (213) | 234 |
| Disposals | (134) | (113) | 39 |
| Exchange rate differences | (12) | 89 | (102) |
| Other reconciling items | 533 | 162 | 235 |
Taxation charge | 13,401 | 12,991 | 21,941 |
| Weighted average of statutory tax rates [A] | 44% | 41% | 36% |
| Effective tax rate based on income before taxation [B] | 45% | 40% | 34% |
| Effective tax rate based on income before taxation excluding share of profit of joint ventures and associates [C] | 50% | 45% | 36% |
[A]The weighted average of statutory tax rates is calculated by dividing the applicable tax charge at standard statutory tax rates by Income before taxation and share of profit of joint ventures and associates.
[B]The effective tax rate based on income before taxation is calculated by dividing Taxation charge by Income before taxation.
[C]The effective tax rate based on income before taxation excluding share of profit of joint ventures and associates is calculated by dividing Taxation charge by Income before taxation and share of profit of joint ventures and associates.
Financial Statements and Supplements | Notes to the Consolidated Financial Statements continued
23. Taxation continued
Compared with 2023, the increase in the weighted average of statutory tax rates mainly reflects a higher proportion of total earnings subject to relatively higher tax rates in Upstream.
| | | | | | | | | | | | | | | | | | | | | | |
| | | | | | | | $ million |
| Deferred tax asset | Decommissioning
and other
provisions | | Property,
plant and
equipment | | Tax losses
and credits
carried forward | Retirement benefits | Other | Total |
| At January 1, 2024 | 7,577 | | 1,584 | | 4,280 | 1,750 | 4,432 | 19,623 |
Credit/(charge) to income | 528 | | 254 | | (388) | — | 799 | 1,193 |
| Currency translation differences | (94) | | (7) | | (129) | (77) | (31) | (338) |
| Other comprehensive income | — | | — | | 33 | (162) | 46 | (83) |
| Other movements | (1,170) | | (17) | | (229) | 343 | (11) | (1,084) |
| At December 31, 2024 | 6,841 | | 1,814 | | 3,567 | 1,854 | 5,235 | 19,311 |
| Deferred tax liability | | | | | | | | |
| At January 1, 2024 | | | (21,996) | | | (2,880) | (3,640) | (28,516) |
(Charge)/credit to income | | | (799) | | | (138) | 49 | (888) |
| Currency translation differences | | | 231 | | | 386 | 68 | 685 |
| Other comprehensive income | | | (2) | | | (267) | (15) | (284) |
Other movements | | | 3,652 | | | (351) | (257) | 3,044 |
| At December 31, 2024 | | | (18,914) | | | (3,250) | (3,795) | (25,959) |
| Net deferred tax liability at December 31, 2024 | | | | | | | | (6,648) |
| Deferred tax asset/(liability) as presented in the balance sheet at December 31, 2024 | | | | | | | | |
| Deferred tax asset | | | | | | | | 6,857 |
| Deferred tax liability | | | | | | | | (13,505) |
| | | | | | | | | | | | | | | | | | | | |
| | | | | | $ million |
| Deferred tax asset | Decommissioning
and other
provisions | Property,
plant and
equipment | Tax losses
and credits carried forward | Retirement benefits | Other | Total |
| At January 1, 2023 | 6,049 | 4,290 | 6,446 | 1,977 | 4,827 | 23,589 |
| (Charge)/credit to income | 61 | (680) | (2,025) | 27 | 557 | (2,060) |
| Currency translation differences | 89 | 18 | 66 | 28 | (11) | 190 |
| Other comprehensive income | — | — | (5) | 104 | 23 | 122 |
Other movements | 1,378 | (2,044) | (202) | (386) | (964) | (2,218) |
| At December 31, 2023 | 7,577 | 1,584 | 4,280 | 1,750 | 4,432 | 19,623 |
| Deferred tax liability | | | | | | |
| At January 1, 2023 | | (24,818) | | (3,189) | (3,953) | (31,960) |
Credit/(charge) to income | | 2,109 | | (228) | (168) | 1,713 |
| Currency translation differences | | (173) | | 227 | — | 54 |
| Other comprehensive income | | (3) | | (90) | (3) | (96) |
Other movements | | 889 | | 400 | 484 | 1,773 |
| At December 31, 2023 | | (21,996) | | (2,880) | (3,640) | (28,516) |
| Net deferred tax asset at December 31, 2023 | | | | | | (8,893) |
| Deferred tax asset/(liability) as presented in the balance sheet at December 31, 2023 | | | | | | |
| Deferred tax asset | | | | | | 6,454 |
| Deferred tax liability | | | | | | (15,347) |
The presentation in the balance sheet takes into consideration the offsetting of deferred tax assets and deferred tax liabilities within the same tax jurisdiction, where this is permitted. The overall deferred tax position in a particular tax jurisdiction determines if a deferred tax balance related to that jurisdiction is presented within deferred tax assets or deferred tax liabilities.
Financial Statements and Supplements | Notes to the Consolidated Financial Statements continued
23. Taxation continued
Other movements in deferred tax assets and liabilities are mainly related to assets classified as held for sale and liabilities directly associated with assets classified as held for sale (see note 19).
The deferred tax category Other primarily includes deferred tax positions in respect of leases, financial assets and liabilities, inventories, intangible assets other than goodwill and investments in subsidiaries, joint ventures and associates.
The deferred tax category property, plant and equipment also includes deferred tax positions in respect of investments in partnerships in the USA which are considered pass-through entities by its parent for tax purposes.
Deferred tax assets of $6,857 million (2023: $6,454 million) are recognised only to the extent it is considered probable that those assets will be recoverable. This involves an assessment of when those assets are likely to be recovered, and a judgement as to whether or not there will be sufficient taxable profits available to offset the assets. It is considered probable based on business forecasts that such taxable profits will be available. For Marketing, as well as Chemicals and Products, additional judgement is required; in some jurisdictions the assessment of forecasted taxable profits resulting in deferred tax asset recognition of $315 million (2023: $455 million) extends for an additional 10 years beyond Shell's regular 10-year planning horizon. In those situations, additional risking has been applied to the forecast of taxable profits. For Integrated Gas and Upstream, deferred tax assets recognised are expected to be recovered within the period of production of each asset. For deferred tax assets of $625 million (2023: $241 million) as at December 31, 2024, this period extends beyond 10 years.
The amount of deferred tax assets which are dependent on future taxable profits not arising from the reversal of existing deferred tax liabilities, and which relate to tax jurisdictions where Shell has suffered a loss in the current or preceding year, was $4,022 million at December 31, 2024 (2023: $2,027 million). The increase compared with 2023 is primarily attributable to a higher number of entities which have generated losses in 2024.
| | |
Expected expiration of unused tax losses, unrecognised deductible temporary differences and tax credits |
| | | | | | | | | | | |
| | | | | $ million |
Expected expiration | | Dec 31, 2024 | | Dec 31, 2023 |
| | | | | |
Less than 1 year | | 375 | | | 1,496 |
Between 1 and 5 years | | 1,318 | | | 1,475 |
5 years and later [A] | | 75,768 | | | 71,709 |
Total | | 77,461 | | | 74,680 |
| | | | | |
| | | | | |
| | | | | |
[A]Includes unrecognised losses for Petroleum Resource Rent Tax (PRRT) in Australia which, due to the annual augmentation, increased to $49,893 million as at the end of the most recent PRRT fiscal year, June 30, 2024 (June 30, 2023: $46,220 million).
Unrecognised taxable temporary differences associated with undistributed retained earnings of investments in subsidiaries, joint ventures and associates amounted to $4,504 million at December 31, 2024 (2023: $5,311 million). These retained earnings are subject to withholding tax upon distribution.
Excluding unrecognised tax losses for PRRT, the unrecognised deductible temporary differences, unused tax losses and credits carried forward amounted to $27,568 million at December 31, 2024 (2023: $28,460 million), and included amounts of $25,875 million (2023: $25,489 million) that are subject to time limits for utilisation of five years or later, or are not time limited.
24. Retirement benefits
Retirement benefits are provided in most of the countries where Shell has operational activities. Shell offers these benefits through funded and unfunded defined benefit plans and defined contribution plans. The most significant pension plans are in the Netherlands, UK and USA.
Other post-employment benefits (OPEB) comprising retirement health care and life insurance are also provided in certain countries. The most significant OPEB plan is in the USA.
Financial Statements and Supplements | Notes to the Consolidated Financial Statements continued
24. Retirement benefits continued
| | | | | | | | |
| $ million |
| Dec 31, 2024 | Dec 31, 2023 |
| Obligations | (66,054) | (78,024) |
| Plan assets | 69,707 | 79,961 |
| Asset ceilings | (402) | (335) |
Surplus | 3,251 | 1,602 |
| Retirement benefits in the Consolidated Balance Sheet: | | |
| Non-current assets | 10,003 | 9,151 |
| Non-current liabilities: | (6,752) | (7,549) |
| Non-current liabilities - Pensions | (3,874) | (4,448) |
| Non-current liabilities - OPEB | (2,878) | (3,101) |
| Total | 3,251 | 1,602 |
| | |
| Retirement benefit expense |
| | | | | | | | | | | |
| $ million |
| 2024 | 2023 | 2022 |
| Defined benefit plans: | | | |
| Current service cost, net of plan participants' contributions | 802 | 731 | 1,100 |
| Interest expense on defined pension benefit obligations | 2,757 | 3,072 | 1,584 |
| Interest income on plan assets | (2,999) | (3,417) | (1,732) |
| Interest expense on OPEB obligations | 154 | 166 | 120 |
| Current OPEB service cost | 38 | 36 | 57 |
| Other [A] | (457) | 262 | 246 |
| Total | 295 | 850 | 1,375 |
| Defined contribution plans | 514 | 474 | 420 |
| Total retirement benefit expense | 809 | 1,324 | 1,795 |
[A]Mainly related to plan amendments and curtailments on pension plans and OPEB plans.
Retirement benefit expenses are presented principally within production and manufacturing expenses and selling, distribution and administrative expenses in the Consolidated Statement of Income. Interest income on plan assets is calculated using the same rate as that applied to the related defined benefit obligations for each plan to determine interest expense.
| | | | | | | | | | | | | | | |
| $ million |
| 2024 | 2023 | | 2022 | |
Actuarial gains/(losses) on obligations: | | | | | |
| Due to changes in financial assumptions on pensions [A] | 4,445 | (1,513) | | 28,840 | |
| Due to changes in financial assumptions on OPEB [A] | 249 | (264) | | 527 | |
| Due to experience adjustments on pensions [B] | (701) | (491) | | (2,956) | |
Due to experience adjustments on OPEB [B] | (259) | 230 | | 1,480 | [D] |
Due to changes in demographic assumptions on pensions [C] | 445 | (299) | | 27 | |
Due to changes in demographic assumptions on OPEB [C] | 87 | (38) | | 25 | |
| Total | 4,266 | (2,375) | | 27,943 | |
Return on plan assets in (shortage)/excess of interest income | (2,319) | 1,243 | | (20,612) | |
| Other movements | (93) | 44 | | (349) | |
| Total remeasurements | 1,854 | (1,088) | | 6,982 | |
[A]Mainly relates to changes in the discount rate and inflation assumptions.
[B]Experience adjustments arise from differences between the actuarial assumptions made in respect of the year and actual outcomes.
[C]Mainly relates to updates in mortality assumptions.
[D]In 2022, experience adjustments in OPEB includes $782 million to reflect the impact of prescription drug rebates.
Financial Statements and Supplements | Notes to the Consolidated Financial Statements continued
24. Retirement benefits continued
Defined benefit plan obligations
| | | | | | | | | | | | | | | | | | | | | | | | | | | | | |
| $ million, except where indicated |
| Pension benefits | | | Other post-employment benefits | |
| The Netherlands | UK | USA | | Rest of the world | | | OPEB [C] | Total |
| At January 1 | 26,746 | 19,074 | 15,579 | | 13,524 | | | 3,101 | 78,024 |
| Current service cost | 186 | 148 | 239 | | 215 | | | 38 | 826 |
| Interest expense | 847 | 847 | 507 | | 556 | | | 154 | 2,911 |
Actuarial gains | (1,377) | (1,793) | (997) | | (22) | | | (77) | (4,266) |
| Benefit payments | (1,076) | (1,081) | (702) | | (770) | | | (141) | (3,770) |
| Other movements | (251) | (1) | (5,030) | [A] | 540 | | | (95) | (4,837) |
| Currency translation differences | (1,498) | (237) | — | | (997) | | | (102) | (2,834) |
| At December 31 | 23,577 | 16,957 | 9,596 | | 13,046 | [B] | | 2,878 | 66,054 |
| Comprising: | | | | | | | | | |
| Funded pension plans | 23,577 | 16,638 | 8,787 | | 10,913 | | | | 59,915 |
| Weighted average duration | 15 years | 12 years | 12 years | | 13 years | | | | 13 years |
| Unfunded pension plans | | 319 | 809 | | 2,133 | | | | 3,261 |
| Weighted average duration | | 15 years | 8 years | | 11 years | | | | 11 years |
| Unfunded OPEB plans | | | | | | | | 2,878 | 2,878 |
| Weighted average duration | | | | | | | | 12 years | 12 years |
[A]Other movements mainly include the contract that the defined benefit pension plan in the USA, Shell Pension Plan, has entered into with a third-party insurance company to settle $5,052 million of pension liabilities. The settlement price consisted of $4,920 million of pension assets.
[B]Rest of the world includes pension plans in Germany ($3,234 million) and Canada ($3,641 million) which are the largest pension plans in this category.
[C]Mainly related to post-retirement medical benefits in the USA.
| | | | | | | | | | | | | | | | | | | | | | | | | | |
| $ million, except where indicated |
| Pension benefits | | | Other post-employment benefits | |
| The Netherlands | UK | USA | Rest of the world | | | OPEB [B] | Total |
| At January 1 | 24,608 | 17,791 | 14,793 | 13,410 | | | 2,879 | 73,481 |
| Current service cost | 184 | 145 | 215 | 179 | | | 36 | 759 |
| Interest expense | 904 | 881 | 695 | 592 | | | 166 | 3,238 |
Actuarial losses | 929 | 257 | 832 | 285 | | | 72 | 2,375 |
| Benefit payments | (1,032) | (1,014) | (956) | (757) | | | (88) | (3,847) |
| Other movements | 252 | — | — | (63) | | | — | 189 |
| Currency translation differences | 901 | 1,014 | — | (122) | | | 36 | 1,829 |
| At December 31 | 26,746 | 19,074 | 15,579 | 13,524 | [A] | | 3,101 | 78,024 |
| Comprising: | | | | | | | | |
| Funded pension plans | 26,746 | 18,734 | 14,695 | 11,298 | | | | 71,473 |
| Weighted average duration | 16 years | 15 years | 11 years | 13 years | | | | 14 years |
| Unfunded pension plans | | 340 | 884 | 2,226 | | | | 3,450 |
| Weighted average duration | | 16 years | 8 years | 11 years | | | | 11 years |
| Unfunded OPEB plans | | | | | | | 3,101 | 3,101 |
| Weighted average duration | | | | | | | 13 years | 13 years |
[A]Rest of the world includes pension plans in Germany ($3,647 million) and Canada ($3,930 million) which are the largest pension plans in this category.
[B]Mainly related to post-retirement medical benefits in the USA.
Financial Statements and Supplements | Notes to the Consolidated Financial Statements continued
24. Retirement benefits continued
Defined benefit plan assets
| | | | | | | | | | | | | | | | | | | | | | | | |
| $ million |
| Pension benefits | | | |
| The Netherlands | UK | USA | | Rest of the world | | | Total |
| At January 1 | 30,266 | 22,320 | 14,835 | | 12,540 | | | 79,961 |
| Return on plan assets in excess of interest income | (34) | (2,435) | (566) | | 716 | | | (2,319) |
| Interest income | 946 | 995 | 487 | | 571 | | | 2,999 |
Employer contributions | 2 | 36 | 262 | | 109 | [B] | | 409 |
| Plan participants' contributions | 12 | 17 | — | | 7 | | | 36 |
| | | | | | | | |
| Benefit payments | (1,076) | (1,081) | (702) | | (731) | | | (3,590) |
| Other movements | (9) | (22) | (4,891) | [A] | 470 | | | (4,452) |
| Currency translation differences | (1,777) | (270) | — | | (1,290) | | | (3,337) |
| At December 31 | 28,330 | 19,560 | 9,425 | | 12,392 | [C] | | 69,707 |
[A]Other movements mainly include the contract that the defined benefit pension plan in the USA, Shell Pension Plan, has entered into with a third-party insurance company to settle $5,052 million of pension liabilities. The settlement price consisted of $4,920 million of pension assets.
[B]Includes a netted amount of $108 million received from a captive structure in relation to pension plans reinsured in Rest of the world.
[C]Rest of the world includes pension plans in Germany ($2,705 million) and Canada ($3,179 million) which are the largest pension plans in this category.
| | | | | | | | | | | | | | | | | | | | | |
| $ million |
| Pension benefits | | | |
| The Netherlands | UK | USA | Rest of the world | | | Total |
| At January 1 | 27,986 | 21,963 | 14,243 | 12,564 | | | 76,756 |
| Return on plan assets in excess of interest income | 833 | (999) | 609 | 800 | | | 1,243 |
| Interest income | 1,035 | 1,094 | 679 | 609 | | | 3,417 |
Employer contributions | 419 | 34 | 274 | (23) | [A] | | 704 |
| Plan participants' contributions | 11 | 16 | — | 7 | | | 34 |
| | | | | | | |
| Benefit payments | (1,032) | (1,014) | (957) | (703) | | | (3,706) |
| Other movements | (6) | (16) | (13) | 17 | | | (18) |
| Currency translation differences | 1,020 | 1,242 | — | (731) | | | 1,531 |
| At December 31 | 30,266 | 22,320 | 14,835 | 12,540 | [B] | | 79,961 |
[A]Includes the netted amount of $212 million received from the captive structure in relation to pension plans reinsured in Rest of the world.
[B]Rest of the world includes pension plans in Germany ($2,730 million) and Canada ($3,504 million) which are the largest pension plans in this category.
The table below presents percentages derived from a weighted average calculation of the investments in the plan assets.
| | | | | | | | |
| 2024 | 2023 |
| Quoted in active markets: | | |
Equities [A] | 12% | 12% |
Debt securities [B] | 68% | 71% |
| Real estate | 2% | 1% |
| | |
| Unquoted | | |
| Equities | 13% | 12% |
| Debt securities | 4% | 4% |
Real estate | 6% | 7% |
| Investment funds | 3% | 3% |
Debt repurchase agreements [C] | (12)% | (11)% |
| Other | 1% | —% |
| Cash | 3% | 1% |
[A]Equity securities (quoted) are mainly related to investments of the Netherlands pension fund.
[B]Debt securities (quoted) are mainly related to the investments of the UK and the Netherlands pension funds.
[C]Debt repurchase agreements are mainly related to UK member-defined pension plans to fund liability-driven investments. In addition to these contracts, derivatives including interest rate and inflation swaps are used in the principal defined benefit plan in the Netherlands for liability matching strategies.
Financial Statements and Supplements | Notes to the Consolidated Financial Statements continued
24. Retirement benefits continued
Employer contributions to funded defined benefit pension plans are based on actuarial valuations in accordance with local regulations and are estimated to be $862 million in 2025.
Characteristics of significant defined benefit and defined contribution plans and regulatory framework
The Netherlands
The principal defined benefit pension plan in the Netherlands is a funded career-averaged pension arrangement with retired employees drawing benefits as an annuity, with a surplus of $4,753 million reported as at December 31, 2024, (2023: $3,520 million surplus). While the plan was closed to employees hired or rehired after July 1, 2013, it currently remains open for ongoing accrual for existing active members. Active members account for 21% (2023: 23%) of the total defined benefit liability in the Netherlands. From July 1, 2013 onwards, new employees in the Netherlands are entitled to membership of a defined contribution pension plan.
In line with Dutch regulations, the defined benefit pension plan has a joint Trustee Board with trustee representatives nominated by the Company, the Central Staff Council and retired members. The defined benefit pension plan also has an Accountability Council comprising members nominated by the Company, the Central Staff Council and retired members. Furthermore, there is a Supervisory Committee, which includes external experts from the pension industry, to oversee management, compliance and operations of the fund. The defined contribution pension plan has a one-tier Trustee Board with an independent chair, trustee representatives nominated by the Company and the Central Staff Council, as well as two executive board members. The defined contribution fund also has an Accountability Council comprised of members nominated by the Company and the Central Staff Council. Both Trustee Boards are responsible for administering the plans in line with the Dutch "Pensioenwet" (PW), including corporate governance, investment strategy for the pension plans' assets and paying member benefits,
and are required to act in the best interests of the members.
Dutch pension reform
As per July 1, 2023, new pension legislation ("Wet Toekomst Pensioenen" (WTP)) came into effect in the Netherlands, with implementation required prior to January 2028. This legislation aims to create a more resilient and adaptable pensions system that can better accommodate demographic changes and economic fluctuations while providing adequate retirement income. The legislation requires all future pension accruals to be in a defined contribution framework, with the intention that existing benefits accrued in pension funds are also converted into a defined contribution framework. The new regulatory framework will impact Shell's existing defined benefit pension plan, net pension scheme and defined contribution pension plan in the Netherlands.
In response to the new pension legislation the Company, with the consent of the Central Staff Council in the Netherlands, decided on June 25, 2024, that all future pension accruals from January 1, 2027, will be under a defined contribution framework. The new pension scheme(s) and associated transition measures were laid down in separate transition plans. In July 2024, these were formally submitted to the Trustee Boards of the pension funds for their acceptance. It is the intention that the gross defined benefit scheme of Shell will be transferred into a new defined contribution plan from January 1, 2027, and that the defined contribution plan of Shell will be transformed on January 1, 2026.
The transition plan for the defined benefit plan states that the transfer into a new defined contribution plan is subject to the local funding level of the plan remaining above an agreed level (125%) during the predetermined transition period. If the Trustee Board of the defined benefit plan formally accepts the transition plan (expected in 2025), Shell will derecognise the pension surplus, based on asset ceiling principles, resulting in a loss in other comprehensive income and an additional "minimum funding requirement" for an expected final cash contribution. Subsequently, at the date of transition (December 31, 2026), a charge to the Consolidated Statement of Income is expected in respect of the surplus previously derecognised. The likelihood of acceptance of the plan, and the extent to which the funding level will meet the agreed 125% threshold, is subject to uncertainty. If the funding level of the defined benefit plan falls below 125% during the transition period, the transition plan and anticipated cash contributions may need to be reassessed.
The amounts to be recognised which will be determined at each respective date are subject to uncertainty and market risks and may have a material impact on Shell's financial condition, results of operations and cash flows.
UK
The four largest defined benefit pension plans for employees in the UK are funded final salary pension arrangements with retired employees mainly drawing benefits as an annuity with the option to take a portion as a lump sum. The three plans are separate and independent plans and cannot be netted against each other. In total, the plans reported a surplus of $2,603 million as at December 31, 2024 (2023: surplus of $3,246 million), which is after netting of unfunded plans of $319 million (2023: $340 million) which are reported as non-current liabilities on the balance sheet. All three plans were closed to new employees hired or rehired. However, two plans currently remain open for ongoing accrual for existing active members. Active members account for 14% (2023: 16%) of the total defined benefit liability in the UK. From March 1, 2013, onwards new employees in the UK are entitled to membership of a defined contribution pension plan.
In line with UK regulations, the principal defined benefit pension plan is governed by a corporate trustee whose board comprises four trustee directors nominated by the Company, including the chair and four member-nominated trustee directors. The defined contribution pension plan is governed by a corporate trustee whose board comprises of three company-nominated directors, including the chair and two member-nominated trustee directors. The trustees are responsible for administering the plans in line with the Trust Deed and Regulations, including setting the investment strategy for the pension plans' assets and paying member benefits, and are required to act in the best interests of the members of the pension plans.
For the funded defined benefit pension plan for former BG employees, the BG Pension Scheme (BGPS), the Board of Trustees of the BG Pension Scheme decided to enter into a qualifying insurance contract for the full scheme (buy in) with a third-party insurer which was executed on September 11, 2024. This policy replaces the previous investments held to support the BGPS's benefits, and as a consequence, the longevity and investment risks have been transferred in full to the insurer. The liabilities relating to the scheme remain on the balance sheet but are now fully insured. The scheme has defined benefit liabilities of $1,270 million and a surplus of $105 million reported at December 31, 2024.
Financial Statements and Supplements | Notes to the Consolidated Financial Statements continued
24. Retirement benefits continued
USA
The principal defined benefit pension plan in the USA is a funded final average pay pension plan with a surplus of $638 million reported as at December 31, 2024 (2023: $140 million surplus). After retirement, all retirees can choose to draw their benefits as an annuity, whereas others also have the choice to take their benefit in a lump sum. There is also an unfunded defined benefit pension plan with a deficit of $809 million (2023: $884 million deficit). The benefits under this plan are taken primarily in a lump sum. In addition, the Company provides a defined contribution benefit plan. The funded defined benefit, unfunded defined benefit, and Shell's defined contribution pension plans are subject to the provisions of the Employee Retirement Income Security Act (ERISA).
In line with Shell Group's strategic objectives and risk management, on January 30, 2024, the principal defined benefit pension plan in the USA, Shell Pension Plan, entered into a contract with a third-party insurance company to settle $5,052 million of pension liabilities. The settlement price consisted of $4,920 million of pension assets. As a result of this transaction, all legal and constructive obligations for a tranche of benefits provided by the Shell Pension Plan have been eliminated. A gain on settlement of $101 million (after associated adjustment for deferred tax) has been recognised in Shell's Consolidated Statement of Income. As a consequence, as of December 31, 2024, the total active members increased to 30% (2023: 23%) of the total defined benefit liability in the USA.
Both the funded defined benefit pension plan and the defined contribution pension plan are governed by trustees who are appointed by the Plan Sponsor and are named fiduciaries with respect to the plans. The trustees are generally responsible for investment-related matters, appointing the Plan Administrator, maintaining general oversight and deciding appeals of participants.
USA OPEB
The Company also sponsors other post-retirement employee benefits (OPEB), mainly in the USA. The OPEB plans in the USA provide medical, dental and vision benefits, as well as life insurance benefits to eligible retired employees. The plans are unfunded, and the Company and retirees share the costs of the premiums with a deficit of $2,337 million reported as at December 31, 2024 (2023: $2,267 million deficit). The plan that provides post-retirement medical benefits in the USA is closed to employees hired or rehired on or after January 1, 2017. Certain life insurance benefits are paid by the Company.
Significant funding requirements:
○Additional contributions to the Dutch defined benefit pension plan would be required if the 12-month rolling average local funding percentage falls below 105% for six months or more. At the most recent 2024 funding valuation, the local funding percentage was above this level.
○There are no set minimum statutory funding requirements for the UK plans. A professional qualified independent actuary, appointed by the trustee board, undertakes a local funding valuation typically every three years. The most recent completed funding valuation for the principal defined benefit plan was undertaken as at December 31, 2023, and revealed a funding ratio of 108% and therefore no sponsor contributions (except for salary sacrifice contributions) were payable under the schedule of contributions.
○Under the Pension Protection Act, US pension plans are subject to minimum required contribution levels based on the funding position.
No contributions are required based on the most recent funding valuation.
Associated risks to which retirement benefits are exposed
There are inherent risks associated with defined benefit pension and OPEB plans. These risks are related to various assumptions made on valuation of the liabilities and the cash funding requirement of the underlying plans. Volatility in capital markets or government policies, and the resulting consequences for investment performance, interest and inflation rates, as well as changes in assumptions for mortality, retirement age or pensionable remuneration at retirement, could result in significant changes to the funding level of future liabilities. In case of a shortfall, there could be a requirement to make substantial cash contributions (depending on the applicable local regulations).
These inherent risks are managed by a pension forum, chaired by the Chief Financial Officer, which oversees Shell's pension strategy, policy and operations. The forum is supported by a risk committee in reviewing the results of the assurance process with respect to pension risk.
Investment strategies
Long-term investment strategies of plans are generally determined by the relevant pension plan trustees using a structured asset/liability modelling approach to define the asset mix that best meets the objectives of optimising returns within agreed risk levels, while maintaining adequate funding levels.
Principal and actuarial assumptions
The principal assumptions applied in determining the present value of defined benefit obligations and their bases were as follows:
○rates of increase in pensionable remuneration, pensions in payment and health care costs: historical experience and management's
long-term expectation;
○discount rates: prevailing long-term AA corporate bond yields, chosen to match the currency and duration of the relevant obligation; and
○mortality rates: published standard mortality tables for the individual countries concerned adjusted for Shell experience where statistically significant.
The weighted averages for those assumptions and related sensitivity information as at December 31, 2024 are presented below. Sensitivity information indicates by how much the defined benefit obligations would increase or decrease if a given assumption were to increase or decrease with no change in other assumptions. The sensitivity analyses may not be representative of an actual change in the defined benefit obligation as it is unlikely that changes in assumptions would occur in isolation from one another. The weighted averages are at nominal terms and based on market expectations at December 31, 2024.
Financial Statements and Supplements | Notes to the Consolidated Financial Statements continued
24. Retirement benefits continued
| | | | | | | | | | | | | | | | | | | | | | | | | | |
| | | | $ million, except where indicated |
| | | | Effect of using alternative assumptions |
| Assumptions used
at nominal rates | | Increase/(decrease) in defined benefit obligations |
| Dec 31, 2024 | Dec 31, 2023 | | Range
of assumptions | Dec 31, 2024 | Dec 31, 2023 |
| Rate of increase in pensionable remuneration [A] | 3.9% | 3.9% | | -1% to +1% | (421) | 469 | (828) | 915 |
of which the Netherlands [B] | 3.3% | 3.3% | | | | | | |
of which the UK | 3.5% | 4.1% | | | | | | |
of which the USA | 4.6% | 4.6% | | | | | | |
| Rate of increase in pensions in payment | 2.0% | 1.9% | | -1% to +1% | (4,978) | 6,045 | (5,599) | 6,713 |
| of which the Netherlands | 2.1% | 2.4% | | | | | | |
of which the UK | 2.9% | 2.8% | | | | | | |
of which the USA | —% | —% | | | | | | |
| Discount rate for pension plans | 4.5% | 4.1% | | -1% to +1% | 8,641 | (6,925) | 10,560 | (8,472) |
| of which the Netherlands | 3.5% | 3.3% | | | | | | |
of which the UK | 5.5% | 4.6% | | | | | | |
of which the USA | 5.6% | 4.9% | | | | | | |
Inflation rate for defined benefit obligation [C] | 2.1% | 2.0% | | -1% to +1% | (5,328) | 6,494 | (6,034) | 7,300 |
| of which the Netherlands | 2.1% | 2.4% | | | | | | |
of which the UK | 3.0% | 2.9% | | | | | | |
| | | | | | | | |
| Expected age at death for persons aged 60: | | | | | | | | |
| Men | 88 years | 88 years | | -1 year to +1 year | (970) | 981 | (1,166) | 1,143 |
| of which the Netherlands | 88 years | 88 years | | | | | | |
of which the UK | 87 years | 87 years | | | | | | |
| of which USA | 88 years | 87 years | | | | | | |
| Women | 89 years | 89 years | | -1 year to +1 year | (850) | 874 | (1,006) | 1,041 |
| of which the Netherlands | 90 years | 90 years | | | | | | |
of which the UK | 89 years | 89 years | | | | | | |
of which the USA | 89 years | 89 years | | | | | | |
Rate of increase in health care costs [D] | 8.0% | 7.0% | | -1% to +1% | (295) | 359 | (338) | 422 |
Discount rate for health care plans [D] | 6.0% | 5.6% | | -1% to +1% | 390 | (314) | 457 | (358) |
[A]Based on active members.
[B]Decrease is mainly due to the Netherlands (WTP).
[C]Excluding US funds in the weighted average inflation rate, because of the insignificant impact on the defined benefit obligation.
[D]Mainly related to post-retirement health care benefits in the USA.
Financial Statements and Supplements | Notes to the Consolidated Financial Statements continued
25. Decommissioning and other provisions
| | | | | | | | | | | | | | | | | | | | | | | |
| $ million |
| Decommissioning
and restoration | Legal | Onerous contracts | Environmental | Redundancy | Other | Total |
| At January 1, 2024 | | | | | | | |
| Current | 1,296 | 508 | 224 | 318 | 367 | 1,328 | 4,041 |
| Non-current | 18,157 | 1,548 | 880 | 638 | 123 | 1,185 | 22,531 |
| 19,453 | 2,056 | 1,104 | 956 | 490 | 2,513 | 26,572 |
| Additions | 629 | 261 | 184 | 125 | 1,258 | 665 | 3,122 |
| Amounts charged against provisions | (1,034) | (409) | (227) | (148) | (354) | (316) | (2,488) |
| Accretion expense | 830 | 76 | 35 | 14 | 3 | 9 | 967 |
| Disposals and liabilities classified as held for sale | (3,115) | — | — | (3) | 2 | 11 | (3,105) |
| Remeasurements and other movements | 1,994 | (161) | (33) | (39) | (241) | (505) | 1,015 |
| Currency translation differences | (273) | (2) | (1) | (22) | (37) | (52) | (387) |
| (969) | (235) | (42) | (73) | 631 | (188) | (876) |
| At December 31, 2024 | | | | | | | |
| Current | 1,356 | 457 | 238 | 267 | 932 | 1,219 | 4,469 |
| Non-current | 17,128 | 1,364 | 824 | 616 | 189 | 1,106 | 21,227 |
| 18,484 | 1,821 | 1,062 | 883 | 1,121 | 2,325 | 25,696 |
| | | | | | | |
| At January 1, 2023 | | | | | | | |
| Current | 856 | 224 | 277 | 321 | 171 | 1,061 | 2,910 |
| Non-current | 19,429 | 1,177 | 1,207 | 730 | 153 | 1,149 | 23,845 |
| 20,285 | 1,401 | 1,484 | 1,051 | 324 | 2,210 | 26,755 |
| Additions | 617 | 853 | 26 | 208 | 424 | 806 | 2,934 |
| Amounts charged against provisions | (777) | (195) | (345) | (233) | (154) | (203) | (1,907) |
| Accretion expense | 643 | 21 | 24 | 13 | 4 | 9 | 714 |
| Disposals and liabilities classified as held for sale | (60) | (1) | — | (16) | (1) | (1) | (79) |
| Remeasurements and other movements | (1,499) | (24) | (83) | (74) | (113) | (321) | (2,114) |
| Currency translation differences | 244 | 1 | (2) | 7 | 6 | 13 | 269 |
| (832) | 655 | (380) | (95) | 166 | 303 | (183) |
| At December 31, 2023 | | | | | | | |
| Current | 1,296 | 508 | 224 | 318 | 367 | 1,328 | 4,041 |
| Non-current | 18,157 | 1,548 | 880 | 638 | 123 | 1,185 | 22,531 |
| 19,453 | 2,056 | 1,104 | 956 | 490 | 2,513 | 26,572 |
The amount and timing of settlement in respect of these provisions are uncertain and dependent on various factors that are not always within management's control. Reviews of estimated future decommissioning and restoration costs and the discount rate applied are carried out regularly. The discount rate applied at December 31, 2024, was 4.5% (2023: 4.5%).
In 2024, there was a decrease of $3,105 million in provisions due to disposals and liabilities classified as held for sale. Of this total $3,053 million relate to liabilities classified as held for sale (see Note 19).
An increase of 0.5% or a decrease of 0.5% in the discount rate could result in a decrease of $0.9 billion (2023: $0.9 billion) or an increase of $1.0 billion (2023: $1.0 billion) in decommissioning and restoration provisions, respectively. Where applicable, the associated increase in the carrying amount of the related asset would be tested for impairment.
Other provisions at December 31, 2024, include amounts recognised in respect of employee benefits.
The decommissioning and restoration provision at December 31, 2024, is expected to be utilised within:
| | | | | | | | | | | |
| | | $ million |
| | | Dec 31, 2024 |
| Between 1 to 5 years | | | 5,127 |
| Between 6 to 10 years | | | 3,486 |
| 11 years and later | | | 9,871 |
| Total | | | 18,484 |
Financial Statements and Supplements | Notes to the Consolidated Financial Statements continued
26. Financial instruments
Financial instruments in the Consolidated Balance Sheet include investments in securities (see Note 15), trade and other receivables (see Note 16), cash and cash equivalents (see Note 18), trade and other payables (see Note 20), debt (see Note 21) and derivative contracts.
| | | | | | | | | | | | | | | | | |
| | | | | $ million |
| | Carrying amount |
| Note | Amortised cost | Fair value through profit or loss | Fair value through other comprehensive income | Total carrying amount |
| Financial assets | | | | | |
| Investments in securities | 15 | 37 | 97 | 2,121 | 2,255 |
| Trade and other receivables | 16 | 51,878 | | | 51,878 |
| Derivative financial instruments (non-designated) | | | 10,007 | | 10,007 |
| Derivative hedging instruments (designated) | | | 40 | | 40 |
| | 51,915 | 10,144 | 2,121 | 64,180 |
| Cash and cash equivalents | 18 | | | | 39,110 |
At December 31, 2024 | | 51,915 | 10,144 | 2,121 | 103,290 |
| Financial liabilities | | | | | |
| Debt | 21 | 48,376 | | | 48,376 |
| Trade and other payables | 20 | 63,983 | | | 63,983 |
| Derivative financial instruments (non-designated) | | | 7,065 | | 7,065 |
| Derivative financial instruments (designated) | | | 2,511 | | 2,511 |
At December 31, 2024 | | 112,359 | 9,576 | | 121,935 |
| | | | | | | | | | | | | | | | | |
| | | | | $ million |
| | Carrying amount |
| Note | Amortised cost | Fair value through profit or loss | Fair value through other comprehensive income | Total carrying amount |
| Financial assets | | | | | |
| Investments in securities | 15 | 28 | 328 | 2,890 | 3,246 |
| Trade and other receivables | 16 | 59,571 | | | 59,571 |
Derivative financial instruments (non-designated) | | | 15,708 | | 15,708 |
Derivative hedging instruments (designated) | | | 191 | | 191 |
| | 59,599 | 16,227 | 2,890 | 78,716 |
| Cash and cash equivalents | 18 | | | | 38,774 |
At December 31, 2023 | | 59,599 | 16,227 | 2,890 | 117,490 |
| Financial liabilities | | | | | |
| Debt | 21 | 53,832 | | | 53,832 |
| Trade and other payables | 20 | 71,340 | | | 71,340 |
Derivative financial instruments (non-designated) | | | 9,773 | | 9,773 |
Derivative financial instruments (designated) | | | 2,057 | | 2,057 |
At December 31, 2023 | | 125,172 | 11,830 | | 137,002 |
Financial Statements and Supplements | Notes to the Consolidated Financial Statements continued
26. Financial instruments continued
Risks
In the normal course of business, financial instruments of various kinds are used for the purposes of managing exposure to interest rate, foreign exchange and commodity price movements.
Treasury standards are applicable to all subsidiaries and each subsidiary is required to adopt a treasury policy consistent with these standards. These policies cover: financing structure; interest rate and foreign exchange risk management; insurance; counterparty risk management; and use of derivative contracts. Wherever possible, treasury operations are carried out through specialist regional organisations without removing from each subsidiary the responsibility to formulate and implement appropriate treasury policies.
Apart from forward foreign exchange contracts to meet known commitments, the use of derivative contracts by most subsidiaries is not permitted by their treasury policy.
Other than in exceptional cases, the use of external derivative contracts is confined to specialist trading and central treasury organisations that have appropriate skills, experience, supervision, control and reporting systems.
Shell's operations expose it to market, credit and liquidity risk, as described below.
Market risk
Market risk is the possibility that changes in interest rates, foreign exchange rates or commodity prices will adversely affect the value of assets, liabilities or expected future cash flows.
Interest rate risk
Most debt is raised from central borrowing programmes. Shell's policy is to have debt principally denominated in dollars and to retain a balanced exposure to fixed and floating rates over time. Shell has issued a significant amount of fixed rate debt in recent years, taking advantage of historically low interest rates. As a result, the majority of the debt portfolio at December 31, 2024, is fixed.
The financing of most subsidiaries is structured on a floating-rate basis, and any further interest rate risk management is only applied under exceptional circumstances.
On the basis of the floating-rate net cash position at December 31, 2024, (both issued and hedged), and assuming other factors (principally foreign exchange rates and commodity prices) remained constant and that no further interest rate management action was taken, an increase in interest rates of 1% would have increased 2024 income before taxation by $268 million (2023: $226 million increase).
The carrying amounts and maturities of debt and borrowing facilities are presented in Note 21. Interest expense is presented in Note 10.
Foreign exchange risk
Many of the markets in which Shell operates are priced, directly or indirectly, in dollars. As a result, the functional currency of most Integrated Gas and Upstream entities and those with significant cross-border business is the dollar. For Chemicals and Products entities, the functional currency is typically the local currency. Consequently, Shell is exposed to varying levels of foreign exchange risk: when an entity enters into transactions that are not denominated in its functional currency; when foreign currency monetary assets and liabilities are translated at the balance sheet date; and as a result of holding net investments in operations that are not dollar-functional. Each entity is required to adopt treasury policies that are designed to measure and manage its foreign exchange exposures by reference to its functional currency.
Financial Statements and Supplements | Notes to the Consolidated Financial Statements continued
26. Financial instruments continued
Foreign exchange gains and losses arise in the normal course of business from the recognition of receivables and payables and other monetary items in currencies other than an entity's functional currency. Foreign exchange risk may also arise in connection with capital expenditure. For major projects, an assessment is made at the final investment decision stage of whether to hedge any resulting exposure.
Assuming other factors (principally interest rates and commodity prices) remained constant and that no further foreign exchange risk management actions were taken, a 10% appreciation against the dollar at December 31 of the main currencies to which Shell is exposed would have had the following effects:
| | | | | | | | | | | | | | | | | |
| $ million |
| Increase/(decrease)
in income before taxation | | Increase in net assets |
| 2024 | 2023 | | 2024 | 2023 |
| 10% appreciation against the dollar of: | | | | | |
| Sterling | (69) | (270) | | 789 | 1,022 |
| Euro | 98 | (46) | | 2,410 | 2,434 |
| Malaysian ringgit | 34 | 49 | | 274 | 279 |
| Australian dollar | (103) | (129) | | 625 | 780 |
| Canadian dollar | 20 | 9 | | 1,353 | 1,392 |
The above sensitivity information was calculated by reference to carrying amounts of assets and liabilities at December 31 only. The effect on income before taxation arises in connection with monetary balances denominated in currencies other than an entity's functional currency; the effect on net assets arises principally from the translation of assets and liabilities of entities that are not dollar-functional.
Foreign exchange gains and losses included in income are presented in Note 9.
Commodity price risk
Certain subsidiaries have a mandate to trade crude oil, natural gas, LNG, refined products, chemical feedstocks, power and environmental certificates, and to use commodity derivative contracts (forwards, futures, swaps and options) as a means of managing price and timing risks arising from this trading activity. In effecting these transactions, the entities concerned operate within procedures and policies designed to ensure that risks are managed within authorised limits. A department that is independent from Shell's traders monitors market risk exposures daily.
Value-at-risk (VAR) techniques based on variance/covariance or Monte Carlo simulation models are used to make a statistical assessment of the market risk arising from possible future changes in market values for commodity positions held by these subsidiaries over a 1-day holding period and within a 95% confidence level. The calculation of potential changes in fair value takes into account positions, the history of price movements and the correlation of these price movements. Models are regularly reviewed against actual fair value movements to ensure integrity is maintained. The VAR average and year-end positions in respect of commodities traded in liquid markets, which are presented in the table below, are calculated on a diversified basis in order to reflect the effect of offsetting risk within combined portfolios.
| | | | | | | | | | | | | | | | | |
| | | | | $ million |
| | 2024 | | | 2023 |
| Average | Year-end | | Average | Year-end |
| Global oil | 29 | 22 | | 43 | 25 |
| North America gas and power | 15 | 16 | | 13 | 10 |
| Europe gas and power | 13 | 13 | | 31 | 12 |
| Australia gas and power | 3 | 3 | | 4 | 2 |
| Environmental certificates | 5 | 2 | | 9 | 4 |
Furthermore, commodity derivative hedge contracts are used to partially mitigate price volatility on future LNG sales and purchases.
As contracts to buy and sell physical LNG are accounted for on an accrual basis (see Note 2) and commodity derivatives are accounted for on a fair-value basis, this creates an accounting mismatch over periods. The fair value accounting of commodity derivatives can result in gains or losses in the Consolidated Statement of Income. These derivative contracts are based on a mix of European and North American gas price indices, global crude price indices and Asian LNG price indices. In previous years, Shell has seen high volatility in these markets. On that basis, a sensitivity analysis has been performed for a 50% price increase or decrease of this basket of derivative contracts at year-end 2024, which would result in a pre-tax loss or gain of $0.6 billion in the Consolidated Statement of Income (2023: $1.5 billion pre-tax gain or loss), whereas the same sensitivity analysis applied to the average exposures for the period was a gain or loss of $0.3 billion (2023: $0.8 billion pre-tax).
Financial Statements and Supplements | Notes to the Consolidated Financial Statements continued
26. Financial instruments continued
Credit risk
Comprehensive policies are in place to ensure that credit risk is appropriately managed and remains within risk appetite. These policies include requirements for assessment of internal credit ratings, the assignment of credit limits based on counterparty creditworthiness, and monitoring of exposure against these credit limits. Credit information is regularly shared between business and finance functions, with dedicated teams in place to quickly identify and respond to cases of credit deterioration. Mitigation measures are defined and implemented for higher-risk business partners and customers, and include shortened payment terms, collateral, credit insurance, or other security posting and timely collections.
Surplus cash is invested in a range of short-dated, secure and liquid instruments including short-term bank deposits, money market funds, reverse repos and similar instruments. The portfolio of these investments is diversified to avoid concentrating risk in any one instrument, country or counterparty. Management monitors the investments regularly and adjusts the investment portfolio in light of new market information where necessary to ensure credit risk is effectively diversified.
In commodity trading, additional requirements are established to manage credit risk. Credit checks are performed by a department independent of traders, and are undertaken before contractual commitment. In addition, a defined portfolio credit risk appetite is in place to manage credit risk concentrations. It includes a set of thresholds and alerts set at different portfolio levels (e.g. country, industry sector, creditworthiness). Utilisation against these thresholds, including identification of credit risk concentrations with particular counterparties, is actively monitored, and actions are taken to ensure compliance where appropriate. There were no material concentrations of credit risk, with individual customers or geographically, at December 31, 2024.
Shell routinely enters into offsetting, master netting and similar arrangements with trading and other counterparties to manage credit risk. Where there is a legally enforceable right of offset under such arrangements and Shell has the intention to settle on a net basis or realise the asset and settle the liability simultaneously, the net asset or liability is recognised in the Consolidated Balance Sheet, otherwise assets and liabilities are presented gross. These amounts, as presented net and gross within trade and other receivables, trade and other payables and derivative financial instruments in the Consolidated Balance Sheet at December 31, were as follows:
| | | | | | | | | | | | | | | | | | | | | | | |
| | | | | | | $ million |
| | Amounts offset | | | Amounts not offset | |
| Gross amounts
before offset | Amounts
offset | Net amounts
as presented | | Cash collateral
received/pledged | Other offsetting
instruments | Net amounts |
| Assets: | | | | | | | |
| Within trade receivables | 18,569 | 11,452 | 7,117 | | 58 | 227 | 6,832 |
| Within derivative financial instruments | 12,200 | 4,490 | 7,710 | | 951 | 1,730 | 5,029 |
| Liabilities: | | | | | | | |
| Within trade payables | 17,106 | 11,449 | 5,657 | | 121 | 227 | 5,309 |
| Within derivative financial instruments | 12,760 | 4,490 | 8,270 | | 2,049 | 1,730 | 4,491 |
| | | | | | | | | | | | | | | | | | | | | | | |
| | | | | | | $ million |
| | | Amounts offset | | | Amounts not offset | |
| Gross amounts
before offset | Amounts
offset | Net amounts
as presented | | Cash collateral
received/pledged | Other offsetting instruments | Net amounts |
| Assets: | | | | | | | |
| Within trade receivables | 20,810 | 12,350 | 8,460 | | 18 | 356 | 8,086 |
| Within derivative financial instruments | 26,166 | 13,140 | 13,026 | | 1,688 | 2,616 | 8,722 |
| Liabilities: | | | | | | | |
| Within trade payables | 18,423 | 12,351 | 6,072 | | 69 | 356 | 5,647 |
| Within derivative financial instruments | 23,037 | 13,163 | 9,874 | | 2,040 | 2,636 | 5,198 |
Amounts not offset principally relate to contracts where the intention to settle on a net basis was not clearly established at December 31.
Financial Statements and Supplements | Notes to the Consolidated Financial Statements continued
26. Financial instruments continued
The carrying amount of financial assets pledged as collateral for liabilities or contingent liabilities at December 31, 2024, presented within trade and other receivables, was $2,519 million (2023: $3,437 million). The carrying amount of collateral held at December 31, 2024, presented within trade and other payables, was $581 million (2023: $1,404 million). In addition, Shell has utilised guarantees and letters of credit as non-cash collateral to cover margining requirements of $1,359 million as at December 31, 2024 (2023: $1,506 million). Collateral mainly relates to initial margins held with commodity exchanges/brokers and over-the-counter counterparty variation margins. Some derivative contracts are fully cash collateralised, thereby eliminating both counterparty risk and the Group's own non-performance risk.
Liquidity risk
Liquidity risk is the risk that suitable sources of funding for Shell's business activities may not be available. Management believes that it has access to sufficient cash and cash equivalents, debt funding sources (capital markets) and to undrawn committed borrowing facilities to meet foreseeable requirements. Information about borrowing facilities is presented in Note 21.
Derivative contracts and hedges
Derivative contracts such as forwards, futures, options and swaps are used principally to hedge or mitigate risks arising from interest rate changes, currency fluctuations and commodity price volatility. However, hedge accounting is not always applied, therefore, movements in the carrying amounts of derivative contracts that are recognised in income may not be matched in the same period by the recognition of the income effects of the related hedged items.
In the course of trading operations, certain contracts are entered into for delivery of commodities that are accounted for as derivatives. The resulting price exposures are managed by entering into related derivative contracts.
Derivative contracts classified below as "other contracts" include certain contracts for the sale or purchase of commodities and others containing embedded derivatives. These contracts are required to be recognised at fair value because of pricing or delivery conditions, even though they were entered into to meet operational requirements.
For certain commodity derivatives contracts, carrying amounts cannot be derived from quoted market prices or other observable inputs, in which case fair value is estimated using valuation techniques, such as Black-Scholes; option spread models; and extrapolation, using quoted spreads with assumptions developed internally based on observable market activity.
Carrying amounts, maturities and hedges
The carrying amounts of derivative contracts at December 31, designated and not designated as hedging instruments for hedge accounting purposes, were as follows:
| | | | | | | | | | | | | | | | | | | | | | | | | | |
| | | | | | | | $ million |
| Assets | | Liabilities | |
| Designated | Not
designated | Total | | Designated | Not
designated | Total | Net |
| Interest rate swaps | 7 | 1 | 8 | | 64 | — | 64 | (56) |
| Forward foreign exchange contracts | — | 682 | 682 | | — | 379 | 379 | 303 |
| Currency swaps and options | 33 | 5 | 38 | | 2,447 | 42 | 2,489 | (2,451) |
| Commodity derivatives | — | 9,204 | 9,204 | | — | 6,630 | 6,630 | 2,574 |
| Other contracts | — | 115 | 115 | | — | 14 | 14 | 101 |
| Total | 40 | 10,007 | 10,047 | | 2,511 | 7,065 | 9,576 | 471 |
| | | | | | | | | | | | | | | | | | | | | | | | | | |
| | | | | | | | $ million |
| Assets | | Liabilities | |
| Designated | Not
designated | Total | | Designated | Not
designated | Total | Net |
| Interest rate swaps | 14 | 2 | 16 | | 98 | — | 98 | (82) |
| Forward foreign exchange contracts | — | 697 | 697 | | — | 592 | 592 | 105 |
| Currency swaps and options | 177 | — | 177 | | 1,959 | 13 | 1,972 | (1,795) |
| Commodity derivatives | — | 14,783 | 14,783 | | — | 9,161 | 9,161 | 5,622 |
| Other contracts | — | 226 | 226 | | — | 7 | 7 | 219 |
| Total | 191 | 15,708 | 15,899 | | 2,057 | 9,773 | 11,830 | 4,069 |
Financial Statements and Supplements | Notes to the Consolidated Financial Statements continued
26. Financial instruments continued
Net gains before tax on derivative contracts, excluding those designed as hedges, were $1,314 million in 2024 (2023: $5,189 million gains; 2022: $1,331 million gains).
Certain contracts, mainly to hedge price risk relating to forecast commodity transactions, were designated in cash flow hedging relationships and are presented after the offset of related margin balances with exchanges. Contracts to hedge foreign exchange risks were also designated in cash flow hedging relationships and the net carrying amount of these contracts at December 31, 2024, was a liability of $579 million (2023: $373 million liability). See Note 29 for the accumulated balance recognised within other comprehensive income.
Certain interest rate and currency swaps were designated in fair value hedges, principally in respect of debt for which the net carrying amount of the related derivative contracts, net of accrued interest, at December 31, 2024, was a liability of $1,872 million (2023: $1,441 million liability).
At December 31, 2024, no debt instruments (2023: nil) were designated as hedges of net investments in foreign operations, relating to the foreign exchange risk arising between certain intermediate holding companies and their subsidiaries. See Note 29 for the accumulated balance recognised within other comprehensive income.
The following table compares contractual maturities of derivative liabilities at December 31 with their carrying amounts in the Consolidated Balance Sheet.
| | | | | | | | | | | | | | | | | | | | | | | | | | | | | |
| | | | | | | | | $ million |
| Contractual maturities | | |
| Less than
1 year | Between
1 and 2
years | Between
2 and 3
years | Between
3 and 4
years | Between
4 and 5
years | 5 years
and later | Total | Difference
from carrying
amount [A] | Carrying
amount |
| Interest rate swaps | 20 | 16 | 16 | 16 | — | — | 68 | (4) | 64 |
| Forward foreign exchange contracts | 393 | 84 | 3 | (3) | — | — | 477 | (98) | 379 |
| Currency swaps and options | 925 | 693 | 627 | 423 | 316 | 1,008 | 3,992 | (1,503) | 2,489 |
| Commodity derivatives | 4,345 | 1,088 | 524 | 326 | 184 | 458 | 6,925 | (295) | 6,630 |
| Other contracts | 6 | 5 | 2 | — | — | — | 13 | 1 | 14 |
| Total | 5,689 | 1,886 | 1,172 | 762 | 500 | 1,466 | 11,475 | (1,899) | 9,576 |
[A]Mainly related to the effect of discounting.
| | | | | | | | | | | | | | | | | | | | | | | | | | | | | |
| | | | | | | | | $ million |
| Contractual maturities | | |
| Less than
1 year | Between
1 and 2
years | Between
2 and 3
years | Between
3 and 4
years | Between
4 and 5
years | 5 years
and later | Total | Difference
from carrying
amount [A] | Carrying
amount |
| Interest rate swaps | 78 | 9 | 3 | 3 | 5 | — | 98 | — | 98 |
| Forward foreign exchange contracts | 465 | 77 | 25 | 1 | — | (3) | 565 | 27 | 592 |
| Currency swaps and options | 551 | 609 | 521 | 392 | 186 | 859 | 3,118 | (1,146) | 1,972 |
| Commodity derivatives | 5,767 | 1,902 | 799 | 381 | 225 | 597 | 9,671 | (510) | 9,161 |
| Other contracts | 2 | 4 | 2 | — | — | — | 8 | (1) | 7 |
| Total | 6,863 | 2,601 | 1,350 | 777 | 416 | 1,453 | 13,460 | (1,630) | 11,830 |
[A]Mainly related to the effect of discounting.
Financial Statements and Supplements | Notes to the Consolidated Financial Statements continued
26. Financial instruments continued
Fair value measurements
The net carrying amounts of derivative contracts held at December 31 categorised according to the predominant source and nature of inputs used in determining the fair value of each contract were as follows:
| | | | | | | | | | | | | | |
| | | | $ million |
| Prices in active markets for identical
assets/liabilities | Other
observable
inputs | Unobservable
inputs | Total |
| Interest rate swaps | — | (56) | — | (56) |
| Forward foreign exchange contracts | — | 303 | — | 303 |
| Currency swaps and options | — | (2,451) | — | (2,451) |
| Commodity derivatives | 44 | 487 | 2,043 | 2,574 |
| Other contracts | — | 107 | (6) | 101 |
| Total | 44 | (1,610) | 2,037 | 471 |
| | | | | | | | | | | | | | |
| | | | $ million |
| Prices in active markets for identical
assets/liabilities | Other
observable
inputs | Unobservable
inputs | Total |
| Interest rate swaps | — | (82) | — | (82) |
| Forward foreign exchange contracts | — | 105 | — | 105 |
| Currency swaps and options | — | (1,795) | — | (1,795) |
| Commodity derivatives | (39) | 3,191 | 2,470 | 5,622 |
| Other contracts | — | 223 | (4) | 219 |
| Total | (39) | 1,642 | 2,466 | 4,069 |
| | |
| Net carrying amounts of derivative contracts measured using predominantly unobservable inputs |
| | | | | | | | |
| | $ million |
| 2024 | 2023 |
| At January 1 | 2,466 | 1,909 |
Net (losses)/gains recognised in revenue | (191) | 576 |
| Purchases | 310 | 271 |
| Sales | (363) | (185) |
| Settlements | — | (125) |
| Recategorisations (net) | (127) | 25 |
| Currency translation differences | (58) | (5) |
| At December 31 | 2,037 | 2,466 |
Included in net losses recognised in revenue in 2024 were unrealised net gains totalling $591 million relating to assets and liabilities held at December 31, 2024 (2023: $797 million gains).
Unrecognised day one gains or losses
Certain long-term commodity contracts extend to periods where observable pricing data are limited and their value may include estimates. Where this is more than an insignificant part of the overall contract valuation, any gains or losses will be deferred. Valuation techniques are further described in Note 2. The unrecognised gains on these derivative contracts at December 31, 2024, were as follows:
| | | | | | | | |
| | $ million |
| 2024 | 2023 |
| At January 1 | 1,607 | 1,620 |
| Movements | (862) | (13) |
| At December 31 | 745 | 1,607 |
Financial Statements and Supplements | Notes to the Consolidated Financial Statements continued
27. Share capital
Issued and fully paid ordinary shares of €0.07 each
| | | | | | | | | |
| Number of shares | Nominal value $ million | |
| | | |
| At January 1, 2024 | 6,524,109,049 | 544 | |
| Repurchases of shares | (409,077,891) | (34) | |
| At December 31, 2024 | 6,115,031,158 | 510 | |
| At January 1, 2023 | 7,003,503,393 | 584 | |
| | | |
| | | |
| | | |
Repurchases of shares | (479,394,344) | (40) | |
| At December 31, 2023 | 6,524,109,049 | 544 | |
At the Company's Annual General Meeting (AGM) on May 21, 2024, the Board was authorised to allot ordinary shares in the Company, and to grant rights to subscribe for or to convert any security into ordinary shares in the Company, up to an aggregate nominal amount of approximately €150 million (representing approximately 2,147 million ordinary shares of €0.07 each), and to list such shares or rights on any stock exchange. This authority expires at the earlier of the close of business on August 20, 2025, and the end of the AGM to be held in 2025, unless previously renewed, revoked or varied by the Company in a general meeting.
At the May 21, 2024, AGM, shareholders granted the Company the authority to repurchase (i) up to 644.2 million ordinary shares "on-market" (excluding any treasury shares), less the number of ordinary shares purchased or committed to be purchased in terms of the buyback contracts ("off-market"), made under the authority in (ii); and (ii) up to 644.2 million ordinary shares off-market, less any on-market purchases made under the authority in (i).
In the case of both on-market and off-market purchases of the ordinary shares, the minimum price, exclusive of expenses, which may be paid for an ordinary share is €0.07 and the maximum price, exclusive of expenses, which may be paid for an ordinary share is the higher of: (i) an amount equal to 5% above the average market value for an ordinary share for the five business days immediately preceding the date of the purchase; and (ii) the higher of the price of the last independent trade and the highest current independent bid in relation to ordinary shares on the trading venues where the purchase is carried out. The authorities for both on-market and off-market purchases of the ordinary shares will expire at the earlier of the close of business on August 20, 2025, and the end of the AGM of the Company to be held in 2025. Ordinary shares purchased by the Company pursuant to these authorities will either be cancelled or held in treasury. Treasury shares are shares in the Company which are owned by the Company itself.
28. Share-based compensation plans and shares held in trust
| | |
| Share-based compensation expense |
| | | | | | | | | | | |
| $ million |
| 2024 | 2023 | 2022 |
| Equity-settled [A] | 732 | 700 | 807 |
| | | |
[A]On an incidental basis awards may be cash-settled, where an equity settlement is not possible under local regulations.
The principal share-based employee compensation plans are the PSP and LTIP. Awards of shares and American Depositary Shares (ADS) of the Company under the PSP and LTIP are granted upon certain conditions to eligible employees. The actual number of shares that may vest ranges from 0% to 200% of the awards, depending on the outcomes of prescribed performance conditions over a three-year period beginning on January 1 of the award year.
| | | | | | | | | | | | | |
| | | Number of ordinary shares (million) | Number of ADSs
(million) | Weighted average remaining contractual life (years) |
| At January 1, 2024 | | | 58 | 10 | 0.9 |
| Granted | | | 20 | 3 | |
| Vested | | | (26) | (4) | |
| Forfeited | | | (3) | — | |
| At December 31, 2024 | | | 49 | 9 | 0.9 |
| At January 1, 2023 | | | 58 | 10 | 1.1 |
| | | | | |
| Granted | | | 19 | 3 | |
| Vested | | | (17) | (3) | |
| Forfeited | | | (2) | — | |
| At December 31, 2023 | | | 58 | 10 | 0.9 |
Financial Statements and Supplements | Notes to the Consolidated Financial Statements continued
28. Share-based compensation plans and shares held in trust continued
Other plans offer eligible employees opportunities to acquire shares and ADSs of the Company or receive cash benefits measured by reference to the Company's share price.
Shell employee share ownership trusts and trust-like entities purchase the Company's shares in the open market to meet delivery commitments under employee share plans. At December 31, 2024, they held a total of 22.6 million ordinary shares (2023: 24.2 million) and 4.1 million ADS (2023: 6.8 million).
29. Other reserves
| | |
Other reserves attributable to Shell plc shareholders |
| | | | | | | | | | | | | | | | | | | | |
| $ million |
| Merger
reserve | Share
premium
reserve | Capital
redemption
reserve | Share plan
reserve | Accumulated
other
comprehensive
income | Total |
| At January 1, 2024 | 37,298 | 154 | 236 | 1,308 | (17,851) | 21,145 |
| Other comprehensive income attributable to Shell plc shareholders | — | — | — | — | (1,715) | (1,715) |
| Transfer from other comprehensive income | — | — | — | — | 193 | 193 |
| Repurchases of shares | — | — | 34 | — | — | 34 |
| Share-based compensation | — | — | — | 109 | — | 109 |
| At December 31, 2024 | 37,298 | 154 | 270 | 1,417 | (19,373) | 19,766 |
| At January 1, 2023 | 37,298 | 154 | 196 | 1,140 | (17,656) | 21,132 |
| Other comprehensive income attributable to Shell plc shareholders | — | — | — | — | (83) | (83) |
| Transfer from other comprehensive income | — | — | — | — | (112) | (112) |
| Repurchases of shares | — | — | 40 | — | — | 40 |
| Share-based compensation | — | — | — | 168 | — | 168 |
| At December 31, 2023 | 37,298 | 154 | 236 | 1,308 | (17,851) | 21,145 |
| At January 1, 2022 | 37,298 | 154 | 139 | 964 | (19,646) | 18,909 |
| Other comprehensive loss attributable to Shell plc shareholders | — | — | — | — | 2,024 | 2,024 |
| Transfer from other comprehensive income | — | — | — | — | (34) | (34) |
| Repurchases of shares | — | — | 57 | — | — | 57 |
| Share-based compensation | — | — | — | 176 | — | 176 |
| At December 31, 2022 | 37,298 | 154 | 196 | 1,140 | (17,656) | 21,132 |
The merger reserve and share premium reserve were established as a consequence of the Company becoming the single parent company of Royal Dutch Petroleum Company and The "Shell" Transport and Trading Company, plc, now The Shell Transport and Trading Company Limited, in 2005. The merger reserve increased in 2016 following the issuance of shares for the acquisition of BG Group plc.
The capital redemption reserve was established in connection with repurchases of shares of the Company.
The share plan reserve is in respect of equity-settled share-based compensation plans (see Note 28). The movement comprises the net of the charge for the year and the release as a result of vested awards.
Financial Statements and Supplements | Notes to the Consolidated Financial Statements continued
29. Other reserves continued
Accumulated other comprehensive income comprises the following:
| | |
Accumulated other comprehensive income attributable to Shell plc shareholders |
| | | | | | | | | | | | | | | | | | | | | | | | | | |
| $ million |
| Currency
translation
differences | Equity
instruments
remeasurements | Debt
instruments
remeasurements | Cash flow
hedging (losses)/gains | Net investment
hedging (losses)/gains | Deferred
cost of
hedging | Retirement
benefits
remeasurements | Total |
| At January 1, 2024 | (11,213) | 73 | (34) | (451) | (2,008) | (174) | (4,044) | (17,851) |
| Recognised in other comprehensive income | (4,574) | (7) | 20 | 211 | — | (137) | 1,854 | (2,633) |
| Reclassified to income | 1,256 | — | 16 | 29 | — | 24 | — | 1,325 |
| Reclassified to the balance sheet | — | — | (11) | 32 | — | — | — | 21 |
| Reclassified to retained earnings | — | (182) | — | — | — | — | 375 | 193 |
| Tax on amounts recognised/reclassified | 70 | 35 | (20) | (56) | — | 40 | (447) | (378) |
| Total, net of tax | (3,248) | (154) | 5 | 216 | — | (73) | 1,782 | (1,472) |
| Share of joint ventures and associates | (42) | 43 | — | (76) | — | — | 4 | (71) |
| Other comprehensive (loss)/income for the period | (3,290) | (111) | 5 | 140 | — | (73) | 1,786 | (1,543) |
| Less: non-controlling interest | 21 | (2) | — | — | — | — | 2 | 21 |
| Attributable to Shell plc shareholders | (3,269) | (113) | 5 | 140 | — | (73) | 1,788 | (1,522) |
| At December 31, 2024 | (14,482) | (40) | (29) | (311) | (2,008) | (247) | (2,256) | (19,373) |
| At January 1, 2023 | (12,590) | 487 | (75) | (524) | (1,964) | (26) | (2,964) | (17,656) |
| Recognised in other comprehensive income | 1,393 | (67) | 33 | (196) | (44) | (273) | (1,088) | (242) |
| Reclassified to income | 1 | — | 9 | 162 | — | 61 | — | 233 |
| Reclassified to the balance sheet | — | — | (1) | 117 | — | 1 | — | 117 |
| Reclassified to retained earnings | — | (112) | — | — | — | — | — | (112) |
| Tax on amounts recognised/reclassified | 3 | (32) | — | (12) | — | 63 | 5 | 27 |
| Total, net of tax | 1,397 | (211) | 41 | 71 | (44) | (148) | (1,083) | 23 |
| Share of joint ventures and associates | 16 | (202) | — | 2 | — | — | 1 | (183) |
| Other comprehensive income/(loss) for the period | 1,413 | (413) | 41 | 73 | (44) | (148) | (1,082) | (160) |
| Less: non-controlling interest | (36) | (1) | — | — | — | — | 2 | (35) |
| Attributable to Shell plc shareholders | 1,377 | (414) | 41 | 73 | (44) | (148) | (1,080) | (195) |
| At December 31, 2023 | (11,213) | 73 | (34) | (451) | (2,008) | (174) | (4,044) | (17,851) |
| At January 1, 2022 | (9,563) | 1,294 | 3 | (536) | (2,144) | (226) | (8,474) | (19,646) |
| Recognised in other comprehensive income | (3,422) | (524) | (90) | 426 | 180 | 64 | 6,982 | 3,616 |
| Reclassified to income | 437 | — | 12 | (636) | — | 81 | — | (106) |
| Reclassified to the balance sheet | — | — | — | (81) | — | — | — | (81) |
| Reclassified to retained earnings | — | (32) | — | — | — | — | (2) | (34) |
| Tax on amounts recognised/reclassified | (1) | 33 | — | 59 | — | 55 | (1,516) | (1,370) |
| Total, net of tax | (2,986) | (523) | (78) | (232) | 180 | 200 | 5,464 | 2,025 |
| Share of joint ventures and associates | 30 | (283) | — | 244 | — | — | 30 | 21 |
| Other comprehensive income/(loss) for the period | (2,956) | (806) | (78) | 12 | 180 | 200 | 5,494 | 2,046 |
| Less: non-controlling interest | (71) | (1) | — | — | — | — | 16 | (56) |
| Attributable to Shell plc shareholders | (3,027) | (807) | (78) | 12 | 180 | 200 | 5,510 | 1,990 |
| At December 31, 2022 | (12,590) | 487 | (75) | (524) | (1,964) | (26) | (2,964) | (17,656) |
Financial Statements and Supplements | Notes to the Consolidated Financial Statements continued
30. Dividends
| | | | | | | | | | | | | | | | | | | | | | | |
| $ per share | | $ million |
| 2024 | 2023 | 2022 | | 2024 | 2023 | 2022 |
| | | | | | | |
| Cash: | | | | | | | |
| March | 0.344 | 0.2875 | 0.24 | | 2,210 | 2,030 | 1,829 |
| June | 0.344 | 0.2875 | 0.25 | | 2,177 | 1,984 | 1,850 |
| September | 0.344 | 0.3310 | 0.25 | | 2,169 | 2,179 | 1,818 |
| December | 0.344 | 0.3310 | 0.25 | | 2,112 | 2,196 | 1,786 |
| Total | 1.376 | 1.237 | 0.99 | | 8,668 | 8,389 | 7,283 |
| | | | | | | |
| | | | | | | |
| | | | | | | |
| | | | | | | |
| | | | | | | |
| | | | | | | |
| | | | | | | |
| | | | | | | |
On January 30, 2025, the Directors announced a further interim dividend in respect of 2024 of $0.3580 per ordinary share. The total dividend is payable on March 24, 2025, to shareholders on the register at February 14, 2025.
Shareholders will be able to elect to receive their dividends in US dollars, sterling or euros.
31. Earnings per share
| | | | | | | | | | | |
| 2024 | 2023 | 2022 |
Income attributable to Shell plc shareholders ($ million) | 16,094 | 19,359 | 42,309 |
| | | |
| Weighted average number of shares used as the basis for determining: | | | |
| Basic earnings per share (million of shares) | 6,299.6 | 6,733.5 | 7,347.5 |
| Diluted earnings per share (million of shares) | 6,363.7 | 6,799.8 | 7,410.5 |
Basic earnings per share are calculated by dividing the income attributable to Shell plc shareholders for the year by the weighted average number of shares outstanding during the year. The weighted average number of shares outstanding excludes shares held in trust.
Diluted earnings per share are based on the same income figures. The weighted average number of shares outstanding during the year is increased by dilutive shares related to share-based compensation plans. If the inclusion of potentially issuable shares could decrease diluted loss per share, the potentially issuable shares are excluded from the weighted average number of shares outstanding used to calculate diluted earnings per share.
32. Legal proceedings and other contingencies
General
In the ordinary course of business, Shell subsidiaries are subject to a number of contingencies arising from litigation and claims brought by governmental authorities, including tax authorities and private parties. The operations and earnings of Shell subsidiaries continue, from time to time, to be affected to varying degrees by political, legislative, fiscal and regulatory developments, including those relating to the protection of the environment and indigenous groups in the countries where they operate. The industries in which Shell subsidiaries are engaged are also subject to physical risks of various types.
The amounts claimed in relation to such events and, if such claims against Shell were successful, the costs of implementing the remedies sought in the various cases could be substantial. Based on information available to date and taking into account that in some cases it is not practicable to estimate the possible magnitude or timing of any resultant payments, management believes that the foregoing are not expected to have a material adverse impact on Shell's Consolidated Financial Statements. However, there remains a high degree of uncertainty around these contingencies, as well as their potential effect on future operations, earnings, cash flows and Shell's financial condition.
Costs in respect of decommissioning and restoration obligations are subject to uncertain timing and amount, and are dependent on various factors that are not always within management's control (see Note 25). In certain divestment transactions, liabilities related to decommissioning and restoration are de-recognised upon transfer of these obligations to the buyer. In certain cases, Shell retains a secondary obligation for decommissioning activities, either via reversionary legislation or the issuance of guarantees, in case the primary obligor is not able to meet its obligation. These exposures are actively monitored, and the likelihood of a liability arising in respect of these obligations is not considered probable.
Decommissioning and restoration of manufacturing facilities
For long-lived manufacturing facilities, where decommissioning would generally be more than 50 years away, while there is a present obligation that has arisen from past events, the amount of the obligation cannot be reliably measured. This is because the settlement dates are indeterminate; and other estimates, such as extremely long-term discount rates for which there is no observable measure, cannot be reliably determined. Consequently, the decommissioning and restoration obligation that exists for such long-lived manufacturing facilities cannot be reliably quantified and is disclosed as a contingent liability. There remains a high degree of uncertainty concerning such obligations and their potential effects on future operations, earnings, cash flows, reputation and Shell's financial condition.
Financial Statements and Supplements | Notes to the Consolidated Financial Statements continued
32. Legal proceedings and other contingencies continued
Pesticide litigation
Shell, along with another agricultural chemical pesticide manufacturer and several distributors, has been sued by public and quasi-public water purveyors, water storage districts and private landowners alleging responsibility for groundwater contamination caused by applications of chemical pesticides. There are approximately nine such cases currently pending, four claims made but not yet filed, and an active subpoena for records. These matters assert various theories of strict liability and negligence, seeking to recover actual damages, including drinking well treatment and remediation costs. Most assert claims for punitive damages. Shell continues to vigorously defend these actions. Based on the claims asserted and Shell's history regarding amounts paid to resolve varying actions, management does not expect the outcome of the matters pending at December 31, 2024, to have a material adverse impact on Shell USA. However, there remains a high degree of uncertainty regarding the potential outcome of some of these pending lawsuits, as well as their potential effect on future operations, earnings, cash flows and Shell's financial condition.
Climate change litigation
In the USA, energy companies (including Shell), industry associations, and others have been named in several matters alleging responsibility for the impacts of climate change due to the use of fossil fuels. These matters assert various theories of liability for a wide variety of harms, including but not limited to, impacts to public and private infrastructure, natural resources, and public health and services. As of December 31, 2024, 31 lawsuits naming Shell as a defendant were pending.
In the Netherlands, in a case against Shell brought by a group of environmental non-governmental organisations and individual claimants (referred to herein as "Milieudefensie"), the Hague District Court in 2021 found that while Shell was not acting unlawfully, Shell had the obligation to reduce the aggregate annual volume of CO2 emissions of Shell operations and energy-carrying products sold across Scope 1, 2 and 3 by 45% (net) by the end of 2030 relative to its 2019 emissions levels. For Scopes 2 and 3, this was a significant best-efforts obligation. Shell appealed that ruling. On November 12, 2024, the Hague Court of Appeal upheld Shell's appeal and dismissed the claim against Shell. In doing so, the Court of Appeal annulled the earlier judgment of the District Court in its entirety with immediate effect. On February 11, 2025, Milieudefensie filed an appeal to the Supreme Court of the Netherlands.
Management believes the outcome of these matters should be resolved in a manner favourable to Shell, but there remains a high degree of uncertainty regarding the ultimate outcome of these lawsuits, as well as their potential effect on future operations, earnings, cash flows and Shell's financial condition.
NAM (Groningen gas field) litigation
Since 1963, NAM – a joint venture between Shell and ExxonMobil (50%:50%) – has been producing gas from the Groningen field, the largest gas field in Western Europe. After smaller tremors in the 1990s and the late 2000s, an earthquake measuring 3.6 on the Richter scale occurred in 2012, causing damage to properties in the affected area. NAM has successfully settled close to 80,000 claims for physical damage to property. The Dutch State has taken over the damage-claim-handling from NAM for all claim categories, and the strengthening operation in the region, while NAM remains financially responsible insofar as the costs corresponded to NAM's liability. In 2022, NAM started arbitrations with the Dutch government to have its financial liability determined for costs which the Dutch government compensated to claimants and subsequently charged to NAM. These claims include but are not limited to physical damage to property, housing value loss, emotional damage, and loss of living enjoyment. Arbitral awards in the strengthening and damages arbitrations are expected to be rendered in March and Summer 2025 respectively.
Shell is seeking to reach a final, all-encompassing settlement with the Dutch government on the new design of the Dutch "Gasgebouw" earthquake costs and the wind-down of natural gas production in Groningen. Shell, ExxonMobil and the Dutch government reached agreements in 2018 (Heads of Agreement) and 2019 (Interim Agreement) and subsequently have been engaged in discussions on the interpretation and implementation of these agreements and on a final and all-encompassing settlement. As these discussions have not led to such a settlement, in December 2023, the NAM shareholders asked an independent arbitration panel to rule on the interpretation and implementation of the agreements made in 2018/2019. The purpose of this arbitration is for a neutral third party to assess the situation and provide clarity. The arbitration is expected to take several years, and the judgement will be binding. The arbitration does not preclude a final and all-encompassing settlement, provided Shell, ExxonMobil and the Dutch government agree to pursue such a settlement.
There remains a high degree of uncertainty concerning the ultimate outcome of these disputes and their potential effect on future operations, earnings, cash flows, reputation and Shell's financial condition.
Financial Statements and Supplements | Notes to the Consolidated Financial Statements continued
32. Legal proceedings and other contingencies continued
Kazakhstan
Shell has several matters in dispute involving the Republic of Kazakhstan. One litigation matter involving a Shell NOV relates to a Sulphur permitting inspection outcome. An unfavourable ruling was issued by the Administrative Collegium of Astana City Court in February 2024. The Shell NOV filed an appeal in March 2024 to the Kazakhstan Supreme Court which is pending.
The other matters are ongoing disputes involving two Shell NOVs under the applicable production-sharing contracts.
At this time, it is not possible to reliably estimate the magnitude and timing of any possible obligations or payments in respect of the matters above or whether any payments will be due. There remains a high degree of uncertainty regarding the ultimate outcomes, as well as the potential effect on future operations, earnings, cash flows and Shell's financial condition.
Nigerian litigation
Shell (in its capacity as previous owner of SPDC) and various subsidiaries and associates operating in Nigeria are parties to various environmental, non-environmental and contractual disputes brought in the courts of Nigeria, the USA and England. These disputes are at different stages in arbitration and litigation, including at the appellate stage, where judgements have been rendered against Shell entities in some of these disputes. If taken at face value, the aggregate amount of these judgements could be seen as material. Management, however, believes that the outcomes of these disputes, once determined, will be favourable to Shell. However, there remains a high degree of uncertainty regarding these cases, as well as their potential effect on future operations, earnings, cash flows and Shell's financial condition.
OPL 245
In March 2017, criminal charges alleging official corruption and conspiracy to commit official corruption were filed against SNEPCO, one then current now former Shell employee and third parties including ENI SpA and one of its subsidiaries. Those charges were struck out for want of diligent prosecution and the proceedings have been dismissed. However, they can be refiled. In March 2017, parties alleging to be shareholders of Malabu Oil and Gas Company Ltd. (Malabu) filed two actions to challenge the 2011 settlement of litigation pertaining to Oil Prospecting Licence 245 (OPL 245) with regard to potential anti-bribery, anti-corruption and anti-money laundering laws and the award of OPL 245 to SNEPCO and an ENI SpA subsidiary by the Federal Government of Nigeria. Both actions are currently stayed awaiting the outcome of appeals filed against procedural decisions. Those appeal proceedings are ongoing. On May 8, 2018, Human Environmental Development Agenda (HEDA) sought permission from the Federal High Court of Nigeria to apply for an order to direct the Attorney General of the Federation to revoke OPL 245 on grounds that the entire Malabu transaction in relation to the OPL is unconstitutional, illegal and void as it was obtained through fraudulent and corrupt practice. On July 3, 2019, the Nigerian Federal High Court upheld objections from SNEPCO and NAE and struck the lawsuit filed by HEDA. The suit was struck because of the statute of limitations and lack of jurisdiction to hear the matter. HEDA has appealed the judgement, which is ongoing.
On July 21, 2022, the Dutch Public Prosecutor's office announced it had dismissed its investigation into bribery allegations related to OPL 245. On October 24, 2022, Re:Common, HEDA and The Corner House announced that they filed a complaint at the Court of Appeal in The Hague, pursuant to Article 12 of the Dutch Code for Criminal Procedure, challenging the decision by the Dutch Public Prosecutor to dismiss its investigation. On March 20, 2025, the Court of Appeal in The Hague dismissed this complaint. There remains a high degree of uncertainty around the OPL 245 matters and contingencies discussed above, as well as their potential effect on future operations, earnings, cash flows and Shell's financial condition. Accordingly, at this time, it is not possible to reliably estimate the possible obligations and timing of any payments. Any violation of anti-bribery, anti-corruption or anti-money laundering legislation could have a material adverse effect on Shell plc's earnings, cash flows and financial condition.
Russia
On October 2, 2024, the Russian prosecutor filed a Moscow court claim against eight Shell-group entities (including Shell plc and Shell Energy Europe Limited ("SEEL")). The prosecutor seeks (i) declarations that Shell illegally abandoned in support of Sakhalin Energy Investment Company ("Sakhalin"); (ii) monetary relief of approximately €1.5 billion from SEEL to Gazprom Export ("GPE") for alleged unpaid gas deliveries in 2022; and (iii) a declaration that GPE can take 94₽ billion purportedly set aside for Shell for Sakhalin equity compensation from a Type-C account to net off against part of the alleged debt owed by SEEL to GPE. On January 30, 2025, SEEL filed a written postponement motion in the Moscow court proceedings regarding SEEL's non-payment of GPE gas invoices and Sakhalin. At a court hearing on February 14, 2025, the judge postponed the proceedings until the next hearing, which is scheduled for April 14, 2025.
At this time, it is not possible to reliably estimate the magnitude and timing of any possible obligations or payments in respect of the matters above or whether any payments will be due. There remains a high degree of uncertainty regarding the ultimate outcomes, as well as the potential effect on future operations, earnings, cash flows and Shell's financial condition.
Financial Statements and Supplements | Notes to the Consolidated Financial Statements continued
33. Employees
| | | | | | | | | | | |
| $ million |
| 2024 | 2023 | 2022 |
| Remuneration | 10,928 | 10,648 | 10,509 |
| Social security contributions | 983 | 957 | 860 |
Retirement benefits (see Note 24) | 809 | 1,324 | 1,795 |
Share-based compensation (see Note 28) | 732 | 700 | 807 |
| Total [A] | 13,452 | 13,629 | 13,971 |
[A]Excludes employees seconded to joint ventures and associates.
| | |
Average employee numbers [A] |
| | | | | | | | | | | |
| Thousand |
| 2024 | 2023 | 2022 |
| Integrated Gas | 6 | 6 | 6 |
| Upstream | 13 | 11 | 12 |
| Marketing | 24 | 26 | 17 |
| Chemicals and Products | 22 | 22 | 21 |
| Renewables and Energy Solutions | 3 | 5 | 4 |
Corporate [B] | 30 | 30 | 27 |
Total [C] | 98 | 100 | 87 |
[A]The employee numbers are based on headcount.
[B]Includes 23,000 employees (2023: 23,000; 2022: 20,000) working in business service centres irrespective of the segment they support.
[C]Excludes employees seconded to joint ventures and associates (2024: 1,000 employees; 2023: 2,000 employees; 2022: 2,000 employees).
34. Directors and Senior Management
| | |
Remuneration of Directors of the Company |
| | | | | | | | | | | |
| $ million |
| | 2024 | 2023 | 2022 |
| Emoluments | 13 | 12 | 12 |
| Value of released awards under long-term incentive plans | 10 | 4 | 7 |
| Employer contributions to pension plans | 1 | 1 | 1 |
Emoluments comprise salaries and fees, annual bonuses (for the period for which performance is assessed) and other benefits. The value of released awards under long-term incentive plans for the period is in respect of the performance period ending in that year. In 2024, no Director accrued retirement benefits in respect of qualifying services under defined benefit plans.
| | |
Directors and Senior Management expense |
| | | | | | | | | | | |
| $ million |
| 2024 | 2023 | 2022 |
| Short-term benefits | 33 | 31 | 33 |
| Retirement benefits | 2 | 2 | 2 |
| Share-based compensation | 11 | 17 | 17 |
| Termination and related amounts | — | 7 | 1 |
| Total | 46 | 57 | 53 |
Directors and Senior Management comprise members of the Executive Committee and the Non-executive Directors of the Company.
Short-term benefits comprise salaries and fees, annual bonuses delivered in cash and shares (for the period for which performance is assessed), other benefits and employer social security contributions.
Financial Statements and Supplements | Notes to the Consolidated Financial Statements continued
35. Auditor's remuneration
| | | | | | | | | | | |
| $ million |
| 2024 | 2023 | 2022 |
| Fees in respect of the audit of the Consolidated and Parent Company Financial Statements, including audit of consolidation returns | 41 | 42 | 45 |
| Other audit fees, principally in respect of audits of accounts of subsidiaries | 19 | 19 | 18 |
| Total audit fees | 60 | 61 | 63 |
| Audit-related fees | 3 | 3 | 3 |
| Fees in respect of other non-audit services | 3 | 2 | 3 |
| Total | 66 | 66 | 69 |
In addition, the auditor provided audit services to retirement benefit plans for employees of subsidiaries. Remuneration paid by those benefit plans amounted to $1 million in 2024 (2023: $1 million; 2022: $1 million).
36. Post-balance sheet events
On January 23, 2025, and March 4, 2025, Shell announced changes to the Executive Committee. As per the announcements, with effect from April 1, 2025, the most senior leadership structure will be delayered to reflect the three primary areas of business value – Integrated Gas; Upstream; and Downstream, Renewables and Energy Solutions, while elevating Trading and Supply. These changes will not affect Shell's reporting segments as the changes do not impact how the Chief Executive Officer, who serves as the Chief Operating Decision Maker, makes decisions about allocating resources and assessing performance.
On January 30, 2025, Shell announced the commencement of a $3.5 billion share buyback programme (the "programme") covering an aggregate contract term of approximately three months. The purpose of the programme is to reduce the issued share capital of the Company. All shares repurchased as part of the programme will be cancelled. It is intended that, subject to market conditions, the programme will be completed prior to the Company's first quarter 2025 results announcement, scheduled for May 2, 2025. The Company has entered into an arrangement with a single broker consisting of two irrevocable, non-discretionary contracts, to enable the purchase of ordinary shares.
On March 13, 2025, Shell completed the sale of The Shell Petroleum Development Company of Nigeria Limited (SPDC) to Renaissance, as announced on January 16, 2024. The divestment of SPDC aligns with Shell's intent to simplify its presence in Nigeria through an exit of onshore oil production in the Niger Delta and a focus of future disciplined investment in its deep-water and integrated gas positions. As part of the transaction, Shell has also provided loan facilities. No significant impairments are expected as a result of completion of the transaction.
Financial Statements and Supplements
Supplementary information – oil and gas (unaudited)
About this section
The purpose of this section is to comply with the requirements of the Financial Accounting Standards Board (FASB) "Extractive Activities – Oil and Gas (Topic 932)". Extractive activities for this purpose include exploration and production activities to extract oil, condensates, natural gas liquids, oil sands and natural gas from their natural reservoirs.
In Shell, extractive activities, or oil and gas exploration and production activities, are undertaken within the Integrated Gas, Upstream and the Chemicals and Products (includes oil sands) segments. Shell's extractive activities do not represent the full extent of Integrated Gas, Upstream and Chemicals and Products activities, and exclude GTL processing, some LNG activities, trading and optimisation, as well as other non-extractive activities. As a result, the information in this extractive activities section is not suitable for modelling Shell's integrated businesses, for which we refer to the segment information. Full segment information to the Consolidated Financial Statements is available on pages 252-257.
The information set out on pages 297-316 is referred to as "unaudited" as a means of clarifying that it is not covered by the audit opinion of the independent registered public accounting firm that has audited and reported on the Consolidated Financial Statements.
Proved reserves
Proved reserves estimates are calculated pursuant to the US Securities and Exchange Commission (SEC) Rules and the FASB's Topic 932. Proved reserves can be either developed or undeveloped. The definitions used are in accordance with the SEC Rule 4–10 (a) of Regulation S-X. We include proved reserves associated with future production that will be consumed in operations.
Proved reserves shown are net of any quantities of crude oil or natural gas that are expected to be (or could be) taken as royalties in kind. Proved reserves outside North America include quantities that will be settled as royalties in cash. Proved reserves include certain quantities of crude oil or natural gas that will be produced under arrangements that involve Shell subsidiaries, joint ventures and associates in risks and rewards but do not transfer title of the product to those entities.
Subsidiaries' proved reserves at December 31, 2024, were divided into 78% developed and 22% undeveloped on a barrel of oil equivalent (boe) basis. For the Shell share of joint ventures and associates, the proved reserves at December 31, 2024, were divided into 35% developed and 65% undeveloped on a boe basis.
Proved reserves are recognised under various forms of contractual agreements. Shell's proved reserves volumes at December 31, 2024, present in agreements such as production-sharing contracts (PSC), tax/variable royalty contracts or other forms of economic entitlement contracts, where the Shell share of reserves can vary with commodity prices, were 2,153 million barrels of liquids, and 10,240 thousand million standard cubic feet (scf) of natural gas.
Proved reserves cannot be measured exactly because estimation of reserves involves subjective judgement (see "Risk factors" on page 26 and our "Proved reserves assurance process" below). These estimates remain subject to revision and are unaudited supplementary information.
Proved reserves assurance process
A central group of reserves experts, who on average have around 28 years' experience in the oil and gas industry, undertake the primary assurance of the proved reserves bookings. This group of experts is part of the Resources Assurance and Reporting (RAR) organisation within Shell. A Vice President with 39 years' experience in the oil and gas industry currently heads the RAR organisation. He is a member of the Society of Petroleum Engineers, Society of Petroleum Evaluation Engineers and holds a BA in mathematics from Oxford University and an MEng in Petroleum Engineering from Heriot-Watt University. The RAR organisation reports directly to an Executive Vice President of Finance, who is a member of the Upstream Reserves Committee (URC). The URC is a multidisciplinary committee consisting of senior representatives from the Finance, Legal, Integrated Gas and Upstream organisations. The URC reviews and endorses all major (larger than 30 million barrels of oil equivalent) proved reserves bookings and debookings and endorses the total aggregated proved reserves. Final approval of all proved reserves bookings remains with Shell's CEO, and all proved reserves bookings are reviewed by Shell's Audit and Risk Committee. The Internal Audit function also provides secondary assurance through audits of the control framework.
Crude oil, natural gas liquids, synthetic crude oil and bitumen
Shell subsidiaries' proved reserves of crude oil, natural gas liquids (NGLs), synthetic crude oil and bitumen at the end of the year; their share of the proved reserves of joint ventures and associates at the end of the year; and the changes in such reserves during the year are set out on pages 298-302. Significant changes in these proved reserves are discussed below (except where specific disclosures are prohibited), where "revisions and reclassifications" are changes based on new information that resulted from development drilling, production history and changes in economic factors.
Financial Statements and Supplements | Supplementary information – oil and gas (unaudited) continued
Proved reserves 2024–2023
Shell subsidiaries
Asia
○The increase of 115 million barrels in revisions and reclassifications was mainly in Oman and Kazakhstan.
USA
○The increase of 92 million barrels in revisions and reclassifications was mainly in Vito, Appomattox, Kaikias and Mars.
South America
○The increase of 162 million barrels in revisions and reclassifications was mainly due to an FID of an additional FPSO in Atapu, Brazil.
Proved reserves 2023–2022
Shell subsidiaries
Asia
○The increase of 149 million barrels in revisions and reclassifications was mainly in Oman.
Africa
○The increase of 79 million barrels in revisions and reclassifications was mainly in Bonga, Nigeria.
USA
○The increase of 69 million barrels in extensions and discoveries was due to an FID of Sparta.
○The increase of 46 million barrels in revisions and reclassifications was mainly in Appomattox.
○The decrease of 110 million barrels in sales in place was in Aera.
South America
○The increase of 165 million barrels in revisions and reclassifications was mainly in Mero and Atapu, Brazil.
Financial Statements and Supplements | Supplementary information – oil and gas (unaudited) continued
| | | | | | | | | | | | | | |
Proved developed and undeveloped reserves 2024 |
| | | | | | | | | | | | | | | | | | | | | | | | | | | | | | | | | | | | | | | | |
| Million barrels |
| | | | | North America | South America | | | | | |
| Europe | Asia | Oceania | Africa | USA | Canada | | Total |
| Oil and NGL | Oil and NGL | Oil and NGL | Oil and NGL | Oil and NGL | Oil and NGL | Synthetic crude oil | | Oil and NGL | | Oil and NGL | Synthetic crude oil | | All products |
| Shell subsidiaries | | | | | | | | | | | | | | |
| At January 1 | 160 | 1,392 | 79 | 259 | 439 | 5 | 757 | | 1,178 | | 3,512 | 757 | | 4,269 |
| Revisions and reclassifications | 32 | 115 | (2) | 13 | 92 | (4) | (13) | | 162 | | 408 | (13) | | 395 |
| Improved recovery | — | 9 | — | 39 | — | — | — | | — | | 48 | — | | 48 |
| Extensions and discoveries | — | 5 | — | 24 | 14 | — | — | | 9 | | 52 | — | | 52 |
| Purchases of minerals in place | — | 1 | — | — | — | — | 16 | | 12 | | 13 | 16 | | 29 |
| Sales of minerals in place | — | — | — | — | — | — | — | | — | | — | — | | — |
| Production [A] | (34) | (161) | (12) | (41) | (108) | (1) | (19) | | (150) | | (507) | (19) | | (526) |
| At December 31 | 158 | 1,361 | 65 | 294 | 437 | — | 741 | | 1,211 | | 3,526 | 741 | | 4,267 |
| Shell share of joint ventures and associates | | | | | | | | | | | | |
| At January 1 | 2 | 390 | — | — | — | — | — | | — | | 392 | — | | 392 |
| Revisions and reclassifications | — | (5) | — | — | — | — | — | | — | | (5) | — | | (5) |
| Improved recovery | — | — | — | — | — | — | — | | — | | — | — | | — |
| Extensions and discoveries | — | — | — | — | — | — | — | | — | | — | — | | — |
| Purchases of minerals in place | — | — | — | — | — | — | — | | — | | — | — | | — |
| Sales of minerals in place | — | — | — | — | — | — | — | | — | | — | — | | — |
| Production | (1) | (23) | — | — | — | — | — | | — | | (24) | — | | (24) |
| At December 31 | 1 | 362 | — | — | — | — | — | | — | | 363 | — | | 363 |
Total [B] [C] [D] | 159 | 1,723 | 65 | 294 | 437 | — | 741 | | 1,211 | | 3,889 | 741 | | 4,630 |
| Reserves attributable to non-controlling interest in Shell subsidiaries at December 31 | — | — | — | — | — | — | 370 | | — | | — | 370 | | 370 |
[A]Includes 1 million barrels consumed in operations for synthetic crude oil.
[B]On March 13, 2025, Shell completed the sale of its Nigerian onshore subsidiary The Shell Petroleum Development Company of Nigeria Limited (SPDC) which holds a 30% interest in the SPDC JV to Renaissance. As of December 31, 2024, Shell had proved reserves of 134 million barrels in crude oil in SPDC.
[C]Pursuant to Shell's 2017 agreement with Canadian Natural Resources Limited, its remaining mining interest and associated synthetic crude oil reserves will be swapped for an additional 10% interest in the Scotford Upgrader and Quest CCS project. The transaction is expected to close by the end of the first half of 2025, subject to regulatory approvals. The associated proved reserves as of December 31, 2024 were 741 million barrels in synthetic crude oil (of which 50% attributable to non-controlling interest).
[D]On December 5, 2024, Shell along with Equinor ASA, announced the combination of their UK offshore oil and gas assets and expertise to form a new company which will be the UK North Sea's biggest independent producer. On deal completion, the new independent producer will be jointly owned by Equinor (50%) and Shell (50%) and 112 million barrels crude oil (as of December 31, 2024) of Shell's proved reserves will be contributed to the new joint venture alongside proved reserves contributed by Equinor. Subsequently, Shell will report 50% of the proved reserves of the new joint venture as part of Shell's share of proved reserves from joint ventures and associates.
Financial Statements and Supplements | Supplementary information – oil and gas (unaudited) continued
| | | | | | | | | | | | | | |
Proved developed reserves 2024 |
| | | | | | | | | | | | | | | | | | | | | | | | | | | | | | | | | | | | | | | | |
| | | | | | | | | | | | Million barrels |
| | | | | North America | South America | | | | | |
| Europe | Asia | Oceania | Africa | USA | Canada | | Total |
| Oil and NGL | Oil and NGL | Oil and NGL | Oil and NGL | Oil and NGL | Oil and NGL | Synthetic crude oil | | Oil and NGL | | Oil and NGL | Synthetic crude oil | | All products |
| Shell subsidiaries | | | | | | | | | | | | | | |
| At January 1 | 122 | 985 | 53 | 230 | 305 | 2 | 757 | | 841 | | 2,538 | 757 | | 3,295 |
| At December 31 | 115 | 1,183 | 43 | 216 | 285 | — | 741 | | 886 | | 2,728 | 741 | | 3,469 |
| Shell share of joint ventures and associates | | | | | | | | | | | | |
| At January 1 | 2 | 113 | — | — | — | — | — | | — | | 115 | — | | 115 |
| At December 31 | 1 | 135 | — | — | — | — | — | | — | | 136 | — | | 136 |
| | | | | | | | | | | | | | |
Proved undeveloped reserves 2024 |
| | | | | | | | | | | | | | | | | | | | | | | | | | | | | | | | | | | | | | | | |
| Million barrels |
| | | | | North America | South America | | | | | |
| Europe | Asia | Oceania | Africa | USA | Canada | | Total |
| Oil and NGL | Oil and NGL | Oil and NGL | Oil and NGL | Oil and NGL | Oil and NGL | Synthetic crude oil | | Oil and NGL | | Oil and NGL | Synthetic crude oil | | All products |
| Shell subsidiaries | | | | | | | | | | | | | | |
| At January 1 | 38 | 407 | 26 | 29 | 134 | 3 | — | | 337 | | 974 | — | | 974 |
| At December 31 | 43 | 178 | 22 | 78 | 152 | — | — | | 325 | | 798 | — | | 798 |
| Shell share of joint ventures and associates | | | | | | | | | | | | |
| At January 1 | — | 277 | — | — | — | — | — | | — | | 277 | — | | 277 |
| At December 31 | — | 227 | — | — | — | — | — | | — | | 227 | — | | 227 |
Financial Statements and Supplements | Supplementary information – oil and gas (unaudited) continued
| | | | | | | | | | | | | | |
| Proved developed and undeveloped reserves 2023 |
| | | | | | | | | | | | | | | | | | | | | | | | | | | | | | | | | | | | | | | | |
| Million barrels |
| | | | | North America | South America | | | | | |
| Europe | Asia | Oceania | Africa | USA | Canada | | Total |
| Oil and NGL | Oil and NGL | Oil and NGL | Oil and NGL | Oil and NGL | Oil and NGL | Synthetic crude oil | | Oil and NGL | | Oil and NGL | Synthetic crude oil | | All products |
| Shell subsidiaries | | | | | | | | | | | | | | |
| At January 1 | 192 | 1,411 | 106 | 218 | 543 | 4 | 731 | | 1,138 | | 3,612 | 731 | | 4,343 |
| Revisions and reclassifications | 2 | 149 | (17) | 79 | 46 | 1 | 35 | | 165 | | 425 | 35 | | 460 |
| Improved recovery | — | 3 | — | — | — | — | — | | — | | 3 | — | | 3 |
| Extensions and discoveries | — | 2 | — | — | 69 | 1 | — | | 25 | | 97 | — | | 97 |
| Purchases of minerals in place | — | — | 1 | — | 3 | — | 11 | | — | | 4 | 11 | | 15 |
| Sales of minerals in place | — | (11) | — | — | (110) | — | — | | — | | (121) | — | | (121) |
| Production [A] | (34) | (162) | (11) | (38) | (112) | (1) | (20) | | (150) | | (508) | (20) | | (528) |
| At December 31 | 160 | 1,392 | 79 | 259 | 439 | 5 | 757 | | 1,178 | | 3,512 | 757 | | 4,269 |
| Shell share of joint ventures and associates | | | | | | | | | | | | |
| At January 1 | 3 | 327 | — | — | — | — | — | | 7 | | 337 | — | | 337 |
| Revisions and reclassifications | — | — | — | — | — | — | — | | (7) | | (7) | — | | (7) |
| Improved recovery | — | — | — | — | — | — | — | | — | | — | — | | — |
| Extensions and discoveries | — | — | — | — | — | — | — | | — | | — | — | | — |
| Purchases of minerals in place | — | 85 | — | — | — | — | — | | — | | 85 | — | | 85 |
| Sales of minerals in place | — | — | — | — | — | — | — | | — | | — | — | | — |
| Production | (1) | (22) | — | — | — | — | — | | — | | (23) | — | | (23) |
| At December 31 | 2 | 390 | — | — | — | — | — | | — | | 392 | — | | 392 |
Total | 162 | 1,782 | 79 | 259 | 439 | 5 | 757 | | 1,178 | | 3,904 | 757 | | 4,661 |
| Reserves attributable to non-controlling interest in Shell subsidiaries at December 31 | — | — | — | — | — | — | 378 | | — | | | 378 | | 378 |
[A]Includes 1 million barrels consumed in operations for synthetic crude oil.
| | | | | | | | | | | | | | |
| Proved developed reserves 2023 |
| | | | | | | | | | | | | | | | | | | | | | | | | | | | | | | | | | | | | | | | |
| | | | | | | | | | | | Million barrels |
| | | | | North America | South America | | | | | |
| Europe | Asia | Oceania | Africa | USA | Canada | | Total |
| Oil and NGL | Oil and NGL | Oil and NGL | Oil and NGL | Oil and NGL | Oil and NGL | Synthetic crude oil | | Oil and NGL | | Oil and NGL | Synthetic crude oil | | All products |
| Shell subsidiaries | | | | | | | | | | | | | | |
| At January 1 | 140 | 999 | 73 | 187 | 356 | 3 | 731 | | 831 | | 2,589 | 731 | | 3,320 |
| At December 31 | 122 | 985 | 53 | 230 | 305 | 2 | 757 | | 841 | | 2,538 | 757 | | 3,295 |
| Shell share of joint ventures and associates | | | | | | | | | | | | |
| At January 1 | 3 | 154 | — | — | — | — | — | | 7 | | 164 | — | | 164 |
| At December 31 | 2 | 113 | — | — | — | — | — | | — | | 115 | — | | 115 |
| | | | | | | | | | | | | | |
| Proved undeveloped reserves 2023 |
| | | | | | | | | | | | | | | | | | | | | | | | | | | | | | | | | | | | | | | | |
| Million barrels |
| | | | | North America | South America | | | | | |
| Europe | Asia | Oceania | Africa | USA | Canada | | Total |
| Oil and NGL | Oil and NGL | Oil and NGL | Oil and NGL | Oil and NGL | Oil and NGL | Synthetic crude oil | | Oil and NGL | | Oil and NGL | Synthetic crude oil | | All products |
| Shell subsidiaries | | | | | | | | | | | | | | |
| At January 1 | 52 | 412 | 33 | 31 | 187 | 1 | — | | 307 | | 1,023 | — | | 1,023 |
| At December 31 | 38 | 407 | 26 | 29 | 134 | 3 | — | | 337 | | 974 | — | | 974 |
| Shell share of joint ventures and associates | | | | | | | | | | | | |
| At January 1 | — | 173 | — | — | — | — | — | | — | | 173 | — | | 173 |
| At December 31 | — | 277 | — | — | — | — | — | | — | | 277 | — | | 277 |
Financial Statements and Supplements | Supplementary information – oil and gas (unaudited) continued
| | |
| Proved developed and undeveloped reserves 2022 |
| | | | | | | | | | | | | | | | | | | | | | | | | | | | | | | | | | | | | | | | |
| Million barrels |
| | | | | North America | South America | | | | | |
| Europe | Asia | Oceania | Africa | USA | Canada | | Total |
| Oil and NGL | Oil and NGL | Oil and NGL | Oil and NGL | Oil and NGL | Oil and NGL | Synthetic crude oil | | Oil and NGL | | Oil and NGL | Synthetic crude oil | | All products |
| Shell subsidiaries | | | | | | | | | | | | | | |
| At January 1 | 208 | 1,521 | 80 | 265 | 610 | 5 | 533 | | 1,131 | | 3,820 | 533 | | 4,353 |
| Revisions and reclassifications | 16 | 34 | 11 | (18) | 48 | (1) | (25) | | 47 | | 137 | (25) | | 112 |
| Improved recovery | — | — | — | — | — | — | — | | 32 | | 32 | — | | 32 |
| Extensions and discoveries | 5 | 13 | 24 | — | 7 | 1 | — | | 11 | | 61 | — | | 61 |
| Purchases of minerals in place | — | 12 | — | — | — | — | 240 | | 55 | | 67 | 240 | | 307 |
| Sales of minerals in place | — | (1) | — | — | — | — | — | | — | | (1) | — | | (1) |
| Production [A] | (37) | (168) | (9) | (29) | (122) | (1) | (17) | | (138) | | (504) | (17) | | (521) |
| At December 31 | 192 | 1,411 | 106 | 218 | 543 | 4 | 731 | | 1,138 | | 3,612 | 731 | | 4,343 |
| Shell share of joint ventures and associates | | | | | | | | | | | | |
| At January 1 | 7 | 217 | — | — | — | — | — | | 4 | | 228 | — | | 228 |
| Revisions and reclassifications | (3) | (23) | — | — | — | — | — | | 1 | | (25) | — | | (25) |
| Improved recovery | — | — | — | — | — | — | — | | — | | — | — | | — |
| Extensions and discoveries | — | — | — | — | — | — | — | | 4 | | 4 | — | | 4 |
| Purchases of minerals in place | — | 159 | — | — | — | — | — | | — | | 159 | — | | 159 |
| Sales of minerals in place | — | — | — | — | — | — | — | | — | | — | — | | — |
| Production | (1) | (26) | — | — | — | — | — | | (2) | | (29) | — | | (29) |
| At December 31 | 3 | 327 | — | — | — | — | — | | 7 | | 337 | — | | 337 |
| Total [B] | 195 | 1,738 | 106 | 218 | 543 | 4 | 731 | | 1,145 | | 3,949 | 731 | | 4,680 |
| Reserves attributable to non-controlling interest in Shell subsidiaries at December 31 | | | | | | | 365 | | | | | 365 | | 365 |
[A]Includes 1 million barrels consumed in operations for synthetic crude oil.
[B]As announced on February 28, 2023, Shell completed the sale of its 100% interest in Shell Onshore Ventures LLC, which held a 51.8% membership interest in Aera Energy LLC, to IKAV.
As of December 31, 2022, Shell had proved reserves of 112 million barrels in crude oil.
| | |
| Proved developed reserves 2022 |
| | | | | | | | | | | | | | | | | | | | | | | | | | | | | | | | | | | | | | | | |
| | | | | | | | | | | | Million barrels |
| | | | | North America | South America | | | | | |
| Europe | Asia | Oceania | Africa | USA | Canada | | Total |
| Oil and NGL | Oil and NGL | Oil and NGL | Oil and NGL | Oil and NGL | Oil and NGL | Synthetic crude oil | | Oil and NGL | | Oil and NGL | Synthetic crude oil | | All products |
| Shell subsidiaries | | | | | | | | | | | | | | |
| At January 1 | 140 | 1,348 | 71 | 218 | 397 | 2 | 533 | | 786 | | 2,962 | 533 | | 3,495 |
| At December 31 | 140 | 999 | 73 | 187 | 356 | 3 | 731 | | 831 | | 2,589 | 731 | | 3,320 |
| Shell share of joint ventures and associates | | | | | | | | | | | | |
| At January 1 | 7 | 197 | — | — | — | — | — | | 4 | | 208 | — | | 208 |
| At December 31 | 3 | 154 | — | — | — | — | — | | 7 | | 164 | — | | 164 |
| | |
| Proved undeveloped reserves 2022 |
| | | | | | | | | | | | | | | | | | | | | | | | | | | | | | | | | | | | | | | | |
| Million barrels |
| | | | | North America | South America | | | | | |
| Europe | Asia | Oceania | Africa | USA | Canada | | Total |
| Oil and NGL | Oil and NGL | Oil and NGL | Oil and NGL | Oil and NGL | Oil and NGL | Synthetic crude oil | | Oil and NGL | | Oil and NGL | Synthetic crude oil | | All products |
| Shell subsidiaries | | | | | | | | | | | | | | |
| At January 1 | 68 | 173 | 9 | 47 | 213 | 3 | — | | 345 | | 858 | — | | 858 |
| At December 31 | 52 | 412 | 33 | 31 | 187 | 1 | — | | 307 | | 1,023 | — | | 1,023 |
| Shell share of joint ventures and associates | | | | | | | | | | | | |
| At January 1 | — | 20 | — | — | — | — | — | | — | | 20 | — | | 20 |
| At December 31 | — | 173 | — | — | — | — | — | | — | | 173 | — | | 173 |
Financial Statements and Supplements | Supplementary information – oil and gas (unaudited) continued
Natural gas
Shell subsidiaries' proved reserves of natural gas at the end of the year, their share of the proved reserves of joint ventures and associates at the end of the year, and the changes in such reserves during the years are set out on pages 303-306. Significant changes in these proved reserves
are discussed below (except where specific disclosures are prohibited).
Volumes are not adjusted to standard heat content. Apart from integrated projects, volumes of gas are reported on an "as-sold" basis. The price used to calculate future revenue and cash flows from proved gas reserves is the contract price or the 12-month average on "as-sold" volumes. Volumes associated with integrated projects are those measured at a designated transfer point between the upstream and downstream portions of the integrated project. Natural gas volumes are converted into oil equivalent using a factor of 5,800 scf per barrel.
Proved reserves 2024–2023
Shell subsidiaries
Europe
○The increase of 280 thousand million scf in revisions and reclassifications was mainly in Troll, Norway.
Asia
○The increase of 490 thousand million scf in revisions and reclassifications was mainly in Malaysia.
Canada
○The decrease of 1,329 thousand million scf in revisions and reclassifications was mainly due to the low year-average AECO (Alberta Energy Company) price in 2024 in Groundbirch, Canada.
South America
○The increase of 1,664 thousand million scf in extensions and discoveries was mainly due to an FID on Manatee, Trinidad and Tobago.
Proved reserves 2023–2022
Shell subsidiaries
Asia
○The increase of 952 thousand million scf in revisions and reclassifications was mainly in Oman.
Oceania
○The increase of 1,043 thousand million scf in revisions and reclassifications was mainly in Surat QGC and Gorgon, Australia.
Canada
○The increase of 443 thousand million scf in revisions and reclassifications was mainly in Groundbirch, Canada.
Financial Statements and Supplements | Supplementary information – oil and gas (unaudited) continued
| | | | | | | | | | | | | | |
Proved developed and undeveloped reserves 2024 |
| | | | | | | | | | | | | | | | | | | | | | | | | | |
| Thousand million standard cubic feet |
| | | | | North America | South America | |
| Europe | Asia | Oceania | Africa | USA | Canada | Total |
| Shell subsidiaries | | | | | | | | |
| At January 1 | 2,508 | 9,168 | 6,229 | 1,847 | 485 | 1,483 | 1,556 | 23,276 |
| Revisions and reclassifications | 280 | 490 | 232 | 89 | 77 | (1,329) | 79 | (82) |
| Improved recovery | — | — | — | 7 | — | — | — | 7 |
| Extensions and discoveries | 4 | 37 | 51 | 181 | 46 | — | 1,664 | 1,983 |
| Purchases of minerals in place | — | 86 | — | — | — | — | 15 | 101 |
| Sales of minerals in place | (1) | — | — | — | — | — | — | (1) |
| Production [A] | (284) | (890) | (817) | (172) | (110) | (154) | (299) | (2,726) |
| At December 31 | 2,507 | 8,891 | 5,695 | 1,952 | 498 | — | 3,015 | 22,558 |
| Shell share of joint ventures and associates | | | | | | | | |
| At January 1 | 122 | 6,103 | 228 | — | — | — | — | 6,453 |
| Revisions and reclassifications | 5 | 84 | 59 | — | — | — | — | 148 |
| Improved recovery | — | — | — | — | — | — | — | — |
| Extensions and discoveries | — | 1 | 148 | — | — | — | — | 149 |
| Purchases of minerals in place | — | — | — | — | — | — | — | — |
| Sales of minerals in place | — | — | — | — | — | — | — | — |
| Production [B] | (38) | (288) | (40) | — | — | — | — | (366) |
| At December 31 | 89 | 5,900 | 395 | — | — | — | — | 6,384 |
Total [C] [D] | 2,596 | 14,791 | 6,090 | 1,952 | 498 | — | 3,015 | 28,942 |
| Reserves attributable to non-controlling interest in Shell subsidiaries at December 31 | — | — | — | — | — | — | — | — |
[A]Includes 238 thousand million standard cubic feet consumed in operations.
[B]Includes 27 thousand million standard cubic feet consumed in operations.
[C]On March 13, 2025, Shell completed the sale of its Nigerian onshore subsidiary The Shell Petroleum Development Company of Nigeria Limited (SPDC) which holds a 30% interest in the SPDC JV to Renaissance. As of December 31, 2024, Shell had proved reserves of 1,850 thousand million standard cubic feet in natural gas in SPDC.
[D]On December 5, 2024, Shell along with Equinor ASA, announced the combination of their UK offshore oil and gas assets and expertise to form a new company which will be the UK North Sea's biggest independent producer. On deal completion, the new independent producer will be jointly owned by Equinor (50%) and Shell (50%) and 262 thousand million standard cubic feet in natural gas (as of December 31, 2024) of Shell's proved reserves will be contributed to the new joint venture alongside proved reserves contributed by Equinor. Subsequently, Shell will report 50% of the proved reserves of the new joint venture as part of Shell's share of proved reserves from joint ventures and associates.
| | | | | | | | | | | | | | |
Proved developed reserves 2024 |
| | | | | | | | | | | | | | | | | | | | | | | | | | |
| Thousand million standard cubic feet |
| | | | | North America | South America | |
| Europe | Asia | Oceania | Africa | USA | Canada | Total |
| Shell subsidiaries | | | | | | | | |
| At January 1 | 2,205 | 7,348 | 4,870 | 875 | 268 | 706 | 1,273 | 17,545 |
| At December 31 | 2,054 | 7,693 | 4,521 | 1,072 | 226 | — | 1,120 | 16,686 |
| Shell share of joint ventures and associates | | | | | | | | |
| At January 1 | 120 | 1,936 | 228 | — | — | — | — | 2,284 |
| At December 31 | 88 | 1,855 | 265 | — | — | — | — | 2,208 |
| | | | | | | | | | | | | | |
Proved undeveloped reserves 2024 |
| | | | | | | | | | | | | | | | | | | | | | | | | | |
| Thousand million standard cubic feet |
| | | | | North America | South America | |
| Europe | Asia | Oceania | Africa | USA | Canada | Total |
| Shell subsidiaries | | | | | | | | |
| At January 1 | 303 | 1,820 | 1,359 | 972 | 217 | 777 | 283 | 5,731 |
| At December 31 | 453 | 1,198 | 1,174 | 880 | 272 | — | 1,895 | 5,872 |
| Shell share of joint ventures and associates | | | | | | | | |
| At January 1 | 2 | 4,167 | — | — | — | — | — | 4,169 |
| At December 31 | 1 | 4,045 | 130 | — | — | — | — | 4,176 |
Financial Statements and Supplements | Supplementary information – oil and gas (unaudited) continued
| | | | | | | | | | | | | | |
| Proved developed and undeveloped reserves 2023 |
| | | | | | | | | | | | | | | | | | | | | | | | | | |
| Thousand million standard cubic feet |
| | | | | North America | South America | |
| Europe | Asia | Oceania | Africa | USA | Canada | Total |
| Shell subsidiaries | | | | | | | | |
| At January 1 | 2,884 | 9,078 | 5,949 | 1,841 | 521 | 956 | 1,819 | 23,048 |
| Revisions and reclassifications | (103) | 952 | 1,043 | 139 | 64 | 443 | 64 | 2,602 |
| Improved recovery | — | — | — | — | — | — | — | — |
| Extensions and discoveries | — | 55 | — | — | 43 | 224 | 14 | 336 |
| Purchases of minerals in place | — | — | 14 | — | 2 | — | — | 16 |
| Sales of minerals in place | — | (82) | — | — | (31) | — | — | (113) |
| Production [A] | (273) | (835) | (777) | (133) | (114) | (140) | (341) | (2,613) |
| At December 31 | 2,508 | 9,168 | 6,229 | 1,847 | 485 | 1,483 | 1,556 | 23,276 |
| Shell share of joint ventures and associates | | | | | | | | |
| At January 1 | 175 | 5,008 | 169 | — | — | — | 7 | 5,359 |
| Revisions and reclassifications | 3 | (141) | 60 | — | — | — | (6) | (84) |
| Improved recovery | — | — | — | — | — | — | — | — |
| Extensions and discoveries | — | — | 30 | — | — | — | — | 30 |
| Purchases of minerals in place | — | 1,516 | — | — | — | — | — | 1,516 |
| Sales of minerals in place | — | — | — | — | — | — | — | — |
| Production [B] | (56) | (280) | (31) | — | — | — | (1) | (368) |
| At December 31 | 122 | 6,103 | 228 | — | — | — | — | 6,453 |
Total | 2,630 | 15,271 | 6,457 | 1,847 | 485 | 1,483 | 1,556 | 29,729 |
| Reserves attributable to non-controlling interest in Shell subsidiaries at December 31 | — | — | — | — | — | — | — | — |
[A]Includes 233 thousand million standard cubic feet consumed in operations.
[B]Includes 27 thousand million standard cubic feet consumed in operations.
| | | | | | | | | | | | | | |
| Proved developed reserves 2023 |
| | | | | | | | | | | | | | | | | | | | | | | | | | |
| Thousand million standard cubic feet |
| | | | | North America | South America | |
| Europe | Asia | Oceania | Africa | USA | Canada | Total |
| Shell subsidiaries | | | | | | | | |
| At January 1 | 2,460 | 6,698 | 4,111 | 984 | 275 | 712 | 1,582 | 16,822 |
| At December 31 | 2,205 | 7,348 | 4,870 | 875 | 268 | 706 | 1,273 | 17,545 |
| Shell share of joint ventures and associates | | | | | | | | |
| At January 1 | 175 | 2,261 | 129 | — | — | — | 7 | 2,572 |
| At December 31 | 120 | 1,936 | 228 | — | — | — | — | 2,284 |
| | | | | | | | | | | | | | |
| Proved undeveloped reserves 2023 |
| | | | | | | | | | | | | | | | | | | | | | | | | | |
| Thousand million standard cubic feet |
| | | | | North America | South America | |
| Europe | Asia | Oceania | Africa | USA | Canada | Total |
| Shell subsidiaries | | | | | | | | |
| At January 1 | 424 | 2,380 | 1,838 | 857 | 246 | 244 | 237 | 6,226 |
| At December 31 | 303 | 1,820 | 1,359 | 972 | 217 | 777 | 283 | 5,731 |
| Shell share of joint ventures and associates | | | | | | | | |
| At January 1 | — | 2,747 | 40 | — | — | — | — | 2,787 |
| At December 31 | 2 | 4,167 | — | — | — | — | — | 4,169 |
Financial Statements and Supplements | Supplementary information – oil and gas (unaudited) continued
| | |
| Proved developed and undeveloped reserves 2022 |
| | | | | | | | | | | | | | | | | | | | | | | | | | |
| Thousand million standard cubic feet |
| | | | | North America | South America | |
| Europe | Asia | Oceania | Africa | USA | Canada | Total |
| Shell subsidiaries | | | | | | | | |
| At January 1 | 2,991 | 9,573 | 5,307 | 2,016 | 615 | 1,540 | 1,753 | 23,795 |
| Revisions and reclassifications | 131 | (906) | 959 | 15 | 22 | (540) | 288 | (31) |
| Improved recovery | — | — | — | — | — | — | — | — |
| Extensions and discoveries | 64 | 581 | 453 | — | 10 | 81 | 81 | 1,270 |
| Purchases of minerals in place | — | 682 | — | — | — | — | 33 | 715 |
| Sales of minerals in place | — | (53) | — | — | — | — | — | (53) |
| Production [A] | (302) | (799) | (770) | (190) | (126) | (125) | (336) | (2,648) |
| At December 31 | 2,884 | 9,078 | 5,949 | 1,841 | 521 | 956 | 1,819 | 23,048 |
| Shell share of joint ventures and associates | | | | | | | | |
| At January 1 | 312 | 3,560 | 71 | — | — | — | 6 | 3,949 |
| Revisions and reclassifications | (3) | (776) | 45 | — | — | — | 1 | (733) |
| Improved recovery | — | — | — | — | — | — | — | — |
| Extensions and discoveries | — | — | 77 | — | — | — | 3 | 80 |
| Purchases of minerals in place | — | 2,549 | — | — | — | — | — | 2,549 |
| Sales of minerals in place | — | — | — | — | — | — | — | — |
| Production [B] | (134) | (325) | (24) | — | — | — | (3) | (486) |
| At December 31 | 175 | 5,008 | 169 | — | — | — | 7 | 5,359 |
| Total [C] | 3,059 | 14,086 | 6,118 | 1,841 | 521 | 956 | 1,826 | 28,407 |
| Reserves attributable to non-controlling interest in Shell subsidiaries at December 31 | — | | — | — | — | — | — | — |
[A]Includes 228 thousand million standard cubic feet consumed in operations.
[B]Includes 31 thousand million standard cubic feet consumed in operations.
[C]As announced on February 28, 2023, Shell completed the sale of its 100% interest in Shell Onshore Ventures LLC, which held a 51.8% membership interest in Aera Energy LLC, to IKAV.
As of December 31, 2022, Shell had proved reserves of 31 thousand million standard cubic feet.
| | |
| Proved developed reserves 2022 |
| | | | | | | | | | | | | | | | | | | | | | | | | | |
| Thousand million standard cubic feet |
| | | | | North America | South America | |
| Europe | Asia | Oceania | Africa | USA | Canada | Total |
| Shell subsidiaries | | | | | | | | |
| At January 1 | 2,532 | 8,789 | 4,089 | 981 | 373 | 757 | 1,301 | 18,822 |
| At December 31 | 2,460 | 6,698 | 4,111 | 984 | 275 | 712 | 1,582 | 16,822 |
| Shell share of joint ventures and associates | | | | | | | | |
| At January 1 | 265 | 3,097 | 71 | — | — | — | 6 | 3,439 |
| At December 31 | 175 | 2,261 | 129 | — | — | — | 7 | 2,572 |
| | |
| Proved undeveloped reserves 2022 |
| | | | | | | | | | | | | | | | | | | | | | | | | | |
| Thousand million standard cubic feet |
| | | | | North America | South America | |
| Europe | Asia | Oceania | Africa | USA | Canada | Total |
| Shell subsidiaries | | | | | | | | |
| At January 1 | 459 | 784 | 1,218 | 1,035 | 242 | 783 | 452 | 4,973 |
| At December 31 | 424 | 2,380 | 1,838 | 857 | 246 | 244 | 237 | 6,226 |
| Shell share of joint ventures and associates | | | | | | | | |
| At January 1 | 47 | 463 | — | — | — | — | — | 510 |
| At December 31 | — | 2,747 | 40 | — | — | — | — | 2,787 |
Financial Statements and Supplements | Supplementary information – oil and gas (unaudited) continued
Standardised measure of discounted future cash flows
SEC Form 20-F requires the disclosure of a standardised measure of discounted future net cash flows, relating to proved reserves quantities and based on a 12-month unweighted arithmetic average sales price, calculated on a first-day-of-the-month basis, with cost factors based on those at the end of each year, currently enacted tax rates and a 10% annual discount factor. In our view, the information so calculated does not provide a reliable measure of future cash flows from proved reserves, nor does it permit a realistic comparison to be made of one entity with another because the assumptions used cannot reflect the varying circumstances within each entity. In addition, a substantial but unknown proportion of future real cash flows from oil and gas production activities is expected to derive from reserves which have already been discovered, but which cannot yet be regarded as proved.
Standardised measure of discounted future cash flows relating to proved reserves at December 31
| | | | | | | | | | | | | | |
| 2024 – Shell subsidiaries |
| | | | | | | | | | | | | | | | | | | | | | | | | | |
| | | | | | | | $ million |
| | | | | North America | South America | |
| Europe | Asia | Oceania | Africa | USA | Canada | Total |
| Future cash inflows | 37,955 | 123,846 | 55,232 | 28,879 | 32,916 | 48,952 | 102,670 | 430,450 |
| Future production costs | 11,866 | 29,048 | 24,991 | 10,232 | 12,472 | 19,831 | 46,858 | 155,298 |
| Future development costs | 6,522 | 13,124 | 8,866 | 5,971 | 9,953 | 4,905 | 18,146 | 67,487 |
| Future tax expenses | 16,295 | 35,843 | 3,306 | 6,345 | 1,710 | 5,492 | 10,910 | 79,901 |
| Future net cash flows | 3,272 | 45,831 | 18,069 | 6,331 | 8,781 | 18,724 | 26,756 | 127,764 |
| Effect of discounting cash flows at 10% | 703 | 19,582 | 6,456 | 2,793 | 1,386 | 13,675 | 11,592 | 56,187 |
| Standardised measure of discounted future net cash flows | 2,569 | 26,249 | 11,613 | 3,538 | 7,395 | 5,049 | 15,164 | 71,577 |
Non-controlling interest included | — | — | — | — | — | 2,525 | — | 2,525 |
| | | | | | | | | | | | | | |
| 2024 – Shell share of joint ventures and associates |
| | | | | | | | | | | | | | | | | | | | | | | | | | |
| | | | | | | | $ million |
| | | | | North America | South America | |
| Europe | Asia | Oceania | Africa | USA | Canada | Total |
| Future cash inflows | 1,068 | 68,554 | 2,542 | — | — | — | — | 72,164 |
| Future production costs | 571 | 26,367 | 1,697 | — | — | — | — | 28,635 |
| Future development costs | 608 | 8,260 | 491 | — | — | — | — | 9,359 |
| Future tax expenses | 132 | 23,786 | — | — | — | — | — | 23,918 |
| Future net cash flows | (243) | 10,141 | 354 | — | — | — | — | 10,252 |
| Effect of discounting cash flows at 10% | (151) | 5,338 | 81 | — | — | — | — | 5,268 |
| Standardised measure of discounted future net cash flows | (92) | 4,803 | 273 | — | — | — | — | 4,984 |
| | | | | | | | | | | | | | |
| 2023 – Shell subsidiaries |
| | | | | | | | | | | | | | | | | | | | | | | | | | |
| | | | | | | | $ million |
| | | | | North America | South America | |
| Europe | Asia | Oceania | Africa | USA | Canada | Total |
| Future cash inflows | 47,840 | 130,018 | 61,283 | 25,740 | 34,456 | 54,604 | 96,804 | 450,745 |
| Future production costs | 13,367 | 29,098 | 28,065 | 10,844 | 14,506 | 23,944 | 43,320 | 163,144 |
| Future development costs | 6,013 | 13,744 | 8,902 | 3,446 | 8,771 | 6,633 | 15,862 | 63,371 |
| Future tax expenses | 23,310 | 37,566 | 3,562 | 6,805 | 1,561 | 5,485 | 11,674 | 89,963 |
| Future net cash flows | 5,150 | 49,610 | 20,754 | 4,645 | 9,618 | 18,542 | 25,948 | 134,267 |
| Effect of discounting cash flows at 10% | 1,351 | 21,769 | 7,594 | 1,392 | 1,644 | 13,453 | 9,320 | 56,523 |
| Standardised measure of discounted future net cash flows | 3,799 | 27,841 | 13,160 | 3,253 | 7,974 | 5,089 | 16,628 | 77,744 |
Non-controlling interest included | — | — | — | — | — | 2,544 | — | 2,544 |
Financial Statements and Supplements | Supplementary information – oil and gas (unaudited) continued
| | | | | | | | | | | | | | |
| 2023 – Shell share of joint ventures and associates |
| | | | | | | | | | | | | | | | | | | | | | | | | | |
| | | | | | | | $ million |
| | | | | North America | South America | |
| Europe | Asia | Oceania | Africa | USA | Canada | Total |
| Future cash inflows | 1,885 | 71,003 | 1,478 | — | — | — | — | 74,366 |
| Future production costs | 792 | 27,725 | 1,136 | — | — | — | — | 29,653 |
| Future development costs | 601 | 8,267 | 155 | — | — | — | — | 9,023 |
| Future tax expenses | 386 | 24,495 | — | — | — | — | — | 24,881 |
| Future net cash flows | 106 | 10,516 | 187 | — | — | — | — | 10,809 |
| Effect of discounting cash flows at 10% | (83) | 6,539 | (59) | — | — | — | — | 6,397 |
| Standardised measure of discounted future net cash flows | 189 | 3,977 | 246 | — | — | — | — | 4,412 |
| | |
| 2022 – Shell subsidiaries |
| | | | | | | | | | | | | | | | | | | | | | | | | | |
| | | | | | | | $ million |
| | | | | North America | South America | |
| Europe | Asia | Oceania | Africa | USA | Canada | Total |
| Future cash inflows | 82,513 | 157,030 | 67,551 | 28,054 | 52,231 | 66,059 | 115,529 | 568,967 |
| Future production costs | 16,781 | 32,416 | 22,764 | 9,762 | 23,546 | 28,520 | 46,947 | 180,736 |
| Future development costs | 6,125 | 15,240 | 8,696 | 3,004 | 7,720 | 5,269 | 15,917 | 61,971 |
| Future tax expenses | 43,626 | 50,771 | 6,917 | 9,670 | 3,821 | 7,004 | 15,074 | 136,883 |
| Future net cash flows | 15,981 | 58,603 | 29,174 | 5,618 | 17,144 | 25,266 | 37,591 | 189,377 |
| Effect of discounting cash flows at 10% | 5,193 | 25,770 | 10,529 | 1,580 | 4,056 | 17,478 | 13,104 | 77,710 |
| Standardised measure of discounted future net cash flows | 10,788 | 32,833 | 18,645 | 4,038 | 13,088 | 7,788 | 24,487 | 111,667 |
| Non-controlling interest included | — | — | — | — | — | 3,314 | — | 3,314 |
| | |
| 2022 – Shell share of joint ventures and associates |
| | | | | | | | | | | | | | | | | | | | | | | | | | |
| | | | | | | | $ million |
| | | | | North America | South America | |
| Europe | Asia | Oceania | Africa | USA | Canada | Total |
| Future cash inflows | 6,576 | 86,464 | 1,227 | — | — | — | 577 | 94,844 |
| Future production costs | 3,626 | 31,569 | 760 | — | — | — | 162 | 36,117 |
| Future development costs | 778 | 7,139 | 536 | — | — | — | 15 | 8,468 |
| Future tax expenses | 2,257 | 34,551 | — | — | — | — | 81 | 36,889 |
| Future net cash flows | (85) | 13,205 | (69) | — | — | — | 319 | 13,370 |
| Effect of discounting cash flows at 10% | 85 | 6,152 | (130) | — | — | — | 67 | 6,174 |
| Standardised measure of discounted future net cash flows | (170) | 7,053 | 61 | — | — | — | 252 | 7,196 |
Financial Statements and Supplements | Supplementary information – oil and gas (unaudited) continued
Change in standardised measure of discounted future net cash flows relating to proved reserves
| | | | | | | | | | | |
| | | $ million |
| Shell
subsidiaries | Shell share
of joint ventures
and associates | Total |
| At January 1 | 77,744 | 4,412 | 82,156 |
| Net changes in prices and production costs | (6,032) | 813 | (5,219) |
| Revisions of previous reserves estimates | 16,196 | 2,180 | 18,376 |
| Extensions, discoveries and improved recovery | 6,559 | 277 | 6,836 |
| Purchases and sales of minerals in place | 475 | 0 | 475 |
| Development cost related to future production | (12,193) | (668) | (12,861) |
| Sales and transfers of oil and gas, net of production costs | (40,034) | (3,767) | (43,801) |
| Development cost incurred during the year | 11,298 | 1,260 | 12,558 |
| Accretion of discount | 11,892 | 1,144 | 13,036 |
| Net change in income tax | 5,672 | (667) | 5,005 |
| At December 31 | 71,577 | 4,984 | 76,561 |
| | | | | | | | | | | |
| | | $ million |
| Shell
subsidiaries | Shell share
of joint ventures
and associates | Total |
| At January 1 | 111,667 | 7,196 | 118,863 |
| Net changes in prices and production costs | (57,249) | (8,991) | (66,240) |
| Revisions of previous reserves estimates | 17,624 | (1,507) | 16,117 |
| Extensions, discoveries and improved recovery | 5,007 | 60 | 5,067 |
| Purchases and sales of minerals in place | (4,039) | 3,365 | (674) |
| Development cost related to future production | (8,339) | (2,011) | (10,350) |
| Sales and transfers of oil and gas, net of production costs | (41,345) | (1,976) | (43,321) |
| Development cost incurred during the year | 9,797 | 1,337 | 11,134 |
| Accretion of discount | 17,482 | 1,855 | 19,337 |
| Net change in income tax | 27,139 | 5,084 | 32,223 |
| At December 31 | 77,744 | 4,412 | 82,156 |
| | | | | | | | | | | |
| | | $ million |
| Shell
subsidiaries | Shell share
of joint ventures
and associates | Total |
| At January 1 | 70,465 | 5,058 | 75,523 |
| Net changes in prices and production costs | 107,637 | 10,441 | 118,078 |
| Revisions of previous reserves estimates | 12,378 | (5,544) | 6,834 |
| Extensions, discoveries and improved recovery | 7,422 | 439 | 7,861 |
| Purchases and sales of minerals in place | 3,187 | 10,374 | 13,561 |
| Development cost related to future production | (11,233) | (1,619) | (12,852) |
| Sales and transfers of oil and gas, net of production costs | (54,486) | (7,029) | (61,515) |
| Development cost incurred during the year | 10,079 | 1,545 | 11,624 |
| Accretion of discount | 9,796 | 888 | 10,684 |
| Net change in income tax | (43,578) | (7,357) | (50,935) |
| At December 31 | 111,667 | 7,196 | 118,863 |
Financial Statements and Supplements | Supplementary information – oil and gas (unaudited) continued
Oil and gas exploration and production activities capitalised costs
The aggregate amount of property, plant and equipment and intangible assets, excluding goodwill, relating to oil and gas exploration and production activities, and the aggregate amount of the related depreciation, depletion and amortisation at December 31 are shown in the tables below. Furthermore, long-lived assets that are classified as held for sale are presented separately in the balance sheet and are not included in the capitalised costs for oil and gas producing activities.
Shell subsidiaries
| | | | | | | | |
| | $ million |
| 2024 | 2023 |
| Cost | | |
| Proved properties [A] | 247,001 | 260,979 |
| Unproved properties | 7,214 | 8,711 |
| Support equipment and facilities | 12,164 | 11,767 |
| 266,379 | 281,457 |
| Depreciation, depletion and amortisation | | |
| Proved properties [A] | 159,802 | 164,860 |
| Unproved properties | 3,106 | 3,400 |
| Support equipment and facilities | 7,658 | 6,953 |
| 170,566 | 175,213 |
| Net capitalised costs | 95,813 | 106,244 |
[A]Includes capitalised asset decommissioning and restoration costs and related depreciation.
Shell share of joint ventures and associates
| | | | | | | | |
| | $ million |
| 2024 | 2023 |
| Cost | | |
| Proved properties [A] | 50,270 | 48,424 |
| Unproved properties | 1,309 | 1,372 |
| Support equipment and facilities | 4,752 | 4,673 |
| 56,331 | 54,469 |
| Depreciation, depletion and amortisation | | |
| Proved properties [A] | 38,068 | 36,844 |
| Unproved properties | 452 | 452 |
| Support equipment and facilities | 3,213 | 3,053 |
| 41,733 | 40,349 |
| Net capitalised costs | 14,598 | 14,120 |
[A]Includes capitalised asset decommissioning and restoration costs and related depreciation.
Oil and gas exploration and production activities costs incurred
Costs incurred during the year in oil and gas property acquisition, exploration and development activities, whether capitalised or charged to income currently, are shown in the tables below. Development costs include capitalised asset decommissioning and restoration costs (including increases or decreases arising from changes to cost estimates or to the discount rate applied to the obligations) and exclude costs of acquiring support equipment and facilities, but include depreciation thereon.
Shell subsidiaries
| | | | | | | | | | | | | | | | | | | | | | | | | | |
| | | | | | | | $ million |
| | | | | North America | South America | |
| Europe | Asia | Oceania | Africa | USA | Other [A] | Total |
| Acquisition of properties | | | | | | | | |
| Proved | 1 | | | 1 | | | | 2 |
| Unproved | | | | 9 | 68 | 1 | 19 | 97 |
| Exploration | 264 | 187 | 91 | 398 | 499 | 85 | 342 | 1,866 |
| Development | 1,728 | 1,812 | 1,904 | 1,002 | 4,302 | 402 | 2,568 | 13,718 |
[A]Comprises Canada, Mexico and Barbados.
Financial Statements and Supplements | Supplementary information – oil and gas (unaudited) continued
| | | | | | | | | | | | | | | | | | | | | | | | | | |
| | | | | | | | $ million |
| | | | | North America | South America | |
| Europe | Asia | Oceania | Africa | USA | Other [A] | Total |
| Acquisition of properties | | | | | | | | |
| Proved | 1 | — | — | — | 3 | — | — | 4 |
| Unproved | — | — | — | (6) | 18 | 34 | 45 | 91 |
| Exploration | 352 | 201 | 62 | 536 | 1,159 | 293 | 365 | 2,968 |
| Development | 1,431 | 1,701 | 1,039 | 353 | 3,265 | 309 | 1,982 | 10,080 |
[A]Comprises Canada, Mexico and Barbados.
| | | | | | | | | | | | | | | | | | | | | | | | | | |
| | | | | | | | $ million |
| | | | | North America | South America | |
| Europe | Asia | Oceania | Africa | USA | Other [A] | Total |
| Acquisition of properties | | | | | | | | |
| Proved | (1) | — | — | 102 | — | — | 184 | 285 |
| Unproved | — | — | — | (1) | 66 | 8 | 27 | 100 |
| Exploration | 422 | 141 | 21 | 259 | 721 | 140 | 591 | 2,295 |
| Development | 981 | 1,001 | 547 | 727 | 1,951 | 213 | 3,966 | 9,386 |
[A]Comprises Canada and Mexico.
Shell share of joint ventures and associates
Joint ventures and associates did not incur costs in the acquisition of oil and gas properties in 2024, 2023, and 2022.
| | | | | | | | | | | | | | | | | | | | | | | | | | |
| | | | | | | | $ million |
| | | | | North America | South America | |
| Europe | Asia | Oceania | Africa | USA | Other | Total |
| | | | | | | | |
| | | | | | | | |
| Exploration | | 43 | 10 | | | | | 53 |
| Development | 34 | 2,746 | 96 | | | | | 2,876 |
| | | | | | | | | | | | | | | | | | | | | | | | | | |
| | | | | | | | $ million |
| | | | | North America | South America | |
| Europe | Asia | Oceania | Africa | USA | Other | Total |
| | | | | | | | |
| | | | | | | | |
| Exploration | — | 65 | 5 | — | — | — | — | 70 |
| Development | 2 | 2,809 | 189 | — | — | — | — | 3,000 |
| | | | | | | | | | | | | | | | | | | | | | | | | | |
| | | | | | | | $ million |
| | | | | North America | South America | |
| Europe | Asia | Oceania | Africa | USA | Other | Total |
| Exploration | — | 50 | 3 | — | — | — | 51 | 104 |
| Development | (8) | 2,250 | 246 | — | — | — | 87 | 2,575 |
Financial Statements and Supplements | Supplementary information – oil and gas (unaudited) continued
Oil and gas exploration and production activities earnings
The earnings disclosed in this "extractive activities" section are only a subset of Shell's total earnings and as a result are not suitable for modelling Shell's integrated businesses, for which we refer to the full segment earnings and descriptions of Integrated Gas, Upstream and Chemicals and Products. These are available on pages 48, 55 and 77 respectively. The earnings disclosed in this "extractive activities" section are not adjusted for items such as impairment charges, restructuring charges and charges for onerous contract provisions. Full segment information to the Consolidated Financial Statements is available on pages 252-257.
The results of operations for oil and gas producing activities are shown in the tables below. Taxes other than income tax include royalties in cash to governments, without option to pay in kind outside USA and Canada.
Shell subsidiaries
| | | | | | | | | | | | | | | | | | | | | | | | | | |
| $ million |
| | | | | North America | South
America | |
| Europe | Asia | Oceania | Africa | USA | Other [A] | Total |
| Revenue | | | | | | | | |
| Third parties | 1,263 | 3,166 | 591 | 1,535 | 181 | 1,322 | 1,963 | 10,021 |
| Sales between businesses | 6,663 | 11,905 | 7,596 | 2,667 | 8,261 | 1,907 | 10,093 | 49,092 |
| Total | 7,926 | 15,071 | 8,187 | 4,202 | 8,442 | 3,229 | 12,056 | 59,113 |
| Production costs excluding taxes | 1,389 | 1,878 | 1,097 | 817 | 1,269 | 565 | 1,488 | 8,503 |
| Taxes other than income tax | 82 | 176 | 405 | 332 | — | — | 2,911 | 3,906 |
| Exploration | 707 | 152 | 13 | 503 | 533 | 34 | 469 | 2,411 |
| Depreciation, depletion and amortisation | 1,249 | 1,551 | 2,309 | 831 | 4,371 | 347 | 3,930 | 14,588 |
| Other costs/(income) | 2,302 | 1,583 | 303 | (33) | 541 | 2,126 | 1,400 | 8,222 |
| Earnings before taxation | 2,197 | 9,731 | 4,060 | 1,752 | 1,728 | 157 | 1,858 | 21,483 |
| Taxation charge/(credit) | 2,119 | 5,920 | 1,145 | 1,280 | 345 | 56 | 507 | 11,372 |
| Earnings after taxation | 78 | 3,811 | 2,915 | 472 | 1,383 | 101 | 1,351 | 10,111 |
[A]Comprises Canada, Mexico and Barbados
| | | | | | | | | | | | | | | | | | | | | | | | | | |
| $ million |
| | | | | North America | South
America | |
| Europe | Asia | Oceania | Africa | USA | Other [A] | Total |
| Revenue | | | | | | | | |
| Third parties | 1,328 | 2,967 | 754 | 1,431 | 123 | 827 | 1,934 | 9,364 |
| Sales between businesses | 7,452 | 11,717 | 7,113 | 2,344 | 8,711 | 2,382 | 10,663 | 50,382 |
| Total | 8,780 | 14,684 | 7,867 | 3,775 | 8,834 | 3,209 | 12,597 | 59,746 |
| Production costs excluding taxes | 1,655 | 1,827 | 1,181 | 659 | 1,259 | 677 | 1,514 | 8,772 |
| Taxes other than income tax | 102 | 165 | 412 | 284 | — | — | 3,307 | 4,270 |
| Exploration | 146 | 256 | 13 | 317 | 446 | 336 | 236 | 1,750 |
| Depreciation, depletion and amortisation | 1,687 | 1,324 | 2,760 | 1,471 | 4,330 | 1,094 | 4,100 | 16,766 |
| Other costs/(income) | 1,846 | 1,350 | 118 | (32) | 886 | 1,595 | 1,774 | 7,537 |
| Earnings before taxation | 3,344 | 9,762 | 3,383 | 1,076 | 1,913 | (493) | 1,666 | 20,651 |
| Taxation charge/(credit) | 2,362 | 5,544 | 976 | 343 | 330 | (13) | 1,088 | 10,630 |
| Earnings after taxation | 982 | 4,218 | 2,407 | 733 | 1,583 | (480) | 578 | 10,021 |
[A]Comprises Canada, Mexico and Barbados.
Financial Statements and Supplements | Supplementary information – oil and gas (unaudited) continued
| | | | | | | | | | | | | | | | | | | | | | | | | | | | |
| $ million |
| | | | | | | North America | South
America | |
| Europe | | Asia | | Oceania | Africa | USA | Other [A] | Total |
| Revenue | | | | | | | | | | |
| Third parties | 1,986 | | 3,832 | | 1,394 | 2,173 | 257 | 888 | 2,459 | 12,989 |
| Sales between businesses | 11,115 | | 14,503 | | 8,457 | 2,013 | 12,221 | 2,713 | 12,107 | 63,129 |
| Total | 13,101 | | 18,335 | | 9,851 | 4,186 | 12,478 | 3,601 | 14,566 | 76,118 |
| Production costs excluding taxes | 2,151 | | 1,956 | | 1,331 | 825 | 1,556 | 731 | 1,331 | 9,881 |
| Taxes other than income tax | 102 | | 831 | | 688 | 238 | (3) | — | 3,837 | 5,693 |
| Exploration | 274 | | 121 | | 74 | 233 | 621 | 92 | 297 | 1,712 |
| Depreciation, depletion and amortisation | 1,468 | | 2,090 | | (211) | 1,090 | 4,462 | 403 | 1,722 | 11,024 |
| Other costs/(income) | 3,772 | | 1,089 | | 135 | (336) | 629 | 1,557 | 1,030 | 7,876 |
| Earnings before taxation | 5,334 | | 12,248 | | 7,834 | 2,136 | 5,213 | 818 | 6,349 | 39,932 |
| Taxation charge/(credit) | 5,151 | | 7,561 | | 3,025 | 527 | 739 | 229 | 1,681 | 18,913 |
| Earnings after taxation | 183 | | 4,687 | | 4,809 | 1,609 | 4,474 | 589 | 4,668 | 21,019 |
[A]Comprises Canada, Mexico and Barbados.
Shell share of joint ventures and associates
| | | | | | | | | | | | | | | | | | | | | | | | | | |
| $ million |
| | | | | North America | South
America | |
| Europe | Asia | Oceania | Africa | USA | Canada | Total |
| Third-party revenue | 1,607 | 3,849 | 313 | — | — | — | — | 5,769 |
| Total | 1,607 | 3,849 | 313 | — | — | — | — | 5,769 |
| Production costs excluding taxes | 200 | 625 | 132 | — | — | — | — | 957 |
| Taxes other than income tax | 3 | 876 | 22 | — | — | — | — | 901 |
| Exploration | 2 | 23 | — | — | — | — | — | 25 |
| Depreciation, depletion and amortisation | 51 | 630 | 59 | — | — | — | 1 | 741 |
| Other costs/(income) | 102 | 77 | (20) | | | | (1) | 158 |
| Earnings before taxation | 1,249 | 1,618 | 120 | — | — | — | — | 2,987 |
| Taxation charge | 630 | 751 | — | — | — | — | — | 1,381 |
| Earnings after taxation | 619 | 867 | 120 | — | — | — | — | 1,606 |
| | | | | | | | | | | | | | | | | | | | | | | | | | |
| $ million |
| | | | | North America | South
America | |
| Europe | Asia | Oceania | Africa | USA | Canada | Total |
| Third-party revenue | 433 | 3,801 | 239 | — | — | — | 52 | 4,525 |
| Total | 433 | 3,801 | 239 | — | — | — | 52 | 4,525 |
| Production costs excluding taxes | 255 | 634 | 109 | — | — | — | 7 | 1,005 |
| Taxes other than income tax | 26 | 872 | 17 | — | — | — | 7 | 922 |
| Exploration | — | 9 | — | — | — | — | — | 9 |
| Depreciation, depletion and amortisation | 105 | 501 | 45 | — | — | — | 29 | 680 |
| Other costs/(income) | (2) | 29 | 17 | — | (7) | — | (10) | 27 |
| Earnings before taxation | 49 | 1,756 | 51 | — | 7 | — | 19 | 1,882 |
| Taxation charge | 25 | 868 | — | — | 2 | — | (20) | 875 |
| Earnings after taxation | 24 | 888 | 51 | — | 5 | — | 39 | 1,007 |
Financial Statements and Supplements | Supplementary information – oil and gas (unaudited) continued
| | | | | | | | | | | | | | | | | | | | | | | | | | |
| $ million |
| | | | | North America | South
America | |
| Europe | Asia | Oceania | Africa | USA | Canada | Total |
| Third-party revenue | 2,899 | 5,997 | 190 | — | — | — | 219 | 9,305 |
| Total | 2,899 | 5,997 | 190 | — | — | — | 219 | 9,305 |
| Production costs excluding taxes | 289 | 617 | 97 | — | — | — | 23 | 1,026 |
| Taxes other than income tax | 231 | 1,402 | 18 | — | — | — | 25 | 1,676 |
| Exploration | 1 | 26 | — | — | — | — | — | 27 |
| Depreciation, depletion and amortisation | 155 | 2,910 | 46 | — | — | — | 47 | 3,158 |
| Other costs/(income) | (2,061) | 184 | 14 | — | (2) | — | 18 | (1,847) |
| Earnings before taxation | 4,284 | 858 | 15 | — | 2 | — | 106 | 5,265 |
| Taxation charge | 2,958 | 1,437 | — | — | 1 | — | 22 | 4,418 |
| Earnings after taxation | 1,326 | (579) | 15 | — | 1 | — | 84 | 847 |
Acreage and wells
The tables below reflect acreage and wells of Shell subsidiaries, joint ventures and associates. The term "gross" refers to the total activity in which Shell subsidiaries, joint ventures and associates have an interest. The term "net" refers to the sum of the fractional interests owned by Shell subsidiaries plus the Shell share of joint ventures and associates' fractional interests. Data below are rounded to the nearest whole number.
| | |
| Oil and gas acreage (at December 31) |
| | | | | | | | | | | | | | | | | | | | | | | | | | | | | | | | | | | | | | | | | | | | | | | | | | | | |
| | | | | | | | | | | | | | | | | | | Thousand Acres |
| 2024 | | 2023 | | 2022 |
| Developed | Undeveloped | | Developed | | Undeveloped | | Developed | | Undeveloped |
| Gross | Net | Gross | Net | | Gross | | Net | | Gross | | Net | | | Gross | | Net | | Gross | | Net | |
| Europe | 5,916 | 1,915 | 5,578 | 3,075 | | 5,913 | | 1,854 | | 4,230 | | 2,105 | | | 6,008 | | 1,873 | | 6,121 | | 3,095 | |
| Asia | 20,664 | 7,365 | 32,009 | 16,445 | | 20,654 | | 7,360 | | 34,782 | | 18,515 | | | 20,678 | | 7,370 | | 33,382 | | 18,524 | |
| Oceania | 2,394 | 885 | 7,492 | 4,262 | | 2,381 | | 879 | | 7,618 | | 4,337 | | | 2,368 | | 854 | | 8,978 | | 4,940 | |
| Africa | 3,086 | 1,141 | 51,735 | 24,210 | | 3,086 | | 1,141 | | 57,376 | | 28,471 | | | 3,086 | | 1,141 | | 71,934 | | 37,199 | |
| North America - USA | 427 | 264 | 1,650 | 1,264 | | 388 | | 242 | | 1,984 | | 1,318 | | | 486 | | 286 | | 2,180 | | 1,457 | |
| North America - Mexico | — | — | 4,870 | 3,067 | | — | | — | | 5,406 | | 3,335 | | | — | | — | | 5,406 | | 3,335 | |
| North America - Canada | 390 | 217 | 1,150 | 649 | | 385 | | 213 | | 1,147 | | 646 | | | 379 | | 209 | | 1,126 | | 626 | |
| South America | 1,687 | 767 | 37,825 | 22,532 | | 1,678 | | 761 | | 31,164 | | 20,183 | | | 1,669 | | 755 | | 26,156 | | 14,393 | |
| Total | 34,564 | 12,554 | 142,309 | 75,504 | | 34,485 | | 12,450 | | 143,707 | | 78,910 | | | 34,674 | | 12,488 | | 155,283 | | 83,569 | |
Financial Statements and Supplements | Supplementary information – oil and gas (unaudited) continued
| | |
| Number of productive wells [A] (at December 31) |
| | | | | | | | | | | | | | | | | | | | | | | | | | | | | | | | | | | | | | | | | | | | | | | | | | | | | | | | |
| 2024 | | 2023 | | 2022 |
| Oil | Gas | | Oil | Gas | | Oil | Gas |
| Gross | Net | Gross | Net | | Gross | | Net | | Gross | | Net | | | Gross | Net | Gross | Net |
| Europe | 693 | 187 | 801 | 255 | | 754 | | 201 | | 930 | | 295 | | | 749 | 199 | 963 | 306 |
| Asia | 9,160 | 3,169 | 369 | 236 | | 8,536 | | 2,959 | | 374 | | 238 | | | 8,164 | 2,843 | 316 | 201 |
| Oceania | — | — | 3,776 | 2,240 | | — | | — | | 3,579 | | 2,127 | | | — | — | 3,382 | 1,964 |
| Africa | 324 | 107 | 92 | 36 | | 328 | | 108 | | 83 | | 33 | | | 321 | 106 | 84 | 34 |
| North America – USA | 178 | 107 | 21 | 15 | | 172 | [B] | 108 | [B] | 23 | | 16 | | | 13,021 | 6,617 | 26 | 18 |
| North America – Canada | — | — | 579 | 512 | | — | | — | | 545 | | 472 | | | — | — | 530 | 459 |
| South America | 418 | 204 | 69 | 44 | | 345 | | 170 | | 63 | | 39 | | | 293 | 144 | 58 | 35 |
| Total | 10,773 | 3,774 | 5,707 | 3,338 | | 10,135 | [C] | 3,546 | [C] | 5,597 | | 3,220 | | | 22,548 | 9,909 | 5,359 | 3,017 |
[A]The number of productive wells with multiple completions at December 31, 2024 was 313 Gross (125 Net); December 31, 2023: 346 Gross (142 Net); December 31, 2022: 869 Gross (400 Net).
[B]Corrected From 173 Gross (109 Net).
[C]Corrected From 10,136 Gross (3,547 Net).
| | |
| Number of net productive wells and dry holes drilled [A] |
| | | | | | | | | | | | | | | | | | | | | | | | | | |
| 2024 | | 2023 | | 2022 |
| Productive | Dry | | Productive | Dry | | Productive | Dry |
Exploratory | | | | | | | | |
| Europe | — | 4 | | — | 1 | | 5 | 2 |
| Asia | 14 | 11 | | 1 | 4 | | 4 | 5 |
| Oceania | 4 | 0 | | 24 | — | | 20 | 1 |
| Africa | 3 | 4 | | — | 2 | | — | 2 |
| North America - USA | 1 | 1 | | 2 | 5 | | — | 5 |
| North America - Canada | 2 | 1 | | 3 | — | | — | — |
| South America | 8 | 2 | | 10 | — | | 18 | 2 |
| Total | 32 | 23 | | 40 | 12 | | 47 | 17 |
| Development | | | | | | | | |
| Europe | 3 | — | | 2 | — | | 3 | — |
| Asia | 262 | — | | 255 | 3 | | 217 | — |
| Oceania | 102 | 1 | | 166 | 25 | | 84 | 1 |
| Africa | 2 | — | | 2 | — | | 5 | — |
| North America - USA | 5 | 1 | | 12 | — | | 54 | — |
| North America - Canada | 39 | 2 | | 10 | 1 | | 22 | — |
| South America | 24 | — | | 20 | — | | 23 | — |
| Total | 437 | 4 | | 467 | 29 | | 408 | 1 |
[A]Productive wells are wells with proved reserves allocated. Wells in the process of drilling are excluded and presented separately below.
Financial Statements and Supplements | Supplementary information – oil and gas (unaudited) continued
| | |
| Number of wells in the process of exploratory drilling [A] |
| | | | | | | | | | | | | | | | | | | | | | | | | | | | | | | | | | | | | | |
| 2024 |
| At January 1 | | Wells in the process of drilling at January 1 and allocated proved reserves during the year | Wells in the process of drilling at January 1 and determined as dry during the year | New wells in the process of drilling at December 31 | At December 31 |
| |
| Gross | | Net | | Gross | Net | Gross | Net | Gross | Net | Gross | Net |
| Europe | 11 | | 7 | | — | — | (4) | (4) | 4 | 3 | 11 | 5 |
| Asia | 61 | [B] | 24 | [B] | (34) | (12) | (7) | (4) | 12 | 5 | 32 | 13 |
| Oceania | 30 | | 11 | | (8) | (4) | — | — | 5 | 5 | 27 | 12 |
| Africa | 26 | | 15 | | (4) | (2) | (7) | (4) | — | — | 15 | 9 |
| North America - USA | 6 | [C] | 5 | [C] | (1) | (1) | (2) | (1) | 2 | — | 5 | 3 |
| North America - Canada | 6 | | 6 | | — | — | — | — | — | — | 6 | 6 |
| South America | 34 | [D] | 16 | [D] | (14) | (7) | (5) | (2) | 30 | 12 | 45 | 20 |
| Total | 174 | [E] | 84 | [E] | (61) | (26) | (25) | (15) | 53 | 25 | 141 | 68 |
[A]Wells in the process of exploratory drilling includes wells pending further evaluation.
[B]Corrected from 62 Gross (26 Net).
[C]Corrected from 7 Gross (5 Net).
[D]Corrected from 26 Gross (12 Net).
[E]Corrected from 168 Gross (82 Net).
| | |
| Number of wells in the process of development drilling |
| | | | | | | | | | | | | | | | | | | | | | | |
| 2024 |
| At January 1 | | | At December 31 |
| Gross | | Net | | | Gross | Net |
| Europe | 5 | | 2 | | | 9 | 6 |
| Asia | 127 | | 20 | | | 141 | 14 |
| Oceania | 165 | | 94 | | | 80 | 41 |
| Africa | 3 | | 1 | | | 4 | 1 |
| North America - USA | 5 | | 3 | | | 16 | 9 |
| North America - Canada | — | | — | | | 7 | 7 |
| South America | 26 | | 6 | | | 32 | 11 |
| Total | 331 | | 126 | | | 289 | 89 |
In addition to the present activities mentioned above, the following recovery methods are operational in the following countries: water flooding (Brazil (including water alternating gas), Brunei, Malaysia, Nigeria, Oman, the UK and the USA); gas injection (Brazil, Brunei, Kazakhstan, Malaysia, Nigeria and Oman); steam injection (the Netherlands, Oman and the USA), and polymer flooding (Oman).
Financial Statements and Supplements
The EU Taxonomy
Introduction
Regulation EU 2020/852 (the "Taxonomy Regulation" or the "Taxonomy") is a classification system for determining when an economic activity can be considered environmentally sustainable according to European Union (EU) standards. It aims to encourage investment in a low-carbon economy by creating common definitions of sustainability and mandatory disclosures to help investors make informed decisions.
Non-financial companies screen their eligible activities against the taxonomy's technical criteria for environmental sustainability and minimum safeguards. This allows them to calculate the share of revenue (turnover), capital expenditure (capex) and operating expenditure (opex) that can be classified as aligned.
Shell supports the EU's ambition to achieve net-zero emissions, which aligns with our own target to become a net-zero emissions energy business by 2050. We have reported against the taxonomy voluntarily since 2021 because we recognise the importance of increasing transparency about how companies are progressing in the energy transition.
In anticipation of the transposition by the Netherlands of the EU Corporate Sustainability Reporting Directive (CSRD) into national law, a key development for Shell in 2024 has been the voluntary implementation of the CSRD and the accompanying European Sustainability Reporting Standards (ESRS). This means Shell plc will come fully into scope of the EU Taxonomy Regulation upon the transposition of the CSRD by the Netherlands into law. The CSRD extends the EU Taxonomy Regulation's reporting obligation to third-country issuers that are listed on European exchanges.
Reporting scope
The taxonomy's reporting scope covers Shell's global business, based on the financial consolidation boundary. Shell's eligible activities include elements of our chemicals, power generation and storage, hydrogen, biogas and biofuels, electric vehicle charging, carbon capture and storage (CCS) and nature-based solutions (NBS) businesses. Our remaining businesses are non-eligible.
The taxonomy's reporting basis differs from that used in our financial statements, which are based on International Financial Reporting Standards (IFRS).
For example, the taxonomy does not recognise our interests in equity-accounted joint ventures and associates, goodwill, feasibility expenses or integrated value chains. These and other differences result in lower reported turnover, capex and opex under the taxonomy compared with our other disclosures.
Technical criteria
The taxonomy's technical criteria recognise stringent levels of environmental performance rather than transitional steps or alternative pathways. The complexity of the criteria and their reliance on EU standards can make the criteria difficult to interpret and apply, especially for activities outside the EU.
Eligible and aligned share of Shell's business
In 2024, Shell's eligible turnover was $9,353 million or 3.3% (2023: $8,445 million or 2.7%), capex was $3,270 million or 10.6% (2023: $6,032 million or 19.2%) and opex was $1,181 million or 24.7% (2023: $1,382 million or 25.9%).
In 2024, our aligned turnover was $698 million or 0.2% (2023: $542 million or 0.2%), capex was $1,849 million or 6.0% (2023: $4,173 million or 13.3%) and opex was $114 million or 2.4% (2023: $30 million or 0.6%). Our taxonomy-aligned activities include elements of our hydrogen, wind, solar, battery storage, biogas and biofuels, and EV charging businesses, excluding individual assets that are not currently aligned with the technical screening criteria.
The taxonomy does not provide a complete picture of our low-carbon business. Nevertheless, we support efforts to improve the framework and advance climate-related disclosure more broadly. For more information, see "Our journey to net zero" on pages 93-123.
| | |
Scope of taxonomy-eligible activities |
Financial Statements and Supplements | Supplementary information – EU Taxonomy disclosure continued
The taxonomy framework
The taxonomy establishes technical criteria for environmental sustainability across more than 150 economic activities and six environmental objectives.
An activity is taxonomy-eligible if it is described in a delegated act adopted under the EU Taxonomy Regulation. Such an activity is eligible regardless of whether it complies with the technical screening criteria.
An activity is taxonomy-aligned if it contributes substantially to one or more environmental objectives, does no significant harm to any of the other objectives, is carried out in compliance with minimum human and labour rights safeguards, and complies with the relevant technical screening criteria.
The EU has stated that the taxonomy will develop over time. It notes that the fact that an activity does not contribute substantially to one of the EU's environmental objectives does not necessarily mean it is not sustainable. Not all activities with the potential to make a substantial contribution to the environmental objectives are yet included in the framework.
Our eligibility and alignment
Our eligible and aligned turnover, capex and opex are presented in the table below.
Eligible turnover increased by $908 million, mainly due to revenues generated from the manufacture of chemicals and plastics. Eligible capex decreased by $2,762 million compared to 2023 due to fewer acquisitions of eligible activities in 2024. Eligible opex decreased by $201 million, and mainly consisted of operational costs in chemicals and plastics business.
Five economic activities were assessed as taxonomy-aligned, including the manufacture of hydrogen, electricity from wind, electricity from solar, storage of electricity and infrastructure enabling low-carbon road
transport. For a sixth activity, the manufacture of biogas and biofuels, we assessed some elements of our activities as taxonomy-aligned and some as non-aligned.
Aligned turnover increased by $156 million, mainly due to revenues generated by renewable energy and low-carbon road transport businesses. Aligned capex decreased by $2,324 million compared to capex reported in 2023 due to fewer acquisitions of eligible activities in 2024. Aligned opex increased by $84 million, mainly due to CrossWind Hollandse Kust (noord) offshore wind farm reaching commercial operations.
Basis of preparation
Shell seeks to prepare its disclosure in accordance with Delegated Regulation EU 2021/2178 (the "Disclosures Delegated Act") as well as several Commission Notices containing answers to frequently asked questions about taxonomy reporting issued between 2021 and 2024.
Shell has adopted a three-step process to prepare its taxonomy disclosure:
○we identify our eligible activities and map these to our assets and projects;
○we screen those activities for alignment with the technical criteria and the minimum safeguards; and
○we calculate the metrics for eligibility and alignment, based on the screening results.
Each step is discussed below.
Identification of eligible activities
Shell has assessed its business against the economic activities qualifying for the taxonomy's six environmental objectives. These include the activities listed in Delegated Regulation EU 2021/2139 (the "Climate Delegated Act", as amended), the gas-related activities listed in Delegated Regulation EU 2022/1214 (the "Complementary Climate Delegated Act") and the activities listed in Delegated Regulation EU 2023/2486 (the "Environmental Delegated Act").
| | |
EU taxonomy eligibility and alignment 2024 |
| | | | | | | | | | | | | | | | | | | | | | | |
| $ million, except where indicated |
| 2024 | | 2023 |
| Turnover | Capex | Opex | | Turnover | Capex | Opex |
Aligned | 698 | 1,849 | 114 | | 542 | 4,173 | 30 |
| Eligible | 9,353 | 3,270 | 1,181 | | 8,445 | 6,032 | 1,382 |
| Non-eligible | 274,959 | 27,632 | 3,603 | | 308,175 | 25,440 | 3,951 |
| Total | 284,312 | 30,902 | 4,784 | | 316,620 | 31,472 | 5,333 |
Aligned % of total | 0.2% | 6.0% | 2.4% | | 0.2% | 13.3% | 0.6% |
| Eligible % of total | 3.3% | 10.6% | 24.7% | | 2.7% | 19.2% | 25.9% |
| Non-eligible % of total | 96.7% | 89.4% | 75.3% | | 97.3% | 80.8% | 74.1% |
Financial Statements and Supplements | Supplementary information – EU Taxonomy disclosure continued
The taxonomy does not provide criteria for determining when an economic activity is in scope for reporting. According to EU guidance, an economic activity takes place when resources — such as capital, goods, labour, manufacturing techniques or intermediary products — are combined to produce specific goods or services. Based on this definition, Shell treats economic activities as in scope for reporting if they correspond to final goods or services offered for sale to customers, or if they are intended to be offered for sale in the future, based on current business plans. We do not report on factors of production or overheads, such as real estate or IT, since these do not represent a final good or service. We also do not report on activities which are immaterial to our results and are not intended to operate as stand-alone businesses, such as sales of waste heat or electricity from refineries and chemical plants.
For 2024, we identified a total of 13 economic activities as eligible for reporting. Although we screen our activities against all applicable environmental objectives, the discussion of our performance against the technical screening criteria focuses on the climate mitigation objective.
Alignment screening
Shell has developed an internal process to assess its eligible activities for alignment with the technical screening criteria and minimum safeguards. This is based on our understanding of the requirements of the Disclosures Delegated Act.
For each eligible activity, we begin by identifying the assets in scope for reporting. An asset is typically a discrete element of physical plant or equipment that contributes to an economic activity, such as a chemical plant or a wind farm, or a project in development that is intended to become an asset in the future.
Once the assets for each activity have been defined, we review the Substantial Contribution and Do No Significant Harm criteria and proceed to screen the assets. Screening is carried out by subject matter experts and subject to cross-checking at various levels.
The technical criteria are highly detailed, with extensive references to European standards and regulations, which are not widely used outside the region. Applying them poses several challenges including:
○where it is difficult to translate EU standards or regulations to a non-EU context;
○where Shell is materially aligned with a complex technical standard but varies in certain details;
○where the criteria are expressed in qualitative terms that are open to interpretation; or
○where the criteria are designed for a different range of applications than the one implied by the activity description.
These situations require us to apply judgement in determining whether the criteria are met.
Sometimes it is not possible to associate eligible turnover, capex or opex with a specific asset. For example, this can happen when we incur research and development expenses for an activity but the expenditure cannot be tied to a specific project for screening purposes. If alignment cannot be reasonably established according to our alignment screening process, the relevant amounts are classified as eligible but non-aligned.
Situations can arise where we may not be able to screen all assets in scope of an activity. This can occur when an activity contains a large number of early-stage projects and it is more efficient to focus on the most material projects and treat the remaining ones as eligible but
non-aligned. This situation can also arise when assets are acquired
late in the reporting cycle and there is insufficient time to conduct a technical screening, or when it has not been possible to obtain
information about a non-operated asset from joint-venture partners. Such assets are treated as eligible but non-aligned by default.
Assets that do not have eligible turnover, capex or opex to report are non-eligible and are not subject to technical screening. In practice, many early-stage projects are non-eligible because they have no turnover or capex to report, while feasibility expenditures incurred prior to a final investment decision (FID) are considered non-eligible under the taxonomy's definition of opex. Technical screening outcomes described in this disclosure apply only to eligible assets that have been screened in 2024.
Where some assets or products in scope of an economic activity are assessed as fully aligned with the technical screening criteria while others are not, an allocation method is applied so that only the aligned portion is included. For example, this can occur when some biofuels or biogas production is assessed as taxonomy-aligned and some is assessed as non-aligned.
Where there is uncertainty with regard to how to interpret or apply any of the technical screening criteria in our alignment screening process, the relevant assets are assessed as non-aligned. In such cases, we intend to monitor future developments and update our approach as appropriate.
Substantial Contribution
The taxonomy's Substantial Contribution criteria are designed to ensure that an economic activity either has a substantial positive impact on one of the environmental objectives or substantially reduces negative impacts on the environment. The criteria vary from activity to activity.
Shell screened its eligible economic activities against all relevant environmental objectives. For five activities, assets in scope for screening were assessed as aligned with the Substantial Contribution criteria for climate mitigation, including solar, wind, hydrogen manufacturing, storage of electricity and infrastructure enabling low-carbon road transport. For a sixth activity, manufacture of biogas and biofuels, some elements were assessed as aligned and some as non-aligned, based on the proportion of feedstock meeting the Substantial Contribution criteria.
Assets in scope for our remaining activities were assessed as non-aligned. For two activities, alignment could not be established due to uncertainty about how to interpret and apply the technical screening criteria. This was the case for carbon transport and storage, where there are questions as to whether local standards are equivalent to the international and EU standards referenced by the criteria, and for conservation forestry, where the technical criteria differ from internationally recognised carbon credit standards.
Do No Significant Harm
The taxonomy's Do No Significant Harm (DNSH) criteria are designed to ensure that an economic activity does not impede other environmental objectives being reached. The combination of the Substantial Contribution and Do No Significant Harm criteria is intended to ensure coherence between the taxonomy's objectives and to avoid progress towards one objective being made at the expense of another.
The DNSH criteria for activities contributing to climate change mitigation include detailed requirements for climate change adaptation, water, circular economy, pollution prevention and biodiversity. The criteria vary for each environmental objective and activity.
Shell screened its eligible economic activities against all relevant environmental objectives. For five activities, assets in scope for screening were assessed as aligned with the DNSH criteria for climate
Financial Statements and Supplements | Supplementary information – EU Taxonomy disclosure continued
mitigation, including solar, wind, hydrogen manufacturing, storage of electricity and infrastructure enabling low-carbon road transport. Some elements of our manufacture of biogas and biofuels activities were assessed as aligned and some as non-aligned.
In 2024, we continued to review physical climate risks for our eligible activities in line with the requirements of the Generic criteria for Do No Significant Harm to Climate Change Adaptation (Appendix A). The review of the eligible activities followed the approach set out in "Climate-related physical risks" on page 28.
In assessing alignment with the DNSH criteria, we were required to apply judgement to our electric vehicle charging activities. Electric vehicle charging is referenced by multiple economic activities in the taxonomy, each of which has a different set of technical screening criteria. There is a lack of consensus in the market about which one to apply to different electrical vehicle charging business models. Shell categorised all its electric vehicle charging businesses under the activity with the most stringent criteria, "6.15 Infrastructure Enabling Low-Carbon Road Transport and Public Transport".
For this activity, we assessed the DNSH criteria for waste management to be more applicable to medium- or large-scale infrastructure projects than to distributed, small-scale electric vehicle charging infrastructure with a small construction footprint. Our operating standards for electric vehicle charging include measures to limit waste generation and encourage re-use and recycling, which we assess as materially equivalent.
Our remaining eligible activities were assessed as non-aligned with one or more of the DNSH criteria. In several cases, we assessed ourselves as non-aligned due to uncertainty about how to interpret various aspects of the technical screening criteria.
Minimum safeguards
The taxonomy defines the minimum safeguards as procedures implemented by a company to ensure alignment with the OECD Guidelines for Multinational Enterprises and the UN Guiding Principles on Business and Human Rights, including the eight fundamental conventions identified in the Declaration of the International Labour Organisation on Fundamental Principles and Rights at Work and the International Bill of Human Rights.
Respect for human rights is embedded in the Shell General Business Principles and our Code of Conduct. We have an integrated approach to human rights that is embedded into our policies and processes, which are applicable to all employees and contractors. This approach is informed by the UN Guiding Principles on Business and Human Rights.
We assessed our taxonomy-eligible activities as compliant with the minimum safeguards [A]. See "Human Rights" on page 136 for more information.
Capex Plan assessment
As specified in the Disclosures Delegated Act, capex and opex can be treated as aligned when such expenditures form part of a Capex Plan aimed at expanding an aligned activity or upgrading an eligible activity to enable it to become aligned.
To qualify, a Capex Plan must be approved by management and disclosed at the economic activity aggregated level. The expansion or upgrade must take place within five years unless a longer period is justified by the specific features of the activity and the upgrade concerned. This can be up to a maximum of 10 years. The justification for a longer transition period must feature in the Capex Plan and be included
in the disclosure. If the Capex Plan fails to meet the conditions within the specified timeframe, previously published KPIs must be restated.
A lack of consensus exists in the market about how to interpret various aspects of the technical screening criteria. There is also uncertainty about how the criteria might apply to future performance conditions. Shell has therefore decided not to recognise any capex or opex as aligned under the Capex Plan provision in 2024.
Enabling and transitional activities
The taxonomy designates a subset of aligned activities as "enabling" or "transitional".
Transitional activities are those for which low-carbon alternatives are not yet available and which:
○have greenhouse gas emission levels that correspond to the best performance in the sector or industry;
○do not hamper the development and deployment of low-carbon alternatives; and
○do not lead to a lock-in of carbon-intensive assets, considering the economic lifetime of those assets.
Enabling activities are those which directly enable others to make a substantial contribution to an environmental objective, provided they:
○do not lead to a lock-in of assets that undermine long-term environmental goals, considering the economic lifetime of those assets; and
○have a substantial positive impact on the basis of life-cycle considerations.
An economic activity is only transitional or enabling if it complies with the technical screening criteria. In 2024, two of Shell's activities, storage of electricity and infrastructure enabling low-carbon road transport, qualified as enabling.
Calculating the key performance indicators
The taxonomy KPIs consist of separate measures for eligible and aligned turnover, capex and opex. Each measure is calculated as the amount associated with eligible or aligned economic activities (numerator) divided by the total (denominator). In 2024, there was no change in the approach to calculating the KPIs.
Turnover
The turnover KPI comprises the Revenue line from the Consolidated Statement of Income. This measure is reconciled as follows.
| | |
| EU Taxonomy turnover 2024 |
| | | | | | | | |
| | $ million |
| 2024 | 2023 |
| Revenue from contracts with customers | 274,347 | 301,013 |
| Revenue from other sources | 9,965 | 15,607 |
| Total EUT Turnover | 284,312 | 316,620 |
Shell's reporting of revenue in the Consolidated Statement of Income follows the IFRS definition, under which realised and unrealised gains and losses from hedging are recognised in revenue. We follow the same principles when calculating the numerator and denominator for the turnover KPI. In 2024, excluding hedging effects would have an immaterial impact on the numerator and denominator.
[A]In 2021, a notification to the Netherlands National Contact Point (NCP) was raised concerning the activities of SPDC as operator of the SPDC JV in Nigeria, in which SPDC holds a 30% interest. In 2024, the NCP, in its final statement, highlighted recommendations in relation to SPDC's community feedback mechanism (CFM). SPDC continues to implement improvements to further align this mechanism with the UNGP effectiveness criteria for operational grievance mechanisms. All our reported eligible economic activities fall outside of Nigeria. As detailed elsewhere in this report, on March 13, 2025, Shell completed the sale of SPDC to Renaissance.
Financial Statements and Supplements | Supplementary information – EU Taxonomy disclosure continued
Capex
The capex KPI comprises the Additions line from the "Consolidated Financial Statements" Note 11 – Goodwill and other intangible assets; and the Additions line from the "Consolidated Financial Statements" Note 12 – Property, plant and equipment. Goodwill is excluded from the measure.
When business combinations involving an eligible activity occur in a prior reporting period but purchase price allocation takes place within the current period, we recognise the resulting movements to property, plant and equipment and intangible assets as an addition. These amounts are contained within Note 11 – Goodwill and other intangible assets and Note 12 – Property, plant and equipment in the Sales, retirements and other movements line and are added to the numerator and denominator.
This measure is reconciled as follows.
| | | | | | | | |
| | $ million |
| 2024 | 2023 |
| Additions to property, plant and equipment | 26,446 | 25,831 |
| Additions to goodwill and other intangible assets | 4,611 | 6,994 |
| Less: Goodwill | 155 | 1,436 |
| Add: Other movements | — | 83 |
| Total EUT Capex | 30,902 | 31,472 |
The numerator for aligned capex comprises the part of eligible capex that is (a) associated with taxonomy-aligned economic activities; (b) part of a Capex Plan to expand an aligned activity or to enable a non-aligned activity to become aligned; and (c) related to the purchase of output from taxonomy-eligible activities. Due to limited guidance about how (c) should be calculated, our reporting focuses on (a) and (b) only.
The capex KPI as defined by the EU Taxonomy Regulation differs from Shell's cash capital expenditure measure. The latter monitors investing activities on a cash basis, excluding items such as lease additions, which do not necessarily result in cash outflows in the period. This measure comprises the following lines from the Consolidated Statement of Cash Flows: Capital expenditure, investments in joint ventures and associates and investments in equity securities. The cash capital expenditure is presented on page 256.
Opex
The taxonomy defines the opex KPI as costs associated with maintenance and repair, research and development and short-term leases. This is narrower than Shell's definition of operating expenses and does not capture all of our expenditure on otherwise eligible activities. This measure is reconciled as follows:
* Non-GAAP measure (see page 337).
| | | | | | | | |
| | $ million |
| 2024 | 2023 |
| Production and manufacturing expenses | 23,379 | 25,240 |
| Selling, distribution and administrative expenses | 12,439 | 13,433 |
| Research and development | 1,099 | 1,287 |
Total operating expenses* | 36,917 | 39,960 |
| Less: Non-maintenance expenses | 20,054 | 21,689 |
| Less: Selling, distribution and administrative expenses | 12,439 | 13,433 |
| Add: Expenses relating to short-term leases | 360 | 495 |
| Total EUT Opex | 4,784 | 5,333 |
The numerator for aligned opex comprises the part of eligible opex that is (a) associated with taxonomy-aligned economic activities; (b) part of a Capex Plan to expand an aligned activity or to enable a non-aligned activity to become aligned; and (c) related to the purchase of output from taxonomy-eligible activities. Due to limited guidance about how (c) should be calculated, our reporting focuses on (a) and (b) only.
Other accounting policies
Eligibility and alignment are calculated separately for each economic activity.
The reporting boundary for each economic activity is determined by the scope of the activity description contained in the relevant delegated act. This boundary frequently differs from our integrated value chains and segmental reporting. As a result, various adjustments are needed to calculate the required figures. For example, we exclude sales of third-party products as well as trading and retailing from the calculation of the KPIs. These are significant for Shell's integrated business model but are not eligible for the taxonomy. Although intra-group sales are non-eligible, sales to our trading business are used in certain circumstances to calculate the turnover attributable to eligible parts of the value chain.
When a reporting entity is engaged in multiple economic activities, an allocation method is applied so that only the appropriate part is included. Reconciliation is made to total turnover, capex and opex to avoid double counting.
In some cases, a subsidiary or other related undertaking may have interests in more than one economic activity but insufficient data are available to disaggregate turnover, capex and opex. In these cases, we allocate the KPIs to the activity that best describes the primary business of the entity.
Shell's eligible and aligned turnover, capex and opex are presented on pages 324-326 in accordance with templates specified in Annex II of the Disclosures Delegated Act as amended. Disclosures concerning our gas-related activities are presented on pages 327-330 in accordance with the requirements of the Disclosures Delegated Act, Articles 8(6) and (7), including the templates specified in Annex XII.
Financial Statements and Supplements | Supplementary information – EU Taxonomy disclosure continued
Contextual information on the KPIs
This section provides additional contextual information to accompany the presentation of the turnover, capex and opex KPIs on pages 324-326.
Turnover
In 2024, Shell's taxonomy-eligible turnover was $9,353 million or 3.3% of the total, which was an increase in absolute terms of $908 million compared with 2023. The economic activities that made the biggest contribution to eligible turnover were the manufacture of chemicals and plastics, renewable energy (including wind, solar and installation of renewable energy technologies), and the manufacture of biogas and biofuels.
Eligible turnover for the manufacture of chemicals and plastics increased to $8,032 million in 2024 from $7,082 million in 2023 as a result of higher production volume and better asset performance. Additional eligible revenues of $742 million were generated by renewable energy, driven by the wind business. Revenue of $258 million was generated by the manufacture of biogas and biofuels.
Aligned turnover of $698 million was an increase in absolute terms of $156 million compared with 2023, mainly due to revenues generated by renewable energy from wind and solar.
Capex
In 2024, Shell's taxonomy-eligible capex was $3,270 million or 10.6% of the total, which was a decrease of $2,762 million compared with 2023. The economic activities that made the biggest contribution to eligible capex included renewable energy from solar and wind, the manufacture of chemicals and plastics, and the manufacture of biogas and biofuels.
Eligible capex for solar and wind was a combined $1,026 million in 2024 compared with $1,596 million in 2023 due to further capital re-allocation in the renewable energy business. Eligible capex for chemicals and plastics was a combined $898 million in 2024
compared with $999 million in 2023, reflecting the completion of construction activities after a fire incident in one of our plants. Eligible capex for biogas and biofuels was $532 million in 2024 compared with $2,078 million in 2023, which was driven by a material business acquisition in 2023. Eligible capex for low-carbon transport, which includes electric vehicle charging and hydrogen mobility, was $336 million in 2024 compared with $991 million in 2023, driven by fewer acquisitions in the business. Eligible capex for hydrogen was $295 million in 2024 compared with $199 million in 2023.
Aligned capex of $1,849 million was a decrease in absolute terms of $2,324 million compared with 2023, mainly driven by fewer acquisitions and further capital reallocation in the renewable energy business.
Capex additions related to acquisitions through business combinations are aggregated with other capex additions.
Opex
In 2024, Shell's taxonomy-eligible opex was $1,181 million or 24.7% of the total, which was a decrease of $201 million compared with 2023. The economic activities that made the biggest contribution to eligible opex included manufacture of chemicals and plastics, renewable energy from wind, and manufacture of biogas and biofuels. Our chemicals business is relatively mature compared with our other eligible activities and therefore accounts for the largest share of opex.
Eligible opex for chemicals and plastics was a combined $971 million in 2024 compared with opex of $1,133 million in 2023, mainly due to global costs reduction. Lower opex for biogas and biofuels and hydrogen were mainly driven by lower research and development expenditure.
Aligned opex of $114 million was higher compared with $30 million reported in 2023, and mainly related to operational costs in the wind business.
Financial Statements and Supplements | Supplementary information – EU Taxonomy disclosure continued
| | |
| Scope of taxonomy-eligible activities |
| | | | | | | | | | | |
| No | Economic activity | Scope | Notes |
| 1.4 | Conservation forestry | Nature-based solutions projects that meet the EU taxonomy activity description for conservation forestry and generate capital assets. | [A], [B], [C] |
| 3.10 | Manufacture of hydrogen | Development and operation of hydrogen manufacturing assets. | [A], [B], [C], [D], [E] |
| 3.14 | Manufacture of organic basic chemicals | Manufacture of taxonomy-eligible chemical products. | [A], [B], [C], [D], [F] |
| 3.17 | Manufacture of plastics in primary form | Manufacture of polyethylene. | [A], [B], [C], [D] |
| 4.1 | Electricity generation using solar photovoltaic technology | Development and operation of solar photovoltaic power assets. | [A], [B], [C], [D], [G], [H] |
| 4.3 | Electricity generation from wind power | Development and operation of wind power assets. | [A], [B], [C], [D], [G], [H] |
| 4.10 | Storage of electricity | Development and operation of utility-scale facilities that store electricity. | [A], [B], [C], [G] |
| 4.13 | Manufacture of biogas and biofuels for use in transport and of bioliquids | Development and operation of assets for the manufacture of biogas and biofuels for use in transport. | [A], [B], [C], [D], [I] |
| 4.29 | Electricity generation from fossil gaseous fuels | Development and operation of gas-fired power assets. | [A], [B], [C], [D], [J], [K] |
| 5.11 | Transport of CO2 | Development and operation of CO2 transport assets. | [A], [B], [L], [M] |
| 5.12 | Underground permanent geological storage of CO2 | Development and operation of CO2 storage assets. | [A], [B], [L], [M] |
| 6.15 | Infrastructure enabling low-carbon road transport and public transport | Development and operation of electric vehicle charging points and hydrogen infrastructure for road transport. | [A], [B], [G] |
| 7.6 | Installation, maintenance and repair of renewable energy technologies | Installation, maintenance and repair of renewable energy technologies, on site. | [A], [B], [H] |
[A]Excludes interests in equity-accounted joint ventures and associates.
[B]Excludes feasibility expenses incurred prior to final investment decision.
[C]Excludes trading activity.
[D]Excludes sales of third-party products.
[E]Excludes integrated hydrogen units whose outputs are primarily intended for internal consumption, such as desulphurisation in refineries.
[F]Excludes taxonomy non-eligible chemical products.
[G]Excludes B2B/B2C retail sales of electricity.
[H]Excludes expenditure on renewable power projects to reduce Scope 1 and 2 emissions for taxonomy non-eligible target activities.
[I]Excludes ventures engaged in the development of feedstocks for biofuels manufacturing.
[J]Does not include integrated generation or cogeneration units whose outputs are primarily intended for internal consumption.
[K]Does not include upstream exploration and production, midstream, LNG or GTL.
[L]Excludes carbon capture, subject to the remarks in Note [M].
[M]For integrated CCS projects where it is not practically possible to distinguish carbon capture, transport and/or storage, the "Storage of CO₂" activity is used.
Financial Statements and Supplements | Supplementary information – EU Taxonomy disclosure continued
Turnover KPI
| | |
Proportion of turnover from products or services associated with taxonomy-aligned economic activities - 2024 [A] |
| | | | | | | | | | | | | | | | | | | | | | | | | | | | | | | | | | | | | | | | | | | | | | | | | | | | | | | | | | | | | | | | | | | | |
Financial year | 2024 | | | | Substantial contribution criteria | | DNSH criteria
('Do No Significant Harm') | | | Proportion of taxonomy-aligned (A.1.) or eligible (A.2.) turnover, year 2023 (18) | Category enabling activity (19) | Category transitional activity (20) |
Economic activities (1) | Code (2) | Turnover (3) | Proportion of turnover year 2024 (4) | | Climate change mitigation (5) | Climate change adaptation (6) | Water (7) | Pollution (8) | Circular economy (9) | Biodiversity (10) | | Climate change mitigation (11) | Climate change adaptation (12) | Water (13) | Pollution (14) | Circular economy (15) | Biodiversity (16) | Minimum safeguards (17) | |
| $ million | % | | Y; N; N/EL | | Y/N | | % | E | T |
| A. TAXONOMY-ELIGIBLE ACTIVITIES | | | | | | | | | | | | | | | | | | | | |
A.1 Environmentally sustainable activities (taxonomy-aligned) |
| Manufacture of hydrogen | CCM 3.10 | — | — | | Y | | | | | | | | Y | Y | Y | | Y | Y | | — | | |
| Electricity generation using solar photovoltaic technology | CCM 4.1 | 139 | — | | Y | | | | | | | | Y | | | Y | Y | Y | | — | | |
| Electricity generation from wind power | CCM 4.3 | 361 | 0.1% | | Y | | | | | | | | Y | | | Y | Y | Y | | 0.1% | | |
| Storage of electricity | CCM 4.10 | 1 | — | | Y | | | | | | | | Y | Y | | Y | Y | Y | | — | E | |
Manufacture of biogas and biofuels for use in transport and of bioliquids | CCM 4.13 | 22 | — | | Y | | | | | | | | Y | Y | Y | | Y | Y | | — | | |
Infrastructure enabling low-carbon road transport and public transport | CCM 6.15 | 175 | 0.1% | | Y | | | | | | | | Y | Y | Y | Y | Y | Y | | — | E | |
Turnover of environmentally sustainable activities (taxonomy-aligned) (A.1) | | 698 | 0.2% | | 100% | — | — | — | — | — | | | | | | | | | | 0.2% | | |
| Of which Enabling | | 176 | 0.1% | | — | — | — | — | — | — | | | | | | | | | | — | E | |
| Of which Transitional | | — | — | | — | — | — | — | — | — | | | | | | | | | | — | | T |
A.2 Taxonomy-eligible but not environmentally sustainable activities (not taxonomy-aligned) |
| | | | | EL; N/EL | | | | | | | | | | | | |
| Conservation forestry | CCM 1.4 | 1 | — | | EL | | | | | | | | | | | | | | | — | | |
| Manufacture of hydrogen | CCM 3.10 | — | — | | EL | | | | | | | | | | | | | | | — | | |
| Manufacture of organic basic chemicals | CCM 3.14 | 7,076 | 2.5% | | EL | | | | | | | | | | | | | | | 2.1% | | |
| Manufacture of plastics in primary form | CCM 3.17 | 956 | 0.3% | | EL | | | | | | | | | | | | | | | 0.1% | | |
| Electricity generation using solar photovoltaic technology | CCM 4.1 | — | — | | EL | | | | | | | | | | | | | | | — | | |
| Electricity generation from wind power | CCM 4.3 | — | — | | EL | | | | | | | | | | | | | | | — | | |
| Storage of electricity | CCM 4.10 | — | — | | EL | | | | | | | | | | | | | | | — | | |
| Manufacture of biogas and biofuels for use in transport and of bioliquids | CCM 4.13 | 236 | 0.1% | | EL | | | | | | | | | | | | | | | — | | |
| Electricity generation from fossil gaseous fuels | CCM 4.29 | 141 | — | | EL | | | | | | | | | | | | | | | — | | |
Transport of CO2 | CCM 5.11 | — | — | | EL | | | | | | | | | | | | | | | — | | |
Underground permanent geological storage of CO2 | CCM 5.12 | 3 | — | | EL | | | | | | | | | | | | | | | — | | |
| Infrastructure enabling low-carbon road transport and public transport | CCM 6.15 | — | — | | EL | | | | | | | | | | | | | | | — | | |
| Installation, maintenance and repair of renewable energy technologies | CCM 7.6 | 242 | 0.1% | | EL | | | | | | | | | | | | | | | 0.2% | | |
Turnover of taxonomy-eligible but not environmentally sustainable activities (not taxonomy-aligned) (A.2) | 8,655 | 3.0% | | | | | | | | | | | | | | | | | 2.5% | | |
| A.Turnover of taxonomy-eligible activities (A1 + A2) | 9,353 | 3.3% | | | | | | | | | | | | | | | | | 2.7% | | |
| B. TAXONOMY NON-ELIGIBLE ACTIVITIES | | | | | | | | | | | | | | | | | | | | |
Turnover of taxonomy non-eligible activities | 274,959 | 96.7% | | | | | | | | | | | | | | | | | 97.3% | | |
| TOTAL | 284,312 | 100% | | | | | | | | | | | | | | | | | 100% | | |
[A]The taxonomy's reporting basis differs from that used in Shell's financial statements, which are based on International Financial Reporting Standards. For example, the taxonomy does not recognise our interests in equity-accounted joint ventures and associates; goodwill; feasibility expenses; or the non-eligible parts of integrated value chains. These differences, and others, result in lower reported turnover, capex and opex under the taxonomy compared with our other disclosures.
Financial Statements and Supplements | Supplementary information – EU Taxonomy disclosure continued
Capex KPI
| | |
Proportion of capex from products or services associated with taxonomy-aligned economic activities - 2024 [A] |
| | | | | | | | | | | | | | | | | | | | | | | | | | | | | | | | | | | | | | | | | | | | | | | | | | | | | | | | | | | | | | | | | | | | |
Financial year | 2024 | | | | Substantial contribution criteria | | DNSH criteria
('Do No Significant Harm') | | | Proportion of taxonomy-aligned (A.1.) or eligible (A.2.) capex, year 2023 (18) | | |
Economic activities (1) | Code (2) | Capex (3) | Proportion of capex year 2024 (4) | | Climate change mitigation (5) | Climate change adaptation (6) | Water (7) | Pollution (8) | Circular economy (9) | Biodiversity (10) | | Climate change mitigation (11) | Climate change adaptation (12) | Water (13) | Pollution (14) | Circular economy (15) | Biodiversity (16) | Minimum safeguards (17) | | Category enabling activity (19) | Category transitional activity (20) |
| $ million | % | | Y; N; N/EL | | Y/N | | % | E | T |
| A. TAXONOMY-ELIGIBLE ACTIVITIES |
| A.1 Environmentally sustainable activities (taxonomy-aligned) |
| Manufacture of hydrogen | CCM3.10 | 235 | 0.8% | | Y | | | | | | | | Y | Y | Y | | Y | Y | | 0.6% | | |
| Electricity generation using solar photovoltaic technology | CCM 4.1 | 699 | 2.3% | | Y | | | | | | | | Y | | | Y | Y | Y | | 2.3% | | |
| Electricity generation from wind power | CCM 4.3 | 316 | 1.0% | | Y | | | | | | | | Y | | | Y | Y | Y | | 2.2% | | |
| Storage of electricity | CCM 4.10 | 18 | 0.1% | | Y | | | | | | | | Y | Y | | Y | Y | Y | | 0.3% | E | |
Manufacture of biogas and biofuels for use in transport and of bioliquids | CCM 4.13 | 254 | 0.8% | | Y | | | | | | | | Y | Y | Y | | Y | Y | | 4.7% | | |
Infrastructure enabling low-carbon road transport and public transport | CCM6.15 | 327 | 1.1% | | Y | | | | | | | | Y | Y | Y | Y | Y | Y | | 3.1% | E | |
| Capex of environmentally sustainable activities (taxonomy-aligned) (A.1) | | 1,849 | 6.0% | | 100% | — | — | — | — | — | | | | | | | | | | 13.3% | | |
| Of which Enabling | | 345 | 1.1% | | — | — | — | — | — | — | | | | | | | | | | 3.3% | E | |
| Of which Transitional | | — | — | | — | — | — | — | — | — | | | | | | | | | | — | | T |
A.2 Taxonomy-eligible but not environmentally sustainable activities (not taxonomy-aligned) |
| | | | | EL; N/EL | | | | | | | | | | | | |
| Conservation forestry | CCM 1.4 | 72 | 0.2% | | EL | | | | | | | | | | | | | | | — | | |
| Manufacture of hydrogen | CCM 3.10 | 60 | 0.2% | | EL | | | | | | | | | | | | | | | — | | |
| Manufacture of organic basic chemicals | CCM 3.14 | 734 | 2.4% | | EL | | | | | | | | | | | | | | | 2.8% | | |
| Manufacture of plastics in primary form | CCM 3.17 | 164 | 0.5% | | EL | | | | | | | | | | | | | | | 0.4% | | |
| Electricity generation using solar photovoltaic technology | CCM 4.1 | 9 | — | | EL | | | | | | | | | | | | | | | 0.4% | | |
| Electricity generation from wind power | CCM 4.3 | 2 | — | | EL | | | | | | | | | | | | | | | 0.1% | | |
| Storage of electricity | CCM 4.10 | — | — | | EL | | | | | | | | | | | | | | | — | | |
| Manufacture of biogas and biofuels for use in transport and of bioliquids | CCM 4.13 | 278 | 0.9% | | EL | | | | | | | | | | | | | | | 1.9% | | |
| Electricity generation from fossil gaseous fuels | CCM 4.29 | 12 | — | | EL | | | | | | | | | | | | | | | — | | |
Transport of CO2 | CCM 5.11 | — | — | | EL | | | | | | | | | | | | | | | — | | |
Underground permanent geological storage of CO2 | CCM 5.12 | 74 | 0.2% | | EL | | | | | | | | | | | | | | | 0.1% | | |
| Infrastructure enabling low-carbon road transport and public transport | CCM 6.15 | 9 | — | | EL | | | | | | | | | | | | | | | 0.1% | | |
| Installation, maintenance and repair of renewable energy technologies | CCM 7.6 | 7 | — | | EL | | | | | | | | | | | | | | | 0.1% | | |
Capex of taxonomy-eligible but not environmentally sustainable activities (not taxonomy-aligned) (A.2) | 1,421 | 4.6% | | | | | | | | | | | | | | | | | 5.9% | | |
A.Capex of taxonomy-eligible activities (A1+A2) | | 3,270 | 10.6% | | | | | | | | | | | | | | | | | 19.2% | | |
| B. TAXONOMY NON-ELIGIBLE ACTIVITIES |
Capex of taxonomy non-eligible activities | | 27,632 | 89.4% | | | | | | | | | | | | | | | | | 80.8% | | |
| TOTAL | | 30,902 | 100% | | | | | | | | | | | | | | | | | 100% | | |
[A]The taxonomy's reporting basis differs from that used in Shell's financial statements, which are based on International Financial Reporting Standards. For example, the taxonomy does not recognise our interests in equity-accounted joint ventures and associates; goodwill; feasibility expenses; or the non-eligible parts of integrated value chains. These differences, and others, result in lower reported turnover, capex and opex under the taxonomy compared with our other disclosures.
Financial Statements and Supplements | Supplementary information – EU Taxonomy disclosure continued
Opex KPI
| | |
Proportion of opex from products or services associated with taxonomy-aligned economic activities - 2024 [A] |
| | | | | | | | | | | | | | | | | | | | | | | | | | | | | | | | | | | | | | | | | | | | | | | | | | | | | | | | | | | | | | | | | | | | |
Financial year | 2024 | | | | Substantial contribution criteria | | DNSH criteria
('Do No Significant Harm') | | | Proportion of taxonomy-aligned (A.1.) or eligible (A.2.) opex, year 2023 (18) | | |
Economic activities (1) | Code (2) | Opex (3) | Proportion of opex year 2024 (4) | | Climate change mitigation (5) | Climate change adaptation (6) | Water (7) | Pollution (8) | Circular economy (9) | Biodiversity (10) | | Climate change mitigation (11) | Climate change adaptation (12) | Water (13) | Pollution (14) | Circular economy (15) | Biodiversity (16) | Minimum safeguards (17) | | Category enabling activity (19) | Category transitional activity (20) |
| $ million | % | | Y; N; N/EL | | Y/N | | % | E | T |
| A. TAXONOMY-ELIGIBLE ACTIVITIES |
| A.1 Environmentally sustainable activities (taxonomy-aligned) |
| Manufacture of hydrogen | CCM 3.10 | — | — | | Y | | | | | | | | Y | Y | Y | | Y | Y | | — | | |
| Electricity generation using solar photovoltaic technology | CCM 4.1 | 3 | 0.1% | | Y | | | | | | | | Y | | | Y | Y | Y | | — | | |
| Electricity generation from wind power | CCM 4.3 | 106 | 2.2% | | Y | | | | | | | | Y | | | Y | Y | Y | | 0.5% | | |
| Storage of electricity | CCM 4.10 | — | — | | Y | | | | | | | | Y | Y | | Y | Y | Y | | — | E | |
| Manufacture of biogas and biofuels for use in transport and of bioliquids | CCM 4.13 | 5 | 0.1% | | Y | | | | | | | | Y | Y | Y | | Y | Y | | — | | |
| Infrastructure enabling low-carbon road transport and public transport | CCM6.15 | — | — | | Y | | | | | | | | Y | Y | Y | Y | Y | Y | | 0.1% | E | |
Opex of environmentally sustainable activities (taxonomy-aligned) (A.1) | 114 | 2.4% | | 100% | — | — | — | — | — | | | | | | | | | | 0.6% | | |
| Of which Enabling | | — | — | | — | — | — | — | — | — | | | | | | | | | | 0.1% | E | |
| Of which Transitional | | — | — | | — | — | — | — | — | — | | | | | | | | | | — | | T |
A.2 Taxonomy-eligible but not environmentally sustainable activities (not taxonomy-aligned) |
| | | | | EL; N/EL | | | | | | | | | | | | |
| Conservation forestry | CCM 1.4 | — | — | | EL | | | | | | | | | | | | | | | — | | |
| Manufacture of hydrogen | CCM 3.10 | 9 | 0.2% | | EL | | | | | | | | | | | | | | | 1.1% | | |
| Manufacture of organic basic chemicals | CCM 3.14 | 683 | 14.3% | | EL | | | | | | | | | | | | | | | 14.6% | | |
| Manufacture of plastics in primary form | CCM 3.17 | 288 | 6.0% | | EL | | | | | | | | | | | | | | | 6.7% | | |
| Electricity generation using solar photovoltaic technology | CCM 4.1 | — | — | | EL | | | | | | | | | | | | | | | — | | |
| Electricity generation from wind power | CCM 4.3 | 15 | 0.3% | | EL | | | | | | | | | | | | | | | 0.3% | | |
| Storage of electricity | CCM 4.10 | — | — | | EL | | | | | | | | | | | | | | | 0.1% | | |
| Manufacture of biogas and biofuels for use in transport and of bioliquids | CCM 4.13 | 62 | 1.3% | | EL | | | | | | | | | | | | | | | 2.4% | | |
| Electricity generation from fossil gaseous fuels | CCM 4.29 | 1 | — | | EL | | | | | | | | | | | | | | | — | | |
Transport of CO2 | CCM 5.11 | — | — | | EL | | | | | | | | | | | | | | | — | | |
Underground permanent geological storage of CO2 | CCM 5.12 | 4 | 0.1% | | EL | | | | | | | | | | | | | | | 0.1% | | |
| Infrastructure enabling low-carbon road transport and public transport | CCM 6.15 | 5 | 0.1% | | EL | | | | | | | | | | | | | | | — | | |
| Installation, maintenance and repair of renewable energy technologies | CCM 7.6 | — | — | | EL | | | | | | | | | | | | | | | — | | |
Opex of taxonomy-eligible but not environmentally sustainable activities (not taxonomy-aligned) (A.2) | 1,067 | 22.3% | | | | | | | | | | | | | | | | | 25.4% | | |
A.Opex of taxonomy-eligible activities (A1+A2) | 1,181 | 24.7% | | | | | | | | | | | | | | | | | 25.9% | | |
| B. TAXONOMY NON-ELIGIBLE ACTIVITIES |
Opex of taxonomy non-eligible activities | 3,603 | 75.3% | | | | | | | | | | | | | | | | | 74.1% | | |
| TOTAL | | 4,784 | 100% | | | | | | | | | | | | | | | | | 100% | | |
[A]The taxonomy's reporting basis differs from that used in Shell's financial statements, which are based on International Financial Reporting Standards. For example, the taxonomy does not recognise our interests in equity-accounted joint ventures and associates; goodwill; feasibility expenses; or the non-eligible parts of integrated value chains. These differences, and others, result in lower reported turnover, capex and opex under the taxonomy compared with our other disclosures.
Financial Statements and Supplements | Supplementary information – EU Taxonomy disclosure continued
Disclosures for nuclear and fossil gas activities
| | |
| Template 1: Nuclear and fossil gas related activities |
| | | | | | | | |
| Row | | 2024 |
| Nuclear energy related activities | |
| 1 | The undertaking carries out, funds or has exposures to research, development, demonstration and deployment of innovative electricity generation facilities that produce energy from nuclear processes with minimal waste from the fuel cycle. | No |
| 2 | The undertaking carries out, funds or has exposures to construction and safe operation of new nuclear installations to produce electricity or process heat, including for the purposes of district heating or industrial processes such as hydrogen production, as well as their safety upgrades, using best available technologies. | No |
| 3 | The undertaking carries out, funds or has exposures to safe operation of existing nuclear installations that produce electricity or process heat, including for the purposes of district heating or industrial processes such as hydrogen production from nuclear energy, as well as their safety upgrades. | No |
| Fossil gas related activities | |
| 4 | The undertaking carries out, funds or has exposures to construction or operation of electricity generation facilities that produce electricity using fossil gaseous fuels. | Yes |
| 5 | The undertaking carries out, funds or has exposures to construction, refurbishment, and operation of combined heat/cool and power generation facilities using fossil gaseous fuels. | No [A] |
| 6 | The undertaking carries out, funds or has exposures to construction, refurbishment and operation of heat generation facilities that produce heat/cool using fossil gaseous fuels. | No [A] |
[A]Shell's facilities include integrated gas-fired heating, cooling and power generation units which support one or more primary activities. Such units do not operate on a stand-alone basis and are not treated as a separate economic activity for reporting purposes.
| | |
Template 2: Taxonomy-aligned economic activities (denominator), 2024 |
| | | | | | | | | | | | | | | | | | | | | | | | | | | | | | | | | | | | | | | | | | | | | | | | | | | | | | | | | | | | | | | | | |
| | | | | | | | | | | | | | | | $ million, except where indicated |
| | Turnover | | Capex | | Opex |
| | CCM + CCA | Climate change mitigation (CCM) | Climate change adaptation (CCA) | | CCM + CCA | Climate change mitigation (CCM) | Climate change adaptation (CCA) | | CCM + CCA | Climate change mitigation (CCM) | Climate change adaptation (CCA) |
| Row | Economic activities | Amount | % | Amount | % | Amount | % | | Amount | % | Amount | % | Amount | % | | Amount | % | Amount | % | Amount | % |
| 1 | Amount and proportion of taxonomy-eligible but not taxonomy-aligned economic activity referred to in Section 4.26 of Annexes I and II to Delegated Regulation 2021/2139 in the denominator of the applicable KPI | — | — | — | — | — | — | | — | — | — | — | — | — | | — | — | — | — | — | — |
| 2 | Amount and proportion of taxonomy-aligned economic activity referred to in Section 4.27 of Annexes I and II to Delegated Regulation 2021/2139 in the denominator of the applicable KPI | — | — | — | — | — | — | | — | — | — | — | — | — | | — | — | — | — | — | — |
| 3 | Amount and proportion of taxonomy-aligned economic activity referred to in Section 4.28 of Annexes I and II to Delegated Regulation 2021/2139 in the denominator of the applicable KPI | — | — | — | — | — | — | | — | — | — | — | — | — | | — | — | — | — | — | — |
| 4 | Amount and proportion of taxonomy-aligned economic activity referred to in Section 4.29 of Annexes I and II to Delegated Regulation 2021/2139 in the denominator of the applicable KPI | 0 | 0% | 0 | 0% | — | — | | 0 | 0% | 0 | 0% | — | — | | 0 | 0% | 0 | 0% | — | — |
| 5 | Amount and proportion of taxonomy-aligned economic activity referred to in Section 4.30 of Annexes I and II to Delegated Regulation 2021/2139 in the denominator of the applicable KPI | — | — | — | — | — | — | | — | — | — | — | — | — | | — | — | — | — | — | — |
| 6 | Amount and proportion of taxonomy-aligned economic activity referred to in Section 4.31 of Annexes I and II to Delegated Regulation 2021/2139 in the denominator of the applicable KPI | — | — | — | — | — | — | | — | — | — | — | — | — | | — | — | — | — | — | — |
| 7 | Amount and proportion of other taxonomy-aligned economic activities not referred to in rows 1 to 6 above in the denominator of the applicable KPI | 698 | 0.2% | 698 | 0.2% | — | — | | 1,849 | 6.0% | 1,849 | 6.0% | — | — | | 114 | 2.4% | 114 | 2.4% | — | — |
| 8 | Total applicable KPI | 284,312 | 100% | 284,312 | 100% | — | — | | 30,902 | 100% | 30,902 | 100% | — | — | | 4,784 | 100% | 4,784 | 100% | — | — |
Financial Statements and Supplements | Supplementary information – EU Taxonomy disclosure continued
| | |
Template 3: Taxonomy-aligned economic activities (numerator), 2024 |
| | | | | | | | | | | | | | | | | | | | | | | | | | | | | | | | | | | | | | | | | | | | | | | | | | | | | | | | | | | | | | | | | |
| | | | | | | | | | | | | | | | $ million, except where indicated |
| | Turnover | | Capex | | Opex |
| | CCM + CCA | Climate change mitigation (CCM) | Climate change adaptation (CCA) | | CCM + CCA | Climate change mitigation (CCM) | Climate change adaptation (CCA) | | CCM + CCA | Climate change mitigation (CCM) | Climate change adaptation (CCA) |
| Row | Economic activities | Amount | % | Amount | % | Amount | % | | Amount | % | Amount | % | Amount | % | | Amount | % | Amount | % | Amount | % |
| 1 | Amount and proportion of taxonomy-aligned economic activity referred to in Section 4.26 of Annexes I and II to Delegated Regulation 2021/2139 in the numerator of the applicable KPI | — | — | — | — | — | — | | — | — | — | — | — | — | | — | — | — | — | — | — |
| 2 | Amount and proportion of taxonomy-aligned economic activity referred to in Section 4.27 of Annexes I and II to Delegated Regulation 2021/2139 in the numerator of the applicable KPI | — | — | — | — | — | — | | — | — | — | — | — | — | | — | — | — | — | — | — |
| 3 | Amount and proportion of taxonomy-aligned economic activity referred to in Section 4.28 of Annexes I and II to Delegated Regulation 2021/2139 in the numerator of the applicable KPI | — | — | — | — | — | — | | — | — | — | — | — | — | | — | — | — | — | — | — |
| 4 | Amount and proportion of taxonomy-aligned economic activity referred to in Section 4.29 of Annexes I and II to Delegated Regulation 2021/2139 in the numerator of the applicable KPI | 0 | 0% | 0 | 0% | — | — | | 0 | 0% | 0 | 0% | — | — | | 0 | 0% | 0 | 0% | — | — |
| 5 | Amount and proportion of taxonomy-aligned economic activity referred to in Section 4.30 of Annexes I and II to Delegated Regulation 2021/2139 in the numerator of the applicable KPI | — | — | — | — | — | — | | — | — | — | — | — | — | | — | — | — | — | — | — |
| 6 | Amount and proportion of taxonomy-aligned economic activity referred to in Section 4.31 of Annexes I and II to Delegated Regulation 2021/2139 in the numerator of the applicable KPI | — | — | — | — | — | — | | — | — | — | — | — | — | | — | — | — | — | — | — |
| 7 | Amount and proportion of other taxonomy-aligned economic activities not referred to in rows 1 to 6 above in the numerator of the applicable KPI | 698 | 0.2% | 698 | 0.2% | — | — | | 1,849 | 6.0% | 1,849 | 6.0% | — | — | | 114 | 2.4% | 114 | 2.4% | — | — |
| 8 | Total amount and proportion of taxonomy-aligned economic activities in the numerator of the applicable KPI | 698 | 0.2% | 698 | 0.2% | — | — | | 1,849 | 6.0% | 1,849 | 6.0% | — | — | | 114 | 2.4% | 114 | 2.4% | — | — |
Financial Statements and Supplements | Supplementary information – EU Taxonomy disclosure continued
| | |
Template 4: Taxonomy-eligible but not taxonomy-aligned economic activities, 2024 |
| | | | | | | | | | | | | | | | | | | | | | | | | | | | | | | | | | | | | | | | | | | | | | | | | | | | | | | | | | | | | | | | | |
| | | | | | | | | | | | | | | | $ million, except where indicated |
| | Turnover | | Capex | | Opex |
| | CCM + CCA | Climate change mitigation (CCM) | Climate change adaptation (CCA) | | CCM + CCA | Climate change mitigation (CCM) | Climate change adaptation (CCA) | | CCM + CCA | Climate change mitigation (CCM) | Climate change adaptation (CCA) |
| Row | Economic activities | Amount | % | Amount | % | Amount | % | | Amount | % | Amount | % | Amount | % | | Amount | % | Amount | % | Amount | % |
| 1 | Amount and proportion of taxonomy-eligible but not taxonomy-aligned economic activity referred to in Section 4.26 of Annexes I and II to Delegated Regulation 2021/2139 in the denominator of the applicable KPI | — | — | — | — | — | — | | — | — | — | — | — | — | | — | — | — | — | — | — |
| 2 | Amount and proportion of taxonomy-eligible but not taxonomy-aligned economic activity referred to in Section 4.27 of Annexes I and II to Delegated Regulation 2021/2139 in the denominator of the applicable KPI | — | — | — | — | — | — | | — | — | — | — | — | — | | — | — | — | — | — | — |
| 3 | Amount and proportion of taxonomy-eligible but not taxonomy-aligned economic activity referred to in Section 4.28 of Annexes I and II to Delegated Regulation 2021/2139 in the denominator of the applicable KPI | — | — | — | — | — | — | | — | — | — | — | — | — | | — | — | — | — | — | — |
| 4 | Amount and proportion of taxonomy-eligible but not taxonomy-aligned economic activity referred to in Section 4.29 of Annexes I and II to Delegated Regulation 2021/2139 in the denominator of the applicable KPI | 141 | | 0.0 | % | 141 | | 0.0 | % | — | | — | | | 12 | | 0.0 | % | 12 | | 0.0 | % | — | | — | | | 1 | | 0.1 | % | 1 | | 0.1 | % | — | | — | |
| 5 | Amount and proportion of taxonomy-eligible but not taxonomy-aligned economic activity referred to in Section 4.30 of Annexes I and II to Delegated Regulation 2021/2139 in the denominator of the applicable KPI | — | — | — | — | — | — | | — | — | — | — | — | — | | — | — | — | — | — | — |
| 6 | Amount and proportion of taxonomy-eligible but not taxonomy-aligned economic activity referred to in Section 4.31 of Annexes I and II to Delegated Regulation 2021/2139 in the denominator of the applicable KPI | — | — | — | — | — | — | | — | — | — | — | — | — | | — | — | — | — | — | — |
| 7 | Amount and proportion of other taxonomy-eligible but not taxonomy-aligned economic activities not referred to in rows 1 to 6 above in the denominator of the applicable KPI | 8,514 | 3.0% | 8,514 | 3.0% | — | — | | 1,409 | 4.6% | 1,409 | 4.6% | — | — | | 1,066 | 22.3% | 1,066 | 22.3% | — | — |
| 8 | Total amount and proportion of taxonomy-eligible but not taxonomy-aligned economic activities in the denominator of the applicable KPI | 8,655 | 3.0% | 8,655 | 3.0% | — | — | | 1,421 | 4.6% | 1,421 | 4.6% | — | — | | 1,067 | 22.3% | 1,067 | 22.3% | — | — |
Financial Statements and Supplements | Supplementary information – EU Taxonomy disclosure continued
| | |
Template 5: Taxonomy non-eligible economic activities, 2024 |
| | | | | | | | | | | | | | | | | | | | | | | | | | | | | |
| | | | | | | | $ million, except where indicated |
| | Turnover | | Capex | | Opex |
| Row | Economic activities | Amount | % | | Amount | % | | Amount | % |
| 1 | Amount and proportion of economic activity referred to in row 1 of Template 1 that is taxonomy non-eligible in accordance with Section 4.26 of Annexes I and II to Delegated Regulation 2021/2139 in the denominator of the applicable KPI | — | — | | — | — | | — | — |
| 2 | Amount and proportion of economic activity referred to in row 2 of Template 1 that is taxonomy non-eligible in accordance with Section 4.27 of Annexes I and II to Delegated Regulation 2021/2139 in the denominator of the applicable KPI | — | — | | — | — | | — | — |
| 3 | Amount and proportion of economic activity referred to in row 3 of Template 1 that is taxonomy non-eligible in accordance with Section 4.28 of Annexes I and II to Delegated Regulation 2021/2139 in the denominator of the applicable KPI | — | — | | — | — | | — | — |
| 4 | Amount and proportion of economic activity referred to in row 4 of Template 1 that is taxonomy non-eligible in accordance with Section 4.29 of Annexes I and II to Delegated Regulation 2021/2139 in the denominator of the applicable KPI [A] | 0 | 0% | | 0 | 0% | | 0 | 0% |
| 5 | Amount and proportion of economic activity referred to in row 5 of Template 1 that is taxonomy non-eligible in accordance with Section 4.30 of Annexes I and II to Delegated Regulation 2021/2139 in the denominator of the applicable KPI | — | — | | — | — | | — | — |
| 6 | Amount and proportion of economic activity referred to in row 6 of Template 1 that is taxonomy non-eligible in accordance with Section 4.31 of Annexes I and II to Delegated Regulation 2021/2139 in the denominator of the applicable KPI | — | — | | — | — | | — | — |
| 7 | Amount and proportion of other taxonomy non-eligible economic activities not referred to in rows 1 to 6 above in the denominator of the applicable KPI | 274,959 | 96.7% | | 27,632 | 89.4% | | 3,603 | 75.3% |
| 8 | Total amount and proportion of taxonomy non-eligible economic activities in the denominator of the applicable KPI | 274,959 | 96.7% | | 27,632 | 89.4% | | 3,603 | 75.3% |
[A]The scope of this requirement cannot be determined based on current EU guidance. Shell intends to monitor future developments and update our approach as appropriate.
Shareholder Information
Shell plc (the Company) was incorporated in England and Wales on February 5, 2002, as a private company under the Companies Act 1985, as amended. On October 27, 2004, the Company was re-registered as a public company limited by shares and changed its name from Forthdeal Limited to Royal Dutch Shell plc. On January 21, 2022, the Company changed its name from Royal Dutch Shell plc to Shell plc. The Company is registered at Companies House, Cardiff, under company number 4366849. The Legal Entity Identifier (LEI) issued by the London Stock Exchange is 21380068P1DRHMJ8KU70. The business address for the Directors and Senior Management is Shell Centre, London, SE1 7NA. The Company's agent in the USA is Puglisi & Associates, 850 Library Avenue, Suite 204, Newark, Delaware 19711.
On December 31, 2021, the Company became tax resident in the United Kingdom. Its primary objective is to carry on the business of a holding company. It is not directly or indirectly owned or controlled by another corporation or by any government and does not know of any arrangements that may result in a change of control of the Company.
Nature of trading market
On January 29, 2022, the Company established one single line of ordinary shares, each having a nominal value of €0.07. All shares are listed and able to trade at Euronext Amsterdam and the London Stock Exchange. Furthermore, all shares are transferable between these two markets. This makes both these exchanges primary exchanges for the ordinary shares.
Ordinary shares are traded in registered form.
The Company's American Depositary Shares (ADSs) are listed on the New York Stock Exchange [A]. A depositary receipt is a certificate that evidences ADSs. Depositary receipts are issued, cancelled and exchanged at the office of JP Morgan Chase Bank, N.A., 383 Madison Avenue, New York, New York 10179, USA, as depositary (the Depositary), under Second Amended and Restated Deposit Agreement and Amendment No. 1 thereto (Deposit Agreement) between the Company, the Depositary and the holders of ADSs. Each ADS is equivalent to two ordinary shares of Shell plc deposited under the Deposit Agreement. All ordinary shares are capable of being deposited with the Depository in exchange for the corresponding amount of ADSs which may be traded at the New York Stock Exchange. This makes the New York Stock Exchange the primary exchange for the Company's American Depositary Receipts (ADRs). More information relating to ADSs is given on page 332.
[A]At March 4, 2025, 569,992,987 ADSs were outstanding, representing 18.86% of the ordinary share capital, held by holders of record with an address in the USA. In addition to holders of ADSs, at March 4, 2025, 865,294 ordinary shares of €0.07 each were outstanding, representing 0.0143% of the ordinary share capital, held by 2951 holders of record registered with an address in the USA.
| | | | | | | | | | | |
| Euronext Amsterdam | London Stock Exchange | NYSE |
| Identifiers | Ordinary share | Ordinary share | ADS [A] |
| Market | Primary | Primary | Primary |
| Ticker symbol | SHELL | SHEL | SHEL |
| ISIN | GB00BP6MXD84 | GB00BP6MXD84 | US7802593050 |
| SEDOL | BP6MXT4 | BP6MXD8 | BPK3CG3 |
| CUSIP | G80827 101 | G80827 101 | 780259 305 |
Index weight at December 31, 2024 | AEX: 14.92% | FTSE: 7.60% | —% |
[A]Each ADS represents two ordinary shares of €0.07 each.
Share capital
Below we provide information on our share capital as at December 31, 2024.
| | |
Share capital as at December 31, 2024 |
The issued and fully paid share capital of the Company at December 31, 2024, was as follows:
| | | | | | | | |
| Issued and fully paid |
| Number | Nominal value |
| Ordinary shares of €0.07 each | 6,115,031,158 | €428,052,181 |
| | |
| Share capital as at March 4, 2025 |
The issued and fully paid share capital of the Company at March 4, 2025, was as follows:
| | | | | | | | |
| Issued and fully paid |
| Number | Nominal value |
| Ordinary shares of €0.07 each | 6,044,202,109 | €423,094,148 |
The Directors may only allot new ordinary shares if they have authority from shareholders to do so. The Company seeks to renew this authority annually at its AGM. Under the resolution passed at the Company's 2024 AGM, the Directors were granted authority to allot ordinary shares up to an aggregate nominal amount equivalent to approximately one-third of the issued ordinary share capital of the Company (in line with the guidelines issued by institutional investors).
The following is a summary of the material terms of the Company's ordinary shares, including brief descriptions of the provisions contained in the Articles of Association (the Articles) and applicable laws of England and Wales in effect on the date of this document. This summary does not purport to include complete statements
of these provisions:
○upon issuance, the ordinary shares are fully paid and free from all liens, equities, charges, encumbrances and other interest of the Company and not subject to calls of any kind;
○all ordinary shares rank equally for all dividends and distributions
on ordinary share capital; and
○all ordinary shares are admitted to the Official List of the UK Financial Conduct Authority and to trading on the market for listed securities of the London Stock Exchange. Ordinary shares are also admitted to trading on Euronext Amsterdam. ADSs are listed on the New York Stock Exchange.
At December 31, 2024, trusts and trust-like entities holding shares for the benefit of employee share plans of Shell held (directly and indirectly) 31 million shares of the Company with an aggregate market value of $980 million and an aggregate nominal value of €2 million.
Additional Information | Shareholder Information continued
Significant shareholdings
The Company's ordinary shares have voting rights on all matters that are subject to shareholder approval, including the election of directors. The Company's major shareholders do not have different voting rights.
Significant shareholdings
Interests of investors with 5% or more of the Company's ordinary shares at March 4, 2025 are provided below. The information provided includes the percentage of issued share capital as at March 4, 2025.
| | | | | | | | | | | |
| | Ordinary Shares |
| | Number [A] | % [B] |
BlackRock, Inc. | | 615,032,699 | 10.2 |
[A]Information presented per Schedule 13G/A filed on February 6, 2024.
[B]Percentage calculated based on the total number of ordinary shares outstanding as of March 4, 2025.
Designation of the Netherlands as EU Home Member State for regulatory purposes
Following the exit of the UK from the EU and the end of the transition period, the Company announced that the EU Home Member State of the Company for the purposes of the EU Transparency Directive would be the Netherlands as from January 1, 2021. As a consequence, the Company files Transparency Directive and Market Abuse Regulation-related regulatory information with the Netherlands Authority for the Financial Markets (Autoriteit Financiële Markten, or AFM). Major shareholders are required to report substantial holdings in Shell to the AFM in accordance with applicable Dutch law, in addition
to their ongoing disclosure obligations under the DTR.
Method of holding shares or an interest in shares
There are several ways in which Shell plc registered shares or an interest in these shares can be held, including:
○directly as registered shares either in uncertificated form or in certificated form in a shareholder's own name;
○indirectly through Euroclear Nederland (in respect of which the Dutch Securities Giro Act (Wet giraal effectenverkeer) is applicable);
○through the Shell Corporate Nominee Service;
○through another third-party nominee or intermediary company; and
○as a direct or indirect holder of either ADS with the Depositary.
American Depositary Shares
The Depositary is holding the shares underlying the ADSs and to the extent it is doing so directly via its UK nominee enjoys the rights of a shareholder under the Articles. Holders of ADSs will not have shareholder rights. The rights of the holder of an ADS are specified in the Deposit Agreement with the Depositary and are summarised below.
The Depositary will receive all cash dividends and other cash distributions made on the deposited shares underlying the ADSs and, where possible and on a reasonable basis, will distribute such dividends and distributions to holders of ADSs. Rights to purchase
additional shares will also be made available to the Depositary who may make such rights available to holders of ADSs. All other distributions made on the Company's shares will be distributed by the Depositary in any means that the Depositary thinks is equitable and practical. The Depositary may deduct its fees and expenses and the amount of any taxes owed from any payments to holders and it may sell a holder's deposited shares to pay any taxes owed. The Depositary is not responsible if it decides that it is unlawful or impractical to make a distribution available to holders of ADSs.
The Depositary will notify holders of ADSs of shareholders' meetings
of the Company and will arrange to deliver voting materials to such holders of ADSs if requested by the Company. Upon request by a holder, the Depositary will endeavour to appoint such holder as proxy in respect of such holder's deposited shares entitling such holder to attend and vote at shareholders' meetings. Holders of ADSs may also instruct the Depositary to vote their deposited securities and the Depositary will try, as far as practical and lawful, to vote deposited shares in accordance with such instructions. The Company cannot ensure that holders will receive voting materials or otherwise learn of an upcoming shareholders' meeting in time to ensure that holders can instruct the Depositary to vote their shares.
Upon payment of appropriate fees, expenses and taxes: (i) shareholders may deposit their shares with the Depositary and receive the corresponding class and amount of ADSs; and (ii) holders of ADSs may surrender their ADSs to the Depositary and have the corresponding class and amount of shares credited to their account.
Further, subject to certain limitations, holders may, at any time, cancel ADSs and withdraw their underlying shares or have the corresponding class and amount of shares credited to their account.
Fees paid by holders of ADSs
The Depositary collects its fees for delivery and surrender of ADSs directly from investors depositing shares or surrendering ADSs for the purpose of withdrawal or from intermediaries acting for them. The Depositary collects fees for making distributions to investors by deducting those fees from the amounts distributed or by selling a portion of distributable property to pay the fees. The Depositary may generally refuse to provide fee-attracting services until its fees for those services are paid. See page 333.
Payments by Depositary to the Company
J.P. Morgan Chase Bank, N.A., as Depositary, has agreed to share with the Company portions of certain fees collected, less ADS programme expenses paid by the Depositary. For example, these expenses include the Depositary's annual programme fees, transfer agency fees, custody fees, legal expenses, postage and envelopes for mailing annual and interim financial reports, printing and distributing dividend cheques, electronic filing of US federal tax information, mailing required tax forms, stationery, postage, facsimile and telephone calls and the standard out-of-pocket maintenance costs for the ADSs. From January 1, 2024, to December 31, 2024, the Company received $641,716.13 from the Depositary.
Additional Information | Shareholder Information continued
| | | | | |
| Persons depositing or withdrawing shares must pay: | For: |
| $5.00 or less per 100 ADSs (or portion of 100 ADSs) | ○Issuance of ADSs, including those resulting from a distribution of shares, rights or other property. ○Cancellation of ADSs for the purpose of their withdrawal, including if the Deposit Agreement terminates. An additional transaction fee per cancellation request and any applicable delivery expenses may also be charged by the Depositary. ○Distribution of securities to holders of deposited securities by the Depositary to ADS registered holders. |
| Registration and transfer fees | ○Registration and transfer of shares on the share register to or from the name of the Depositary or its agent when they deposit or withdraw shares. |
| Expenses of the Depositary | ○Cable, telex and facsimile transmissions (when expressly provided in the Deposit agreement). ○Converting foreign currency into dollars. |
Taxes and other governmental charges the Depositary or the custodian has to pay on any ADS or share underlying an ADS, for example, share transfer taxes, stamp duty or withholding taxes | ○As necessary. |
In addition to the above, the Depositary may charge: (i) a dividend fee of $5.00 or less per 100 ADSs (or portion of 100 ADSs) for cash dividends or issuance of ADSs resulting from share dividends and (ii) an administrative fee of $5.00 or less per 100 ADSs (or portion of 100 ADSs) per calendar year. The Company and Depositary have agreed not to charge these fees at this time.
Dividend Reinvestment Plan
Equiniti Financial Services Limited, part of the Equiniti group of companies, operates a Dividend Reinvestment Plan (DRIP) which enables Shell plc shareholders to elect to have their dividend payments used to purchase Shell plc ordinary shares. More information can be found at shareview.co.uk/info/drip or by contacting Equiniti, the Company's UK Registrar.
ABN AMRO Bank N.V. and JP Morgan Chase Bank N.A. also operate dividend reinvestment options. More information can be found by contacting the relevant provider.
Exchange controls and other limitations affecting security holders
Other than restrictions affecting those individuals, entities, government bodies, corporations, or activities that are targeted by European Union (EU) or UK sanctions for example, regarding Syria, Russia or North Korea, etc. and the general EU prohibition to transfer funds to and from for example, North Korea or Iran and the EU and UK financial restrictions affecting Russia or Belarus, we are not aware of any other legislative or other legal provision currently in force in the UK, the Netherlands, the EU or arising under the Articles restricting remittances to holders of the Company's ordinary shares who are non-residents of the UK, or affecting the import or export of capital.
Taxation
General
The Company is incorporated in England and Wales. The Company changed tax residence from the Netherlands to the UK on December 31, 2021.
US Taxation
This section describes the material US federal income tax consequences of acquiring, owning and disposing of Shell’s ordinary shares or ADSs. It applies to holders only if they hold the ordinary shares or ADSs as capital assets for tax purposes. It does not apply to holders who are a member of a special class of holders subject to special rules, including: (i) a dealer in securities or currencies; (ii) a trader in securities that elects to use a mark-to-market method of accounting for its securities holdings; (iii) a regulated investment company; (iv) a real estate investment trust; (v) a tax-exempt organisation; (vi) an insurance company; (vii) a financial institution; (viii)
a person that actually or constructively owns 10% or more of the ordinary shares of Shell (as measured by vote or value); (ix) a person that holds offered securities as part of a straddle or a hedging or conversion transaction, or as part of a constructive sale or other integrated financial transaction; (x) a person who is an investor in a partnership (or entity or arrangement taxed as a partnership for US federal income tax purposes); (xi) a person who acquires shares through the exercise of options, or otherwise as compensation, or through a tax-qualified retirement plan; (xii) a US expatriate; (xiii) holders of options granted under any benefit plan; (xiv) a person liable for alternative minimum tax; or (xv) a person whose functional currency is not the US dollar.
This section is based on the Internal Revenue Code of 1986, as amended (Code), its legislative history, existing and proposed regulations, published rulings and court decisions, all as currently in effect. These laws are subject to change, possibly on a retroactive basis.
If a partnership (or entity or arrangement taxed as a partnership for US federal income tax purposes) holds the ordinary shares or ADSs, the tax treatment of a partner generally will depend upon the status of the partner and the activities of the partnership. Any holder that is a partner of a partnership holding the offered securities should consult its tax advisor.
This summary does not address the alternative minimum tax, the rules under Section 451 of the Code with respect to conforming the timing of income accruals to financial statements, any non-income tax (such as estate or gift taxes) or any state, local or non-US tax consequences of the acquisition, ownership or disposition of our ordinary shares or ADSs.
Holders are urged to consult their own tax advisor regarding the US federal, state and local and other tax consequences of acquiring, owning and disposing of ordinary shares or ADSs in their particular circumstances.
As used in this section, “US holder” means a beneficial owner of ordinary shares or ADSs who is, for US federal income tax purposes: (i) a citizen or resident of the USA; (ii) a corporation, or entity taxable as a corporation, that was created or organised under the laws of the US or any of its political subdivisions; (iii) an estate whose income is subject to US federal income tax regardless of its source; or (iv) a trust if (a) a US court can exercise primary supervision over the trust’s administration and one or more US persons are authorised to control all substantial decisions of the trust; or (b) the trust has made a valid election under applicable US Treasury regulations to be treated as a US person.
Additional Information | Shareholder Information continued
Taxation of cash distributions
The gross amount of any cash distribution (other than in liquidation) that a US holder receives with respect to Shell’s ordinary shares or ADSs generally will be includible in such US holder’s gross income on the day on which, in the case of a holder of our ordinary shares, such holder receives such distribution or, in the case of a holder of our ADSs, the depositary receives such distribution on behalf of the holder of the applicable ADSs. The tax treatment of the distribution will depend on the amount of the distribution and the amount of the US holder’s adjusted tax basis in the applicable ordinary shares or ADSs as set out herein.
Distributions paid by Shell with respect to the underlying ordinary shares will be taxed as ordinary dividends to the extent such distributions do not exceed Shell’s current or accumulated earnings and profits (E&P), as calculated for US federal income tax purposes. The current maximum income tax rate imposed on certain qualified dividend income received by US holders that are individuals is 20% (Reduced Rate), so long as certain holding period requirements are met and Shell is a Qualified Foreign Corporation (QFC) and not a passive foreign investment company (PFIC), each as defined in the Code. Shell believes that it is a QFC and is not a PFIC. As a result, dividends received by individual US holders will generally constitute qualified dividend income for US federal income tax purposes and be eligible for the Reduced Rate (see “— Taxation of Sale or Other Disposition”). There can be no assurance, however, that Shell will continue to be considered a QFC or that Shell will not be classified as a PFIC in the future. Thus, there can be no assurance that Shell’s dividends will continue to be eligible for the Reduced Rate. Special rules apply for purposes of determining the recipient’s investment income (which limits deductions for investment interest) and non-US source income (which may affect the amount of foreign tax credit) and to certain extraordinary dividends.
Because Shell is not a US corporation, dividends Shell pays generally will not be eligible for the dividends received deduction allowable to corporations under the Code.
To the extent that distributions by Shell exceed its current or accumulated E&P but do not exceed such US holder’s adjusted tax basis in Shell’s ordinary shares or ADSs, such distributions will be treated as a tax-free return of capital, to both individual and corporate US holders.
As a return of capital, such distribution will reduce such US holder’s adjusted tax basis in the ordinary shares or ADSs on a dollar-for-dollar basis (thereby increasing any gain or decreasing any loss on a future disposition of the ordinary shares or ADSs).
To the extent that the distributions exceed both Shell’s current or accumulated E&P and the US holder’s adjusted tax basis in the ordinary shares or ADSs, such US holder will be taxed as having recognised gain on the sale or disposition of the ordinary shares or ADSs (see “— Taxation of Sale or Other Disposition”).
It is anticipated that dividends on Shell’s ADSs will be announced and paid to the depositary in US dollars, and holders of Shell ADSs will receive dividend payments in US dollars from the depositary. The US holder would include in gross income as a dividend the US dollar amount received by the Depositary. It is anticipated that dividends on Shell ordinary shares will be announced in US dollars but the dividend will be distributed in euros or pounds sterling. The US holder would include in gross income as a dividend the amount as received, calculated by reference to the exchange rate in effect on the day the US holder receives the dividend.
Dividends paid by Shell generally will be treated as foreign source income for US foreign tax credit limitation purposes. Subject to certain limitations, US holders may elect to claim a foreign tax credit against their US federal income tax liability for non-US tax withheld (if any) from dividends received in respect of the ordinary shares or ADSs. The limitation on non-US taxes eligible for credit is calculated separately with respect to specific classes of income. For this purpose, dividends paid in respect of Shell’s ordinary shares or ADSs generally will be “passive category income” and therefore any US federal income tax imposed on these dividends cannot be offset by excess foreign tax credits that such US holders may have from non-US source income not qualifying as passive income. In the case of certain types of US holders, any such dividends may be treated as “general category income” for purposes of calculating the US foreign tax credit limitations. US holders that do not elect to claim a foreign tax credit may instead claim a deduction for non-US tax withheld (if any).
Taxation of sale or other disposition
A US holder generally will recognise capital gain or loss upon a sale or other disposition of ordinary shares or ADSs in an amount equal to the difference between the amount realised on their disposition and such US holder’s adjusted tax basis in the ordinary shares or ADSs.
Under current law, capital gains realised by corporate and individual taxpayers generally are subject to US federal income taxes at the same rate as ordinary income, except that long-term capital gains realised by noncorporate US holders are currently subject to US federal income tax at a maximum rate of 20%. Certain limitations exist on the deductibility of capital losses by both corporate and individual taxpayers. Capital gains and losses on the sale or other disposition by a US holder of ordinary shares or ADSs generally should constitute gains or losses from sources within the USA.
For cash basis US holders who receive foreign currency in connection with a sale or other taxable disposition of ordinary shares or ADSs, the amount realised will be based on the US dollar value of the foreign currency received with respect to such ordinary shares or ADSs as determined on the settlement date of such sale or other taxable disposition.
Accrual basis US holders may elect the same treatment required of cash basis taxpayers with respect to a sale or other taxable disposition of ordinary shares or ADSs, provided that the election is applied consistently from year to year. Such election may not be changed without the consent of the US Internal Revenue Service. Accrual basis US holders who or which do not elect to be treated as cash basis taxpayers (pursuant to the US Treasury regulations applicable to foreign currency transactions) for this purpose may have a foreign currency gain or loss for US federal income tax purposes because of differences between the US dollar value of the foreign currency received prevailing on the date of the sale or other taxable disposition of ordinary shares or ADSs and the date of payment. Any such foreign currency gain or loss generally will constitute gain or loss from sources within the US and generally will be treated as ordinary income or loss and would be in addition to gain or loss, if any, recognised on the sale or other taxable disposition of ordinary shares or ADSs.
A US holder’s tax basis in the foreign currency received will equal the US dollar value on the settlement date. Any foreign currency gain or loss realised by a US holder on a conversion of foreign currency into US dollars generally will constitute ordinary income or loss from sources within the US and will be in addition to gain or loss, if any, recognised on the sale or other disposition of ordinary shares or ADSs.
US backup withholding and information reporting
In general, information reporting requirements will apply to payments of dividends on ordinary shares or ADSs and the proceeds of certain
Additional Information | Shareholder Information continued
sales of ordinary shares or ADSs in respect of US holders other than certain exempt persons (such as corporations). A backup withholding tax (at a rate of 24%) will apply to such payments if the US holder fails to provide a correct taxpayer identification number or other certification of exempt status or, with respect to certain payments, the US holder fails to report in full all dividend and interest income and the US Internal Revenue Service notifies the payer of such under-reporting. Amounts withheld under the backup withholding rules may be credited against a holder’s US federal income tax liability, and a refund of any excess amounts withheld under the backup withholding rules may be obtained by filing the appropriate claim form with the US Internal Revenue Service. US holders should consult their tax advisors about these rules and any other reporting obligations that may apply to the ownership or disposition of the ordinary shares or ADSs.
UK Taxation
The following is a summary of the material UK tax consequences for a US holder of the ownership and disposal of ordinary shares or ADSs. It is based on current UK law and on what is understood to be the current practice of His Majesty’s Revenue and Customs (HMRC) in the UK, either of which is subject to change, possibly with retroactive effect. This summary applies only to US holders who hold their securities as an investment and are the absolute beneficial owners of them, who are not resident for tax purposes in the UK or carrying on a trade (or profession or vocation) in the UK through a permanent establishment, branch or agency and who are not (and have not in the previous seven years been) employees of Shell or of any person connected with Shell. It assumes that holders of Shell ADSs will in practice be treated for the purposes of UK tax as the beneficial owners of the Shell ordinary shares represented by such Shell ADSs.
The paragraphs below do not attempt to describe all possible UK tax considerations that may be relevant to a US holder. Any US holders who are in any doubt about any aspect of their particular tax position should consult appropriate independent tax advisers.
For the purposes of this section a person is a US holder at any time if, at that time, he/she is regarded as a resident of the USA for US tax purposes.
UK tax on income and chargeable gains
US holders who satisfy the criteria set out in the first paragraph above under the heading “UK Taxation” will not generally be subject to UK tax on income or chargeable gains in respect of the ownership and disposal of ordinary shares or ADSs or the receipt of any dividends that are paid on them.
There are complications to this rule in the case of a US holder who is an individual, who has ceased to be resident for tax purposes in the UK or starts to be regarded as non-resident for the purposes of a relevant double taxation treaty (Treaty Non Resident) but then resumes residence in the UK or, as the case may be, ceases to be regarded as Treaty Non Resident. Such a holder should seek independent tax advice.
UK inheritance tax
Whilst a US holder who is an individual domiciled in the USA for the purposes of the UK/US Estate and Gift Tax Treaty and who has never been domiciled in the UK for the purposes of the UK/US Estate and Gift Tax Treaty, and whose shares are not held as part of business property, will not normally be subject to UK inheritance tax in respect of ordinary shares or ADSs on the individual’s death or on a gift of such ordinary shares or ADSs made during the individual’s lifetime, the rules are complex. Individuals should seek independent tax advice tailored to their specific circumstances.
UK stamp duty and stamp duty reserve tax
Sales or transfers of the Company's ordinary shares within a clearance service (such as Euroclear Nederland) or of the Company's ADSs within the ADS depositary receipts system will not give rise to a stamp duty reserve tax (SDRT) liability and should not in practice require the payment of UK stamp duty.
The transfer of the Company's ordinary shares to a clearance service (such as Euroclear Nederland) or to an issuer of depositary shares (such as ADSs) will generally give rise to a UK stamp duty or SDRT liability at the rate of 1.5% of consideration given or, if none, of the value of the shares. A sale of the Company's ordinary shares that are not held within a clearance service (for example, settled through the UK's CREST system of paperless transfers) will generally be subject to UK stamp duty or SDRT at the rate of 0.5% of the amount of the consideration, normally paid by the purchaser.
Capital gains tax
For the purposes of UK capital gains tax, the market values [A] of the shares of the former public parent companies of the Shell Group at the relevant dates were:
| | | | | | | | |
| | £ |
| March 31, 1982 | July 20, 2005 |
| Royal Dutch Petroleum Company (N.V. Koninklijke Nederlandsche Petroleum Maatschappij) which ceased to exist on December 21, 2005 | 1.1349 | 17.6625 |
| The "Shell" Transport and Trading Company, p.l.c. which delisted on July 19, 2005 | 1.4502 | Not
applicable |
[A]Restated where applicable to reflect all capitalisation issues since the relevant date. This includes the change in the capital structure in 2005, when Shell plc (at the time known as Royal Dutch Shell plc) became the single parent company of Royal Dutch Petroleum Company and of The "Shell" Transport and Trading Company, p.l.c., now The Shell Transport and Trading Company Limited, and one share in Royal Dutch Petroleum Company was exchanged for two Royal Dutch Shell plc A shares and one share in The "Shell" Transport and Trading Company, p.l.c. was exchanged for 0.287333066 Royal Dutch Shell plc B shares.
Section 13(r) of the US Securities Exchange Act of 1934 Disclosure
In accordance with our General Business Principles and Code of Conduct, Shell seeks to comply with all applicable international trade laws, including applicable sanctions and embargoes.
The activities listed below have been conducted outside the USA by non-US affiliates of Shell plc. None of the payments disclosed below were made in US dollars, nor are any of the balances disclosed below held in US dollars; however, for disclosure purposes, all have been converted into US dollars at the appropriate exchange rate. We do not believe that any of the transactions or activities listed below violated US sanctions.
We maintain accounts with Karafarin Bank where our cash deposits (balance of $5,231,999 at December 31, 2024) generated interest income of $247,917 in 2024. We paid $1,216 in bank charges, a portion of which was for transfer of cash from 2018 that was paid in 2024. As the accounts with Karafarin Bank will be maintained for the foreseeable future, we expect that the receipt of interest income and the payment of bank charges to continue in the future.
In 2024 we have paid $51,096 of Income Tax for the period March 2022 – March 2023 and $1,276 of late payment fee to the North Tehran Tax Office. The tax payment pertains to the interest income derived from cash held in our Karafarin bank account. The payment was made on our behalf by Bayat Ryan and from our Karafarin bank account.
Non-GAAP measures reconciliations
These non-GAAP measures, also known as alternative performance measures, are financial measures other than those defined in International Financial Reporting Standards, that Shell considers provide useful information.
Earnings on a current cost of supplies basis
Segment earnings are presented on a current cost of supplies basis (CCS earnings), which is the earnings measure used by the Chief Executive Officer for the purposes of making decisions about allocating resources and assessing performance. On this basis, the purchase price of volumes sold during the period is based on the current cost of supplies during the same period after making allowance for the tax effect. CCS earnings therefore exclude the effect of changes in the oil price on inventory carrying amounts. The current cost of supplies adjustment does not impact cash flow from operating activities in the "Consolidated Statement of Cash Flows". For "Reconciliation of CCS earnings to income for the period", please refer to Note 7 to the "Consolidated Financial Statements".
Adjusted Earnings per share
Adjusted Earnings per share is calculated as Adjusted Earnings (see below) divided by the weighted average number of shares used as the basis for basic earnings per share (see Note 31 to the "Consolidated Financial Statements"). Adjusted Earnings per share were 3.76 in 2024 (2024 Adjusted Earnings: $23,716 million; 2024 weighted average number of shares 6,299.6 million) and $4.20 in 2023 (2023 Adjusted Earnings $28,250 million; 2023 weighted average number of shares: 6,733.5 million).
Adjusted Earnings, Adjusted Earnings Before Interest, Taxes, Depreciation and Amortisation (EBITDA), and Cash flow from operating activities
The "Adjusted Earnings" measure is presented on a CCS basis and aims to facilitate a comparative understanding of Shell's financial performance from period to period by removing the effects of oil price changes on inventory carrying amounts and removing the effects of identified items adjusted for current cost of supplies. These items are in some cases driven by external factors and may, either individually or collectively, hinder the comparative understanding of Shell's financial results from period to period.
The "Adjusted EBITDA" measure is presented on a CCS basis and is used by management to evaluate Shell's performance in the period and over time. We define "Adjusted EBITDA" as "Income/(loss) for the period" adjusted for current cost of supplies; identified items; tax charge/(credit); depreciation, amortisation and depletion; exploration well write-offs; and net interest expense. All items include the non-controlling interest component.
Adjusted Earnings, Adjusted Earnings Before Interest, Taxes, Depreciation and Amortisation (EBITDA) and Cash flow from operating activities
| | | | | | | | | | | | | | | | | | | | | | | |
| | | | | | | $ million |
| Total | Integrated Gas | Upstream | Marketing | Chemicals and Products | Renewables and Energy Solutions | Corporate |
| CCS Earnings [A] | 16,792 | 9,590 | 7,772 | 1,894 | 1,757 | (1,229) | (2,992) |
| Less: Identified items | (7,347) | (1,800) | (623) | (1,991) | (1,177) | (732) | (1,024) |
Less: CCS earnings attributable to non-controlling interest | 441 | | | | | | |
Add: Identified items attributable to non-controlling interest | 18 | | | | | | |
| Adjusted Earnings | 23,716 | | | | | | |
Add: Non-controlling interest | 424 | | | | | | |
Adjusted Earnings plus non-controlling interest | 24,139 | 11,390 | 8,395 | 3,885 | 2,934 | (497) | (1,968) |
| Add: Taxation charge/(credit) excluding tax impact of identified items | 15,013 | 3,520 | 9,865 | 1,305 | 364 | 87 | (128) |
| Add: Depreciation, depletion and amortisation excluding impairments | 22,703 | 5,594 | 10,971 | 2,235 | 3,495 | 383 | 25 |
| Add: Exploration well write-offs | 1,622 | 291 | 1,331 | | | | |
| Add: Interest expense excluding identified items | 4,697 | 189 | 720 | 52 | 70 | 6 | 3,660 |
| Less: Interest income | 2,372 | 8 | 18 | 1 | 79 | 2 | 2,265 |
Adjusted EBITDA | 65,803 | 20,978 | 31,264 | 7,476 | 6,783 | (22) | (675) |
| Less: Current cost of supplies adjustment before taxation | 363 | | | 254 | 109 | | |
| Joint ventures and associates (dividends received less profit) | (328) | (137) | (946) | 262 | 304 | 190 | — |
Derivative financial instruments | 1,472 | (1,466) | 24 | 59 | 219 | 3,012 | (376) |
| Taxation paid | (12,002) | (2,955) | (7,851) | (562) | (146) | (457) | (31) |
| Other | (1,961) | 23 | (1,464) | (616) | (321) | 152 | 264 |
| (Increase)/decrease in working capital | 2,062 | 467 | 216 | 998 | 524 | 923 | (1,065) |
| Cash flow from operating activities | 54,687 | 16,909 | 21,244 | 7,363 | 7,253 | 3,798 | (1,882) |
[A]See Note 7 to the Consolidated Financial Statements.
| | | | | | | | | | | | | | | | | | | | | | | |
| | | | | | | $ million |
| Total | Integrated Gas [B] | Upstream [B] | Marketing [B] | Chemicals and Products [B] | Renewables and Energy Solutions [B] | Corporate [B] |
| CCS Earnings [A] | 20,281 | 7,057 | 8,540 | 3,057 | 1,482 | 3,089 | (2,944) |
| Less: Identified items | (8,252) | (6,861) | (1,267) | (254) | (2,135) | 2,333 | (69) |
Less: CCS earnings attributable to non-controlling interest | 273 | | | | | | |
Add: Identified items attributable to non-controlling interest | (11) | | | | | | |
| Adjusted Earnings | 28,250 | | | | | | |
Add: Non-controlling interest | 284 | | | | | | |
Adjusted Earnings plus non-controlling interest | 28,534 | 13,919 | 9,806 | 3,312 | 3,617 | 756 | (2,875) |
| Add: Taxation charge/(credit) excluding tax impact of identified items | 13,674 | 3,837 | 8,280 | 936 | 287 | 341 | (8) |
| Add: Depreciation, depletion and amortisation excluding impairments | 23,106 | 5,756 | 11,309 | 2,048 | 3,582 | 392 | 19 |
| Add: Exploration well write-offs | 867 | 121 | 746 | | | | |
| Add: Interest expense excluding identified items | 4,669 | 146 | 507 | 50 | 60 | 4 | 3,902 |
| Less: Interest income | 2,313 | 6 | 27 | 9 | 57 | 12 | 2,201 |
Adjusted EBITDA | 68,538 | 23,773 | 30,622 | 6,337 | 7,489 | 1,481 | (1,164) |
| Less: Current cost of supplies adjustment before taxation | 848 | | | 478 | 370 | | |
| Joint ventures and associates (dividends received less profit) | 79 | 241 | (692) | 117 | 310 | 102 | 3 |
Derivative financial instruments | (6,142) | (4,668) | 51 | (14) | 518 | (1,988) | (41) |
| Taxation paid | (13,712) | (3,574) | (8,470) | (760) | (467) | (762) | 322 |
Other [C] | (865) | (313) | (142) | (486) | (138) | 450 | (237) |
(Increase)/decrease in working capital [C] | 7,145 | 2,061 | 82 | 845 | 172 | 3,701 | 284 |
| Cash flow from operating activities | 54,191 | 17,520 | 21,450 | 5,561 | 7,513 | 2,984 | (832) |
[A]See Note 7 to the Consolidated Financial Statements.
[B]See Note 7 to the "Consolidated Financial Statements" which includes an explanation of the reporting segments changes applicable from 2024.
[C]See footnote [A] of Consolidated Statement of Cash Flows.
| | | | | | | | | | | | | | | | | | | | | | | |
| | | | | | | $ million |
| Total | Integrated Gas [B] | Upstream [B] | Marketing [B] | Chemicals and Products [B] | Renewables and Energy Solutions [B] | Corporate [B] |
| CCS Earnings [A] | 41,562 | 22,221 | 16,258 | 2,292 | 4,380 | (1,027) | (2,562) |
| Less: Identified items | 1,259 | 6,075 | (1,096) | (612) | (213) | (2,805) | (90) |
Less: CCS earnings attributable to non-controlling interest | 449 | | | | | | |
Add: Identified items attributable to non-controlling interest | 15 | | | | | | |
| Adjusted Earnings | 39,870 | | | | | | |
Add: Non-controlling interest | 434 | | | | | | |
Adjusted Earnings plus non-controlling interest | 40,304 | 16,146 | 17,354 | 2,905 | 4,592 | 1,778 | (2,472) |
| Add: Taxation charge/(credit) excluding tax impact of identified items | 18,578 | 4,706 | 11,840 | 962 | 839 | 357 | (126) |
| Add: Depreciation, depletion and amortisation excluding impairments | 22,393 | 5,544 | 11,889 | 1,701 | 2,877 | 365 | 18 |
| Add: Exploration well write-offs | 881 | 142 | 738 | | | | — |
| Add: Interest expense excluding identified items | 3,181 | 84 | 345 | 45 | 21 | 2 | 2,683 |
| Less: Interest income | 1,046 | 43 | 22 | — | 24 | (2) | 959 |
Adjusted EBITDA | 84,289 | 26,581 | 42,144 | 5,613 | 8,305 | 2,503 | (856) |
| Less: Current cost of supplies adjustment before taxation | (1,755) | | | (1,316) | (439) | | |
| Joint ventures and associates (dividends received less profit) | (2,157) | (522) | (2,650) | 223 | 704 | 85 | 4 |
Derivative financial instruments | 624 | 6,104 | (35) | (3) | (213) | (4,998) | (230) |
| Taxation paid | (13,120) | (2,824) | (9,423) | (524) | (257) | (27) | (64) |
Other [C] | 2,042 | (250) | 375 | 730 | 921 | (248) | 514 |
(Increase)/decrease in working capital [C] | (5,021) | (1,396) | (768) | (3,546) | 1,574 | (3,708) | 2,824 |
| Cash flow from operating activities | 68,414 | 27,692 | 29,641 | 3,810 | 11,472 | (6,394) | 2,192 |
[A]See Note 7 to the Consolidated Financial Statements.
[B]See Note 7 to the "Consolidated Financial Statements" which includes an explanation of the reporting segments changes applicable from 2024.
[C]See footnote [A] of Consolidated Statement of Cash Flows.
The objective of identified items is to remove material impacts on net income/loss arising from transactions which are generally uncontrollable and unusual (infrequent or non-recurring) in nature or giving rise to a mismatch of accounting and economic results, or certain transactions that are generally excluded from underlying results in the industry.
Identified items comprise: divestment gains and losses, impairments, redundancy and restructuring, provisions for onerous contracts, fair value accounting of commodity derivatives and certain gas contracts, and the impact of exchange rate movements on certain deferred tax balances, and other items. Identified items in the table below are presented on a net basis.
| | | | | | | | | | | | | | | | | | | | | | | |
| 2024 |
| | | | | | | $ million |
| Total | Integrated Gas | Upstream | Marketing | Chemicals and Products | Renewables and Energy Solutions | Corporate |
| Identified items included in Income/(loss) before taxation | | | | | | | |
| Divestment gains/(losses) | (288) | (100) | 89 | (400) | 6 | 119 | (3) |
| Impairment reversals/(impairments) | (5,051) | (555) | (362) | (1,747) | (1,205) | (1,181) | (1) |
| Redundancy and restructuring | (1,012) | (106) | (320) | (296) | (195) | (97) | 2 |
| Provisions for onerous contracts | (24) | (3) | (14) | (7) | — | — | — |
Fair value accounting of commodity derivatives and certain gas contracts | (1,012) | (1,286) | (58) | 49 | (117) | 399 | — |
| Other | (1,481) | (126) | (436) | (1) | 146 | 39 | (1,103) |
| Total identified items included in Income/(loss) before taxation | (8,867) | (2,176) | (1,100) | (2,402) | (1,364) | (720) | (1,105) |
| Less: total identified items included in Taxation charge/(credit) | (1,521) | (376) | (477) | (411) | (187) | 12 | (81) |
| Identified items included in Income/(loss) for the period | | | | | | | |
| Divestment gains/(losses) | (319) | (96) | 67 | (386) | 4 | 94 | (2) |
| Impairment reversals/(impairments) | (4,371) | (363) | (323) | (1,423) | (1,176) | (1,085) | (1) |
| Redundancy and restructuring | (712) | (71) | (214) | (215) | (142) | (71) | 1 |
| Provisions for onerous contracts | (19) | (3) | (11) | (5) | — | — | — |
| Fair value accounting of commodity derivatives and certain gas contracts | (849) | (1,088) | (14) | 40 | (86) | 300 | — |
| Impact of exchange rate movements and inflationary adjustments on tax balances | 363 | (49) | 313 | — | — | — | 99 |
Other [A] | (1,440) | (130) | (440) | (1) | 223 | 30 | (1,122) |
| Impact on CCS earnings | (7,347) | (1,800) | (623) | (1,991) | (1,177) | (732) | (1,024) |
| Impact on CCS earnings attributable to non-controlling interest | 18 | — | — | — | 18 | — | — |
| Impact on CCS earnings attributable to Shell plc shareholders | (7,365) | (1,800) | (623) | (1,991) | (1,195) | (732) | (1,024) |
[A]Corporate includes reclassifications from equity to profit and loss of cumulative currency translation differences related to funding structures resulting in unfavourable movements of $1,122 million. These cu rrency translation differences were previously recognised in other comprehensive income and accumulated in equity as part of accumulated other comprehensive income.
| | | | | | | | | | | | | | | | | | | | | | | |
| 2023 |
| | | | | | | $ million |
| Total | Integrated Gas [A] | Upstream [A] | Marketing [A] | Chemicals and Products [A] | Renewables and Energy Solutions [A] | Corporate [A] |
| Identified items included in Income/(loss) before taxation | | | | | | | |
| Divestment gains/(losses) | 257 | (22) | 209 | 1 | (46) | 109 | 5 |
| Impairment reversals/(impairments) | (8,300) | (3,147) | (1,187) | (509) | (2,690) | (767) | — |
| Redundancy and restructuring | (329) | (1) | (21) | (150) | (106) | (32) | (18) |
| Provisions for onerous contracts | (24) | | | | (24) | | |
Fair value accounting of commodity derivatives and certain gas contracts | (419) | (4,755) | 447 | 20 | 276 | 3,593 | |
| Other | 82 | 32 | (615) | 300 | (43) | 408 | |
| Total identified items included in Income/(loss) before taxation | (8,732) | (7,892) | (1,166) | (339) | (2,632) | 3,311 | (14) |
| Less: total identified items included in Taxation charge/(credit) | (481) | (1,031) | 100 | (85) | (497) | 978 | 55 |
| Identified items included in Income/(loss) for the period | | | | | | | |
| Divestment gains/(losses) | 277 | (14) | 208 | 1 | (35) | 113 | 3 |
| Impairment reversals/(impairments) | (6,219) | (2,247) | (642) | (466) | (2,195) | (669) | — |
| Redundancy and restructuring | (241) | — | (9) | (113) | (82) | (24) | (12) |
| Provisions for onerous contracts | (18) | | | | (18) | | |
Fair value accounting of commodity derivatives and certain gas contracts | (1,284) | (4,407) | 127 | 26 | 214 | 2,756 | |
| Impact of exchange rate movements and inflationary adjustments on tax balances | (355) | — | (295) | | | | (60) |
| Other | (412) | (193) | (656) | 298 | (19) | 158 | |
| Impact on CCS earnings | (8,252) | (6,861) | (1,267) | (254) | (2,135) | 2,333 | (69) |
| Impact on CCS earnings attributable to non-controlling interest | (11) | | | (11) | | | |
| Impact on CCS earnings attributable to Shell plc shareholders | (8,240) | (6,861) | (1,267) | (242) | (2,135) | 2,333 | (69) |
[A]See Note 7 to the "Consolidated Financial Statements" which includes an explanation of the reporting segments changes applicable from 2024.
| | | | | | | | | | | | | | | | | | | | | | | |
| 2022 |
| | | | | | | $ million |
| Total | Integrated Gas [A] | Upstream [A] | Marketing [A] | Chemicals and Products [A] | Renewables and Energy Solutions [A] | Corporate [A] |
| Identified items included in Income/(loss) before taxation | | | | | | | |
| Divestment gains/(losses) | 657 | 101 | 437 | (154) | 265 | 7 | — |
| Impairment reversals/(impairments) | 2,260 | 1,780 | 1,515 | (338) | (285) | (412) | — |
| Redundancy and restructuring | 44 | (26) | (50) | (1) | 130 | (7) | — |
| Provisions for onerous contracts | (508) | (415) | (35) | (62) | 4 | | |
Fair value accounting of commodity derivatives and certain gas contracts | 3,244 | 6,711 | (218) | (46) | (161) | (3,041) | |
| Other | (1,519) | (882) | (506) | (56) | (76) | | |
| Total identified items included in Income/(loss) before taxation | 4,178 | 7,269 | 1,143 | (657) | (123) | (3,454) | — |
| Less: total identified items included in Taxation charge/(credit) | 2,919 | 1,195 | 2,238 | (45) | 90 | (649) | 90 |
| Identified items included in Income/(loss) for the period | | | | | | | |
| Divestment gains/(losses) | 418 | 95 | 231 | (122) | 210 | 5 | — |
| Impairment reversals/(impairments) | 725 | 779 | 853 | (321) | (226) | (361) | — |
| Redundancy and restructuring | 43 | (26) | (27) | (1) | 103 | (5) | — |
| Provisions for onerous contracts | (487) | (387) | (35) | (62) | (2) | | |
Fair value accounting of commodity derivatives and certain gas contracts | 3,421 | 6,273 | (225) | (42) | (142) | (2,443) | |
| Impact of exchange rate movements and inflationary adjustments on tax balances | (57) | (51) | 84 | | | | (90) |
| Other | (2,804) | (608) | (1,976) | (64) | (156) | | |
| Impact on CCS earnings | 1,259 | 6,075 | (1,096) | (612) | (213) | (2,805) | (90) |
| Impact on CCS earnings attributable to non-controlling interest | 15 | | | | 15 | | |
| Impact on CCS earnings attributable to Shell plc shareholders | 1,243 | 6,075 | (1,096) | (612) | (228) | (2,805) | (90) |
[A]See Note 7 to the "Consolidated Financial Statements" which includes an explanation of the reporting segments changes applicable from 2024.
The identified items categories above may include after-tax impacts of identified items of joint ventures and associates which are fully reported within "Share of profit of joint ventures and associates" in the Consolidated Statement of Income, and fully reported as identified items included in Income/(loss) before taxation in the table above. Identified items related to subsidiaries are consolidated and reported across appropriate lines of the Consolidated Statement of Income. Only pre-tax identified items reported by subsidiaries are taken into account in the calculation of underlying operating expenses.
Provisions for onerous contracts: Provisions for onerous contracts that relate to businesses that Shell has exited or to redundant assets or assets that cannot be used.
Fair value accounting of commodity derivatives and certain gas contracts: In the ordinary course of business, Shell enters into contracts to supply or purchase oil and gas products, power and environmental products. Shell also enters into contracts for tolling, pipeline and storage capacity. Derivative contracts are entered into for mitigation of resulting economic exposures (generally price exposure) and these derivative contracts are carried at period-end market price (fair value), with movements in fair value recognised in income for the period. Supply and purchase contracts entered into for operational purposes, as well as contracts for tolling, pipeline and storage capacity, are, by contrast, recognised when the transaction occurs; furthermore, inventory is carried at historical cost or net realisable value, whichever is lower. As a consequence, accounting mismatches occur because: (a) the supply or purchase transaction is recognised in a different period, or (b) the inventory is measured on a different basis. In addition, certain contracts are, due to pricing or delivery conditions, deemed to contain embedded derivatives or written options and are also required to be carried at fair value even though they are entered into for operational purposes. The accounting impacts are reported as identified items.
Impacts of exchange rate movements on tax balances represent the impact on tax balances of exchange rate movements arising on (a) the conversion to dollars of the local currency tax base of non-monetary assets and liabilities, as well as losses (this primarily impacts the Upstream and Integrated Gas segments) and (b) the conversion of dollar-denominated inter-segment loans to local currency, leading to taxable exchange rate gains or losses (this primarily impacts the Corporate segment).
Other identified items represent other credits or charges that based on Shell management's assessment hinder the comparative understanding of Shell's financial results from period to period.
Operating expenses and underlying operating expenses
Operating expenses is a measure of Shell's cost management performance, comprising the following items from the "Consolidated Statement of Income": production and manufacturing expenses; selling, distribution and administrative expenses; and research and development expenses.See Note 7 to the "Consolidated Financial Statements" for reconciliation of total operating expenses.
Underlying operating expenses is a measure aimed at facilitating a comparative understanding of performance from period to period by removing the effects of identified items, which, either individually or collectively, can cause volatility, in some cases driven by external factors.
| | |
| Operating expenses and underlying operating expenses |
| | | | | | | | | | | |
| $ million |
| 2024 | 2023 | 2022 |
| | | |
| | | |
| | | |
Operating expenses, of which: | 36,917 | 39,960 | 39,476 |
| Production and manufacturing expenses | 23,379 | 25,240 | 25,518 |
| Selling, distribution and administrative expenses | 12,439 | 13,433 | 12,883 |
| Research and development expenses | 1,099 | 1,287 | 1,075 |
| Of which identified items: | | | |
| Redundancy and restructuring (charges)/reversal | (1,009) | (325) | 46 |
| (Provisions)/reversal | (454) | (434) | 77 |
| Other | 252 | — | (143) |
| Identified items | (1,210) | (758) | (21) |
| Underlying operating expenses | 35,707 | 39,201 | 39,456 |
Total spend on goods and services
Total spend on goods and services represents the amounts paid to our suppliers globally and is comprised of both Capital Expenditure and Operating Expenditure. Employee costs are excluded from Operating costs as these do not relate to third-party spend.
The total spend on goods and services is used to demonstrate the company's societal contribution towards suppliers, contractors and communities where Shell operates.
The calculation of Total spend on goods and services was changed in 2023, with data published in previous years being limited to spend for Operated assets that has been contracted with the support of the Contracting and Procurement team, calculated on a cash payments basis.
| | | | | | | | | | | |
Total spend on goods and services |
| $ million |
| 2024 | 2023 | 2022 |
Capital Expenditure | 19,601 | 22,993 | 22,600 |
Add: Underlying Operating Expenditure [A] | 35,707 | 39,201 | 39,456 |
Less: Employee costs [B] | 13,452 | 13,629 | 13,971 |
Total spend on goods and services | 41,856 | 48,565 | 48,085 |
[A]See the "Operating expenses and underlying operating expenses" table above.
[B]See Note 33 to the "Consolidated Financial Statements".
Structural cost reduction
The structural cost reduction target is used for the purpose of demonstrating how management drives cost discipline across the entire organisation, simplifying our processes and portfolio, and streamlining the way we work.
Structural cost reduction describes the decrease in underlying operating expenses as a result of operational efficiencies, divestments, workforce reductions and other cost-saving measures that are expected to be sustainable compared with 2022 levels.
The total change between periods in underlying operating expenses will reflect both structural cost reductions and other changes in spend, including market factors, such as inflation and foreign exchange impacts, as well as changes in activity levels and costs associated with new operations.
Estimates of cumulative annual structural cost reduction may be revised depending on whether cost reductions realised in prior periods are determined to be sustainable compared with 2022 levels. Structural cost reductions are stewarded internally to support management's oversight of spending over time. The 2025 target reflects annualised saving achieved by end-2025.
| | |
| Structural cost reduction |
| | | | | | | | | | | |
| $ million |
| 2024 | 2023 | Total [A] |
| Underlying Operating expenses current year | 35,707 | 39,201 | |
| Underlying Operating expenses previous year | 39,201 | 39,456 | |
| Total decrease in Underlying operating expenses | (3,494) | (255) | (3,749) |
Of which: | | | |
Structural cost reduction | (2,132) | (987) | (3,119) |
Increase (decrease) in underlying operating expenses except structural cost reduction | (1,362) | 732 | (630) |
[A] Structural cost reductions up to 2024 compared to 2022.Capital Employed
Effective from 2024, the definition of capital employed has been amended to reflect the deduction of cash and cash equivalents.
Management believes that the updated methodology better reflects Shell's approach to managing capital employed, including the management of cash and cash equivalents alongside total debt and equity as part of the financial framework. Comparative information has been revised to reflect the updated definition.
| | | | | | | | | | | |
| $ million |
| 2024 | 2023 | 2022 |
| Current debt | 9,931 | 9,001 | 8,218 |
| Non-current debt | 71,610 | 74,794 | 80,868 |
| Total equity | 188,362 | 192,597 | 175,326 |
| Less: Cash and cash equivalents | (38,774) | (40,246) | (36,970) |
| Capital employed – opening | 231,128 | 236,146 | 227,442 |
| Current debt | 11,630 | 9,931 | 9,001 |
| Non-current debt | 65,448 | 71,610 | 74,794 |
| Total equity | 180,168 | 188,362 | 192,597 |
| Less: Cash and cash equivalents | (39,110) | (38,774) | (40,246) |
| Capital employed – closing | 218,134 | 231,128 | 236,146 |
| Capital employed – average | 224,630 | 233,637 | 231,794 |
Return on average capital employed
Return on average capital employed ("ROACE") measures the efficiency of Shell's utilisation of the capital that it employs. Shell uses two ROACE measures: ROACE on an Adjusted Earnings plus
Non-controlling interest (NCI) basis and LTIP ROACE.
ROACE on an Adjusted Earnings plus NCI basis relies on earnings on an Adjusted Earnings plus NCI basis excluding identified items adjusted for after-tax interest expense and after-tax interest income and is considered to be comparable with Shell's IFRS peers, who tend to adjust for similar items when calculating ROACE. The measure refers to Capital employed which consists of Total equity, current debt, and non-current debt, reduced by cash and cash equivalents.
In addition, the numerator applied to ROACE on an Adjusted Earnings plus NCI basis has been amended to remove interest on cash and cash equivalents for consistency with the revised capital employed definition.
LTIP (Long-Term Incentive Plan vesting) ROACE is a performance measure that is used for Long-Term Incentive Plan performance ranking and is defined as net income for the period as a percentage of the average capital employed for the period. The Capital Employed that is applied is different to the ROACE on an Adjusted earnings plus NCI basis in that it is not adjusted for Cash and cash equivalents.
ROACE on a Net Income basis has been discontinued, as this measure is no longer routinely used by management in assessing the efficiency of capital employed.
| | |
| ROACE on an Adjusted Earnings plus Non-controlling interest (NCI) basis |
| | | | | | | | | | | |
| $ million |
| 2024 | 2023 | 2022 |
Adjusted Earnings | 23,716 | 28,250 | 39,870 |
Add: Income/(loss) attributable to Non-controlling interest | 427 | 277 | 565 |
Add: Current cost of supplies adjustment attributable to Non-controlling interest | 14 | (5) | (116) |
Less: Identified items attributable to Non-controlling interest | 18 | (11) | 15 |
Adjusted Earnings plus Non-controlling interest excluding identified items | 24,139 | 28,534 | 40,304 |
Add: Interest expense after tax | 2,701 | 2,728 | 1,931 |
| Less: Interest income after tax on cash and cash equivalents | 1,389 | 1,287 | 457 |
| Adjusted Earnings plus Non-controlling interest excluding identified items before interest expense and interest income | 25,452 | 29,975 | 41,777 |
| Capital employed - average | 224,630 | 233,637 | 231,794 |
| ROACE on an Adjusted Earnings plus Non-controlling interest basis | 11.3% | 12.8% | 18.0% |
| | | | | | | | | | | |
| $ million |
| 2024 | 2023 | 2022 |
| Income for the period | 16,521 | 19,636 | 42,874 |
| Capital Employed - opening including cash and cash equivalents | 269,902 | 276,392 | 264,413 |
| Capital employed - closing including cash and cash equivalents | 257,242 | 269,902 | 276,392 |
| Capital Employed including cash and cash equivalents - average | 263,572 | 273,147 | 270,402 |
| Net Income ROACE | 6.3% | 7.2% | 15.9% |
Furthermore an additional measure of Price normalised ROACE on an Adjusted Earnings plus NCI basis, was introduced during Capital Market Day 2025 for purposes of tracking improvement in underlying performance in the utilisation of the capital that the company employs. The exclusion of the impact of price effects provides a more comparable reflection of the underlying business performance.
This new measure will be calculated in the same manner as ROACE on an Adjusted Earnings plus NCI basis, with the only difference being the price-normalisation of Adjusted Earnings.
Price-normalisation refers to the process of removing the impact of macroeconomic price movements, so as to determine a more comparable basis for calculating the ROACE year on year. Shell believes this is a more meaningful basis for investors to be able to assess the Company's performance over time.
The normalised Adjusted Earnings will be determined by price-normalising the adjusted earnings using a price set as published in Quarterly Databook for Brent, Henry Hub on a real term 2024 basis (and related gas markers) and Refining and Chemicals Margin to a price set as communicated during Capital Market Day 2025.
Net debt, Net debt excluding lease liabilities and gearing
Net debt is defined as the sum of current and non-current debt, less cash and cash equivalents, adjusted for the fair value of derivative financial instruments used to hedge foreign exchange and interest rate risk relating to debt, and associated collateral balances. Management considers this adjustment useful because it reduces the volatility of net debt caused by fluctuations in foreign exchange and interest rates, and eliminates the potential impact of related collateral payments or receipts. Debt-related derivative financial instruments are a subset of the derivative financial instrument assets and liabilities presented on the balance sheet. Collateral balances are reported under "Trade and other receivables" or "Trade and other payables" as appropriate. See also Note 20 to the "Consolidated Financial Statements".
Net debt excluding lease liabilities is calculated by subtracting lease liabilities from Net Debt.
Lease Liabilities are frequently long-term operational necessities rather than discretionary financing choices. Management believes that using Net debt excluding lease liabilities alongside Net debt gives better insight to the financial position by reflecting debt directly tied to financing activities, and improving comparability against peers with different asset ownership strategies or following different accounting standards.
Gearing is a measure of Shell's capital structure and is defined as net debt as a percentage of total capital (net debt plus total equity).
| | |
| Net debt, Net Debt excluding Lease Liabilities and Gearing |
| | | | | | | | | | | |
| $ million |
| 2024 | 2023 | 2022 |
| Current debt | 11,630 | 9,931 | 9,001 |
| Non-current debt | 65,448 | 71,610 | 74,794 |
| Total debt | 77,078 | 81,541 | 83,795 |
| Of which lease liabilities | 28,702 | 27,709 | 27,643 |
| Add: Debt-related derivative financial instruments: net liability / (asset) | 2,469 | 1,835 | 3,071 |
| Add: Collateral on debt-related derivatives: net liability / (asset) | (1,628) | (1,060) | (1,783) |
| Less: Cash and cash equivalents | (39,110) | (38,774) | (40,246) |
| Net Debt | 38,809 | 43,542 | 44,837 |
| Of which Net Debt excluding lease liabilities | 10,107 | 15,833 | 17,194 |
| Add: Total equity | 180,168 | 188,362 | 192,597 |
| Total capital | 218,974 | 231,902 | 237,434 |
| Gearing | 17.7% | 18.8% | 18.9% |
Cash flow from operating activities excluding working capital movements
Working capital movements are defined as the sum of the following items in the Statement of Cash Flows: (increase) or decrease in inventories, (increase) or decrease in current receivables, and increase or (decrease) in current payables.
Cash flow from operating activities excluding working capital movements is a measure used by Shell to analyse its operating cash generation over time excluding the timing effects of changes in inventories and operating receivables and payables from period to period.
| | |
Cash flow from operating activities excluding working capital movements |
| | | | | | | | | | | |
| $ million |
| 2024 | 2023 | 2022 |
| Cash flow from operating activities | 54,687 | 54,191 | 68,414 |
| (Increase)/decrease in inventories | 1,273 | 6,325 | (8,360) |
| (Increase)/decrease in current receivables | 6,578 | 12,401 | (8,989) |
| Increase/(decrease) in current payables [A] | (5,789) | (11,581) | 12,329 |
| (Increase)/decrease in working capital [A] | 2,062 | 7,145 | (5,021) |
| Cash flow from operating activities excluding working capital movements [A] | 52,625 | 47,046 | 73,434 |
[A]To further enhance consistency between working capital and the Balance Sheet and the Statement of Cash Flows, from January 1, 2024, onwards movements in current other provisions are recognised in 'Decommissioning and other provisions' instead of 'Increase/(decrease) in current payables'. Comparatives for 2023 and 2022 have been reclassified accordingly to conform with current period presentation.
Free cash flow and organic free cash flow
Free cash flow is used to evaluate cash available for financing activities, including shareholder distributions and debt servicing, after investment in maintaining and growing our business.
Organic free cash flow is defined as Free cash flow excluding the cash flows from acquisition and divestment activities. It is a measure used by management to evaluate generation of cash flow without these activities.
| | |
| Free cash flow and Organic free cash flow |
| | | | | | | | | | | |
| $ million |
| 2024 | 2023 | 2022 |
| Cash flow from operating activities | 54,687 | 54,191 | 68,414 |
| Cash flow from investing activities | (15,155) | (17,734) | (22,448) |
| Free cash flow | 39,533 | 36,457 | 45,965 |
Less: Divestment proceeds [A] | 2,793 | 3,091 | 2,059 |
Add: Tax paid on divestments (reported under "Other investing cash outflows") | 1 | — | 17 |
| Add: Cash outflows related to inorganic capital expenditure [B] | 776 | 2,522 | 4,205 |
| Organic free cash flow | 37,517 | 35,888 | 48,128 |
[A]See "Divestment Proceeds" on page 344.
[B]Cash outflows related to inorganic capital expenditure includes portfolio actions which expand Shell's activities through acquisitions and restructuring activities as reported in capital expenditure lines in the "Consolidated Statement of Cash Flows".
Shareholder distribution and Shareholder distribution as percentage of CFFO
Shareholder distribution is used to evaluate the level of cash distribution to shareholders. It is defined as the sum of Cash dividends paid to Shell plc shareholders and Repurchases of shares. Both are reported in the Consolidated Statement of Cash Flows.
Shareholder distribution as a percentage of CFFO is used to measure the company's progress on increasing returns to shareholders. This measure is calculated by dividing the Shareholder distribution by the annual CFFO as presented in the Consolidated Statement of Cash Flows.
| | |
Shareholder distribution and Shareholder distribution as percentage of CFFO |
| | | | | | | | | | | |
| $ million |
| 2024 | 2023 | 2022 |
| Cash dividends paid to Shell plc shareholders | 8,668 | 8,393 | 7,405 |
| Repurchases of shares | 13,898 | 14,617 | 18,437 |
| Shareholder distribution | 22,566 | 23,010 | 25,842 |
CFFO | 54,687 | 54,191 | 68,414 |
Shareholder distribution as % CFFO | 41% | 42% | 38% |
Divestment proceeds
Divestment proceeds represent cash received from divestment activities in the period. Management regularly monitors this measure as a key lever to deliver sustainable cash flow.
| | | | | | | | | | | |
| $ million |
| 2024 | 2023 | 2022 |
| Proceeds from sale of property, plant and equipment and businesses | 1,621 | 2,565 | 1,431 |
| Proceeds from joint ventures and associates from sale, capital reduction and repayment of long-term loans | 590 | 474 | 511 |
| Proceeds from sale of equity securities | 582 | 51 | 117 |
| Divestment proceeds | 2,793 | 3,091 | 2,059 |
| | | |
| | | |
| | | |
| | | |
| | | |
| | | |
| | | |
Normalised free cash flow growth per share
Normalised free cash flow growth per share is a new business target introduced during Capital Markets Day in 2025 for purposes of demonstrating progress in value creation towards achieving our strategy, reported on an annual basis.
As from 2025 this new measure will replace the previous measures of Price-normalised free cash flow growth and Price-normalised free cash flow growth per share and will apply Organic free cash flow as the basis instead of Free cash flow, and also exclude the volatility of working capital and derivatives.
Price-normalised free cash flow will be determined by price-normalising the organic free cash flow using a price set as published in the Quarterly Databook for Brent, Henry Hub on a real term 2024 basis (and related gas markers) and Refining and Chemicals Margin to a price set as communicated during Capital Market Day 2025. This Price-normalised organic free cash flow is then adjusted for the impact of working capital and derivatives.
Price-normalisation refers to the process of removing the impact of macroeconomic price movements, so as to determine a more comparable basis for calculating the growth in organic free cash flow year on year. Shell believes this is a more meaningful basis for investors to be able to assess the Company's performance over time.
The Normalised free cash flow per share is calculated by dividing the Normalised free cash flow (see above) by the number of shares outstanding at the end of the period (the number of shares excludes shares held in trust).
The Normalised free cash flow growth per share is determined by comparing the Normalised free cash flow per share of the current year to the previous year.
Taxes paid
Taxes paid represents the taxes paid to governments and comprises Corporate income tax and government royalties.
This measure differs to prior years reporting in that taxes of excise duties, sales taxes and similar levies on our fuel and products that are collected on behalf of the governments are no longer included. The removal of taxes collected which are not directly sourced from our systems is in line with our strategic simplification approach.
| | | | | | | | | | | |
| $ million |
| 2024 | 2023 | 2022 |
Corporate income tax [A] | 12,459 | 14,134 | 13,411 |
Royalties [B] | 5,737 | 6,073 | 8,189 |
Taxes paid | 18,196 | 20,207 | 21,600 |
[A]We paid $12 billion in corporate income taxes and accrued $0.5 billion of withholding taxes. Income taxes come from Tax paid in the Consolidated Statement of Cash Flows and withholding tax is part of "Other" of $1.5 billion in the Consolidated Statement of Cash Flows.
[B]Includes Production Taxes. Part of Purchases of $188.1 billion as included in the Consolidate Statement of Income.
Index to the Exhibit | | | | | | | | | | | |
| Exhibit No. | | Description | |
| 1.1 | | | |
| 1.2 | | | |
| 2.1 | | | |
| 2.3 | | | |
| 2.4 | | | |
| 2.5 | | Form of American Depositary Receipts representing Shell plc American Depositary Shares each evidencing the right to receive two ordinary shares of Shell plc (included as Exhibit A to Exhibit 2.4 herein). | |
| 2.6 | | | |
| 2.7 | | | |
| 2.8 | | | |
| 4.1 | | | |
| 4.2 | | | |
| 4.3 | | Form of contract of employment for Executive Directors (incorporated by reference to Exhibit 4.3 to the Annual Report for fiscal year ended December 31, 2023, on Form 20-F (File No. 001-32575) of Shell plc filed with the US Securities and Exchange Commission on March 14, 2024). | |
| 4.4 | | | |
| 4.5 | | | |
| 4.6 | | | |
| 4.7 | | Rules of the Shell Share Plan 2023 (incorporated by reference to Exhibit 4.7 to the Annual Report for the fiscal year ended December 31, 2023, on Form 20-F (File No. 001-32575) of Shell plc filed with the US Securities and Exchange Commission on March 14, 2024). | |
| 4.8 | | | |
| 8.1 | | | |
| 11.1 | | | |
| 11.2 | | | |
| 12.1 | | | |
| 12.2 | | | |
| 13.1 | | | |
| 15.1 | | | |
| 17.1 | | | |
| 97.1 | | | |
| 101 | | Inline Interactive data files. | |
| 104 | | Cover page inline interactive data file (formatted as Inline XBRL and contained in Exhibit 101). | |
Signatures
The registrant hereby certifies that it meets all of the requirements for filing on Form 20-F and that it has duly caused and authorised the undersigned to sign this annual report on its behalf.
Shell plc
| | | | | |
| /s/ Wael Sawan | |
| Wael Sawan | |
| Chief Executive Officer | |
March 25, 2025 | |
Financial calendar in 2025
The Annual General Meeting will be held on May 20, 2025.
| | | | | | | | | | | | | | |
| 2024 Fourth quarter [A] | 2025 First quarter [B] | 2025 Second quarter [B] | 2025 Third quarter [B] |
| Results announcements | January 30 | May 2 | July 31 | October 30 |
| Interim dividend timetable | | | | |
| Announcement date | January 30 [C] | May 2 | July 31 | October 30 |
Ex-dividend date for SHEL ADS | February 14 | May 16 | August 15 | November 14 |
| Ex-dividend date for SHEL ordinary shares | February 13 | May 15 | August 14 | November 13 |
| Record date | February 14 | May 16 | August 15 | November 14 |
Closing of currency election date [D] | February 28 | June 2 | September 1 | November 28 |
| Pounds sterling and euro equivalents announcement date | March 10 | June 9 | September 8 | December 8 |
| Payment date | March 24 | June 23 | September 22 | December 18 |
[A]In respect of the financial year ended December 31, 2024.
[B]In respect of the financial year ended December 31, 2025.
[C]The Directors do not propose to recommend any further distribution in respect of 2024.
[D]A different currency election date may apply to shareholders holding shares in a securities account with a bank or financial institution ultimately through Euroclear Nederland. This may also apply to other shareholders who do not hold their shares either directly on the Register of Members or in the corporate sponsored nominee arrangement. Shareholders can contact their broker, financial intermediary, bank or financial institution for the election deadline that applies.
Contact Us
The best way to get in touch is via the "Contact us" section of the Shell website shell.com/investors. From here questions are properly directed to the Shell team that can assist. In addition, we have introduced an automated question response tool to assist with the most popular questions that we receive and reviewed and updated the "Shareholder FAQ" section of our website to provide the most time efficient information for our investors.
| | | | | | | | |
Registered Office and HQ Shell plc Shell Centre London SE1 7NA United Kingdom
Registered in England and Wales Company number 4366849
| Share registration Equiniti Aspect House Spencer Road Lancing West Sussex BN99 6DA United Kingdom 0800 169 1679 customer@equiniti.com
For online information about your holding and to change the way you receive your company documents: shareview.co.uk | Investor Relations Shell plc PO Box 162 2501 AN The Hague The Netherlands
or
Shell Oil Company Investor Relations 150 N Dairy Ashford Houston, TX 77079 USA shell.com/investors |
| | |
American Depositary Shares (ADSs) JPMorgan Chase Bank, N.A. Shareowner Services P.O. Box 64504 St. Paul, MN 55164-0504 USA
Overnight correspondence to: Shareowner Services 1110 Centre Pointe Curve, Suite 101 Mendota Heights, MN 55120-4100 USA +1 888 737 2377 (USA only) +1 651 453 2128 (International) Email: shareowneronline.com/informational/contact-us/ adr.com/shareholder |
| Report ordering shell.com/annualreport |