falseFY0001263043M5KRKRIt is the goodwill recognized by Shinhan Financial Plus, a subsidiary acquired in the previous year, from a business transfer for the GF division and IMGA division of Leaders Financial Marketing.Fair value of investment properties is estimated based in the recent market transaction conditions with an independent third party and certain significant unobservable inputs. Accordingly, fair value of investment properties is classified as level 3.It is the carrying value after reflecting the impairment loss in the securities sector.Dividends for hybrid bonds are deducted.Gain and loss on disposal of sale-and-leaseback are included in gain and loss on disposal of property, plant, and equipment and gain on disposal of investment property, respectively. Gain on disposal of sale-and-leaseback for the year ended December 31, 2020 is W 9,761 million.Gain and loss on disposal of sale-and-leaseback are included in gain and loss on disposal of property and equipment, gain and loss on disposal of investment property and gain on assets held for sale, respectively. Gain on disposal of sale-and-leaseback for the years ended December 31, 2021 and 2022 are W 9,761 million and W 443,780 million, respectively.It includes W 284,176 million, W 466,775 million and W 168,020 million, respectively, for the years ended December 31, 2020, 2021 and 2022 of estimated claim for damages that are highly probable to be paid in case of customer losses expected due to redemption delays of Lime CI funds, etc.The number of basic ordinary shares outstanding is 508,784,869 shares and the above weighted-average stocks are calculated by reflecting treasury stocks issued and 17,482,000 shares of convertible preferred shares issued on May 1, 2019.Treasury stock has retired on June 1, 2020.The expenses of share-based payment transactions are the renumeration expenses during the vesting period.The payments for leases with terms less than 1 month are included.As the corporate tax rate was changed due to the tax law revision in the end of 2022, the effect of the tax rate change was reflected in deferred tax assets (liabilities) expected to be realized 2023 onward.Unused credit commitments provided to the card customers are included, the amounts are W 86,979,545 million for the year ended December 31, 2021 and W 90,452,012 million for the year ended December 31, 2022.Among operating lease fees recognized for the years ended December 31, 2020, 2021 and 2022, there is no variable lease fee income which does not vary by index or rate.The notional amounts of derivatives outstanding those will be settled in the ‘Central Counter Party (CCP)’ system.The maximum exposure amounts for due from banks, loans, securities at amortized cost and other financial assets at amortized cost are recorded as net of allowances. Classified as similar credit risk group based on calculation of the BIS ratio under new Basel Capital Accord (Basel III). Other financial assets mainly comprise of accounts receivable, accrued income, deposits, domestic exchange settlement debit and suspense payments. The liability for defined benefit obligation of W90,816 million as of December 31, 2021 is the net defined benefit liabilities of W142,020 million less the net defined assets of W51,204 million. In addition, the asset for defined benefit obligation of W604,989 million as of December 31, 2022 is the net defined benefit assets of W619,653 million less the net defined liabilities of W14,664 million.Goodwill impairment incurred from the cash-generating unit of security sector at PT Shinhan Sekuritas Indonesia. As a result of the impairment test for goodwill of PT Shinhan Sekuritas Indonesia’s cash-generating unit, the Group’s interests of the carrying amount exceeding the recoverable amount of the cash-generating unit was recognized as an impairment loss for W 2,258 million. This is attributable to the continued high prices caused by the prolonged crisis in Ukraine in 2022, the local and global economic downturn, and the increase in the discount rate due to the global high interest rate economic phenomenon, and recoverable amount decreased by W 1,569 million compared to the previous year. The amount of impairment loss recognized is included in the non-operating expenses, the line item of the consolidated statement of comprehensive income.Included in general administrative expense and other operating income(expense) of the consolidated statements of comprehensive income.Included in general administrative expense and other operating income(expense) of the consolidated statements of comprehensive income.Deferred tax assets from overseas subsidiaries are increased by W939 million due to foreign exchange rate movements.The intrinsic value of share-based payments is W67,442 million as of December 31, 2020. For the calculation, the quoted market price of W32,050 per share is used for stock options and the fair value is considered as intrinsic value for performance shares, respectively.As of December 31, 2021, all stock options have expired.Deferred tax assets from overseas subsidiaries are decreased by W2,797 million due to foreign exchange rate movements.Deferred tax effects, which are originated from the accumulated other comprehensive income in separate account, are included in the other liabilities of principle and interest guaranteed separate account’s financial statement.Excluded from the associates due to disposal and liquidation for the year ended December 31, 2021.Excluded from the associates due to disposal and liquidation for the year ended December 31, 2020.Excluded from the associates due to disposal and liquidation for the year ended December 31, 2022.For the year ended December 31, 2022, it is incorporated into the consolidation target as the Group held control due to increased equity ratio and BNP Paribas Cardif General Insurance, Ltd. has changed its name to Shinhan EZ General Insurance, Ltd. The transaction amount for the years ended December 31, 2020, 2011 and 2022 is the amount before being incorporated into the consolidation target.Based on performance-based stock compensation, the reference stock price (the arithmetic average of the weighted average share price of transaction volume for the past two month, the previous one month, and the past one week) of four years after the commencement of the grant year is paid in cash, and the fair value of the reference stock to be paid in the future is assessed as the closing price of the settlement. ΔNII is the change in net interest income that can occur over the next year due to changes in interest rates by using the Basel III standard based IRRBB method.ΔEVE is the change in economic value of equity capital that can arise from changes in interest rates that affect the present value of assets, liabilities and off-balance sheet items by using the Basel III standard based IRRBB method.The amount of the policyholders equity adjustment for the reclassification of other comprehensive income is W13,277 million for the year ended December 31, 2022.The related account categories are presented as interest rate swap assets / liabilities and currency swap assets / liabilities, currency forwards assets / liabilities and borrowings.The amount of the policyholders equity adjustment for the reclassification of other comprehensive income is W11,079 million for the year ended December 31, 2021.The amount of uncollected loans currently in recovery (principal and interest) is W 10,613,730 million, which is written off as of December 31, 2021.The amount of uncollected loans currently in recovery (principal and interest) is W 9,739,237 million, which is written off as of December 31, 2022.The effect on changes in allowance for credit loss is included.The effect on changes in allowance for credit loss is included. 58Considering the default forecast period, the Group reflected the future economic outlook. The macroeconomic outlook figures are estimated by the Group for the purpose of calculating expected credit losses based on information from domestic and foreign research institutes. Therefore, it could be different from other institutions’ estimates.As a result of examining the correlation between each variable, Shinhan Bank applied the GDP growth rate and private consumption index increase rate, etc. as the major variables to reflect the final forward-looking information, while, Shinhan Card applied the GDP growth rate, facility investment change rate, and current account balance, etc. as the major variables. In addition to the table above, the Group has selected unemployment rate and KOSPI forecasts.Shinhan Bank applied the GDP growth rate and private consumption index as the major variables. In addition, Shinhan Card applied the GDP growth rate, facility investment growth rate, consumer price index growth rate, and balance on current account as the major variables. In addition to the table above, the Group has selected additional forecasts for the KOSPI.The current dividend(plan) will be decided on March 23, 2023. The amount of dividends was not recognized as a distribution to the owner during the period.Dividends on own shares held by the Group are excluded. During the business combination, the Group acquired receivables that were fair value of W98 million, and the total contract amount was W98 million. There is no contractual cash flow that is not expected to be recovered from the receivables.The accounting for the acquisition of Shinhan EZ General Insurance, Ltd. was determined using the identifiable assets and liabilities recognized by Shinhan EZ General Insurance, Ltd. at the time of business combination.VOBA (Value Of Business Acquired) measured separately was adjusted by applying the direct method based on the actuarial appraisal value model to the carrying amount of the acquired company’s insurance contract liabilities.Shinhan Bank and Jeju Bank reviewed and reflected the Worst scenario (during the foreign exchange crisis) in addition to the three scenarios of Upside, Central and Downside.Comprise buildings and land, etc.The adjustments for others are the unrecognized equity method for preferred stocks without voting rights issued by the invested company. Other represents the adjustments of fair value when acquired. Others are the amount of fair value adjustments that occurred at the time of acquisition and accumulated losses that were not recognized due to the suspension of equity method recognition as the investment account balance became “0” due to the accumulation of losses for the current period. The instruments that will be matured before the end of June 30, 2023 when USD LIBOR interest rate calculation is discontinued are excluded.The instruments that will be matured before the end of June 30, 2023 when USD LIBOR interest rate calculation is discontinued are excluded.The commitments and guarantee contracts are in nominal amount.Includes the 5.46% shares Shinhan Life Insurance Co., Ltd. held.Other changes are due to effects of changes in foreign exchange rate. 0001263043 2022-01-01 2022-12-31 0001263043 2022-12-31 0001263043 2021-12-31 0001263043 2021-01-01 2021-12-31 0001263043 2020-01-01 2020-12-31 0001263043 2020-12-31 0001263043 2021-01-01 0001263043 2020-12-31 2020-12-31 0001263043 2019-05-01 2019-05-01 0001263043 2022-01-01 2022-03-31 0001263043 2022-04-01 2022-06-30 0001263043 2022-07-01 2022-09-30 0001263043 2019-12-31 0001263043 srt:ParentCompanyMember 2021-12-31 0001263043 ifrs-full:AssetbackedFinancingsMember 2021-12-31 0001263043 ifrs-full:InvestmentFundsMember 2021-12-31 0001263043 shg:StructuredFinancingMember 2021-12-31 0001263043 ifrs-full:AssetbackedFinancingsMember shg:LoanReceivablesMeasuredAtFVTPLMember 2021-12-31 0001263043 ifrs-full:AssetbackedFinancingsMember shg:LoansAtAmortizedCostMember 2021-12-31 0001263043 shg:LoansAtAmortizedCostMember 2021-12-31 0001263043 ifrs-full:InvestmentFundsMember shg:SecuritiesAtFVTPLMember 2021-12-31 0001263043 shg:StructuredFinancingMember shg:DerivativeFinancialInstrumentsAssetsMember 2021-12-31 0001263043 shg:StructuredFinancingMember ifrs-full:FinancialAssetsAtAmortisedCostMember 2021-12-31 0001263043 ifrs-full:OtherAssetsMember ifrs-full:AssetbackedFinancingsMember 2021-12-31 0001263043 ifrs-full:FinancialAssetsAtAmortisedCostMember 2021-12-31 0001263043 ifrs-full:AssetbackedFinancingsMember ifrs-full:FinancialAssetsAtAmortisedCostMember 2021-12-31 0001263043 ifrs-full:InvestmentFundsMember ifrs-full:FinancialAssetsAtFairValueThroughOtherComprehensiveIncomeCategoryMember 2021-12-31 0001263043 shg:DerivativeFinancialInstrumentsAssetsMember 2021-12-31 0001263043 ifrs-full:AssetbackedFinancingsMember shg:DerivativeFinancialInstrumentsAssetsMember 2021-12-31 0001263043 shg:StructuredFinancingMember shg:SecuritiesAtFVTPLMember 2021-12-31 0001263043 ifrs-full:InvestmentFundsMember shg:LoansAtAmortizedCostMember 2021-12-31 0001263043 ifrs-full:OtherAssetsMember 2021-12-31 0001263043 ifrs-full:FinancialAssetsAtFairValueThroughOtherComprehensiveIncomeCategoryMember 2021-12-31 0001263043 ifrs-full:InvestmentFundsMember ifrs-full:OtherAssetsMember 2021-12-31 0001263043 shg:StructuredFinancingMember ifrs-full:OtherAssetsMember 2021-12-31 0001263043 ifrs-full:InvestmentFundsMember ifrs-full:FinancialAssetsAtAmortisedCostMember 2021-12-31 0001263043 shg:StructuredFinancingMember ifrs-full:FinancialAssetsAtFairValueThroughOtherComprehensiveIncomeCategoryMember 2021-12-31 0001263043 ifrs-full:InvestmentFundsMember shg:DerivativeFinancialInstrumentsAssetsMember 2021-12-31 0001263043 shg:LoanReceivablesMeasuredAtFVTPLMember 2021-12-31 0001263043 shg:LoanReceivablesMeasuredAtFVTPLMember ifrs-full:InvestmentFundsMember 2021-12-31 0001263043 shg:SecuritiesAtFVTPLMember 2021-12-31 0001263043 ifrs-full:AssetbackedFinancingsMember ifrs-full:FinancialAssetsAtFairValueThroughOtherComprehensiveIncomeCategoryMember 2021-12-31 0001263043 ifrs-full:AssetbackedFinancingsMember shg:SecuritiesAtFVTPLMember 2021-12-31 0001263043 shg:StructuredFinancingMember shg:LoansAtAmortizedCostMember 2021-12-31 0001263043 shg:StructuredFinancingMember shg:LoanReceivablesMeasuredAtFVTPLMember 2021-12-31 0001263043 shg:StructuredFinancingMember ifrs-full:ClassesOfAssetsMember 2021-12-31 0001263043 ifrs-full:InvestmentFundsMember shg:PurchaseCommitmentMember 2021-12-31 0001263043 shg:StructuredFinancingMember ifrs-full:LoanCommitmentsMember 2021-12-31 0001263043 ifrs-full:LoanCommitmentsMember 2021-12-31 0001263043 shg:OtherContractMember 2021-12-31 0001263043 shg:StructuredFinancingMember ifrs-full:GuaranteesMember 2021-12-31 0001263043 ifrs-full:InvestmentFundsMember ifrs-full:LoanCommitmentsMember 2021-12-31 0001263043 ifrs-full:InvestmentFundsMember ifrs-full:ClassesOfAssetsMember 2021-12-31 0001263043 ifrs-full:GuaranteesMember ifrs-full:AssetbackedFinancingsMember 2021-12-31 0001263043 ifrs-full:GuaranteesMember 2021-12-31 0001263043 shg:StructuredFinancingMember shg:PurchaseCommitmentMember 2021-12-31 0001263043 ifrs-full:AssetbackedFinancingsMember ifrs-full:LoanCommitmentsMember 2021-12-31 0001263043 shg:StructuredFinancingMember shg:OtherContractMember 2021-12-31 0001263043 shg:PurchaseCommitmentMember ifrs-full:AssetbackedFinancingsMember 2021-12-31 0001263043 shg:PurchaseCommitmentMember 2021-12-31 0001263043 ifrs-full:ClassesOfAssetsMember 2021-12-31 0001263043 ifrs-full:AssetbackedFinancingsMember ifrs-full:ClassesOfAssetsMember 2021-12-31 0001263043 shg:ExternalCreditRatingsOfAAAMember 2021-12-31 0001263043 ifrs-full:ExternalCreditGradesMember 2021-12-31 0001263043 shg:ExternalCreditRatingsOfAMinusToAPlusMember 2021-12-31 0001263043 shg:ExternalCreditRatingsOfAAMinusToAAPlusMember 2021-12-31 0001263043 shg:PerformanceSharesMember 2021-12-31 0001263043 shg:SubsidiaryShinhanLifeInsuranceMember 2021-12-31 0001263043 shg:SubsidiaryShinhanVentureInvestmentMember 2021-12-31 0001263043 shg:ShinhanSecuritiesCo.Ltd.Member 2021-12-31 0001263043 shg:AssociatesShinhanEzGeneralInsuranceLtd.Member 2021-12-31 0001263043 shg:DummySMember 2021-12-31 0001263043 shg:ShinhanAssetTrustCo.Ltd.Member 2021-12-31 0001263043 shg:SubsidiaryShinhanAssetManagementCo.Ltd.Member 2021-12-31 0001263043 shg:SubsidiaryShinhanAIMember 2021-12-31 0001263043 shg:SubsidiaryShinhanBankMember 2021-12-31 0001263043 shg:SubsidiaryShinhanAitasMember 2021-12-31 0001263043 shg:SubsidiaryJejuBankMember 2021-12-31 0001263043 shg:SubsidiaryShinhanDataSystemMember 2021-12-31 0001263043 shg:SubsidiaryShinhanAlternativeInvestmentManagementMember 2021-12-31 0001263043 shg:SubsidiarySHCManagementMember 2021-12-31 0001263043 shg:SubsidiaryShinhanCapitalMember 2021-12-31 0001263043 shg:SubsidiaryShinhanCardMember 2021-12-31 0001263043 shg:SubsidiaryShinhanSavingsBankMember 2021-12-31 0001263043 shg:SubsidiaryShinhanREITsManagementMember 2021-12-31 0001263043 shg:InternalCreditRatingOfBBBPlusOrAboveMember 2021-12-31 0001263043 shg:InternalCreditRatingOfBelowBBBPlusMember 2021-12-31 0001263043 ifrs-full:AtFairValueMember 2021-12-31 0001263043 ifrs-full:Level2OfFairValueHierarchyMember 2021-12-31 0001263043 ifrs-full:Level1OfFairValueHierarchyMember 2021-12-31 0001263043 shg:CarryingValueMember 2021-12-31 0001263043 ifrs-full:Level3OfFairValueHierarchyMember 2021-12-31 0001263043 ifrs-full:FinancialAssetsAtFairValueThroughOtherComprehensiveIncomeCategoryMember 2021-12-31 0001263043 shg:DesignatedAsHedgingInstrumentMember 2021-12-31 0001263043 ifrs-full:FinancialAssetsAtAmortisedCostCategoryMember 2021-12-31 0001263043 ifrs-full:FinancialAssetsAtFairValueThroughProfitOrLossCategoryMember 2021-12-31 0001263043 country:VN shg:DueFromBanksAndLoansAtAmortizedCostMember shg:ShinhanBankMember 2021-12-31 0001263043 shg:ShinhanBankMember shg:DueFromBanksAndLoansAtAmortizedCostMember 2021-12-31 0001263043 shg:OthersCountryMember shg:DueFromBanksAndLoansAtAmortizedCostMember ifrs-full:ConsumerLoansMember 2021-12-31 0001263043 ifrs-full:GovernmentMember country:KR shg:DueFromBanksAndLoansAtAmortizedCostMember 2021-12-31 0001263043 ifrs-full:GovernmentMember country:JP shg:DueFromBanksAndLoansAtAmortizedCostMember 2021-12-31 0001263043 ifrs-full:GovernmentMember country:CN shg:DueFromBanksAndLoansAtAmortizedCostMember 2021-12-31 0001263043 country:CN shg:DueFromBanksAndLoansAtAmortizedCostMember ifrs-full:CorporateLoansMember 2021-12-31 0001263043 country:JP shg:DueFromBanksAndLoansAtAmortizedCostMember shg:CreditCardReceivablesMember 2021-12-31 0001263043 country:VN shg:DueFromBanksAndLoansAtAmortizedCostMember shg:CreditCardReceivablesMember 2021-12-31 0001263043 shg:DueFromBanksAndLoansAtAmortizedCostMember shg:CreditCardReceivablesMember 2021-12-31 0001263043 country:GB shg:DueFromBanksAndLoansAtAmortizedCostMember 2021-12-31 0001263043 country:JP shg:DueFromBanksAndLoansAtAmortizedCostMember 2021-12-31 0001263043 shg:DueFromBanksAndLoansAtAmortizedCostMember 2021-12-31 0001263043 shg:DepositsAndLoansAtFVTPLMember country:KR 2021-12-31 0001263043 shg:DepositsAndLoansAtFVTPLMember shg:OthersCountryMember 2021-12-31 0001263043 country:KR shg:SecuritiesAtFVTPLMember 2021-12-31 0001263043 country:GB shg:SecuritiesAtFVTPLMember 2021-12-31 0001263043 shg:SecuritiesAtFVTPLMember country:CN 2021-12-31 0001263043 country:KR ifrs-full:FinancialAssetsAtFairValueThroughOtherComprehensiveIncomeCategoryMember 2021-12-31 0001263043 country:JP ifrs-full:FinancialAssetsAtFairValueThroughOtherComprehensiveIncomeCategoryMember 2021-12-31 0001263043 ifrs-full:FinancialAssetsAtFairValueThroughOtherComprehensiveIncomeCategoryMember country:VN 2021-12-31 0001263043 country:VN ifrs-full:FinancialAssetsAtAmortisedCostMember 2021-12-31 0001263043 country:CN ifrs-full:FinancialAssetsAtAmortisedCostMember 2021-12-31 0001263043 shg:OthersCountryMember ifrs-full:FinancialAssetsAtAmortisedCostMember 2021-12-31 0001263043 country:JP 2021-12-31 0001263043 shg:OthersCountryMember 2021-12-31 0001263043 shg:FinancialGuaranteeContractMember country:VN 2021-12-31 0001263043 shg:FinancialGuaranteeContractMember 2021-12-31 0001263043 country:GB shg:LoanCommitmentsAndOtherLiabilitiesRelatedToCreditMember 2021-12-31 0001263043 shg:LoanCommitmentsAndOtherLiabilitiesRelatedToCreditMember country:VN 2021-12-31 0001263043 shg:LoanCommitmentsAndOtherLiabilitiesRelatedToCreditMember 2021-12-31 0001263043 shg:OffBalanceAccountsMember country:GB 2021-12-31 0001263043 country:KR shg:DepositsAndLoansAtFVTPLMember ifrs-full:CorporateLoansMember 2021-12-31 0001263043 shg:OthersCountryMember shg:DueFromBanksAndLoansAtAmortizedCostMember shg:CreditCardReceivablesMember 2021-12-31 0001263043 country:DE shg:DueFromBanksAndLoansAtAmortizedCostMember 2021-12-31 0001263043 country:GB shg:DueFromBanksAndLoansAtAmortizedCostMember shg:ShinhanBankMember 2021-12-31 0001263043 ifrs-full:CorporateLoansMember shg:DueFromBanksAndLoansAtAmortizedCostMember country:KR 2021-12-31 0001263043 country:KR 2021-12-31 0001263043 country:JP shg:DepositsAndLoansAtFVTPLMember ifrs-full:CorporateLoansMember 2021-12-31 0001263043 shg:DueFromBanksAndLoansAtAmortizedCostMember country:CN 2021-12-31 0001263043 country:DE shg:DueFromBanksAndLoansAtAmortizedCostMember shg:ShinhanBankMember 2021-12-31 0001263043 country:US shg:DueFromBanksAndLoansAtAmortizedCostMember shg:CreditCardReceivablesMember 2021-12-31 0001263043 country:KR shg:DueFromBanksAndLoansAtAmortizedCostMember ifrs-full:ConsumerLoansMember 2021-12-31 0001263043 country:US shg:DepositsAndLoansAtFVTPLMember 2021-12-31 0001263043 country:KR shg:DueFromBanksAndLoansAtAmortizedCostMember 2021-12-31 0001263043 shg:OthersCountryMember shg:DueFromBanksAndLoansAtAmortizedCostMember ifrs-full:CorporateLoansMember 2021-12-31 0001263043 country:DE shg:DueFromBanksAndLoansAtAmortizedCostMember ifrs-full:ConsumerLoansMember 2021-12-31 0001263043 shg:ShinhanBankMember shg:DueFromBanksAndLoansAtAmortizedCostMember shg:OthersCountryMember 2021-12-31 0001263043 country:CN 2021-12-31 0001263043 ifrs-full:FinancialAssetsAtFairValueThroughOtherComprehensiveIncomeCategoryMember 2021-12-31 0001263043 shg:OthersCountryMember shg:SecuritiesAtFVTPLMember 2021-12-31 0001263043 shg:DepositsAndLoansAtFVTPLMember ifrs-full:CorporateLoansMember 2021-12-31 0001263043 country:US shg:DepositsAndLoansAtFVTPLMember shg:ShinhanBankMember 2021-12-31 0001263043 country:DE shg:DueFromBanksAndLoansAtAmortizedCostMember shg:CreditCardReceivablesMember 2021-12-31 0001263043 country:KR shg:DueFromBanksAndLoansAtAmortizedCostMember shg:ShinhanBankMember 2021-12-31 0001263043 country:US 2021-12-31 0001263043 ifrs-full:GovernmentMember country:VN shg:DueFromBanksAndLoansAtAmortizedCostMember 2021-12-31 0001263043 ifrs-full:GovernmentMember shg:DueFromBanksAndLoansAtAmortizedCostMember 2021-12-31 0001263043 shg:FinancialGuaranteeContractMember country:GB 2021-12-31 0001263043 shg:LoanCommitmentsAndOtherLiabilitiesRelatedToCreditMember country:US 2021-12-31 0001263043 shg:LoanCommitmentsAndOtherLiabilitiesRelatedToCreditMember country:DE 2021-12-31 0001263043 shg:OthersCountryMember shg:LoanCommitmentsAndOtherLiabilitiesRelatedToCreditMember 2021-12-31 0001263043 shg:OffBalanceAccountsMember country:US 2021-12-31 0001263043 shg:OffBalanceAccountsMember country:DE 2021-12-31 0001263043 shg:OffBalanceAccountsMember shg:OthersCountryMember 2021-12-31 0001263043 country:CN ifrs-full:FinancialAssetsAtFairValueThroughOtherComprehensiveIncomeCategoryMember 2021-12-31 0001263043 country:VN shg:SecuritiesAtFVTPLMember 2021-12-31 0001263043 country:VN shg:DueFromBanksAndLoansAtAmortizedCostMember 2021-12-31 0001263043 ifrs-full:CorporateLoansMember shg:DueFromBanksAndLoansAtAmortizedCostMember country:GB 2021-12-31 0001263043 shg:ShinhanBankMember shg:DueFromBanksAndLoansAtAmortizedCostMember country:US 2021-12-31 0001263043 country:GB 2021-12-31 0001263043 country:US ifrs-full:FinancialAssetsAtFairValueThroughOtherComprehensiveIncomeCategoryMember 2021-12-31 0001263043 shg:OthersCountryMember shg:DueFromBanksAndLoansAtAmortizedCostMember 2021-12-31 0001263043 ifrs-full:CorporateLoansMember shg:DueFromBanksAndLoansAtAmortizedCostMember country:DE 2021-12-31 0001263043 country:JP shg:DueFromBanksAndLoansAtAmortizedCostMember shg:ShinhanBankMember 2021-12-31 0001263043 country:KR shg:DueFromBanksAndLoansAtAmortizedCostMember shg:CreditCardReceivablesMember 2021-12-31 0001263043 ifrs-full:FinancialAssetsAtAmortisedCostMember 2021-12-31 0001263043 country:DE ifrs-full:FinancialAssetsAtFairValueThroughOtherComprehensiveIncomeCategoryMember 2021-12-31 0001263043 country:US shg:SecuritiesAtFVTPLMember 2021-12-31 0001263043 country:GB shg:DueFromBanksAndLoansAtAmortizedCostMember shg:CreditCardReceivablesMember 2021-12-31 0001263043 country:VN shg:DueFromBanksAndLoansAtAmortizedCostMember ifrs-full:CorporateLoansMember 2021-12-31 0001263043 country:GB shg:DueFromBanksAndLoansAtAmortizedCostMember ifrs-full:ConsumerLoansMember 2021-12-31 0001263043 country:JP ifrs-full:FinancialAssetsAtAmortisedCostMember 2021-12-31 0001263043 country:GB ifrs-full:FinancialAssetsAtFairValueThroughOtherComprehensiveIncomeCategoryMember 2021-12-31 0001263043 shg:DepositsAndLoansAtFVTPLMember 2021-12-31 0001263043 shg:DueFromBanksAndLoansAtAmortizedCostMember ifrs-full:CorporateLoansMember 2021-12-31 0001263043 country:CN shg:DueFromBanksAndLoansAtAmortizedCostMember ifrs-full:ConsumerLoansMember 2021-12-31 0001263043 country:DE 2021-12-31 0001263043 ifrs-full:GovernmentMember country:DE shg:DueFromBanksAndLoansAtAmortizedCostMember 2021-12-31 0001263043 ifrs-full:GovernmentMember shg:OthersCountryMember shg:DueFromBanksAndLoansAtAmortizedCostMember 2021-12-31 0001263043 shg:FinancialGuaranteeContractMember country:US 2021-12-31 0001263043 shg:FinancialGuaranteeContractMember country:DE 2021-12-31 0001263043 shg:FinancialGuaranteeContractMember shg:OthersCountryMember 2021-12-31 0001263043 shg:OffBalanceAccountsMember country:KR 2021-12-31 0001263043 shg:OffBalanceAccountsMember country:JP 2021-12-31 0001263043 country:CN shg:OffBalanceAccountsMember 2021-12-31 0001263043 shg:SecuritiesAtFVTPLMember 2021-12-31 0001263043 country:US shg:DepositsAndLoansAtFVTPLMember ifrs-full:CorporateLoansMember 2021-12-31 0001263043 shg:DueFromBanksAndLoansAtAmortizedCostMember ifrs-full:ConsumerLoansMember 2021-12-31 0001263043 country:US shg:DueFromBanksAndLoansAtAmortizedCostMember ifrs-full:CorporateLoansMember 2021-12-31 0001263043 country:VN 2021-12-31 0001263043 country:US ifrs-full:FinancialAssetsAtAmortisedCostMember 2021-12-31 0001263043 country:JP shg:SecuritiesAtFVTPLMember 2021-12-31 0001263043 country:JP shg:DueFromBanksAndLoansAtAmortizedCostMember ifrs-full:CorporateLoansMember 2021-12-31 0001263043 country:US shg:DueFromBanksAndLoansAtAmortizedCostMember ifrs-full:ConsumerLoansMember 2021-12-31 0001263043 ifrs-full:FinancialAssetsAtFairValueThroughOtherComprehensiveIncomeCategoryMember shg:OthersCountryMember 2021-12-31 0001263043 country:DE shg:SecuritiesAtFVTPLMember 2021-12-31 0001263043 country:JP shg:DepositsAndLoansAtFVTPLMember 2021-12-31 0001263043 shg:DepositsAndLoansAtFVTPLMember ifrs-full:CorporateLoansMember shg:OthersCountryMember 2021-12-31 0001263043 country:JP shg:DueFromBanksAndLoansAtAmortizedCostMember ifrs-full:ConsumerLoansMember 2021-12-31 0001263043 shg:ShinhanBankMember shg:DueFromBanksAndLoansAtAmortizedCostMember country:CN 2021-12-31 0001263043 ifrs-full:FinancialAssetsAtAmortisedCostMember country:KR 2021-12-31 0001263043 shg:DepositsAndLoansAtFVTPLMember shg:ShinhanBankMember 2021-12-31 0001263043 country:CN shg:DueFromBanksAndLoansAtAmortizedCostMember shg:CreditCardReceivablesMember 2021-12-31 0001263043 ifrs-full:ConsumerLoansMember shg:DueFromBanksAndLoansAtAmortizedCostMember country:VN 2021-12-31 0001263043 country:US shg:DueFromBanksAndLoansAtAmortizedCostMember 2021-12-31 0001263043 ifrs-full:GovernmentMember country:US shg:DueFromBanksAndLoansAtAmortizedCostMember 2021-12-31 0001263043 shg:FinancialGuaranteeContractMember country:KR 2021-12-31 0001263043 shg:FinancialGuaranteeContractMember country:JP 2021-12-31 0001263043 shg:FinancialGuaranteeContractMember country:CN 2021-12-31 0001263043 shg:LoanCommitmentsAndOtherLiabilitiesRelatedToCreditMember country:KR 2021-12-31 0001263043 shg:LoanCommitmentsAndOtherLiabilitiesRelatedToCreditMember country:JP 2021-12-31 0001263043 shg:LoanCommitmentsAndOtherLiabilitiesRelatedToCreditMember country:CN 2021-12-31 0001263043 shg:OffBalanceAccountsMember country:VN 2021-12-31 0001263043 shg:OffBalanceAccountsMember 2021-12-31 0001263043 shg:DueFromBanksAndLoansAtAmortizedCostMember ifrs-full:ConsumerLoansMember shg:RetailCustomersMember 2021-12-31 0001263043 ifrs-full:GovernmentMember shg:OthersMember shg:DueFromBanksAndLoansAtAmortizedCostMember 2021-12-31 0001263043 shg:DueFromBanksAndLoansAtAmortizedCostMember shg:RealEstateAndServiceMember ifrs-full:CorporateLoansMember 2021-12-31 0001263043 shg:CreditCardReceivablesMember shg:FinanceAndInsuranceMember shg:DueFromBanksAndLoansAtAmortizedCostMember 2021-12-31 0001263043 shg:CreditCardReceivablesMember shg:ConstructionServiceMember shg:DueFromBanksAndLoansAtAmortizedCostMember 2021-12-31 0001263043 shg:ConstructionServiceMember shg:DueFromBanksAndLoansAtAmortizedCostMember 2021-12-31 0001263043 shg:LodgingAndRestaurantMember shg:DueFromBanksAndLoansAtAmortizedCostMember 2021-12-31 0001263043 shg:ManufacturingMember shg:DepositsAndLoansAtFVTPLMember 2021-12-31 0001263043 shg:RealEstateAndServiceMember ifrs-full:FinancialAssetsAtFairValueThroughOtherComprehensiveIncomeCategoryMember 2021-12-31 0001263043 shg:FinanceAndInsuranceMember 2021-12-31 0001263043 shg:ConstructionServiceMember 2021-12-31 0001263043 shg:ManufacturingMember shg:FinancialGuaranteeContractMember 2021-12-31 0001263043 shg:FinancialGuaranteeContractMember shg:ConstructionServiceMember 2021-12-31 0001263043 shg:FinancialGuaranteeContractMember shg:RetailCustomersMember 2021-12-31 0001263043 shg:LoanCommitmentsAndOtherLiabilitiesRelatedToCreditMember shg:OthersMember 2021-12-31 0001263043 shg:OffBalanceAccountsMember shg:FinanceAndInsuranceMember 2021-12-31 0001263043 shg:OffBalanceAccountsMember shg:RealEstateAndServiceMember 2021-12-31 0001263043 shg:OthersMember shg:OffBalanceAccountsMember 2021-12-31 0001263043 shg:RetailCustomersMember 2021-12-31 0001263043 shg:OthersMember ifrs-full:FinancialAssetsAtFairValueThroughOtherComprehensiveIncomeCategoryMember 2021-12-31 0001263043 shg:ShinhanBankMember shg:FinanceAndInsuranceMember shg:DepositsAndLoansAtFVTPLMember 2021-12-31 0001263043 shg:ShinhanBankMember shg:OthersMember shg:DueFromBanksAndLoansAtAmortizedCostMember 2021-12-31 0001263043 ifrs-full:CorporateLoansMember shg:ConstructionServiceMember shg:DepositsAndLoansAtFVTPLMember 2021-12-31 0001263043 shg:RetailCustomersMember shg:DueFromBanksAndLoansAtAmortizedCostMember 2021-12-31 0001263043 shg:CreditCardReceivablesMember shg:RetailAndWholesaleMember shg:DueFromBanksAndLoansAtAmortizedCostMember 2021-12-31 0001263043 shg:ConstructionServiceMember ifrs-full:FinancialAssetsAtAmortisedCostMember 2021-12-31 0001263043 shg:LodgingAndRestaurantMember ifrs-full:FinancialAssetsAtFairValueThroughOtherComprehensiveIncomeCategoryMember 2021-12-31 0001263043 shg:RealEstateAndServiceMember shg:DepositsAndLoansAtFVTPLMember 2021-12-31 0001263043 shg:FinancialGuaranteeContractMember shg:LodgingAndRestaurantMember 2021-12-31 0001263043 shg:RetailAndWholesaleMember shg:LoanCommitmentsAndOtherLiabilitiesRelatedToCreditMember 2021-12-31 0001263043 shg:LodgingAndRestaurantMember shg:LoanCommitmentsAndOtherLiabilitiesRelatedToCreditMember 2021-12-31 0001263043 shg:OffBalanceAccountsMember shg:RetailCustomersMember 2021-12-31 0001263043 ifrs-full:GovernmentMember shg:RealEstateAndServiceMember shg:DueFromBanksAndLoansAtAmortizedCostMember 2021-12-31 0001263043 shg:DueFromBanksAndLoansAtAmortizedCostMember shg:RealEstateAndServiceMember shg:CreditCardReceivablesMember 2021-12-31 0001263043 shg:RealEstateAndServiceMember shg:DueFromBanksAndLoansAtAmortizedCostMember 2021-12-31 0001263043 shg:ConstructionServiceMember shg:DepositsAndLoansAtFVTPLMember 2021-12-31 0001263043 ifrs-full:FinancialAssetsAtAmortisedCostMember shg:OthersMember 2021-12-31 0001263043 shg:ManufacturingMember 2021-12-31 0001263043 ifrs-full:CorporateLoansMember shg:RealEstateAndServiceMember shg:DepositsAndLoansAtFVTPLMember 2021-12-31 0001263043 shg:DueFromBanksAndLoansAtAmortizedCostMember shg:ManufacturingMember 2021-12-31 0001263043 shg:CreditCardReceivablesMember shg:ManufacturingMember shg:DueFromBanksAndLoansAtAmortizedCostMember 2021-12-31 0001263043 shg:LodgingAndRestaurantMember 2021-12-31 0001263043 shg:DepositsAndLoansAtFVTPLMember shg:OthersMember 2021-12-31 0001263043 shg:CreditCardReceivablesMember shg:LodgingAndRestaurantMember shg:DueFromBanksAndLoansAtAmortizedCostMember 2021-12-31 0001263043 ifrs-full:CorporateLoansMember shg:ConstructionServiceMember shg:DueFromBanksAndLoansAtAmortizedCostMember 2021-12-31 0001263043 shg:OthersMember 2021-12-31 0001263043 shg:RetailAndWholesaleMember shg:DueFromBanksAndLoansAtAmortizedCostMember 2021-12-31 0001263043 ifrs-full:CorporateLoansMember shg:LodgingAndRestaurantMember shg:DueFromBanksAndLoansAtAmortizedCostMember 2021-12-31 0001263043 ifrs-full:GovernmentMember shg:FinanceAndInsuranceMember shg:DueFromBanksAndLoansAtAmortizedCostMember 2021-12-31 0001263043 shg:FinancialGuaranteeContractMember shg:RetailAndWholesaleMember 2021-12-31 0001263043 shg:LoanCommitmentsAndOtherLiabilitiesRelatedToCreditMember shg:ManufacturingMember 2021-12-31 0001263043 shg:ConstructionServiceMember shg:LoanCommitmentsAndOtherLiabilitiesRelatedToCreditMember 2021-12-31 0001263043 shg:LoanCommitmentsAndOtherLiabilitiesRelatedToCreditMember shg:RetailCustomersMember 2021-12-31 0001263043 shg:ManufacturingMember shg:OffBalanceAccountsMember 2021-12-31 0001263043 shg:OffBalanceAccountsMember shg:ConstructionServiceMember 2021-12-31 0001263043 shg:FinanceAndInsuranceMember shg:DueFromBanksAndLoansAtAmortizedCostMember 2021-12-31 0001263043 ifrs-full:CorporateLoansMember shg:RetailAndWholesaleMember shg:DepositsAndLoansAtFVTPLMember 2021-12-31 0001263043 shg:RetailAndWholesaleMember 2021-12-31 0001263043 ifrs-full:FinancialAssetsAtFairValueThroughOtherComprehensiveIncomeCategoryMember shg:ManufacturingMember 2021-12-31 0001263043 shg:DepositsAndLoansAtFVTPLMember shg:ManufacturingMember ifrs-full:CorporateLoansMember 2021-12-31 0001263043 ifrs-full:CorporateLoansMember shg:ManufacturingMember shg:DueFromBanksAndLoansAtAmortizedCostMember 2021-12-31 0001263043 shg:RealEstateAndServiceMember 2021-12-31 0001263043 ifrs-full:FinancialAssetsAtAmortisedCostMember shg:FinanceAndInsuranceMember 2021-12-31 0001263043 ifrs-full:FinancialAssetsAtFairValueThroughOtherComprehensiveIncomeCategoryMember shg:RetailAndWholesaleMember 2021-12-31 0001263043 shg:FinanceAndInsuranceMember shg:DepositsAndLoansAtFVTPLMember 2021-12-31 0001263043 ifrs-full:CorporateLoansMember shg:RetailAndWholesaleMember shg:DueFromBanksAndLoansAtAmortizedCostMember 2021-12-31 0001263043 shg:FinanceAndInsuranceMember shg:FinancialGuaranteeContractMember 2021-12-31 0001263043 shg:FinancialGuaranteeContractMember shg:RealEstateAndServiceMember 2021-12-31 0001263043 shg:FinancialGuaranteeContractMember shg:OthersMember 2021-12-31 0001263043 shg:FinanceAndInsuranceMember shg:LoanCommitmentsAndOtherLiabilitiesRelatedToCreditMember 2021-12-31 0001263043 shg:LoanCommitmentsAndOtherLiabilitiesRelatedToCreditMember shg:RealEstateAndServiceMember 2021-12-31 0001263043 shg:RetailAndWholesaleMember shg:OffBalanceAccountsMember 2021-12-31 0001263043 shg:OffBalanceAccountsMember shg:LodgingAndRestaurantMember 2021-12-31 0001263043 shg:FinanceAndInsuranceMember shg:ShinhanBankMember shg:DueFromBanksAndLoansAtAmortizedCostMember 2021-12-31 0001263043 ifrs-full:CorporateLoansMember shg:FinanceAndInsuranceMember shg:DueFromBanksAndLoansAtAmortizedCostMember 2021-12-31 0001263043 shg:CreditCardReceivablesMember shg:OthersMember shg:DueFromBanksAndLoansAtAmortizedCostMember 2021-12-31 0001263043 shg:OthersMember shg:DueFromBanksAndLoansAtAmortizedCostMember 2021-12-31 0001263043 ifrs-full:CorporateLoansMember shg:OthersMember shg:DepositsAndLoansAtFVTPLMember 2021-12-31 0001263043 shg:FinanceAndInsuranceMember ifrs-full:FinancialAssetsAtFairValueThroughOtherComprehensiveIncomeCategoryMember 2021-12-31 0001263043 shg:RetailAndWholesaleMember shg:DepositsAndLoansAtFVTPLMember 2021-12-31 0001263043 ifrs-full:CorporateLoansMember shg:FinanceAndInsuranceMember shg:DepositsAndLoansAtFVTPLMember 2021-12-31 0001263043 shg:CreditCardReceivablesMember shg:RetailCustomersMember shg:DueFromBanksAndLoansAtAmortizedCostMember 2021-12-31 0001263043 ifrs-full:CorporateLoansMember shg:OthersMember shg:DueFromBanksAndLoansAtAmortizedCostMember 2021-12-31 0001263043 ifrs-full:FinancialAssetsAtAmortisedCostMember shg:RealEstateAndServiceMember 2021-12-31 0001263043 shg:ConstructionServiceMember ifrs-full:FinancialAssetsAtFairValueThroughOtherComprehensiveIncomeCategoryMember 2021-12-31 0001263043 shg:OthersMember shg:SecuritiesAtFVTPLMember 2021-12-31 0001263043 shg:LodgingAndRestaurantMember shg:SecuritiesAtFVTPLMember 2021-12-31 0001263043 shg:ConstructionServiceMember shg:SecuritiesAtFVTPLMember 2021-12-31 0001263043 shg:RealEstateAndServiceMember shg:SecuritiesAtFVTPLMember 2021-12-31 0001263043 shg:RetailAndWholesaleMember shg:SecuritiesAtFVTPLMember 2021-12-31 0001263043 shg:ManufacturingMember shg:SecuritiesAtFVTPLMember 2021-12-31 0001263043 shg:FinanceAndInsuranceMember shg:SecuritiesAtFVTPLMember 2021-12-31 0001263043 shg:LodgingAndRestaurantMember shg:DepositsAndLoansAtFVTPLMember 2021-12-31 0001263043 shg:LodgingAndRestaurantMember shg:DepositsAndLoansAtFVTPLMember ifrs-full:CorporateLoansMember 2021-12-31 0001263043 ifrs-full:WeightedAverageMember shg:BankingMember 2021-12-31 0001263043 ifrs-full:RiskDiversificationEffectMember ifrs-full:WeightedAverageMember shg:BankingMember 2021-12-31 0001263043 ifrs-full:CommodityPriceRiskMember ifrs-full:TopOfRangeMember shg:BankingMember 2021-12-31 0001263043 shg:OptionVolatilityMember shg:DateOfEndOfReportingPeriodMember shg:BankingMember 2021-12-31 0001263043 ifrs-full:CurrencyRiskMember shg:DateOfEndOfReportingPeriodMember shg:BankingMember 2021-12-31 0001263043 ifrs-full:CurrencyRiskMember ifrs-full:BottomOfRangeMember shg:BankingMember 2021-12-31 0001263043 shg:BankingMember ifrs-full:WeightedAverageMember ifrs-full:CurrencyRiskMember 2021-12-31 0001263043 shg:BankingMember ifrs-full:TopOfRangeMember ifrs-full:RiskDiversificationEffectMember 2021-12-31 0001263043 ifrs-full:CommodityPriceRiskMember shg:DateOfEndOfReportingPeriodMember shg:BankingMember 2021-12-31 0001263043 shg:OptionVolatilityMember ifrs-full:BottomOfRangeMember shg:BankingMember 2021-12-31 0001263043 ifrs-full:RiskDiversificationEffectMember shg:DateOfEndOfReportingPeriodMember shg:BankingMember 2021-12-31 0001263043 shg:BankingMember ifrs-full:WeightedAverageMember shg:OptionVolatilityMember 2021-12-31 0001263043 shg:DateOfEndOfReportingPeriodMember shg:BankingMember 2021-12-31 0001263043 ifrs-full:CurrencyRiskMember ifrs-full:TopOfRangeMember shg:BankingMember 2021-12-31 0001263043 ifrs-full:InterestRateRiskMember ifrs-full:TopOfRangeMember shg:BankingMember 2021-12-31 0001263043 ifrs-full:TopOfRangeMember shg:BankingMember 2021-12-31 0001263043 ifrs-full:InterestRateRiskMember ifrs-full:BottomOfRangeMember shg:BankingMember 2021-12-31 0001263043 ifrs-full:EquityPriceRiskMember ifrs-full:WeightedAverageMember shg:BankingMember 2021-12-31 0001263043 shg:OptionVolatilityMember ifrs-full:TopOfRangeMember shg:BankingMember 2021-12-31 0001263043 ifrs-full:InterestRateRiskMember shg:DateOfEndOfReportingPeriodMember shg:BankingMember 2021-12-31 0001263043 ifrs-full:RiskDiversificationEffectMember ifrs-full:BottomOfRangeMember shg:BankingMember 2021-12-31 0001263043 ifrs-full:EquityPriceRiskMember shg:DateOfEndOfReportingPeriodMember shg:BankingMember 2021-12-31 0001263043 ifrs-full:EquityPriceRiskMember ifrs-full:BottomOfRangeMember shg:BankingMember 2021-12-31 0001263043 ifrs-full:BottomOfRangeMember shg:BankingMember 2021-12-31 0001263043 ifrs-full:InterestRateRiskMember ifrs-full:WeightedAverageMember shg:BankingMember 2021-12-31 0001263043 ifrs-full:CommodityPriceRiskMember ifrs-full:WeightedAverageMember shg:BankingMember 2021-12-31 0001263043 ifrs-full:EquityPriceRiskMember ifrs-full:TopOfRangeMember shg:BankingMember 2021-12-31 0001263043 shg:LifeInsuranceMember ifrs-full:TopOfRangeMember shg:OptionVolatilityMember 2021-12-31 0001263043 ifrs-full:TopOfRangeMember shg:LifeInsuranceMember 2021-12-31 0001263043 ifrs-full:CurrencyRiskMember ifrs-full:WeightedAverageMember shg:LifeInsuranceMember 2021-12-31 0001263043 shg:LifeInsuranceMember ifrs-full:WeightedAverageMember shg:OptionVolatilityMember 2021-12-31 0001263043 shg:LifeInsuranceMember ifrs-full:WeightedAverageMember ifrs-full:InterestRateRiskMember 2021-12-31 0001263043 shg:LifeInsuranceMember ifrs-full:TopOfRangeMember ifrs-full:InterestRateRiskMember 2021-12-31 0001263043 shg:LifeInsuranceMember shg:DateOfEndOfReportingPeriodMember ifrs-full:CurrencyRiskMember 2021-12-31 0001263043 shg:LifeInsuranceMember ifrs-full:WeightedAverageMember ifrs-full:EquityPriceRiskMember 2021-12-31 0001263043 ifrs-full:EquityPriceRiskMember ifrs-full:TopOfRangeMember shg:LifeInsuranceMember 2021-12-31 0001263043 shg:LifeInsuranceMember shg:DateOfEndOfReportingPeriodMember shg:OptionVolatilityMember 2021-12-31 0001263043 shg:LifeInsuranceMember ifrs-full:WeightedAverageMember 2021-12-31 0001263043 shg:LifeInsuranceMember shg:DateOfEndOfReportingPeriodMember ifrs-full:EquityPriceRiskMember 2021-12-31 0001263043 shg:LifeInsuranceMember ifrs-full:TopOfRangeMember ifrs-full:CurrencyRiskMember 2021-12-31 0001263043 shg:LifeInsuranceMember ifrs-full:BottomOfRangeMember 2021-12-31 0001263043 ifrs-full:InterestRateRiskMember shg:DateOfEndOfReportingPeriodMember shg:LifeInsuranceMember 2021-12-31 0001263043 shg:LifeInsuranceMember shg:DateOfEndOfReportingPeriodMember 2021-12-31 0001263043 shg:OptionVolatilityMember ifrs-full:BottomOfRangeMember shg:LifeInsuranceMember 2021-12-31 0001263043 ifrs-full:CurrencyRiskMember ifrs-full:BottomOfRangeMember shg:LifeInsuranceMember 2021-12-31 0001263043 shg:LifeInsuranceMember ifrs-full:BottomOfRangeMember ifrs-full:EquityPriceRiskMember 2021-12-31 0001263043 shg:LifeInsuranceMember ifrs-full:BottomOfRangeMember ifrs-full:InterestRateRiskMember 2021-12-31 0001263043 ifrs-full:TopOfRangeMember ifrs-full:RiskDiversificationEffectMember shg:SecuritiesMember 2021-12-31 0001263043 ifrs-full:EquityPriceRiskMember ifrs-full:WeightedAverageMember shg:SecuritiesMember 2021-12-31 0001263043 ifrs-full:RiskDiversificationEffectMember shg:DateOfEndOfReportingPeriodMember shg:SecuritiesMember 2021-12-31 0001263043 shg:SecuritiesMember ifrs-full:BottomOfRangeMember ifrs-full:InterestRateRiskMember 2021-12-31 0001263043 ifrs-full:WeightedAverageMember shg:SecuritiesMember 2021-12-31 0001263043 ifrs-full:CurrencyRiskMember ifrs-full:WeightedAverageMember shg:SecuritiesMember 2021-12-31 0001263043 ifrs-full:BottomOfRangeMember ifrs-full:RiskDiversificationEffectMember shg:SecuritiesMember 2021-12-31 0001263043 ifrs-full:CurrencyRiskMember ifrs-full:TopOfRangeMember shg:SecuritiesMember 2021-12-31 0001263043 shg:SecuritiesMember ifrs-full:TopOfRangeMember 2021-12-31 0001263043 ifrs-full:EquityPriceRiskMember ifrs-full:TopOfRangeMember shg:SecuritiesMember 2021-12-31 0001263043 shg:SecuritiesMember shg:DateOfEndOfReportingPeriodMember shg:OptionVolatilityMember 2021-12-31 0001263043 ifrs-full:WeightedAverageMember ifrs-full:RiskDiversificationEffectMember shg:SecuritiesMember 2021-12-31 0001263043 shg:OptionVolatilityMember ifrs-full:WeightedAverageMember shg:SecuritiesMember 2021-12-31 0001263043 ifrs-full:InterestRateRiskMember shg:DateOfEndOfReportingPeriodMember shg:SecuritiesMember 2021-12-31 0001263043 ifrs-full:EquityPriceRiskMember shg:DateOfEndOfReportingPeriodMember shg:SecuritiesMember 2021-12-31 0001263043 ifrs-full:BottomOfRangeMember shg:SecuritiesMember 2021-12-31 0001263043 shg:SecuritiesMember shg:DateOfEndOfReportingPeriodMember 2021-12-31 0001263043 shg:SecuritiesMember shg:DateOfEndOfReportingPeriodMember ifrs-full:CurrencyRiskMember 2021-12-31 0001263043 shg:OptionVolatilityMember ifrs-full:BottomOfRangeMember shg:SecuritiesMember 2021-12-31 0001263043 shg:SecuritiesMember ifrs-full:TopOfRangeMember shg:OptionVolatilityMember 2021-12-31 0001263043 ifrs-full:CurrencyRiskMember ifrs-full:BottomOfRangeMember shg:SecuritiesMember 2021-12-31 0001263043 ifrs-full:EquityPriceRiskMember ifrs-full:BottomOfRangeMember shg:SecuritiesMember 2021-12-31 0001263043 ifrs-full:InterestRateRiskMember ifrs-full:TopOfRangeMember shg:SecuritiesMember 2021-12-31 0001263043 ifrs-full:InterestRateRiskMember ifrs-full:WeightedAverageMember shg:SecuritiesMember 2021-12-31 0001263043 shg:DerivativesAndOtherFinancialInstrumentsMember 2021-12-31 0001263043 shg:BondsSoldUnderRepurchaseAgreementsMember 2021-12-31 0001263043 shg:SecuritiesLoanedMember 2021-12-31 0001263043 shg:ReceivablesFromDisposalOfSecuritiesMember 2021-12-31 0001263043 ifrs-full:DerivativesMember 2021-12-31 0001263043 shg:DomesticExchangeSettlementDebitMember 2021-12-31 0001263043 shg:InsuranceReceivablesMember 2021-12-31 0001263043 shg:BondsSoldUnderRepurchaseAgreementsMember 2021-12-31 0001263043 shg:InsurancePayablesMember 2021-12-31 0001263043 ifrs-full:DerivativesMember 2021-12-31 0001263043 shg:SecuritiesBorrowedMember 2021-12-31 0001263043 shg:DerivativesAndOtherFinancialInstrumentsMember 2021-12-31 0001263043 shg:DomesticExchangeSettlementPendingMember 2021-12-31 0001263043 shg:PayableFromPurchaseOfSecuritiesMember 2021-12-31 0001263043 currency:USD shg:CashAndDueFromBanksAtAmortizedCostMember 2021-12-31 0001263043 shg:OtherCurrencyMember shg:CashAndDueFromBanksAtAmortizedCostMember 2021-12-31 0001263043 currency:CNY ifrs-full:FinancialAssetsAtFairValueThroughOtherComprehensiveIncomeCategoryMember 2021-12-31 0001263043 shg:OtherFinancialAssetsMember currency:EUR 2021-12-31 0001263043 currency:USD shg:DueFromBanksAtFVTPLMember 2021-12-31 0001263043 currency:EUR ifrs-full:FinancialLiabilitiesMember 2021-12-31 0001263043 shg:BorrowingsMember currency:EUR 2021-12-31 0001263043 currency:EUR shg:DerivativeFinancialInstrumentsAssetsMember 2021-12-31 0001263043 currency:JPY shg:OtherFinancialAssetsMember 2021-12-31 0001263043 shg:OtherCurrencyMember shg:NetAssetsNetDomesticAndForeignCurrencyExposureMember 2021-12-31 0001263043 currency:JPY shg:LoansAtAmortizedCostMember 2021-12-31 0001263043 currency:USD shg:OtherFinancialLiabilitiesMember 2021-12-31 0001263043 currency:JPY shg:BorrowingsMember 2021-12-31 0001263043 currency:EUR shg:SecuritiesAtFVTPLMember 2021-12-31 0001263043 currency:EUR shg:DepositsMember 2021-12-31 0001263043 shg:BorrowingsMember currency:USD 2021-12-31 0001263043 currency:JPY shg:OtherFinancialLiabilitiesMember 2021-12-31 0001263043 currency:JPY shg:OffBalanceDerivativeExposureMember 2021-12-31 0001263043 shg:OtherFinancialAssetsMember 2021-12-31 0001263043 shg:CashAndDueFromBanksAtAmortizedCostMember currency:JPY 2021-12-31 0001263043 shg:BorrowingsMember currency:CNY 2021-12-31 0001263043 currency:JPY ifrs-full:FinancialAssetsAtFairValueThroughOtherComprehensiveIncomeCategoryMember 2021-12-31 0001263043 currency:USD shg:OtherFinancialAssetsMember 2021-12-31 0001263043 shg:OtherCurrencyMember shg:DepositsMember 2021-12-31 0001263043 shg:OffBalanceDerivativeExposureMember currency:CNY 2021-12-31 0001263043 currency:JPY ifrs-full:FinancialLiabilitiesMember 2021-12-31 0001263043 shg:OtherCurrencyMember ifrs-full:FinancialAssetsAtAmortisedCostCategoryMember 2021-12-31 0001263043 currency:CNY shg:DepositsMember 2021-12-31 0001263043 shg:FinancialAssetsClassMember 2021-12-31 0001263043 currency:USD shg:DebtSecuritiesIssuedMember 2021-12-31 0001263043 shg:OtherCurrencyMember shg:SecuritiesAtFVTPLMember 2021-12-31 0001263043 currency:CNY ifrs-full:FinancialAssetsAtAmortisedCostCategoryMember 2021-12-31 0001263043 currency:EUR shg:FinancialAssetsClassMember 2021-12-31 0001263043 shg:OtherCurrencyMember shg:NetForeignCurrencyExposureMember 2021-12-31 0001263043 currency:JPY shg:NetForeignCurrencyExposureMember 2021-12-31 0001263043 shg:LoansAtFvtplMember 2021-12-31 0001263043 currency:USD shg:LoansAtFvtplMember 2021-12-31 0001263043 shg:NetForeignCurrencyExposureMember 2021-12-31 0001263043 currency:EUR shg:NetForeignCurrencyExposureMember 2021-12-31 0001263043 shg:NetAssetsNetDomesticAndForeignCurrencyExposureMember 2021-12-31 0001263043 shg:NetAssetsNetDomesticAndForeignCurrencyExposureMember currency:EUR 2021-12-31 0001263043 shg:OtherFinancialLiabilitiesMember currency:CNY 2021-12-31 0001263043 shg:OtherCurrencyMember shg:BorrowingsMember 2021-12-31 0001263043 shg:LoansAtAmortizedCostMember 2021-12-31 0001263043 shg:OtherCurrencyMember shg:DerivativeFinancialInstrumentsAssetsMember 2021-12-31 0001263043 shg:OtherFinancialAssetsMember currency:CNY 2021-12-31 0001263043 shg:DebtSecuritiesIssuedMember 2021-12-31 0001263043 ifrs-full:FinancialLiabilitiesMember 2021-12-31 0001263043 shg:DerivativeFinancialInstrumentsAssetsMember 2021-12-31 0001263043 shg:OffBalanceDerivativeExposureMember 2021-12-31 0001263043 currency:JPY shg:SecuritiesAtFVTPLMember 2021-12-31 0001263043 currency:EUR shg:OtherFinancialLiabilitiesMember 2021-12-31 0001263043 currency:EUR ifrs-full:FinancialAssetsAtAmortisedCostCategoryMember 2021-12-31 0001263043 currency:JPY shg:DepositsMember 2021-12-31 0001263043 shg:DueFromBanksAtFVTPLMember 2021-12-31 0001263043 currency:JPY shg:DerivativeFinancialInstrumentsAssetsMember 2021-12-31 0001263043 currency:CNY shg:DerivativeFinancialInstrumentsAssetsMember 2021-12-31 0001263043 ifrs-full:FinancialAssetsAtAmortisedCostCategoryMember currency:USD 2021-12-31 0001263043 ifrs-full:FinancialAssetsAtAmortisedCostCategoryMember 2021-12-31 0001263043 shg:OtherCurrencyMember shg:FinancialAssetsClassMember 2021-12-31 0001263043 currency:USD shg:DepositsMember 2021-12-31 0001263043 ifrs-full:FinancialLiabilitiesAtFairValueThroughProfitOrLossCategoryMember 2021-12-31 0001263043 currency:USD shg:DerivativeFinancialInstrumentsLiabilitiesMember 2021-12-31 0001263043 shg:DerivativeFinancialInstrumentsLiabilitiesMember currency:JPY 2021-12-31 0001263043 currency:EUR shg:DerivativeFinancialInstrumentsLiabilitiesMember 2021-12-31 0001263043 shg:OtherFinancialAssetsMember shg:OtherCurrencyMember 2021-12-31 0001263043 ifrs-full:FinancialAssetsAtFairValueThroughOtherComprehensiveIncomeCategoryMember currency:USD 2021-12-31 0001263043 currency:USD shg:SecuritiesAtFVTPLMember 2021-12-31 0001263043 ifrs-full:FinancialLiabilitiesAtFairValueThroughProfitOrLossDesignatedUponInitialRecognitionCategoryMember 2021-12-31 0001263043 currency:USD shg:FinancialAssetsClassMember 2021-12-31 0001263043 currency:JPY ifrs-full:FinancialAssetsAtAmortisedCostCategoryMember 2021-12-31 0001263043 currency:CNY shg:CashAndDueFromBanksAtAmortizedCostMember 2021-12-31 0001263043 shg:DepositsMember 2021-12-31 0001263043 currency:USD shg:OffBalanceDerivativeExposureMember 2021-12-31 0001263043 currency:USD shg:LoansAtAmortizedCostMember 2021-12-31 0001263043 shg:BorrowingsMember 2021-12-31 0001263043 currency:CNY shg:FinancialAssetsClassMember 2021-12-31 0001263043 shg:OtherCurrencyMember ifrs-full:FinancialAssetsAtFairValueThroughOtherComprehensiveIncomeCategoryMember 2021-12-31 0001263043 currency:USD shg:DerivativeFinancialInstrumentsAssetsMember 2021-12-31 0001263043 ifrs-full:FinancialLiabilitiesAtFairValueThroughProfitOrLossDesignatedUponInitialRecognitionCategoryMember currency:USD 2021-12-31 0001263043 currency:EUR shg:OffBalanceDerivativeExposureMember 2021-12-31 0001263043 currency:USD ifrs-full:FinancialLiabilitiesMember 2021-12-31 0001263043 shg:DebtSecuritiesIssuedMember shg:OtherCurrencyMember 2021-12-31 0001263043 shg:OtherCurrencyMember ifrs-full:FinancialLiabilitiesAtFairValueThroughProfitOrLossCategoryMember 2021-12-31 0001263043 currency:JPY shg:FinancialAssetsClassMember 2021-12-31 0001263043 ifrs-full:FinancialAssetsAtFairValueThroughOtherComprehensiveIncomeCategoryMember currency:EUR 2021-12-31 0001263043 currency:EUR shg:DebtSecuritiesIssuedMember 2021-12-31 0001263043 shg:LoansAtAmortizedCostMember shg:OtherCurrencyMember 2021-12-31 0001263043 currency:EUR shg:CashAndDueFromBanksAtAmortizedCostMember 2021-12-31 0001263043 currency:JPY shg:NetAssetsNetDomesticAndForeignCurrencyExposureMember 2021-12-31 0001263043 currency:CNY shg:NetForeignCurrencyExposureMember 2021-12-31 0001263043 currency:USD shg:NetForeignCurrencyExposureMember 2021-12-31 0001263043 shg:OtherCurrencyMember shg:OffBalanceDerivativeExposureMember 2021-12-31 0001263043 currency:CNY shg:NetAssetsNetDomesticAndForeignCurrencyExposureMember 2021-12-31 0001263043 currency:USD shg:NetAssetsNetDomesticAndForeignCurrencyExposureMember 2021-12-31 0001263043 shg:OtherCurrencyMember ifrs-full:FinancialLiabilitiesMember 2021-12-31 0001263043 currency:CNY ifrs-full:FinancialLiabilitiesMember 2021-12-31 0001263043 shg:OtherFinancialLiabilitiesMember 2021-12-31 0001263043 shg:OtherCurrencyMember shg:OtherFinancialLiabilitiesMember 2021-12-31 0001263043 currency:JPY shg:DebtSecuritiesIssuedMember 2021-12-31 0001263043 shg:DerivativeFinancialInstrumentsLiabilitiesMember 2021-12-31 0001263043 shg:DerivativeFinancialInstrumentsLiabilitiesMember shg:OtherCurrencyMember 2021-12-31 0001263043 currency:CNY shg:DerivativeFinancialInstrumentsLiabilitiesMember 2021-12-31 0001263043 shg:CashAndDueFromBanksAtAmortizedCostMember 2021-12-31 0001263043 shg:LoansAtAmortizedCostMember currency:EUR 2021-12-31 0001263043 currency:CNY shg:LoansAtAmortizedCostMember 2021-12-31 0001263043 currency:USD ifrs-full:FinancialLiabilitiesAtFairValueThroughProfitOrLossCategoryMember 2021-12-31 0001263043 shg:SecuritiesAtFVTPLMember currency:CNY 2021-12-31 0001263043 ifrs-full:Level2OfFairValueHierarchyMember shg:DueFromBanksAtAmortizedCostMember 2021-12-31 0001263043 ifrs-full:Level3OfFairValueHierarchyMember shg:OtherFinancialAssetsMember 2021-12-31 0001263043 shg:OtherFinancialAssetsMember ifrs-full:Level2OfFairValueHierarchyMember 2021-12-31 0001263043 ifrs-full:Level2OfFairValueHierarchyMember shg:BorrowingsMember 2021-12-31 0001263043 ifrs-full:Level2OfFairValueHierarchyMember shg:LoansAtAmortizedCostMember 2021-12-31 0001263043 ifrs-full:Level3OfFairValueHierarchyMember shg:OtherFinancialLiabilitiesMember 2021-12-31 0001263043 ifrs-full:Level3OfFairValueHierarchyMember 2021-12-31 0001263043 ifrs-full:Level3OfFairValueHierarchyMember shg:LoansAtAmortizedCostMember 2021-12-31 0001263043 ifrs-full:Level3OfFairValueHierarchyMember shg:BorrowingsMember 2021-12-31 0001263043 ifrs-full:Level3OfFairValueHierarchyMember ifrs-full:FinancialAssetsAtAmortisedCostMember 2021-12-31 0001263043 ifrs-full:Level2OfFairValueHierarchyMember ifrs-full:DebtSecuritiesMember 2021-12-31 0001263043 ifrs-full:Level2OfFairValueHierarchyMember ifrs-full:FinancialAssetsAtAmortisedCostMember 2021-12-31 0001263043 ifrs-full:Level2OfFairValueHierarchyMember shg:OtherFinancialLiabilitiesMember 2021-12-31 0001263043 ifrs-full:Level2OfFairValueHierarchyMember shg:DepositsMember 2021-12-31 0001263043 ifrs-full:Level3OfFairValueHierarchyMember ifrs-full:DebtSecuritiesMember 2021-12-31 0001263043 shg:DepositsMember ifrs-full:Level3OfFairValueHierarchyMember 2021-12-31 0001263043 ifrs-full:FinancialAssetsAtFairValueThroughOtherComprehensiveIncomeCategoryMember 2021-12-31 0001263043 ifrs-full:FinancialAssetsAtAmortisedCostMember 2021-12-31 0001263043 shg:BondsSoldUnderRepurchaseAgreementsMember 2021-12-31 0001263043 shg:SecuritiesLoanedMember 2021-12-31 0001263043 shg:CorporationBondsMember 2021-12-31 0001263043 shg:SecuritiesAtFVTPLMember 2021-12-31 0001263043 shg:FinancialInstitutionsMember 2021-12-31 0001263043 ifrs-full:GovernmentMember 2021-12-31 0001263043 shg:EquitySecuritiesMember 2021-12-31 0001263043 ifrs-full:Level3OfFairValueHierarchyMember shg:DesignatedAsHedgingInstrumentMember shg:DerivativeFinancialInstrumentsAssetsMember 2021-12-31 0001263043 ifrs-full:Level2OfFairValueHierarchyMember ifrs-full:FinancialAssetsAtFairValueThroughOtherComprehensiveIncomeCategoryMember ifrs-full:DebtSecuritiesMember 2021-12-31 0001263043 shg:DerivativeFinancialInstrumentsAssetsMember shg:NotDesignatedAsHedgingInstrumentTradingMember 2021-12-31 0001263043 ifrs-full:DebtSecuritiesMember ifrs-full:FinancialAssetsAtFairValueThroughProfitOrLossCategoryMember 2021-12-31 0001263043 shg:EquitySecuritiesMember ifrs-full:Level1OfFairValueHierarchyMember ifrs-full:FinancialAssetsAtFairValueThroughOtherComprehensiveIncomeCategoryMember 2021-12-31 0001263043 ifrs-full:DebtSecuritiesMember ifrs-full:FinancialAssetsAtFairValueThroughOtherComprehensiveIncomeCategoryMember 2021-12-31 0001263043 shg:DerivativeFinancialInstrumentsAssetsMember 2021-12-31 0001263043 shg:DesignatedAsHedgingInstrumentMember shg:DerivativeFinancialInstrumentsAssetsMember 2021-12-31 0001263043 ifrs-full:Level2OfFairValueHierarchyMember shg:NotDesignatedAsHedgingInstrumentTradingMember shg:DerivativeFinancialInstrumentsAssetsMember 2021-12-31 0001263043 ifrs-full:Level1OfFairValueHierarchyMember shg:GoldDepositsMember ifrs-full:FinancialAssetsAtFairValueThroughProfitOrLossCategoryMember 2021-12-31 0001263043 ifrs-full:Level3OfFairValueHierarchyMember shg:EquitySecuritiesMember ifrs-full:FinancialAssetsAtFairValueThroughProfitOrLossCategoryMember 2021-12-31 0001263043 ifrs-full:Level2OfFairValueHierarchyMember ifrs-full:DebtSecuritiesMember ifrs-full:FinancialAssetsAtFairValueThroughProfitOrLossCategoryMember 2021-12-31 0001263043 shg:LoansAtFvtplMember 2021-12-31 0001263043 ifrs-full:Level2OfFairValueHierarchyMember shg:EquitySecuritiesMember ifrs-full:FinancialAssetsAtFairValueThroughProfitOrLossCategoryMember 2021-12-31 0001263043 shg:EquitySecuritiesMember ifrs-full:FinancialAssetsAtFairValueThroughOtherComprehensiveIncomeCategoryMember 2021-12-31 0001263043 ifrs-full:Level3OfFairValueHierarchyMember shg:DerivativeFinancialInstrumentsAssetsMember 2021-12-31 0001263043 ifrs-full:FinancialAssetsAtFairValueThroughOtherComprehensiveIncomeCategoryMember 2021-12-31 0001263043 ifrs-full:FinancialAssetsAtFairValueThroughProfitOrLossCategoryMember shg:GoldDepositsMember 2021-12-31 0001263043 ifrs-full:FinancialAssetsAtFairValueThroughOtherComprehensiveIncomeCategoryMember ifrs-full:Level1OfFairValueHierarchyMember 2021-12-31 0001263043 shg:LoansAtFvtplMember ifrs-full:Level3OfFairValueHierarchyMember 2021-12-31 0001263043 shg:DueFromBanksAtFVTPLMember 2021-12-31 0001263043 ifrs-full:Level1OfFairValueHierarchyMember ifrs-full:FinancialAssetsAtFairValueThroughProfitOrLossCategoryMember 2021-12-31 0001263043 ifrs-full:Level1OfFairValueHierarchyMember ifrs-full:FinancialAssetsAtFairValueThroughOtherComprehensiveIncomeCategoryMember ifrs-full:DebtSecuritiesMember 2021-12-31 0001263043 ifrs-full:Level2OfFairValueHierarchyMember ifrs-full:FinancialAssetsAtFairValueThroughOtherComprehensiveIncomeCategoryMember 2021-12-31 0001263043 ifrs-full:Level2OfFairValueHierarchyMember 2021-12-31 0001263043 ifrs-full:Level3OfFairValueHierarchyMember ifrs-full:FinancialAssetsAtFairValueThroughOtherComprehensiveIncomeCategoryMember ifrs-full:DebtSecuritiesMember 2021-12-31 0001263043 ifrs-full:Level2OfFairValueHierarchyMember shg:DesignatedAsHedgingInstrumentMember shg:DerivativeFinancialInstrumentsAssetsMember 2021-12-31 0001263043 ifrs-full:Level1OfFairValueHierarchyMember 2021-12-31 0001263043 ifrs-full:Level2OfFairValueHierarchyMember shg:DerivativeFinancialInstrumentsAssetsMember 2021-12-31 0001263043 shg:EquitySecuritiesMember ifrs-full:FinancialAssetsAtFairValueThroughProfitOrLossCategoryMember 2021-12-31 0001263043 ifrs-full:Level3OfFairValueHierarchyMember shg:NotDesignatedAsHedgingInstrumentTradingMember shg:DerivativeFinancialInstrumentsAssetsMember 2021-12-31 0001263043 ifrs-full:FinancialAssetsAtFairValueThroughOtherComprehensiveIncomeCategoryMember ifrs-full:Level3OfFairValueHierarchyMember shg:EquitySecuritiesMember 2021-12-31 0001263043 ifrs-full:Level3OfFairValueHierarchyMember ifrs-full:FinancialAssetsAtFairValueThroughOtherComprehensiveIncomeCategoryMember 2021-12-31 0001263043 ifrs-full:Level1OfFairValueHierarchyMember shg:DerivativeFinancialInstrumentsAssetsMember 2021-12-31 0001263043 ifrs-full:Level3OfFairValueHierarchyMember ifrs-full:FinancialAssetsAtFairValueThroughProfitOrLossCategoryMember 2021-12-31 0001263043 ifrs-full:Level3OfFairValueHierarchyMember shg:DueFromBanksAtFVTPLMember 2021-12-31 0001263043 shg:EquitySecuritiesMember ifrs-full:Level2OfFairValueHierarchyMember ifrs-full:FinancialAssetsAtFairValueThroughOtherComprehensiveIncomeCategoryMember 2021-12-31 0001263043 shg:LoansAtFvtplMember ifrs-full:Level2OfFairValueHierarchyMember 2021-12-31 0001263043 ifrs-full:Level1OfFairValueHierarchyMember shg:EquitySecuritiesMember ifrs-full:FinancialAssetsAtFairValueThroughProfitOrLossCategoryMember 2021-12-31 0001263043 ifrs-full:FinancialAssetsAtFairValueThroughProfitOrLossCategoryMember 2021-12-31 0001263043 ifrs-full:Level2OfFairValueHierarchyMember ifrs-full:FinancialAssetsAtFairValueThroughProfitOrLossCategoryMember 2021-12-31 0001263043 ifrs-full:Level3OfFairValueHierarchyMember ifrs-full:DebtSecuritiesMember ifrs-full:FinancialAssetsAtFairValueThroughProfitOrLossCategoryMember 2021-12-31 0001263043 ifrs-full:Level1OfFairValueHierarchyMember shg:NotDesignatedAsHedgingInstrumentTradingMember shg:DerivativeFinancialInstrumentsAssetsMember 2021-12-31 0001263043 ifrs-full:Level1OfFairValueHierarchyMember ifrs-full:DebtSecuritiesMember ifrs-full:FinancialAssetsAtFairValueThroughProfitOrLossCategoryMember 2021-12-31 0001263043 ifrs-full:Level3OfFairValueHierarchyMember shg:DerivativeFinancialInstrumentsLiabilitiesMember shg:DesignatedAsHedgingInstrumentMember 2021-12-31 0001263043 ifrs-full:FinancialLiabilitiesAtFairValueThroughProfitOrLossDesignatedUponInitialRecognitionCategoryMember shg:DerivativesCombinedSecuritiesSoldMember 2021-12-31 0001263043 ifrs-full:Level2OfFairValueHierarchyMember shg:DerivativeFinancialInstrumentsLiabilitiesMember shg:DesignatedAsHedgingInstrumentMember 2021-12-31 0001263043 ifrs-full:FinancialLiabilitiesAtFairValueThroughProfitOrLossCategoryMember 2021-12-31 0001263043 shg:DerivativeFinancialInstrumentsLiabilitiesMember 2021-12-31 0001263043 ifrs-full:Level3OfFairValueHierarchyMember shg:DerivativeFinancialInstrumentsLiabilitiesMember shg:NotDesignatedAsHedgingInstrumentTradingMember 2021-12-31 0001263043 ifrs-full:Level2OfFairValueHierarchyMember shg:DerivativeFinancialInstrumentsLiabilitiesMember shg:NotDesignatedAsHedgingInstrumentTradingMember 2021-12-31 0001263043 ifrs-full:Level1OfFairValueHierarchyMember shg:DerivativeFinancialInstrumentsLiabilitiesMember shg:NotDesignatedAsHedgingInstrumentTradingMember 2021-12-31 0001263043 shg:GoldDepositsMember ifrs-full:FinancialLiabilitiesAtFairValueThroughProfitOrLossCategoryMember 2021-12-31 0001263043 shg:DerivativeFinancialInstrumentsLiabilitiesMember shg:NotDesignatedAsHedgingInstrumentTradingMember 2021-12-31 0001263043 ifrs-full:FinancialLiabilitiesAtFairValueThroughProfitOrLossDesignatedUponInitialRecognitionCategoryMember shg:DerivativesCombinedSecuritiesSoldMember ifrs-full:Level3OfFairValueHierarchyMember 2021-12-31 0001263043 ifrs-full:Level1OfFairValueHierarchyMember ifrs-full:FinancialLiabilitiesAtFairValueThroughProfitOrLossCategoryMember 2021-12-31 0001263043 ifrs-full:Level1OfFairValueHierarchyMember shg:DerivativeFinancialInstrumentsLiabilitiesMember 2021-12-31 0001263043 shg:GoldDepositsMember ifrs-full:Level1OfFairValueHierarchyMember ifrs-full:FinancialLiabilitiesAtFairValueThroughProfitOrLossCategoryMember 2021-12-31 0001263043 ifrs-full:Level3OfFairValueHierarchyMember shg:DerivativeFinancialInstrumentsLiabilitiesMember 2021-12-31 0001263043 ifrs-full:FinancialLiabilitiesAtFairValueThroughProfitOrLossDesignatedUponInitialRecognitionCategoryMember shg:DerivativesCombinedSecuritiesSoldMember ifrs-full:Level2OfFairValueHierarchyMember 2021-12-31 0001263043 ifrs-full:Level2OfFairValueHierarchyMember shg:DerivativeFinancialInstrumentsLiabilitiesMember 2021-12-31 0001263043 shg:DerivativeFinancialInstrumentsLiabilitiesMember shg:DesignatedAsHedgingInstrumentMember 2021-12-31 0001263043 shg:SecuritiesSoldMember ifrs-full:FinancialLiabilitiesAtFairValueThroughProfitOrLossCategoryMember 2021-12-31 0001263043 shg:SecuritiesSoldMember ifrs-full:Level1OfFairValueHierarchyMember ifrs-full:FinancialLiabilitiesAtFairValueThroughProfitOrLossCategoryMember 2021-12-31 0001263043 ifrs-full:FinancialGuaranteeContractsMember 2021-12-31 0001263043 ifrs-full:DerivativesMember 2021-12-31 0001263043 ifrs-full:LoanCommitmentsMember 2021-12-31 0001263043 shg:DepositsAndLoansAtFVTPLMember shg:SubsidiaryShinhanBankMember 2021-12-31 0001263043 shg:DueFromBanksAndLoansAtAmortizedCostMember shg:SubsidiaryShinhanCardMember 2021-12-31 0001263043 shg:DueFromBanksAndLoansAtAmortizedCostMember shg:SubsidiaryShinhanBankMember 2021-12-31 0001263043 ifrs-full:ForwardContractMember shg:NotDesignatedAsHedgingInstrumentTradingMember shg:ForeignExchangeContractMember shg:OverTheCounterMember 2021-12-31 0001263043 shg:DesignatedAsHedgingInstrumentMember shg:ForeignExchangeContractMember shg:InterestRateForwardsAndSwapsMember 2021-12-31 0001263043 shg:NotDesignatedAsHedgingInstrumentTradingMember shg:ForeignExchangeContractMember shg:OverTheCounterMember ifrs-full:OptionContractMember 2021-12-31 0001263043 shg:InterestRatesRelatedMember shg:InterestRateOptionContractMember shg:OverTheCounterMember shg:NotDesignatedAsHedgingInstrumentTradingMember 2021-12-31 0001263043 shg:NotDesignatedAsHedgingInstrumentTradingMember shg:OverTheCounterMember shg:InterestRatesRelatedMember 2021-12-31 0001263043 shg:NotDesignatedAsHedgingInstrumentTradingMember shg:EquityContractMember shg:OverTheCounterMember shg:EquityOptionsMember 2021-12-31 0001263043 shg:EquityContractMember shg:ExchangeTradedMember shg:NotDesignatedAsHedgingInstrumentTradingMember 2021-12-31 0001263043 ifrs-full:FuturesContractMember shg:ExchangeTradedMember shg:ForeignExchangeContractMember shg:NotDesignatedAsHedgingInstrumentTradingMember 2021-12-31 0001263043 shg:NotDesignatedAsHedgingInstrumentTradingMember shg:EquityContractMember shg:OverTheCounterMember 2021-12-31 0001263043 shg:InterestRateFutureContractMember shg:ExchangeTradedMember shg:InterestRateContractMember shg:NotDesignatedAsHedgingInstrumentTradingMember 2021-12-31 0001263043 shg:InterestRateContractMember shg:NotDesignatedAsHedgingInstrumentTradingMember 2021-12-31 0001263043 shg:EquitySwapsAndForwardsMember shg:OverTheCounterMember shg:EquityContractMember shg:NotDesignatedAsHedgingInstrumentTradingMember 2021-12-31 0001263043 shg:EquityContractMember shg:NotDesignatedAsHedgingInstrumentTradingMember 2021-12-31 0001263043 shg:InterestRateOptionContractMember shg:ExchangeTradedMember shg:InterestRateContractMember shg:NotDesignatedAsHedgingInstrumentTradingMember 2021-12-31 0001263043 shg:CreditSwapsMember shg:OverTheCounterMember shg:CreditRiskContractMember shg:NotDesignatedAsHedgingInstrumentTradingMember 2021-12-31 0001263043 shg:NotDesignatedAsHedgingInstrumentTradingMember shg:OverTheCounterMember shg:InterestRatesRelatedMember shg:InterestRateForwardsAndSwapsMember 2021-12-31 0001263043 shg:DesignatedAsHedgingInstrumentMember 2021-12-31 0001263043 ifrs-full:ForwardContractMember shg:ForeignExchangeContractMember shg:DesignatedAsHedgingInstrumentMember 2021-12-31 0001263043 ifrs-full:SwapContractMember shg:ForeignExchangeContractMember shg:DesignatedAsHedgingInstrumentMember 2021-12-31 0001263043 shg:OverTheCounterMember shg:CommodityContractMember shg:NotDesignatedAsHedgingInstrumentTradingMember 2021-12-31 0001263043 shg:CommodityFuturesAndOptionsMember shg:ExchangeTradedMember shg:CommodityContractMember shg:NotDesignatedAsHedgingInstrumentTradingMember 2021-12-31 0001263043 shg:CommodityContractMember shg:NotDesignatedAsHedgingInstrumentTradingMember 2021-12-31 0001263043 shg:NotDesignatedAsHedgingInstrumentTradingMember shg:CommodityContractMember shg:CommodityRelatedMember shg:OverTheCounterMember shg:CommodityOptionsMember 2021-12-31 0001263043 shg:CommoditySwapsAndForwardsMember shg:OverTheCounterMember shg:CommodityContractMember shg:NotDesignatedAsHedgingInstrumentTradingMember 2021-12-31 0001263043 shg:ExchangeTradedMember shg:InterestRateContractMember shg:NotDesignatedAsHedgingInstrumentTradingMember 2021-12-31 0001263043 shg:NotDesignatedAsHedgingInstrumentTradingMember shg:EquityContractMember shg:ExchangeTradedMember shg:EquityOptionsMember 2021-12-31 0001263043 shg:OverTheCounterMember shg:ForeignExchangeContractMember shg:NotDesignatedAsHedgingInstrumentTradingMember 2021-12-31 0001263043 shg:InterestRateContractMember shg:NotDesignatedAsHedgingInstrumentTradingMember shg:ExchangeTradedMember ifrs-full:InterestRateSwapContractMember 2021-12-31 0001263043 shg:EquityFuturesMember shg:ExchangeTradedMember shg:EquityContractMember shg:NotDesignatedAsHedgingInstrumentTradingMember 2021-12-31 0001263043 shg:NotDesignatedAsHedgingInstrumentTradingMember shg:ForeignExchangeContractMember shg:OverTheCounterMember ifrs-full:SwapContractMember 2021-12-31 0001263043 shg:ForeignExchangeContractMember shg:NotDesignatedAsHedgingInstrumentTradingMember 2021-12-31 0001263043 ifrs-full:AccumulatedDepreciationAndAmortisationMember 2021-12-31 0001263043 shg:AcquisitionRelatedCostsMember 2021-12-31 0001263043 ifrs-full:AccumulatedImpairmentMember 2021-12-31 0001263043 shg:ExchangeTradedMember shg:EquityOptionsMember 2021-12-31 0001263043 shg:ExchangeTradedMember shg:EquityFuturesMember 2021-12-31 0001263043 shg:CommodityRelatedMember shg:OverTheCounterMember shg:CommoditySwapsAndForwardsMember 2021-12-31 0001263043 shg:OverTheCounterMember shg:CommodityRelatedMember 2021-12-31 0001263043 shg:CommodityRelatedMember shg:CommodityFuturesAndOptionsMember shg:ExchangeTradedMember 2021-12-31 0001263043 shg:ExchangeTradedMember 2021-12-31 0001263043 shg:HedgeFundsMember 2021-12-31 0001263043 shg:ExchangeTradedMember shg:CommodityRelatedMember 2021-12-31 0001263043 shg:CommodityOptionsMember shg:OverTheCounterMember shg:CommodityRelatedMember 2021-12-31 0001263043 shg:HedgeFundsMember ifrs-full:ForwardContractMember 2021-12-31 0001263043 shg:HedgeFundsMember ifrs-full:SwapContractMember 2021-12-31 0001263043 shg:HedgeFundsMember shg:InterestRateForwardsAndSwapsMember 2021-12-31 0001263043 shg:EquityRelatedMember shg:OverTheCounterMember shg:EquitySwapsAndForwardsMember 2021-12-31 0001263043 shg:CreditRelatedMember shg:OverTheCounterMember shg:CreditSwapsMember 2021-12-31 0001263043 shg:EquityRelatedMember shg:OverTheCounterMember 2021-12-31 0001263043 shg:EquityRelatedMember shg:OverTheCounterMember shg:EquityOptionsMember 2021-12-31 0001263043 shg:NotDesignatedAsHedgingInstrumentTradingMember shg:InterestRateContractMember shg:OverTheCounterMember shg:InterestRateOptionContractMember 2021-12-31 0001263043 shg:InterestRatesRelatedMember shg:ExchangeTradedMember shg:InterestRateFutureContractMember 2021-12-31 0001263043 shg:NotDesignatedAsHedgingInstrumentTradingMember shg:InterestRateContractMember shg:OverTheCounterMember 2021-12-31 0001263043 shg:ExchangeTradedMember shg:InterestRateOptionContractMember shg:InterestRatesRelatedMember 2021-12-31 0001263043 shg:InterestRatesRelatedMember 2021-12-31 0001263043 shg:NotDesignatedAsHedgingInstrumentTradingMember shg:InterestRateContractMember shg:OverTheCounterMember shg:InterestRateForwardsAndSwapsMember 2021-12-31 0001263043 shg:InterestRatesRelatedMember shg:ExchangeTradedMember 2021-12-31 0001263043 shg:ForeignCurrencyMember 2021-12-31 0001263043 shg:ForeignCurrencyMember 2021-12-31 0001263043 ifrs-full:NotLaterThanOneYearMember 2021-12-31 0001263043 ifrs-full:LaterThanFiveYearsMember 2021-12-31 0001263043 ifrs-full:LaterThanTwoYearsAndNotLaterThanThreeYearsMember 2021-12-31 0001263043 ifrs-full:LaterThanFourYearsAndNotLaterThanFiveYearsMember 2021-12-31 0001263043 ifrs-full:LaterThanThreeYearsAndNotLaterThanFourYearsMember 2021-12-31 0001263043 ifrs-full:LaterThanOneYearAndNotLaterThanTwoYearsMember 2021-12-31 0001263043 ifrs-full:ActuarialAssumptionOfExpectedRatesOfSalaryIncreasesMember 2021-12-31 0001263043 ifrs-full:ActuarialAssumptionOfDiscountRatesMember 2021-12-31 0001263043 ifrs-full:LegalProceedingsProvisionMember 2021-12-31 0001263043 shg:UnusedCreditCommitmentsMember 2021-12-31 0001263043 ifrs-full:MiscellaneousOtherProvisionsMember 2021-12-31 0001263043 ifrs-full:ProvisionForDecommissioningRestorationAndRehabilitationCostsMember 2021-12-31 0001263043 ifrs-full:FinancialGuaranteeContractsMember 2021-12-31 0001263043 shg:GuaranteeContractsIssuedMember 2021-12-31 0001263043 shg:NonfinancialGuaranteeContractsIssuedMember 2021-12-31 0001263043 shg:DeathMember 2021-12-31 0001263043 shg:GroupPoliciesMember 2021-12-31 0001263043 shg:PureEndowmentMember 2021-12-31 0001263043 shg:PureProtectionMember 2021-12-31 0001263043 shg:IndividualPoliciesMember 2021-12-31 0001263043 shg:EndowmentMember 2021-12-31 0001263043 shg:SavingsMember 2021-12-31 0001263043 shg:CreditCardMember 2021-12-31 0001263043 shg:SecuritiesMember 2021-12-31 0001263043 ifrs-full:AllOtherSegmentsMember 2021-12-31 0001263043 ifrs-full:GoodwillMember 2021-12-31 0001263043 shg:BankingMember 2021-12-31 0001263043 shg:LifeInsuranceMember 2021-12-31 0001263043 shg:AssociatesWWGGlobalRealEstateInvestmentTrustno4Member 2021-12-31 0001263043 shg:AssociatesNHAmundiUSInfrastructurePrivateFund2Member 2021-12-31 0001263043 shg:AssociatesAoneMezzanineOpportunityProfessionalPrivateMember 2021-12-31 0001263043 shg:AssociatesVSCornerstoneFundMember 2021-12-31 0001263043 shg:AssociatesKakaoShinhan1stTNYTFundMember 2021-12-31 0001263043 shg:AssociatesPacificPrivatePlacementRealEstateFundNo40Member 2021-12-31 0001263043 shg:AssociatesKIAMCOVietnamSolarSpecialAssetPrivateInvestmentTrustMember 2021-12-31 0001263043 shg:AssociatesSimoneMezzanineFundNo3Member 2021-12-31 0001263043 shg:AssociatesKiwoomHeroNo4PrivateEquityFundMember 2021-12-31 0001263043 shg:AssociatesCSQUARESNIPERPROFESSIONALPRIVATE10Member 2021-12-31 0001263043 shg:AssociatesIGISGLIPProfessionalInvestmentPrivateRealEstateInvestmentTrustNo12Member 2021-12-31 0001263043 shg:AssociatesKiwoomPrivateEquityAntManStartupVentureSpecializedPrivateEquityFundMember 2021-12-31 0001263043 shg:SHINHANNEOCoreIndustrialTechnologyFundMember 2021-12-31 0001263043 shg:AssociatesShinhanJigaeNamsanRoadPrivateSpecialAssetInvestmentTrustMember 2021-12-31 0001263043 shg:AssociatesKbOaktreeTrustNo.3Member 2021-12-31 0001263043 shg:AssociatesJbIncheonBucheonReitsNo.54Member 2021-12-31 0001263043 shg:AssociatesSwfvFund1Member 2021-12-31 0001263043 shg:AssociatesJsShinhanPrivateEquityFundMember 2021-12-31 0001263043 shg:AssociatesDaehanNo.36OfficeAssetManagementCompanyMember 2021-12-31 0001263043 shg:AssociatesHankookSmartRealAssetInvestmentTrustNo.3Member 2021-12-31 0001263043 shg:AssociatesShinhantimeMezzanineBlindFundMember 2021-12-31 0001263043 shg:AssociatesHighland20218FundMember 2021-12-31 0001263043 shg:AssociatesSksYozmaFundNo.1Member 2021-12-31 0001263043 shg:AssociatesJbHwaseongHadongReitsNo.53Member 2021-12-31 0001263043 shg:AssociatesCapstoneReitsNo.26Member 2021-12-31 0001263043 shg:AssociatesMedicii20213FundMember 2021-12-31 0001263043 shg:AssociatesPharosDkFundMember 2021-12-31 0001263043 shg:AssociatesDaishinNewgenNewTechnologyInvestmentFund1stMember 2021-12-31 0001263043 shg:AssociatesAves1stCorporateRecoveryPrivateEquityFundMember 2021-12-31 0001263043 shg:AssociatesHanyangMeritz1FundMember 2021-12-31 0001263043 shg:AssociatesKnt2ndPrivateEquityFundMember 2021-12-31 0001263043 shg:AssociatesMapleMobilityFundMember 2021-12-31 0001263043 shg:AssociatesPremierLuminousPrivateEquityFundMember 2021-12-31 0001263043 shg:AssociatesClBuyout1stPefMember 2021-12-31 0001263043 shg:AssociatesJMoorimJadeInvestmentFundMember 2021-12-31 0001263043 shg:AssociatesVogoCanisterProfessionalTrustPrivateFundIMember 2021-12-31 0001263043 shg:AssociatesUlmusShcInnovationInvestmentFundMember 2021-12-31 0001263043 shg:AssociatesShinhanneoMarketfrontier2ndFundMember 2021-12-31 0001263043 shg:AssociatesMiraeAssetPartnersXPrivateEquityFundMember 2021-12-31 0001263043 shg:AssociatesNhsynergyCoreIndustrialNewTechnologyFundMember 2021-12-31 0001263043 shg:AssociatesFountProfessionalInvestorsPrivateInvestmentTrustNo.3Member 2021-12-31 0001263043 shg:AssociatesTimefolioTheVenturevSecondMember 2021-12-31 0001263043 shg:AssociatesDaishinNewTechnologyInvestmentFund5thMember 2021-12-31 0001263043 shg:AssociatesPacificSunnyProfessionalInvestorsPrivatePlacementRealEstateInvestmentCompanyNo45Member 2021-12-31 0001263043 shg:AssociatesIGISGLIPProfessionalInvestmentPrivateRealEstateInvestmentTrustNo11Member 2021-12-31 0001263043 shg:AssociatesSynergyGreenNewDeal1stNewTechnologyBusinessInvestmentFundMember 2021-12-31 0001263043 shg:AssociatesKAIMRealestatePrivateInvestmentTrust20Member 2021-12-31 0001263043 shg:AssociatesTF2020SSPrivateEquityFundSpecializinginStartupandVentureBusinessMember 2021-12-31 0001263043 shg:AssociatesMasternOpportunitySeekingRealEstateFundIIMember 2021-12-31 0001263043 shg:AssociatesPCCAmberstonePrivateEquityFundIMember 2021-12-31 0001263043 shg:AssociatesFutureCreationNeopluxVentureCapitalFundMember 2021-12-31 0001263043 shg:AssociatesKBDistributionPrivateRealEstate1Member 2021-12-31 0001263043 shg:AssociatesHarvestPrivateEquityFundIiMember 2021-12-31 0001263043 shg:AssociatesAIONELFISPROFESSIONALPRIVATE1Member 2021-12-31 0001263043 shg:AssociatesNeopluxNo3PrivateEquityFundMember 2021-12-31 0001263043 shg:AssociatesGyeonggiNeopluxSupermanFundMember 2021-12-31 0001263043 shg:AssociatesLBScotlandAmazonFulfillmentCenterFund29Member 2021-12-31 0001263043 shg:AssociatesMasternPrivateRealEstateLoanFundNo2Member 2021-12-31 0001263043 shg:EDNCENTRALCoLtdMember 2021-12-31 0001263043 shg:AssociatesNewWave6thFundMember 2021-12-31 0001263043 shg:AssociatesJRAMCHungaryBudapestOfficeFund16Member 2021-12-31 0001263043 shg:AssociatesIMMSpecialSituation12PRIVATEEQUITYFUNDMember 2021-12-31 0001263043 shg:ShbnppJapanPhotovoltaicPrivateSpecialAssetInvestmentTrustNo.2Member 2021-12-31 0001263043 shg:AssociatesNeopluxMarketFrontierSecondaryFundMember 2021-12-31 0001263043 shg:AssociatesKIAMCOPOWERLOANTRUST4THMember 2021-12-31 0001263043 shg:AssociatesPebblestoneCGVPrivateRealEstateTrustNo1Member 2021-12-31 0001263043 shg:AssociatesShinhanHealthcareFund2Member 2021-12-31 0001263043 shg:AssociatesShinhanAIMRealEstateFundNo2Member 2021-12-31 0001263043 shg:AssociatesFidelisGlobalPrivateRealEstateTrustNo2Member 2021-12-31 0001263043 shg:AssociatesShinhanAIMRealEstateFundNo1Member 2021-12-31 0001263043 shg:AssociatesAIPEUROPRIVATEREALESTATETRUSTNo12Member 2021-12-31 0001263043 shg:AssociatesGoduckGangil10PfvCo.LtdMember 2021-12-31 0001263043 shg:AssociatesBRAINDOPROFESSIONALEPRIVATENo27Member 2021-12-31 0001263043 shg:ShbnppCorporateProfessionalInvestmentTypePrivateSecurityInvestmentTrustNo.7Member 2021-12-31 0001263043 shg:ShbnppBnctProfessionalInvestmentTypePrivateSpecialAssetInvestmentTrustMember 2021-12-31 0001263043 shg:AssociatesSparklabsShinhanOpportunityFund1Member 2021-12-31 0001263043 shg:AssociatesBNWTechInnovationPrivateEquityFundMember 2021-12-31 0001263043 shg:AssociatesIGISRealestatePrivateInvestmentTrustNo33Member 2021-12-31 0001263043 shg:AssociatesDeutscheGlobalProfessionalInvestmentTypePrivateRealEstateInvestmentTrustNo24Member 2021-12-31 0001263043 shg:AssociatesKoreaCreditBureauMember 2021-12-31 0001263043 shg:AssociatesNomuraRifaPrivateRealEstateInvestmentTrust31Member 2021-12-31 0001263043 shg:AssociatesSBCPFVCoLtdMember 2021-12-31 0001263043 shg:AssociatesVogoRealtyPartnersPrivateRealEstateFundVMember 2021-12-31 0001263043 shg:AssociatesGoduckGangil1PFVCoLtdMember 2021-12-31 0001263043 shg:AssociatesIMMGlobalPrivateEquityFundMember 2021-12-31 0001263043 shg:AssociatesStonebridgeCorporate1stFundMember 2021-12-31 0001263043 shg:ShSeniorLoanProfessionalInvestmentTypePrivateMixedAssetInvestmentTrustNo.2Member 2021-12-31 0001263043 shg:AssociatesHANAAlternativeEstateProfessionalPrivate122Member 2021-12-31 0001263043 shg:AssociatesNHamundiGlobalInfraPrivateFund16Member 2021-12-31 0001263043 shg:AssociatesCapeITFundNo3Member 2021-12-31 0001263043 shg:AssociatesJarvisMemorialPrivateInvestmentTrust1Member 2021-12-31 0001263043 shg:AssociatesSamchullyMidstreamPrivatePlacementSpecialAssetFund54Member 2021-12-31 0001263043 shg:AssociatesAIPTransportationSpecializedPrivatelyPlacedFundTrust1Member 2021-12-31 0001263043 shg:AssociatesKiwoomShinhanInnovationFundIMember 2021-12-31 0001263043 shg:AssociatesSHBNPPSeniorLoanProfessionalInvestmentTypePrivateMixedAssetInvestmentTrustNo3Member 2021-12-31 0001263043 shg:AssociatesKoreaFinanceSecurityMember 2021-12-31 0001263043 shg:AssociatesVestasQualifiedInvestorsPrivateRealEstateFundInvestmentTrustNo37Member 2021-12-31 0001263043 shg:AssociatesEHealthcareInvestmentFundNo6Member 2021-12-31 0001263043 shg:MilestonePrivateRealEstateFund3Member 2021-12-31 0001263043 shg:AssociatesNHAmundiGlobalInfrastructureTrust14Member 2021-12-31 0001263043 shg:AssociatesMidasAssetGlobalCREDebtPrivateFundNo6Member 2021-12-31 0001263043 shg:AssociatesDaishinKTNewTechnologyInvestmentFundMember 2021-12-31 0001263043 shg:AssociatesOneShinhanGlobalFund1Member 2021-12-31 0001263043 shg:AssociatesMIELCOLTDMember 2021-12-31 0001263043 shg:AssociatesGenesisNo1PrivateEquityFundMember 2021-12-31 0001263043 shg:AssociatesBNPParibasCardifGeneralInsuranceMember 2021-12-31 0001263043 shg:AssociatesShinhanNvestorLiquiditySolutionFundMember 2021-12-31 0001263043 shg:AssociatesSongrimPartnersMember 2021-12-31 0001263043 shg:AssociatesKiwoomMilestoneProfessionalPrivateRealEstateTrust19Member 2021-12-31 0001263043 shg:AssociatesShinhanGlobalHealthcareFund1Member 2021-12-31 0001263043 shg:AssociatesKoramcoEuropeCorePrivatePlacementRealEstateFundNo2and2Member 2021-12-31 0001263043 shg:AssociatesShinhanAIMFoFFund1aMember 2021-12-31 0001263043 shg:AssociatesPartnerOneValueUpIPrivateEquityFundMember 2021-12-31 0001263043 shg:AssociatesKTBNewlakeGlobalHealthcarePEFMember 2021-12-31 0001263043 shg:AssociatesShinhanPraxisKGrowthGlobalPrivateEquityFundMember 2021-12-31 0001263043 shg:AssociatesHermesPrivateInvestmentEquityFundMember 2021-12-31 0001263043 shg:AssociatesIGISGlobalCreditFund1501Member 2021-12-31 0001263043 shg:AssociatesBNPParibasCardifLifeInsuranceMember 2021-12-31 0001263043 shg:AssociatesPartners4thGrowthInvestmentFundMember 2021-12-31 0001263043 shg:AssociatesShinHanSooYoungEntrepreneurInvestmentFundNo1Member 2021-12-31 0001263043 shg:VogoDebtStrategyQualifiedInvPrivateMember 2021-12-31 0001263043 shg:AssociatesShinhanAlbatrossTechInvestmentFundMember 2021-12-31 0001263043 shg:AssociatesKBNAHickoryPrivateSpecialAssetFundMember 2021-12-31 0001263043 shg:AssociatesAIPEUROGREENPrivateRealEstateInvestmentTrustNo3Member 2021-12-31 0001263043 shg:AssociatesShinhanMidasDongaSecondaryFundMember 2021-12-31 0001263043 shg:AssociatesShinhanNeopluxEnergyNewbizFundMember 2021-12-31 0001263043 shg:AssociatesShinhanSmilegateGlobalPefIMember 2021-12-31 0001263043 shg:AssociatesSwsFundMember 2021-12-31 0001263043 shg:AssociatesGenesisEcoNo.1PefMember 2021-12-31 0001263043 shg:AssociatesNewlakeGrowthCapitalPartners2PefMember 2021-12-31 0001263043 shg:AssociatesEumPrivateEquityFundNo7Member 2021-12-31 0001263043 shg:AssociatesAcurusHyundaiInvestmentPartnersNewTechnologyMember 2021-12-31 0001263043 shg:AssociatesMetaEsgPrivateEquityFundIMember 2021-12-31 0001263043 shg:AssociatesShinhanVcTomorrowVentureFund1Member 2021-12-31 0001263043 shg:AssociatesTresyujinTrustMember 2021-12-31 0001263043 shg:AssociatesRhinosPremierMezzaninePrivateInvestmentFundNo.1Member 2021-12-31 0001263043 shg:AssociatesShRealEstateLoanInvestmentTypePrivateRealEstateInvestmentTrustNo.2Member 2021-12-31 0001263043 shg:AssociatesGenesisNorthAmericaPowerCompanyNo1PEFMember 2021-12-31 0001263043 shg:AssociatesSooDeliveryPlatformGrowthFundMember 2021-12-31 0001263043 shg:AssociatesKoreaOmegaProjectFundIIIMember 2021-12-31 0001263043 shg:AssociatesSHBNPPMAINProfessionalInvestmentTypePrivateMixedAssetInvestmentTrustNo3Member 2021-12-31 0001263043 shg:AssociatesFuturePlayShinhanTechInnovationFund1Member 2021-12-31 0001263043 shg:ShbnppDaeguGreenPowerCogenerationSystemProfessionalInvestmentTypePrivateSpecialAssetInvestmentTrustMember 2021-12-31 0001263043 shg:ShbnppSangjuYcExpresswayProfessionalInvestmentTypePrivateSpecialAssetInvestmentTrustMember 2021-12-31 0001263043 shg:ShbnppGlobalInfrastructureProfessionalInvestmentTypePrivateSpecialAssetInvestmentTrustNo.7To2UsdMember 2021-12-31 0001263043 shg:AssociatesKoreaOmegaShinhanProjectFundIMember 2021-12-31 0001263043 shg:AssociatesStBonanjaFoodTechMember 2021-12-31 0001263043 shg:SamsungSraRealEstateProfessionalPrivate45Member 2021-12-31 0001263043 shg:AssociatesIBKGlobalNewRenewableEnergySpecialAssetProfessionalPrivate2Member 2021-12-31 0001263043 shg:KTCNPGrowthChamp20112PrivateEquityFundMember 2021-12-31 0001263043 shg:AssociatesSHBNPPGreenNewDealEnergyProfessionalInvestmentTypePrivateSpecialAssetInvestmentTrustNo2Member 2021-12-31 0001263043 shg:AssociatesTCoreIndustrialTechnology1stVenturePefMember 2021-12-31 0001263043 shg:AssociatesCuriousFinaleCorporateRecoveryPrivateEquityFundMember 2021-12-31 0001263043 shg:AssociatesTiFirstPropertyPrivateInvestmentTrust1Member 2021-12-31 0001263043 shg:AssociatesMplusProfessionalPrivateRealEstateFund25Member 2021-12-31 0001263043 shg:AssociatesIbkcGlobalContentsInvestmentFundMember 2021-12-31 0001263043 shg:AssociatesNauticSmartNo.6PrivateEquityFundMember 2021-12-31 0001263043 shg:ShBnctProfessionalInvestmentTypePrivateSpecialAssetInvestmentTrustMember 2021-12-31 0001263043 shg:ShMainProfessionalInvestmentTypePrivateMixedAssetInvestmentTrustNo.3Member 2021-12-31 0001263043 shg:AssociatesShSeniorLoanProfessionalInvestmentTypePrivateMixedAssetInvestmentTrustNo.3Member 2021-12-31 0001263043 shg:ShCorporateProfessionalInvestmentTypePrivateSecurityInvestmentTrustNo.7Member 2021-12-31 0001263043 shg:AssociatesKeistoneUnicornPrivateEquityFundMember 2021-12-31 0001263043 shg:AssociatesOthers2020Member 2021-12-31 0001263043 shg:AssociatesIBKCMETISGlobalContentsInvestmentFundMember 2021-12-31 0001263043 shg:AssociatesIGISProfessionalInvestorsPrivateInvestmentRealEstateInvestmentLLCNo395Member 2021-12-31 0001263043 shg:AssociatesShinhanneoCoreIndustrialTechnologyFundMember 2021-12-31 0001263043 shg:AssociatesKiwoomMilestoneUSRealEstateProfessionalPrivate20Member 2021-12-31 0001263043 shg:AssociatesShJapanPhotovoltaicPrivateSpecialAssetInvestmentTrustNo.2Member 2021-12-31 0001263043 shg:AssociatesKoFCNeopluxRDBizCreation20131VentureCapitalFundMember 2021-12-31 0001263043 shg:AssociatesKtcnpGrowthChamp20112PrivateEquityFundMember 2021-12-31 0001263043 shg:AssociatesEdncentralCo.ltdMember 2021-12-31 0001263043 shg:AssociatesSHJigaeNamsanBTOprofessionalInvestmentTypePrivateSpecialAssetInvestmentTrustMember 2021-12-31 0001263043 shg:AssociatesIGIS372RealEstateProfessionalPrivateMember 2021-12-31 0001263043 shg:AssociatesMultiAssetTheUnitedStatesThortonsProfessionalPrivate1Member 2021-12-31 0001263043 shg:AssociatesNewGreenShinhanMezzanineFundMember 2021-12-31 0001263043 shg:AssociatesShJapanPhotovoltaicPrivateSpecialAssetInvestmentTrustNo.1Member 2021-12-31 0001263043 shg:AssociatesShGlobalInfrastructureProfessionalInvestmentTypePrivateSpecialAssetInvestmentTrustNo.72Member 2021-12-31 0001263043 shg:AssociatesDAEKWANGSEMICONDUCTORMember 2021-12-31 0001263043 shg:AssociatesDBEpicConvertiblebondPrivateTrustNo2Member 2021-12-31 0001263043 shg:AssociatesHyungjeArtPrintingMember 2021-12-31 0001263043 shg:AssociatesMultimediaTechCoLtdMember 2021-12-31 0001263043 shg:AssociatesMasternPrivateInvestmentTrust68Member 2021-12-31 0001263043 shg:AssociatesRichmondPrivateInvestmentTrustNo82Member 2021-12-31 0001263043 shg:AssociatesTigerAlternativeRealEstateProfessionalPrivate5Member 2021-12-31 0001263043 shg:AssociatesHanaSemiconductorNewTechnologyFundMember 2021-12-31 0001263043 shg:AssociatesJMagnetStartupVentureSpecializedPrivateEquityFundMember 2021-12-31 0001263043 shg:AssociatesIGISPrivateRealEstateInvestmentTrust286Member 2021-12-31 0001263043 shg:AssociatesPSAEMPPrivateEquityFundMember 2021-12-31 0001263043 shg:AssociatesHanwhaIncusPlusNewTechnologyFundNo1Member 2021-12-31 0001263043 shg:AssociatesUIVentureFund7thMember 2021-12-31 0001263043 shg:AssociatesKORAMKODaumProfessionalPrivateInvestmentTrustNo12Member 2021-12-31 0001263043 shg:AssociatesShSangjuYcExpresswayProfessionalInvestmentTypePrivateSpecialAssetInvestmentTrustMember 2021-12-31 0001263043 shg:AssociatesShDaeguGreenPowerCogenerationSystemProfessionalInvestmentTypePrivateSpecialAssetInvestmentTrustMember 2021-12-31 0001263043 shg:AssociatesShCorporateProfessionalInvestmentTypePrivateSecurityInvestmentTrustNo.45Member 2021-12-31 0001263043 shg:AssociatesKiwoomUnicorn3NewTechnologyBusinessInvestmentFundMember 2021-12-31 0001263043 shg:AssociatesIGISPRIVATEREALESTATETRUSTNO331Member 2021-12-31 0001263043 shg:AssociatesJBPowerTLInvestmentTypePrivatePlacementSpecialAssetFund7Member 2021-12-31 0001263043 shg:AssociatesFindvaluePreIPO6thProfessionalInvestmentTypePrivateInvestmentTrustMember 2021-12-31 0001263043 shg:AssociatesCredianHealthcarePrivateEquityFund2Member 2021-12-31 0001263043 ifrs-full:FinancialGuaranteeContractsMember ifrs-full:LifetimeExpectedCreditLossesMember 2021-12-31 0001263043 ifrs-full:FinancialGuaranteeContractsMember ifrs-full:TwelvemonthExpectedCreditLossesMember 2021-12-31 0001263043 shg:InternalCreditRatingOfBelowBBBPlusMember ifrs-full:LoanCommitmentsMember 2021-12-31 0001263043 ifrs-full:FinancialGuaranteeContractsMember ifrs-full:FinancialInstrumentsCreditimpairedMember 2021-12-31 0001263043 shg:InternalCreditRatingOfBelowBBBPlusMember 2021-12-31 0001263043 ifrs-full:LifetimeExpectedCreditLossesMember shg:InternalCreditRatingOfBelowBBBPlusMember ifrs-full:LoanCommitmentsMember 2021-12-31 0001263043 ifrs-full:FinancialInstrumentsCreditimpairedMember 2021-12-31 0001263043 shg:InternalCreditRatingOfBBBPlusOrAboveMember 2021-12-31 0001263043 ifrs-full:FinancialGuaranteeContractsMember shg:ImpairedMember 2021-12-31 0001263043 ifrs-full:FinancialGuaranteeContractsMember shg:InternalCreditRatingOfBBBPlusOrAboveMember ifrs-full:LifetimeExpectedCreditLossesMember 2021-12-31 0001263043 shg:ImpairedMember ifrs-full:LoanCommitmentsMember 2021-12-31 0001263043 ifrs-full:FinancialGuaranteeContractsMember shg:InternalCreditRatingOfBBBPlusOrAboveMember 2021-12-31 0001263043 ifrs-full:LoanCommitmentsMember shg:InternalCreditRatingOfBBBPlusOrAboveMember ifrs-full:TwelvemonthExpectedCreditLossesMember 2021-12-31 0001263043 ifrs-full:LoanCommitmentsMember ifrs-full:LifetimeExpectedCreditLossesMember 2021-12-31 0001263043 ifrs-full:LoanCommitmentsMember shg:InternalCreditRatingOfBBBPlusOrAboveMember ifrs-full:LifetimeExpectedCreditLossesMember 2021-12-31 0001263043 ifrs-full:LoanCommitmentsMember shg:InternalCreditRatingOfBelowBBBPlusMember ifrs-full:TwelvemonthExpectedCreditLossesMember 2021-12-31 0001263043 ifrs-full:LoanCommitmentsMember ifrs-full:FinancialInstrumentsCreditimpairedMember 2021-12-31 0001263043 ifrs-full:FinancialGuaranteeContractsMember shg:InternalCreditRatingOfBelowBBBPlusMember 2021-12-31 0001263043 ifrs-full:FinancialGuaranteeContractsMember shg:InternalCreditRatingOfBelowBBBPlusMember ifrs-full:TwelvemonthExpectedCreditLossesMember 2021-12-31 0001263043 ifrs-full:LoanCommitmentsMember ifrs-full:TwelvemonthExpectedCreditLossesMember 2021-12-31 0001263043 ifrs-full:FinancialGuaranteeContractsMember shg:InternalCreditRatingOfBBBPlusOrAboveMember ifrs-full:TwelvemonthExpectedCreditLossesMember 2021-12-31 0001263043 ifrs-full:FinancialGuaranteeContractsMember shg:InternalCreditRatingOfBelowBBBPlusMember ifrs-full:LifetimeExpectedCreditLossesMember 2021-12-31 0001263043 ifrs-full:FinancialGuaranteeContractsMember ifrs-full:FinancialInstrumentsCreditimpairedMember shg:ImpairedMember 2021-12-31 0001263043 ifrs-full:LoanCommitmentsMember ifrs-full:FinancialInstrumentsCreditimpairedMember shg:ImpairedMember 2021-12-31 0001263043 ifrs-full:LoanCommitmentsMember shg:InternalCreditRatingOfBBBPlusOrAboveMember 2021-12-31 0001263043 ifrs-full:LaterThanOneYearAndNotLaterThanFiveYearsMember ifrs-full:FinancialAssetsAtAmortisedCostMember 2021-12-31 0001263043 shg:SecuritiesAtFVTPLMember ifrs-full:LaterThanThreeMonthsAndNotLaterThanSixMonthsMember 2021-12-31 0001263043 ifrs-full:NotLaterThanOneMonthMember shg:LoanReceivablesMeasuredAtFVTPLMember 2021-12-31 0001263043 ifrs-full:LaterThanOneYearAndNotLaterThanFiveYearsMember shg:FinancialAssetsClassMember 2021-12-31 0001263043 ifrs-full:LaterThanFiveYearsMember shg:LoanReceivablesMeasuredAtFVTPLMember 2021-12-31 0001263043 ifrs-full:NotLaterThanOneMonthMember shg:DueFromBanksAtFVTPLMember 2021-12-31 0001263043 ifrs-full:NotLaterThanOneMonthMember ifrs-full:FinancialAssetsAtFairValueThroughOtherComprehensiveIncomeCategoryMember 2021-12-31 0001263043 ifrs-full:LaterThanOneYearAndNotLaterThanFiveYearsMember shg:LoanReceivablesMeasuredAtFVTPLMember 2021-12-31 0001263043 shg:OtherFinancialAssetsMember ifrs-full:LaterThanOneMonthAndNotLaterThanThreeMonthsMember 2021-12-31 0001263043 ifrs-full:LaterThanFiveYearsMember ifrs-full:FinancialAssetsAtFairValueThroughOtherComprehensiveIncomeCategoryMember 2021-12-31 0001263043 ifrs-full:LaterThanSixMonthsAndNotLaterThanOneYearMember shg:LoansAtAmortizedCostMember 2021-12-31 0001263043 ifrs-full:LaterThanThreeMonthsAndNotLaterThanSixMonthsMember shg:CashAndDueFromBanksAtAmortizedCostMember 2021-12-31 0001263043 ifrs-full:NotLaterThanOneMonthMember shg:LoansAtAmortizedCostMember 2021-12-31 0001263043 ifrs-full:LaterThanOneMonthAndNotLaterThanThreeMonthsMember shg:SecuritiesAtFVTPLMember 2021-12-31 0001263043 ifrs-full:LaterThanFiveYearsMember shg:SecuritiesAtFVTPLMember 2021-12-31 0001263043 ifrs-full:LaterThanOneYearAndNotLaterThanFiveYearsMember ifrs-full:FinancialAssetsAtFairValueThroughOtherComprehensiveIncomeCategoryMember 2021-12-31 0001263043 ifrs-full:NotLaterThanOneMonthMember ifrs-full:FinancialAssetsAtAmortisedCostMember 2021-12-31 0001263043 shg:OtherFinancialAssetsMember ifrs-full:LaterThanSixMonthsAndNotLaterThanOneYearMember 2021-12-31 0001263043 shg:OtherFinancialAssetsMember ifrs-full:LaterThanFiveYearsMember 2021-12-31 0001263043 ifrs-full:NotLaterThanOneMonthMember shg:FinancialAssetsClassMember 2021-12-31 0001263043 ifrs-full:LaterThanOneMonthAndNotLaterThanThreeMonthsMember shg:FinancialAssetsClassMember 2021-12-31 0001263043 ifrs-full:LaterThanSixMonthsAndNotLaterThanOneYearMember ifrs-full:FinancialAssetsAtAmortisedCostMember 2021-12-31 0001263043 shg:FinancialAssetsClassMember ifrs-full:LaterThanFiveYearsMember 2021-12-31 0001263043 ifrs-full:LaterThanThreeMonthsAndNotLaterThanSixMonthsMember shg:LoansAtAmortizedCostMember 2021-12-31 0001263043 ifrs-full:LaterThanOneMonthAndNotLaterThanThreeMonthsMember shg:CashAndDueFromBanksAtAmortizedCostMember 2021-12-31 0001263043 shg:OtherFinancialAssetsMember ifrs-full:NotLaterThanOneMonthMember 2021-12-31 0001263043 ifrs-full:LaterThanOneMonthAndNotLaterThanThreeMonthsMember ifrs-full:FinancialAssetsAtFairValueThroughOtherComprehensiveIncomeCategoryMember 2021-12-31 0001263043 ifrs-full:NotLaterThanOneMonthMember shg:CashAndDueFromBanksAtAmortizedCostMember 2021-12-31 0001263043 shg:OtherFinancialAssetsMember ifrs-full:LaterThanOneYearAndNotLaterThanFiveYearsMember 2021-12-31 0001263043 ifrs-full:LaterThanOneMonthAndNotLaterThanThreeMonthsMember shg:LoansAtAmortizedCostMember 2021-12-31 0001263043 ifrs-full:LaterThanFiveYearsMember shg:CashAndDueFromBanksAtAmortizedCostMember 2021-12-31 0001263043 ifrs-full:LaterThanThreeMonthsAndNotLaterThanSixMonthsMember ifrs-full:FinancialAssetsAtAmortisedCostMember 2021-12-31 0001263043 ifrs-full:NotLaterThanOneMonthMember shg:SecuritiesAtFVTPLMember 2021-12-31 0001263043 ifrs-full:LaterThanSixMonthsAndNotLaterThanOneYearMember shg:LoanReceivablesMeasuredAtFVTPLMember 2021-12-31 0001263043 shg:LoanReceivablesMeasuredAtFVTPLMember 2021-12-31 0001263043 shg:OtherFinancialAssetsMember ifrs-full:LaterThanThreeMonthsAndNotLaterThanSixMonthsMember 2021-12-31 0001263043 ifrs-full:LaterThanSixMonthsAndNotLaterThanOneYearMember ifrs-full:FinancialAssetsAtFairValueThroughOtherComprehensiveIncomeCategoryMember 2021-12-31 0001263043 ifrs-full:LaterThanThreeMonthsAndNotLaterThanSixMonthsMember shg:FinancialAssetsClassMember 2021-12-31 0001263043 ifrs-full:LaterThanThreeMonthsAndNotLaterThanSixMonthsMember ifrs-full:FinancialAssetsAtFairValueThroughOtherComprehensiveIncomeCategoryMember 2021-12-31 0001263043 ifrs-full:LaterThanFiveYearsMember shg:LoansAtAmortizedCostMember 2021-12-31 0001263043 ifrs-full:LaterThanOneYearAndNotLaterThanFiveYearsMember shg:CashAndDueFromBanksAtAmortizedCostMember 2021-12-31 0001263043 ifrs-full:LaterThanOneMonthAndNotLaterThanThreeMonthsMember ifrs-full:FinancialAssetsAtAmortisedCostMember 2021-12-31 0001263043 ifrs-full:LaterThanOneYearAndNotLaterThanFiveYearsMember shg:SecuritiesAtFVTPLMember 2021-12-31 0001263043 ifrs-full:LaterThanThreeMonthsAndNotLaterThanSixMonthsMember shg:LoanReceivablesMeasuredAtFVTPLMember 2021-12-31 0001263043 ifrs-full:LaterThanSixMonthsAndNotLaterThanOneYearMember shg:CashAndDueFromBanksAtAmortizedCostMember 2021-12-31 0001263043 ifrs-full:LaterThanSixMonthsAndNotLaterThanOneYearMember shg:FinancialAssetsClassMember 2021-12-31 0001263043 ifrs-full:LaterThanOneYearAndNotLaterThanFiveYearsMember shg:LoansAtAmortizedCostMember 2021-12-31 0001263043 ifrs-full:LaterThanOneMonthAndNotLaterThanThreeMonthsMember shg:LoanReceivablesMeasuredAtFVTPLMember 2021-12-31 0001263043 ifrs-full:LaterThanFiveYearsMember ifrs-full:FinancialAssetsAtAmortisedCostMember 2021-12-31 0001263043 ifrs-full:LaterThanSixMonthsAndNotLaterThanOneYearMember shg:SecuritiesAtFVTPLMember 2021-12-31 0001263043 ifrs-full:NotLaterThanOneMonthMember ifrs-full:FinancialLiabilitiesMember 2021-12-31 0001263043 ifrs-full:NotLaterThanOneMonthMember ifrs-full:FinancialLiabilitiesAtFairValueThroughProfitOrLossDesignatedUponInitialRecognitionCategoryMember 2021-12-31 0001263043 ifrs-full:LaterThanFiveYearsMember shg:BorrowingsMember 2021-12-31 0001263043 ifrs-full:LaterThanOneYearAndNotLaterThanFiveYearsMember shg:DepositsMember 2021-12-31 0001263043 ifrs-full:LaterThanThreeMonthsAndNotLaterThanSixMonthsMember shg:OtherFinancialLiabilitiesMember 2021-12-31 0001263043 ifrs-full:LaterThanThreeMonthsAndNotLaterThanSixMonthsMember shg:DebtSecuritiesIssuedMember 2021-12-31 0001263043 ifrs-full:LaterThanFiveYearsMember ifrs-full:FinancialLiabilitiesAtFairValueThroughProfitOrLossDesignatedUponInitialRecognitionCategoryMember 2021-12-31 0001263043 ifrs-full:LaterThanSixMonthsAndNotLaterThanOneYearMember shg:OtherFinancialLiabilitiesMember 2021-12-31 0001263043 ifrs-full:LaterThanOneMonthAndNotLaterThanThreeMonthsMember ifrs-full:FinancialLiabilitiesAtFairValueThroughProfitOrLossCategoryMember 2021-12-31 0001263043 ifrs-full:LaterThanSixMonthsAndNotLaterThanOneYearMember shg:DebtSecuritiesIssuedMember 2021-12-31 0001263043 ifrs-full:LaterThanSixMonthsAndNotLaterThanOneYearMember ifrs-full:FinancialLiabilitiesMember 2021-12-31 0001263043 ifrs-full:LaterThanThreeMonthsAndNotLaterThanSixMonthsMember shg:BorrowingsMember 2021-12-31 0001263043 ifrs-full:LaterThanOneMonthAndNotLaterThanThreeMonthsMember shg:DepositsMember 2021-12-31 0001263043 ifrs-full:LaterThanFiveYearsMember shg:OtherFinancialLiabilitiesMember 2021-12-31 0001263043 ifrs-full:LaterThanSixMonthsAndNotLaterThanOneYearMember ifrs-full:FinancialLiabilitiesAtFairValueThroughProfitOrLossDesignatedUponInitialRecognitionCategoryMember 2021-12-31 0001263043 ifrs-full:NotLaterThanOneMonthMember shg:DebtSecuritiesIssuedMember 2021-12-31 0001263043 ifrs-full:LaterThanThreeMonthsAndNotLaterThanSixMonthsMember ifrs-full:FinancialLiabilitiesMember 2021-12-31 0001263043 ifrs-full:LaterThanThreeMonthsAndNotLaterThanSixMonthsMember shg:DepositsMember 2021-12-31 0001263043 ifrs-full:LaterThanOneYearAndNotLaterThanFiveYearsMember ifrs-full:FinancialLiabilitiesMember 2021-12-31 0001263043 ifrs-full:LaterThanOneYearAndNotLaterThanFiveYearsMember ifrs-full:FinancialLiabilitiesAtFairValueThroughProfitOrLossDesignatedUponInitialRecognitionCategoryMember 2021-12-31 0001263043 ifrs-full:LaterThanOneYearAndNotLaterThanFiveYearsMember shg:BorrowingsMember 2021-12-31 0001263043 ifrs-full:LaterThanSixMonthsAndNotLaterThanOneYearMember shg:BorrowingsMember 2021-12-31 0001263043 ifrs-full:NotLaterThanOneMonthMember shg:OtherFinancialLiabilitiesMember 2021-12-31 0001263043 ifrs-full:LaterThanFiveYearsMember shg:DebtSecuritiesIssuedMember 2021-12-31 0001263043 ifrs-full:NotLaterThanOneMonthMember shg:DepositsMember 2021-12-31 0001263043 ifrs-full:LaterThanFiveYearsMember shg:DepositsMember 2021-12-31 0001263043 ifrs-full:LaterThanThreeMonthsAndNotLaterThanSixMonthsMember ifrs-full:FinancialLiabilitiesAtFairValueThroughProfitOrLossCategoryMember 2021-12-31 0001263043 ifrs-full:LaterThanSixMonthsAndNotLaterThanOneYearMember ifrs-full:FinancialLiabilitiesAtFairValueThroughProfitOrLossCategoryMember 2021-12-31 0001263043 ifrs-full:LaterThanOneMonthAndNotLaterThanThreeMonthsMember shg:BorrowingsMember 2021-12-31 0001263043 ifrs-full:LaterThanOneYearAndNotLaterThanFiveYearsMember shg:DebtSecuritiesIssuedMember 2021-12-31 0001263043 ifrs-full:LaterThanOneMonthAndNotLaterThanThreeMonthsMember ifrs-full:FinancialLiabilitiesAtFairValueThroughProfitOrLossDesignatedUponInitialRecognitionCategoryMember 2021-12-31 0001263043 ifrs-full:LaterThanThreeMonthsAndNotLaterThanSixMonthsMember ifrs-full:FinancialLiabilitiesAtFairValueThroughProfitOrLossDesignatedUponInitialRecognitionCategoryMember 2021-12-31 0001263043 shg:OtherFinancialLiabilitiesMember ifrs-full:LaterThanOneYearAndNotLaterThanFiveYearsMember 2021-12-31 0001263043 ifrs-full:LaterThanOneMonthAndNotLaterThanThreeMonthsMember ifrs-full:FinancialLiabilitiesMember 2021-12-31 0001263043 ifrs-full:LaterThanFiveYearsMember ifrs-full:FinancialLiabilitiesMember 2021-12-31 0001263043 ifrs-full:LaterThanOneYearAndNotLaterThanFiveYearsMember ifrs-full:FinancialLiabilitiesAtFairValueThroughProfitOrLossCategoryMember 2021-12-31 0001263043 ifrs-full:LaterThanOneMonthAndNotLaterThanThreeMonthsMember shg:OtherFinancialLiabilitiesMember 2021-12-31 0001263043 ifrs-full:LaterThanOneMonthAndNotLaterThanThreeMonthsMember shg:DebtSecuritiesIssuedMember 2021-12-31 0001263043 ifrs-full:NotLaterThanOneMonthMember ifrs-full:FinancialLiabilitiesAtFairValueThroughProfitOrLossCategoryMember 2021-12-31 0001263043 ifrs-full:LaterThanSixMonthsAndNotLaterThanOneYearMember shg:DepositsMember 2021-12-31 0001263043 ifrs-full:NotLaterThanOneMonthMember shg:BorrowingsMember 2021-12-31 0001263043 ifrs-full:FinancialAssetsAtAmortisedCostMember shg:InternalCreditRatingOfBelowBBBPlusMember ifrs-full:LifetimeExpectedCreditLossesMember 2021-12-31 0001263043 shg:DueFromBanksAndLoansAtAmortizedCostMember shg:InternalCreditRatingOfBBBPlusOrAboveMember ifrs-full:TwelvemonthExpectedCreditLossesMember 2021-12-31 0001263043 ifrs-full:LifetimeExpectedCreditLossesMember shg:InternalCreditRatingOfBelowBBBPlusMember shg:DueFromBanksAndLoansAtAmortizedCostMember 2021-12-31 0001263043 ifrs-full:TwelvemonthExpectedCreditLossesMember shg:InternalCreditRatingOfBelowBBBPlusMember shg:DueFromBanksAndLoansAtAmortizedCostMember shg:BankingMember 2021-12-31 0001263043 ifrs-full:LifetimeExpectedCreditLossesMember shg:DueFromBanksAndLoansAtAmortizedCostMember shg:InternalCreditRatingOfBBBPlusOrAboveMember ifrs-full:CorporateLoansMember 2021-12-31 0001263043 ifrs-full:LifetimeExpectedCreditLossesMember shg:InternalCreditRatingOfBBBPlusOrAboveMember 2021-12-31 0001263043 ifrs-full:LifetimeExpectedCreditLossesMember shg:InternalCreditRatingOfBBBPlusOrAboveMember shg:DueFromBanksAndLoansAtAmortizedCostMember 2021-12-31 0001263043 ifrs-full:LifetimeExpectedCreditLossesMember shg:DueFromBanksAndLoansAtAmortizedCostMember shg:InternalCreditRatingOfBelowBBBPlusMember shg:CreditCardReceivablesMember 2021-12-31 0001263043 shg:DueFromBanksAndLoansAtAmortizedCostMember ifrs-full:FinancialInstrumentsCreditimpairedMember 2021-12-31 0001263043 shg:InternalCreditRatingOfBelowBBBPlusMember ifrs-full:TwelvemonthExpectedCreditLossesMember 2021-12-31 0001263043 ifrs-full:LifetimeExpectedCreditLossesMember shg:InternalCreditRatingOfBelowBBBPlusMember ifrs-full:FinancialAssetsAtFairValueThroughOtherComprehensiveIncomeCategoryMember 2021-12-31 0001263043 shg:CreditCardReceivablesMember shg:DueFromBanksAndLoansAtAmortizedCostMember shg:InternalCreditRatingOfBelowBBBPlusMember ifrs-full:TwelvemonthExpectedCreditLossesMember 2021-12-31 0001263043 ifrs-full:TwelvemonthExpectedCreditLossesMember shg:InternalCreditRatingOfBBBPlusOrAboveMember shg:DueFromBanksAndLoansAtAmortizedCostMember ifrs-full:CorporateLoansMember 2021-12-31 0001263043 ifrs-full:TwelvemonthExpectedCreditLossesMember shg:InternalCreditRatingOfBBBPlusOrAboveMember shg:DueFromBanksAndLoansAtAmortizedCostMember ifrs-full:ConsumerLoansMember 2021-12-31 0001263043 ifrs-full:LifetimeExpectedCreditLossesMember shg:DueFromBanksAndLoansAtAmortizedCostMember shg:InternalCreditRatingOfBelowBBBPlusMember shg:BankingMember 2021-12-31 0001263043 ifrs-full:FinancialInstrumentsCreditimpairedMember shg:CreditCardReceivablesMember shg:DueFromBanksAndLoansAtAmortizedCostMember 2021-12-31 0001263043 ifrs-full:TwelvemonthExpectedCreditLossesMember shg:InternalCreditRatingOfBBBPlusOrAboveMember shg:DueFromBanksAndLoansAtAmortizedCostMember shg:CreditCardReceivablesMember 2021-12-31 0001263043 ifrs-full:ConsumerLoansMember shg:InternalCreditRatingOfBelowBBBPlusMember shg:DueFromBanksAndLoansAtAmortizedCostMember ifrs-full:LifetimeExpectedCreditLossesMember 2021-12-31 0001263043 ifrs-full:FinancialInstrumentsCreditimpairedMember ifrs-full:ConsumerLoansMember shg:DueFromBanksAndLoansAtAmortizedCostMember 2021-12-31 0001263043 ifrs-full:ConsumerLoansMember shg:DueFromBanksAndLoansAtAmortizedCostMember shg:InternalCreditRatingOfBelowBBBPlusMember ifrs-full:TwelvemonthExpectedCreditLossesMember 2021-12-31 0001263043 ifrs-full:TwelvemonthExpectedCreditLossesMember shg:InternalCreditRatingOfBBBPlusOrAboveMember shg:DueFromBanksAndLoansAtAmortizedCostMember ifrs-full:GovernmentMember 2021-12-31 0001263043 shg:DueFromBanksAndLoansAtAmortizedCostMember shg:InternalCreditRatingOfBelowBBBPlusMember ifrs-full:TwelvemonthExpectedCreditLossesMember 2021-12-31 0001263043 ifrs-full:LifetimeExpectedCreditLossesMember shg:DueFromBanksAndLoansAtAmortizedCostMember shg:InternalCreditRatingOfBBBPlusOrAboveMember shg:CreditCardReceivablesMember 2021-12-31 0001263043 shg:BankingMember shg:DueFromBanksAndLoansAtAmortizedCostMember shg:InternalCreditRatingOfBBBPlusOrAboveMember ifrs-full:TwelvemonthExpectedCreditLossesMember 2021-12-31 0001263043 ifrs-full:LifetimeExpectedCreditLossesMember shg:DueFromBanksAndLoansAtAmortizedCostMember shg:InternalCreditRatingOfBBBPlusOrAboveMember shg:BankingMember 2021-12-31 0001263043 shg:DueFromBanksAndLoansAtAmortizedCostMember shg:BankingMember 2021-12-31 0001263043 ifrs-full:GovernmentMember shg:InternalCreditRatingOfBelowBBBPlusMember shg:DueFromBanksAndLoansAtAmortizedCostMember ifrs-full:LifetimeExpectedCreditLossesMember 2021-12-31 0001263043 ifrs-full:FinancialInstrumentsCreditimpairedMember ifrs-full:CorporateLoansMember shg:DueFromBanksAndLoansAtAmortizedCostMember 2021-12-31 0001263043 ifrs-full:TwelvemonthExpectedCreditLossesMember shg:InternalCreditRatingOfBBBPlusOrAboveMember ifrs-full:FinancialAssetsAtFairValueThroughOtherComprehensiveIncomeCategoryMember 2021-12-31 0001263043 ifrs-full:TwelvemonthExpectedCreditLossesMember shg:InternalCreditRatingOfBBBPlusOrAboveMember ifrs-full:FinancialAssetsAtAmortisedCostMember 2021-12-31 0001263043 shg:InternalCreditRatingOfBBBPlusOrAboveMember ifrs-full:TwelvemonthExpectedCreditLossesMember 2021-12-31 0001263043 shg:InternalCreditRatingOfBelowBBBPlusMember ifrs-full:LifetimeExpectedCreditLossesMember 2021-12-31 0001263043 ifrs-full:FinancialInstrumentsCreditimpairedMember 2021-12-31 0001263043 ifrs-full:TwelvemonthExpectedCreditLossesMember shg:InternalCreditRatingOfBelowBBBPlusMember ifrs-full:FinancialAssetsAtAmortisedCostMember 2021-12-31 0001263043 ifrs-full:TwelvemonthExpectedCreditLossesMember shg:InternalCreditRatingOfBelowBBBPlusMember shg:DueFromBanksAndLoansAtAmortizedCostMember ifrs-full:GovernmentMember 2021-12-31 0001263043 ifrs-full:LifetimeExpectedCreditLossesMember shg:DueFromBanksAndLoansAtAmortizedCostMember shg:InternalCreditRatingOfBBBPlusOrAboveMember ifrs-full:GovernmentMember 2021-12-31 0001263043 ifrs-full:TwelvemonthExpectedCreditLossesMember shg:InternalCreditRatingOfBelowBBBPlusMember ifrs-full:FinancialAssetsAtFairValueThroughOtherComprehensiveIncomeCategoryMember 2021-12-31 0001263043 ifrs-full:LifetimeExpectedCreditLossesMember shg:DueFromBanksAndLoansAtAmortizedCostMember shg:InternalCreditRatingOfBelowBBBPlusMember ifrs-full:CorporateLoansMember 2021-12-31 0001263043 ifrs-full:TwelvemonthExpectedCreditLossesMember shg:InternalCreditRatingOfBelowBBBPlusMember shg:DueFromBanksAndLoansAtAmortizedCostMember ifrs-full:CorporateLoansMember 2021-12-31 0001263043 ifrs-full:LifetimeExpectedCreditLossesMember shg:DueFromBanksAndLoansAtAmortizedCostMember shg:InternalCreditRatingOfBBBPlusOrAboveMember ifrs-full:ConsumerLoansMember 2021-12-31 0001263043 ifrs-full:DerivativesMember ifrs-full:LaterThanFiveYearsMember 2021-12-31 0001263043 ifrs-full:DerivativesMember ifrs-full:LaterThanThreeMonthsAndNotLaterThanSixMonthsMember 2021-12-31 0001263043 ifrs-full:DerivativesMember ifrs-full:LaterThanOneYearAndNotLaterThanFiveYearsMember 2021-12-31 0001263043 ifrs-full:DerivativesMember ifrs-full:LaterThanOneMonthAndNotLaterThanThreeMonthsMember 2021-12-31 0001263043 ifrs-full:DerivativesMember ifrs-full:NotLaterThanOneMonthMember 2021-12-31 0001263043 ifrs-full:DerivativesMember ifrs-full:LaterThanSixMonthsAndNotLaterThanOneYearMember 2021-12-31 0001263043 shg:CmaMember 2021-12-31 0001263043 shg:GoldDepositsMember 2021-12-31 0001263043 shg:DueFromBanksAtFairValueMember 2021-12-31 0001263043 ifrs-full:DebtSecuritiesMember 2021-12-31 0001263043 shg:BeneficiaryCertificatesMember 2021-12-31 0001263043 shg:CorporationMember 2021-12-31 0001263043 ifrs-full:TradingEquitySecuritiesMember 2021-12-31 0001263043 shg:CommercialpaperMember 2021-12-31 0001263043 shg:OthersMember 2021-12-31 0001263043 ifrs-full:EquityInvestmentsMember 2021-12-31 0001263043 shg:ExcludeOtherInstrumentsMember 2021-12-31 0001263043 shg:StocksMember 2021-12-31 0001263043 shg:PutoptionMember 2021-12-31 0001263043 shg:OtherdebtsecuritiesMember 2021-12-31 0001263043 shg:FinancialinstitutionsborrowerMember 2021-12-31 0001263043 shg:EquityInvestmentWithPutOptionMember 2021-12-31 0001263043 ifrs-full:GovernmentMember 2021-12-31 0001263043 ifrs-full:OtherEquitySecuritiesMember 2021-12-31 0001263043 shg:LoansAtFairValueThroughProfitLossMember 2021-12-31 0001263043 shg:SecuritiesAtFVTPLMember 2021-12-31 0001263043 shg:DueFromBanksAtFVTPLMember 2021-12-31 0001263043 ifrs-full:CurrencyRiskMember ifrs-full:LaterThanOneYearAndNotLaterThanTwoYearsMember 2021-12-31 0001263043 ifrs-full:CurrencyRiskMember ifrs-full:LaterThanFiveYearsMember 2021-12-31 0001263043 ifrs-full:CurrencyRiskMember 2021-12-31 0001263043 ifrs-full:InterestRateRiskMember ifrs-full:LaterThanFourYearsAndNotLaterThanFiveYearsMember 2021-12-31 0001263043 ifrs-full:CurrencyRiskMember ifrs-full:LaterThanFourYearsAndNotLaterThanFiveYearsMember 2021-12-31 0001263043 ifrs-full:InterestRateRiskMember 2021-12-31 0001263043 ifrs-full:InterestRateRiskMember ifrs-full:LaterThanFiveYearsMember 2021-12-31 0001263043 ifrs-full:CurrencyRiskMember ifrs-full:LaterThanThreeYearsAndNotLaterThanFourYearsMember 2021-12-31 0001263043 ifrs-full:InterestRateRiskMember ifrs-full:NotLaterThanOneYearMember 2021-12-31 0001263043 ifrs-full:CurrencyRiskMember ifrs-full:LaterThanTwoYearsAndNotLaterThanThreeYearsMember 2021-12-31 0001263043 ifrs-full:CurrencyRiskMember ifrs-full:NotLaterThanOneYearMember 2021-12-31 0001263043 ifrs-full:InterestRateRiskMember ifrs-full:LaterThanOneYearAndNotLaterThanTwoYearsMember 2021-12-31 0001263043 ifrs-full:InterestRateRiskMember ifrs-full:LaterThanTwoYearsAndNotLaterThanThreeYearsMember 2021-12-31 0001263043 ifrs-full:InterestRateRiskMember ifrs-full:LaterThanThreeYearsAndNotLaterThanFourYearsMember 2021-12-31 0001263043 shg:FinancialInstitutionsBondsMember 2021-12-31 0001263043 shg:EquitySecuritiesMember 2021-12-31 0001263043 shg:CorporateBondsAndOthersMember 2021-12-31 0001263043 shg:HedgeOfNetInvestmentMember ifrs-full:LongtermBorrowingsMember 2021-12-31 0001263043 shg:HedgeOfNetInvestmentMember ifrs-full:ForwardContractMember 2021-12-31 0001263043 ifrs-full:ReserveOfCashFlowHedgesMember ifrs-full:ForwardContractMember 2021-12-31 0001263043 ifrs-full:ReserveOfCashFlowHedgesMember ifrs-full:InterestRateSwapContractMember 2021-12-31 0001263043 ifrs-full:FairValueHedgesMember ifrs-full:ForwardContractMember 2021-12-31 0001263043 ifrs-full:FairValueHedgesMember ifrs-full:InterestRateSwapContractMember 2021-12-31 0001263043 ifrs-full:CurrencySwapContractMember ifrs-full:ReserveOfCashFlowHedgesMember 2021-12-31 0001263043 ifrs-full:FairValueHedgesMember ifrs-full:InterestRateRiskMember 2021-12-31 0001263043 ifrs-full:CashFlowHedgesMember ifrs-full:InterestRateRiskMember 2021-12-31 0001263043 ifrs-full:FairValueHedgesMember shg:ForeignExchangeRiskMember 2021-12-31 0001263043 ifrs-full:CashFlowHedgesMember shg:ForeignExchangeRiskMember 2021-12-31 0001263043 ifrs-full:FinancialLiabilitiesAtFairValueThroughProfitOrLossDesignatedUponInitialRecognitionCategoryMember 2021-12-31 0001263043 shg:DerivativesCombinedSecuritiesSoldMember 2021-12-31 0001263043 shg:EquityLinkedSecuritiesSoldMember 2021-12-31 0001263043 shg:MunicipalBondsMember 2021-12-31 0001263043 shg:GoldDepositsMember 2021-12-31 0001263043 shg:SecuritiesSoldMember 2021-12-31 0001263043 shg:StocksMember 2021-12-31 0001263043 shg:OtherSecuritiesSoldMember 2021-12-31 0001263043 ifrs-full:AccumulatedDepreciationAndAmortisationMember ifrs-full:VehiclesMember 2021-12-31 0001263043 ifrs-full:AccumulatedDepreciationAndAmortisationMember ifrs-full:LandAndBuildingsMember 2021-12-31 0001263043 ifrs-full:AccumulatedDepreciationAndAmortisationMember ifrs-full:OtherAssetsMember 2021-12-31 0001263043 ifrs-full:OtherAssetsMember 2021-12-31 0001263043 ifrs-full:VehiclesMember 2021-12-31 0001263043 ifrs-full:LandAndBuildingsMember 2021-12-31 0001263043 shg:AcquisitionRelatedCostsMember ifrs-full:OtherAssetsMember 2021-12-31 0001263043 shg:AcquisitionRelatedCostsMember ifrs-full:VehiclesMember 2021-12-31 0001263043 shg:AcquisitionRelatedCostsMember ifrs-full:LandAndBuildingsMember 2021-12-31 0001263043 ifrs-full:OrdinarySharesMember 2021-12-31 0001263043 ifrs-full:PreferenceSharesMember 2021-12-31 0001263043 shg:EURIBOR3MMember 2021-12-31 0001263043 shg:USD1MLIBORMember 2021-12-31 0001263043 shg:USD3MLIBORMember 2021-12-31 0001263043 shg:EURIBOR1MMember 2021-12-31 0001263043 shg:KRW3MCDMember 2021-12-31 0001263043 shg:TreasuryStockMember 2021-12-31 0001263043 shg:SubsidiaryShinhanBankMember shg:AirliftpassengerMember 2021-12-31 0001263043 shg:SubsidiaryShinhanBankMember shg:ArtRelatedMember 2021-12-31 0001263043 shg:SubsidiaryShinhanBankMember shg:TravelMember 2021-12-31 0001263043 shg:SubsidiaryShinhanBankMember shg:OilPetroleumrefineryMember 2021-12-31 0001263043 shg:SubsidiaryShinhanBankMember shg:ClothingManufacturingMember 2021-12-31 0001263043 shg:SubsidiaryShinhanBankMember shg:MovietheaterMember 2021-12-31 0001263043 shg:SubsidiaryShinhanBankMember shg:LodgingAndRestaurantMember 2021-12-31 0001263043 shg:YouthTrainingFacilitiesBusinessMember shg:SubsidiaryJejuBankMember 2021-12-31 0001263043 shg:AirliftpassengerMember shg:SubsidiaryJejuBankMember 2021-12-31 0001263043 shg:BusBusinessMember shg:SubsidiaryJejuBankMember 2021-12-31 0001263043 shg:SubsidiaryJejuBankMember shg:LodgingAndRestaurantMember 2021-12-31 0001263043 shg:ArtRelatedMember shg:SubsidiaryJejuBankMember 2021-12-31 0001263043 shg:SubsidiaryJejuBankMember shg:LeisureRelatedServiceIndustryMember 2021-12-31 0001263043 shg:BathBusinessMember shg:SubsidiaryJejuBankMember 2021-12-31 0001263043 shg:MovietheaterMember shg:SubsidiaryJejuBankMember 2021-12-31 0001263043 shg:SubsidiaryShinhanCardMember shg:RetailCustomersMember 2021-12-31 0001263043 shg:DownsideScenarioMember shg:FY20224QMember 2021-12-31 0001263043 shg:DownsideScenarioMember shg:FY20221QMember 2021-12-31 0001263043 shg:CentralScenarioMember shg:FY20214QMember 2021-12-31 0001263043 shg:CentralScenarioMember shg:FY20223QMember 2021-12-31 0001263043 shg:CentralScenarioMember shg:FY20222QMember 2021-12-31 0001263043 shg:CentralScenarioMember shg:FY20221QMember 2021-12-31 0001263043 shg:CentralScenarioMember shg:FY20224QMember 2021-12-31 0001263043 shg:UpsideScenarioMember shg:FY20214QMember 2021-12-31 0001263043 shg:UpsideScenarioMember shg:FY20223QMember 2021-12-31 0001263043 shg:DownsideScenarioMember shg:FY20222QMember 2021-12-31 0001263043 shg:DownsideScenarioMember shg:FY20223QMember 2021-12-31 0001263043 shg:DownsideScenarioMember shg:FY20214QMember 2021-12-31 0001263043 shg:UpsideScenarioMember shg:FY20222QMember 2021-12-31 0001263043 shg:UpsideScenarioMember shg:FY20221QMember 2021-12-31 0001263043 shg:UpsideScenarioMember shg:FY20224QMember 2021-12-31 0001263043 ifrs-full:LaterThanOneYearAndNotLaterThanThreeYearsMember 2021-12-31 0001263043 shg:LaterThanTenYearsAndNotLaterThanTwentyYearsMember 2021-12-31 0001263043 ifrs-full:LaterThanSevenYearsAndNotLaterThanTenYearsMember 2021-12-31 0001263043 shg:LaterThanThreeYearAndNotLaterThanSevenYearsMember 2021-12-31 0001263043 shg:LaterThanTwentyYearsMember 2021-12-31 0001263043 ifrs-full:Level3OfFairValueHierarchyMember shg:DerivativeFinancialInstrumentsAssetsMember shg:InterestRateContractMember 2021-12-31 0001263043 shg:DesignatedAsHedgingInstrumentMember shg:DerivativeFinancialInstrumentsAssetsMember ifrs-full:Level2OfFairValueHierarchyMember 2021-12-31 0001263043 ifrs-full:Level2OfFairValueHierarchyMember shg:DerivativeFinancialInstrumentsAssetsMember shg:NotDesignatedAsHedgingInstrumentTradingMember 2021-12-31 0001263043 ifrs-full:Level3OfFairValueHierarchyMember shg:DerivativeFinancialInstrumentsAssetsMember shg:CreditAndCommodityContractMember 2021-12-31 0001263043 ifrs-full:Level3OfFairValueHierarchyMember shg:DerivativeFinancialInstrumentsAssetsMember shg:EquityAndForeignExchangeContractMember 2021-12-31 0001263043 shg:SubsidiaryShinhanLifeInsuranceMember shg:NonparticipatingLifeInsurancePolicyMember ifrs-full:FixedInterestRateMember 2021-12-31 0001263043 ifrs-full:FloatingInterestRateMember shg:NonparticipatingLifeInsurancePolicyMember shg:SubsidiaryShinhanLifeInsuranceMember 2021-12-31 0001263043 shg:SubsidiaryShinhanLifeInsuranceMember 2021-12-31 0001263043 ifrs-full:FixedInterestRateMember shg:ParticipatingLifeInsurancePolicyMember shg:SubsidiaryShinhanLifeInsuranceMember 2021-12-31 0001263043 shg:SubsidiaryShinhanLifeInsuranceMember shg:ParticipatingLifeInsurancePolicyMember ifrs-full:FloatingInterestRateMember 2021-12-31 0001263043 shg:SubsidiaryShinhanLifeInsuranceMember shg:VariableTypeMember 2021-12-31 0001263043 shg:GeneralInsuranceMember 2021-12-31 0001263043 shg:LongtermMember 2021-12-31 0001263043 shg:DebtSecuritiesAtAmortisedCostMember 2021-12-31 0001263043 shg:DebtSecuritiesAtAmortisedCostMember ifrs-full:TwelvemonthExpectedCreditLossesMember 2021-12-31 0001263043 ifrs-full:FinancialAssetsAtFairValueThroughOtherComprehensiveIncomeCategoryMember ifrs-full:LifetimeExpectedCreditLossesMember 2021-12-31 0001263043 ifrs-full:FinancialAssetsAtFairValueThroughOtherComprehensiveIncomeCategoryMember ifrs-full:TwelvemonthExpectedCreditLossesMember 2021-12-31 0001263043 shg:DebtSecuritiesAtAmortisedCostMember ifrs-full:LifetimeExpectedCreditLossesMember 2021-12-31 0001263043 ifrs-full:CountryOfDomicileMember 2021-12-31 0001263043 ifrs-full:ForeignCountriesMember 2021-12-31 0001263043 shg:DomesticCurrencyMember 2021-12-31 0001263043 shg:DomesticCurrencyMember 2021-12-31 0001263043 ifrs-full:FinancialGuaranteeContractsMember ifrs-full:FinancialInstrumentsCreditimpairedMember 2021-12-31 0001263043 ifrs-full:ProvisionForCreditCommitmentsMember ifrs-full:TwelvemonthExpectedCreditLossesMember 2021-12-31 0001263043 ifrs-full:ProvisionForCreditCommitmentsMember ifrs-full:FinancialInstrumentsCreditimpairedMember 2021-12-31 0001263043 ifrs-full:FinancialGuaranteeContractsMember ifrs-full:TwelvemonthExpectedCreditLossesMember 2021-12-31 0001263043 ifrs-full:FinancialGuaranteeContractsMember ifrs-full:LifetimeExpectedCreditLossesMember 2021-12-31 0001263043 shg:ProvisionForUnusedCreditCommitmentsAndFinancialGuaranteeContractsIssuedMember 2021-12-31 0001263043 ifrs-full:ProvisionForCreditCommitmentsMember ifrs-full:LifetimeExpectedCreditLossesMember 2021-12-31 0001263043 ifrs-full:AssociatesMember 2021-12-31 0001263043 shg:ShinhanGlobalHealthcareFund2Member 2021-12-31 0001263043 ifrs-full:InvestmentFundsMember shg:OtherLiabilitiesMember 2021-12-31 0001263043 shg:StructuredFinancingMember ifrs-full:DerivativesMember 2021-12-31 0001263043 ifrs-full:DerivativesMember 2021-12-31 0001263043 ifrs-full:AssetbackedFinancingsMember ifrs-full:DerivativesMember 2021-12-31 0001263043 ifrs-full:InvestmentFundsMember ifrs-full:DerivativesMember 2021-12-31 0001263043 shg:StructuredFinancingMember shg:OtherLiabilitiesMember 2021-12-31 0001263043 ifrs-full:AssetbackedFinancingsMember shg:OtherLiabilitiesMember 2021-12-31 0001263043 shg:OtherLiabilitiesMember 2021-12-31 0001263043 shg:CreditCardMember ifrs-full:TopOfRangeMember ifrs-full:InterestRateRiskMember 2021-12-31 0001263043 shg:CreditCardMember ifrs-full:BottomOfRangeMember ifrs-full:InterestRateRiskMember 2021-12-31 0001263043 ifrs-full:CurrencyRiskMember ifrs-full:WeightedAverageMember shg:ConsolidatedEntitiesMember 2021-12-31 0001263043 ifrs-full:BottomOfRangeMember shg:ConsolidatedEntitiesMember 2021-12-31 0001263043 ifrs-full:InterestRateRiskMember shg:DateOfEndOfReportingPeriodMember shg:ConsolidatedEntitiesMember 2021-12-31 0001263043 shg:ConsolidatedEntitiesMember shg:DateOfEndOfReportingPeriodMember ifrs-full:CurrencyRiskMember 2021-12-31 0001263043 ifrs-full:CommodityPriceRiskMember ifrs-full:TopOfRangeMember shg:ConsolidatedEntitiesMember 2021-12-31 0001263043 ifrs-full:EquityPriceRiskMember ifrs-full:WeightedAverageMember shg:ConsolidatedEntitiesMember 2021-12-31 0001263043 ifrs-full:TopOfRangeMember shg:ConsolidatedEntitiesMember 2021-12-31 0001263043 ifrs-full:InterestRateRiskMember ifrs-full:BottomOfRangeMember shg:ConsolidatedEntitiesMember 2021-12-31 0001263043 ifrs-full:CommodityPriceRiskMember ifrs-full:BottomOfRangeMember shg:ConsolidatedEntitiesMember 2021-12-31 0001263043 shg:ConsolidatedEntitiesMember ifrs-full:WeightedAverageMember shg:OptionVolatilityMember 2021-12-31 0001263043 shg:DateOfEndOfReportingPeriodMember shg:ConsolidatedEntitiesMember 2021-12-31 0001263043 shg:OptionVolatilityMember ifrs-full:TopOfRangeMember shg:ConsolidatedEntitiesMember 2021-12-31 0001263043 ifrs-full:EquityPriceRiskMember ifrs-full:TopOfRangeMember shg:ConsolidatedEntitiesMember 2021-12-31 0001263043 ifrs-full:EquityPriceRiskMember ifrs-full:BottomOfRangeMember shg:ConsolidatedEntitiesMember 2021-12-31 0001263043 ifrs-full:InterestRateRiskMember ifrs-full:WeightedAverageMember shg:ConsolidatedEntitiesMember 2021-12-31 0001263043 ifrs-full:WeightedAverageMember shg:ConsolidatedEntitiesMember 2021-12-31 0001263043 shg:ConsolidatedEntitiesMember shg:DateOfEndOfReportingPeriodMember ifrs-full:CommodityPriceRiskMember 2021-12-31 0001263043 ifrs-full:CurrencyRiskMember ifrs-full:TopOfRangeMember shg:ConsolidatedEntitiesMember 2021-12-31 0001263043 ifrs-full:InterestRateRiskMember ifrs-full:TopOfRangeMember shg:ConsolidatedEntitiesMember 2021-12-31 0001263043 shg:OptionVolatilityMember shg:DateOfEndOfReportingPeriodMember shg:ConsolidatedEntitiesMember 2021-12-31 0001263043 shg:OptionVolatilityMember ifrs-full:BottomOfRangeMember shg:ConsolidatedEntitiesMember 2021-12-31 0001263043 ifrs-full:CommodityPriceRiskMember ifrs-full:WeightedAverageMember shg:ConsolidatedEntitiesMember 2021-12-31 0001263043 ifrs-full:CurrencyRiskMember ifrs-full:BottomOfRangeMember shg:ConsolidatedEntitiesMember 2021-12-31 0001263043 ifrs-full:EquityPriceRiskMember shg:DateOfEndOfReportingPeriodMember shg:ConsolidatedEntitiesMember 2021-12-31 0001263043 shg:CreditCardMember shg:DateOfEndOfReportingPeriodMember ifrs-full:InterestRateRiskMember 2021-12-31 0001263043 shg:CreditCardMember ifrs-full:WeightedAverageMember ifrs-full:InterestRateRiskMember 2021-12-31 0001263043 ifrs-full:Level3OfFairValueHierarchyMember shg:DerivativeFinancialInstrumentsLiabilitiesMember shg:CreditAndCommodityContractMember 2021-12-31 0001263043 ifrs-full:Level3OfFairValueHierarchyMember shg:DerivativeFinancialInstrumentsLiabilitiesMember shg:InterestRateContractMember 2021-12-31 0001263043 ifrs-full:Level3OfFairValueHierarchyMember shg:DerivativeFinancialInstrumentsLiabilitiesMember shg:EquityAndForeignExchangeContractMember 2021-12-31 0001263043 ifrs-full:Level3OfFairValueHierarchyMember ifrs-full:FinancialLiabilitiesAtFairValueThroughProfitOrLossDesignatedUponInitialRecognitionCategoryMember 2021-12-31 0001263043 ifrs-full:Level2OfFairValueHierarchyMember ifrs-full:FinancialLiabilitiesAtFairValueThroughProfitOrLossDesignatedUponInitialRecognitionCategoryMember 2021-12-31 0001263043 ifrs-full:NotLaterThanOneMonthMember shg:OffBalanceMember 2021-12-31 0001263043 shg:OtherLiabilitiesRelatedToLoanCommitmentsMember ifrs-full:NotLaterThanOneMonthMember 2021-12-31 0001263043 ifrs-full:FinancialGuaranteeContractsMember ifrs-full:NotLaterThanOneMonthMember 2021-12-31 0001263043 shg:OffBalanceMember 2021-12-31 0001263043 shg:OtherLiabilitiesRelatedToLoanCommitmentsMember 2021-12-31 0001263043 shg:LoansAtAmortizedCostMember shg:CreditCardReceivablesMember ifrs-full:LifetimeExpectedCreditLossesMember 2021-12-31 0001263043 shg:LoansAtAmortizedCostMember shg:CreditCardReceivablesMember ifrs-full:FinancialInstrumentsCreditimpairedMember 2021-12-31 0001263043 shg:LoansAtAmortizedCostMember ifrs-full:ConsumerLoansMember ifrs-full:TwelvemonthExpectedCreditLossesMember 2021-12-31 0001263043 shg:DueFromBanksAtAmortizedCostAndOtherFinancialAssetsMember ifrs-full:TwelvemonthExpectedCreditLossesMember 2021-12-31 0001263043 shg:LoansAtAmortizedCostMember ifrs-full:ConsumerLoansMember ifrs-full:LifetimeExpectedCreditLossesMember 2021-12-31 0001263043 shg:LoansAtAmortizedCostMember ifrs-full:CorporateLoansMember ifrs-full:TwelvemonthExpectedCreditLossesMember 2021-12-31 0001263043 shg:LoansAtAmortizedCostMember ifrs-full:CorporateLoansMember ifrs-full:FinancialInstrumentsCreditimpairedMember 2021-12-31 0001263043 shg:LoansAtAmortizedCostMember ifrs-full:CorporateLoansMember ifrs-full:LifetimeExpectedCreditLossesMember 2021-12-31 0001263043 shg:LoansAtAmortizedCostMember shg:OtherFinancialAssetsMember ifrs-full:TwelvemonthExpectedCreditLossesMember 2021-12-31 0001263043 shg:LoansAtAmortizedCostMember shg:OtherFinancialAssetsMember ifrs-full:LifetimeExpectedCreditLossesMember 2021-12-31 0001263043 shg:LoansAtAmortizedCostMember ifrs-full:ConsumerLoansMember ifrs-full:FinancialInstrumentsCreditimpairedMember 2021-12-31 0001263043 shg:LoansAtAmortizedCostMember 2021-12-31 0001263043 ifrs-full:FinancialInstrumentsCreditimpairedMember shg:DueFromBanksAtAmortizedCostAndOtherFinancialAssetsMember 2021-12-31 0001263043 shg:DueFromBanksAtAmortizedCostAndOtherFinancialAssetsMember ifrs-full:LifetimeExpectedCreditLossesMember 2021-12-31 0001263043 shg:DueFromBanksAtAmortizedCostAndOtherFinancialAssetsMember 2021-12-31 0001263043 shg:LoansAtAmortizedCostMember shg:OtherFinancialAssetsMember ifrs-full:FinancialInstrumentsCreditimpairedMember 2021-12-31 0001263043 shg:LoansAtAmortizedCostMember shg:CreditCardReceivablesMember ifrs-full:TwelvemonthExpectedCreditLossesMember 2021-12-31 0001263043 shg:DesignatedAsHedgingInstrumentMember 2021-12-31 0001263043 ifrs-full:FinancialLiabilitiesAtAmortisedCostCategoryMember 2021-12-31 0001263043 ifrs-full:FinancialLiabilitiesAtFairValueThroughProfitOrLossCategoryMember 2021-12-31 0001263043 shg:SeriesQMember 2021-12-31 0001263043 shg:SeriesPMember 2021-12-31 0001263043 shg:SeriesOMember 2021-12-31 0001263043 shg:SeriesNMember 2021-12-31 0001263043 shg:SeriesMMember 2021-12-31 0001263043 shg:SeriesLMember 2021-12-31 0001263043 shg:SeriesKMember 2021-12-31 0001263043 shg:SeriesJMember 2021-12-31 0001263043 shg:SeriesIMember 2021-12-31 0001263043 shg:SeriesHMember 2021-12-31 0001263043 shg:SeriesGMember 2021-12-31 0001263043 shg:SeriesFMember 2021-12-31 0001263043 shg:SeriesEMember 2021-12-31 0001263043 shg:SeriesDMember 2021-12-31 0001263043 shg:SeriesCMember 2021-12-31 0001263043 shg:SeriesBMember 2021-12-31 0001263043 shg:ShinhanEzGeneralInsuranceLtdMember 2021-12-31 0001263043 shg:ForeignCurrencyMember shg:CorporateDebtSecuritiesMember 2021-12-31 0001263043 shg:DomesticCurrencyMember shg:CorporateDebtSecuritiesMember 2021-12-31 0001263043 shg:DomesticCurrencyMember 2021-12-31 0001263043 shg:ForeignCurrencyMember shg:SubordinatedDebtMember 2021-12-31 0001263043 shg:DomesticCurrencyMember shg:SubordinatedDebtMember 2021-12-31 0001263043 shg:ForeignCurrencyMember 2021-12-31 0001263043 shg:LifeInsuranceMember 2021-12-31 0001263043 shg:SecuritiesMember 2021-12-31 0001263043 shg:CreditCardMember 2021-12-31 0001263043 shg:ShinhanBankMember 2021-12-31 0001263043 shg:OneShinhanGlobalFund1Member 2021-12-31 0001263043 shg:EDNCENTRALCoLtdMember 2021-12-31 0001263043 shg:ShinhanSmilegateGlobalPefIMember 2021-12-31 0001263043 shg:AssociatesSHINHANCORETRENDGLOBALFUND1Member 2021-12-31 0001263043 shg:AssociatesBNPParibasCardifLifeInsuranceMember 2021-12-31 0001263043 shg:ForeignCurrencyMember 2021-12-31 0001263043 shg:BorrowingsFromBanksMember 2021-12-31 0001263043 shg:DomesticCurrencyMember 2021-12-31 0001263043 shg:CallMoneyMember 2021-12-31 0001263043 shg:BorrowingsFromBankOfKoreaMember 2021-12-31 0001263043 shg:BillsSoldMember 2021-12-31 0001263043 shg:OthersBorrowingsInForeignCurrencyMember 2021-12-31 0001263043 shg:OthersBorrowingsInWonMember 2021-12-31 0001263043 shg:RepurchaseAgreementsMember 2021-12-31 0001263043 shg:OverdraftDueToBanksMember 2021-12-31 0001263043 ifrs-full:LaterThanThreeMonthsAndNotLaterThanSixMonthsMember ifrs-full:VehiclesMember 2021-12-31 0001263043 ifrs-full:LaterThanSixMonthsAndNotLaterThanOneYearMember ifrs-full:LandAndBuildingsMember 2021-12-31 0001263043 ifrs-full:NotLaterThanOneMonthMember ifrs-full:LandAndBuildingsMember 2021-12-31 0001263043 ifrs-full:LaterThanSixMonthsAndNotLaterThanOneYearMember ifrs-full:VehiclesMember 2021-12-31 0001263043 ifrs-full:LaterThanOneYearAndNotLaterThanFiveYearsMember 2021-12-31 0001263043 ifrs-full:LaterThanSixMonthsAndNotLaterThanOneYearMember ifrs-full:OtherAssetsMember 2021-12-31 0001263043 ifrs-full:NotLaterThanOneMonthMember ifrs-full:OtherAssetsMember 2021-12-31 0001263043 ifrs-full:LaterThanOneYearAndNotLaterThanFiveYearsMember ifrs-full:VehiclesMember 2021-12-31 0001263043 ifrs-full:NotLaterThanOneMonthMember ifrs-full:VehiclesMember 2021-12-31 0001263043 ifrs-full:LaterThanOneYearAndNotLaterThanFiveYearsMember ifrs-full:LandAndBuildingsMember 2021-12-31 0001263043 ifrs-full:LaterThanFiveYearsMember 2021-12-31 0001263043 ifrs-full:LaterThanThreeMonthsAndNotLaterThanSixMonthsMember 2021-12-31 0001263043 ifrs-full:LaterThanFiveYearsMember ifrs-full:VehiclesMember 2021-12-31 0001263043 ifrs-full:LaterThanOneMonthAndNotLaterThanThreeMonthsMember ifrs-full:VehiclesMember 2021-12-31 0001263043 ifrs-full:LaterThanFiveYearsMember ifrs-full:LandAndBuildingsMember 2021-12-31 0001263043 ifrs-full:LaterThanOneMonthAndNotLaterThanThreeMonthsMember ifrs-full:LandAndBuildingsMember 2021-12-31 0001263043 ifrs-full:LaterThanThreeMonthsAndNotLaterThanSixMonthsMember ifrs-full:OtherAssetsMember 2021-12-31 0001263043 ifrs-full:LaterThanFiveYearsMember ifrs-full:OtherAssetsMember 2021-12-31 0001263043 ifrs-full:LaterThanOneMonthAndNotLaterThanThreeMonthsMember 2021-12-31 0001263043 ifrs-full:LaterThanThreeMonthsAndNotLaterThanSixMonthsMember ifrs-full:LandAndBuildingsMember 2021-12-31 0001263043 ifrs-full:LaterThanOneMonthAndNotLaterThanThreeMonthsMember ifrs-full:OtherAssetsMember 2021-12-31 0001263043 ifrs-full:LaterThanOneYearAndNotLaterThanFiveYearsMember ifrs-full:OtherAssetsMember 2021-12-31 0001263043 ifrs-full:NotLaterThanOneMonthMember 2021-12-31 0001263043 ifrs-full:LaterThanSixMonthsAndNotLaterThanOneYearMember 2021-12-31 0001263043 shg:GoduckGangil10PFVCoLtdMember 2021-12-31 0001263043 shg:AssociatesGoduckGangil1PFVCoLtdMember 2021-12-31 0001263043 shg:LogisvalleyShinhanReitCo.ltd.Member 2021-12-31 0001263043 shg:AssociatesIMMGlobalPrivateEquityFundMember 2021-12-31 0001263043 shg:ForeignCurrencyMember shg:GainLossOnFairValueHedgesMember 2021-12-31 0001263043 shg:GainLossOnFairValueHedgesMember shg:DomesticCurrencyMember 2021-12-31 0001263043 ifrs-full:HedgesOfNetInvestmentInForeignOperationsMember shg:ForeignExchangeRiskMember 2021-12-31 0001263043 shg:ShGlobalNetZeroSolutionSecurityInvestmentTrustMember 2021-12-31 0001263043 shg:ShSustainableManagementEsgShortTermBondSecurityFeederInvestmentTrustNo.1Member 2021-12-31 0001263043 shg:GyeonggiNeopluxSupermanFundMember 2021-12-31 0001263043 shg:KTCNPGrowthChamp20112PrivateEquityFundMember 2021-12-31 0001263043 shg:SHINHANNEOCoreIndustrialTechnologyFundMember 2021-12-31 0001263043 shg:ShinhanNeopluxEnergyNewbizFundMember 2021-12-31 0001263043 shg:ShinhanNeoMarketfrontier2ndFundMember 2021-12-31 0001263043 shg:NeopluxNo3PrivateEquityFundMember 2021-12-31 0001263043 shg:FutureCreationNeopluxVentureCapitalFundMember 2021-12-31 0001263043 shg:NeopluxMarketFrontierSecondaryFundMember 2021-12-31 0001263043 shg:NewWave6thFundMember 2021-12-31 0001263043 shg:ShinhanVcTomorrowVentureFund1Member 2021-12-31 0001263043 ifrs-full:BottomOfRangeMember 2021-12-31 0001263043 ifrs-full:TopOfRangeMember 2021-12-31 0001263043 ifrs-full:BottomOfRangeMember shg:SubsidiaryShinhanLifeInsuranceMember shg:LiabilityAdequacyTestForLifeInsuranceMember 2021-12-31 0001263043 ifrs-full:TopOfRangeMember shg:SubsidiaryShinhanLifeInsuranceMember shg:LiabilityAdequacyTestForLifeInsuranceMember 2021-12-31 0001263043 ifrs-full:TradingSecuritiesMember ifrs-full:FinancialAssetsAtAmortisedCostCategoryMember 2021-12-31 0001263043 shg:DepositsMember ifrs-full:FinancialAssetsAtAmortisedCostCategoryMember 2021-12-31 0001263043 ifrs-full:TradingSecuritiesMember ifrs-full:FinancialAssetsAtFairValueThroughOtherComprehensiveIncomeCategoryMember 2021-12-31 0001263043 shg:AssetsPledgedAsCollateralMember 2021-12-31 0001263043 ifrs-full:TradingSecuritiesMember ifrs-full:FinancialAssetsAtFairValueThroughProfitOrLossCategoryMember 2021-12-31 0001263043 shg:PropertyAndEquipmentRealEstateMember 2021-12-31 0001263043 ifrs-full:TradingSecuritiesMember 2021-12-31 0001263043 shg:ArticleFiftyThreeOfFinancialHoldingCompaniesActMember 2021-12-31 0001263043 shg:ShinhanBankJejuBankAndShinhanCapitalMember ifrs-full:NoncontrollingInterestsMember 2021-12-31 0001263043 shg:PtBankShinhanIndonesiasCgusMember 2021-12-31 0001263043 shg:AssociatesSHBNPPMAINProfessionalInvestmentTypePrivateMixedAssetInvestmentTrustNo3Member 2021-12-31 0001263043 shg:NomuraRifaPrivateRealEstateInvestmentTrustNo.19Member 2021-12-31 0001263043 shg:DsPowerSemiconPrivateEquityFundMember 2021-12-31 0001263043 shg:GenesisNo.1PrivateEquityFundMember 2021-12-31 0001263043 shg:DdiLvcMasterRealEstateInvestmentTrustCo.Ltd.Member 2021-12-31 0001263043 shg:NewlakeGrowthCapitalPartners2PefMember 2021-12-31 0001263043 shg:ShinhanalbatrossTechInvestmentFundMember 2021-12-31 0001263043 shg:SeokwangTiMember 2021-12-31 0001263043 shg:ShinhanTime1stInvestmentFundMember 2021-12-31 0001263043 shg:NVStationPrivateEquityFundMember 2021-12-31 0001263043 shg:SwsFundMember 2021-12-31 0001263043 shg:KoreaDigitalAssetCustodyMember 2021-12-31 0001263043 shg:NovaNewTechnologyInvestmentFundNo1Member 2021-12-31 0001263043 shg:WavetechnologyCo.ltdMember 2021-12-31 0001263043 shg:CjlNo1PrivateEquityFundMember 2021-12-31 0001263043 shg:ShinhanGlobalActiveReitCo.ltd.Member 2021-12-31 0001263043 shg:AssociatesHermesPrivateInvestmentEquityFundMember 2021-12-31 0001263043 shg:AssociatesSprottGlobalRenewablePrivateEquityFundIMember 2021-12-31 0001263043 shg:IMMSpecialSituation12PRIVATEEQUITYFUNDMember 2021-12-31 0001263043 shg:AssociatesKoreaFinanceSecurityMember 2021-12-31 0001263043 shg:AssociatesSBCPFVCoLtdMember 2021-12-31 0001263043 shg:AssociatesPartners4thGrowthInvestmentFundMember 2021-12-31 0001263043 shg:AssociatesKoreaCreditBureauMember 2021-12-31 0001263043 shg:ShinhanGlobalHealthcareFund2Member 2021-12-31 0001263043 shg:AssociatesDreamHighFund3Member 2021-12-31 0001263043 shg:AssociatesKDBCMidasDongASnowballVentureFundIIMember 2021-12-31 0001263043 shg:AssociatesIncorporatedAssociationFinanceSavingInformationCenterMember 2021-12-31 0001263043 shg:DeepblueNo.1PrivateEquityFundMember 2021-12-31 0001263043 shg:IpixelCoLtdMember 2021-12-31 0001263043 ifrs-full:OtherRelatedPartiesMember 2021-12-31 0001263043 shg:BankTimeDepositsMember shg:ForeignCurrencyMember 2021-12-31 0001263043 shg:CertificatesOfDepositMember 2021-12-31 0001263043 shg:BankTimeDepositsMember shg:DomesticCurrencyMember 2021-12-31 0001263043 shg:DemandDepositsMember shg:DomesticCurrencyMember 2021-12-31 0001263043 shg:DemandDepositsMember shg:ForeignCurrencyMember 2021-12-31 0001263043 shg:OtherDepositsMember 2021-12-31 0001263043 shg:CmaMember 2021-12-31 0001263043 shg:BankTimeDepositsMember 2021-12-31 0001263043 shg:DemandDepositsMember 2021-12-31 0001263043 shg:NoteDiscountDepositsMember 2021-12-31 0001263043 shg:PledgedAssetsRightToSellOrPledgeMember 2021-12-31 0001263043 shg:AssociatesOthersTotal2020Member 2021-12-31 0001263043 shg:ShbnppSeniorLoanProfessionalInvestmentTypePrivateMixedAssetInvestmentTrustNo.2Member 2021-12-31 0001263043 shg:EquityAndDerivativeLinkedSecuritiesMember 2021-12-31 0001263043 shg:OtherPartyLiabilitiesMember 2021-12-31 0001263043 shg:PreferredStockIssueMember 2021-12-31 0001263043 ifrs-full:FinancialAssetsAtFairValueThroughProfitOrLossCategoryMember 2021-12-31 0001263043 ifrs-full:FinancialAssetsAtFairValueThroughProfitOrLossCategoryMember ifrs-full:Level3OfFairValueHierarchyMember 2021-12-31 0001263043 ifrs-full:Level3OfFairValueHierarchyMember ifrs-full:FinancialLiabilitiesAtFairValueThroughProfitOrLossDesignatedUponInitialRecognitionCategoryMember 2021-12-31 0001263043 ifrs-full:Level3OfFairValueHierarchyMember shg:DerivativeFinancialInstrumentsAssetsMember 2021-12-31 0001263043 shg:LoansMember shg:DueFromBanksAndLoansAtAmortizedCostMember shg:UsdLiborMember 2021-12-31 0001263043 shg:DueFromBanksAndLoansAtAmortizedCostMember shg:LoansMember shg:JpyLiborMember 2021-12-31 0001263043 shg:DueFromBanksAndLoansAtAmortizedCostMember shg:LoansMember shg:EurLiborMember 2021-12-31 0001263043 shg:DueFromBanksAndLoansAtAmortizedCostMember shg:LoansMember shg:OtherLiborsMember 2021-12-31 0001263043 shg:FinancialInstitutionsBondsMember ifrs-full:FinancialAssetsAtFairValueThroughOtherComprehensiveIncomeCategoryMember shg:UsdLiborMember 2021-12-31 0001263043 shg:CorporateBondsAndOthersMember ifrs-full:FinancialAssetsAtFairValueThroughOtherComprehensiveIncomeCategoryMember shg:UsdLiborMember 2021-12-31 0001263043 ifrs-full:FinancialAssetsAtFairValueThroughOtherComprehensiveIncomeCategoryMember shg:UsdLiborMember 2021-12-31 0001263043 shg:UsdLiborMember shg:CommitmentsAndGuaranteeContractsMember 2021-12-31 0001263043 shg:CommitmentsAndGuaranteeContractsMember shg:JpyLiborMember 2021-12-31 0001263043 shg:CommitmentsAndGuaranteeContractsMember shg:EurLiborMember 2021-12-31 0001263043 shg:CommitmentsAndGuaranteeContractsMember shg:OtherLiborsMember 2021-12-31 0001263043 shg:UsdLiborMember ifrs-full:FinancialLiabilitiesAtAmortisedCostCategoryMember shg:BorrowingsMember 2021-12-31 0001263043 shg:UsdLiborMember ifrs-full:FinancialLiabilitiesAtAmortisedCostCategoryMember shg:DepositsMember 2021-12-31 0001263043 shg:UsdLiborMember ifrs-full:FinancialLiabilitiesAtAmortisedCostCategoryMember 2021-12-31 0001263043 shg:UsdLiborMember ifrs-full:FinancialLiabilitiesAtAmortisedCostCategoryMember shg:DebtSecuritiesIssuedMember 2021-12-31 0001263043 shg:NotDesignatedAsHedgingInstrumentTradingMember shg:InterestRatesRelatedMember shg:UsdLiborMember 2021-12-31 0001263043 shg:NotDesignatedAsHedgingInstrumentTradingMember shg:EquityAndForeignExchangeContractMember shg:UsdLiborMember 2021-12-31 0001263043 shg:NotDesignatedAsHedgingInstrumentTradingMember shg:EquityContractMember shg:UsdLiborMember 2021-12-31 0001263043 shg:NotDesignatedAsHedgingInstrumentTradingMember shg:CreditRiskContractMember shg:UsdLiborMember 2021-12-31 0001263043 shg:NotDesignatedAsHedgingInstrumentTradingMember shg:OtherContractMember shg:UsdLiborMember 2021-12-31 0001263043 shg:NotDesignatedAsHedgingInstrumentTradingMember shg:UsdLiborMember 2021-12-31 0001263043 shg:InterestRatesRelatedMember shg:DesignatedAsHedgingInstrumentMember shg:UsdLiborMember 2021-12-31 0001263043 shg:EquityAndForeignExchangeContractMember shg:DesignatedAsHedgingInstrumentMember shg:UsdLiborMember 2021-12-31 0001263043 shg:DesignatedAsHedgingInstrumentMember shg:UsdLiborMember 2021-12-31 0001263043 shg:OtherLongTermInvestmentsMember ifrs-full:BottomOfRangeMember 2021-12-31 0001263043 shg:OtherLongTermInvestmentsMember ifrs-full:TopOfRangeMember 2021-12-31 0001263043 shg:ShinhanEzGeneralInsuranceLtdMember 2021-12-31 0001263043 srt:ParentCompanyMember 2022-12-31 0001263043 shg:StructuredFinancingMember 2022-12-31 0001263043 ifrs-full:AssetbackedFinancingsMember 2022-12-31 0001263043 ifrs-full:InvestmentFundsMember 2022-12-31 0001263043 shg:StructuredFinancingMember shg:LoanReceivablesMeasuredAtFVTPLMember 2022-12-31 0001263043 shg:LoansAtAmortizedCostMember 2022-12-31 0001263043 ifrs-full:InvestmentFundsMember shg:SecuritiesAtFVTPLMember 2022-12-31 0001263043 ifrs-full:InvestmentFundsMember shg:DerivativeFinancialInstrumentsAssetsMember 2022-12-31 0001263043 shg:StructuredFinancingMember ifrs-full:FinancialAssetsAtFairValueThroughOtherComprehensiveIncomeCategoryMember 2022-12-31 0001263043 shg:StructuredFinancingMember ifrs-full:OtherAssetsMember 2022-12-31 0001263043 ifrs-full:OtherAssetsMember 2022-12-31 0001263043 ifrs-full:FinancialAssetsAtAmortisedCostMember 2022-12-31 0001263043 ifrs-full:AssetbackedFinancingsMember ifrs-full:FinancialAssetsAtAmortisedCostMember 2022-12-31 0001263043 shg:LoanReceivablesMeasuredAtFVTPLMember 2022-12-31 0001263043 ifrs-full:AssetbackedFinancingsMember shg:SecuritiesAtFVTPLMember 2022-12-31 0001263043 shg:StructuredFinancingMember shg:LoansAtAmortizedCostMember 2022-12-31 0001263043 ifrs-full:InvestmentFundsMember shg:LoanReceivablesMeasuredAtFVTPLMember 2022-12-31 0001263043 ifrs-full:FinancialAssetsAtFairValueThroughOtherComprehensiveIncomeCategoryMember 2022-12-31 0001263043 ifrs-full:AssetbackedFinancingsMember ifrs-full:OtherAssetsMember 2022-12-31 0001263043 shg:StructuredFinancingMember ifrs-full:FinancialAssetsAtAmortisedCostMember 2022-12-31 0001263043 ifrs-full:InvestmentFundsMember ifrs-full:FinancialAssetsAtFairValueThroughOtherComprehensiveIncomeCategoryMember 2022-12-31 0001263043 shg:DerivativeFinancialInstrumentsAssetsMember 2022-12-31 0001263043 shg:StructuredFinancingMember shg:SecuritiesAtFVTPLMember 2022-12-31 0001263043 ifrs-full:InvestmentFundsMember shg:LoansAtAmortizedCostMember 2022-12-31 0001263043 ifrs-full:AssetbackedFinancingsMember shg:LoanReceivablesMeasuredAtFVTPLMember 2022-12-31 0001263043 ifrs-full:InvestmentFundsMember ifrs-full:OtherAssetsMember 2022-12-31 0001263043 ifrs-full:InvestmentFundsMember ifrs-full:FinancialAssetsAtAmortisedCostMember 2022-12-31 0001263043 shg:SecuritiesAtFVTPLMember 2022-12-31 0001263043 ifrs-full:AssetbackedFinancingsMember ifrs-full:FinancialAssetsAtFairValueThroughOtherComprehensiveIncomeCategoryMember 2022-12-31 0001263043 shg:StructuredFinancingMember shg:DerivativeFinancialInstrumentsAssetsMember 2022-12-31 0001263043 ifrs-full:AssetbackedFinancingsMember shg:DerivativeFinancialInstrumentsAssetsMember 2022-12-31 0001263043 ifrs-full:AssetbackedFinancingsMember shg:LoansAtAmortizedCostMember 2022-12-31 0001263043 ifrs-full:AssetbackedFinancingsMember ifrs-full:GuaranteesMember 2022-12-31 0001263043 ifrs-full:GuaranteesMember 2022-12-31 0001263043 shg:StructuredFinancingMember shg:PurchaseCommitmentMember 2022-12-31 0001263043 ifrs-full:AssetbackedFinancingsMember ifrs-full:LoanCommitmentsMember 2022-12-31 0001263043 shg:OtherContractMember shg:StructuredFinancingMember 2022-12-31 0001263043 ifrs-full:AssetbackedFinancingsMember shg:PurchaseCommitmentMember 2022-12-31 0001263043 shg:PurchaseCommitmentMember 2022-12-31 0001263043 ifrs-full:ClassesOfAssetsMember 2022-12-31 0001263043 ifrs-full:AssetbackedFinancingsMember ifrs-full:ClassesOfAssetsMember 2022-12-31 0001263043 shg:StructuredFinancingMember ifrs-full:ClassesOfAssetsMember 2022-12-31 0001263043 ifrs-full:InvestmentFundsMember shg:PurchaseCommitmentMember 2022-12-31 0001263043 shg:StructuredFinancingMember ifrs-full:LoanCommitmentsMember 2022-12-31 0001263043 ifrs-full:LoanCommitmentsMember 2022-12-31 0001263043 shg:OtherContractMember 2022-12-31 0001263043 shg:StructuredFinancingMember ifrs-full:GuaranteesMember 2022-12-31 0001263043 ifrs-full:InvestmentFundsMember ifrs-full:ClassesOfAssetsMember 2022-12-31 0001263043 shg:VestedAtDecember312021Member 2022-12-31 0001263043 shg:VestedAtEndOf2022Member 2022-12-31 0001263043 shg:NotExpiredPerformanceSharesMember 2022-12-31 0001263043 shg:VestedAtDecember312020Member 2022-12-31 0001263043 shg:VestedAtEndOf2019Member 2022-12-31 0001263043 shg:ExternalCreditRatingsOfUnratedMember 2022-12-31 0001263043 shg:ExternalCreditRatingsOfAAMinusToAAPlusMember 2022-12-31 0001263043 ifrs-full:ExternalCreditGradesMember 2022-12-31 0001263043 shg:ExternalCreditRatingsOfAAAMember 2022-12-31 0001263043 shg:ExternalCreditRatingsOfAMinusToAPlusMember 2022-12-31 0001263043 shg:PerformanceSharesMember 2022-12-31 0001263043 shg:SubsidiaryShinhanVentureInvestmentMember 2022-12-31 0001263043 shg:SubsidiaryShinhanCapitalMember 2022-12-31 0001263043 shg:AssociatesShinhanEzGeneralInsuranceLtd.Member 2022-12-31 0001263043 shg:ShinhanSecuritiesCo.Ltd.Member 2022-12-31 0001263043 shg:DummySMember 2022-12-31 0001263043 shg:ShinhanAssetTrustCo.Ltd.Member 2022-12-31 0001263043 shg:SubsidiaryShinhanAssetManagementCo.Ltd.Member 2022-12-31 0001263043 shg:SubsidiarySHCManagementMember 2022-12-31 0001263043 shg:SubsidiaryShinhanLifeInsuranceMember 2022-12-31 0001263043 shg:SubsidiaryShinhanAitasMember 2022-12-31 0001263043 shg:SubsidiaryShinhanCardMember 2022-12-31 0001263043 shg:SubsidiaryShinhanSavingsBankMember 2022-12-31 0001263043 shg:SubsidiaryShinhanREITsManagementMember 2022-12-31 0001263043 shg:SubsidiaryShinhanAlternativeInvestmentManagementMember 2022-12-31 0001263043 shg:SubsidiaryShinhanDataSystemMember 2022-12-31 0001263043 shg:SubsidiaryJejuBankMember 2022-12-31 0001263043 shg:SubsidiaryShinhanAIMember 2022-12-31 0001263043 shg:SubsidiaryShinhanBankMember 2022-12-31 0001263043 shg:InternalCreditRatingOfBBBPlusOrAboveMember 2022-12-31 0001263043 shg:InternalCreditRatingOfBelowBBBPlusMember 2022-12-31 0001263043 ifrs-full:Level2OfFairValueHierarchyMember 2022-12-31 0001263043 ifrs-full:AtFairValueMember 2022-12-31 0001263043 ifrs-full:Level1OfFairValueHierarchyMember 2022-12-31 0001263043 shg:CarryingValueMember 2022-12-31 0001263043 ifrs-full:Level3OfFairValueHierarchyMember 2022-12-31 0001263043 ifrs-full:FinancialAssetsAtAmortisedCostCategoryMember 2022-12-31 0001263043 ifrs-full:FinancialAssetsAtFairValueThroughProfitOrLossCategoryMember 2022-12-31 0001263043 shg:DesignatedAsHedgingInstrumentMember 2022-12-31 0001263043 ifrs-full:FinancialAssetsAtFairValueThroughOtherComprehensiveIncomeCategoryMember 2022-12-31 0001263043 country:KR shg:DepositsAndLoansAtFVTPLMember shg:ShinhanBankMember 2022-12-31 0001263043 country:GB shg:DepositsAndLoansAtFVTPLMember ifrs-full:CorporateLoansMember 2022-12-31 0001263043 country:GB shg:DepositsAndLoansAtFVTPLMember 2022-12-31 0001263043 shg:FinancialGuaranteeContractMember country:KR 2022-12-31 0001263043 country:US shg:FinancialGuaranteeContractMember 2022-12-31 0001263043 country:GB shg:FinancialGuaranteeContractMember 2022-12-31 0001263043 country:JP shg:FinancialGuaranteeContractMember 2022-12-31 0001263043 country:DE shg:FinancialGuaranteeContractMember 2022-12-31 0001263043 country:VN shg:FinancialGuaranteeContractMember 2022-12-31 0001263043 country:CN shg:FinancialGuaranteeContractMember 2022-12-31 0001263043 shg:OthersCountryMember shg:FinancialGuaranteeContractMember 2022-12-31 0001263043 shg:FinancialGuaranteeContractMember 2022-12-31 0001263043 country:US shg:DueFromBanksAndLoansAtAmortizedCostMember shg:ShinhanBankMember 2022-12-31 0001263043 country:JP shg:DueFromBanksAndLoansAtAmortizedCostMember shg:ShinhanBankMember 2022-12-31 0001263043 country:KR shg:DueFromBanksAndLoansAtAmortizedCostMember ifrs-full:ConsumerLoansMember 2022-12-31 0001263043 country:GB shg:DueFromBanksAndLoansAtAmortizedCostMember ifrs-full:ConsumerLoansMember 2022-12-31 0001263043 shg:OthersCountryMember shg:DueFromBanksAndLoansAtAmortizedCostMember ifrs-full:ConsumerLoansMember 2022-12-31 0001263043 shg:DueFromBanksAndLoansAtAmortizedCostMember ifrs-full:ConsumerLoansMember 2022-12-31 0001263043 ifrs-full:GovernmentMember shg:DueFromBanksAndLoansAtAmortizedCostMember country:US 2022-12-31 0001263043 ifrs-full:GovernmentMember shg:DueFromBanksAndLoansAtAmortizedCostMember country:DE 2022-12-31 0001263043 ifrs-full:GovernmentMember shg:DueFromBanksAndLoansAtAmortizedCostMember shg:OthersCountryMember 2022-12-31 0001263043 country:JP shg:DueFromBanksAndLoansAtAmortizedCostMember ifrs-full:CorporateLoansMember 2022-12-31 0001263043 country:DE shg:DueFromBanksAndLoansAtAmortizedCostMember ifrs-full:CorporateLoansMember 2022-12-31 0001263043 country:JP shg:DueFromBanksAndLoansAtAmortizedCostMember shg:CreditCardReceivablesMember 2022-12-31 0001263043 country:DE shg:DueFromBanksAndLoansAtAmortizedCostMember shg:CreditCardReceivablesMember 2022-12-31 0001263043 country:VN shg:CreditCardReceivablesMember shg:DueFromBanksAndLoansAtAmortizedCostMember 2022-12-31 0001263043 shg:OthersCountryMember shg:DueFromBanksAndLoansAtAmortizedCostMember shg:CreditCardReceivablesMember 2022-12-31 0001263043 country:US shg:DueFromBanksAndLoansAtAmortizedCostMember 2022-12-31 0001263043 shg:DueFromBanksAndLoansAtAmortizedCostMember 2022-12-31 0001263043 country:US shg:DepositsAndLoansAtFVTPLMember ifrs-full:CorporateLoansMember 2022-12-31 0001263043 shg:DepositsAndLoansAtFVTPLMember ifrs-full:CorporateLoansMember 2022-12-31 0001263043 country:JP shg:DepositsAndLoansAtFVTPLMember 2022-12-31 0001263043 country:CN shg:SecuritiesAtFVTPLMember 2022-12-31 0001263043 country:DE ifrs-full:FinancialAssetsAtFairValueThroughOtherComprehensiveIncomeCategoryMember 2022-12-31 0001263043 ifrs-full:FinancialAssetsAtAmortisedCostMember country:VN 2022-12-31 0001263043 country:CN ifrs-full:FinancialAssetsAtAmortisedCostMember 2022-12-31 0001263043 country:KR 2022-12-31 0001263043 country:CN 2022-12-31 0001263043 shg:LoanCommitmentsAndOtherLiabilitiesRelatedToCreditMember country:GB 2022-12-31 0001263043 country:VN shg:LoanCommitmentsAndOtherLiabilitiesRelatedToCreditMember 2022-12-31 0001263043 shg:OffBalanceAccountsMember country:DE 2022-12-31 0001263043 shg:OffBalanceAccountsMember shg:OthersCountryMember 2022-12-31 0001263043 shg:CreditCardReceivablesMember shg:DueFromBanksAndLoansAtAmortizedCostMember country:US 2022-12-31 0001263043 country:VN ifrs-full:ConsumerLoansMember shg:DueFromBanksAndLoansAtAmortizedCostMember 2022-12-31 0001263043 country:DE shg:DueFromBanksAndLoansAtAmortizedCostMember shg:ShinhanBankMember 2022-12-31 0001263043 shg:DueFromBanksAndLoansAtAmortizedCostMember country:VN 2022-12-31 0001263043 country:US shg:DepositsAndLoansAtFVTPLMember 2022-12-31 0001263043 shg:OthersCountryMember shg:SecuritiesAtFVTPLMember 2022-12-31 0001263043 country:GB shg:DueFromBanksAndLoansAtAmortizedCostMember shg:ShinhanBankMember 2022-12-31 0001263043 shg:OthersCountryMember shg:DueFromBanksAndLoansAtAmortizedCostMember 2022-12-31 0001263043 shg:OthersCountryMember ifrs-full:CorporateLoansMember shg:DepositsAndLoansAtFVTPLMember 2022-12-31 0001263043 country:DE 2022-12-31 0001263043 shg:DueFromBanksAndLoansAtAmortizedCostMember shg:ShinhanBankMember 2022-12-31 0001263043 country:DE shg:DueFromBanksAndLoansAtAmortizedCostMember ifrs-full:ConsumerLoansMember 2022-12-31 0001263043 country:KR shg:DueFromBanksAndLoansAtAmortizedCostMember shg:CreditCardReceivablesMember 2022-12-31 0001263043 country:GB ifrs-full:FinancialAssetsAtFairValueThroughOtherComprehensiveIncomeCategoryMember 2022-12-31 0001263043 country:CN ifrs-full:FinancialAssetsAtFairValueThroughOtherComprehensiveIncomeCategoryMember 2022-12-31 0001263043 ifrs-full:FinancialAssetsAtAmortisedCostMember 2022-12-31 0001263043 country:KR ifrs-full:FinancialAssetsAtFairValueThroughOtherComprehensiveIncomeCategoryMember 2022-12-31 0001263043 country:KR shg:SecuritiesAtFVTPLMember 2022-12-31 0001263043 country:JP shg:DepositsAndLoansAtFVTPLMember ifrs-full:CorporateLoansMember 2022-12-31 0001263043 country:JP shg:DueFromBanksAndLoansAtAmortizedCostMember 2022-12-31 0001263043 shg:ShinhanBankMember shg:DueFromBanksAndLoansAtAmortizedCostMember country:CN 2022-12-31 0001263043 shg:ShinhanBankMember shg:DepositsAndLoansAtFVTPLMember country:US 2022-12-31 0001263043 shg:LoanCommitmentsAndOtherLiabilitiesRelatedToCreditMember country:KR 2022-12-31 0001263043 ifrs-full:GovernmentMember shg:DueFromBanksAndLoansAtAmortizedCostMember country:CN 2022-12-31 0001263043 shg:LoanCommitmentsAndOtherLiabilitiesRelatedToCreditMember country:US 2022-12-31 0001263043 shg:LoanCommitmentsAndOtherLiabilitiesRelatedToCreditMember country:DE 2022-12-31 0001263043 shg:OthersCountryMember shg:LoanCommitmentsAndOtherLiabilitiesRelatedToCreditMember 2022-12-31 0001263043 shg:OffBalanceAccountsMember country:US 2022-12-31 0001263043 country:CN shg:DueFromBanksAndLoansAtAmortizedCostMember ifrs-full:CorporateLoansMember 2022-12-31 0001263043 country:GB shg:SecuritiesAtFVTPLMember 2022-12-31 0001263043 country:US ifrs-full:FinancialAssetsAtAmortisedCostMember 2022-12-31 0001263043 country:GB shg:DueFromBanksAndLoansAtAmortizedCostMember 2022-12-31 0001263043 shg:SecuritiesAtFVTPLMember country:DE 2022-12-31 0001263043 shg:OthersCountryMember shg:DueFromBanksAndLoansAtAmortizedCostMember ifrs-full:CorporateLoansMember 2022-12-31 0001263043 country:JP shg:DueFromBanksAndLoansAtAmortizedCostMember ifrs-full:ConsumerLoansMember 2022-12-31 0001263043 shg:OthersCountryMember 2022-12-31 0001263043 shg:OthersCountryMember ifrs-full:FinancialAssetsAtAmortisedCostMember 2022-12-31 0001263043 country:JP 2022-12-31 0001263043 shg:OthersCountryMember shg:DepositsAndLoansAtFVTPLMember 2022-12-31 0001263043 shg:DueFromBanksAndLoansAtAmortizedCostMember ifrs-full:CorporateLoansMember country:VN 2022-12-31 0001263043 country:CN shg:DueFromBanksAndLoansAtAmortizedCostMember shg:CreditCardReceivablesMember 2022-12-31 0001263043 country:JP ifrs-full:FinancialAssetsAtFairValueThroughOtherComprehensiveIncomeCategoryMember 2022-12-31 0001263043 country:JP ifrs-full:FinancialAssetsAtAmortisedCostMember 2022-12-31 0001263043 country:US shg:SecuritiesAtFVTPLMember 2022-12-31 0001263043 country:JP shg:SecuritiesAtFVTPLMember 2022-12-31 0001263043 shg:DepositsAndLoansAtFVTPLMember country:KR 2022-12-31 0001263043 country:CN shg:DueFromBanksAndLoansAtAmortizedCostMember 2022-12-31 0001263043 shg:DueFromBanksAndLoansAtAmortizedCostMember shg:CreditCardReceivablesMember 2022-12-31 0001263043 country:GB shg:DueFromBanksAndLoansAtAmortizedCostMember ifrs-full:CorporateLoansMember 2022-12-31 0001263043 country:KR shg:DueFromBanksAndLoansAtAmortizedCostMember ifrs-full:GovernmentMember 2022-12-31 0001263043 ifrs-full:GovernmentMember shg:DueFromBanksAndLoansAtAmortizedCostMember country:JP 2022-12-31 0001263043 shg:LoanCommitmentsAndOtherLiabilitiesRelatedToCreditMember country:JP 2022-12-31 0001263043 shg:LoanCommitmentsAndOtherLiabilitiesRelatedToCreditMember country:CN 2022-12-31 0001263043 shg:OffBalanceAccountsMember country:KR 2022-12-31 0001263043 shg:OffBalanceAccountsMember country:JP 2022-12-31 0001263043 shg:OffBalanceAccountsMember country:CN 2022-12-31 0001263043 country:VN shg:SecuritiesAtFVTPLMember 2022-12-31 0001263043 shg:OthersCountryMember ifrs-full:FinancialAssetsAtFairValueThroughOtherComprehensiveIncomeCategoryMember 2022-12-31 0001263043 country:KR shg:DueFromBanksAndLoansAtAmortizedCostMember ifrs-full:CorporateLoansMember 2022-12-31 0001263043 shg:OthersCountryMember shg:DueFromBanksAndLoansAtAmortizedCostMember shg:ShinhanBankMember 2022-12-31 0001263043 country:US ifrs-full:FinancialAssetsAtFairValueThroughOtherComprehensiveIncomeCategoryMember 2022-12-31 0001263043 country:US shg:DueFromBanksAndLoansAtAmortizedCostMember ifrs-full:CorporateLoansMember 2022-12-31 0001263043 country:VN shg:ShinhanBankMember shg:DueFromBanksAndLoansAtAmortizedCostMember 2022-12-31 0001263043 country:DE shg:DueFromBanksAndLoansAtAmortizedCostMember 2022-12-31 0001263043 country:US 2022-12-31 0001263043 country:VN ifrs-full:FinancialAssetsAtFairValueThroughOtherComprehensiveIncomeCategoryMember 2022-12-31 0001263043 shg:DepositsAndLoansAtFVTPLMember 2022-12-31 0001263043 shg:DueFromBanksAndLoansAtAmortizedCostMember ifrs-full:CorporateLoansMember 2022-12-31 0001263043 country:US shg:DueFromBanksAndLoansAtAmortizedCostMember ifrs-full:ConsumerLoansMember 2022-12-31 0001263043 shg:SecuritiesAtFVTPLMember 2022-12-31 0001263043 country:KR ifrs-full:FinancialAssetsAtAmortisedCostMember 2022-12-31 0001263043 country:VN 2022-12-31 0001263043 country:GB 2022-12-31 0001263043 ifrs-full:FinancialAssetsAtFairValueThroughOtherComprehensiveIncomeCategoryMember 2022-12-31 0001263043 ifrs-full:CorporateLoansMember country:KR shg:DepositsAndLoansAtFVTPLMember 2022-12-31 0001263043 country:KR shg:DueFromBanksAndLoansAtAmortizedCostMember 2022-12-31 0001263043 country:GB shg:DueFromBanksAndLoansAtAmortizedCostMember shg:CreditCardReceivablesMember 2022-12-31 0001263043 ifrs-full:ConsumerLoansMember shg:DueFromBanksAndLoansAtAmortizedCostMember country:CN 2022-12-31 0001263043 shg:ShinhanBankMember shg:DueFromBanksAndLoansAtAmortizedCostMember country:KR 2022-12-31 0001263043 shg:ShinhanBankMember shg:DepositsAndLoansAtFVTPLMember 2022-12-31 0001263043 country:GB shg:DueFromBanksAndLoansAtAmortizedCostMember ifrs-full:GovernmentMember 2022-12-31 0001263043 ifrs-full:GovernmentMember shg:DueFromBanksAndLoansAtAmortizedCostMember country:VN 2022-12-31 0001263043 ifrs-full:GovernmentMember shg:DueFromBanksAndLoansAtAmortizedCostMember 2022-12-31 0001263043 shg:LoanCommitmentsAndOtherLiabilitiesRelatedToCreditMember 2022-12-31 0001263043 shg:OffBalanceAccountsMember country:GB 2022-12-31 0001263043 shg:OffBalanceAccountsMember country:VN 2022-12-31 0001263043 shg:OffBalanceAccountsMember 2022-12-31 0001263043 shg:DueFromBanksAndLoansAtAmortizedCostMember shg:OthersMember shg:ShinhanBankMember 2022-12-31 0001263043 ifrs-full:ConsumerLoansMember shg:RetailCustomersMember shg:DueFromBanksAndLoansAtAmortizedCostMember 2022-12-31 0001263043 shg:DueFromBanksAndLoansAtAmortizedCostMember shg:ManufacturingMember ifrs-full:CorporateLoansMember 2022-12-31 0001263043 ifrs-full:CorporateLoansMember shg:RetailAndWholesaleMember shg:DueFromBanksAndLoansAtAmortizedCostMember 2022-12-31 0001263043 shg:CreditCardReceivablesMember shg:ManufacturingMember shg:DueFromBanksAndLoansAtAmortizedCostMember 2022-12-31 0001263043 shg:DueFromBanksAndLoansAtAmortizedCostMember shg:RealEstateAndServiceMember shg:CreditCardReceivablesMember 2022-12-31 0001263043 shg:DueFromBanksAndLoansAtAmortizedCostMember shg:RetailCustomersMember shg:CreditCardReceivablesMember 2022-12-31 0001263043 shg:RetailAndWholesaleMember shg:DueFromBanksAndLoansAtAmortizedCostMember 2022-12-31 0001263043 shg:RetailCustomersMember shg:DueFromBanksAndLoansAtAmortizedCostMember 2022-12-31 0001263043 ifrs-full:CorporateLoansMember shg:RealEstateAndServiceMember shg:DepositsAndLoansAtFVTPLMember 2022-12-31 0001263043 shg:RetailAndWholesaleMember shg:DepositsAndLoansAtFVTPLMember 2022-12-31 0001263043 shg:ConstructionServiceMember shg:DepositsAndLoansAtFVTPLMember 2022-12-31 0001263043 shg:SecuritiesAtFVTPLMember shg:FinanceAndInsuranceMember 2022-12-31 0001263043 shg:ConstructionServiceMember shg:SecuritiesAtFVTPLMember 2022-12-31 0001263043 ifrs-full:FinancialAssetsAtFairValueThroughOtherComprehensiveIncomeCategoryMember shg:FinanceAndInsuranceMember 2022-12-31 0001263043 ifrs-full:FinancialAssetsAtFairValueThroughOtherComprehensiveIncomeCategoryMember shg:LodgingAndRestaurantMember 2022-12-31 0001263043 ifrs-full:FinancialAssetsAtFairValueThroughOtherComprehensiveIncomeCategoryMember shg:OthersMember 2022-12-31 0001263043 shg:OthersMember ifrs-full:FinancialAssetsAtAmortisedCostMember 2022-12-31 0001263043 shg:ManufacturingMember 2022-12-31 0001263043 shg:RealEstateAndServiceMember 2022-12-31 0001263043 shg:FinancialGuaranteeContractMember shg:FinanceAndInsuranceMember 2022-12-31 0001263043 shg:FinancialGuaranteeContractMember shg:OthersMember 2022-12-31 0001263043 shg:LoanCommitmentsAndOtherLiabilitiesRelatedToCreditMember shg:FinanceAndInsuranceMember 2022-12-31 0001263043 shg:LoanCommitmentsAndOtherLiabilitiesRelatedToCreditMember shg:RealEstateAndServiceMember 2022-12-31 0001263043 shg:LoanCommitmentsAndOtherLiabilitiesRelatedToCreditMember shg:OthersMember 2022-12-31 0001263043 shg:OffBalanceAccountsMember shg:LodgingAndRestaurantMember 2022-12-31 0001263043 shg:OthersMember shg:OffBalanceAccountsMember 2022-12-31 0001263043 shg:OffBalanceAccountsMember shg:RealEstateAndServiceMember 2022-12-31 0001263043 shg:OffBalanceAccountsMember shg:FinanceAndInsuranceMember 2022-12-31 0001263043 shg:LoanCommitmentsAndOtherLiabilitiesRelatedToCreditMember shg:ManufacturingMember 2022-12-31 0001263043 shg:FinancialGuaranteeContractMember shg:RetailCustomersMember 2022-12-31 0001263043 shg:CreditCardReceivablesMember shg:LodgingAndRestaurantMember shg:DueFromBanksAndLoansAtAmortizedCostMember 2022-12-31 0001263043 ifrs-full:CorporateLoansMember shg:FinanceAndInsuranceMember shg:DueFromBanksAndLoansAtAmortizedCostMember 2022-12-31 0001263043 shg:DepositsAndLoansAtFVTPLMember shg:ConstructionServiceMember ifrs-full:CorporateLoansMember 2022-12-31 0001263043 shg:RetailCustomersMember 2022-12-31 0001263043 shg:ShinhanBankMember shg:FinanceAndInsuranceMember shg:DueFromBanksAndLoansAtAmortizedCostMember 2022-12-31 0001263043 shg:CreditCardReceivablesMember shg:ConstructionServiceMember shg:DueFromBanksAndLoansAtAmortizedCostMember 2022-12-31 0001263043 shg:ConstructionServiceMember shg:DueFromBanksAndLoansAtAmortizedCostMember 2022-12-31 0001263043 ifrs-full:CorporateLoansMember shg:FinanceAndInsuranceMember shg:DepositsAndLoansAtFVTPLMember 2022-12-31 0001263043 shg:FinanceAndInsuranceMember shg:DepositsAndLoansAtFVTPLMember 2022-12-31 0001263043 shg:SecuritiesAtFVTPLMember shg:LodgingAndRestaurantMember 2022-12-31 0001263043 shg:RealEstateAndServiceMember ifrs-full:FinancialAssetsAtAmortisedCostMember 2022-12-31 0001263043 shg:OthersMember shg:DueFromBanksAndLoansAtAmortizedCostMember 2022-12-31 0001263043 ifrs-full:FinancialAssetsAtFairValueThroughOtherComprehensiveIncomeCategoryMember shg:ConstructionServiceMember 2022-12-31 0001263043 ifrs-full:CorporateLoansMember shg:RealEstateAndServiceMember shg:DueFromBanksAndLoansAtAmortizedCostMember 2022-12-31 0001263043 shg:ManufacturingMember shg:DepositsAndLoansAtFVTPLMember 2022-12-31 0001263043 shg:SecuritiesAtFVTPLMember shg:ManufacturingMember 2022-12-31 0001263043 shg:RetailAndWholesaleMember shg:FinancialGuaranteeContractMember 2022-12-31 0001263043 shg:LodgingAndRestaurantMember shg:DueFromBanksAndLoansAtAmortizedCostMember 2022-12-31 0001263043 shg:DepositsAndLoansAtFVTPLMember shg:ManufacturingMember ifrs-full:CorporateLoansMember 2022-12-31 0001263043 shg:OthersMember shg:DepositsAndLoansAtFVTPLMember 2022-12-31 0001263043 shg:OthersMember shg:SecuritiesAtFVTPLMember 2022-12-31 0001263043 ifrs-full:FinancialAssetsAtFairValueThroughOtherComprehensiveIncomeCategoryMember shg:ManufacturingMember 2022-12-31 0001263043 shg:RetailAndWholesaleMember 2022-12-31 0001263043 ifrs-full:CorporateLoansMember shg:OthersMember shg:DueFromBanksAndLoansAtAmortizedCostMember 2022-12-31 0001263043 shg:CreditCardReceivablesMember shg:OthersMember shg:DueFromBanksAndLoansAtAmortizedCostMember 2022-12-31 0001263043 ifrs-full:CorporateLoansMember shg:RetailAndWholesaleMember shg:DepositsAndLoansAtFVTPLMember 2022-12-31 0001263043 shg:FinancialGuaranteeContractMember shg:RealEstateAndServiceMember 2022-12-31 0001263043 shg:OffBalanceAccountsMember shg:RetailCustomersMember 2022-12-31 0001263043 shg:RetailAndWholesaleMember shg:OffBalanceAccountsMember 2022-12-31 0001263043 shg:LoanCommitmentsAndOtherLiabilitiesRelatedToCreditMember shg:LodgingAndRestaurantMember 2022-12-31 0001263043 shg:LoanCommitmentsAndOtherLiabilitiesRelatedToCreditMember shg:RetailAndWholesaleMember 2022-12-31 0001263043 ifrs-full:GovernmentMember shg:OthersMember shg:DueFromBanksAndLoansAtAmortizedCostMember 2022-12-31 0001263043 shg:ConstructionServiceMember ifrs-full:FinancialAssetsAtAmortisedCostMember 2022-12-31 0001263043 ifrs-full:CorporateLoansMember shg:OthersMember shg:DepositsAndLoansAtFVTPLMember 2022-12-31 0001263043 shg:SecuritiesAtFVTPLMember shg:RetailAndWholesaleMember 2022-12-31 0001263043 ifrs-full:FinancialAssetsAtFairValueThroughOtherComprehensiveIncomeCategoryMember shg:RetailAndWholesaleMember 2022-12-31 0001263043 shg:FinanceAndInsuranceMember 2022-12-31 0001263043 ifrs-full:CorporateLoansMember shg:ConstructionServiceMember shg:DueFromBanksAndLoansAtAmortizedCostMember 2022-12-31 0001263043 shg:RealEstateAndServiceMember shg:DueFromBanksAndLoansAtAmortizedCostMember 2022-12-31 0001263043 shg:LodgingAndRestaurantMember 2022-12-31 0001263043 shg:CreditCardReceivablesMember shg:FinanceAndInsuranceMember shg:DueFromBanksAndLoansAtAmortizedCostMember 2022-12-31 0001263043 shg:FinanceAndInsuranceMember shg:DueFromBanksAndLoansAtAmortizedCostMember 2022-12-31 0001263043 shg:RealEstateAndServiceMember ifrs-full:FinancialAssetsAtFairValueThroughOtherComprehensiveIncomeCategoryMember 2022-12-31 0001263043 shg:FinancialGuaranteeContractMember shg:ManufacturingMember 2022-12-31 0001263043 shg:FinancialGuaranteeContractMember shg:ConstructionServiceMember 2022-12-31 0001263043 shg:OffBalanceAccountsMember shg:ConstructionServiceMember 2022-12-31 0001263043 shg:OffBalanceAccountsMember shg:ManufacturingMember 2022-12-31 0001263043 shg:LoanCommitmentsAndOtherLiabilitiesRelatedToCreditMember shg:RetailCustomersMember 2022-12-31 0001263043 shg:ConstructionServiceMember shg:LoanCommitmentsAndOtherLiabilitiesRelatedToCreditMember 2022-12-31 0001263043 shg:LodgingAndRestaurantMember shg:FinancialGuaranteeContractMember 2022-12-31 0001263043 shg:CreditCardReceivablesMember shg:RetailAndWholesaleMember shg:DueFromBanksAndLoansAtAmortizedCostMember 2022-12-31 0001263043 shg:SecuritiesAtFVTPLMember shg:RealEstateAndServiceMember 2022-12-31 0001263043 shg:ConstructionServiceMember 2022-12-31 0001263043 ifrs-full:GovernmentMember shg:RealEstateAndServiceMember shg:DueFromBanksAndLoansAtAmortizedCostMember 2022-12-31 0001263043 shg:OthersMember 2022-12-31 0001263043 ifrs-full:CorporateLoansMember shg:LodgingAndRestaurantMember shg:DueFromBanksAndLoansAtAmortizedCostMember 2022-12-31 0001263043 shg:ManufacturingMember shg:DueFromBanksAndLoansAtAmortizedCostMember 2022-12-31 0001263043 shg:RealEstateAndServiceMember shg:DepositsAndLoansAtFVTPLMember 2022-12-31 0001263043 ifrs-full:GovernmentMember shg:FinanceAndInsuranceMember shg:DueFromBanksAndLoansAtAmortizedCostMember 2022-12-31 0001263043 shg:FinanceAndInsuranceMember ifrs-full:FinancialAssetsAtAmortisedCostMember 2022-12-31 0001263043 shg:ShinhanBankMember shg:FinanceAndInsuranceMember shg:DepositsAndLoansAtFVTPLMember 2022-12-31 0001263043 ifrs-full:CorporateLoansMember shg:LodgingAndRestaurantMember shg:DepositsAndLoansAtFVTPLMember 2022-12-31 0001263043 shg:LodgingAndRestaurantMember shg:DepositsAndLoansAtFVTPLMember 2022-12-31 0001263043 shg:ManufacturingMember ifrs-full:FinancialAssetsAtAmortisedCostMember 2022-12-31 0001263043 shg:OthersMember shg:DepositsAndLoansAtFVTPLMember shg:ShinhanBankMember 2022-12-31 0001263043 shg:RealEstateAndServiceMember shg:DepositsAndLoansAtFVTPLMember shg:ShinhanBankMember 2022-12-31 0001263043 shg:ConstructionServiceMember shg:DueFromBanksAndLoansAtAmortizedCostMember shg:ShinhanBankMember 2022-12-31 0001263043 ifrs-full:RiskDiversificationEffectMember ifrs-full:TopOfRangeMember shg:BankingMember 2022-12-31 0001263043 ifrs-full:EquityPriceRiskMember shg:DateOfEndOfReportingPeriodMember shg:BankingMember 2022-12-31 0001263043 ifrs-full:TopOfRangeMember shg:BankingMember 2022-12-31 0001263043 shg:OptionVolatilityMember ifrs-full:BottomOfRangeMember shg:BankingMember 2022-12-31 0001263043 ifrs-full:InterestRateRiskMember ifrs-full:WeightedAverageMember shg:BankingMember 2022-12-31 0001263043 shg:BankingMember ifrs-full:WeightedAverageMember 2022-12-31 0001263043 shg:OptionVolatilityMember ifrs-full:WeightedAverageMember shg:BankingMember 2022-12-31 0001263043 ifrs-full:CurrencyRiskMember ifrs-full:BottomOfRangeMember shg:BankingMember 2022-12-31 0001263043 ifrs-full:InterestRateRiskMember ifrs-full:TopOfRangeMember shg:BankingMember 2022-12-31 0001263043 ifrs-full:CommodityPriceRiskMember ifrs-full:WeightedAverageMember shg:BankingMember 2022-12-31 0001263043 ifrs-full:InterestRateRiskMember ifrs-full:BottomOfRangeMember shg:BankingMember 2022-12-31 0001263043 shg:DateOfEndOfReportingPeriodMember shg:BankingMember 2022-12-31 0001263043 shg:OptionVolatilityMember shg:DateOfEndOfReportingPeriodMember shg:BankingMember 2022-12-31 0001263043 ifrs-full:EquityPriceRiskMember ifrs-full:BottomOfRangeMember shg:BankingMember 2022-12-31 0001263043 ifrs-full:RiskDiversificationEffectMember ifrs-full:BottomOfRangeMember shg:BankingMember 2022-12-31 0001263043 ifrs-full:EquityPriceRiskMember ifrs-full:WeightedAverageMember shg:BankingMember 2022-12-31 0001263043 ifrs-full:CommodityPriceRiskMember shg:DateOfEndOfReportingPeriodMember shg:BankingMember 2022-12-31 0001263043 ifrs-full:EquityPriceRiskMember ifrs-full:TopOfRangeMember shg:BankingMember 2022-12-31 0001263043 ifrs-full:CommodityPriceRiskMember ifrs-full:TopOfRangeMember shg:BankingMember 2022-12-31 0001263043 ifrs-full:InterestRateRiskMember shg:DateOfEndOfReportingPeriodMember shg:BankingMember 2022-12-31 0001263043 ifrs-full:CurrencyRiskMember ifrs-full:TopOfRangeMember shg:BankingMember 2022-12-31 0001263043 ifrs-full:BottomOfRangeMember shg:BankingMember 2022-12-31 0001263043 ifrs-full:RiskDiversificationEffectMember shg:DateOfEndOfReportingPeriodMember shg:BankingMember 2022-12-31 0001263043 ifrs-full:RiskDiversificationEffectMember ifrs-full:WeightedAverageMember shg:BankingMember 2022-12-31 0001263043 ifrs-full:CommodityPriceRiskMember ifrs-full:BottomOfRangeMember shg:BankingMember 2022-12-31 0001263043 shg:OptionVolatilityMember ifrs-full:TopOfRangeMember shg:BankingMember 2022-12-31 0001263043 shg:BankingMember shg:DateOfEndOfReportingPeriodMember ifrs-full:CurrencyRiskMember 2022-12-31 0001263043 ifrs-full:CurrencyRiskMember ifrs-full:WeightedAverageMember shg:BankingMember 2022-12-31 0001263043 ifrs-full:CurrencyRiskMember ifrs-full:WeightedAverageMember shg:LifeInsuranceMember 2022-12-31 0001263043 shg:LifeInsuranceMember ifrs-full:TopOfRangeMember 2022-12-31 0001263043 shg:LifeInsuranceMember shg:DateOfEndOfReportingPeriodMember ifrs-full:InterestRateRiskMember 2022-12-31 0001263043 shg:LifeInsuranceMember ifrs-full:BottomOfRangeMember 2022-12-31 0001263043 shg:LifeInsuranceMember ifrs-full:TopOfRangeMember shg:OptionVolatilityMember 2022-12-31 0001263043 ifrs-full:CurrencyRiskMember ifrs-full:TopOfRangeMember shg:LifeInsuranceMember 2022-12-31 0001263043 ifrs-full:EquityPriceRiskMember ifrs-full:BottomOfRangeMember shg:LifeInsuranceMember 2022-12-31 0001263043 ifrs-full:InterestRateRiskMember ifrs-full:BottomOfRangeMember shg:LifeInsuranceMember 2022-12-31 0001263043 ifrs-full:TopOfRangeMember ifrs-full:RiskDiversificationEffectMember shg:SecuritiesMember 2022-12-31 0001263043 ifrs-full:EquityPriceRiskMember shg:DateOfEndOfReportingPeriodMember shg:SecuritiesMember 2022-12-31 0001263043 ifrs-full:TopOfRangeMember shg:SecuritiesMember 2022-12-31 0001263043 ifrs-full:InterestRateRiskMember ifrs-full:BottomOfRangeMember shg:SecuritiesMember 2022-12-31 0001263043 shg:SecuritiesMember shg:DateOfEndOfReportingPeriodMember ifrs-full:CurrencyRiskMember 2022-12-31 0001263043 ifrs-full:BottomOfRangeMember shg:SecuritiesMember 2022-12-31 0001263043 ifrs-full:BottomOfRangeMember ifrs-full:RiskDiversificationEffectMember shg:SecuritiesMember 2022-12-31 0001263043 ifrs-full:EquityPriceRiskMember ifrs-full:TopOfRangeMember shg:SecuritiesMember 2022-12-31 0001263043 shg:OptionVolatilityMember ifrs-full:BottomOfRangeMember shg:SecuritiesMember 2022-12-31 0001263043 shg:SecuritiesMember ifrs-full:WeightedAverageMember ifrs-full:InterestRateRiskMember 2022-12-31 0001263043 shg:SecuritiesMember ifrs-full:WeightedAverageMember 2022-12-31 0001263043 ifrs-full:CurrencyRiskMember ifrs-full:TopOfRangeMember shg:SecuritiesMember 2022-12-31 0001263043 ifrs-full:CurrencyRiskMember ifrs-full:BottomOfRangeMember shg:SecuritiesMember 2022-12-31 0001263043 ifrs-full:InterestRateRiskMember ifrs-full:TopOfRangeMember shg:SecuritiesMember 2022-12-31 0001263043 ifrs-full:InterestRateRiskMember shg:DateOfEndOfReportingPeriodMember shg:SecuritiesMember 2022-12-31 0001263043 shg:DateOfEndOfReportingPeriodMember shg:SecuritiesMember 2022-12-31 0001263043 shg:SecuritiesMember ifrs-full:WeightedAverageMember shg:OptionVolatilityMember 2022-12-31 0001263043 shg:SecuritiesMember shg:DateOfEndOfReportingPeriodMember ifrs-full:RiskDiversificationEffectMember 2022-12-31 0001263043 ifrs-full:WeightedAverageMember ifrs-full:RiskDiversificationEffectMember shg:SecuritiesMember 2022-12-31 0001263043 shg:OptionVolatilityMember shg:DateOfEndOfReportingPeriodMember shg:SecuritiesMember 2022-12-31 0001263043 shg:SecuritiesMember ifrs-full:TopOfRangeMember shg:OptionVolatilityMember 2022-12-31 0001263043 ifrs-full:CurrencyRiskMember ifrs-full:WeightedAverageMember shg:SecuritiesMember 2022-12-31 0001263043 ifrs-full:EquityPriceRiskMember ifrs-full:BottomOfRangeMember shg:SecuritiesMember 2022-12-31 0001263043 ifrs-full:EquityPriceRiskMember ifrs-full:WeightedAverageMember shg:SecuritiesMember 2022-12-31 0001263043 shg:OptionVolatilityMember ifrs-full:WeightedAverageMember shg:LifeInsuranceMember 2022-12-31 0001263043 ifrs-full:WeightedAverageMember shg:LifeInsuranceMember 2022-12-31 0001263043 ifrs-full:EquityPriceRiskMember shg:DateOfEndOfReportingPeriodMember shg:LifeInsuranceMember 2022-12-31 0001263043 ifrs-full:CurrencyRiskMember shg:DateOfEndOfReportingPeriodMember shg:LifeInsuranceMember 2022-12-31 0001263043 ifrs-full:InterestRateRiskMember ifrs-full:TopOfRangeMember shg:LifeInsuranceMember 2022-12-31 0001263043 ifrs-full:CurrencyRiskMember ifrs-full:BottomOfRangeMember shg:LifeInsuranceMember 2022-12-31 0001263043 shg:DateOfEndOfReportingPeriodMember shg:LifeInsuranceMember 2022-12-31 0001263043 ifrs-full:EquityPriceRiskMember ifrs-full:TopOfRangeMember shg:LifeInsuranceMember 2022-12-31 0001263043 shg:OptionVolatilityMember ifrs-full:BottomOfRangeMember shg:LifeInsuranceMember 2022-12-31 0001263043 ifrs-full:InterestRateRiskMember ifrs-full:WeightedAverageMember shg:LifeInsuranceMember 2022-12-31 0001263043 shg:OptionVolatilityMember shg:DateOfEndOfReportingPeriodMember shg:LifeInsuranceMember 2022-12-31 0001263043 ifrs-full:EquityPriceRiskMember ifrs-full:WeightedAverageMember shg:LifeInsuranceMember 2022-12-31 0001263043 shg:BondsSoldUnderRepurchaseAgreementsMember 2022-12-31 0001263043 ifrs-full:DerivativesMember 2022-12-31 0001263043 shg:InsuranceReceivablesMember 2022-12-31 0001263043 shg:ReceivablesFromDisposalOfSecuritiesMember 2022-12-31 0001263043 shg:DerivativesAndOtherFinancialInstrumentsMember 2022-12-31 0001263043 shg:SecuritiesLoanedMember 2022-12-31 0001263043 shg:DomesticExchangeSettlementDebitMember 2022-12-31 0001263043 shg:InsurancePayablesMember 2022-12-31 0001263043 shg:DomesticExchangeSettlementPendingMember 2022-12-31 0001263043 shg:BondsSoldUnderRepurchaseAgreementsMember 2022-12-31 0001263043 shg:PayableFromPurchaseOfSecuritiesMember 2022-12-31 0001263043 shg:SecuritiesBorrowedMember 2022-12-31 0001263043 shg:DerivativesAndOtherFinancialInstrumentsMember 2022-12-31 0001263043 ifrs-full:DerivativesMember 2022-12-31 0001263043 shg:NetAssetsNetDomesticAndForeignCurrencyExposureMember shg:OtherCurrencyMember 2022-12-31 0001263043 currency:EUR shg:SecuritiesAtFVTPLMember 2022-12-31 0001263043 shg:NetForeignCurrencyExposureMember 2022-12-31 0001263043 currency:EUR shg:NetForeignCurrencyExposureMember 2022-12-31 0001263043 currency:JPY shg:OffBalanceDerivativeExposureMember 2022-12-31 0001263043 shg:NetAssetsNetDomesticAndForeignCurrencyExposureMember 2022-12-31 0001263043 currency:EUR shg:NetAssetsNetDomesticAndForeignCurrencyExposureMember 2022-12-31 0001263043 ifrs-full:FinancialLiabilitiesMember shg:OtherCurrencyMember 2022-12-31 0001263043 ifrs-full:FinancialLiabilitiesMember currency:EUR 2022-12-31 0001263043 shg:OtherFinancialLiabilitiesMember currency:JPY 2022-12-31 0001263043 ifrs-full:FinancialLiabilitiesAtFairValueThroughProfitOrLossDesignatedUponInitialRecognitionCategoryMember 2022-12-31 0001263043 shg:OtherCurrencyMember shg:DebtSecuritiesIssuedMember 2022-12-31 0001263043 currency:USD shg:DebtSecuritiesIssuedMember 2022-12-31 0001263043 currency:USD shg:DerivativeFinancialInstrumentsLiabilitiesMember 2022-12-31 0001263043 ifrs-full:FinancialLiabilitiesAtFairValueThroughProfitOrLossCategoryMember 2022-12-31 0001263043 shg:OtherCurrencyMember ifrs-full:FinancialLiabilitiesAtFairValueThroughProfitOrLossCategoryMember 2022-12-31 0001263043 currency:CNY shg:DepositsMember 2022-12-31 0001263043 shg:FinancialAssetsClassMember currency:CNY 2022-12-31 0001263043 shg:FinancialAssetsClassMember currency:EUR 2022-12-31 0001263043 shg:FinancialAssetsClassMember currency:JPY 2022-12-31 0001263043 shg:OtherFinancialAssetsMember 2022-12-31 0001263043 currency:CNY ifrs-full:FinancialAssetsAtAmortisedCostCategoryMember 2022-12-31 0001263043 currency:EUR ifrs-full:FinancialAssetsAtAmortisedCostCategoryMember 2022-12-31 0001263043 currency:EUR ifrs-full:FinancialAssetsAtFairValueThroughOtherComprehensiveIncomeCategoryMember 2022-12-31 0001263043 currency:JPY ifrs-full:FinancialAssetsAtFairValueThroughOtherComprehensiveIncomeCategoryMember 2022-12-31 0001263043 ifrs-full:FinancialAssetsAtFairValueThroughOtherComprehensiveIncomeCategoryMember currency:USD 2022-12-31 0001263043 currency:USD shg:DerivativeFinancialInstrumentsAssetsMember 2022-12-31 0001263043 shg:LoansAtAmortizedCostMember 2022-12-31 0001263043 currency:CNY shg:LoansAtAmortizedCostMember 2022-12-31 0001263043 shg:LoansAtFvtplMember 2022-12-31 0001263043 shg:OtherCurrencyMember shg:CashAndDueFromBanksAtAmortizedCostMember 2022-12-31 0001263043 shg:CashAndDueFromBanksAtAmortizedCostMember currency:CNY 2022-12-31 0001263043 currency:JPY shg:NetForeignCurrencyExposureMember 2022-12-31 0001263043 shg:OtherCurrencyMember shg:NetForeignCurrencyExposureMember 2022-12-31 0001263043 ifrs-full:FinancialLiabilitiesMember 2022-12-31 0001263043 shg:OtherCurrencyMember shg:DerivativeFinancialInstrumentsLiabilitiesMember 2022-12-31 0001263043 currency:JPY shg:DebtSecuritiesIssuedMember 2022-12-31 0001263043 currency:USD shg:CashAndDueFromBanksAtAmortizedCostMember 2022-12-31 0001263043 currency:EUR shg:LoansAtAmortizedCostMember 2022-12-31 0001263043 shg:OtherCurrencyMember shg:DerivativeFinancialInstrumentsAssetsMember 2022-12-31 0001263043 currency:JPY ifrs-full:FinancialAssetsAtAmortisedCostCategoryMember 2022-12-31 0001263043 shg:DepositsMember currency:JPY 2022-12-31 0001263043 ifrs-full:FinancialLiabilitiesMember currency:JPY 2022-12-31 0001263043 currency:CNY shg:OffBalanceDerivativeExposureMember 2022-12-31 0001263043 shg:CashAndDueFromBanksAtAmortizedCostMember 2022-12-31 0001263043 shg:OtherCurrencyMember shg:LoansAtAmortizedCostMember 2022-12-31 0001263043 currency:CNY shg:OtherFinancialAssetsMember 2022-12-31 0001263043 shg:BorrowingsMember 2022-12-31 0001263043 currency:CNY shg:OtherFinancialLiabilitiesMember 2022-12-31 0001263043 shg:OffBalanceDerivativeExposureMember 2022-12-31 0001263043 currency:CNY shg:SecuritiesAtFVTPLMember 2022-12-31 0001263043 currency:USD shg:DepositsMember 2022-12-31 0001263043 currency:EUR shg:DerivativeFinancialInstrumentsLiabilitiesMember 2022-12-31 0001263043 currency:EUR shg:OtherFinancialAssetsMember 2022-12-31 0001263043 shg:DerivativeFinancialInstrumentsLiabilitiesMember 2022-12-31 0001263043 currency:USD ifrs-full:FinancialLiabilitiesAtFairValueThroughProfitOrLossDesignatedUponInitialRecognitionCategoryMember 2022-12-31 0001263043 shg:NetForeignCurrencyExposureMember currency:USD 2022-12-31 0001263043 currency:CNY shg:NetAssetsNetDomesticAndForeignCurrencyExposureMember 2022-12-31 0001263043 shg:NetAssetsNetDomesticAndForeignCurrencyExposureMember currency:USD 2022-12-31 0001263043 shg:LoansAtFvtplMember currency:USD 2022-12-31 0001263043 shg:DueFromBanksAtFVTPLMember currency:USD 2022-12-31 0001263043 currency:JPY shg:OtherFinancialAssetsMember 2022-12-31 0001263043 shg:FinancialAssetsClassMember 2022-12-31 0001263043 currency:JPY shg:DerivativeFinancialInstrumentsLiabilitiesMember 2022-12-31 0001263043 shg:OtherCurrencyMember shg:BorrowingsMember 2022-12-31 0001263043 shg:OtherFinancialLiabilitiesMember 2022-12-31 0001263043 ifrs-full:FinancialLiabilitiesMember currency:CNY 2022-12-31 0001263043 currency:CNY shg:DerivativeFinancialInstrumentsLiabilitiesMember 2022-12-31 0001263043 currency:USD ifrs-full:FinancialAssetsAtAmortisedCostCategoryMember 2022-12-31 0001263043 shg:OtherCurrencyMember shg:SecuritiesAtFVTPLMember 2022-12-31 0001263043 currency:JPY shg:LoansAtAmortizedCostMember 2022-12-31 0001263043 currency:EUR shg:CashAndDueFromBanksAtAmortizedCostMember 2022-12-31 0001263043 currency:USD shg:OffBalanceDerivativeExposureMember 2022-12-31 0001263043 currency:CNY shg:BorrowingsMember 2022-12-31 0001263043 shg:FinancialAssetsClassMember currency:USD 2022-12-31 0001263043 shg:OtherCurrencyMember ifrs-full:FinancialAssetsAtFairValueThroughOtherComprehensiveIncomeCategoryMember 2022-12-31 0001263043 currency:JPY shg:DerivativeFinancialInstrumentsAssetsMember 2022-12-31 0001263043 currency:EUR shg:BorrowingsMember 2022-12-31 0001263043 ifrs-full:FinancialAssetsAtAmortisedCostCategoryMember 2022-12-31 0001263043 shg:DerivativeFinancialInstrumentsAssetsMember currency:CNY 2022-12-31 0001263043 currency:USD shg:SecuritiesAtFVTPLMember 2022-12-31 0001263043 shg:OtherCurrencyMember shg:FinancialAssetsClassMember 2022-12-31 0001263043 currency:USD ifrs-full:FinancialLiabilitiesMember 2022-12-31 0001263043 currency:USD ifrs-full:FinancialLiabilitiesAtFairValueThroughProfitOrLossCategoryMember 2022-12-31 0001263043 currency:USD shg:OtherFinancialAssetsMember 2022-12-31 0001263043 currency:CNY ifrs-full:FinancialAssetsAtFairValueThroughOtherComprehensiveIncomeCategoryMember 2022-12-31 0001263043 currency:JPY shg:SecuritiesAtFVTPLMember 2022-12-31 0001263043 shg:DerivativeFinancialInstrumentsAssetsMember 2022-12-31 0001263043 shg:OtherCurrencyMember shg:OtherFinancialAssetsMember 2022-12-31 0001263043 currency:EUR shg:DepositsMember 2022-12-31 0001263043 shg:CashAndDueFromBanksAtAmortizedCostMember currency:JPY 2022-12-31 0001263043 currency:USD shg:OtherFinancialLiabilitiesMember 2022-12-31 0001263043 shg:OffBalanceDerivativeExposureMember currency:EUR 2022-12-31 0001263043 currency:CNY shg:NetForeignCurrencyExposureMember 2022-12-31 0001263043 currency:JPY shg:NetAssetsNetDomesticAndForeignCurrencyExposureMember 2022-12-31 0001263043 currency:USD shg:LoansAtAmortizedCostMember 2022-12-31 0001263043 currency:EUR shg:DerivativeFinancialInstrumentsAssetsMember 2022-12-31 0001263043 shg:DepositsMember 2022-12-31 0001263043 shg:BorrowingsMember currency:JPY 2022-12-31 0001263043 shg:DebtSecuritiesIssuedMember 2022-12-31 0001263043 currency:EUR shg:OtherFinancialLiabilitiesMember 2022-12-31 0001263043 shg:OtherCurrencyMember shg:OffBalanceDerivativeExposureMember 2022-12-31 0001263043 shg:DueFromBanksAtFVTPLMember 2022-12-31 0001263043 shg:OtherCurrencyMember ifrs-full:FinancialAssetsAtAmortisedCostCategoryMember 2022-12-31 0001263043 shg:DepositsMember shg:OtherCurrencyMember 2022-12-31 0001263043 currency:USD shg:BorrowingsMember 2022-12-31 0001263043 currency:EUR shg:DebtSecuritiesIssuedMember 2022-12-31 0001263043 shg:OtherCurrencyMember shg:OtherFinancialLiabilitiesMember 2022-12-31 0001263043 currency:CNY shg:DebtSecuritiesIssuedMember 2022-12-31 0001263043 currency:EUR shg:LoansAtFvtplMember 2022-12-31 0001263043 ifrs-full:Level2OfFairValueHierarchyMember ifrs-full:DebtSecuritiesMember 2022-12-31 0001263043 ifrs-full:Level3OfFairValueHierarchyMember shg:LoansAtAmortizedCostMember 2022-12-31 0001263043 ifrs-full:Level3OfFairValueHierarchyMember 2022-12-31 0001263043 ifrs-full:Level3OfFairValueHierarchyMember shg:OtherFinancialLiabilitiesMember 2022-12-31 0001263043 ifrs-full:Level2OfFairValueHierarchyMember shg:LoansAtAmortizedCostMember 2022-12-31 0001263043 ifrs-full:Level2OfFairValueHierarchyMember ifrs-full:FinancialAssetsAtAmortisedCostMember 2022-12-31 0001263043 ifrs-full:Level3OfFairValueHierarchyMember shg:BorrowingsMember 2022-12-31 0001263043 ifrs-full:Level3OfFairValueHierarchyMember shg:DepositsMember 2022-12-31 0001263043 ifrs-full:Level3OfFairValueHierarchyMember ifrs-full:DebtSecuritiesMember 2022-12-31 0001263043 ifrs-full:Level2OfFairValueHierarchyMember shg:DepositsMember 2022-12-31 0001263043 ifrs-full:Level2OfFairValueHierarchyMember shg:OtherFinancialLiabilitiesMember 2022-12-31 0001263043 ifrs-full:Level3OfFairValueHierarchyMember ifrs-full:FinancialAssetsAtAmortisedCostMember 2022-12-31 0001263043 ifrs-full:Level2OfFairValueHierarchyMember shg:BorrowingsMember 2022-12-31 0001263043 ifrs-full:Level3OfFairValueHierarchyMember shg:OtherFinancialAssetsMember 2022-12-31 0001263043 shg:OtherFinancialAssetsMember ifrs-full:Level2OfFairValueHierarchyMember 2022-12-31 0001263043 ifrs-full:Level2OfFairValueHierarchyMember shg:DueFromBanksAtAmortizedCostMember 2022-12-31 0001263043 shg:BondsSoldUnderRepurchaseAgreementsMember 2022-12-31 0001263043 shg:CorporationBondsMember 2022-12-31 0001263043 ifrs-full:FinancialAssetsAtAmortisedCostMember 2022-12-31 0001263043 shg:SecuritiesAtFVTPLMember 2022-12-31 0001263043 ifrs-full:FinancialAssetsAtFairValueThroughOtherComprehensiveIncomeCategoryMember 2022-12-31 0001263043 ifrs-full:GovernmentMember 2022-12-31 0001263043 shg:FinancialInstitutionsMember 2022-12-31 0001263043 shg:SecuritiesLoanedMember 2022-12-31 0001263043 shg:EquitySecuritiesMember 2022-12-31 0001263043 shg:DerivativeFinancialInstrumentsAssetsMember shg:NotDesignatedAsHedgingInstrumentTradingMember 2022-12-31 0001263043 ifrs-full:FinancialAssetsAtFairValueThroughProfitOrLossCategoryMember ifrs-full:Level3OfFairValueHierarchyMember shg:EquitySecuritiesMember 2022-12-31 0001263043 shg:DerivativeFinancialInstrumentsAssetsMember ifrs-full:Level3OfFairValueHierarchyMember shg:NotDesignatedAsHedgingInstrumentTradingMember 2022-12-31 0001263043 ifrs-full:Level3OfFairValueHierarchyMember shg:DueFromBanksAtFVTPLMember 2022-12-31 0001263043 shg:LoansAtFvtplMember ifrs-full:Level3OfFairValueHierarchyMember 2022-12-31 0001263043 shg:DueFromBanksAtFVTPLMember 2022-12-31 0001263043 ifrs-full:FinancialAssetsAtFairValueThroughProfitOrLossCategoryMember shg:EquitySecuritiesMember 2022-12-31 0001263043 ifrs-full:FinancialAssetsAtFairValueThroughProfitOrLossCategoryMember ifrs-full:Level3OfFairValueHierarchyMember ifrs-full:DebtSecuritiesMember 2022-12-31 0001263043 shg:DesignatedAsHedgingInstrumentMember shg:DerivativeFinancialInstrumentsAssetsMember 2022-12-31 0001263043 ifrs-full:FinancialAssetsAtFairValueThroughProfitOrLossCategoryMember ifrs-full:Level1OfFairValueHierarchyMember ifrs-full:DebtSecuritiesMember 2022-12-31 0001263043 ifrs-full:FinancialAssetsAtFairValueThroughOtherComprehensiveIncomeCategoryMember ifrs-full:Level1OfFairValueHierarchyMember shg:EquitySecuritiesMember 2022-12-31 0001263043 ifrs-full:FinancialAssetsAtFairValueThroughOtherComprehensiveIncomeCategoryMember ifrs-full:DebtSecuritiesMember 2022-12-31 0001263043 shg:GoldDepositsMember ifrs-full:FinancialAssetsAtFairValueThroughProfitOrLossCategoryMember 2022-12-31 0001263043 ifrs-full:FinancialAssetsAtFairValueThroughProfitOrLossCategoryMember ifrs-full:Level2OfFairValueHierarchyMember ifrs-full:DebtSecuritiesMember 2022-12-31 0001263043 ifrs-full:FinancialAssetsAtFairValueThroughOtherComprehensiveIncomeCategoryMember shg:EquitySecuritiesMember 2022-12-31 0001263043 ifrs-full:FinancialAssetsAtFairValueThroughProfitOrLossCategoryMember ifrs-full:DebtSecuritiesMember 2022-12-31 0001263043 ifrs-full:FinancialAssetsAtFairValueThroughOtherComprehensiveIncomeCategoryMember ifrs-full:Level1OfFairValueHierarchyMember ifrs-full:DebtSecuritiesMember 2022-12-31 0001263043 shg:DerivativeFinancialInstrumentsAssetsMember ifrs-full:Level2OfFairValueHierarchyMember shg:NotDesignatedAsHedgingInstrumentTradingMember 2022-12-31 0001263043 shg:LoansAtFvtplMember ifrs-full:Level2OfFairValueHierarchyMember 2022-12-31 0001263043 ifrs-full:FinancialAssetsAtFairValueThroughProfitOrLossCategoryMember ifrs-full:Level1OfFairValueHierarchyMember shg:EquitySecuritiesMember 2022-12-31 0001263043 ifrs-full:FinancialAssetsAtFairValueThroughOtherComprehensiveIncomeCategoryMember ifrs-full:Level2OfFairValueHierarchyMember ifrs-full:DebtSecuritiesMember 2022-12-31 0001263043 ifrs-full:FinancialAssetsAtFairValueThroughOtherComprehensiveIncomeCategoryMember ifrs-full:Level3OfFairValueHierarchyMember shg:EquitySecuritiesMember 2022-12-31 0001263043 shg:DerivativeFinancialInstrumentsAssetsMember ifrs-full:Level1OfFairValueHierarchyMember shg:NotDesignatedAsHedgingInstrumentTradingMember 2022-12-31 0001263043 shg:LoansAtFvtplMember 2022-12-31 0001263043 ifrs-full:FinancialAssetsAtFairValueThroughProfitOrLossCategoryMember ifrs-full:Level2OfFairValueHierarchyMember shg:EquitySecuritiesMember 2022-12-31 0001263043 ifrs-full:FinancialAssetsAtFairValueThroughProfitOrLossCategoryMember ifrs-full:Level1OfFairValueHierarchyMember shg:GoldDepositsMember 2022-12-31 0001263043 shg:DerivativeFinancialInstrumentsAssetsMember ifrs-full:Level2OfFairValueHierarchyMember shg:DesignatedAsHedgingInstrumentMember 2022-12-31 0001263043 ifrs-full:FinancialAssetsAtFairValueThroughOtherComprehensiveIncomeCategoryMember ifrs-full:Level2OfFairValueHierarchyMember shg:EquitySecuritiesMember 2022-12-31 0001263043 ifrs-full:Level1OfFairValueHierarchyMember shg:DerivativeFinancialInstrumentsAssetsMember 2022-12-31 0001263043 ifrs-full:Level2OfFairValueHierarchyMember shg:DerivativeFinancialInstrumentsAssetsMember 2022-12-31 0001263043 ifrs-full:Level3OfFairValueHierarchyMember shg:DerivativeFinancialInstrumentsAssetsMember 2022-12-31 0001263043 shg:DerivativeFinancialInstrumentsAssetsMember 2022-12-31 0001263043 ifrs-full:Level2OfFairValueHierarchyMember ifrs-full:FinancialAssetsAtFairValueThroughOtherComprehensiveIncomeCategoryMember 2022-12-31 0001263043 ifrs-full:Level3OfFairValueHierarchyMember ifrs-full:FinancialAssetsAtFairValueThroughOtherComprehensiveIncomeCategoryMember 2022-12-31 0001263043 ifrs-full:FinancialAssetsAtFairValueThroughOtherComprehensiveIncomeCategoryMember 2022-12-31 0001263043 ifrs-full:Level2OfFairValueHierarchyMember 2022-12-31 0001263043 ifrs-full:Level1OfFairValueHierarchyMember ifrs-full:FinancialAssetsAtFairValueThroughOtherComprehensiveIncomeCategoryMember 2022-12-31 0001263043 ifrs-full:Level2OfFairValueHierarchyMember shg:DueFromBanksAtFVTPLMember 2022-12-31 0001263043 ifrs-full:FinancialAssetsAtFairValueThroughProfitOrLossCategoryMember 2022-12-31 0001263043 ifrs-full:Level3OfFairValueHierarchyMember ifrs-full:FinancialAssetsAtFairValueThroughProfitOrLossCategoryMember 2022-12-31 0001263043 ifrs-full:Level2OfFairValueHierarchyMember ifrs-full:FinancialAssetsAtFairValueThroughProfitOrLossCategoryMember 2022-12-31 0001263043 ifrs-full:Level1OfFairValueHierarchyMember ifrs-full:FinancialAssetsAtFairValueThroughProfitOrLossCategoryMember 2022-12-31 0001263043 ifrs-full:Level1OfFairValueHierarchyMember 2022-12-31 0001263043 ifrs-full:Level1OfFairValueHierarchyMember ifrs-full:FinancialLiabilitiesAtFairValueThroughProfitOrLossCategoryMember 2022-12-31 0001263043 ifrs-full:FinancialLiabilitiesAtFairValueThroughProfitOrLossCategoryMember 2022-12-31 0001263043 shg:DerivativesCombinedSecuritiesSoldMember ifrs-full:FinancialLiabilitiesAtFairValueThroughProfitOrLossDesignatedUponInitialRecognitionCategoryMember ifrs-full:Level2OfFairValueHierarchyMember 2022-12-31 0001263043 shg:DerivativesCombinedSecuritiesSoldMember ifrs-full:FinancialLiabilitiesAtFairValueThroughProfitOrLossDesignatedUponInitialRecognitionCategoryMember ifrs-full:Level3OfFairValueHierarchyMember 2022-12-31 0001263043 shg:DerivativesCombinedSecuritiesSoldMember ifrs-full:FinancialLiabilitiesAtFairValueThroughProfitOrLossDesignatedUponInitialRecognitionCategoryMember 2022-12-31 0001263043 shg:DebtSecuritiesIssuedMember ifrs-full:FinancialLiabilitiesAtFairValueThroughProfitOrLossDesignatedUponInitialRecognitionCategoryMember ifrs-full:Level2OfFairValueHierarchyMember 2022-12-31 0001263043 shg:DebtSecuritiesIssuedMember ifrs-full:FinancialLiabilitiesAtFairValueThroughProfitOrLossDesignatedUponInitialRecognitionCategoryMember ifrs-full:Level3OfFairValueHierarchyMember 2022-12-31 0001263043 shg:DebtSecuritiesIssuedMember ifrs-full:FinancialLiabilitiesAtFairValueThroughProfitOrLossDesignatedUponInitialRecognitionCategoryMember 2022-12-31 0001263043 ifrs-full:Level2OfFairValueHierarchyMember ifrs-full:FinancialLiabilitiesAtFairValueThroughProfitOrLossDesignatedUponInitialRecognitionCategoryMember 2022-12-31 0001263043 ifrs-full:Level3OfFairValueHierarchyMember ifrs-full:FinancialLiabilitiesAtFairValueThroughProfitOrLossDesignatedUponInitialRecognitionCategoryMember 2022-12-31 0001263043 ifrs-full:FinancialLiabilitiesAtFairValueThroughProfitOrLossDesignatedUponInitialRecognitionCategoryMember 2022-12-31 0001263043 shg:DerivativeFinancialInstrumentsLiabilitiesMember ifrs-full:Level1OfFairValueHierarchyMember 2022-12-31 0001263043 shg:DerivativeFinancialInstrumentsLiabilitiesMember ifrs-full:Level2OfFairValueHierarchyMember 2022-12-31 0001263043 shg:DerivativeFinancialInstrumentsLiabilitiesMember ifrs-full:Level3OfFairValueHierarchyMember 2022-12-31 0001263043 shg:DerivativeFinancialInstrumentsLiabilitiesMember 2022-12-31 0001263043 shg:DerivativeFinancialInstrumentsLiabilitiesMember ifrs-full:Level2OfFairValueHierarchyMember shg:NotDesignatedAsHedgingInstrumentTradingMember 2022-12-31 0001263043 ifrs-full:FinancialLiabilitiesAtFairValueThroughProfitOrLossCategoryMember shg:SecuritiesSoldMember 2022-12-31 0001263043 ifrs-full:FinancialLiabilitiesAtFairValueThroughProfitOrLossCategoryMember ifrs-full:Level1OfFairValueHierarchyMember shg:GoldDepositsMember 2022-12-31 0001263043 ifrs-full:FinancialLiabilitiesAtFairValueThroughProfitOrLossCategoryMember ifrs-full:Level1OfFairValueHierarchyMember shg:SecuritiesSoldMember 2022-12-31 0001263043 shg:DerivativeFinancialInstrumentsLiabilitiesMember ifrs-full:Level3OfFairValueHierarchyMember shg:NotDesignatedAsHedgingInstrumentTradingMember 2022-12-31 0001263043 shg:DerivativeFinancialInstrumentsLiabilitiesMember ifrs-full:Level1OfFairValueHierarchyMember shg:NotDesignatedAsHedgingInstrumentTradingMember 2022-12-31 0001263043 shg:DesignatedAsHedgingInstrumentMember ifrs-full:Level2OfFairValueHierarchyMember shg:DerivativeFinancialInstrumentsLiabilitiesMember 2022-12-31 0001263043 shg:DerivativeFinancialInstrumentsLiabilitiesMember shg:DesignatedAsHedgingInstrumentMember 2022-12-31 0001263043 shg:DerivativeFinancialInstrumentsLiabilitiesMember shg:NotDesignatedAsHedgingInstrumentTradingMember 2022-12-31 0001263043 ifrs-full:FinancialLiabilitiesAtFairValueThroughProfitOrLossCategoryMember shg:GoldDepositsMember 2022-12-31 0001263043 shg:DerivativeFinancialInstrumentsLiabilitiesMember ifrs-full:Level3OfFairValueHierarchyMember shg:DesignatedAsHedgingInstrumentMember 2022-12-31 0001263043 ifrs-full:FinancialGuaranteeContractsMember 2022-12-31 0001263043 ifrs-full:DerivativesMember 2022-12-31 0001263043 shg:DepositsAndLoansAtFVTPLMember shg:SubsidiaryShinhanBankMember 2022-12-31 0001263043 shg:SubsidiaryShinhanCardMember shg:DueFromBanksAndLoansAtAmortizedCostMember 2022-12-31 0001263043 ifrs-full:LoanCommitmentsMember 2022-12-31 0001263043 shg:DueFromBanksAndLoansAtAmortizedCostMember shg:SubsidiaryShinhanBankMember 2022-12-31 0001263043 shg:DesignatedAsHedgingInstrumentMember 2022-12-31 0001263043 shg:NotDesignatedAsHedgingInstrumentTradingMember shg:ForeignExchangeContractMember shg:OverTheCounterMember 2022-12-31 0001263043 shg:NotDesignatedAsHedgingInstrumentTradingMember shg:InterestRateContractMember shg:ExchangeTradedMember 2022-12-31 0001263043 shg:NotDesignatedAsHedgingInstrumentTradingMember shg:InterestRateContractMember 2022-12-31 0001263043 shg:NotDesignatedAsHedgingInstrumentTradingMember shg:EquityContractMember shg:OverTheCounterMember shg:EquitySwapsAndForwardsMember 2022-12-31 0001263043 shg:NotDesignatedAsHedgingInstrumentTradingMember shg:EquityContractMember shg:OverTheCounterMember shg:EquityOptionsMember 2022-12-31 0001263043 shg:NotDesignatedAsHedgingInstrumentTradingMember shg:EquityContractMember shg:ExchangeTradedMember shg:EquityOptionsMember 2022-12-31 0001263043 shg:ExchangeTradedMember shg:EquityContractMember shg:NotDesignatedAsHedgingInstrumentTradingMember 2022-12-31 0001263043 shg:InterestRatesRelatedMember shg:OverTheCounterMember shg:NotDesignatedAsHedgingInstrumentTradingMember 2022-12-31 0001263043 ifrs-full:FuturesContractMember shg:ExchangeTradedMember shg:ForeignExchangeContractMember shg:NotDesignatedAsHedgingInstrumentTradingMember 2022-12-31 0001263043 shg:NotDesignatedAsHedgingInstrumentTradingMember shg:EquityContractMember shg:OverTheCounterMember 2022-12-31 0001263043 shg:NotDesignatedAsHedgingInstrumentTradingMember shg:EquityContractMember 2022-12-31 0001263043 shg:InterestRateContractMember shg:NotDesignatedAsHedgingInstrumentTradingMember shg:ExchangeTradedMember ifrs-full:InterestRateSwapContractMember 2022-12-31 0001263043 shg:NotDesignatedAsHedgingInstrumentTradingMember shg:InterestRateContractMember shg:ExchangeTradedMember shg:InterestRateFutureContractMember 2022-12-31 0001263043 shg:EquityFuturesMember shg:ExchangeTradedMember shg:EquityContractMember shg:NotDesignatedAsHedgingInstrumentTradingMember 2022-12-31 0001263043 ifrs-full:SwapContractMember shg:OverTheCounterMember shg:ForeignExchangeContractMember shg:NotDesignatedAsHedgingInstrumentTradingMember 2022-12-31 0001263043 ifrs-full:SwapContractMember shg:ForeignExchangeContractMember shg:DesignatedAsHedgingInstrumentMember 2022-12-31 0001263043 shg:DesignatedAsHedgingInstrumentMember shg:ForeignExchangeContractMember shg:InterestRateForwardsAndSwapsMember 2022-12-31 0001263043 shg:DesignatedAsHedgingInstrumentMember shg:ForeignExchangeContractMember ifrs-full:ForwardContractMember 2022-12-31 0001263043 shg:CommoditySwapsAndForwardsMember shg:OverTheCounterMember shg:CommodityContractMember shg:NotDesignatedAsHedgingInstrumentTradingMember 2022-12-31 0001263043 shg:CommodityOptionsMember shg:OverTheCounterMember shg:CommodityRelatedMember shg:CommodityContractMember shg:NotDesignatedAsHedgingInstrumentTradingMember 2022-12-31 0001263043 shg:CommodityFuturesAndOptionsMember shg:ExchangeTradedMember shg:CommodityContractMember shg:NotDesignatedAsHedgingInstrumentTradingMember 2022-12-31 0001263043 shg:OverTheCounterMember shg:CommodityContractMember shg:NotDesignatedAsHedgingInstrumentTradingMember 2022-12-31 0001263043 shg:CommodityContractMember shg:NotDesignatedAsHedgingInstrumentTradingMember 2022-12-31 0001263043 ifrs-full:OptionContractMember shg:OverTheCounterMember shg:ForeignExchangeContractMember shg:NotDesignatedAsHedgingInstrumentTradingMember 2022-12-31 0001263043 shg:InterestRateForwardsAndSwapsMember shg:InterestRatesRelatedMember shg:OverTheCounterMember shg:NotDesignatedAsHedgingInstrumentTradingMember 2022-12-31 0001263043 shg:CreditSwapsMember shg:OverTheCounterMember shg:CreditRiskContractMember shg:NotDesignatedAsHedgingInstrumentTradingMember 2022-12-31 0001263043 ifrs-full:ForwardContractMember shg:OverTheCounterMember shg:ForeignExchangeContractMember shg:NotDesignatedAsHedgingInstrumentTradingMember 2022-12-31 0001263043 shg:InterestRatesRelatedMember shg:InterestRateOptionContractMember shg:OverTheCounterMember shg:NotDesignatedAsHedgingInstrumentTradingMember 2022-12-31 0001263043 shg:ForeignExchangeContractMember shg:NotDesignatedAsHedgingInstrumentTradingMember 2022-12-31 0001263043 shg:InterestRateOptionContractMember shg:ExchangeTradedMember shg:InterestRateContractMember shg:NotDesignatedAsHedgingInstrumentTradingMember 2022-12-31 0001263043 shg:GeneralAssetRiskMember 2022-12-31 0001263043 shg:SecuritiesFidelityGuaranteeAndLiabilityInsuranceAndOthersMember 2022-12-31 0001263043 shg:EmployeesMember 2022-12-31 0001263043 shg:CashAndSecuritiesMember 2022-12-31 0001263043 shg:CashAndCashEquivalentsMember 2022-12-31 0001263043 shg:DirectorsAndOfficersLiabilityInsuranceMember 2022-12-31 0001263043 shg:FurnitureAndFixturesMember 2022-12-31 0001263043 ifrs-full:AccumulatedDepreciationAndAmortisationMember 2022-12-31 0001263043 ifrs-full:AccumulatedImpairmentMember 2022-12-31 0001263043 shg:AcquisitionRelatedCostsMember 2022-12-31 0001263043 shg:ExchangeTradedMember shg:EquityOptionsMember 2022-12-31 0001263043 shg:CommodityRelatedMember shg:OverTheCounterMember shg:CommoditySwapsAndForwardsMember 2022-12-31 0001263043 shg:CommodityOptionsMember shg:OverTheCounterMember shg:CommodityRelatedMember 2022-12-31 0001263043 shg:CommodityRelatedMember shg:CommodityFuturesAndOptionsMember shg:ExchangeTradedMember 2022-12-31 0001263043 shg:ExchangeTradedMember shg:CommodityRelatedMember 2022-12-31 0001263043 shg:HedgeFundsMember ifrs-full:ForwardContractMember 2022-12-31 0001263043 shg:HedgeFundsMember ifrs-full:SwapContractMember 2022-12-31 0001263043 shg:ExchangeTradedMember shg:EquityFuturesMember 2022-12-31 0001263043 shg:HedgeFundsMember 2022-12-31 0001263043 shg:OverTheCounterMember shg:CommodityRelatedMember 2022-12-31 0001263043 shg:HedgeFundsMember shg:InterestRateForwardsAndSwapsMember 2022-12-31 0001263043 shg:ExchangeTradedMember 2022-12-31 0001263043 shg:EquityRelatedMember shg:OverTheCounterMember shg:EquityOptionsMember 2022-12-31 0001263043 shg:EquityRelatedMember shg:OverTheCounterMember shg:EquitySwapsAndForwardsMember 2022-12-31 0001263043 shg:CreditRelatedMember shg:OverTheCounterMember shg:CreditSwapsMember 2022-12-31 0001263043 shg:EquityRelatedMember shg:OverTheCounterMember 2022-12-31 0001263043 shg:NotDesignatedAsHedgingInstrumentTradingMember shg:InterestRateContractMember shg:OverTheCounterMember shg:InterestRateForwardsAndSwapsMember 2022-12-31 0001263043 shg:ExchangeTradedMember shg:InterestRateOptionContractMember shg:InterestRatesRelatedMember 2022-12-31 0001263043 shg:InterestRateFutureContractMember shg:ExchangeTradedMember shg:InterestRatesRelatedMember 2022-12-31 0001263043 shg:NotDesignatedAsHedgingInstrumentTradingMember shg:InterestRateContractMember shg:OverTheCounterMember 2022-12-31 0001263043 shg:ExchangeTradedMember shg:InterestRatesRelatedMember 2022-12-31 0001263043 shg:InterestRatesRelatedMember 2022-12-31 0001263043 shg:NotDesignatedAsHedgingInstrumentTradingMember shg:InterestRateContractMember shg:OverTheCounterMember shg:InterestRateOptionContractMember 2022-12-31 0001263043 shg:ForeignCurrencyMember 2022-12-31 0001263043 shg:ForeignCurrencyMember 2022-12-31 0001263043 ifrs-full:LaterThanTwoYearsAndNotLaterThanThreeYearsMember 2022-12-31 0001263043 ifrs-full:LaterThanOneYearAndNotLaterThanTwoYearsMember 2022-12-31 0001263043 ifrs-full:NotLaterThanOneYearMember 2022-12-31 0001263043 ifrs-full:LaterThanFiveYearsMember 2022-12-31 0001263043 ifrs-full:LaterThanFourYearsAndNotLaterThanFiveYearsMember 2022-12-31 0001263043 ifrs-full:LaterThanThreeYearsAndNotLaterThanFourYearsMember 2022-12-31 0001263043 ifrs-full:ActuarialAssumptionOfDiscountRatesMember 2022-12-31 0001263043 ifrs-full:ActuarialAssumptionOfExpectedRatesOfSalaryIncreasesMember 2022-12-31 0001263043 ifrs-full:ProvisionForDecommissioningRestorationAndRehabilitationCostsMember 2022-12-31 0001263043 shg:NonfinancialGuaranteeContractsIssuedMember 2022-12-31 0001263043 shg:GuaranteeContractsIssuedMember 2022-12-31 0001263043 shg:UnusedCreditCommitmentsMember 2022-12-31 0001263043 ifrs-full:LegalProceedingsProvisionMember 2022-12-31 0001263043 ifrs-full:FinancialGuaranteeContractsMember 2022-12-31 0001263043 ifrs-full:MiscellaneousOtherProvisionsMember 2022-12-31 0001263043 shg:LongtermMember 2022-12-31 0001263043 shg:GeneralInsuranceMember 2022-12-31 0001263043 shg:EndowmentMember 2022-12-31 0001263043 shg:SavingsMember 2022-12-31 0001263043 shg:PureEndowmentMember 2022-12-31 0001263043 shg:PureProtectionMember 2022-12-31 0001263043 shg:IndividualPoliciesMember 2022-12-31 0001263043 shg:DeathMember 2022-12-31 0001263043 shg:GroupPoliciesMember 2022-12-31 0001263043 shg:BankingMember 2022-12-31 0001263043 shg:CreditCardMember 2022-12-31 0001263043 ifrs-full:GoodwillMember 2022-12-31 0001263043 ifrs-full:AllOtherSegmentsMember 2022-12-31 0001263043 shg:LifeInsuranceMember 2022-12-31 0001263043 shg:SecuritiesMember 2022-12-31 0001263043 shg:AssociatesKiwoomMilestoneProfessionalPrivateRealEstateTrust19Member 2022-12-31 0001263043 shg:AssociatesShinhanGlobalHealthcareFund1Member 2022-12-31 0001263043 shg:AssociatesMIELCOLTDMember 2022-12-31 0001263043 shg:AssociatesMidasAssetGlobalCREDebtPrivateFundNo6Member 2022-12-31 0001263043 shg:AssociatesNHAmundiGlobalInfrastructureTrust14Member 2022-12-31 0001263043 shg:MilestonePrivateRealEstateFund3Member 2022-12-31 0001263043 shg:AssociatesEHealthcareInvestmentFundNo6Member 2022-12-31 0001263043 shg:AssociatesVestasQualifiedInvestorsPrivateRealEstateFundInvestmentTrustNo37Member 2022-12-31 0001263043 shg:AssociatesOneShinhanGlobalFund1Member 2022-12-31 0001263043 shg:AssociatesKoreaOmegaProjectFundIIIMember 2022-12-31 0001263043 shg:AssociatesDeutscheGlobalProfessionalInvestmentTypePrivateRealEstateInvestmentTrustNo24Member 2022-12-31 0001263043 shg:AssociatesNHamundiGlobalInfraPrivateFund16Member 2022-12-31 0001263043 shg:AssociatesSamchullyMidstreamPrivatePlacementSpecialAssetFund54Member 2022-12-31 0001263043 shg:AssociatesGenesisNo1PrivateEquityFundMember 2022-12-31 0001263043 shg:AssociatesAIPTransportationSpecializedPrivatelyPlacedFundTrust1Member 2022-12-31 0001263043 shg:AssociatesKiwoomShinhanInnovationFundIMember 2022-12-31 0001263043 shg:AssociatesGenesisNorthAmericaPowerCompanyNo1PEFMember 2022-12-31 0001263043 shg:AssociatesShinhanNeopluxEnergyNewbizFundMember 2022-12-31 0001263043 shg:AssociatesShinhanMidasDongaSecondaryFundMember 2022-12-31 0001263043 shg:AssociatesKBNAHickoryPrivateSpecialAssetFundMember 2022-12-31 0001263043 shg:AssociatesShinhanAlbatrossTechInvestmentFundMember 2022-12-31 0001263043 shg:AssociatesKTBNewlakeGlobalHealthcarePEFMember 2022-12-31 0001263043 shg:AssociatesHermesPrivateInvestmentEquityFundMember 2022-12-31 0001263043 shg:AssociatesBNPParibasCardifLifeInsuranceMember 2022-12-31 0001263043 shg:AssociatesPartners4thGrowthInvestmentFundMember 2022-12-31 0001263043 shg:AssociatesShinHanSooYoungEntrepreneurInvestmentFundNo1Member 2022-12-31 0001263043 shg:VogoDebtStrategyQualifiedInvPrivateMember 2022-12-31 0001263043 shg:AssociatesKoramcoEuropeCorePrivatePlacementRealEstateFundNo2and2Member 2022-12-31 0001263043 shg:AssociatesStonebridgeCorporate1stFundMember 2022-12-31 0001263043 shg:AssociatesIMMGlobalPrivateEquityFundMember 2022-12-31 0001263043 shg:AssociatesGoduckGangil1PFVCoLtdMember 2022-12-31 0001263043 shg:AssociatesFuturePlayShinhanTechInnovationFund1Member 2022-12-31 0001263043 shg:AssociatesVogoRealtyPartnersPrivateRealEstateFundVMember 2022-12-31 0001263043 shg:AssociatesSBCPFVCoLtdMember 2022-12-31 0001263043 shg:AssociatesKoreaCreditBureauMember 2022-12-31 0001263043 shg:AssociatesShinhanAIMRealEstateFundNo1Member 2022-12-31 0001263043 shg:AssociatesStBonanjaFoodTechMember 2022-12-31 0001263043 shg:AssociatesNHAmundiUSInfrastructurePrivateFund2Member 2022-12-31 0001263043 shg:AssociatesShinhanAIMRealEstateFundNo2Member 2022-12-31 0001263043 shg:AssociatesAoneMezzanineOpportunityProfessionalPrivateMember 2022-12-31 0001263043 shg:SamsungSraRealEstateProfessionalPrivate45Member 2022-12-31 0001263043 shg:AssociatesIBKGlobalNewRenewableEnergySpecialAssetProfessionalPrivate2Member 2022-12-31 0001263043 shg:AssociatesKoreaOmegaShinhanProjectFundIMember 2022-12-31 0001263043 shg:AssociatesVSCornerstoneFundMember 2022-12-31 0001263043 shg:AssociatesPacificPrivatePlacementRealEstateFundNo40Member 2022-12-31 0001263043 shg:AssociatesKakaoShinhan1stTNYTFundMember 2022-12-31 0001263043 shg:AssociatesIMMSpecialSituation12PRIVATEEQUITYFUNDMember 2022-12-31 0001263043 shg:AssociatesMasternPrivateRealEstateLoanFundNo2Member 2022-12-31 0001263043 shg:AssociatesNeopluxMarketFrontierSecondaryFundMember 2022-12-31 0001263043 shg:AssociatesJRAMCHungaryBudapestOfficeFund16Member 2022-12-31 0001263043 shg:AssociatesNewWave6thFundMember 2022-12-31 0001263043 shg:EDNCENTRALCoLtdMember 2022-12-31 0001263043 shg:AssociatesLBScotlandAmazonFulfillmentCenterFund29Member 2022-12-31 0001263043 shg:AssociatesGyeonggiNeopluxSupermanFundMember 2022-12-31 0001263043 shg:AssociatesNeopluxNo3PrivateEquityFundMember 2022-12-31 0001263043 shg:AssociatesAIONELFISPROFESSIONALPRIVATE1Member 2022-12-31 0001263043 shg:AssociatesHarvestPrivateEquityFundIiMember 2022-12-31 0001263043 shg:AssociatesFutureCreationNeopluxVentureCapitalFundMember 2022-12-31 0001263043 shg:AssociatesPCCAmberstonePrivateEquityFundIMember 2022-12-31 0001263043 shg:AssociatesMasternOpportunitySeekingRealEstateFundIIMember 2022-12-31 0001263043 shg:AssociatesTF2020SSPrivateEquityFundSpecializinginStartupandVentureBusinessMember 2022-12-31 0001263043 shg:KTCNPGrowthChamp20112PrivateEquityFundMember 2022-12-31 0001263043 shg:AssociatesKbOaktreeTrustNo.3Member 2022-12-31 0001263043 shg:AssociatesJbIncheonBucheonReitsNo.54Member 2022-12-31 0001263043 shg:AssociatesSwfvFund1Member 2022-12-31 0001263043 shg:AssociatesJsShinhanPrivateEquityFundMember 2022-12-31 0001263043 shg:AssociatesMetaEsgPrivateEquityFundIMember 2022-12-31 0001263043 shg:AssociatesShinhanVcTomorrowVentureFund1Member 2022-12-31 0001263043 shg:AssociatesTresyujinTrustMember 2022-12-31 0001263043 shg:AssociatesDaehanNo.36OfficeAssetManagementCompanyMember 2022-12-31 0001263043 shg:AssociatesHankookSmartRealAssetInvestmentTrustNo.3Member 2022-12-31 0001263043 shg:AssociatesSksYozmaFundNo.1Member 2022-12-31 0001263043 shg:AssociatesPharosDkFundMember 2022-12-31 0001263043 shg:AssociatesDaishinNewgenNewTechnologyInvestmentFund1stMember 2022-12-31 0001263043 shg:AssociatesAves1stCorporateRecoveryPrivateEquityFundMember 2022-12-31 0001263043 shg:AssociatesHanyangMeritz1FundMember 2022-12-31 0001263043 shg:AssociatesKnt2ndPrivateEquityFundMember 2022-12-31 0001263043 shg:AssociatesNauticSmartNo.6PrivateEquityFundMember 2022-12-31 0001263043 shg:AssociatesMapleMobilityFundMember 2022-12-31 0001263043 shg:AssociatesPremierLuminousPrivateEquityFundMember 2022-12-31 0001263043 shg:AssociatesTiFirstPropertyPrivateInvestmentTrust1Member 2022-12-31 0001263043 shg:AssociatesShinhanSmilegateGlobalPefIMember 2022-12-31 0001263043 shg:AssociatesGenesisEcoNo.1PefMember 2022-12-31 0001263043 shg:AssociatesNewlakeGrowthCapitalPartners2PefMember 2022-12-31 0001263043 shg:AssociatesClBuyout1stPefMember 2022-12-31 0001263043 shg:AssociatesTCoreIndustrialTechnology1stVenturePefMember 2022-12-31 0001263043 shg:AssociatesJMoorimJadeInvestmentFundMember 2022-12-31 0001263043 shg:AssociatesMplusProfessionalPrivateRealEstateFund25Member 2022-12-31 0001263043 shg:AssociatesCuriousFinaleCorporateRecoveryPrivateEquityFundMember 2022-12-31 0001263043 shg:AssociatesUlmusShcInnovationInvestmentFundMember 2022-12-31 0001263043 shg:AssociatesShinhanneoMarketfrontier2ndFundMember 2022-12-31 0001263043 shg:AssociatesIbkcGlobalContentsInvestmentFundMember 2022-12-31 0001263043 shg:AssociatesMiraeAssetPartnersXPrivateEquityFundMember 2022-12-31 0001263043 shg:AssociatesNhsynergyCoreIndustrialNewTechnologyFundMember 2022-12-31 0001263043 shg:AssociatesTimefolioTheVenturevSecondMember 2022-12-31 0001263043 shg:AssociatesDaishinNewTechnologyInvestmentFund5thMember 2022-12-31 0001263043 shg:AssociatesSynergyGreenNewDeal1stNewTechnologyBusinessInvestmentFundMember 2022-12-31 0001263043 shg:SHINHANNEOCoreIndustrialTechnologyFundMember 2022-12-31 0001263043 shg:AssociatesKAIMRealestatePrivateInvestmentTrust20Member 2022-12-31 0001263043 shg:AssociatesKIAMCOVietnamSolarSpecialAssetPrivateInvestmentTrustMember 2022-12-31 0001263043 shg:AssociatesShinhantimeMezzanineBlindFundMember 2022-12-31 0001263043 shg:AssociatesHighland20218FundMember 2022-12-31 0001263043 shg:AssociatesJbHwaseongHadongReitsNo.53Member 2022-12-31 0001263043 shg:AssociatesCapstoneReitsNo.26Member 2022-12-31 0001263043 shg:AssociatesTf2019BearingPrivateEquityFundSpecializingInStartupAndVentureBusinessMember 2022-12-31 0001263043 shg:ShbnppBnctProfessionalInvestmentTypePrivateSpecialAssetInvestmentTrustMember 2022-12-31 0001263043 shg:ShbnppDaeguGreenPowerCogenerationSystemProfessionalInvestmentTypePrivateSpecialAssetInvestmentTrustMember 2022-12-31 0001263043 shg:ShbnppSangjuYcExpresswayProfessionalInvestmentTypePrivateSpecialAssetInvestmentTrustMember 2022-12-31 0001263043 shg:ShbnppGlobalInfrastructureProfessionalInvestmentTypePrivateSpecialAssetInvestmentTrustNo.7To2UsdMember 2022-12-31 0001263043 shg:AssociatesSjEsgInnovativeGrowthFundMember 2022-12-31 0001263043 shg:AssociatesNhKyoboAiSolutionInvestmentFundMember 2022-12-31 0001263043 shg:AssociatesDdiLvcMasterRealEstateInvestmentTrustCo.Ltd.Member 2022-12-31 0001263043 shg:AssociatesFindGreenNewDeal2ndEquityFundMember 2022-12-31 0001263043 shg:AssociatesShinhanFitrin1stTechnologyBusinessInvestmentAssociationMember 2022-12-31 0001263043 shg:AssociatesKdbcmidasDongaGlobalContentsFundMember 2022-12-31 0001263043 shg:AssociatesMeritzAISingA330BInvestmentTypePrivatePlacementSpecialAssetFundMember 2022-12-31 0001263043 shg:AssociatesMeritzAISingA330AInvestmentTypePrivatePlacementSpecialAssetFundMember 2022-12-31 0001263043 shg:AssociatesParatusNo.3PrivateEquityFundMember 2022-12-31 0001263043 shg:AssociatesLbYoungnamLogisticsPrivateTrustNo.40Member 2022-12-31 0001263043 shg:AssociatesShinhanCognitiveStartupFundL.p.Member 2022-12-31 0001263043 shg:AssociatesIgen2022No.1PrivateEquityFundMember 2022-12-31 0001263043 shg:AssociatesNhBrainEvFundMember 2022-12-31 0001263043 shg:AssociatesSticAltGlobalIiPrivateEquityFundMember 2022-12-31 0001263043 shg:AssociatesTigerGreenAlpahTrustNo.29Member 2022-12-31 0001263043 shg:AssociatesKoreaInvestmentDevelopSeedTrustNo.1Member 2022-12-31 0001263043 shg:AssociatesShinhanSimoneFundIMember 2022-12-31 0001263043 shg:AssociatesHarvestFundNo.3Member 2022-12-31 0001263043 shg:AssociatesSHBNPPGreenNewDealEnergyProfessionalInvestmentTypePrivateSpecialAssetInvestmentTrustNo2Member 2022-12-31 0001263043 shg:AssociatesSimoneMezzanineFundNo3Member 2022-12-31 0001263043 shg:AssociatesGoduckGangil10PfvCo.LtdMember 2022-12-31 0001263043 shg:AssociatesWWGGlobalRealEstateInvestmentTrustno4Member 2022-12-31 0001263043 shg:AssociatesIGISRealestatePrivateInvestmentTrustNo33Member 2022-12-31 0001263043 shg:AssociatesBNWTechInnovationPrivateEquityFundMember 2022-12-31 0001263043 shg:AssociatesKIAMCOPOWERLOANTRUST4THMember 2022-12-31 0001263043 shg:AssociatesShinhanGlobalHealthcareFund2Member 2022-12-31 0001263043 shg:AssociatesAIPEUROPRIVATEREALESTATETRUSTNo12Member 2022-12-31 0001263043 shg:AssociatesFidelisGlobalPrivateRealEstateTrustNo2Member 2022-12-31 0001263043 shg:AssociatesDigitalNewDealKappaPrivateEquityFundMember 2022-12-31 0001263043 shg:AssociatesOnNo.1PrivateEquityFundMember 2022-12-31 0001263043 shg:AssociatesNauticGreenInnovationEsgCoinvestmentNo.1PrivateEquityFundMember 2022-12-31 0001263043 shg:AssociatesIbkcbehighFund1stMember 2022-12-31 0001263043 shg:AssociatesNhDaishinKyoboHealthcare1FundMember 2022-12-31 0001263043 shg:AssociatesCapstoneDevelopFrontierTrustMember 2022-12-31 0001263043 shg:AssociatesImmGlobalVentureOpportunityLpMember 2022-12-31 0001263043 shg:AssociatesNhjibkcLabelTechnologyFundMember 2022-12-31 0001263043 shg:AssociatesShinhanGlobalActiveReitCo.ltdMember 2022-12-31 0001263043 shg:AssociatesBts2ndPrivateEquityFundMember 2022-12-31 0001263043 shg:AssociatesKoreaInvestmentGreenNewdealInfraTrustNo.1Member 2022-12-31 0001263043 shg:AssociatesKdbInvestmentGlobalHealthcarePrivateEquityFundIMember 2022-12-31 0001263043 shg:AssociatesLogisvalleyShinhanReitCo.ltd.Member 2022-12-31 0001263043 shg:AssociatesCornerstoneJmFundIMember 2022-12-31 0001263043 shg:AssociatesEumPrivateEquityFundNo7Member 2022-12-31 0001263043 shg:AssociatesKiwoomHeroNo4PrivateEquityFundMember 2022-12-31 0001263043 shg:AssociatesVogoCanisterProfessionalTrustPrivateFundIMember 2022-12-31 0001263043 shg:AssociatesSwsFundMember 2022-12-31 0001263043 shg:AssociatesKiwoomShinhanInnovationFund2Member 2022-12-31 0001263043 shg:AssociatesRhinosPremierMezzaninePrivateInvestmentFundNo.1Member 2022-12-31 0001263043 shg:AssociatesShinhanPraxisKGrowthGlobalPrivateEquityFundMember 2022-12-31 0001263043 shg:AssociatesShinhanNvestorLiquiditySolutionFundMember 2022-12-31 0001263043 shg:AssociatesShinhanAIMFoFFund1aMember 2022-12-31 0001263043 shg:AssociatesIGISGlobalCreditFund1501Member 2022-12-31 0001263043 shg:AssociatesJarvisMemorialPrivateInvestmentTrust1Member 2022-12-31 0001263043 shg:AssociatesSparklabsShinhanOpportunityFund1Member 2022-12-31 0001263043 shg:AssociatesShinhanKunicornFirstFundMember 2022-12-31 0001263043 shg:AssociatesFivetreeGeneralPrivateEquityNundNo.15Member 2022-12-31 0001263043 shg:AssociatesKoreaInvestmentTopMezzaninePrivateRealEsateTrustNo.1Member 2022-12-31 0001263043 shg:AssociatesRifaRealEstatePrivatePlacementFundForNormalInvestoesNo.51Member 2022-12-31 0001263043 shg:ShSeniorLoanProfessionalInvestmentTypePrivateMixedAssetInvestmentTrustNo.2Member 2022-12-31 0001263043 shg:AssociatesRifaRealEstatePrivatePlacementFundForNormalInvestorsNo.31Member 2022-12-31 0001263043 shg:AssociatesSHBNPPSeniorLoanProfessionalInvestmentTypePrivateMixedAssetInvestmentTrustNo3Member 2022-12-31 0001263043 shg:AssociatesShbnppMainProfessionalInvestmentTypePrivateMixedAssetInvestmentTrustNo.3Member 2022-12-31 0001263043 shg:AssociatesPartnerOneValueUpIPrivateEquityFundMember 2022-12-31 0001263043 shg:AssociatesGoldenRoute2ndStartupVentureSpecializedPrivateEquityFundMember 2022-12-31 0001263043 shg:AssociatesKoramcoPrivateRealEstateFund143Member 2022-12-31 0001263043 shg:ShbnppJapanPhotovoltaicPrivateSpecialAssetInvestmentTrustNo.2Member 2022-12-31 0001263043 shg:AssociatesHelioskdbcDigitalContents1stMember 2022-12-31 0001263043 shg:AssociateHIOTAFundMember 2022-12-31 0001263043 shg:AssociateStonebridgeshinhanUnicornSecondaryFundMember 2022-12-31 0001263043 shg:AssociatesIBKCMETISGlobalContentsInvestmentFundMember 2022-12-31 0001263043 shg:AssociatesKeistoneUnicornPrivateEquityFundMember 2022-12-31 0001263043 shg:AssociatesKbDistributionPrivateRealEstate31Member 2022-12-31 0001263043 shg:AssociatesEventusIbkcLibFundMember 2022-12-31 0001263043 shg:AssociatesPacificPrivateInvestmentTrustNo.491Member 2022-12-31 0001263043 shg:AssociatesKiwoomRealEstatePrivatePlacementFundForNormalInvestorsNo.31Member 2022-12-31 0001263043 shg:AssociatesShSustainableManagementEsgShortTermBondSecurityFeederInvestmentTrustNo.1Member 2022-12-31 0001263043 shg:AssociatesShRealEstateLoanInvestmentTypePrivateRealEstateInvestmentTrustNo.2Member 2022-12-31 0001263043 shg:AssociatesShinhanJigaeNamsanRoadPrivateSpecialAssetInvestmentTrustMember 2022-12-31 0001263043 shg:AssociatesSh1.5yearsMaturityInvestmentTypeSecurityInvestmentTrustNo.2Member 2022-12-31 0001263043 shg:AssociatesOthers2022Member 2022-12-31 0001263043 shg:AssociatesIGISGLIPProfessionalInvestmentPrivateRealEstateInvestmentTrustNo11Member 2022-12-31 0001263043 shg:AssociatesHiotaFundMember 2022-12-31 0001263043 shg:AssociatesStonebridgeShinhanUnicornSecondaryFundMember 2022-12-31 0001263043 shg:ShbnppCorporateProfessionalInvestmentTypePrivateSecurityInvestmentTrustNo.7Member 2022-12-31 0001263043 shg:ShinhanEzGeneralInsuranceLtdMember 2022-12-31 0001263043 shg:AssociatesKBDistributionPrivateRealEstate1Member 2022-12-31 0001263043 shg:AssociatesAcurusHyundaiInvestmentPartnersNewTechnologyMember 2022-12-31 0001263043 shg:AssociatesKiwoomPrivateEquityAntManStartupVentureSpecializedPrivateEquityFundMember 2022-12-31 0001263043 shg:AssociatesEdncentralCo.ltdMember 2022-12-31 0001263043 shg:AssociatesKtcnpGrowthChamp20112PrivateEquityFundMember 2022-12-31 0001263043 shg:AssociatesShinhanneoCoreIndustrialTechnologyFundMember 2022-12-31 0001263043 shg:AssociatesFountProfessionalInvestorsPrivateInvestmentTrustNo.3Member 2022-12-31 0001263043 shg:AssociatesCSQUARESNIPERPROFESSIONALPRIVATE10Member 2022-12-31 0001263043 shg:AssociatesPacificSunnyProfessionalInvestorsPrivatePlacementRealEstateInvestmentCompanyNo45Member 2022-12-31 0001263043 shg:AssociatesHANAAlternativeEstateProfessionalPrivate122Member 2022-12-31 0001263043 shg:AssociatesCapeITFundNo3Member 2022-12-31 0001263043 shg:AssociatesDaishinKTNewTechnologyInvestmentFundMember 2022-12-31 0001263043 shg:AssociatesSongrimPartnersMember 2022-12-31 0001263043 shg:AssociatesAIPEUROGREENPrivateRealEstateInvestmentTrustNo3Member 2022-12-31 0001263043 shg:AssociatesShCorporateProfessionalInvestmentTypePrivateSecurityInvestmentTrustNo.45Member 2022-12-31 0001263043 shg:AssociatesPebblestoneCGVPrivateRealEstateTrustNo1Member 2022-12-31 0001263043 shg:ShbnppSeniorLoanProfessionalInvestmentTypePrivateMixedAssetInvestmentTrustNo.2Member 2022-12-31 0001263043 shg:AssociatesShMainProfessionalInvestmentTypePrivateMixedAssetInvestmentTrustNo.3Member 2022-12-31 0001263043 shg:AssociatesSooDeliveryPlatformGrowthFundMember 2022-12-31 0001263043 shg:AssociatesIGISGLIPProfessionalInvestmentPrivateRealEstateInvestmentTrustNo12Member 2022-12-31 0001263043 shg:ShinhanGlobalHealthcareFund2Member 2022-12-31 0001263043 ifrs-full:FinancialGuaranteeContractsMember shg:InternalCreditRatingOfBBBPlusOrAboveMember ifrs-full:TwelvemonthExpectedCreditLossesMember 2022-12-31 0001263043 ifrs-full:TwelvemonthExpectedCreditLossesMember shg:InternalCreditRatingOfBelowBBBPlusMember ifrs-full:FinancialGuaranteeContractsMember 2022-12-31 0001263043 ifrs-full:FinancialGuaranteeContractsMember shg:InternalCreditRatingOfBelowBBBPlusMember 2022-12-31 0001263043 ifrs-full:LoanCommitmentsMember shg:InternalCreditRatingOfBelowBBBPlusMember ifrs-full:LifetimeExpectedCreditLossesMember 2022-12-31 0001263043 ifrs-full:LoanCommitmentsMember ifrs-full:FinancialInstrumentsCreditimpairedMember shg:ImpairedMember 2022-12-31 0001263043 ifrs-full:LoanCommitmentsMember ifrs-full:FinancialInstrumentsCreditimpairedMember 2022-12-31 0001263043 shg:InternalCreditRatingOfBBBPlusOrAboveMember 2022-12-31 0001263043 ifrs-full:LoanCommitmentsMember shg:InternalCreditRatingOfBBBPlusOrAboveMember 2022-12-31 0001263043 ifrs-full:FinancialGuaranteeContractsMember shg:InternalCreditRatingOfBBBPlusOrAboveMember 2022-12-31 0001263043 ifrs-full:LoanCommitmentsMember shg:ImpairedMember 2022-12-31 0001263043 ifrs-full:FinancialGuaranteeContractsMember ifrs-full:TwelvemonthExpectedCreditLossesMember 2022-12-31 0001263043 ifrs-full:FinancialInstrumentsCreditimpairedMember ifrs-full:FinancialGuaranteeContractsMember 2022-12-31 0001263043 ifrs-full:LoanCommitmentsMember shg:InternalCreditRatingOfBBBPlusOrAboveMember ifrs-full:LifetimeExpectedCreditLossesMember 2022-12-31 0001263043 ifrs-full:FinancialInstrumentsCreditimpairedMember 2022-12-31 0001263043 ifrs-full:FinancialGuaranteeContractsMember shg:InternalCreditRatingOfBBBPlusOrAboveMember ifrs-full:LifetimeExpectedCreditLossesMember 2022-12-31 0001263043 ifrs-full:LoanCommitmentsMember ifrs-full:LifetimeExpectedCreditLossesMember 2022-12-31 0001263043 shg:InternalCreditRatingOfBelowBBBPlusMember 2022-12-31 0001263043 shg:ImpairedMember ifrs-full:FinancialGuaranteeContractsMember 2022-12-31 0001263043 ifrs-full:LoanCommitmentsMember shg:InternalCreditRatingOfBelowBBBPlusMember 2022-12-31 0001263043 ifrs-full:FinancialGuaranteeContractsMember shg:InternalCreditRatingOfBelowBBBPlusMember ifrs-full:LifetimeExpectedCreditLossesMember 2022-12-31 0001263043 ifrs-full:LoanCommitmentsMember shg:InternalCreditRatingOfBelowBBBPlusMember ifrs-full:TwelvemonthExpectedCreditLossesMember 2022-12-31 0001263043 ifrs-full:FinancialGuaranteeContractsMember ifrs-full:LifetimeExpectedCreditLossesMember 2022-12-31 0001263043 ifrs-full:LoanCommitmentsMember ifrs-full:TwelvemonthExpectedCreditLossesMember 2022-12-31 0001263043 ifrs-full:LoanCommitmentsMember shg:InternalCreditRatingOfBBBPlusOrAboveMember ifrs-full:TwelvemonthExpectedCreditLossesMember 2022-12-31 0001263043 ifrs-full:FinancialGuaranteeContractsMember ifrs-full:FinancialInstrumentsCreditimpairedMember shg:ImpairedMember 2022-12-31 0001263043 ifrs-full:LaterThanOneYearAndNotLaterThanFiveYearsMember shg:OtherFinancialAssetsMember 2022-12-31 0001263043 ifrs-full:LaterThanFiveYearsMember ifrs-full:FinancialAssetsAtFairValueThroughOtherComprehensiveIncomeCategoryMember 2022-12-31 0001263043 ifrs-full:NotLaterThanOneMonthMember shg:LoansAtAmortizedCostMember 2022-12-31 0001263043 ifrs-full:LaterThanOneMonthAndNotLaterThanThreeMonthsMember shg:FinancialAssetsClassMember 2022-12-31 0001263043 ifrs-full:LaterThanSixMonthsAndNotLaterThanOneYearMember shg:SecuritiesAtFVTPLMember 2022-12-31 0001263043 ifrs-full:LaterThanOneMonthAndNotLaterThanThreeMonthsMember shg:LoansAtAmortizedCostMember 2022-12-31 0001263043 ifrs-full:LaterThanFiveYearsMember ifrs-full:FinancialAssetsAtAmortisedCostMember 2022-12-31 0001263043 ifrs-full:NotLaterThanOneMonthMember shg:DueFromBanksAtFVTPLMember 2022-12-31 0001263043 ifrs-full:LaterThanThreeMonthsAndNotLaterThanSixMonthsMember shg:LoanReceivablesMeasuredAtFVTPLMember 2022-12-31 0001263043 ifrs-full:LaterThanFiveYearsMember shg:SecuritiesAtFVTPLMember 2022-12-31 0001263043 ifrs-full:NotLaterThanOneMonthMember shg:FinancialAssetsClassMember 2022-12-31 0001263043 ifrs-full:LaterThanOneMonthAndNotLaterThanThreeMonthsMember shg:CashAndDueFromBanksAtAmortizedCostMember 2022-12-31 0001263043 ifrs-full:LaterThanOneMonthAndNotLaterThanThreeMonthsMember shg:LoanReceivablesMeasuredAtFVTPLMember 2022-12-31 0001263043 ifrs-full:LaterThanSixMonthsAndNotLaterThanOneYearMember shg:LoansAtAmortizedCostMember 2022-12-31 0001263043 ifrs-full:LaterThanThreeMonthsAndNotLaterThanSixMonthsMember shg:FinancialAssetsClassMember 2022-12-31 0001263043 ifrs-full:LaterThanFiveYearsMember shg:OtherFinancialAssetsMember 2022-12-31 0001263043 ifrs-full:NotLaterThanOneMonthMember shg:OtherFinancialAssetsMember 2022-12-31 0001263043 ifrs-full:LaterThanOneMonthAndNotLaterThanThreeMonthsMember ifrs-full:FinancialAssetsAtAmortisedCostMember 2022-12-31 0001263043 ifrs-full:LaterThanOneYearAndNotLaterThanFiveYearsMember shg:SecuritiesAtFVTPLMember 2022-12-31 0001263043 ifrs-full:LaterThanOneYearAndNotLaterThanFiveYearsMember ifrs-full:FinancialAssetsAtFairValueThroughOtherComprehensiveIncomeCategoryMember 2022-12-31 0001263043 ifrs-full:LaterThanFiveYearsMember shg:CashAndDueFromBanksAtAmortizedCostMember 2022-12-31 0001263043 ifrs-full:LaterThanOneMonthAndNotLaterThanThreeMonthsMember shg:OtherFinancialAssetsMember 2022-12-31 0001263043 ifrs-full:LaterThanFiveYearsMember shg:FinancialAssetsClassMember 2022-12-31 0001263043 ifrs-full:LaterThanThreeMonthsAndNotLaterThanSixMonthsMember shg:LoansAtAmortizedCostMember 2022-12-31 0001263043 ifrs-full:NotLaterThanOneMonthMember shg:CashAndDueFromBanksAtAmortizedCostMember 2022-12-31 0001263043 ifrs-full:LaterThanSixMonthsAndNotLaterThanOneYearMember shg:FinancialAssetsClassMember 2022-12-31 0001263043 ifrs-full:LaterThanThreeMonthsAndNotLaterThanSixMonthsMember ifrs-full:FinancialAssetsAtAmortisedCostMember 2022-12-31 0001263043 ifrs-full:NotLaterThanOneMonthMember ifrs-full:FinancialAssetsAtFairValueThroughOtherComprehensiveIncomeCategoryMember 2022-12-31 0001263043 ifrs-full:LaterThanOneMonthAndNotLaterThanThreeMonthsMember shg:SecuritiesAtFVTPLMember 2022-12-31 0001263043 ifrs-full:NotLaterThanOneMonthMember ifrs-full:FinancialAssetsAtAmortisedCostMember 2022-12-31 0001263043 shg:OtherFinancialAssetsMember ifrs-full:LaterThanThreeMonthsAndNotLaterThanSixMonthsMember 2022-12-31 0001263043 ifrs-full:LaterThanOneYearAndNotLaterThanFiveYearsMember ifrs-full:FinancialAssetsAtAmortisedCostMember 2022-12-31 0001263043 ifrs-full:LaterThanThreeMonthsAndNotLaterThanSixMonthsMember ifrs-full:FinancialAssetsAtFairValueThroughOtherComprehensiveIncomeCategoryMember 2022-12-31 0001263043 ifrs-full:LaterThanOneMonthAndNotLaterThanThreeMonthsMember ifrs-full:FinancialAssetsAtFairValueThroughOtherComprehensiveIncomeCategoryMember 2022-12-31 0001263043 ifrs-full:LaterThanThreeMonthsAndNotLaterThanSixMonthsMember shg:CashAndDueFromBanksAtAmortizedCostMember 2022-12-31 0001263043 ifrs-full:LaterThanOneYearAndNotLaterThanFiveYearsMember shg:LoansAtAmortizedCostMember 2022-12-31 0001263043 ifrs-full:LaterThanFiveYearsMember shg:LoansAtAmortizedCostMember 2022-12-31 0001263043 ifrs-full:LaterThanSixMonthsAndNotLaterThanOneYearMember shg:OtherFinancialAssetsMember 2022-12-31 0001263043 ifrs-full:LaterThanThreeMonthsAndNotLaterThanSixMonthsMember shg:SecuritiesAtFVTPLMember 2022-12-31 0001263043 ifrs-full:LaterThanSixMonthsAndNotLaterThanOneYearMember ifrs-full:FinancialAssetsAtFairValueThroughOtherComprehensiveIncomeCategoryMember 2022-12-31 0001263043 ifrs-full:LaterThanSixMonthsAndNotLaterThanOneYearMember shg:LoanReceivablesMeasuredAtFVTPLMember 2022-12-31 0001263043 ifrs-full:LaterThanSixMonthsAndNotLaterThanOneYearMember shg:CashAndDueFromBanksAtAmortizedCostMember 2022-12-31 0001263043 ifrs-full:LaterThanSixMonthsAndNotLaterThanOneYearMember ifrs-full:FinancialAssetsAtAmortisedCostMember 2022-12-31 0001263043 ifrs-full:LaterThanOneYearAndNotLaterThanFiveYearsMember shg:FinancialAssetsClassMember 2022-12-31 0001263043 ifrs-full:NotLaterThanOneMonthMember shg:SecuritiesAtFVTPLMember 2022-12-31 0001263043 shg:LoanReceivablesMeasuredAtFVTPLMember 2022-12-31 0001263043 ifrs-full:LaterThanFiveYearsMember shg:LoanReceivablesMeasuredAtFVTPLMember 2022-12-31 0001263043 ifrs-full:LaterThanOneYearAndNotLaterThanFiveYearsMember shg:LoanReceivablesMeasuredAtFVTPLMember 2022-12-31 0001263043 ifrs-full:NotLaterThanOneMonthMember shg:LoanReceivablesMeasuredAtFVTPLMember 2022-12-31 0001263043 ifrs-full:LaterThanOneYearAndNotLaterThanFiveYearsMember shg:CashAndDueFromBanksAtAmortizedCostMember 2022-12-31 0001263043 ifrs-full:LaterThanFiveYearsMember shg:DepositsMember 2022-12-31 0001263043 ifrs-full:NotLaterThanOneMonthMember shg:BorrowingsMember 2022-12-31 0001263043 ifrs-full:LaterThanFiveYearsMember shg:BorrowingsMember 2022-12-31 0001263043 ifrs-full:LaterThanFiveYearsMember ifrs-full:FinancialLiabilitiesAtFairValueThroughProfitOrLossDesignatedUponInitialRecognitionCategoryMember 2022-12-31 0001263043 ifrs-full:NotLaterThanOneMonthMember ifrs-full:FinancialLiabilitiesMember 2022-12-31 0001263043 ifrs-full:NotLaterThanOneMonthMember ifrs-full:FinancialLiabilitiesAtFairValueThroughProfitOrLossCategoryMember 2022-12-31 0001263043 ifrs-full:NotLaterThanOneMonthMember shg:DebtSecuritiesIssuedMember 2022-12-31 0001263043 ifrs-full:LaterThanThreeMonthsAndNotLaterThanSixMonthsMember shg:DebtSecuritiesIssuedMember 2022-12-31 0001263043 ifrs-full:NotLaterThanOneMonthMember shg:DepositsMember 2022-12-31 0001263043 ifrs-full:NotLaterThanOneMonthMember ifrs-full:FinancialLiabilitiesAtFairValueThroughProfitOrLossDesignatedUponInitialRecognitionCategoryMember 2022-12-31 0001263043 ifrs-full:LaterThanThreeMonthsAndNotLaterThanSixMonthsMember shg:OtherFinancialLiabilitiesMember 2022-12-31 0001263043 ifrs-full:LaterThanFiveYearsMember ifrs-full:FinancialLiabilitiesMember 2022-12-31 0001263043 ifrs-full:LaterThanSixMonthsAndNotLaterThanOneYearMember shg:OtherFinancialLiabilitiesMember 2022-12-31 0001263043 ifrs-full:LaterThanOneMonthAndNotLaterThanThreeMonthsMember shg:DebtSecuritiesIssuedMember 2022-12-31 0001263043 ifrs-full:LaterThanOneMonthAndNotLaterThanThreeMonthsMember shg:OtherFinancialLiabilitiesMember 2022-12-31 0001263043 ifrs-full:LaterThanOneMonthAndNotLaterThanThreeMonthsMember shg:DepositsMember 2022-12-31 0001263043 ifrs-full:LaterThanOneMonthAndNotLaterThanThreeMonthsMember ifrs-full:FinancialLiabilitiesMember 2022-12-31 0001263043 ifrs-full:LaterThanOneMonthAndNotLaterThanThreeMonthsMember ifrs-full:FinancialLiabilitiesAtFairValueThroughProfitOrLossDesignatedUponInitialRecognitionCategoryMember 2022-12-31 0001263043 ifrs-full:NotLaterThanOneMonthMember shg:OtherFinancialLiabilitiesMember 2022-12-31 0001263043 ifrs-full:LaterThanThreeMonthsAndNotLaterThanSixMonthsMember ifrs-full:FinancialLiabilitiesMember 2022-12-31 0001263043 ifrs-full:LaterThanFiveYearsMember shg:DebtSecuritiesIssuedMember 2022-12-31 0001263043 ifrs-full:LaterThanSixMonthsAndNotLaterThanOneYearMember shg:DebtSecuritiesIssuedMember 2022-12-31 0001263043 ifrs-full:LaterThanSixMonthsAndNotLaterThanOneYearMember shg:BorrowingsMember 2022-12-31 0001263043 ifrs-full:LaterThanThreeMonthsAndNotLaterThanSixMonthsMember shg:BorrowingsMember 2022-12-31 0001263043 ifrs-full:LaterThanOneMonthAndNotLaterThanThreeMonthsMember shg:BorrowingsMember 2022-12-31 0001263043 ifrs-full:LaterThanThreeMonthsAndNotLaterThanSixMonthsMember shg:DepositsMember 2022-12-31 0001263043 ifrs-full:LaterThanOneYearAndNotLaterThanFiveYearsMember ifrs-full:FinancialLiabilitiesMember 2022-12-31 0001263043 ifrs-full:LaterThanSixMonthsAndNotLaterThanOneYearMember ifrs-full:FinancialLiabilitiesAtFairValueThroughProfitOrLossDesignatedUponInitialRecognitionCategoryMember 2022-12-31 0001263043 ifrs-full:LaterThanFiveYearsMember shg:OtherFinancialLiabilitiesMember 2022-12-31 0001263043 ifrs-full:LaterThanSixMonthsAndNotLaterThanOneYearMember ifrs-full:FinancialLiabilitiesMember 2022-12-31 0001263043 ifrs-full:LaterThanOneYearAndNotLaterThanFiveYearsMember shg:DebtSecuritiesIssuedMember 2022-12-31 0001263043 ifrs-full:LaterThanSixMonthsAndNotLaterThanOneYearMember shg:DepositsMember 2022-12-31 0001263043 ifrs-full:LaterThanOneYearAndNotLaterThanFiveYearsMember ifrs-full:FinancialLiabilitiesAtFairValueThroughProfitOrLossDesignatedUponInitialRecognitionCategoryMember 2022-12-31 0001263043 ifrs-full:LaterThanOneYearAndNotLaterThanFiveYearsMember shg:BorrowingsMember 2022-12-31 0001263043 ifrs-full:LaterThanOneYearAndNotLaterThanFiveYearsMember shg:DepositsMember 2022-12-31 0001263043 shg:OtherFinancialLiabilitiesMember ifrs-full:LaterThanOneYearAndNotLaterThanFiveYearsMember 2022-12-31 0001263043 ifrs-full:LaterThanThreeMonthsAndNotLaterThanSixMonthsMember ifrs-full:FinancialLiabilitiesAtFairValueThroughProfitOrLossDesignatedUponInitialRecognitionCategoryMember 2022-12-31 0001263043 ifrs-full:LifetimeExpectedCreditLossesMember shg:InternalCreditRatingOfBelowBBBPlusMember shg:DueFromBanksAndLoansAtAmortizedCostMember shg:BankingMember 2022-12-31 0001263043 ifrs-full:TwelvemonthExpectedCreditLossesMember shg:InternalCreditRatingOfBelowBBBPlusMember shg:DueFromBanksAndLoansAtAmortizedCostMember ifrs-full:ConsumerLoansMember 2022-12-31 0001263043 ifrs-full:LifetimeExpectedCreditLossesMember shg:InternalCreditRatingOfBelowBBBPlusMember shg:DueFromBanksAndLoansAtAmortizedCostMember ifrs-full:ConsumerLoansMember 2022-12-31 0001263043 ifrs-full:TwelvemonthExpectedCreditLossesMember shg:InternalCreditRatingOfBelowBBBPlusMember shg:DueFromBanksAndLoansAtAmortizedCostMember ifrs-full:CorporateLoansMember 2022-12-31 0001263043 ifrs-full:FinancialInstrumentsCreditimpairedMember shg:DueFromBanksAndLoansAtAmortizedCostMember ifrs-full:CorporateLoansMember 2022-12-31 0001263043 ifrs-full:TwelvemonthExpectedCreditLossesMember shg:InternalCreditRatingOfBelowBBBPlusMember shg:DueFromBanksAndLoansAtAmortizedCostMember shg:CreditCardReceivablesMember 2022-12-31 0001263043 ifrs-full:LifetimeExpectedCreditLossesMember shg:InternalCreditRatingOfBBBPlusOrAboveMember shg:DueFromBanksAndLoansAtAmortizedCostMember shg:CreditCardReceivablesMember 2022-12-31 0001263043 ifrs-full:FinancialInstrumentsCreditimpairedMember shg:DueFromBanksAndLoansAtAmortizedCostMember 2022-12-31 0001263043 ifrs-full:TwelvemonthExpectedCreditLossesMember shg:InternalCreditRatingOfBBBPlusOrAboveMember 2022-12-31 0001263043 ifrs-full:TwelvemonthExpectedCreditLossesMember shg:InternalCreditRatingOfBelowBBBPlusMember 2022-12-31 0001263043 ifrs-full:LifetimeExpectedCreditLossesMember shg:InternalCreditRatingOfBelowBBBPlusMember 2022-12-31 0001263043 ifrs-full:ConsumerLoansMember shg:DueFromBanksAndLoansAtAmortizedCostMember ifrs-full:FinancialInstrumentsCreditimpairedMember 2022-12-31 0001263043 ifrs-full:LifetimeExpectedCreditLossesMember shg:InternalCreditRatingOfBBBPlusOrAboveMember shg:DueFromBanksAndLoansAtAmortizedCostMember ifrs-full:ConsumerLoansMember 2022-12-31 0001263043 shg:DueFromBanksAndLoansAtAmortizedCostMember shg:BankingMember 2022-12-31 0001263043 ifrs-full:LifetimeExpectedCreditLossesMember shg:InternalCreditRatingOfBelowBBBPlusMember ifrs-full:FinancialAssetsAtFairValueThroughOtherComprehensiveIncomeCategoryMember 2022-12-31 0001263043 ifrs-full:ConsumerLoansMember shg:DueFromBanksAndLoansAtAmortizedCostMember shg:InternalCreditRatingOfBBBPlusOrAboveMember ifrs-full:TwelvemonthExpectedCreditLossesMember 2022-12-31 0001263043 ifrs-full:TwelvemonthExpectedCreditLossesMember shg:InternalCreditRatingOfBBBPlusOrAboveMember shg:DueFromBanksAndLoansAtAmortizedCostMember shg:CreditCardReceivablesMember 2022-12-31 0001263043 ifrs-full:LifetimeExpectedCreditLossesMember shg:InternalCreditRatingOfBBBPlusOrAboveMember shg:DueFromBanksAndLoansAtAmortizedCostMember shg:BankingMember 2022-12-31 0001263043 ifrs-full:TwelvemonthExpectedCreditLossesMember shg:InternalCreditRatingOfBBBPlusOrAboveMember shg:DueFromBanksAndLoansAtAmortizedCostMember ifrs-full:CorporateLoansMember 2022-12-31 0001263043 ifrs-full:LifetimeExpectedCreditLossesMember shg:InternalCreditRatingOfBelowBBBPlusMember shg:DueFromBanksAndLoansAtAmortizedCostMember ifrs-full:CorporateLoansMember 2022-12-31 0001263043 ifrs-full:FinancialInstrumentsCreditimpairedMember 2022-12-31 0001263043 ifrs-full:LifetimeExpectedCreditLossesMember shg:InternalCreditRatingOfBelowBBBPlusMember ifrs-full:FinancialAssetsAtAmortisedCostMember 2022-12-31 0001263043 ifrs-full:LifetimeExpectedCreditLossesMember shg:InternalCreditRatingOfBBBPlusOrAboveMember shg:DueFromBanksAndLoansAtAmortizedCostMember ifrs-full:GovernmentMember 2022-12-31 0001263043 ifrs-full:TwelvemonthExpectedCreditLossesMember shg:InternalCreditRatingOfBBBPlusOrAboveMember shg:DueFromBanksAndLoansAtAmortizedCostMember ifrs-full:GovernmentMember 2022-12-31 0001263043 ifrs-full:FinancialAssetsAtAmortisedCostMember shg:InternalCreditRatingOfBelowBBBPlusMember ifrs-full:TwelvemonthExpectedCreditLossesMember 2022-12-31 0001263043 ifrs-full:TwelvemonthExpectedCreditLossesMember shg:InternalCreditRatingOfBelowBBBPlusMember shg:DueFromBanksAndLoansAtAmortizedCostMember ifrs-full:GovernmentMember 2022-12-31 0001263043 ifrs-full:LifetimeExpectedCreditLossesMember shg:InternalCreditRatingOfBBBPlusOrAboveMember 2022-12-31 0001263043 ifrs-full:TwelvemonthExpectedCreditLossesMember shg:InternalCreditRatingOfBelowBBBPlusMember ifrs-full:FinancialAssetsAtFairValueThroughOtherComprehensiveIncomeCategoryMember 2022-12-31 0001263043 ifrs-full:LifetimeExpectedCreditLossesMember shg:InternalCreditRatingOfBelowBBBPlusMember shg:DueFromBanksAndLoansAtAmortizedCostMember 2022-12-31 0001263043 ifrs-full:TwelvemonthExpectedCreditLossesMember shg:InternalCreditRatingOfBelowBBBPlusMember shg:DueFromBanksAndLoansAtAmortizedCostMember 2022-12-31 0001263043 shg:BankingMember shg:DueFromBanksAndLoansAtAmortizedCostMember shg:InternalCreditRatingOfBBBPlusOrAboveMember ifrs-full:TwelvemonthExpectedCreditLossesMember 2022-12-31 0001263043 ifrs-full:FinancialInstrumentsCreditimpairedMember shg:DueFromBanksAndLoansAtAmortizedCostMember shg:CreditCardReceivablesMember 2022-12-31 0001263043 ifrs-full:LifetimeExpectedCreditLossesMember shg:InternalCreditRatingOfBelowBBBPlusMember shg:DueFromBanksAndLoansAtAmortizedCostMember shg:CreditCardReceivablesMember 2022-12-31 0001263043 ifrs-full:TwelvemonthExpectedCreditLossesMember shg:InternalCreditRatingOfBBBPlusOrAboveMember shg:DueFromBanksAndLoansAtAmortizedCostMember 2022-12-31 0001263043 ifrs-full:TwelvemonthExpectedCreditLossesMember shg:InternalCreditRatingOfBBBPlusOrAboveMember ifrs-full:FinancialAssetsAtAmortisedCostMember 2022-12-31 0001263043 ifrs-full:LifetimeExpectedCreditLossesMember shg:InternalCreditRatingOfBBBPlusOrAboveMember shg:DueFromBanksAndLoansAtAmortizedCostMember ifrs-full:CorporateLoansMember 2022-12-31 0001263043 ifrs-full:TwelvemonthExpectedCreditLossesMember shg:InternalCreditRatingOfBBBPlusOrAboveMember ifrs-full:FinancialAssetsAtFairValueThroughOtherComprehensiveIncomeCategoryMember 2022-12-31 0001263043 ifrs-full:LifetimeExpectedCreditLossesMember shg:InternalCreditRatingOfBBBPlusOrAboveMember shg:DueFromBanksAndLoansAtAmortizedCostMember 2022-12-31 0001263043 ifrs-full:LifetimeExpectedCreditLossesMember shg:InternalCreditRatingOfBelowBBBPlusMember shg:DueFromBanksAndLoansAtAmortizedCostMember ifrs-full:GovernmentMember 2022-12-31 0001263043 shg:BankingMember shg:DueFromBanksAndLoansAtAmortizedCostMember shg:InternalCreditRatingOfBelowBBBPlusMember ifrs-full:TwelvemonthExpectedCreditLossesMember 2022-12-31 0001263043 ifrs-full:DerivativesMember ifrs-full:LaterThanOneYearAndNotLaterThanFiveYearsMember 2022-12-31 0001263043 ifrs-full:DerivativesMember ifrs-full:LaterThanOneMonthAndNotLaterThanThreeMonthsMember 2022-12-31 0001263043 ifrs-full:DerivativesMember ifrs-full:LaterThanSixMonthsAndNotLaterThanOneYearMember 2022-12-31 0001263043 ifrs-full:NotLaterThanOneMonthMember ifrs-full:DerivativesMember 2022-12-31 0001263043 ifrs-full:DerivativesMember ifrs-full:LaterThanThreeMonthsAndNotLaterThanSixMonthsMember 2022-12-31 0001263043 ifrs-full:DerivativesMember ifrs-full:LaterThanFiveYearsMember 2022-12-31 0001263043 shg:CorporationMember 2022-12-31 0001263043 shg:DueFromBanksAtFairValueMember 2022-12-31 0001263043 ifrs-full:TradingEquitySecuritiesMember 2022-12-31 0001263043 ifrs-full:OtherEquitySecuritiesMember 2022-12-31 0001263043 ifrs-full:EquityInvestmentsMember 2022-12-31 0001263043 ifrs-full:DebtSecuritiesMember 2022-12-31 0001263043 shg:BeneficiaryCertificatesMember 2022-12-31 0001263043 shg:FinancialinstitutionsborrowerMember 2022-12-31 0001263043 shg:CommercialpaperMember 2022-12-31 0001263043 shg:OthersMember 2022-12-31 0001263043 shg:ExcludeOtherInstrumentsMember 2022-12-31 0001263043 shg:GoldDepositsMember 2022-12-31 0001263043 shg:StocksMember 2022-12-31 0001263043 shg:PutoptionMember 2022-12-31 0001263043 shg:LoansAtFairValueThroughProfitLossMember 2022-12-31 0001263043 shg:OtherdebtsecuritiesMember 2022-12-31 0001263043 shg:EquityInvestmentWithPutOptionMember 2022-12-31 0001263043 shg:CmaMember 2022-12-31 0001263043 ifrs-full:GovernmentMember 2022-12-31 0001263043 shg:SecuritiesAtFVTPLMember 2022-12-31 0001263043 shg:DueFromBanksAtFVTPLMember 2022-12-31 0001263043 ifrs-full:CurrencyRiskMember ifrs-full:NotLaterThanOneYearMember 2022-12-31 0001263043 ifrs-full:InterestRateRiskMember ifrs-full:LaterThanOneYearAndNotLaterThanTwoYearsMember 2022-12-31 0001263043 ifrs-full:CurrencyRiskMember ifrs-full:LaterThanOneYearAndNotLaterThanTwoYearsMember 2022-12-31 0001263043 ifrs-full:InterestRateRiskMember ifrs-full:LaterThanTwoYearsAndNotLaterThanThreeYearsMember 2022-12-31 0001263043 ifrs-full:InterestRateRiskMember ifrs-full:LaterThanThreeYearsAndNotLaterThanFourYearsMember 2022-12-31 0001263043 ifrs-full:CurrencyRiskMember ifrs-full:LaterThanThreeYearsAndNotLaterThanFourYearsMember 2022-12-31 0001263043 ifrs-full:CurrencyRiskMember ifrs-full:LaterThanFourYearsAndNotLaterThanFiveYearsMember 2022-12-31 0001263043 ifrs-full:InterestRateRiskMember 2022-12-31 0001263043 ifrs-full:CurrencyRiskMember 2022-12-31 0001263043 ifrs-full:InterestRateRiskMember ifrs-full:LaterThanFourYearsAndNotLaterThanFiveYearsMember 2022-12-31 0001263043 ifrs-full:CurrencyRiskMember ifrs-full:LaterThanTwoYearsAndNotLaterThanThreeYearsMember 2022-12-31 0001263043 ifrs-full:InterestRateRiskMember ifrs-full:LaterThanFiveYearsMember 2022-12-31 0001263043 ifrs-full:CurrencyRiskMember ifrs-full:LaterThanFiveYearsMember 2022-12-31 0001263043 ifrs-full:InterestRateRiskMember ifrs-full:NotLaterThanOneYearMember 2022-12-31 0001263043 shg:EquitySecuritiesMember 2022-12-31 0001263043 shg:CorporateBondsAndOthersMember 2022-12-31 0001263043 shg:FinancialInstitutionsBondsMember 2022-12-31 0001263043 ifrs-full:InterestRateSwapContractMember ifrs-full:ReserveOfCashFlowHedgesMember 2022-12-31 0001263043 ifrs-full:ReserveOfCashFlowHedgesMember ifrs-full:ForwardContractMember 2022-12-31 0001263043 shg:HedgeOfNetInvestmentMember ifrs-full:LongtermBorrowingsMember 2022-12-31 0001263043 ifrs-full:CurrencySwapContractMember ifrs-full:ReserveOfCashFlowHedgesMember 2022-12-31 0001263043 shg:HedgeOfNetInvestmentMember ifrs-full:ForwardContractMember 2022-12-31 0001263043 ifrs-full:FairValueHedgesMember ifrs-full:InterestRateSwapContractMember 2022-12-31 0001263043 ifrs-full:FairValueHedgesMember ifrs-full:ForwardContractMember 2022-12-31 0001263043 ifrs-full:FairValueHedgesMember ifrs-full:InterestRateRiskMember 2022-12-31 0001263043 ifrs-full:FairValueHedgesMember shg:ForeignExchangeRiskMember 2022-12-31 0001263043 ifrs-full:HedgesOfNetInvestmentInForeignOperationsMember shg:ForeignExchangeRiskMember 2022-12-31 0001263043 ifrs-full:CashFlowHedgesMember shg:ForeignExchangeRiskMember 2022-12-31 0001263043 ifrs-full:CashFlowHedgesMember ifrs-full:InterestRateRiskMember 2022-12-31 0001263043 shg:EquityLinkedSecuritiesSoldMember 2022-12-31 0001263043 ifrs-full:FinancialLiabilitiesAtFairValueThroughProfitOrLossDesignatedUponInitialRecognitionCategoryMember 2022-12-31 0001263043 shg:DerivativesCombinedSecuritiesSoldMember 2022-12-31 0001263043 ifrs-full:DebtSecuritiesMember 2022-12-31 0001263043 shg:SecuritiesSoldMember 2022-12-31 0001263043 shg:GoldDepositsMember 2022-12-31 0001263043 shg:OtherSecuritiesSoldMember 2022-12-31 0001263043 shg:MunicipalBondsMember 2022-12-31 0001263043 shg:StocksMember 2022-12-31 0001263043 ifrs-full:OtherAssetsMember ifrs-full:AccumulatedDepreciationAndAmortisationMember 2022-12-31 0001263043 ifrs-full:VehiclesMember ifrs-full:AccumulatedDepreciationAndAmortisationMember 2022-12-31 0001263043 ifrs-full:LandAndBuildingsMember ifrs-full:AccumulatedDepreciationAndAmortisationMember 2022-12-31 0001263043 ifrs-full:OtherAssetsMember 2022-12-31 0001263043 ifrs-full:VehiclesMember 2022-12-31 0001263043 ifrs-full:LandAndBuildingsMember 2022-12-31 0001263043 ifrs-full:VehiclesMember shg:AcquisitionRelatedCostsMember 2022-12-31 0001263043 ifrs-full:LandAndBuildingsMember shg:AcquisitionRelatedCostsMember 2022-12-31 0001263043 ifrs-full:OtherAssetsMember shg:AcquisitionRelatedCostsMember 2022-12-31 0001263043 ifrs-full:OrdinarySharesMember 2022-12-31 0001263043 ifrs-full:PreferenceSharesMember 2022-12-31 0001263043 shg:CashAndDueFromBanksAtAmortizedCostMember shg:ShinhanEzGeneralInsuranceLtdMember 2022-12-31 0001263043 ifrs-full:OtherAssetsMember shg:ShinhanEzGeneralInsuranceLtdMember 2022-12-31 0001263043 shg:OtherLiabilitiesMember shg:ShinhanEzGeneralInsuranceLtdMember 2022-12-31 0001263043 ifrs-full:IntangibleAssetsOtherThanGoodwillMember shg:ShinhanEzGeneralInsuranceLtdMember 2022-12-31 0001263043 shg:LiabilitiesTotalMember shg:ShinhanEzGeneralInsuranceLtdMember 2022-12-31 0001263043 shg:AssetsTotalMember shg:ShinhanEzGeneralInsuranceLtdMember 2022-12-31 0001263043 shg:ShinhanEzGeneralInsuranceLtdMember 2022-12-31 0001263043 shg:ShinhanEzGeneralInsuranceLtdMember ifrs-full:PropertyPlantAndEquipmentMember 2022-12-31 0001263043 shg:ShinhanEzGeneralInsuranceLtdMember shg:LoansAtAmortizedCostMember 2022-12-31 0001263043 shg:ShinhanEzGeneralInsuranceLtdMember shg:LiabilitiesUnderInsuranceContractsMember 2022-12-31 0001263043 shg:ShinhanEzGeneralInsuranceLtdMember shg:SecuritiesAtFairValueThroughProfitOrLossMember 2022-12-31 0001263043 shg:ShinhanEzGeneralInsuranceLtdMember shg:SecuritiesAtFairValueThroughOtherComprehensiveIncomeMember 2022-12-31 0001263043 shg:AssociatesShinhanEzGeneralInsuranceLtd.Member 2022-12-31 0001263043 shg:USD1MLIBORMember 2022-12-31 0001263043 shg:KRW3MCDMember 2022-12-31 0001263043 shg:EURIBOR1MMember 2022-12-31 0001263043 shg:USD3MLIBORMember 2022-12-31 0001263043 shg:EURIBOR3MMember 2022-12-31 0001263043 shg:TreasuryStockMember 2022-12-31 0001263043 shg:AirliftpassengerMember shg:SubsidiaryJejuBankMember 2022-12-31 0001263043 shg:YouthTrainingFacilitiesBusinessMember shg:SubsidiaryJejuBankMember 2022-12-31 0001263043 shg:SubsidiaryShinhanBankMember shg:OilPetroleumrefineryMember 2022-12-31 0001263043 shg:SubsidiaryShinhanBankMember shg:ClothingManufacturingMember 2022-12-31 0001263043 shg:SubsidiaryShinhanBankMember shg:MovietheaterMember 2022-12-31 0001263043 shg:SubsidiaryShinhanBankMember shg:LodgingAndRestaurantMember 2022-12-31 0001263043 shg:SubsidiaryShinhanBankMember shg:AirliftpassengerMember 2022-12-31 0001263043 shg:SubsidiaryShinhanBankMember shg:ArtRelatedMember 2022-12-31 0001263043 shg:SubsidiaryShinhanBankMember shg:TravelMember 2022-12-31 0001263043 shg:BusBusinessMember shg:SubsidiaryJejuBankMember 2022-12-31 0001263043 shg:SubsidiaryJejuBankMember shg:LodgingAndRestaurantMember 2022-12-31 0001263043 shg:BathBusinessMember shg:SubsidiaryJejuBankMember 2022-12-31 0001263043 shg:ArtRelatedMember shg:SubsidiaryJejuBankMember 2022-12-31 0001263043 shg:SubsidiaryJejuBankMember shg:LeisureRelatedServiceIndustryMember 2022-12-31 0001263043 shg:MovietheaterMember shg:SubsidiaryJejuBankMember 2022-12-31 0001263043 shg:SubsidiaryShinhanCardMember shg:RetailCustomersMember 2022-12-31 0001263043 shg:Fy20234qMember shg:UpsideScenarioMember 2022-12-31 0001263043 shg:FY20224QMember shg:UpsideScenarioMember 2022-12-31 0001263043 shg:Fy20232qMember shg:UpsideScenarioMember 2022-12-31 0001263043 shg:DownsideScenarioMember shg:Fy20231qMember 2022-12-31 0001263043 shg:UpsideScenarioMember shg:Fy20233qMember 2022-12-31 0001263043 shg:CentralScenarioMember shg:Fy20232qMember 2022-12-31 0001263043 shg:CentralScenarioMember shg:Fy20233qMember 2022-12-31 0001263043 shg:CentralScenarioMember shg:Fy20231qMember 2022-12-31 0001263043 shg:Fy20231qMember shg:UpsideScenarioMember 2022-12-31 0001263043 shg:DownsideScenarioMember shg:Fy20233qMember 2022-12-31 0001263043 shg:DownsideScenarioMember shg:Fy20232qMember 2022-12-31 0001263043 shg:CentralScenarioMember shg:Fy20234qMember 2022-12-31 0001263043 shg:CentralScenarioMember shg:FY20224QMember 2022-12-31 0001263043 shg:DownsideScenarioMember shg:Fy20234qMember 2022-12-31 0001263043 shg:DownsideScenarioMember shg:FY20224QMember 2022-12-31 0001263043 shg:WorstScenarioMember 2022-12-31 0001263043 shg:LaterThanTenYearsAndNotLaterThanTwentyYearsMember 2022-12-31 0001263043 ifrs-full:LaterThanSevenYearsAndNotLaterThanTenYearsMember 2022-12-31 0001263043 shg:LaterThanThreeYearAndNotLaterThanSevenYearsMember 2022-12-31 0001263043 shg:LaterThanTwentyYearsMember 2022-12-31 0001263043 ifrs-full:LaterThanOneYearAndNotLaterThanThreeYearsMember 2022-12-31 0001263043 ifrs-full:Level3OfFairValueHierarchyMember shg:DerivativeFinancialInstrumentsAssetsMember shg:CreditAndCommodityContractMember 2022-12-31 0001263043 ifrs-full:Level3OfFairValueHierarchyMember shg:DerivativeFinancialInstrumentsAssetsMember shg:InterestRateContractMember 2022-12-31 0001263043 ifrs-full:Level3OfFairValueHierarchyMember shg:DerivativeFinancialInstrumentsAssetsMember shg:EquityAndForeignExchangeContractMember 2022-12-31 0001263043 shg:DerivativeFinancialInstrumentsAssetsMember shg:NotDesignatedAsHedgingInstrumentTradingMember ifrs-full:Level2OfFairValueHierarchyMember 2022-12-31 0001263043 shg:DerivativeFinancialInstrumentsAssetsMember shg:DesignatedAsHedgingInstrumentMember ifrs-full:Level2OfFairValueHierarchyMember 2022-12-31 0001263043 shg:SubsidiaryShinhanLifeInsuranceMember shg:VariableTypeMember 2022-12-31 0001263043 shg:SubsidiaryShinhanLifeInsuranceMember 2022-12-31 0001263043 ifrs-full:FloatingInterestRateMember shg:ParticipatingLifeInsurancePolicyMember shg:SubsidiaryShinhanLifeInsuranceMember 2022-12-31 0001263043 shg:SubsidiaryShinhanLifeInsuranceMember shg:ParticipatingLifeInsurancePolicyMember ifrs-full:FixedInterestRateMember 2022-12-31 0001263043 shg:SubsidiaryShinhanLifeInsuranceMember shg:NonparticipatingLifeInsurancePolicyMember ifrs-full:FixedInterestRateMember 2022-12-31 0001263043 shg:SubsidiaryShinhanLifeInsuranceMember shg:NonparticipatingLifeInsurancePolicyMember ifrs-full:FloatingInterestRateMember 2022-12-31 0001263043 shg:CoReinsuranceMember shg:SubsidiaryShinhanLifeInsuranceMember 2022-12-31 0001263043 shg:DebtSecuritiesAtAmortisedCostMember 2022-12-31 0001263043 shg:DebtSecuritiesAtAmortisedCostMember ifrs-full:TwelvemonthExpectedCreditLossesMember 2022-12-31 0001263043 ifrs-full:FinancialAssetsAtFairValueThroughOtherComprehensiveIncomeCategoryMember ifrs-full:TwelvemonthExpectedCreditLossesMember 2022-12-31 0001263043 shg:DebtSecuritiesAtAmortisedCostMember ifrs-full:LifetimeExpectedCreditLossesMember 2022-12-31 0001263043 ifrs-full:LifetimeExpectedCreditLossesMember ifrs-full:FinancialAssetsAtFairValueThroughOtherComprehensiveIncomeCategoryMember 2022-12-31 0001263043 ifrs-full:ForeignCountriesMember 2022-12-31 0001263043 ifrs-full:CountryOfDomicileMember 2022-12-31 0001263043 shg:DomesticCurrencyMember 2022-12-31 0001263043 shg:DomesticCurrencyMember 2022-12-31 0001263043 ifrs-full:FinancialGuaranteeContractsMember ifrs-full:LifetimeExpectedCreditLossesMember 2022-12-31 0001263043 shg:ProvisionForUnusedCreditCommitmentsAndFinancialGuaranteeContractsIssuedMember 2022-12-31 0001263043 ifrs-full:FinancialGuaranteeContractsMember ifrs-full:TwelvemonthExpectedCreditLossesMember 2022-12-31 0001263043 ifrs-full:FinancialGuaranteeContractsMember ifrs-full:FinancialInstrumentsCreditimpairedMember 2022-12-31 0001263043 ifrs-full:ProvisionForCreditCommitmentsMember ifrs-full:LifetimeExpectedCreditLossesMember 2022-12-31 0001263043 ifrs-full:ProvisionForCreditCommitmentsMember ifrs-full:TwelvemonthExpectedCreditLossesMember 2022-12-31 0001263043 ifrs-full:FinancialInstrumentsCreditimpairedMember ifrs-full:ProvisionForCreditCommitmentsMember 2022-12-31 0001263043 shg:MsteelCo.ltd.Member 2022-12-31 0001263043 ifrs-full:AssociatesMember 2022-12-31 0001263043 ifrs-full:InvestmentFundsMember shg:OtherLiabilitiesMember 2022-12-31 0001263043 ifrs-full:AssetbackedFinancingsMember shg:OtherLiabilitiesMember 2022-12-31 0001263043 shg:StructuredFinancingMember ifrs-full:DerivativesMember 2022-12-31 0001263043 ifrs-full:DerivativesMember 2022-12-31 0001263043 ifrs-full:AssetbackedFinancingsMember ifrs-full:DerivativesMember 2022-12-31 0001263043 shg:OtherLiabilitiesMember 2022-12-31 0001263043 shg:StructuredFinancingMember shg:OtherLiabilitiesMember 2022-12-31 0001263043 ifrs-full:InvestmentFundsMember ifrs-full:DerivativesMember 2022-12-31 0001263043 shg:CreditCardMember ifrs-full:BottomOfRangeMember ifrs-full:InterestRateRiskMember 2022-12-31 0001263043 shg:CreditCardMember ifrs-full:WeightedAverageMember ifrs-full:InterestRateRiskMember 2022-12-31 0001263043 ifrs-full:InterestRateRiskMember ifrs-full:TopOfRangeMember shg:CreditCardMember 2022-12-31 0001263043 shg:OptionVolatilityMember ifrs-full:TopOfRangeMember shg:ConsolidatedEntitiesMember 2022-12-31 0001263043 shg:DateOfEndOfReportingPeriodMember ifrs-full:InterestRateRiskMember shg:ConsolidatedEntitiesMember 2022-12-31 0001263043 ifrs-full:TopOfRangeMember shg:ConsolidatedEntitiesMember 2022-12-31 0001263043 ifrs-full:CommodityPriceRiskMember ifrs-full:WeightedAverageMember shg:ConsolidatedEntitiesMember 2022-12-31 0001263043 shg:OptionVolatilityMember shg:DateOfEndOfReportingPeriodMember shg:ConsolidatedEntitiesMember 2022-12-31 0001263043 ifrs-full:CommodityPriceRiskMember ifrs-full:BottomOfRangeMember shg:ConsolidatedEntitiesMember 2022-12-31 0001263043 ifrs-full:EquityPriceRiskMember ifrs-full:TopOfRangeMember shg:ConsolidatedEntitiesMember 2022-12-31 0001263043 ifrs-full:WeightedAverageMember shg:ConsolidatedEntitiesMember 2022-12-31 0001263043 shg:ConsolidatedEntitiesMember ifrs-full:BottomOfRangeMember ifrs-full:EquityPriceRiskMember 2022-12-31 0001263043 ifrs-full:TopOfRangeMember ifrs-full:InterestRateRiskMember shg:ConsolidatedEntitiesMember 2022-12-31 0001263043 ifrs-full:CommodityPriceRiskMember ifrs-full:TopOfRangeMember shg:ConsolidatedEntitiesMember 2022-12-31 0001263043 ifrs-full:CurrencyRiskMember ifrs-full:WeightedAverageMember shg:ConsolidatedEntitiesMember 2022-12-31 0001263043 shg:ConsolidatedEntitiesMember ifrs-full:TopOfRangeMember ifrs-full:CurrencyRiskMember 2022-12-31 0001263043 ifrs-full:WeightedAverageMember ifrs-full:InterestRateRiskMember shg:ConsolidatedEntitiesMember 2022-12-31 0001263043 ifrs-full:CommodityPriceRiskMember shg:DateOfEndOfReportingPeriodMember shg:ConsolidatedEntitiesMember 2022-12-31 0001263043 shg:ConsolidatedEntitiesMember ifrs-full:WeightedAverageMember shg:OptionVolatilityMember 2022-12-31 0001263043 ifrs-full:EquityPriceRiskMember shg:DateOfEndOfReportingPeriodMember shg:ConsolidatedEntitiesMember 2022-12-31 0001263043 ifrs-full:BottomOfRangeMember shg:ConsolidatedEntitiesMember 2022-12-31 0001263043 shg:DateOfEndOfReportingPeriodMember shg:ConsolidatedEntitiesMember 2022-12-31 0001263043 shg:OptionVolatilityMember ifrs-full:BottomOfRangeMember shg:ConsolidatedEntitiesMember 2022-12-31 0001263043 ifrs-full:CurrencyRiskMember shg:DateOfEndOfReportingPeriodMember shg:ConsolidatedEntitiesMember 2022-12-31 0001263043 shg:ConsolidatedEntitiesMember ifrs-full:BottomOfRangeMember ifrs-full:CurrencyRiskMember 2022-12-31 0001263043 ifrs-full:EquityPriceRiskMember ifrs-full:WeightedAverageMember shg:ConsolidatedEntitiesMember 2022-12-31 0001263043 ifrs-full:BottomOfRangeMember ifrs-full:InterestRateRiskMember shg:ConsolidatedEntitiesMember 2022-12-31 0001263043 shg:CreditCardMember shg:DateOfEndOfReportingPeriodMember ifrs-full:InterestRateRiskMember 2022-12-31 0001263043 shg:BorrowingsMember ifrs-full:Level2OfFairValueHierarchyMember 2022-12-31 0001263043 ifrs-full:FinancialLiabilitiesAtFairValueThroughProfitOrLossDesignatedUponInitialRecognitionCategoryMember shg:DebtSecuritiesIssuedMember ifrs-full:Level2OfFairValueHierarchyMember 2022-12-31 0001263043 ifrs-full:Level3OfFairValueHierarchyMember shg:CreditAndCommodityContractMember shg:DerivativeFinancialInstrumentsLiabilitiesMember 2022-12-31 0001263043 ifrs-full:Level3OfFairValueHierarchyMember shg:InterestRateContractMember shg:DerivativeFinancialInstrumentsLiabilitiesMember 2022-12-31 0001263043 ifrs-full:Level3OfFairValueHierarchyMember shg:EquityAndForeignExchangeContractMember shg:DerivativeFinancialInstrumentsLiabilitiesMember 2022-12-31 0001263043 shg:OffBalanceMember 2022-12-31 0001263043 shg:OtherLiabilitiesRelatedToLoanCommitmentsMember 2022-12-31 0001263043 ifrs-full:NotLaterThanOneMonthMember shg:OtherLiabilitiesRelatedToLoanCommitmentsMember 2022-12-31 0001263043 ifrs-full:NotLaterThanOneMonthMember shg:OffBalanceMember 2022-12-31 0001263043 ifrs-full:NotLaterThanOneMonthMember ifrs-full:FinancialGuaranteeContractsMember 2022-12-31 0001263043 shg:LoansAtAmortizedCostMember shg:CreditCardReceivablesMember ifrs-full:FinancialInstrumentsCreditimpairedMember 2022-12-31 0001263043 shg:LoansAtAmortizedCostMember shg:OtherFinancialAssetsMember ifrs-full:TwelvemonthExpectedCreditLossesMember 2022-12-31 0001263043 shg:LoansAtAmortizedCostMember ifrs-full:CorporateLoansMember ifrs-full:FinancialInstrumentsCreditimpairedMember 2022-12-31 0001263043 shg:DueFromBanksAtAmortizedCostAndOtherFinancialAssetsMember ifrs-full:TwelvemonthExpectedCreditLossesMember 2022-12-31 0001263043 ifrs-full:LifetimeExpectedCreditLossesMember shg:DueFromBanksAtAmortizedCostAndOtherFinancialAssetsMember 2022-12-31 0001263043 ifrs-full:FinancialInstrumentsCreditimpairedMember shg:DueFromBanksAtAmortizedCostAndOtherFinancialAssetsMember 2022-12-31 0001263043 shg:DueFromBanksAtAmortizedCostAndOtherFinancialAssetsMember 2022-12-31 0001263043 shg:LoansAtAmortizedCostMember ifrs-full:ConsumerLoansMember ifrs-full:FinancialInstrumentsCreditimpairedMember 2022-12-31 0001263043 shg:LoansAtAmortizedCostMember ifrs-full:CorporateLoansMember ifrs-full:TwelvemonthExpectedCreditLossesMember 2022-12-31 0001263043 shg:LoansAtAmortizedCostMember shg:CreditCardReceivablesMember ifrs-full:LifetimeExpectedCreditLossesMember 2022-12-31 0001263043 shg:LoansAtAmortizedCostMember 2022-12-31 0001263043 shg:LoansAtAmortizedCostMember ifrs-full:ConsumerLoansMember ifrs-full:LifetimeExpectedCreditLossesMember 2022-12-31 0001263043 shg:LoansAtAmortizedCostMember ifrs-full:ConsumerLoansMember ifrs-full:TwelvemonthExpectedCreditLossesMember 2022-12-31 0001263043 shg:LoansAtAmortizedCostMember shg:OtherFinancialAssetsMember ifrs-full:LifetimeExpectedCreditLossesMember 2022-12-31 0001263043 shg:LoansAtAmortizedCostMember shg:CreditCardReceivablesMember ifrs-full:TwelvemonthExpectedCreditLossesMember 2022-12-31 0001263043 shg:LoansAtAmortizedCostMember ifrs-full:CorporateLoansMember ifrs-full:LifetimeExpectedCreditLossesMember 2022-12-31 0001263043 shg:LoansAtAmortizedCostMember shg:OtherFinancialAssetsMember ifrs-full:FinancialInstrumentsCreditimpairedMember 2022-12-31 0001263043 shg:LossClaimOneMember 2022-12-31 0001263043 shg:LossClaimTwoMember 2022-12-31 0001263043 shg:HwaseongBansongdongConstructionPaymentLitigationHyosungHeavyIndustriesEtc.1Member 2022-12-31 0001263043 shg:ClaimForThePaymentToExecuteTheAssignmentOrderMember 2022-12-31 0001263043 shg:OtherLitigationsMember 2022-12-31 0001263043 ifrs-full:FinancialLiabilitiesAtFairValueThroughProfitOrLossCategoryMember 2022-12-31 0001263043 shg:DesignatedAsHedgingInstrumentMember 2022-12-31 0001263043 ifrs-full:FinancialLiabilitiesAtAmortisedCostCategoryMember 2022-12-31 0001263043 shg:GeneralMember 2022-12-31 0001263043 shg:SeriesQMember 2022-12-31 0001263043 shg:SeriesPMember 2022-12-31 0001263043 shg:SeriesOMember 2022-12-31 0001263043 shg:SeriesNMember 2022-12-31 0001263043 shg:SeriesMMember 2022-12-31 0001263043 shg:SeriesLMember 2022-12-31 0001263043 shg:SeriesKMember 2022-12-31 0001263043 shg:SeriesJMember 2022-12-31 0001263043 shg:SeriesIMember 2022-12-31 0001263043 shg:SeriesHMember 2022-12-31 0001263043 shg:SeriesGMember 2022-12-31 0001263043 shg:SeriesFMember 2022-12-31 0001263043 shg:SeriesEMember 2022-12-31 0001263043 shg:SeriesDMember 2022-12-31 0001263043 shg:SeriesCMember 2022-12-31 0001263043 shg:SeriesBMember 2022-12-31 0001263043 shg:ShinhanEzGeneralInsuranceLtdMember 2022-12-31 0001263043 shg:DomesticCurrencyMember 2022-12-31 0001263043 shg:ForeignCurrencyMember shg:CorporateDebtSecuritiesMember 2022-12-31 0001263043 shg:DomesticCurrencyMember shg:CorporateDebtSecuritiesMember 2022-12-31 0001263043 shg:ForeignCurrencyMember shg:SubordinatedDebtMember 2022-12-31 0001263043 shg:ForeignCurrencyMember 2022-12-31 0001263043 shg:DomesticCurrencyMember shg:SubordinatedDebtMember 2022-12-31 0001263043 shg:CreditCardMember 2022-12-31 0001263043 shg:LifeInsuranceMember 2022-12-31 0001263043 shg:SecuritiesMember 2022-12-31 0001263043 shg:ShinhanBankMember 2022-12-31 0001263043 shg:OneShinhanGlobalFund1Member 2022-12-31 0001263043 shg:EDNCENTRALCoLtdMember 2022-12-31 0001263043 shg:AssociatesSHINHANCORETRENDGLOBALFUND1Member 2022-12-31 0001263043 shg:ShinhanSmilegateGlobalPefIMember 2022-12-31 0001263043 shg:AssociatesBNPParibasCardifLifeInsuranceMember 2022-12-31 0001263043 shg:ExpiredPerformanceSharesMember 2022-12-31 0001263043 shg:BillsSoldMember 2022-12-31 0001263043 shg:CallMoneyMember 2022-12-31 0001263043 shg:BorrowingsFromBankOfKoreaMember 2022-12-31 0001263043 shg:OthersBorrowingsInForeignCurrencyMember 2022-12-31 0001263043 shg:OverdraftDueToBanksMember 2022-12-31 0001263043 shg:OthersBorrowingsInWonMember 2022-12-31 0001263043 shg:ForeignCurrencyMember 2022-12-31 0001263043 shg:RepurchaseAgreementsMember 2022-12-31 0001263043 shg:BorrowingsFromBanksMember 2022-12-31 0001263043 shg:DomesticCurrencyMember 2022-12-31 0001263043 shg:AutomotiveMember 2022-12-31 0001263043 ifrs-full:LaterThanOneMonthAndNotLaterThanThreeMonthsMember ifrs-full:VehiclesMember 2022-12-31 0001263043 ifrs-full:LaterThanSixMonthsAndNotLaterThanOneYearMember ifrs-full:OtherAssetsMember 2022-12-31 0001263043 ifrs-full:LaterThanThreeMonthsAndNotLaterThanSixMonthsMember 2022-12-31 0001263043 ifrs-full:LaterThanFiveYearsMember 2022-12-31 0001263043 ifrs-full:LaterThanOneMonthAndNotLaterThanThreeMonthsMember ifrs-full:LandAndBuildingsMember 2022-12-31 0001263043 ifrs-full:LandAndBuildingsMember ifrs-full:LaterThanOneYearAndNotLaterThanFiveYearsMember 2022-12-31 0001263043 ifrs-full:NotLaterThanOneMonthMember ifrs-full:VehiclesMember 2022-12-31 0001263043 ifrs-full:LaterThanOneYearAndNotLaterThanFiveYearsMember ifrs-full:VehiclesMember 2022-12-31 0001263043 ifrs-full:LaterThanOneMonthAndNotLaterThanThreeMonthsMember 2022-12-31 0001263043 ifrs-full:LaterThanFiveYearsMember ifrs-full:OtherAssetsMember 2022-12-31 0001263043 ifrs-full:LaterThanThreeMonthsAndNotLaterThanSixMonthsMember ifrs-full:OtherAssetsMember 2022-12-31 0001263043 ifrs-full:LaterThanThreeMonthsAndNotLaterThanSixMonthsMember ifrs-full:VehiclesMember 2022-12-31 0001263043 ifrs-full:LaterThanSixMonthsAndNotLaterThanOneYearMember ifrs-full:VehiclesMember 2022-12-31 0001263043 ifrs-full:LaterThanOneYearAndNotLaterThanFiveYearsMember 2022-12-31 0001263043 ifrs-full:NotLaterThanOneMonthMember ifrs-full:OtherAssetsMember 2022-12-31 0001263043 ifrs-full:LaterThanFiveYearsMember ifrs-full:VehiclesMember 2022-12-31 0001263043 ifrs-full:LaterThanOneMonthAndNotLaterThanThreeMonthsMember ifrs-full:OtherAssetsMember 2022-12-31 0001263043 ifrs-full:LaterThanOneYearAndNotLaterThanFiveYearsMember ifrs-full:OtherAssetsMember 2022-12-31 0001263043 ifrs-full:NotLaterThanOneMonthMember 2022-12-31 0001263043 ifrs-full:LaterThanSixMonthsAndNotLaterThanOneYearMember 2022-12-31 0001263043 ifrs-full:LandAndBuildingsMember ifrs-full:LaterThanThreeMonthsAndNotLaterThanSixMonthsMember 2022-12-31 0001263043 ifrs-full:LaterThanFiveYearsMember ifrs-full:LandAndBuildingsMember 2022-12-31 0001263043 ifrs-full:NotLaterThanOneMonthMember ifrs-full:LandAndBuildingsMember 2022-12-31 0001263043 ifrs-full:LaterThanSixMonthsAndNotLaterThanOneYearMember ifrs-full:LandAndBuildingsMember 2022-12-31 0001263043 shg:AssociatesIMMGlobalPrivateEquityFundMember 2022-12-31 0001263043 shg:LogisvalleyShinhanReitCo.ltd.Member 2022-12-31 0001263043 shg:GoduckGangil10PFVCoLtdMember 2022-12-31 0001263043 shg:AssociatesGoduckGangil1PFVCoLtdMember 2022-12-31 0001263043 shg:ForeignCurrencyMember shg:GainLossOnFairValueHedgesMember 2022-12-31 0001263043 shg:DomesticCurrencyMember shg:GainLossOnFairValueHedgesMember 2022-12-31 0001263043 shg:ShSustainableManagementEsgShortTermBondSecurityFeederInvestmentTrustNo.1Member 2022-12-31 0001263043 shg:ShGlobalNetZeroSolutionSecurityInvestmentTrustMember 2022-12-31 0001263043 shg:ShinhanNeopluxEnergyNewbizFundMember 2022-12-31 0001263043 shg:KTCNPGrowthChamp20112PrivateEquityFundMember 2022-12-31 0001263043 shg:SHINHANNEOCoreIndustrialTechnologyFundMember 2022-12-31 0001263043 shg:NeopluxMarketFrontierSecondaryFundMember 2022-12-31 0001263043 shg:ShinhanNeoMarketfrontier2ndFundMember 2022-12-31 0001263043 shg:FutureCreationNeopluxVentureCapitalFundMember 2022-12-31 0001263043 shg:NeopluxNo3PrivateEquityFundMember 2022-12-31 0001263043 shg:GyeonggiNeopluxSupermanFundMember 2022-12-31 0001263043 shg:NewWave6thFundMember 2022-12-31 0001263043 shg:ShinhanVcTomorrowVentureFund1Member 2022-12-31 0001263043 ifrs-full:BottomOfRangeMember 2022-12-31 0001263043 ifrs-full:TopOfRangeMember 2022-12-31 0001263043 ifrs-full:BottomOfRangeMember shg:SubsidiaryShinhanLifeInsuranceMember shg:LiabilityAdequacyTestForLifeInsuranceMember 2022-12-31 0001263043 ifrs-full:TopOfRangeMember shg:SubsidiaryShinhanLifeInsuranceMember shg:LiabilityAdequacyTestForLifeInsuranceMember 2022-12-31 0001263043 shg:RealGdpGrowthMember shg:TwoThousandTwentySevenMember shg:OtherThanLifeInsuranceMember 2022-12-31 0001263043 shg:PrivateConsumptionGrowthMember shg:TwoThousandTwentySixMember shg:OtherThanLifeInsuranceMember 2022-12-31 0001263043 shg:TwoThousandTwentyThreeMember shg:RealGdpGrowthMember shg:OtherThanLifeInsuranceMember 2022-12-31 0001263043 shg:CpiGrowthMember shg:TwoThousandTwentyFiveMember shg:OtherThanLifeInsuranceMember 2022-12-31 0001263043 shg:TwoThousandTwentyTwoMember shg:CpiGrowthMember shg:OtherThanLifeInsuranceMember 2022-12-31 0001263043 shg:TwoThousandTwentyThreeMember shg:PrivateConsumptionGrowthMember shg:OtherThanLifeInsuranceMember 2022-12-31 0001263043 shg:CpiGrowthMember shg:TwoThousandTwentySixMember shg:OtherThanLifeInsuranceMember 2022-12-31 0001263043 shg:PrivateConsumptionGrowthMember shg:TwoThousandTwentyFiveMember shg:OtherThanLifeInsuranceMember 2022-12-31 0001263043 shg:TwoThousandTwentyThreeMember shg:CpiGrowthMember shg:OtherThanLifeInsuranceMember 2022-12-31 0001263043 shg:TwoThousandTwentyFourMember shg:PrivateConsumptionGrowthMember shg:OtherThanLifeInsuranceMember 2022-12-31 0001263043 shg:PrivateConsumptionGrowthMember shg:TwoThousandTwentySevenMember shg:OtherThanLifeInsuranceMember 2022-12-31 0001263043 shg:OtherThanLifeInsuranceMember shg:RealGdpGrowthMember shg:TwoThousandTwentyFourMember 2022-12-31 0001263043 shg:RealGdpGrowthMember shg:TwoThousandTwentyFiveMember shg:OtherThanLifeInsuranceMember 2022-12-31 0001263043 shg:OtherThanLifeInsuranceMember shg:PrivateConsumptionGrowthMember shg:TwoThousandTwentyTwoMember 2022-12-31 0001263043 shg:RealGdpGrowthMember shg:TwoThousandTwentySixMember shg:OtherThanLifeInsuranceMember 2022-12-31 0001263043 shg:OtherThanLifeInsuranceMember shg:RealGdpGrowthMember shg:TwoThousandTwentyTwoMember 2022-12-31 0001263043 shg:CpiGrowthMember shg:TwoThousandTwentySevenMember shg:OtherThanLifeInsuranceMember 2022-12-31 0001263043 shg:TwoThousandTwentyFourMember shg:CpiGrowthMember shg:OtherThanLifeInsuranceMember 2022-12-31 0001263043 shg:RateOfReturnOnInvestmentMember shg:LifeInsuranceComponentMember 2022-12-31 0001263043 shg:RiskBasedCapitalRatioMember shg:LifeInsuranceComponentMember 2022-12-31 0001263043 shg:AssetsPledgedAsCollateralMember 2022-12-31 0001263043 ifrs-full:TradingSecuritiesMember 2022-12-31 0001263043 ifrs-full:FinancialAssetsAtFairValueThroughProfitOrLossCategoryMember ifrs-full:TradingSecuritiesMember 2022-12-31 0001263043 ifrs-full:TradingSecuritiesMember ifrs-full:FinancialAssetsAtAmortisedCostCategoryMember 2022-12-31 0001263043 ifrs-full:TradingSecuritiesMember ifrs-full:FinancialAssetsAtFairValueThroughOtherComprehensiveIncomeCategoryMember 2022-12-31 0001263043 shg:PropertyAndEquipmentRealEstateMember 2022-12-31 0001263043 shg:DepositsMember ifrs-full:FinancialAssetsAtAmortisedCostCategoryMember 2022-12-31 0001263043 shg:ArticleFiftyThreeOfFinancialHoldingCompaniesActMember 2022-12-31 0001263043 ifrs-full:NoncontrollingInterestsMember shg:ShinhanBankJejuBankAndShinhanCapitalMember 2022-12-31 0001263043 shg:BankingMember ifrs-full:BottomOfRangeMember 2022-12-31 0001263043 shg:BankingMember ifrs-full:TopOfRangeMember 2022-12-31 0001263043 shg:CreditCardMember ifrs-full:BottomOfRangeMember 2022-12-31 0001263043 shg:CreditCardMember ifrs-full:TopOfRangeMember 2022-12-31 0001263043 shg:SecuritiesMember ifrs-full:BottomOfRangeMember 2022-12-31 0001263043 shg:SecuritiesMember ifrs-full:TopOfRangeMember 2022-12-31 0001263043 ifrs-full:AllOtherSegmentsMember ifrs-full:BottomOfRangeMember 2022-12-31 0001263043 ifrs-full:AllOtherSegmentsMember ifrs-full:TopOfRangeMember 2022-12-31 0001263043 ifrs-full:TopOfRangeMember sic:Z6311 2022-12-31 0001263043 sic:Z6311 ifrs-full:BottomOfRangeMember 2022-12-31 0001263043 shg:SecuritiesMember 2022-12-31 0001263043 ifrs-full:AllOtherSegmentsMember 2022-12-31 0001263043 shg:NomuraRifaPrivateRealEstateInvestmentTrustNo.19Member 2022-12-31 0001263043 shg:AssociatesSHBNPPMAINProfessionalInvestmentTypePrivateMixedAssetInvestmentTrustNo3Member 2022-12-31 0001263043 shg:DsPowerSemiconPrivateEquityFundMember 2022-12-31 0001263043 shg:GenesisNo.1PrivateEquityFundMember 2022-12-31 0001263043 shg:DdiLvcMasterRealEstateInvestmentTrustCo.Ltd.Member 2022-12-31 0001263043 shg:NewlakeGrowthCapitalPartners2PefMember 2022-12-31 0001263043 shg:ShinhanalbatrossTechInvestmentFundMember 2022-12-31 0001263043 shg:SeokwangTiMember 2022-12-31 0001263043 shg:ShinhanTime1stInvestmentFundMember 2022-12-31 0001263043 shg:CjlNo1PrivateEquityFundMember 2022-12-31 0001263043 shg:WavetechnologyCo.ltdMember 2022-12-31 0001263043 shg:NVStationPrivateEquityFundMember 2022-12-31 0001263043 shg:NovaNewTechnologyInvestmentFundNo1Member 2022-12-31 0001263043 shg:KoreaDigitalAssetCustodyMember 2022-12-31 0001263043 shg:SwsFundMember 2022-12-31 0001263043 shg:ShinhanGlobalActiveReitCo.ltd.Member 2022-12-31 0001263043 shg:AssociatesKoreaCreditBureauMember 2022-12-31 0001263043 shg:AssociatesSprottGlobalRenewablePrivateEquityFundIMember 2022-12-31 0001263043 shg:AssociatesKoreaFinanceSecurityMember 2022-12-31 0001263043 shg:ShinhanGlobalHealthcareFund2Member 2022-12-31 0001263043 shg:AssociatesDreamHighFund3Member 2022-12-31 0001263043 shg:AssociatesIncorporatedAssociationFinanceSavingInformationCenterMember 2022-12-31 0001263043 shg:AssociatesPartners4thGrowthInvestmentFundMember 2022-12-31 0001263043 shg:AssociatesKDBCMidasDongASnowballVentureFundIIMember 2022-12-31 0001263043 shg:AssociatesHermesPrivateInvestmentEquityFundMember 2022-12-31 0001263043 shg:AssociatesSBCPFVCoLtdMember 2022-12-31 0001263043 shg:IMMSpecialSituation12PRIVATEEQUITYFUNDMember 2022-12-31 0001263043 shg:DeepblueNo.1PrivateEquityFundMember 2022-12-31 0001263043 shg:IpixelCoLtdMember 2022-12-31 0001263043 ifrs-full:OtherRelatedPartiesMember 2022-12-31 0001263043 shg:InsuranceContractLiabilitiesMember 2022-12-31 0001263043 shg:Gen2RelatedTrustInstrumentsMember 2022-12-31 0001263043 shg:ShinhanEzGeneralInsuranceLtdMember 2022-12-31 0001263043 shg:BankTimeDepositsMember 2022-12-31 0001263043 shg:BankTimeDepositsMember shg:ForeignCurrencyMember 2022-12-31 0001263043 shg:DemandDepositsMember shg:ForeignCurrencyMember 2022-12-31 0001263043 shg:DemandDepositsMember 2022-12-31 0001263043 shg:NoteDiscountDepositsMember 2022-12-31 0001263043 shg:BankTimeDepositsMember shg:DomesticCurrencyMember 2022-12-31 0001263043 shg:OtherDepositsMember 2022-12-31 0001263043 shg:CertificatesOfDepositMember 2022-12-31 0001263043 shg:DemandDepositsMember shg:DomesticCurrencyMember 2022-12-31 0001263043 shg:CmaMember 2022-12-31 0001263043 shg:PledgedAssetsRightToSellOrPledgeMember 2022-12-31 0001263043 shg:CapstoneDevelopFrontierTrustMember 2022-12-31 0001263043 shg:ImmGlobalVentureOpportunityLpMember 2022-12-31 0001263043 shg:NhjibkcLabelTechnologyFundMember 2022-12-31 0001263043 shg:ShinhanGlobalActiveReitCo.ltd.Member 2022-12-31 0001263043 shg:Bts2ndPrivateEquityFundMember 2022-12-31 0001263043 shg:KoreaInvestmentGreenNewdealInfraTrustNo.1Member 2022-12-31 0001263043 shg:KdbInvestmentGlobalHealthcarePrivateEquityFundIMember 2022-12-31 0001263043 shg:LogisvalleyShinhanReitCo.ltdMember 2022-12-31 0001263043 shg:CornerstoneJmFundIMember 2022-12-31 0001263043 shg:Igen2022No.1PrivateEquityFundMember 2022-12-31 0001263043 shg:ShinhancognitiveStartupFundL.pMember 2022-12-31 0001263043 shg:LbYoungnamLogisticsPrivateTrustNo.40Member 2022-12-31 0001263043 shg:KoreaInvestmentTopMezzaninePrivateRealEsateTrustNo.1Member 2022-12-31 0001263043 shg:KoramcoPrivateRealEstateFund143Member 2022-12-31 0001263043 shg:GoldenRoute2ndStartupVentureSpecializedPrivateEquityFundMember 2022-12-31 0001263043 shg:ParatusNo3PrivateEquityFundMember 2022-12-31 0001263043 shg:Shinhanfitrin1stTechnologyBusinessInvestmentAssociationMember 2022-12-31 0001263043 shg:FindgreenNewDeal2ndEquityFundMember 2022-12-31 0001263043 shg:DdiLvcMasterRealEstateInvestmentTrustCo.LtdMember 2022-12-31 0001263043 shg:NhbrainEvFundMember 2022-12-31 0001263043 shg:SticAltGlobalIiPrivateEquityFundMember 2022-12-31 0001263043 shg:TigerGreenAlpahTrustNo.29Member 2022-12-31 0001263043 shg:KoreaInvestmentDevelopSeedTrustNo.1Member 2022-12-31 0001263043 shg:ShinhanSimoneFundIMember 2022-12-31 0001263043 shg:HarvestFundNo.3Member 2022-12-31 0001263043 shg:ShinhankunicornFirstFundMember 2022-12-31 0001263043 shg:FivetreeGeneralPrivateEquityFundNo.15Member 2022-12-31 0001263043 shg:RifaRealEstatePrivatePlacementFundForNormalInvestoesNo.51Member 2022-12-31 0001263043 shg:KiwoomRealEstatePrivatePlacementFundForNormalInvestorsNo.31Member 2022-12-31 0001263043 shg:StonebridgeshinhanUnicornSecondaryFundMember 2022-12-31 0001263043 shg:HiotaFundMember 2022-12-31 0001263043 shg:NhKyoboAiSolutionInvestmentFundMember 2022-12-31 0001263043 shg:SjEsgInnovativeGrowthFundMember 2022-12-31 0001263043 shg:KiwoomshinhanInnovationFund2Member 2022-12-31 0001263043 shg:HelioskdbcDigitalContents1stMember 2022-12-31 0001263043 shg:AssociatesOthers2019Member 2022-12-31 0001263043 shg:DigitalNewDealKappaPrivateEquityFundMember 2022-12-31 0001263043 shg:OnNo.1PrivateEquityFundMember 2022-12-31 0001263043 shg:NauticGreenInnovationEsgCoinvestmentNo.1PrivateEquityFundMember 2022-12-31 0001263043 shg:IbkcbehighFund1stMember 2022-12-31 0001263043 shg:NhdaishinkyoboHealthcare1FundMember 2022-12-31 0001263043 shg:EventusibkcLibFundMember 2022-12-31 0001263043 shg:Sh1.5yearsMaturityInvestmentTypeSecurityInvestmentTrustNo.2Member 2022-12-31 0001263043 shg:ShSustainableManagementEsgShortTermBondSecurityFeederInvestmentTrustNo.1Member 2022-12-31 0001263043 shg:AssociatesSHBNPPMAINProfessionalInvestmentTypePrivateMixedAssetInvestmentTrustNo3Member 2022-12-31 0001263043 shg:PacificPrivateInvestmentTrustNo.491Member 2022-12-31 0001263043 shg:KeistoneUnicornPrivateEquityFundMember 2022-12-31 0001263043 shg:KbDistributionPrivateRealEstate31Member 2022-12-31 0001263043 shg:IbkcmetisGlobalContentsInvestmentFundMember 2022-12-31 0001263043 shg:CriteriaForCapitalAdequacyToBeCompliedWithMember 2022-12-31 0001263043 shg:EquityAndDerivativeLinkedSecuritiesMember 2022-12-31 0001263043 shg:OtherPartyLiabilitiesMember 2022-12-31 0001263043 shg:ShinhanLifeInsuranceCoLtdMember shg:MergerMember 2022-12-31 0001263043 shg:PreferredStockIssueMember 2022-12-31 0001263043 shg:AbcpPurchaseAgreementsMember 2022-12-31 0001263043 ifrs-full:FinancialAssetsAtFairValueThroughProfitOrLossCategoryMember 2022-12-31 0001263043 ifrs-full:FinancialAssetsAtFairValueThroughProfitOrLossCategoryMember ifrs-full:Level3OfFairValueHierarchyMember 2022-12-31 0001263043 ifrs-full:Level3OfFairValueHierarchyMember ifrs-full:FinancialLiabilitiesAtFairValueThroughProfitOrLossDesignatedUponInitialRecognitionCategoryMember 2022-12-31 0001263043 ifrs-full:Level3OfFairValueHierarchyMember shg:DerivativeFinancialInstrumentsAssetsMember 2022-12-31 0001263043 shg:UsdLiborMember shg:CorporateBondsAndOthersMember ifrs-full:FinancialAssetsAtFairValueThroughProfitOrLossCategoryMember 2022-12-31 0001263043 shg:LoansMember shg:DueFromBanksAndLoansAtAmortizedCostMember shg:UsdLiborMember 2022-12-31 0001263043 shg:FinancialInstitutionsBondsMember ifrs-full:FinancialAssetsAtFairValueThroughOtherComprehensiveIncomeCategoryMember shg:UsdLiborMember 2022-12-31 0001263043 shg:CorporateBondsAndOthersMember ifrs-full:FinancialAssetsAtFairValueThroughOtherComprehensiveIncomeCategoryMember shg:UsdLiborMember 2022-12-31 0001263043 shg:UsdLiborMember ifrs-full:FinancialAssetsAtFairValueThroughOtherComprehensiveIncomeCategoryMember 2022-12-31 0001263043 shg:UsdLiborMember shg:CommitmentsAndGuaranteeContractsMember 2022-12-31 0001263043 ifrs-full:FinancialLiabilitiesAtFairValueThroughProfitOrLossCategoryMember shg:DerivativesCombinedSecuritiesMember shg:UsdLiborMember 2022-12-31 0001263043 ifrs-full:FinancialLiabilitiesAtAmortisedCostCategoryMember shg:DepositsMember shg:UsdLiborMember 2022-12-31 0001263043 ifrs-full:FinancialLiabilitiesAtAmortisedCostCategoryMember shg:BorrowingsMember shg:UsdLiborMember 2022-12-31 0001263043 ifrs-full:FinancialLiabilitiesAtAmortisedCostCategoryMember shg:DebtSecuritiesIssuedMember shg:UsdLiborMember 2022-12-31 0001263043 ifrs-full:FinancialLiabilitiesAtAmortisedCostCategoryMember shg:UsdLiborMember 2022-12-31 0001263043 shg:UsdLiborMember shg:InterestRatesRelatedMember shg:NotDesignatedAsHedgingInstrumentTradingMember 2022-12-31 0001263043 shg:UsdLiborMember shg:EquityAndForeignExchangeContractMember shg:NotDesignatedAsHedgingInstrumentTradingMember 2022-12-31 0001263043 shg:UsdLiborMember shg:EquityContractMember shg:NotDesignatedAsHedgingInstrumentTradingMember 2022-12-31 0001263043 shg:UsdLiborMember shg:CreditRiskContractMember shg:NotDesignatedAsHedgingInstrumentTradingMember 2022-12-31 0001263043 shg:NotDesignatedAsHedgingInstrumentTradingMember shg:OtherContractMember shg:UsdLiborMember 2022-12-31 0001263043 shg:UsdLiborMember shg:NotDesignatedAsHedgingInstrumentTradingMember 2022-12-31 0001263043 shg:UsdLiborMember shg:InterestRatesRelatedMember shg:DesignatedAsHedgingInstrumentMember 2022-12-31 0001263043 shg:UsdLiborMember shg:EquityAndForeignExchangeContractMember shg:DesignatedAsHedgingInstrumentMember 2022-12-31 0001263043 shg:UsdLiborMember shg:DesignatedAsHedgingInstrumentMember 2022-12-31 0001263043 shg:OtherLongTermInvestmentsMember ifrs-full:BottomOfRangeMember 2022-12-31 0001263043 shg:OtherLongTermInvestmentsMember ifrs-full:TopOfRangeMember 2022-12-31 0001263043 ifrs-full:LaterThanThreeYearsMember 2022-12-31 0001263043 shg:AssociatesBNPParibasCardifGeneralInsuranceMember 2022-12-31 0001263043 shg:ShinhanLifeInsuranceCoLtdMember 2022-12-31 0001263043 shg:IfrsFourAndIfrsNineMember shg:SubsidiaryShinhanLifeInsuranceMember 2022-12-31 0001263043 shg:IfrsSeventeenAndIfrsNineMember shg:SubsidiaryShinhanLifeInsuranceMember 2022-12-31 0001263043 ifrs-full:FinancialEffectOfChangesInAccountingPolicyMember shg:SubsidiaryShinhanLifeInsuranceMember 2022-12-31 0001263043 shg:IfrsFourAndIfrsNineMember shg:AssociatesShinhanEzGeneralInsuranceLtd.Member 2022-12-31 0001263043 shg:IfrsSeventeenAndIfrsNineMember shg:AssociatesShinhanEzGeneralInsuranceLtd.Member 2022-12-31 0001263043 ifrs-full:FinancialEffectOfChangesInAccountingPolicyMember shg:AssociatesShinhanEzGeneralInsuranceLtd.Member 2022-12-31 0001263043 shg:UnderlyingContractsMember shg:SubsidiaryShinhanLifeInsurancesMember shg:FinancialImpactOnInsuranceAssetsAndLiabilitiesMember 2022-12-31 0001263043 ifrs-full:ReinsuranceContractsHeldMember shg:SubsidiaryShinhanLifeInsurancesMember shg:FinancialImpactOnInsuranceAssetsAndLiabilitiesMember 2022-12-31 0001263043 shg:SubsidiaryShinhanLifeInsurancesMember shg:FinancialImpactOnInsuranceAssetsAndLiabilitiesMember 2022-12-31 0001263043 shg:UnderlyingContractsMember shg:AssociatesShinhanEzGeneralInsuranceLtd.Member shg:FinancialImpactOnInsuranceAssetsAndLiabilitiesMember 2022-12-31 0001263043 ifrs-full:ReinsuranceContractsHeldMember shg:AssociatesShinhanEzGeneralInsuranceLtd.Member shg:FinancialImpactOnInsuranceAssetsAndLiabilitiesMember 2022-12-31 0001263043 shg:AssociatesShinhanEzGeneralInsuranceLtd.Member shg:FinancialImpactOnInsuranceAssetsAndLiabilitiesMember 2022-12-31 0001263043 shg:ShinhanLifeInsuranceCoLtdMember 2022-12-31 0001263043 srt:ParentCompanyMember 2020-01-01 2020-12-31 0001263043 shg:SecuritiesAtFVTPLMember 2020-01-01 2020-12-31 0001263043 ifrs-full:FinancialAssetsAtFairValueThroughOtherComprehensiveIncomeCategoryMember 2020-01-01 2020-12-31 0001263043 shg:EmployeeStockOptionSixthMember 2020-01-01 2020-12-31 0001263043 shg:PerformanceSharesMember 2020-01-01 2020-12-31 0001263043 shg:EmployeeStockOptionSeventhMember 2020-01-01 2020-12-31 0001263043 shg:ShinhanAssetTrustCo.Ltd.Member 2020-01-01 2020-12-31 0001263043 shg:SubsidiaryJejuBankMember 2020-01-01 2020-12-31 0001263043 shg:DummySMember 2020-01-01 2020-12-31 0001263043 shg:SubsidiaryShinhanCardMember 2020-01-01 2020-12-31 0001263043 shg:SubsidiaryShinhanDataSystemMember 2020-01-01 2020-12-31 0001263043 shg:SubsidiaryShinhanSavingsBankMember 2020-01-01 2020-12-31 0001263043 shg:SubsidiaryShinhanCapitalMember 2020-01-01 2020-12-31 0001263043 shg:SubsidiaryShinhanAssetManagementCo.Ltd.Member 2020-01-01 2020-12-31 0001263043 shg:SubsidiaryShinhanVentureInvestmentMember 2020-01-01 2020-12-31 0001263043 shg:SubsidiaryShinhanAIMember 2020-01-01 2020-12-31 0001263043 shg:SubsidiaryOrangeLifeInsuranceMember 2020-01-01 2020-12-31 0001263043 shg:SubsidiaryShinhanLifeInsuranceMember 2020-01-01 2020-12-31 0001263043 shg:SubsidiaryShinhanAitasMember 2020-01-01 2020-12-31 0001263043 shg:SubsidiaryShinhanAlternativeInvestmentManagementMember 2020-01-01 2020-12-31 0001263043 shg:SubsidiarySHCManagementMember 2020-01-01 2020-12-31 0001263043 shg:SubsidiaryShinhanREITsManagementMember 2020-01-01 2020-12-31 0001263043 shg:ShinhanSecuritiesCo.Ltd.Member 2020-01-01 2020-12-31 0001263043 shg:SubsidiaryShinhanBankMember 2020-01-01 2020-12-31 0001263043 ifrs-full:ForeignCountriesMember 2020-01-01 2020-12-31 0001263043 ifrs-full:CountryOfDomicileMember 2020-01-01 2020-12-31 0001263043 ifrs-full:AllOtherSegmentsMember 2020-01-01 2020-12-31 0001263043 shg:CreditMember 2020-01-01 2020-12-31 0001263043 shg:CreditMember shg:ExternalCustomersMember 2020-01-01 2020-12-31 0001263043 shg:ConsolidationAdjustmentMember shg:ExternalCustomersMember 2020-01-01 2020-12-31 0001263043 shg:SecuritiesMember 2020-01-01 2020-12-31 0001263043 shg:ConsolidationAdjustmentMember 2020-01-01 2020-12-31 0001263043 shg:BankingMember shg:InternalTransactionsMember 2020-01-01 2020-12-31 0001263043 shg:CreditCardMember 2020-01-01 2020-12-31 0001263043 shg:LifeInsuranceMember shg:ExternalCustomersMember 2020-01-01 2020-12-31 0001263043 shg:LifeInsuranceMember 2020-01-01 2020-12-31 0001263043 ifrs-full:AllOtherSegmentsMember shg:ExternalCustomersMember 2020-01-01 2020-12-31 0001263043 shg:BankingMember 2020-01-01 2020-12-31 0001263043 shg:InternalTransactionsMember 2020-01-01 2020-12-31 0001263043 shg:ConsolidationAdjustmentMember shg:InternalTransactionsMember 2020-01-01 2020-12-31 0001263043 shg:CreditCardMember shg:ExternalCustomersMember 2020-01-01 2020-12-31 0001263043 shg:SecuritiesMember shg:InternalTransactionsMember 2020-01-01 2020-12-31 0001263043 shg:SecuritiesMember shg:ExternalCustomersMember 2020-01-01 2020-12-31 0001263043 shg:ExternalCustomersMember 2020-01-01 2020-12-31 0001263043 shg:CreditMember shg:InternalTransactionsMember 2020-01-01 2020-12-31 0001263043 shg:InternalTransactionsMember shg:LifeInsuranceMember 2020-01-01 2020-12-31 0001263043 ifrs-full:AllOtherSegmentsMember shg:InternalTransactionsMember 2020-01-01 2020-12-31 0001263043 shg:BankingMember shg:ExternalCustomersMember 2020-01-01 2020-12-31 0001263043 shg:CreditCardMember shg:InternalTransactionsMember 2020-01-01 2020-12-31 0001263043 shg:ForeignCurrencyRelatedMember shg:OverTheCounterMember ifrs-full:ForwardContractMember 2020-01-01 2020-12-31 0001263043 shg:ForeignCurrencyRelatedMember shg:OverTheCounterMember 2020-01-01 2020-12-31 0001263043 shg:ForeignCurrencyRelatedMember shg:ExchangeTradedMember 2020-01-01 2020-12-31 0001263043 shg:ForeignCurrencyRelatedMember shg:OverTheCounterMember ifrs-full:SwapContractMember 2020-01-01 2020-12-31 0001263043 shg:ForeignCurrencyRelatedMember shg:OverTheCounterMember ifrs-full:OptionContractMember 2020-01-01 2020-12-31 0001263043 shg:EquityRelatedMember shg:ExchangeTradedMember shg:EquityFuturesMember 2020-01-01 2020-12-31 0001263043 shg:ExchangeTradedMember 2020-01-01 2020-12-31 0001263043 shg:CommodityRelatedMember shg:ExchangeTradedMember 2020-01-01 2020-12-31 0001263043 shg:EquityRelatedMember shg:OverTheCounterMember 2020-01-01 2020-12-31 0001263043 shg:CreditRelatedMember shg:CreditSwapsMember shg:OverTheCounterMember 2020-01-01 2020-12-31 0001263043 shg:CommodityRelatedMember shg:ExchangeTradedMember shg:CommodityFuturesMember 2020-01-01 2020-12-31 0001263043 shg:NotDesignatedAsHedgingInstrumentTradingMember shg:EquityContractMember shg:ExchangeTradedMember 2020-01-01 2020-12-31 0001263043 shg:CommodityRelatedMember shg:OverTheCounterMember shg:CommodityFuturesAndOptionsMember 2020-01-01 2020-12-31 0001263043 shg:EquityRelatedMember shg:OverTheCounterMember shg:EquitySwapsAndForwardsMember 2020-01-01 2020-12-31 0001263043 shg:CommodityRelatedMember shg:OverTheCounterMember 2020-01-01 2020-12-31 0001263043 shg:HedgeFundsMember 2020-01-01 2020-12-31 0001263043 ifrs-full:FuturesContractMember shg:ForeignCurrencyRelatedMember shg:ExchangeTradedMember 2020-01-01 2020-12-31 0001263043 shg:InterestRatesRelatedMember shg:OverTheCounterMember shg:InterestRateForwardsAndSwapsMember 2020-01-01 2020-12-31 0001263043 shg:InterestRatesRelatedMember shg:ExchangeTradedMember shg:InterestRateFutureContractMember 2020-01-01 2020-12-31 0001263043 shg:InterestRatesRelatedMember shg:OverTheCounterMember shg:InterestRateOptionContractMember 2020-01-01 2020-12-31 0001263043 shg:OverTheCounterMember shg:InterestRatesRelatedMember 2020-01-01 2020-12-31 0001263043 shg:InterestRatesRelatedMember shg:ExchangeTradedMember 2020-01-01 2020-12-31 0001263043 shg:EquityRelatedMember shg:ExchangeTradedMember shg:EquityOptionsMember 2020-01-01 2020-12-31 0001263043 shg:CommodityRelatedMember shg:OverTheCounterMember shg:CommoditySwapsAndForwardsMember 2020-01-01 2020-12-31 0001263043 shg:EquityRelatedMember shg:OverTheCounterMember shg:EquityOptionsMember 2020-01-01 2020-12-31 0001263043 shg:LoanReceivablesMeasuredAtFVTPLMember 2020-01-01 2020-12-31 0001263043 shg:DueFromBanksAtFVTPLMember 2020-01-01 2020-12-31 0001263043 ifrs-full:EquityAttributableToOwnersOfParentMember 2020-01-01 2020-12-31 0001263043 ifrs-full:NoncontrollingInterestsMember 2020-01-01 2020-12-31 0001263043 ifrs-full:AccumulatedOtherComprehensiveIncomeMember 2020-01-01 2020-12-31 0001263043 ifrs-full:RetainedEarningsMember 2020-01-01 2020-12-31 0001263043 shg:CapitalAdjustmentsMember 2020-01-01 2020-12-31 0001263043 shg:CapitalSurplusMember 2020-01-01 2020-12-31 0001263043 shg:HybridBondsMember 2020-01-01 2020-12-31 0001263043 ifrs-full:IssuedCapitalMember 2020-01-01 2020-12-31 0001263043 ifrs-full:FinancialLiabilitiesAtFairValueThroughProfitOrLossDesignatedUponInitialRecognitionCategoryMember 2020-01-01 2020-12-31 0001263043 shg:LoansAtAmortizedCostMember 2020-01-01 2020-12-31 0001263043 ifrs-full:OtherAssetsMember 2020-01-01 2020-12-31 0001263043 shg:ShinhanEzGeneralInsuranceLtdMember 2020-01-01 2020-12-31 0001263043 shg:AssociatesStonebridgeShinhanUnicornSecondaryFundMember 2020-01-01 2020-12-31 0001263043 shg:AssociatesShinhanKunicornFirstFundMember 2020-01-01 2020-12-31 0001263043 shg:ShinhanquantumStartupFundMember 2020-01-01 2020-12-31 0001263043 shg:AssociatesShinhanPSInvestmentFundNo1Member 2020-01-01 2020-12-31 0001263043 shg:AssociatesSMNewTechnologyBusinessInvestmentFund1Member 2020-01-01 2020-12-31 0001263043 shg:AssociatesSynergyShinhanMezzanineNewTechnologyInvestmentFundMember 2020-01-01 2020-12-31 0001263043 shg:AssociatesSHCK2GlobalMaterialFundMember 2020-01-01 2020-12-31 0001263043 shg:AssociatesShinhanAlbatrossGrowthFundMember 2020-01-01 2020-12-31 0001263043 shg:AssociatesGXSHINHANINTEREST1stPrivateEquityFundMember 2020-01-01 2020-12-31 0001263043 shg:ShinhanmidasDongaSecondaryFundMember 2020-01-01 2020-12-31 0001263043 shg:AssociatesShinhanRhinos1FundMember 2020-01-01 2020-12-31 0001263043 shg:AssociatesFuturePlayShinhanTechInnovationFund1Member 2020-01-01 2020-12-31 0001263043 shg:OpenShinhanPortfolioInvestmentAssociationNo.1Member 2020-01-01 2020-12-31 0001263043 shg:AssociatesSHBNPPMAINProfessionalInvestmentTypePrivateMixedAssetInvestmentTrustNo3Member 2020-01-01 2020-12-31 0001263043 shg:AssociatesOneShinhanGlobalFund1Member 2020-01-01 2020-12-31 0001263043 shg:AssociatesKiwoomShinhanInnovationFundIMember 2020-01-01 2020-12-31 0001263043 shg:AssociatesSBCPFVCoLtdMember 2020-01-01 2020-12-31 0001263043 shg:AssociatesKoreaFinanceSecurityMember 2020-01-01 2020-12-31 0001263043 shg:AssociatesKoreaCreditBureauMember 2020-01-01 2020-12-31 0001263043 shg:AssociatesShinHanSooYoungEntrepreneurInvestmentFundNo1Member 2020-01-01 2020-12-31 0001263043 shg:AssociatesSHINHANCORETRENDGLOBALFUND1Member 2020-01-01 2020-12-31 0001263043 shg:IGISPRIVATEREALESTATETRUSTNO331Member 2020-01-01 2020-12-31 0001263043 shg:KoreaOmegaProjectFundIMember 2020-01-01 2020-12-31 0001263043 shg:KoFCNeopluxRDBizCreation20131InvestmentMember 2020-01-01 2020-12-31 0001263043 shg:NewWave6thFundMember 2020-01-01 2020-12-31 0001263043 shg:NeopluxNo3PrivateEquityFundMember 2020-01-01 2020-12-31 0001263043 shg:EDNCENTRALCoLtdMember 2020-01-01 2020-12-31 0001263043 shg:ShinhanTimeMezzanineBlindFundMember 2020-01-01 2020-12-31 0001263043 shg:EtriHoldingsShinhan1stUnicornFundMember 2020-01-01 2020-12-31 0001263043 shg:AssociatesKiwoomShinhanInnovationFund2Member 2020-01-01 2020-12-31 0001263043 shg:ReverentShinhanVistaFundMember 2020-01-01 2020-12-31 0001263043 shg:UlmusShcInnovationInvestmentFundMember 2020-01-01 2020-12-31 0001263043 shg:JsShinhanPrivateEquityFundMember 2020-01-01 2020-12-31 0001263043 shg:ShinhanVcTomorrowVentureFund1Member 2020-01-01 2020-12-31 0001263043 shg:SwkshinhanNewTechnologyInvestmentFund1stMember 2020-01-01 2020-12-31 0001263043 shg:ShinhanNeoMarketfrontier2ndFundMember 2020-01-01 2020-12-31 0001263043 shg:ShinhanWesternTDConsignmentManagementRealEstateInvestmentCoLtdMember 2020-01-01 2020-12-31 0001263043 shg:Kakao-Shinhan1stTNYTFundMember 2020-01-01 2020-12-31 0001263043 shg:PacificSunnyProfessionalInvestorsPrivatePlacementRealEstateInvestmentCompanyNo45Member 2020-01-01 2020-12-31 0001263043 shg:SHINHANNEOCoreIndustrialTechnologyFundMember 2020-01-01 2020-12-31 0001263043 shg:KTCNPGrowthChamp20112PrivateEquityFundMember 2020-01-01 2020-12-31 0001263043 shg:FutureCreationNeopluxVentureCapitalFundMember 2020-01-01 2020-12-31 0001263043 shg:NeopluxMarketFrontierSecondaryFundMember 2020-01-01 2020-12-31 0001263043 shg:GyeonggiNeopluxSupermanFundMember 2020-01-01 2020-12-31 0001263043 shg:ShinhanNeopluxEnergyNewbizFundMember 2020-01-01 2020-12-31 0001263043 shg:Sparklabs-ShinhanOpportunityFund1Member 2020-01-01 2020-12-31 0001263043 shg:NewGreenShinhanMezzanineFundMember 2020-01-01 2020-12-31 0001263043 shg:ShinhanSmilegateGlobalPefIMember 2020-01-01 2020-12-31 0001263043 shg:AssociatesBNPParibasCardifLifeInsuranceMember 2020-01-01 2020-12-31 0001263043 shg:AssociatesShinhanPraxisKGrowthGlobalPrivateEquityFundMember 2020-01-01 2020-12-31 0001263043 shg:AssociatesShinhanNvestorLiquiditySolutionFundMember 2020-01-01 2020-12-31 0001263043 shg:AssociatesSHCULMUSFundNo1Member 2020-01-01 2020-12-31 0001263043 shg:ShinhanisquareVentureFund1stMember 2020-01-01 2020-12-31 0001263043 shg:AssociatesShinhanSimoneFundIMember 2020-01-01 2020-12-31 0001263043 shg:AssociatesShinhanFitrin1stTechnologyBusinessInvestmentAssociationMember 2020-01-01 2020-12-31 0001263043 shg:AssociatesLogisvalleyShinhanReitCo.ltd.Member 2020-01-01 2020-12-31 0001263043 shg:ShinhandevHealthcareFundIMember 2020-01-01 2020-12-31 0001263043 shg:AssociatesShinhanCognitiveStartupFundL.p.Member 2020-01-01 2020-12-31 0001263043 shg:GlobalCommerceFundMember 2020-01-01 2020-12-31 0001263043 shg:ShinhanhgiSocialEnterpriseFundMember 2020-01-01 2020-12-31 0001263043 shg:ShinhanwwgEnergyFundNewTechnologyVentureInvestmentFundMember 2020-01-01 2020-12-31 0001263043 shg:IgisshinhanNewTechnologyFund1Member 2020-01-01 2020-12-31 0001263043 shg:Shinhang.n.techSmartInnovationFundMember 2020-01-01 2020-12-31 0001263043 shg:AssociatesShSustainableManagementEsgShortTermBondSecurityFeederInvestmentTrustNo.1Member 2020-01-01 2020-12-31 0001263043 shg:ShGlobalNetZeroSolutionSecurityInvestmentTrustMember 2020-01-01 2020-12-31 0001263043 shg:DsShinhanContentInvestmentFund1Member 2020-01-01 2020-12-31 0001263043 shg:ShinhanTime1stInvestmentFundMember 2020-01-01 2020-12-31 0001263043 shg:ShinhanSgcEsgFundNo.1Member 2020-01-01 2020-12-31 0001263043 shg:ShinhansneakPeekBiohealthcareBounceBackFundMember 2020-01-01 2020-12-31 0001263043 shg:GoduckGangil10PFVCoLtdMember 2020-01-01 2020-12-31 0001263043 shg:DebtSecuritiesAtAmortisedCostMember 2020-01-01 2020-12-31 0001263043 ifrs-full:FinancialAssetsAtFairValueThroughOtherComprehensiveIncomeCategoryMember 2020-01-01 2020-12-31 0001263043 shg:SecuritiesAtFVTPLMember 2020-01-01 2020-12-31 0001263043 ifrs-full:FinancialLiabilitiesAtFairValueThroughProfitOrLossCategoryMember 2020-01-01 2020-12-31 0001263043 shg:UnusedCreditLineAndFinancialGuaranteeMember 2020-01-01 2020-12-31 0001263043 shg:COSPECBIMtechMember 2020-01-01 2020-12-31 0001263043 shg:AssociatesIMMGlobalPrivateEquityFundMember 2020-01-01 2020-12-31 0001263043 ifrs-full:DerivativesMember 2020-01-01 2020-12-31 0001263043 shg:DebtSecuritiesMeasuredAtFairValueThroughOtherComprehensiveIncomeMember 2020-01-01 2020-12-31 0001263043 shg:EquitySecuritiesMeasuredAtFairValueThroughOtherComprehensiveIncomeMember 2020-01-01 2020-12-31 0001263043 shg:CredianTF2020CorporateFinancialStabilityPrivateEquityFundMember 2020-01-01 2020-12-31 0001263043 shg:KoreaDigitalAssetCustodyMember 2020-01-01 2020-12-31 0001263043 shg:CjlNo1PrivateEquityFundMember 2020-01-01 2020-12-31 0001263043 shg:AssociatesHermesPrivateInvestmentEquityFundMember 2020-01-01 2020-12-31 0001263043 shg:AssociatesKDBCMidasDongASnowballVentureFundIIMember 2020-01-01 2020-12-31 0001263043 shg:AssociatesPartners4thGrowthInvestmentFundMember 2020-01-01 2020-12-31 0001263043 shg:AssociatesShinhanAlbatrossTechInvestmentFundMember 2020-01-01 2020-12-31 0001263043 shg:NewlakeGrowthCapitalPartners2PefMember 2020-01-01 2020-12-31 0001263043 shg:AssociatesShinhanGlobalActiveReitCo.ltdMember 2020-01-01 2020-12-31 0001263043 shg:DeepblueNo.1PrivateEquityFundMember 2020-01-01 2020-12-31 0001263043 shg:AssociatesDdiLvcMasterRealEstateInvestmentTrustCo.Ltd.Member 2020-01-01 2020-12-31 0001263043 shg:NomuraRifaPrivateRealEstateInvestmentTrustNo.19Member 2020-01-01 2020-12-31 0001263043 ifrs-full:OtherRelatedPartiesMember 2020-01-01 2020-12-31 0001263043 shg:AssociatesGoduckGangil1PFVCoLtdMember 2020-01-01 2020-12-31 0001263043 shg:IpixelCoLtdMember 2020-01-01 2020-12-31 0001263043 shg:ChangeInAccountingPolicyMember 2020-01-01 2020-12-31 0001263043 shg:SeriesBMember 2021-01-01 2021-12-31 0001263043 shg:SeriesCMember 2021-01-01 2021-12-31 0001263043 shg:SeriesDMember 2021-01-01 2021-12-31 0001263043 shg:SeriesEMember 2021-01-01 2021-12-31 0001263043 shg:SeriesFMember 2021-01-01 2021-12-31 0001263043 shg:SeriesGMember 2021-01-01 2021-12-31 0001263043 shg:SeriesHMember 2021-01-01 2021-12-31 0001263043 shg:SeriesIMember 2021-01-01 2021-12-31 0001263043 shg:SeriesJMember 2021-01-01 2021-12-31 0001263043 shg:SeriesKMember 2021-01-01 2021-12-31 0001263043 shg:SeriesLMember 2021-01-01 2021-12-31 0001263043 shg:SeriesMMember 2021-01-01 2021-12-31 0001263043 shg:SeriesNMember 2021-01-01 2021-12-31 0001263043 shg:SeriesOMember 2021-01-01 2021-12-31 0001263043 shg:SeriesPMember 2021-01-01 2021-12-31 0001263043 shg:SeriesQMember 2021-01-01 2021-12-31 0001263043 srt:ParentCompanyMember 2021-01-01 2021-12-31 0001263043 shg:UnusedLoanLimitMember shg:AssociatesBNPParibasCardifLifeInsuranceMember shg:SubsidiaryShinhanBankMember 2021-01-01 2021-12-31 0001263043 shg:AssociatesBNPParibasCardifLifeInsuranceMember shg:UnusedLinesOfCreditMember shg:SubsidiaryShinhanCardMember 2021-01-01 2021-12-31 0001263043 shg:ShinhanEzGeneralInsuranceLtdMember shg:UnusedLinesOfCreditMember shg:SubsidiaryShinhanCardMember 2021-01-01 2021-12-31 0001263043 shg:StructuredEntitiesMember shg:TheGroupMember shg:PurchaseAgreementMember 2021-01-01 2021-12-31 0001263043 shg:KeyManagementPersonnelMember shg:SubsidiaryShinhanBankMember shg:UnusedLoanLimitMember 2021-01-01 2021-12-31 0001263043 shg:AssociatesBNPParibasCardifLifeInsuranceMember shg:GovernmentGuaranteedCollateralMember shg:SubsidiaryShinhanBankMember 2021-01-01 2021-12-31 0001263043 shg:IpixelCoLtdMember shg:ElectronicCreditGuaranteeMember shg:SubsidiaryShinhanBankMember 2021-01-01 2021-12-31 0001263043 shg:CollateralTrustMember shg:AssociatesLogisvalleyShinhanReitCo.ltd.Member shg:SubsidiaryShinhanBankMember 2021-01-01 2021-12-31 0001263043 ifrs-full:PropertyPlantAndEquipmentMember shg:KeyManagementPersonnelMember shg:SubsidiaryShinhanBankMember 2021-01-01 2021-12-31 0001263043 shg:DepositsAndEtcMember shg:KeyManagementPersonnelMember shg:SubsidiaryShinhanBankMember 2021-01-01 2021-12-31 0001263043 shg:GuaranteeMember shg:KeyManagementPersonnelMember shg:SubsidiaryShinhanBankMember 2021-01-01 2021-12-31 0001263043 shg:SubsidiaryShinhanBankMember 2021-01-01 2021-12-31 0001263043 shg:ShinhanCreditInformationCo.Ltd.Member 2021-01-01 2021-12-31 0001263043 shg:SubsidiaryMFOShinhanFinanceMember 2021-01-01 2021-12-31 0001263043 shg:SubsidiaryShinhanIndoFinanceMember 2021-01-01 2021-12-31 0001263043 shg:SubsidiaryShinhanMicrofinanceMember 2021-01-01 2021-12-31 0001263043 shg:SubsidiaryShinhanVietnamFinanceMember 2021-01-01 2021-12-31 0001263043 shg:SubsidiaryShinhanSecuritiesAmericaIncMember 2021-01-01 2021-12-31 0001263043 shg:ShinhanSecuritiesAsiaLtd.Member 2021-01-01 2021-12-31 0001263043 shg:ShinhanSecuritiesVietnamCo.Ltd.Member 2021-01-01 2021-12-31 0001263043 shg:SubsidiaryPTShinhanAssetManagementIndonesiaMember 2021-01-01 2021-12-31 0001263043 shg:SubsidiaryShinhanFinancialPlusMember 2021-01-01 2021-12-31 0001263043 shg:SubsidiaryShinhanCubeonCoLtdMember 2021-01-01 2021-12-31 0001263043 shg:SubsidiaryShinhanLifeInsuranceVietnamCoLtdMember 2021-01-01 2021-12-31 0001263043 shg:ShinhanAssetManagementHongKongLimitedMember 2021-01-01 2021-12-31 0001263043 shg:SubsidiaryShinhanDSVietnamMember 2021-01-01 2021-12-31 0001263043 shg:SubsidiaryShinhanBankMember 2021-01-01 2021-12-31 0001263043 shg:ShinhanVentureInvestmentCo.Ltd.Member 2021-01-01 2021-12-31 0001263043 shg:SubsidiaryShinhanAIMember 2021-01-01 2021-12-31 0001263043 shg:SubsidiaryShinhanREITsManagementMember 2021-01-01 2021-12-31 0001263043 shg:SubsidiaryShinhanSavingsBankMember 2021-01-01 2021-12-31 0001263043 shg:SubsidiaryShinhanDataSystemMember 2021-01-01 2021-12-31 0001263043 shg:SubsidiarySHCManagementMember 2021-01-01 2021-12-31 0001263043 shg:SubsidiaryShinhanAssetManagementCo.Ltd.Member 2021-01-01 2021-12-31 0001263043 shg:SubsidiaryShinhanAlternativeInvestmentManagementMember 2021-01-01 2021-12-31 0001263043 shg:SubsidiaryShinhanCreditInformationMember 2021-01-01 2021-12-31 0001263043 shg:SubsidiaryJejuBankMember 2021-01-01 2021-12-31 0001263043 shg:SubsidiaryShinhanCapitalMember 2021-01-01 2021-12-31 0001263043 shg:SubsidiaryShinhanLifeInsuranceMember 2021-01-01 2021-12-31 0001263043 shg:ShinhanSecuritiesCo.Ltd.Member 2021-01-01 2021-12-31 0001263043 shg:SubsidiaryShinhanCardMember 2021-01-01 2021-12-31 0001263043 shg:ShinhanAssetTrustCo.Ltd.Member 2021-01-01 2021-12-31 0001263043 shg:SubsidiaryShinhanAitasMember 2021-01-01 2021-12-31 0001263043 shg:SubsidiaryShinhanEzGeneralInsuranceLtdMember 2021-01-01 2021-12-31 0001263043 shg:SubsidiaryShinhanBankAmericaMember 2021-01-01 2021-12-31 0001263043 shg:ShinhanBankEuropeGmbhMember 2021-01-01 2021-12-31 0001263043 shg:SubsidiaryShinhanSekuritasIndonesiaMember 2021-01-01 2021-12-31 0001263043 shg:SubsidiaryShinhanBankVietnamMember 2021-01-01 2021-12-31 0001263043 shg:SubsidiaryBancoShinhanDeMexicoMember 2021-01-01 2021-12-31 0001263043 shg:SubsidiarySBJDNXMember 2021-01-01 2021-12-31 0001263043 shg:SubsidiaryPTBankShinhanIndonesiaMember 2021-01-01 2021-12-31 0001263043 shg:SubsidiaryShinhanBankJapanMember 2021-01-01 2021-12-31 0001263043 shg:SubsidiaryShinhanBankChinaMember 2021-01-01 2021-12-31 0001263043 shg:SubsidiaryShinhanBankCanadaMember 2021-01-01 2021-12-31 0001263043 shg:SubsidiaryShinhanBankKazakhstanMember 2021-01-01 2021-12-31 0001263043 shg:SubsidiaryShinhanBankCambodiaMember 2021-01-01 2021-12-31 0001263043 shg:SecuritiesAtFVTPLMember 2021-01-01 2021-12-31 0001263043 ifrs-full:FinancialAssetsAtFairValueThroughOtherComprehensiveIncomeCategoryMember 2021-01-01 2021-12-31 0001263043 ifrs-full:ReserveOfGainsAndLossesOnFinancialAssetsMeasuredAtFairValueThroughOtherComprehensiveIncomeMember 2021-01-01 2021-12-31 0001263043 shg:PerformanceSharesMember 2021-01-01 2021-12-31 0001263043 shg:EmployeeStockOptionSeventhMember 2021-01-01 2021-12-31 0001263043 shg:ShinhanAssetTrustCo.Ltd.Member 2021-01-01 2021-12-31 0001263043 shg:SubsidiaryShinhanREITsManagementMember 2021-01-01 2021-12-31 0001263043 shg:SubsidiaryShinhanAssetManagementCo.Ltd.Member 2021-01-01 2021-12-31 0001263043 shg:SubsidiaryShinhanAlternativeInvestmentManagementMember 2021-01-01 2021-12-31 0001263043 shg:SubsidiaryShinhanVentureInvestmentMember 2021-01-01 2021-12-31 0001263043 shg:SubsidiaryJejuBankMember 2021-01-01 2021-12-31 0001263043 shg:SubsidiaryShinhanAitasMember 2021-01-01 2021-12-31 0001263043 shg:SubsidiaryShinhanLifeInsuranceMember 2021-01-01 2021-12-31 0001263043 shg:SubsidiarySHCManagementMember 2021-01-01 2021-12-31 0001263043 shg:SubsidiaryShinhanDataSystemMember 2021-01-01 2021-12-31 0001263043 shg:DummySMember 2021-01-01 2021-12-31 0001263043 shg:SubsidiaryShinhanCapitalMember 2021-01-01 2021-12-31 0001263043 shg:SubsidiaryShinhanSavingsBankMember 2021-01-01 2021-12-31 0001263043 shg:SubsidiaryShinhanAIMember 2021-01-01 2021-12-31 0001263043 shg:SubsidiaryOrangeLifeInsuranceMember 2021-01-01 2021-12-31 0001263043 shg:ShinhanSecuritiesCo.Ltd.Member 2021-01-01 2021-12-31 0001263043 shg:SubsidiaryShinhanCardMember 2021-01-01 2021-12-31 0001263043 ifrs-full:Level2OfFairValueHierarchyMember shg:DerivativeFinancialInstrumentsAssetsMember shg:DesignatedAsHedgingInstrumentMember 2021-01-01 2021-12-31 0001263043 ifrs-full:Level3OfFairValueHierarchyMember ifrs-full:FinancialAssetsAtFairValueThroughProfitOrLossCategoryMember ifrs-full:DebtSecuritiesMember 2021-01-01 2021-12-31 0001263043 ifrs-full:Level3OfFairValueHierarchyMember ifrs-full:FinancialAssetsAtFairValueThroughProfitOrLossCategoryMember shg:EquitySecuritiesMember 2021-01-01 2021-12-31 0001263043 shg:DerivativeFinancialInstrumentsAssetsMember ifrs-full:Level2OfFairValueHierarchyMember shg:NotDesignatedAsHedgingInstrumentTradingMember 2021-01-01 2021-12-31 0001263043 ifrs-full:Level2OfFairValueHierarchyMember ifrs-full:FinancialAssetsAtFairValueThroughProfitOrLossCategoryMember ifrs-full:DebtSecuritiesMember 2021-01-01 2021-12-31 0001263043 ifrs-full:Level2OfFairValueHierarchyMember ifrs-full:FinancialAssetsAtFairValueThroughOtherComprehensiveIncomeCategoryMember shg:EquitySecuritiesMember 2021-01-01 2021-12-31 0001263043 ifrs-full:Level2OfFairValueHierarchyMember ifrs-full:FinancialAssetsAtFairValueThroughOtherComprehensiveIncomeCategoryMember ifrs-full:DebtSecuritiesMember 2021-01-01 2021-12-31 0001263043 ifrs-full:Level3OfFairValueHierarchyMember shg:DerivativeFinancialInstrumentsAssetsMember shg:EquityAndForeignExchangeContractMember 2021-01-01 2021-12-31 0001263043 ifrs-full:Level2OfFairValueHierarchyMember ifrs-full:FinancialAssetsAtFairValueThroughProfitOrLossCategoryMember shg:EquitySecuritiesMember 2021-01-01 2021-12-31 0001263043 ifrs-full:Level3OfFairValueHierarchyMember shg:DerivativeFinancialInstrumentsAssetsMember shg:CreditAndCommodityContractMember 2021-01-01 2021-12-31 0001263043 ifrs-full:Level3OfFairValueHierarchyMember shg:DerivativeFinancialInstrumentsAssetsMember shg:InterestRateContractMember 2021-01-01 2021-12-31 0001263043 ifrs-full:Level3OfFairValueHierarchyMember shg:GainLossOnFinancialAssetsDesignatedAtFairValueThroughProfitOrLossMember 2021-01-01 2021-12-31 0001263043 ifrs-full:Level3OfFairValueHierarchyMember 2021-01-01 2021-12-31 0001263043 ifrs-full:Level3OfFairValueHierarchyMember shg:GainLossOnSecuritiesAtFairValueThroughOtherComprehensiveIncomeMember 2021-01-01 2021-12-31 0001263043 ifrs-full:Level3OfFairValueHierarchyMember shg:GainLossOnFinancialAssetsAtFairValueThroughProfitOrLossMember 2021-01-01 2021-12-31 0001263043 ifrs-full:Level3OfFairValueHierarchyMember shg:OtherOperatingIncomeExpenseMember 2021-01-01 2021-12-31 0001263043 ifrs-full:Level3OfFairValueHierarchyMember ifrs-full:FinancialLiabilitiesAtFairValueThroughProfitOrLossDesignatedUponInitialRecognitionCategoryMember 2021-01-01 2021-12-31 0001263043 shg:EquityAndForeignExchangeContractMember shg:DerivativeFinancialInstrumentsLiabilitiesMember ifrs-full:Level3OfFairValueHierarchyMember 2021-01-01 2021-12-31 0001263043 ifrs-full:Level3OfFairValueHierarchyMember shg:DerivativeFinancialInstrumentsLiabilitiesMember shg:CreditAndCommodityContractMember 2021-01-01 2021-12-31 0001263043 ifrs-full:Level3OfFairValueHierarchyMember shg:DerivativeFinancialInstrumentsLiabilitiesMember shg:InterestRateContractMember 2021-01-01 2021-12-31 0001263043 ifrs-full:Level2OfFairValueHierarchyMember ifrs-full:FinancialLiabilitiesAtFairValueThroughProfitOrLossDesignatedUponInitialRecognitionCategoryMember 2021-01-01 2021-12-31 0001263043 ifrs-full:Level2OfFairValueHierarchyMember shg:NotDesignatedAsHedgingInstrumentTradingMember shg:DerivativeFinancialInstrumentsLiabilitiesMember 2021-01-01 2021-12-31 0001263043 ifrs-full:Level2OfFairValueHierarchyMember shg:DerivativeFinancialInstrumentsLiabilitiesMember shg:DesignatedAsHedgingInstrumentMember 2021-01-01 2021-12-31 0001263043 ifrs-full:FinancialAssetsAtFairValueThroughOtherComprehensiveIncomeCategoryMember shg:OtherComprehensiveIncomeMember 2021-01-01 2021-12-31 0001263043 shg:DerivativeFinancialInstrumentsAssetsMember shg:RecognisedInProfitOrLossMember 2021-01-01 2021-12-31 0001263043 shg:FinancialAssetsClassMember 2021-01-01 2021-12-31 0001263043 ifrs-full:FinancialAssetsAtFairValueThroughProfitOrLossCategoryMember shg:RecognisedInProfitOrLossMember 2021-01-01 2021-12-31 0001263043 ifrs-full:ForeignCountriesMember 2021-01-01 2021-12-31 0001263043 ifrs-full:CountryOfDomicileMember 2021-01-01 2021-12-31 0001263043 shg:AssociatesGoduckGangil10PfvCo.LtdMember 2021-01-01 2021-12-31 0001263043 shg:AssociatesSongrimPartnersMember 2021-01-01 2021-12-31 0001263043 shg:AssociatesShinhanGlobalHealthcareFund1Member 2021-01-01 2021-12-31 0001263043 shg:ShinhanGlobalHealthcareFund2Member 2021-01-01 2021-12-31 0001263043 shg:AssociatesEdncentralCo.ltdMember 2021-01-01 2021-12-31 0001263043 shg:AssociatesMIELCOLTDMember 2021-01-01 2021-12-31 0001263043 ifrs-full:AssociatesMember 2021-01-01 2021-12-31 0001263043 shg:AssociatesGoduckGangil1PFVCoLtdMember 2021-01-01 2021-12-31 0001263043 shg:CreditMember shg:ExternalCustomersMember 2021-01-01 2021-12-31 0001263043 shg:CreditCardMember shg:InternalTransactionsMember 2021-01-01 2021-12-31 0001263043 ifrs-full:AllOtherSegmentsMember shg:InternalTransactionsMember 2021-01-01 2021-12-31 0001263043 shg:ConsolidationAdjustmentMember shg:InternalTransactionsMember 2021-01-01 2021-12-31 0001263043 shg:InternalTransactionsMember 2021-01-01 2021-12-31 0001263043 shg:CreditCardMember 2021-01-01 2021-12-31 0001263043 shg:LifeInsuranceMember 2021-01-01 2021-12-31 0001263043 shg:LifeInsuranceMember shg:InternalTransactionsMember 2021-01-01 2021-12-31 0001263043 ifrs-full:AllOtherSegmentsMember 2021-01-01 2021-12-31 0001263043 shg:BankingMember shg:InternalTransactionsMember 2021-01-01 2021-12-31 0001263043 shg:BankingMember shg:ExternalCustomersMember 2021-01-01 2021-12-31 0001263043 shg:ConsolidationAdjustmentMember 2021-01-01 2021-12-31 0001263043 shg:CreditCardMember shg:ExternalCustomersMember 2021-01-01 2021-12-31 0001263043 shg:LifeInsuranceMember shg:ExternalCustomersMember 2021-01-01 2021-12-31 0001263043 shg:SecuritiesMember shg:InternalTransactionsMember 2021-01-01 2021-12-31 0001263043 shg:CreditMember 2021-01-01 2021-12-31 0001263043 ifrs-full:AllOtherSegmentsMember shg:ExternalCustomersMember 2021-01-01 2021-12-31 0001263043 shg:BankingMember 2021-01-01 2021-12-31 0001263043 shg:ExternalCustomersMember shg:ConsolidationAdjustmentMember 2021-01-01 2021-12-31 0001263043 shg:ExternalCustomersMember 2021-01-01 2021-12-31 0001263043 shg:CreditMember shg:InternalTransactionsMember 2021-01-01 2021-12-31 0001263043 shg:SecuritiesMember shg:ExternalCustomersMember 2021-01-01 2021-12-31 0001263043 shg:SecuritiesMember 2021-01-01 2021-12-31 0001263043 ifrs-full:PresentValueOfDefinedBenefitObligationMember 2021-01-01 2021-12-31 0001263043 ifrs-full:PlanAssetsMember 2021-01-01 2021-12-31 0001263043 shg:BorrowingsFromBankOfKoreaMember 2021-01-01 2021-12-31 0001263043 shg:OthersBorrowingsInWonMember 2021-01-01 2021-12-31 0001263043 shg:OverdraftDueToBanksMember 2021-01-01 2021-12-31 0001263043 shg:BorrowingsFromBanksMember 2021-01-01 2021-12-31 0001263043 shg:OthersBorrowingsInForeignCurrencyMember 2021-01-01 2021-12-31 0001263043 shg:CallMoneyMember 2021-01-01 2021-12-31 0001263043 shg:BillsSoldMember 2021-01-01 2021-12-31 0001263043 shg:RepurchaseAgreementsMember 2021-01-01 2021-12-31 0001263043 shg:DomesticCurrencyMember shg:SubordinatedDebtMember 2021-01-01 2021-12-31 0001263043 shg:DomesticCurrencyMember shg:CorporateDebtSecuritiesMember 2021-01-01 2021-12-31 0001263043 shg:CorporateDebtSecuritiesMember shg:ForeignCurrencyMember 2021-01-01 2021-12-31 0001263043 shg:SubordinatedDebtMember shg:ForeignCurrencyMember 2021-01-01 2021-12-31 0001263043 shg:ForeignCurrencyRelatedMember shg:ExchangeTradedMember ifrs-full:FuturesContractMember 2021-01-01 2021-12-31 0001263043 shg:ForeignCurrencyRelatedMember shg:OverTheCounterMember ifrs-full:OptionContractMember 2021-01-01 2021-12-31 0001263043 shg:ForeignCurrencyRelatedMember shg:OverTheCounterMember ifrs-full:ForwardContractMember 2021-01-01 2021-12-31 0001263043 shg:ForeignCurrencyRelatedMember shg:OverTheCounterMember 2021-01-01 2021-12-31 0001263043 shg:HedgeFundsMember 2021-01-01 2021-12-31 0001263043 shg:EquityRelatedMember shg:OverTheCounterMember 2021-01-01 2021-12-31 0001263043 shg:CommodityRelatedMember shg:OverTheCounterMember shg:CommoditySwapsAndForwardsMember 2021-01-01 2021-12-31 0001263043 shg:EquityRelatedMember shg:OverTheCounterMember shg:EquitySwapsAndForwardsMember 2021-01-01 2021-12-31 0001263043 shg:CommodityRelatedMember shg:ExchangeTradedMember shg:CommodityFuturesMember 2021-01-01 2021-12-31 0001263043 shg:ExchangeTradedMember shg:EquityContractMember shg:NotDesignatedAsHedgingInstrumentTradingMember 2021-01-01 2021-12-31 0001263043 shg:CommodityRelatedMember shg:ExchangeTradedMember 2021-01-01 2021-12-31 0001263043 shg:ExchangeTradedMember 2021-01-01 2021-12-31 0001263043 shg:OverTheCounterMember shg:CommodityRelatedMember shg:CommodityFuturesAndOptionsMember 2021-01-01 2021-12-31 0001263043 shg:ForeignCurrencyRelatedMember shg:ExchangeTradedMember 2021-01-01 2021-12-31 0001263043 shg:ForeignCurrencyRelatedMember shg:OverTheCounterMember ifrs-full:SwapContractMember 2021-01-01 2021-12-31 0001263043 shg:InterestRatesRelatedMember shg:OverTheCounterMember shg:InterestRateOptionContractMember 2021-01-01 2021-12-31 0001263043 shg:InterestRatesRelatedMember shg:ExchangeTradedMember shg:InterestRateFutureContractMember 2021-01-01 2021-12-31 0001263043 shg:InterestRatesRelatedMember shg:ExchangeTradedMember 2021-01-01 2021-12-31 0001263043 shg:InterestRatesRelatedMember shg:OverTheCounterMember shg:InterestRateForwardsAndSwapsMember 2021-01-01 2021-12-31 0001263043 shg:InterestRatesRelatedMember shg:OverTheCounterMember 2021-01-01 2021-12-31 0001263043 shg:CreditRelatedMember shg:CreditSwapsMember shg:OverTheCounterMember 2021-01-01 2021-12-31 0001263043 shg:EquityRelatedMember shg:OverTheCounterMember shg:EquityOptionsMember 2021-01-01 2021-12-31 0001263043 shg:EquityOptionsMember shg:ExchangeTradedMember shg:EquityRelatedMember 2021-01-01 2021-12-31 0001263043 shg:CommodityRelatedMember shg:OverTheCounterMember 2021-01-01 2021-12-31 0001263043 shg:EquityRelatedMember shg:ExchangeTradedMember shg:EquityFuturesMember 2021-01-01 2021-12-31 0001263043 ifrs-full:GuaranteesMember ifrs-full:TwelvemonthExpectedCreditLossesMember 2021-01-01 2021-12-31 0001263043 ifrs-full:GuaranteesMember ifrs-full:LifetimeExpectedCreditLossesMember 2021-01-01 2021-12-31 0001263043 ifrs-full:GuaranteesMember ifrs-full:FinancialInstrumentsCreditimpairedMember 2021-01-01 2021-12-31 0001263043 ifrs-full:PropertyPlantAndEquipmentMember ifrs-full:LifetimeExpectedCreditLossesMember 2021-01-01 2021-12-31 0001263043 shg:SecuritiesMember ifrs-full:TwelvemonthExpectedCreditLossesMember 2021-01-01 2021-12-31 0001263043 shg:OtherFinancialAssetsMember 2021-01-01 2021-12-31 0001263043 shg:RealEstateMember 2021-01-01 2021-12-31 0001263043 shg:SecuritiesMember ifrs-full:LifetimeExpectedCreditLossesMember 2021-01-01 2021-12-31 0001263043 ifrs-full:PropertyPlantAndEquipmentMember ifrs-full:TwelvemonthExpectedCreditLossesMember 2021-01-01 2021-12-31 0001263043 ifrs-full:GuaranteesMember 2021-01-01 2021-12-31 0001263043 shg:RealEstateMember ifrs-full:LifetimeExpectedCreditLossesMember 2021-01-01 2021-12-31 0001263043 shg:SecuritiesMember ifrs-full:FinancialInstrumentsCreditimpairedMember 2021-01-01 2021-12-31 0001263043 shg:DepositsMember ifrs-full:TwelvemonthExpectedCreditLossesMember 2021-01-01 2021-12-31 0001263043 ifrs-full:LifetimeExpectedCreditLossesMember 2021-01-01 2021-12-31 0001263043 ifrs-full:PropertyPlantAndEquipmentMember 2021-01-01 2021-12-31 0001263043 ifrs-full:FinancialInstrumentsCreditimpairedMember 2021-01-01 2021-12-31 0001263043 shg:RealEstateMember ifrs-full:TwelvemonthExpectedCreditLossesMember 2021-01-01 2021-12-31 0001263043 shg:SecuritiesMember 2021-01-01 2021-12-31 0001263043 ifrs-full:TwelvemonthExpectedCreditLossesMember 2021-01-01 2021-12-31 0001263043 shg:DepositsMember 2021-01-01 2021-12-31 0001263043 shg:OtherFinancialAssetsMember ifrs-full:FinancialInstrumentsCreditimpairedMember 2021-01-01 2021-12-31 0001263043 ifrs-full:FinancialInstrumentsCreditimpairedMember shg:RealEstateMember 2021-01-01 2021-12-31 0001263043 shg:DepositsMember ifrs-full:LifetimeExpectedCreditLossesMember 2021-01-01 2021-12-31 0001263043 shg:OtherFinancialAssetsMember ifrs-full:TwelvemonthExpectedCreditLossesMember 2021-01-01 2021-12-31 0001263043 shg:DepositsMember ifrs-full:FinancialInstrumentsCreditimpairedMember 2021-01-01 2021-12-31 0001263043 ifrs-full:PropertyPlantAndEquipmentMember ifrs-full:FinancialInstrumentsCreditimpairedMember 2021-01-01 2021-12-31 0001263043 ifrs-full:CashFlowHedgesMember shg:ForeignExchangeRiskMember 2021-01-01 2021-12-31 0001263043 ifrs-full:HedgesOfNetInvestmentInForeignOperationsMember 2021-01-01 2021-12-31 0001263043 ifrs-full:CashFlowHedgesMember ifrs-full:InterestRateRiskMember 2021-01-01 2021-12-31 0001263043 ifrs-full:HedgesOfNetInvestmentInForeignOperationsMember shg:ForeignExchangeRiskMember 2021-01-01 2021-12-31 0001263043 ifrs-full:CashFlowHedgesMember shg:DiscontinuationOfCashFlowHedgesMember 2021-01-01 2021-12-31 0001263043 shg:DueFromBanksAtFVTPLMember 2021-01-01 2021-12-31 0001263043 shg:LoanReceivablesMeasuredAtFVTPLMember 2021-01-01 2021-12-31 0001263043 ifrs-full:InterestRateRiskMember 2021-01-01 2021-12-31 0001263043 ifrs-full:CurrencyRiskMember 2021-01-01 2021-12-31 0001263043 ifrs-full:IssuedCapitalMember 2021-01-01 2021-12-31 0001263043 shg:HybridBondsMember 2021-01-01 2021-12-31 0001263043 shg:CapitalSurplusMember 2021-01-01 2021-12-31 0001263043 shg:CapitalAdjustmentsMember 2021-01-01 2021-12-31 0001263043 ifrs-full:RetainedEarningsMember 2021-01-01 2021-12-31 0001263043 ifrs-full:EquityAttributableToOwnersOfParentMember 2021-01-01 2021-12-31 0001263043 ifrs-full:NoncontrollingInterestsMember 2021-01-01 2021-12-31 0001263043 ifrs-full:AccumulatedOtherComprehensiveIncomeMember 2021-01-01 2021-12-31 0001263043 ifrs-full:FinancialLiabilitiesAtFairValueThroughProfitOrLossDesignatedUponInitialRecognitionCategoryMember 2021-01-01 2021-12-31 0001263043 shg:LoansAtAmortizedCostMember 2021-01-01 2021-12-31 0001263043 ifrs-full:OtherAssetsMember 2021-01-01 2021-12-31 0001263043 ifrs-full:BuildingsMember 2021-01-01 2021-12-31 0001263043 ifrs-full:LandMember 2021-01-01 2021-12-31 0001263043 ifrs-full:RightofuseAssetsMember 2021-01-01 2021-12-31 0001263043 ifrs-full:OtherPropertyPlantAndEquipmentMember 2021-01-01 2021-12-31 0001263043 shg:NetGainLossOnDisposalOfFinancialAssetsAtFairValueThroughProfitOrLossMember 2021-01-01 2021-12-31 0001263043 shg:NetGainLossOnValuationOfFinancialAssetsAtFairValueThroughProfitOrLossMember 2021-01-01 2021-12-31 0001263043 ifrs-full:TwelvemonthExpectedCreditLossesMember ifrs-full:FinancialAssetsAtFairValueThroughOtherComprehensiveIncomeCategoryMember 2021-01-01 2021-12-31 0001263043 ifrs-full:LifetimeExpectedCreditLossesMember shg:DebtSecuritiesAtAmortisedCostMember 2021-01-01 2021-12-31 0001263043 shg:DebtSecuritiesAtAmortisedCostMember 2021-01-01 2021-12-31 0001263043 ifrs-full:LifetimeExpectedCreditLossesMember ifrs-full:FinancialAssetsAtFairValueThroughOtherComprehensiveIncomeCategoryMember 2021-01-01 2021-12-31 0001263043 ifrs-full:TwelvemonthExpectedCreditLossesMember shg:DebtSecuritiesAtAmortisedCostMember 2021-01-01 2021-12-31 0001263043 ifrs-full:ComputerSoftwareMember 2021-01-01 2021-12-31 0001263043 ifrs-full:OtherIntangibleAssetsMember 2021-01-01 2021-12-31 0001263043 ifrs-full:IntangibleAssetsUnderDevelopmentMember 2021-01-01 2021-12-31 0001263043 ifrs-full:GoodwillMember 2021-01-01 2021-12-31 0001263043 ifrs-full:ReserveOfCashFlowHedgesMember 2021-01-01 2021-12-31 0001263043 shg:ReserveOfShareOfAssociatesAndJointVenturesAccountedForUsingEquityMethodMember 2021-01-01 2021-12-31 0001263043 shg:ReserveOfSeparateAccountMember 2021-01-01 2021-12-31 0001263043 ifrs-full:ReserveOfChangeInFairValueOfFinancialLiabilityAttributableToChangeInCreditRiskOfLiabilityMember 2021-01-01 2021-12-31 0001263043 shg:NeverBeReclassifiedToProfitOrlossReserveOfShareOfAssociatesAndJointVenturesAccountedForUsingEquityMethodMember 2021-01-01 2021-12-31 0001263043 shg:NeverBeReclassifiedToProfitOrlossGainLossOnFinancialAssetAtFairValueThroughOtherComprehensiveIncomeMember 2021-01-01 2021-12-31 0001263043 ifrs-full:ReserveOfOverlayApproachMember 2021-01-01 2021-12-31 0001263043 shg:ShareOfOtherComprehensiveIncomeOfAssociatesAndJointVenturesAccountedForUsingEquityMethodThatWillBeReclassifiedToProfitOrLossNetOfTaxMember 2021-01-01 2021-12-31 0001263043 ifrs-full:ReserveOfRemeasurementsOfDefinedBenefitPlansMember 2021-01-01 2021-12-31 0001263043 shg:OtherComprehensiveIncomeNetOfSeparateAccountMember 2021-01-01 2021-12-31 0001263043 ifrs-full:ReserveOfExchangeDifferencesOnTranslationMember 2021-01-01 2021-12-31 0001263043 shg:ShinhanEzGeneralInsuranceLtdMember 2021-01-01 2021-12-31 0001263043 shg:AssociatesStonebridgeShinhanUnicornSecondaryFundMember 2021-01-01 2021-12-31 0001263043 shg:AssociatesShinhanKunicornFirstFundMember 2021-01-01 2021-12-31 0001263043 shg:AssociatesGXSHINHANINTEREST1stPrivateEquityFundMember 2021-01-01 2021-12-31 0001263043 shg:AssociatesShinhanNvestorLiquiditySolutionFundMember 2021-01-01 2021-12-31 0001263043 shg:AssociatesShinhanPSInvestmentFundNo1Member 2021-01-01 2021-12-31 0001263043 shg:AssociatesSHCULMUSFundNo1Member 2021-01-01 2021-12-31 0001263043 shg:AssociatesSHBNPPMAINProfessionalInvestmentTypePrivateMixedAssetInvestmentTrustNo3Member 2021-01-01 2021-12-31 0001263043 shg:AssociatesKoreaCreditBureauMember 2021-01-01 2021-12-31 0001263043 shg:AssociatesShinhanRhinos1FundMember 2021-01-01 2021-12-31 0001263043 shg:AssociatesShinHanSooYoungEntrepreneurInvestmentFundNo1Member 2021-01-01 2021-12-31 0001263043 shg:IGISPRIVATEREALESTATETRUSTNO331Member 2021-01-01 2021-12-31 0001263043 shg:AssociatesKiwoomShinhanInnovationFundIMember 2021-01-01 2021-12-31 0001263043 shg:AssociatesSHINHANCORETRENDGLOBALFUND1Member 2021-01-01 2021-12-31 0001263043 shg:AssociatesFuturePlayShinhanTechInnovationFund1Member 2021-01-01 2021-12-31 0001263043 shg:OpenShinhanPortfolioInvestmentAssociationNo.1Member 2021-01-01 2021-12-31 0001263043 shg:AssociatesKoreaFinanceSecurityMember 2021-01-01 2021-12-31 0001263043 shg:AssociatesSBCPFVCoLtdMember 2021-01-01 2021-12-31 0001263043 shg:AssociatesOneShinhanGlobalFund1Member 2021-01-01 2021-12-31 0001263043 shg:KoreaOmegaProjectFundIMember 2021-01-01 2021-12-31 0001263043 shg:KoFCNeopluxRDBizCreation20131InvestmentMember 2021-01-01 2021-12-31 0001263043 shg:FutureCreationNeopluxVentureCapitalFundMember 2021-01-01 2021-12-31 0001263043 shg:NeopluxMarketFrontierSecondaryFundMember 2021-01-01 2021-12-31 0001263043 shg:GyeonggiNeopluxSupermanFundMember 2021-01-01 2021-12-31 0001263043 shg:NewWave6thFundMember 2021-01-01 2021-12-31 0001263043 shg:NewGreenShinhanMezzanineFundMember 2021-01-01 2021-12-31 0001263043 shg:Sparklabs-ShinhanOpportunityFund1Member 2021-01-01 2021-12-31 0001263043 shg:NeopluxNo3PrivateEquityFundMember 2021-01-01 2021-12-31 0001263043 shg:KTCNPGrowthChamp20112PrivateEquityFundMember 2021-01-01 2021-12-31 0001263043 shg:SHINHANNEOCoreIndustrialTechnologyFundMember 2021-01-01 2021-12-31 0001263043 shg:PacificSunnyProfessionalInvestorsPrivatePlacementRealEstateInvestmentCompanyNo45Member 2021-01-01 2021-12-31 0001263043 shg:AssociatesKiwoomShinhanInnovationFund2Member 2021-01-01 2021-12-31 0001263043 shg:ReverentShinhanVistaFundMember 2021-01-01 2021-12-31 0001263043 shg:UlmusShcInnovationInvestmentFundMember 2021-01-01 2021-12-31 0001263043 shg:SwkshinhanNewTechnologyInvestmentFund1stMember 2021-01-01 2021-12-31 0001263043 shg:JsShinhanPrivateEquityFundMember 2021-01-01 2021-12-31 0001263043 shg:ShinhanVcTomorrowVentureFund1Member 2021-01-01 2021-12-31 0001263043 shg:ShinhanTimeMezzanineBlindFundMember 2021-01-01 2021-12-31 0001263043 shg:EtriHoldingsShinhan1stUnicornFundMember 2021-01-01 2021-12-31 0001263043 shg:ShinhanNeoMarketfrontier2ndFundMember 2021-01-01 2021-12-31 0001263043 shg:Kakao-Shinhan1stTNYTFundMember 2021-01-01 2021-12-31 0001263043 shg:ShinhanWesternTDConsignmentManagementRealEstateInvestmentCoLtdMember 2021-01-01 2021-12-31 0001263043 shg:ShinhanNeopluxEnergyNewbizFundMember 2021-01-01 2021-12-31 0001263043 shg:EDNCENTRALCoLtdMember 2021-01-01 2021-12-31 0001263043 shg:ShinhanSmilegateGlobalPefIMember 2021-01-01 2021-12-31 0001263043 shg:AssociatesBNPParibasCardifLifeInsuranceMember 2021-01-01 2021-12-31 0001263043 shg:AssociatesShinhanPraxisKGrowthGlobalPrivateEquityFundMember 2021-01-01 2021-12-31 0001263043 shg:AssociatesSMNewTechnologyBusinessInvestmentFund1Member 2021-01-01 2021-12-31 0001263043 shg:AssociatesShinhanAlbatrossGrowthFundMember 2021-01-01 2021-12-31 0001263043 shg:AssociatesSHCK2GlobalMaterialFundMember 2021-01-01 2021-12-31 0001263043 shg:AssociatesSynergyShinhanMezzanineNewTechnologyInvestmentFundMember 2021-01-01 2021-12-31 0001263043 shg:ShinhanmidasDongaSecondaryFundMember 2021-01-01 2021-12-31 0001263043 shg:ShinhanisquareVentureFund1stMember 2021-01-01 2021-12-31 0001263043 shg:ShinhanquantumStartupFundMember 2021-01-01 2021-12-31 0001263043 shg:AssociatesShinhanSimoneFundIMember 2021-01-01 2021-12-31 0001263043 shg:AssociatesShinhanFitrin1stTechnologyBusinessInvestmentAssociationMember 2021-01-01 2021-12-31 0001263043 shg:AssociatesLogisvalleyShinhanReitCo.ltd.Member 2021-01-01 2021-12-31 0001263043 shg:ShinhandevHealthcareFundIMember 2021-01-01 2021-12-31 0001263043 shg:AssociatesShinhanCognitiveStartupFundL.p.Member 2021-01-01 2021-12-31 0001263043 shg:GlobalCommerceFundMember 2021-01-01 2021-12-31 0001263043 shg:ShinhanhgiSocialEnterpriseFundMember 2021-01-01 2021-12-31 0001263043 shg:ShinhanwwgEnergyFundNewTechnologyVentureInvestmentFundMember 2021-01-01 2021-12-31 0001263043 shg:IgisshinhanNewTechnologyFund1Member 2021-01-01 2021-12-31 0001263043 shg:Shinhang.n.techSmartInnovationFundMember 2021-01-01 2021-12-31 0001263043 shg:AssociatesShSustainableManagementEsgShortTermBondSecurityFeederInvestmentTrustNo.1Member 2021-01-01 2021-12-31 0001263043 shg:ShGlobalNetZeroSolutionSecurityInvestmentTrustMember 2021-01-01 2021-12-31 0001263043 shg:DsShinhanContentInvestmentFund1Member 2021-01-01 2021-12-31 0001263043 shg:ShinhanTime1stInvestmentFundMember 2021-01-01 2021-12-31 0001263043 shg:ShinhanSgcEsgFundNo.1Member 2021-01-01 2021-12-31 0001263043 shg:ShinhansneakPeekBiohealthcareBounceBackFundMember 2021-01-01 2021-12-31 0001263043 shg:GoduckGangil10PFVCoLtdMember 2021-01-01 2021-12-31 0001263043 ifrs-full:Level3OfFairValueHierarchyMember ifrs-full:FinancialAssetsAtFairValueThroughOtherComprehensiveIncomeCategoryMember shg:EquitySecuritiesMember 2021-01-01 2021-12-31 0001263043 ifrs-full:FinancialAssetsAtFairValueThroughOtherComprehensiveIncomeCategoryMember 2021-01-01 2021-12-31 0001263043 shg:DerivativeAssetsAndLiabilitiesHeldForHedgingMember 2021-01-01 2021-12-31 0001263043 ifrs-full:FinancialAssetsAtFairValueThroughProfitOrLossCategoryMember 2021-01-01 2021-12-31 0001263043 shg:DerivativeAssetsAndLiabilitiesHeldForTradingMember 2021-01-01 2021-12-31 0001263043 ifrs-full:Level2OfFairValueHierarchyMember ifrs-full:DebtSecuritiesMember 2021-01-01 2021-12-31 0001263043 ifrs-full:Level2OfFairValueHierarchyMember shg:LoansAtAmortizedCostMember 2021-01-01 2021-12-31 0001263043 ifrs-full:Level3OfFairValueHierarchyMember ifrs-full:DebtSecuritiesMember 2021-01-01 2021-12-31 0001263043 ifrs-full:Level2OfFairValueHierarchyMember shg:OtherFinancialLiabilitiesMember 2021-01-01 2021-12-31 0001263043 ifrs-full:Level2OfFairValueHierarchyMember shg:DepositsMember 2021-01-01 2021-12-31 0001263043 ifrs-full:Level2OfFairValueHierarchyMember ifrs-full:FinancialAssetsAtAmortisedCostMember 2021-01-01 2021-12-31 0001263043 ifrs-full:Level3OfFairValueHierarchyMember shg:OtherFinancialLiabilitiesMember 2021-01-01 2021-12-31 0001263043 ifrs-full:Level3OfFairValueHierarchyMember shg:DepositsMember 2021-01-01 2021-12-31 0001263043 ifrs-full:Level3OfFairValueHierarchyMember shg:OtherFinancialAssetsMember 2021-01-01 2021-12-31 0001263043 ifrs-full:Level3OfFairValueHierarchyMember shg:BorrowingsMember 2021-01-01 2021-12-31 0001263043 ifrs-full:Level2OfFairValueHierarchyMember shg:BorrowingsMember 2021-01-01 2021-12-31 0001263043 ifrs-full:Level3OfFairValueHierarchyMember shg:LoansAtAmortizedCostMember 2021-01-01 2021-12-31 0001263043 ifrs-full:Level2OfFairValueHierarchyMember shg:DueFromBanksAtAmortizedCostMember 2021-01-01 2021-12-31 0001263043 ifrs-full:Level3OfFairValueHierarchyMember ifrs-full:FinancialAssetsAtAmortisedCostMember 2021-01-01 2021-12-31 0001263043 ifrs-full:Level2OfFairValueHierarchyMember shg:OtherFinancialAssetsMember 2021-01-01 2021-12-31 0001263043 shg:AssociatesDaishinNewgenNewTechnologyInvestmentFund1stMember 2021-01-01 2021-12-31 0001263043 shg:AssociatesMetaEsgPrivateEquityFundIMember 2021-01-01 2021-12-31 0001263043 shg:AssociatesJsShinhanPrivateEquityFundMember 2021-01-01 2021-12-31 0001263043 shg:AssociatesKiwoomUnicorn3NewTechnologyBusinessInvestmentFundMember 2021-01-01 2021-12-31 0001263043 shg:AssociatesIGISPRIVATEREALESTATETRUSTNO331Member 2021-01-01 2021-12-31 0001263043 shg:AssociatesHermesPrivateInvestmentEquityFundMember 2021-01-01 2021-12-31 0001263043 shg:AssociatesAIPTransportationSpecializedPrivatelyPlacedFundTrust1Member 2021-01-01 2021-12-31 0001263043 shg:AssociatesBNPParibasCardifGeneralInsuranceMember 2021-01-01 2021-12-31 0001263043 shg:AssociatesKoramcoEuropeCorePrivatePlacementRealEstateFundNo2and2Member 2021-01-01 2021-12-31 0001263043 shg:AssociatesJBPowerTLInvestmentTypePrivatePlacementSpecialAssetFund7Member 2021-01-01 2021-12-31 0001263043 shg:AssociatesKBNAHickoryPrivateSpecialAssetFundMember 2021-01-01 2021-12-31 0001263043 shg:AssociatesFindvaluePreIPO6thProfessionalInvestmentTypePrivateInvestmentTrustMember 2021-01-01 2021-12-31 0001263043 shg:AssociatesWWGGlobalRealEstateInvestmentTrustno4Member 2021-01-01 2021-12-31 0001263043 shg:AssociatesIGISRealestatePrivateInvestmentTrustNo33Member 2021-01-01 2021-12-31 0001263043 shg:AssociatesBNWTechInnovationPrivateEquityFundMember 2021-01-01 2021-12-31 0001263043 shg:AssociatesFidelisGlobalPrivateRealEstateTrustNo2Member 2021-01-01 2021-12-31 0001263043 shg:AssociatesFuturePlayShinhanTechInnovationFund1Member 2021-01-01 2021-12-31 0001263043 shg:AssociatesAves1stCorporateRecoveryPrivateEquityFundMember 2021-01-01 2021-12-31 0001263043 shg:AssociatesMapleMobilityFundMember 2021-01-01 2021-12-31 0001263043 shg:AssociatesKnt2ndPrivateEquityFundMember 2021-01-01 2021-12-31 0001263043 shg:AssociatesEumPrivateEquityFundNo7Member 2021-01-01 2021-12-31 0001263043 shg:AssociatesKIAMCOPOWERLOANTRUST4THMember 2021-01-01 2021-12-31 0001263043 shg:AssociatesAIPEUROGREENPrivateRealEstateInvestmentTrustNo3Member 2021-01-01 2021-12-31 0001263043 shg:AssociatesKiwoomMilestoneProfessionalPrivateRealEstateTrust19Member 2021-01-01 2021-12-31 0001263043 shg:AssociatesShinHanSooYoungEntrepreneurInvestmentFundNo1Member 2021-01-01 2021-12-31 0001263043 shg:AssociatesShinhanPraxisKGrowthGlobalPrivateEquityFundMember 2021-01-01 2021-12-31 0001263043 shg:AssociatesCredianHealthcarePrivateEquityFund2Member 2021-01-01 2021-12-31 0001263043 shg:AssociatesHanyangMeritz1FundMember 2021-01-01 2021-12-31 0001263043 shg:AssociatesIbkcGlobalContentsInvestmentFundMember 2021-01-01 2021-12-31 0001263043 shg:AssociatesMplusProfessionalPrivateRealEstateFund25Member 2021-01-01 2021-12-31 0001263043 shg:AssociatesShinhanSmilegateGlobalPefIMember 2021-01-01 2021-12-31 0001263043 shg:AssociatesFountProfessionalInvestorsPrivateInvestmentTrustNo.3Member 2021-01-01 2021-12-31 0001263043 shg:AssociatesGenesisEcoNo.1PefMember 2021-01-01 2021-12-31 0001263043 shg:AssociatesShinhanneoMarketfrontier2ndFundMember 2021-01-01 2021-12-31 0001263043 shg:AssociatesNhsynergyCoreIndustrialNewTechnologyFundMember 2021-01-01 2021-12-31 0001263043 shg:AssociatesMedicii20213FundMember 2021-01-01 2021-12-31 0001263043 shg:AssociatesJbIncheonBucheonReitsNo.54Member 2021-01-01 2021-12-31 0001263043 shg:AssociatesTresyujinTrustMember 2021-01-01 2021-12-31 0001263043 shg:AssociatesSwfvFund1Member 2021-01-01 2021-12-31 0001263043 shg:AssociatesPharosDkFundMember 2021-01-01 2021-12-31 0001263043 shg:AssociatesShinhanVcTomorrowVentureFund1Member 2021-01-01 2021-12-31 0001263043 shg:AssociatesHighland20218FundMember 2021-01-01 2021-12-31 0001263043 shg:AssociatesCuriousFinaleCorporateRecoveryPrivateEquityFundMember 2021-01-01 2021-12-31 0001263043 shg:AssociatesTCoreIndustrialTechnology1stVenturePefMember 2021-01-01 2021-12-31 0001263043 shg:AssociatesMiraeAssetPartnersXPrivateEquityFundMember 2021-01-01 2021-12-31 0001263043 shg:AssociatesUlmusShcInnovationInvestmentFundMember 2021-01-01 2021-12-31 0001263043 shg:AssociatesJMoorimJadeInvestmentFundMember 2021-01-01 2021-12-31 0001263043 shg:AssociatesNauticSmartNo.6PrivateEquityFundMember 2021-01-01 2021-12-31 0001263043 shg:AssociatesPremierLuminousPrivateEquityFundMember 2021-01-01 2021-12-31 0001263043 shg:AssociatesShinhantimeMezzanineBlindFundMember 2021-01-01 2021-12-31 0001263043 ifrs-full:ReserveOfCashFlowHedgesMember ifrs-full:ForwardContractMember 2021-01-01 2021-12-31 0001263043 ifrs-full:ReserveOfCashFlowHedgesMember ifrs-full:CurrencySwapContractMember 2021-01-01 2021-12-31 0001263043 ifrs-full:InterestRateSwapContractMember ifrs-full:FairValueHedgesMember 2021-01-01 2021-12-31 0001263043 ifrs-full:ReserveOfCashFlowHedgesMember ifrs-full:InterestRateSwapContractMember 2021-01-01 2021-12-31 0001263043 ifrs-full:ForwardContractMember shg:HedgeOfNetInvestmentMember 2021-01-01 2021-12-31 0001263043 ifrs-full:FairValueHedgesMember ifrs-full:ForwardContractMember 2021-01-01 2021-12-31 0001263043 shg:AssociatesCapstoneReitsNo.26Member 2021-01-01 2021-12-31 0001263043 shg:AssociatesRhinosPremierMezzaninePrivateInvestmentFundNo.1Member 2021-01-01 2021-12-31 0001263043 shg:AssociatesDaehanNo.36OfficeAssetManagementCompanyMember 2021-01-01 2021-12-31 0001263043 shg:AssociatesKbOaktreeTrustNo.3Member 2021-01-01 2021-12-31 0001263043 shg:AssociatesJbHwaseongHadongReitsNo.53Member 2021-01-01 2021-12-31 0001263043 shg:AssociatesHankookSmartRealAssetInvestmentTrustNo.3Member 2021-01-01 2021-12-31 0001263043 shg:AssociatesIBKCMETISGlobalContentsInvestmentFundMember 2021-01-01 2021-12-31 0001263043 shg:AssociatesSksYozmaFundNo.1Member 2021-01-01 2021-12-31 0001263043 shg:AssociatesShRealEstateLoanInvestmentTypePrivateRealEstateInvestmentTrustNo.2Member 2021-01-01 2021-12-31 0001263043 shg:AssociatesShinhanJigaeNamsanRoadPrivateSpecialAssetInvestmentTrustMember 2021-01-01 2021-12-31 0001263043 shg:AssociatesKeistoneUnicornPrivateEquityFundMember 2021-01-01 2021-12-31 0001263043 shg:AssociatesOthers2020Member 2021-01-01 2021-12-31 0001263043 shg:AssociatesMasternPrivateRealEstateLoanFundNo2Member 2021-01-01 2021-12-31 0001263043 shg:AssociatesKakaoShinhan1stTNYTFundMember 2021-01-01 2021-12-31 0001263043 shg:AssociatesKoFCNeopluxRDBizCreation20131VentureCapitalFundMember 2021-01-01 2021-12-31 0001263043 shg:AssociatesPCCAmberstonePrivateEquityFundIMember 2021-01-01 2021-12-31 0001263043 shg:AssociatesTiFirstPropertyPrivateInvestmentTrust1Member 2021-01-01 2021-12-31 0001263043 shg:AssociatesKiwoomPrivateEquityAntManStartupVentureSpecializedPrivateEquityFundMember 2021-01-01 2021-12-31 0001263043 shg:AssociatesShSangjuYcExpresswayProfessionalInvestmentTypePrivateSpecialAssetInvestmentTrustMember 2021-01-01 2021-12-31 0001263043 shg:AssociatesShDaeguGreenPowerCogenerationSystemProfessionalInvestmentTypePrivateSpecialAssetInvestmentTrustMember 2021-01-01 2021-12-31 0001263043 shg:AssociatesShCorporateProfessionalInvestmentTypePrivateSecurityInvestmentTrustNo.45Member 2021-01-01 2021-12-31 0001263043 shg:SamsungSraRealEstateProfessionalPrivate45Member 2021-01-01 2021-12-31 0001263043 shg:AssociatesNewlakeGrowthCapitalPartners2PefMember 2021-01-01 2021-12-31 0001263043 shg:AssociatesTimefolioTheVenturevSecondMember 2021-01-01 2021-12-31 0001263043 shg:AssociatesClBuyout1stPefMember 2021-01-01 2021-12-31 0001263043 shg:AssociatesSwsFundMember 2021-01-01 2021-12-31 0001263043 shg:AssociatesVogoCanisterProfessionalTrustPrivateFundIMember 2021-01-01 2021-12-31 0001263043 shg:AssociatesMultiAssetTheUnitedStatesThortonsProfessionalPrivate1Member 2021-01-01 2021-12-31 0001263043 shg:AssociatesShinhanHealthcareFund2Member 2021-01-01 2021-12-31 0001263043 shg:AssociatesAoneMezzanineOpportunityProfessionalPrivateMember 2021-01-01 2021-12-31 0001263043 shg:AssociatesIBKGlobalNewRenewableEnergySpecialAssetProfessionalPrivate2Member 2021-01-01 2021-12-31 0001263043 shg:AssociatesVSCornerstoneFundMember 2021-01-01 2021-12-31 0001263043 shg:AssociatesPacificPrivatePlacementRealEstateFundNo40Member 2021-01-01 2021-12-31 0001263043 shg:AssociatesIMMSpecialSituation12PRIVATEEQUITYFUNDMember 2021-01-01 2021-12-31 0001263043 shg:AssociatesSHJigaeNamsanBTOprofessionalInvestmentTypePrivateSpecialAssetInvestmentTrustMember 2021-01-01 2021-12-31 0001263043 shg:AssociatesJRAMCHungaryBudapestOfficeFund16Member 2021-01-01 2021-12-31 0001263043 shg:AssociatesNewWave6thFundMember 2021-01-01 2021-12-31 0001263043 shg:AssociatesGyeonggiNeopluxSupermanFundMember 2021-01-01 2021-12-31 0001263043 shg:AssociatesNHAmundiUSInfrastructurePrivateFund2Member 2021-01-01 2021-12-31 0001263043 shg:AssociatesKiwoomMilestoneUSRealEstateProfessionalPrivate20Member 2021-01-01 2021-12-31 0001263043 shg:AssociatesFutureCreationNeopluxVentureCapitalFundMember 2021-01-01 2021-12-31 0001263043 shg:AssociatesSHBNPPGreenNewDealEnergyProfessionalInvestmentTypePrivateSpecialAssetInvestmentTrustNo2Member 2021-01-01 2021-12-31 0001263043 shg:AssociatesIGISGLIPProfessionalInvestmentPrivateRealEstateInvestmentTrustNo11Member 2021-01-01 2021-12-31 0001263043 shg:AssociatesDaishinKTNewTechnologyInvestmentFundMember 2021-01-01 2021-12-31 0001263043 shg:AssociatesSamchullyMidstreamPrivatePlacementSpecialAssetFund54Member 2021-01-01 2021-12-31 0001263043 shg:AssociatesMidasAssetGlobalCREDebtPrivateFundNo6Member 2021-01-01 2021-12-31 0001263043 shg:AssociatesRichmondPrivateInvestmentTrustNo82Member 2021-01-01 2021-12-31 0001263043 shg:AssociatesJarvisMemorialPrivateInvestmentTrust1Member 2021-01-01 2021-12-31 0001263043 shg:AssociatesMasternPrivateInvestmentTrust68Member 2021-01-01 2021-12-31 0001263043 shg:AssociatesPebblestoneCGVPrivateRealEstateTrustNo1Member 2021-01-01 2021-12-31 0001263043 shg:AssociatesStBonanjaFoodTechMember 2021-01-01 2021-12-31 0001263043 shg:AssociatesShJapanPhotovoltaicPrivateSpecialAssetInvestmentTrustNo.1Member 2021-01-01 2021-12-31 0001263043 shg:AssociatesShGlobalInfrastructureProfessionalInvestmentTypePrivateSpecialAssetInvestmentTrustNo.72Member 2021-01-01 2021-12-31 0001263043 shg:AssociatesShinhanAIMRealEstateFundNo2Member 2021-01-01 2021-12-31 0001263043 shg:AssociatesShinhanAIMRealEstateFundNo1Member 2021-01-01 2021-12-31 0001263043 shg:AssociatesKIAMCOVietnamSolarSpecialAssetPrivateInvestmentTrustMember 2021-01-01 2021-12-31 0001263043 shg:AssociatesPSAEMPPrivateEquityFundMember 2021-01-01 2021-12-31 0001263043 shg:AssociatesKORAMKODaumProfessionalPrivateInvestmentTrustNo12Member 2021-01-01 2021-12-31 0001263043 shg:AssociatesAIPEUROPRIVATEREALESTATETRUSTNo12Member 2021-01-01 2021-12-31 0001263043 shg:ShBnctProfessionalInvestmentTypePrivateSpecialAssetInvestmentTrustMember 2021-01-01 2021-12-31 0001263043 shg:ShCorporateProfessionalInvestmentTypePrivateSecurityInvestmentTrustNo.7Member 2021-01-01 2021-12-31 0001263043 shg:ShSeniorLoanProfessionalInvestmentTypePrivateMixedAssetInvestmentTrustNo.2Member 2021-01-01 2021-12-31 0001263043 shg:ShMainProfessionalInvestmentTypePrivateMixedAssetInvestmentTrustNo.3Member 2021-01-01 2021-12-31 0001263043 shg:AssociatesShSeniorLoanProfessionalInvestmentTypePrivateMixedAssetInvestmentTrustNo.3Member 2021-01-01 2021-12-31 0001263043 shg:AssociatesMasternOpportunitySeekingRealEstateFundIIMember 2021-01-01 2021-12-31 0001263043 shg:AssociatesAIONELFISPROFESSIONALPRIVATE1Member 2021-01-01 2021-12-31 0001263043 shg:AssociatesPacificSunnyProfessionalInvestorsPrivatePlacementRealEstateInvestmentCompanyNo45Member 2021-01-01 2021-12-31 0001263043 shg:AssociatesIGISGLIPProfessionalInvestmentPrivateRealEstateInvestmentTrustNo12Member 2021-01-01 2021-12-31 0001263043 shg:AssociatesAcurusHyundaiInvestmentPartnersNewTechnologyMember 2021-01-01 2021-12-31 0001263043 shg:AssociatesSynergyGreenNewDeal1stNewTechnologyBusinessInvestmentFundMember 2021-01-01 2021-12-31 0001263043 shg:AssociatesKAIMRealestatePrivateInvestmentTrust20Member 2021-01-01 2021-12-31 0001263043 shg:AssociatesDaishinNewTechnologyInvestmentFund5thMember 2021-01-01 2021-12-31 0001263043 shg:AssociatesNeopluxMarketFrontierSecondaryFundMember 2021-01-01 2021-12-31 0001263043 shg:AssociatesLBScotlandAmazonFulfillmentCenterFund29Member 2021-01-01 2021-12-31 0001263043 shg:AssociatesTF2020SSPrivateEquityFundSpecializinginStartupandVentureBusinessMember 2021-01-01 2021-12-31 0001263043 shg:AssociatesNeopluxNo3PrivateEquityFundMember 2021-01-01 2021-12-31 0001263043 shg:AssociatesKoreaCreditBureauMember 2021-01-01 2021-12-31 0001263043 shg:AssociatesHANAAlternativeEstateProfessionalPrivate122Member 2021-01-01 2021-12-31 0001263043 shg:AssociatesIGIS372RealEstateProfessionalPrivateMember 2021-01-01 2021-12-31 0001263043 shg:AssociatesKBDistributionPrivateRealEstate1Member 2021-01-01 2021-12-31 0001263043 shg:AssociatesHyungjeArtPrintingMember 2021-01-01 2021-12-31 0001263043 shg:AssociatesDBEpicConvertiblebondPrivateTrustNo2Member 2021-01-01 2021-12-31 0001263043 shg:AssociatesUIVentureFund7thMember 2021-01-01 2021-12-31 0001263043 shg:AssociatesSBCPFVCoLtdMember 2021-01-01 2021-12-31 0001263043 shg:AssociatesHanwhaIncusPlusNewTechnologyFundNo1Member 2021-01-01 2021-12-31 0001263043 shg:AssociatesVogoRealtyPartnersPrivateRealEstateFundVMember 2021-01-01 2021-12-31 0001263043 shg:AssociatesStonebridgeCorporate1stFundMember 2021-01-01 2021-12-31 0001263043 shg:AssociatesDeutscheGlobalProfessionalInvestmentTypePrivateRealEstateInvestmentTrustNo24Member 2021-01-01 2021-12-31 0001263043 shg:AssociatesNHamundiGlobalInfraPrivateFund16Member 2021-01-01 2021-12-31 0001263043 shg:AssociatesCapeITFundNo3Member 2021-01-01 2021-12-31 0001263043 shg:AssociatesKtcnpGrowthChamp20112PrivateEquityFundMember 2021-01-01 2021-12-31 0001263043 shg:AssociatesShJapanPhotovoltaicPrivateSpecialAssetInvestmentTrustNo.2Member 2021-01-01 2021-12-31 0001263043 shg:AssociatesMultimediaTechCoLtdMember 2021-01-01 2021-12-31 0001263043 shg:AssociatesKoreaFinanceSecurityMember 2021-01-01 2021-12-31 0001263043 shg:AssociatesShinhanneoCoreIndustrialTechnologyFundMember 2021-01-01 2021-12-31 0001263043 shg:AssociatesKiwoomShinhanInnovationFundIMember 2021-01-01 2021-12-31 0001263043 shg:AssociatesOneShinhanGlobalFund1Member 2021-01-01 2021-12-31 0001263043 shg:AssociatesSimoneMezzanineFundNo3Member 2021-01-01 2021-12-31 0001263043 shg:AssociatesVestasQualifiedInvestorsPrivateRealEstateFundInvestmentTrustNo37Member 2021-01-01 2021-12-31 0001263043 shg:AssociatesNomuraRifaPrivateRealEstateInvestmentTrust31Member 2021-01-01 2021-12-31 0001263043 shg:AssociatesNewGreenShinhanMezzanineFundMember 2021-01-01 2021-12-31 0001263043 shg:AssociatesKoreaOmegaShinhanProjectFundIMember 2021-01-01 2021-12-31 0001263043 shg:AssociatesIMMGlobalPrivateEquityFundMember 2021-01-01 2021-12-31 0001263043 shg:AssociatesIGISProfessionalInvestorsPrivateInvestmentRealEstateInvestmentLLCNo395Member 2021-01-01 2021-12-31 0001263043 shg:AssociatesCSQUARESNIPERPROFESSIONALPRIVATE10Member 2021-01-01 2021-12-31 0001263043 shg:AssociatesKiwoomHeroNo4PrivateEquityFundMember 2021-01-01 2021-12-31 0001263043 shg:AssociatesHarvestPrivateEquityFundIiMember 2021-01-01 2021-12-31 0001263043 shg:AssociatesShinhanNvestorLiquiditySolutionFundMember 2021-01-01 2021-12-31 0001263043 shg:AssociatesShinhanAIMFoFFund1aMember 2021-01-01 2021-12-31 0001263043 shg:AssociatesEHealthcareInvestmentFundNo6Member 2021-01-01 2021-12-31 0001263043 shg:AssociatesShinhanNeopluxEnergyNewbizFundMember 2021-01-01 2021-12-31 0001263043 shg:AssociatesDAEKWANGSEMICONDUCTORMember 2021-01-01 2021-12-31 0001263043 shg:MilestonePrivateRealEstateFund3Member 2021-01-01 2021-12-31 0001263043 shg:AssociatesNHAmundiGlobalInfrastructureTrust14Member 2021-01-01 2021-12-31 0001263043 shg:AssociatesTigerAlternativeRealEstateProfessionalPrivate5Member 2021-01-01 2021-12-31 0001263043 shg:AssociatesBNPParibasCardifLifeInsuranceMember 2021-01-01 2021-12-31 0001263043 shg:AssociatesShinhanAlbatrossTechInvestmentFundMember 2021-01-01 2021-12-31 0001263043 shg:AssociatesShinhanMidasDongaSecondaryFundMember 2021-01-01 2021-12-31 0001263043 shg:AssociatesBRAINDOPROFESSIONALEPRIVATENo27Member 2021-01-01 2021-12-31 0001263043 shg:AssociatesIGISGlobalCreditFund1501Member 2021-01-01 2021-12-31 0001263043 shg:AssociatesSparklabsShinhanOpportunityFund1Member 2021-01-01 2021-12-31 0001263043 shg:AssociatesKTBNewlakeGlobalHealthcarePEFMember 2021-01-01 2021-12-31 0001263043 shg:VogoDebtStrategyQualifiedInvPrivateMember 2021-01-01 2021-12-31 0001263043 shg:AssociatesPartners4thGrowthInvestmentFundMember 2021-01-01 2021-12-31 0001263043 shg:AssociatesKoreaOmegaProjectFundIIIMember 2021-01-01 2021-12-31 0001263043 shg:AssociatesGenesisNorthAmericaPowerCompanyNo1PEFMember 2021-01-01 2021-12-31 0001263043 shg:AssociatesPartnerOneValueUpIPrivateEquityFundMember 2021-01-01 2021-12-31 0001263043 shg:AssociatesIGISPrivateRealEstateInvestmentTrust286Member 2021-01-01 2021-12-31 0001263043 shg:AssociatesHanaSemiconductorNewTechnologyFundMember 2021-01-01 2021-12-31 0001263043 shg:AssociatesJMagnetStartupVentureSpecializedPrivateEquityFundMember 2021-01-01 2021-12-31 0001263043 shg:AssociatesGenesisNo1PrivateEquityFundMember 2021-01-01 2021-12-31 0001263043 shg:AssociatesSooDeliveryPlatformGrowthFundMember 2021-01-01 2021-12-31 0001263043 shg:GroupPoliciesMember 2021-01-01 2021-12-31 0001263043 shg:PureEndowmentMember 2021-01-01 2021-12-31 0001263043 shg:DeathMember 2021-01-01 2021-12-31 0001263043 shg:EndowmentMember 2021-01-01 2021-12-31 0001263043 shg:IndividualPoliciesMember 2021-01-01 2021-12-31 0001263043 shg:PureProtectionMember 2021-01-01 2021-12-31 0001263043 shg:SavingsMember 2021-01-01 2021-12-31 0001263043 ifrs-full:FloatingInterestRateMember 2021-01-01 2021-12-31 0001263043 ifrs-full:FixedInterestRateMember 2021-01-01 2021-12-31 0001263043 shg:DebtSecuritiesAtAmortisedCostMember 2021-01-01 2021-12-31 0001263043 ifrs-full:FinancialAssetsAtFairValueThroughOtherComprehensiveIncomeCategoryMember 2021-01-01 2021-12-31 0001263043 ifrs-full:OrdinarySharesMember 2021-01-01 2021-12-31 0001263043 ifrs-full:PreferenceSharesMember 2021-01-01 2021-12-31 0001263043 ifrs-full:RightofuseAssetsMember 2021-01-01 2021-12-31 0001263043 ifrs-full:OtherAssetsMember ifrs-full:RightofuseAssetsMember 2021-01-01 2021-12-31 0001263043 ifrs-full:LandAndBuildingsMember ifrs-full:RightofuseAssetsMember 2021-01-01 2021-12-31 0001263043 ifrs-full:VehiclesMember ifrs-full:RightofuseAssetsMember 2021-01-01 2021-12-31 0001263043 shg:SecuritiesAtFVTPLMember 2021-01-01 2021-12-31 0001263043 shg:COSPECBIMtechMember 2021-01-01 2021-12-31 0001263043 ifrs-full:OtherRelatedPartiesMember 2021-01-01 2021-12-31 0001263043 shg:IpixelCoLtdMember 2021-01-01 2021-12-31 0001263043 shg:AssociatesIMMGlobalPrivateEquityFundMember 2021-01-01 2021-12-31 0001263043 shg:AssociatesGoduckGangil1PFVCoLtdMember 2021-01-01 2021-12-31 0001263043 shg:NomuraRifaPrivateRealEstateInvestmentTrustNo.19Member 2021-01-01 2021-12-31 0001263043 shg:ShbnppBnctProfessionalInvestmentTypePrivateSpecialAssetInvestmentTrustMember 2021-01-01 2021-12-31 0001263043 shg:ShbnppCorporateProfessionalInvestmentTypePrivateSecurityInvestmentTrustNo.7Member 2021-01-01 2021-12-31 0001263043 shg:AssociatesSHBNPPSeniorLoanProfessionalInvestmentTypePrivateMixedAssetInvestmentTrustNo3Member 2021-01-01 2021-12-31 0001263043 shg:EDNCENTRALCoLtdMember 2021-01-01 2021-12-31 0001263043 shg:ShbnppJapanPhotovoltaicPrivateSpecialAssetInvestmentTrustNo.2Member 2021-01-01 2021-12-31 0001263043 shg:SHINHANNEOCoreIndustrialTechnologyFundMember 2021-01-01 2021-12-31 0001263043 shg:AssociatesSHBNPPMAINProfessionalInvestmentTypePrivateMixedAssetInvestmentTrustNo3Member 2021-01-01 2021-12-31 0001263043 shg:ShbnppDaeguGreenPowerCogenerationSystemProfessionalInvestmentTypePrivateSpecialAssetInvestmentTrustMember 2021-01-01 2021-12-31 0001263043 shg:ShbnppSangjuYcExpresswayProfessionalInvestmentTypePrivateSpecialAssetInvestmentTrustMember 2021-01-01 2021-12-31 0001263043 shg:ShbnppGlobalInfrastructureProfessionalInvestmentTypePrivateSpecialAssetInvestmentTrustNo.7To2UsdMember 2021-01-01 2021-12-31 0001263043 shg:KTCNPGrowthChamp20112PrivateEquityFundMember 2021-01-01 2021-12-31 0001263043 shg:FinancialAssetsMeasureedAtFairValueMember 2021-01-01 2021-12-31 0001263043 shg:AllowanceRelatedToAssetRevaluationMember 2021-01-01 2021-12-31 0001263043 ifrs-full:OtherTemporaryDifferencesMember 2021-01-01 2021-12-31 0001263043 ifrs-full:PresentValueOfDefinedBenefitObligationMember 2021-01-01 2021-12-31 0001263043 ifrs-full:NetAmountArisingFromInsuranceContractsMember 2021-01-01 2021-12-31 0001263043 ifrs-full:PropertyPlantAndEquipmentMember 2021-01-01 2021-12-31 0001263043 shg:FictitiousDividendMember 2021-01-01 2021-12-31 0001263043 shg:ExtinguishmentOfDepositAndInsuranceLiabilitiesMember 2021-01-01 2021-12-31 0001263043 shg:AllowanceForExpensingDepreciationMember 2021-01-01 2021-12-31 0001263043 ifrs-full:PlanAssetsMember 2021-01-01 2021-12-31 0001263043 shg:AccruedExpensesMember 2021-01-01 2021-12-31 0001263043 shg:DeficitCarriedOverMember 2021-01-01 2021-12-31 0001263043 ifrs-full:TemporaryDifferenceMember 2021-01-01 2021-12-31 0001263043 shg:AccruedcontributionsMember 2021-01-01 2021-12-31 0001263043 ifrs-full:AllowanceForCreditLossesMember 2021-01-01 2021-12-31 0001263043 shg:AccountsReceivableMember 2021-01-01 2021-12-31 0001263043 shg:AccruedIncomeMember 2021-01-01 2021-12-31 0001263043 ifrs-full:InvestmentsAccountedForUsingEquityMethodMember 2021-01-01 2021-12-31 0001263043 ifrs-full:MiscellaneousOtherProvisionsMember 2021-01-01 2021-12-31 0001263043 shg:DepositsMember 2021-01-01 2021-12-31 0001263043 ifrs-full:DerivativesMember 2021-01-01 2021-12-31 0001263043 shg:FinancialInstrumentsMeasuredAtFairValueThroughProfitOrLossMember 2021-01-01 2021-12-31 0001263043 shg:AllowanceForAcceptancesAndGuaranteeMember 2021-01-01 2021-12-31 0001263043 shg:RecognisedInProfitOrLossMember ifrs-full:FinancialLiabilitiesAtFairValueThroughProfitOrLossDesignatedUponInitialRecognitionCategoryMember 2021-01-01 2021-12-31 0001263043 ifrs-full:FinancialLiabilitiesMember 2021-01-01 2021-12-31 0001263043 shg:RecognisedInProfitOrLossMember shg:DerivativeFinancialInstrumentsLiabilitiesMember 2021-01-01 2021-12-31 0001263043 shg:LoansAtAmortizedCostMember shg:OtherFinancialAssetsMember ifrs-full:LifetimeExpectedCreditLossesMember 2021-01-01 2021-12-31 0001263043 shg:LoansAtAmortizedCostMember shg:OtherFinancialAssetsMember ifrs-full:TwelvemonthExpectedCreditLossesMember 2021-01-01 2021-12-31 0001263043 shg:LoansAtAmortizedCostMember shg:CreditCardReceivablesMember ifrs-full:FinancialInstrumentsCreditimpairedMember 2021-01-01 2021-12-31 0001263043 shg:LoansAtAmortizedCostMember ifrs-full:CorporateLoansMember ifrs-full:LifetimeExpectedCreditLossesMember 2021-01-01 2021-12-31 0001263043 shg:LoansAtAmortizedCostMember shg:CreditCardReceivablesMember ifrs-full:TwelvemonthExpectedCreditLossesMember 2021-01-01 2021-12-31 0001263043 shg:LoansAtAmortizedCostMember ifrs-full:ConsumerLoansMember ifrs-full:TwelvemonthExpectedCreditLossesMember 2021-01-01 2021-12-31 0001263043 shg:LoansAtAmortizedCostMember ifrs-full:ConsumerLoansMember ifrs-full:FinancialInstrumentsCreditimpairedMember 2021-01-01 2021-12-31 0001263043 shg:LoansAtAmortizedCostMember 2021-01-01 2021-12-31 0001263043 ifrs-full:FinancialInstrumentsCreditimpairedMember shg:OtherFinancialAssetsMember shg:LoansAtAmortizedCostMember 2021-01-01 2021-12-31 0001263043 shg:LoansAtAmortizedCostMember ifrs-full:ConsumerLoansMember ifrs-full:LifetimeExpectedCreditLossesMember 2021-01-01 2021-12-31 0001263043 shg:DueFromBanksAtAmortizedCostAndOtherFinancialAssetsMember ifrs-full:LifetimeExpectedCreditLossesMember 2021-01-01 2021-12-31 0001263043 shg:DueFromBanksAtAmortizedCostAndOtherFinancialAssetsMember ifrs-full:FinancialInstrumentsCreditimpairedMember 2021-01-01 2021-12-31 0001263043 shg:DueFromBanksAtAmortizedCostAndOtherFinancialAssetsMember 2021-01-01 2021-12-31 0001263043 shg:DueFromBanksAtAmortizedCostAndOtherFinancialAssetsMember ifrs-full:TwelvemonthExpectedCreditLossesMember 2021-01-01 2021-12-31 0001263043 shg:LoansAtAmortizedCostMember shg:CreditCardReceivablesMember ifrs-full:LifetimeExpectedCreditLossesMember 2021-01-01 2021-12-31 0001263043 shg:LoansAtAmortizedCostMember ifrs-full:CorporateLoansMember ifrs-full:TwelvemonthExpectedCreditLossesMember 2021-01-01 2021-12-31 0001263043 shg:LoansAtAmortizedCostMember ifrs-full:CorporateLoansMember ifrs-full:FinancialInstrumentsCreditimpairedMember 2021-01-01 2021-12-31 0001263043 ifrs-full:TreasurySharesMember 2021-01-01 2021-12-31 0001263043 ifrs-full:FinancialLiabilitiesAtFairValueThroughProfitOrLossCategoryMember 2021-01-01 2021-12-31 0001263043 shg:ForeignExchangeRiskMember 2021-01-01 2021-12-31 0001263043 ifrs-full:InterestRateSwapContractMember 2021-01-01 2021-12-31 0001263043 shg:UnusedCreditLineAndFinancialGuaranteeMember 2021-01-01 2021-12-31 0001263043 ifrs-full:PropertyPlantAndEquipmentSubjectToOperatingLeasesMember 2021-01-01 2021-12-31 0001263043 shg:DebenturesMember 2021-01-01 2021-12-31 0001263043 shg:BorrowingsMember 2021-01-01 2021-12-31 0001263043 ifrs-full:LeaseLiabilitiesMember 2021-01-01 2021-12-31 0001263043 ifrs-full:DerivativesMember 2021-01-01 2021-12-31 0001263043 ifrs-full:LongtermBorrowingsMember shg:HedgeOfNetInvestmentMember 2021-01-01 2021-12-31 0001263043 shg:DebtSecuritiesIssuanceCostMember shg:ForeignCurrencyMember 2021-01-01 2021-12-31 0001263043 shg:DebtSecuritiesIssuanceCostMember shg:DomesticCurrencyMember 2021-01-01 2021-12-31 0001263043 shg:BondIssuanceCostsMember 2021-01-01 2021-12-31 0001263043 ifrs-full:CashFlowHedgesMember shg:ForeignExchangeRiskMember 2021-01-01 2021-12-31 0001263043 ifrs-full:CashFlowHedgesMember ifrs-full:InterestRateRiskMember 2021-01-01 2021-12-31 0001263043 ifrs-full:HedgesOfNetInvestmentInForeignOperationsMember shg:ForeignExchangeRiskMember 2021-01-01 2021-12-31 0001263043 ifrs-full:FairValueHedgesMember shg:ForeignExchangeRiskMember 2021-01-01 2021-12-31 0001263043 ifrs-full:FairValueHedgesMember ifrs-full:InterestRateRiskMember 2021-01-01 2021-12-31 0001263043 ifrs-full:LegalProceedingsProvisionMember 2021-01-01 2021-12-31 0001263043 ifrs-full:ProvisionForDecommissioningRestorationAndRehabilitationCostsMember 2021-01-01 2021-12-31 0001263043 shg:ProvisionExceptUnusedCreditCommitmentsAndFinancialGuaranteeContractsIssuedMember 2021-01-01 2021-12-31 0001263043 ifrs-full:MiscellaneousOtherProvisionsMember 2021-01-01 2021-12-31 0001263043 ifrs-full:FinancialGuaranteeContractsMember ifrs-full:LifetimeExpectedCreditLossesMember 2021-01-01 2021-12-31 0001263043 ifrs-full:FinancialGuaranteeContractsMember ifrs-full:TwelvemonthExpectedCreditLossesMember 2021-01-01 2021-12-31 0001263043 shg:ProvisionForUnusedCreditCommitmentsAndFinancialGuaranteeContractsIssuedMember 2021-01-01 2021-12-31 0001263043 ifrs-full:ProvisionForCreditCommitmentsMember ifrs-full:LifetimeExpectedCreditLossesMember 2021-01-01 2021-12-31 0001263043 ifrs-full:FinancialGuaranteeContractsMember ifrs-full:FinancialInstrumentsCreditimpairedMember 2021-01-01 2021-12-31 0001263043 ifrs-full:ProvisionForCreditCommitmentsMember ifrs-full:FinancialInstrumentsCreditimpairedMember 2021-01-01 2021-12-31 0001263043 ifrs-full:ProvisionForCreditCommitmentsMember ifrs-full:TwelvemonthExpectedCreditLossesMember 2021-01-01 2021-12-31 0001263043 ifrs-full:GuaranteesMember 2021-01-01 2021-12-31 0001263043 shg:EquitySecuritiesMeasuredAtFairValueThroughOtherComprehensiveIncomeMember 2021-01-01 2021-12-31 0001263043 shg:DebtSecuritiesMeasuredAtFairValueThroughOtherComprehensiveIncomeMember 2021-01-01 2021-12-31 0001263043 ifrs-full:BottomOfRangeMember 2021-01-01 2021-12-31 0001263043 ifrs-full:TopOfRangeMember 2021-01-01 2021-12-31 0001263043 ifrs-full:NoncontrollingInterestsMember shg:ShinhanBankJejuBankAndShinhanCapitalMember 2021-01-01 2021-12-31 0001263043 shg:PtBankShinhanIndonesiasCgusMember 2021-01-01 2021-12-31 0001263043 shg:DepositoryBankOfLocalGovernmentsMember 2021-01-01 2021-12-31 0001263043 shg:AssociatesHermesPrivateInvestmentEquityFundMember 2021-01-01 2021-12-31 0001263043 shg:KoreaDigitalAssetCustodyMember 2021-01-01 2021-12-31 0001263043 shg:CjlNo1PrivateEquityFundMember 2021-01-01 2021-12-31 0001263043 shg:AssociatesPartners4thGrowthInvestmentFundMember 2021-01-01 2021-12-31 0001263043 shg:AssociatesKDBCMidasDongASnowballVentureFundIIMember 2021-01-01 2021-12-31 0001263043 shg:AssociatesShinhanAlbatrossTechInvestmentFundMember 2021-01-01 2021-12-31 0001263043 shg:NewlakeGrowthCapitalPartners2PefMember 2021-01-01 2021-12-31 0001263043 shg:AssociatesShinhanGlobalActiveReitCo.ltdMember 2021-01-01 2021-12-31 0001263043 shg:DeepblueNo.1PrivateEquityFundMember 2021-01-01 2021-12-31 0001263043 shg:AssociatesDdiLvcMasterRealEstateInvestmentTrustCo.Ltd.Member 2021-01-01 2021-12-31 0001263043 shg:CredianTF2020CorporateFinancialStabilityPrivateEquityFundMember 2021-01-01 2021-12-31 0001263043 shg:ShDaeguGreenPowerCogenerationSystemProfessionalInvestmentTypePrivateSpecialAssetInvestmentTrustMember 2021-01-01 2021-12-31 0001263043 shg:ShGlobalInfrastructureProfessionalInvestmentTypePrivateSpecialAssetInvestmentTrustNo.72Member 2021-01-01 2021-12-31 0001263043 shg:ShSangjuYcExpresswayProfessionalInvestmentTypePrivateSpecialAssetInvestmentTrustMember 2021-01-01 2021-12-31 0001263043 shg:AssociatesShMainProfessionalInvestmentTypePrivateMixedAssetInvestmentTrustNo.3Member 2021-01-01 2021-12-31 0001263043 shg:AssociatesVogoDebtStrategyQualifiedIvPrivateMember 2021-01-01 2021-12-31 0001263043 shg:AssociatesMeritzAISingA330AInvestmentTypePrivatePlacementSpecialAssetFundMember 2021-01-01 2021-12-31 0001263043 shg:AssociatesMeritzAISingA330BInvestmentTypePrivatePlacementSpecialAssetFundMember 2021-01-01 2021-12-31 0001263043 shg:AssociatesShinhanSooYoungEntrepreneurInvestmentFundNo.1Member 2021-01-01 2021-12-31 0001263043 shg:AssociatesShinhanEzGeneralInsuranceLtd.Member 2021-01-01 2021-12-31 0001263043 shg:AssociatesKdbcmidasDongaGlobalContentsFundMember 2021-01-01 2021-12-31 0001263043 shg:AssociatesTf2019BearingPrivateEquityFundSpecializingInStartupAndVentureBusinessMember 2021-01-01 2021-12-31 0001263043 shg:AssociatesHelioskdbcDigitalContents1stMember 2021-01-01 2021-12-31 0001263043 shg:AssociatesKiwoomShinhanInnovationFund2Member 2021-01-01 2021-12-31 0001263043 shg:AssociatesSjEsgInnovativeGrowthFundMember 2021-01-01 2021-12-31 0001263043 shg:AssociatesNhKyoboAiSolutionInvestmentFundMember 2021-01-01 2021-12-31 0001263043 shg:AssociatesHiotaFundMember 2021-01-01 2021-12-31 0001263043 shg:AssociatesStonebridgeShinhanUnicornSecondaryFundMember 2021-01-01 2021-12-31 0001263043 shg:AssociatesSimoneMezzanineFundNoThreeMember 2021-01-01 2021-12-31 0001263043 shg:AssociatesOthersTotal2020Member 2021-01-01 2021-12-31 0001263043 shg:ShbnppSeniorLoanProfessionalInvestmentTypePrivateMixedAssetInvestmentTrustNo.2Member 2021-01-01 2021-12-31 0001263043 shg:PreferredStockIssueMember 2021-01-01 2021-12-31 0001263043 currency:USD 2021-01-01 2021-12-31 0001263043 currency:JPY 2021-01-01 2021-12-31 0001263043 currency:EUR 2021-01-01 2021-12-31 0001263043 currency:GBP 2021-01-01 2021-12-31 0001263043 currency:AUD 2021-01-01 2021-12-31 0001263043 currency:CAD 2021-01-01 2021-12-31 0001263043 currency:SGD 2021-01-01 2021-12-31 0001263043 currency:CNY 2021-01-01 2021-12-31 0001263043 currency:SEK 2021-01-01 2021-12-31 0001263043 shg:UnusedCreditCommitmentsMember 2021-01-01 2021-12-31 0001263043 shg:ChangeInAccountingPolicyMember 2021-01-01 2021-12-31 0001263043 shg:ShinhanEzGeneralInsuranceLtdMember ifrs-full:PreviouslyStatedMember 2021-01-01 2021-12-31 0001263043 shg:SeriesQMember 2022-01-01 2022-12-31 0001263043 shg:SeriesPMember 2022-01-01 2022-12-31 0001263043 shg:SeriesOMember 2022-01-01 2022-12-31 0001263043 shg:SeriesNMember 2022-01-01 2022-12-31 0001263043 shg:SeriesMMember 2022-01-01 2022-12-31 0001263043 shg:SeriesLMember 2022-01-01 2022-12-31 0001263043 shg:SeriesKMember 2022-01-01 2022-12-31 0001263043 shg:SeriesJMember 2022-01-01 2022-12-31 0001263043 shg:SeriesIMember 2022-01-01 2022-12-31 0001263043 shg:SeriesBMember 2022-01-01 2022-12-31 0001263043 shg:SeriesCMember 2022-01-01 2022-12-31 0001263043 shg:SeriesDMember 2022-01-01 2022-12-31 0001263043 shg:SeriesEMember 2022-01-01 2022-12-31 0001263043 shg:SeriesFMember 2022-01-01 2022-12-31 0001263043 shg:SeriesGMember 2022-01-01 2022-12-31 0001263043 shg:SeriesHMember 2022-01-01 2022-12-31 0001263043 srt:ParentCompanyMember 2022-01-01 2022-12-31 0001263043 shg:AssociatesBNPParibasCardifLifeInsuranceMember shg:UnusedLoanLimitMember shg:SubsidiaryShinhanBankMember 2022-01-01 2022-12-31 0001263043 shg:ShinhanEzGeneralInsuranceLtdMember shg:UnusedLinesOfCreditMember shg:SubsidiaryShinhanCardMember 2022-01-01 2022-12-31 0001263043 shg:StructuredEntitiesMember shg:TheGroupMember shg:PurchaseAgreementMember 2022-01-01 2022-12-31 0001263043 shg:AssociatesBNPParibasCardifLifeInsuranceMember shg:UnusedLinesOfCreditMember shg:SubsidiaryShinhanCardMember 2022-01-01 2022-12-31 0001263043 shg:KeyManagementPersonnelMember shg:SubsidiaryShinhanBankMember shg:UnusedLoanLimitMember 2022-01-01 2022-12-31 0001263043 shg:AssociatesBNPParibasCardifLifeInsuranceMember shg:GovernmentGuaranteedCollateralMember shg:SubsidiaryShinhanBankMember 2022-01-01 2022-12-31 0001263043 shg:IpixelCoLtdMember shg:ElectronicCreditGuaranteeMember shg:SubsidiaryShinhanBankMember 2022-01-01 2022-12-31 0001263043 shg:CollateralTrustMember shg:AssociatesLogisvalleyShinhanReitCo.ltd.Member shg:SubsidiaryShinhanBankMember 2022-01-01 2022-12-31 0001263043 ifrs-full:PropertyPlantAndEquipmentMember shg:KeyManagementPersonnelMember shg:SubsidiaryShinhanBankMember 2022-01-01 2022-12-31 0001263043 shg:DepositsAndEtcMember shg:KeyManagementPersonnelMember shg:SubsidiaryShinhanBankMember 2022-01-01 2022-12-31 0001263043 shg:GuaranteeMember shg:KeyManagementPersonnelMember shg:SubsidiaryShinhanBankMember 2022-01-01 2022-12-31 0001263043 shg:SubsidiaryShinhanBankMember 2022-01-01 2022-12-31 0001263043 shg:SubsidiaryShinhanBankMember 2022-01-01 2022-12-31 0001263043 shg:ShinhanVentureInvestmentCo.Ltd.Member 2022-01-01 2022-12-31 0001263043 shg:SubsidiaryShinhanAIMember 2022-01-01 2022-12-31 0001263043 shg:SubsidiaryShinhanREITsManagementMember 2022-01-01 2022-12-31 0001263043 shg:ShinhanAssetTrustCo.Ltd.Member 2022-01-01 2022-12-31 0001263043 shg:SubsidiaryShinhanSavingsBankMember 2022-01-01 2022-12-31 0001263043 shg:SubsidiarySHCManagementMember 2022-01-01 2022-12-31 0001263043 shg:SubsidiaryShinhanAssetManagementCo.Ltd.Member 2022-01-01 2022-12-31 0001263043 shg:SubsidiaryShinhanAlternativeInvestmentManagementMember 2022-01-01 2022-12-31 0001263043 shg:SubsidiaryShinhanCreditInformationMember 2022-01-01 2022-12-31 0001263043 shg:SubsidiaryJejuBankMember 2022-01-01 2022-12-31 0001263043 shg:SubsidiaryShinhanCapitalMember 2022-01-01 2022-12-31 0001263043 shg:SubsidiaryShinhanLifeInsuranceMember 2022-01-01 2022-12-31 0001263043 shg:SubsidiaryShinhanCardMember 2022-01-01 2022-12-31 0001263043 shg:ShinhanSecuritiesCo.Ltd.Member 2022-01-01 2022-12-31 0001263043 shg:SubsidiaryShinhanDataSystemMember 2022-01-01 2022-12-31 0001263043 shg:SubsidiaryShinhanAitasMember 2022-01-01 2022-12-31 0001263043 shg:SubsidiaryShinhanBankAmericaMember 2022-01-01 2022-12-31 0001263043 shg:ShinhanBankEuropeGmbhMember 2022-01-01 2022-12-31 0001263043 shg:SubsidiaryShinhanBankVietnamMember 2022-01-01 2022-12-31 0001263043 shg:SubsidiaryBancoShinhanDeMexicoMember 2022-01-01 2022-12-31 0001263043 shg:SubsidiaryPTBankShinhanIndonesiaMember 2022-01-01 2022-12-31 0001263043 shg:SubsidiarySBJDNXMember 2022-01-01 2022-12-31 0001263043 shg:ShinhanCreditInformationCo.Ltd.Member 2022-01-01 2022-12-31 0001263043 shg:SubsidiaryMFOShinhanFinanceMember 2022-01-01 2022-12-31 0001263043 shg:SubsidiaryShinhanIndoFinanceMember 2022-01-01 2022-12-31 0001263043 shg:SubsidiaryShinhanMicrofinanceMember 2022-01-01 2022-12-31 0001263043 shg:SubsidiaryShinhanVietnamFinanceMember 2022-01-01 2022-12-31 0001263043 shg:SubsidiaryShinhanSecuritiesAmericaIncMember 2022-01-01 2022-12-31 0001263043 shg:ShinhanSecuritiesAsiaLtd.Member 2022-01-01 2022-12-31 0001263043 shg:ShinhanSecuritiesVietnamCo.Ltd.Member 2022-01-01 2022-12-31 0001263043 shg:SubsidiaryShinhanSekuritasIndonesiaMember 2022-01-01 2022-12-31 0001263043 shg:SubsidiaryShinhanFinancialPlusMember 2022-01-01 2022-12-31 0001263043 shg:SubsidiaryShinhanCubeonCoLtdMember 2022-01-01 2022-12-31 0001263043 shg:SubsidiaryShinhanLifeInsuranceVietnamCoLtdMember 2022-01-01 2022-12-31 0001263043 shg:ShinhanAssetManagementHongKongLimitedMember 2022-01-01 2022-12-31 0001263043 shg:SubsidiaryShinhanDSVietnamMember 2022-01-01 2022-12-31 0001263043 shg:SubsidiaryPTShinhanAssetManagementIndonesiaMember 2022-01-01 2022-12-31 0001263043 shg:SubsidiaryShinhanBankJapanMember 2022-01-01 2022-12-31 0001263043 shg:SubsidiaryShinhanBankChinaMember 2022-01-01 2022-12-31 0001263043 shg:SubsidiaryShinhanBankCanadaMember 2022-01-01 2022-12-31 0001263043 shg:SubsidiaryShinhanBankKazakhstanMember 2022-01-01 2022-12-31 0001263043 shg:SubsidiaryShinhanBankCambodiaMember 2022-01-01 2022-12-31 0001263043 shg:SubsidiaryShinhanEzGeneralInsuranceLtdMember 2022-01-01 2022-12-31 0001263043 shg:SecuritiesAtFVTPLMember 2022-01-01 2022-12-31 0001263043 ifrs-full:FinancialAssetsAtFairValueThroughOtherComprehensiveIncomeCategoryMember 2022-01-01 2022-12-31 0001263043 shg:ReserveOfSeparateAccountMember 2022-01-01 2022-12-31 0001263043 shg:NeverBeReclassifiedToProfitOrlossGainLossOnFinancialAssetAtFairValueThroughOtherComprehensiveIncomeMember 2022-01-01 2022-12-31 0001263043 ifrs-full:ReserveOfOverlayApproachMember 2022-01-01 2022-12-31 0001263043 shg:ReserveOfShareOfAssociatesAndJointVenturesAccountedForUsingEquityMethodMember 2022-01-01 2022-12-31 0001263043 ifrs-full:ReserveOfRemeasurementsOfDefinedBenefitPlansMember 2022-01-01 2022-12-31 0001263043 ifrs-full:ReserveOfChangeInFairValueOfFinancialLiabilityAttributableToChangeInCreditRiskOfLiabilityMember 2022-01-01 2022-12-31 0001263043 ifrs-full:ReserveOfCashFlowHedgesMember 2022-01-01 2022-12-31 0001263043 shg:NeverBeReclassifiedToProfitOrlossReserveOfShareOfAssociatesAndJointVenturesAccountedForUsingEquityMethodMember 2022-01-01 2022-12-31 0001263043 ifrs-full:ReserveOfGainsAndLossesOnFinancialAssetsMeasuredAtFairValueThroughOtherComprehensiveIncomeMember 2022-01-01 2022-12-31 0001263043 ifrs-full:ReserveOfExchangeDifferencesOnTranslationMember 2022-01-01 2022-12-31 0001263043 shg:PerformanceSharesMember 2022-01-01 2022-12-31 0001263043 shg:EmployeeStockOptionSeventhMember 2022-01-01 2022-12-31 0001263043 shg:ShinhanSecuritiesCo.Ltd.Member 2022-01-01 2022-12-31 0001263043 shg:ShinhanAssetTrustCo.Ltd.Member 2022-01-01 2022-12-31 0001263043 shg:SubsidiaryShinhanAssetManagementCo.Ltd.Member 2022-01-01 2022-12-31 0001263043 shg:SubsidiaryShinhanSavingsBankMember 2022-01-01 2022-12-31 0001263043 shg:SubsidiaryShinhanVentureInvestmentMember 2022-01-01 2022-12-31 0001263043 shg:SubsidiaryShinhanAlternativeInvestmentManagementMember 2022-01-01 2022-12-31 0001263043 shg:SubsidiaryShinhanDataSystemMember 2022-01-01 2022-12-31 0001263043 shg:SubsidiarySHCManagementMember 2022-01-01 2022-12-31 0001263043 shg:SubsidiaryShinhanAitasMember 2022-01-01 2022-12-31 0001263043 shg:SubsidiaryShinhanREITsManagementMember 2022-01-01 2022-12-31 0001263043 shg:SubsidiaryOrangeLifeInsuranceMember 2022-01-01 2022-12-31 0001263043 shg:SubsidiaryShinhanAIMember 2022-01-01 2022-12-31 0001263043 shg:SubsidiaryJejuBankMember 2022-01-01 2022-12-31 0001263043 shg:SubsidiaryShinhanCapitalMember 2022-01-01 2022-12-31 0001263043 shg:SubsidiaryShinhanCardMember 2022-01-01 2022-12-31 0001263043 shg:DummySMember 2022-01-01 2022-12-31 0001263043 shg:SubsidiaryShinhanLifeInsuranceMember 2022-01-01 2022-12-31 0001263043 shg:NotExpiredPerformanceSharesMember 2022-01-01 2022-12-31 0001263043 shg:ExpiredPerformanceSharesMember 2022-01-01 2022-12-31 0001263043 ifrs-full:FinancialAssetsAtFairValueThroughProfitOrLossCategoryMember ifrs-full:DebtSecuritiesMember ifrs-full:Level2OfFairValueHierarchyMember 2022-01-01 2022-12-31 0001263043 ifrs-full:FinancialAssetsAtFairValueThroughProfitOrLossCategoryMember ifrs-full:Level3OfFairValueHierarchyMember ifrs-full:DebtSecuritiesMember 2022-01-01 2022-12-31 0001263043 ifrs-full:FinancialAssetsAtFairValueThroughProfitOrLossCategoryMember ifrs-full:Level3OfFairValueHierarchyMember shg:EquitySecuritiesMember 2022-01-01 2022-12-31 0001263043 ifrs-full:FinancialAssetsAtFairValueThroughOtherComprehensiveIncomeCategoryMember ifrs-full:Level3OfFairValueHierarchyMember shg:EquitySecuritiesMember 2022-01-01 2022-12-31 0001263043 shg:InterestRateContractMember shg:DerivativeFinancialInstrumentsAssetsMember ifrs-full:Level3OfFairValueHierarchyMember 2022-01-01 2022-12-31 0001263043 ifrs-full:Level3OfFairValueHierarchyMember shg:DerivativeFinancialInstrumentsAssetsMember shg:EquityAndForeignExchangeContractMember 2022-01-01 2022-12-31 0001263043 ifrs-full:Level3OfFairValueHierarchyMember shg:DerivativeFinancialInstrumentsAssetsMember shg:CreditAndCommodityContractMember 2022-01-01 2022-12-31 0001263043 ifrs-full:FinancialAssetsAtFairValueThroughProfitOrLossCategoryMember shg:EquitySecuritiesMember ifrs-full:Level2OfFairValueHierarchyMember 2022-01-01 2022-12-31 0001263043 shg:DerivativeFinancialInstrumentsAssetsMember shg:NotDesignatedAsHedgingInstrumentTradingMember ifrs-full:Level2OfFairValueHierarchyMember 2022-01-01 2022-12-31 0001263043 ifrs-full:FinancialAssetsAtFairValueThroughOtherComprehensiveIncomeCategoryMember ifrs-full:DebtSecuritiesMember ifrs-full:Level2OfFairValueHierarchyMember 2022-01-01 2022-12-31 0001263043 ifrs-full:Level3OfFairValueHierarchyMember 2022-01-01 2022-12-31 0001263043 shg:GainLossOnSecuritiesAtFairValueThroughOtherComprehensiveIncomeMember ifrs-full:Level3OfFairValueHierarchyMember 2022-01-01 2022-12-31 0001263043 ifrs-full:Level3OfFairValueHierarchyMember shg:GainLossOnFinancialAssetsAtFairValueThroughProfitOrLossMember 2022-01-01 2022-12-31 0001263043 ifrs-full:Level3OfFairValueHierarchyMember shg:OtherOperatingIncomeExpenseMember 2022-01-01 2022-12-31 0001263043 shg:GainLossOnFinancialAssetsDesignatedAtFairValueThroughProfitOrLossMember ifrs-full:Level3OfFairValueHierarchyMember 2022-01-01 2022-12-31 0001263043 ifrs-full:Level3OfFairValueHierarchyMember ifrs-full:FinancialLiabilitiesAtFairValueThroughProfitOrLossDesignatedUponInitialRecognitionCategoryMember 2022-01-01 2022-12-31 0001263043 ifrs-full:FinancialLiabilitiesAtFairValueThroughProfitOrLossDesignatedUponInitialRecognitionCategoryMember shg:DebtSecuritiesIssuedMember ifrs-full:Level2OfFairValueHierarchyMember 2022-01-01 2022-12-31 0001263043 ifrs-full:Level2OfFairValueHierarchyMember shg:NotDesignatedAsHedgingInstrumentTradingMember shg:DerivativeFinancialInstrumentsLiabilitiesMember 2022-01-01 2022-12-31 0001263043 ifrs-full:Level3OfFairValueHierarchyMember shg:EquityAndForeignExchangeContractMember shg:DerivativeFinancialInstrumentsLiabilitiesMember 2022-01-01 2022-12-31 0001263043 ifrs-full:Level3OfFairValueHierarchyMember shg:InterestRateContractMember shg:DerivativeFinancialInstrumentsLiabilitiesMember 2022-01-01 2022-12-31 0001263043 ifrs-full:Level3OfFairValueHierarchyMember shg:CreditAndCommodityContractMember shg:DerivativeFinancialInstrumentsLiabilitiesMember 2022-01-01 2022-12-31 0001263043 ifrs-full:FinancialAssetsAtFairValueThroughOtherComprehensiveIncomeCategoryMember shg:OtherComprehensiveIncomeMember 2022-01-01 2022-12-31 0001263043 shg:DerivativeFinancialInstrumentsAssetsMember shg:RecognisedInProfitOrLossMember 2022-01-01 2022-12-31 0001263043 shg:FinancialAssetsClassMember 2022-01-01 2022-12-31 0001263043 ifrs-full:FinancialAssetsAtFairValueThroughProfitOrLossCategoryMember shg:RecognisedInProfitOrLossMember 2022-01-01 2022-12-31 0001263043 ifrs-full:ForeignCountriesMember 2022-01-01 2022-12-31 0001263043 ifrs-full:CountryOfDomicileMember 2022-01-01 2022-12-31 0001263043 ifrs-full:AssociatesMember 2022-01-01 2022-12-31 0001263043 shg:ShinhanGlobalHealthcareFund2Member 2022-01-01 2022-12-31 0001263043 shg:AssociatesEdncentralCo.ltdMember 2022-01-01 2022-12-31 0001263043 shg:AssociatesMIELCOLTDMember 2022-01-01 2022-12-31 0001263043 shg:AssociatesShinhanGlobalHealthcareFund1Member 2022-01-01 2022-12-31 0001263043 shg:MsteelCo.ltd.Member 2022-01-01 2022-12-31 0001263043 shg:SecuritiesMember 2022-01-01 2022-12-31 0001263043 shg:CreditMember 2022-01-01 2022-12-31 0001263043 shg:ConsolidationAdjustmentMember shg:InternalTransactionsMember 2022-01-01 2022-12-31 0001263043 shg:InternalTransactionsMember 2022-01-01 2022-12-31 0001263043 shg:CreditCardMember 2022-01-01 2022-12-31 0001263043 shg:LifeInsuranceMember 2022-01-01 2022-12-31 0001263043 shg:LifeInsuranceMember shg:InternalTransactionsMember 2022-01-01 2022-12-31 0001263043 ifrs-full:AllOtherSegmentsMember 2022-01-01 2022-12-31 0001263043 shg:BankingMember shg:InternalTransactionsMember 2022-01-01 2022-12-31 0001263043 shg:BankingMember shg:ExternalCustomersMember 2022-01-01 2022-12-31 0001263043 shg:SecuritiesMember shg:InternalTransactionsMember 2022-01-01 2022-12-31 0001263043 ifrs-full:AllOtherSegmentsMember shg:ExternalCustomersMember 2022-01-01 2022-12-31 0001263043 shg:BankingMember 2022-01-01 2022-12-31 0001263043 shg:ConsolidationAdjustmentMember shg:ExternalCustomersMember 2022-01-01 2022-12-31 0001263043 shg:ExternalCustomersMember 2022-01-01 2022-12-31 0001263043 shg:InternalTransactionsMember shg:CreditMember 2022-01-01 2022-12-31 0001263043 shg:ConsolidationAdjustmentMember 2022-01-01 2022-12-31 0001263043 shg:SecuritiesMember shg:ExternalCustomersMember 2022-01-01 2022-12-31 0001263043 shg:CreditCardMember shg:ExternalCustomersMember 2022-01-01 2022-12-31 0001263043 shg:LifeInsuranceMember shg:ExternalCustomersMember 2022-01-01 2022-12-31 0001263043 shg:CreditMember shg:ExternalCustomersMember 2022-01-01 2022-12-31 0001263043 shg:CreditCardMember shg:InternalTransactionsMember 2022-01-01 2022-12-31 0001263043 ifrs-full:AllOtherSegmentsMember shg:InternalTransactionsMember 2022-01-01 2022-12-31 0001263043 ifrs-full:PlanAssetsMember 2022-01-01 2022-12-31 0001263043 ifrs-full:PresentValueOfDefinedBenefitObligationMember 2022-01-01 2022-12-31 0001263043 shg:BorrowingsFromBankOfKoreaMember 2022-01-01 2022-12-31 0001263043 shg:OthersBorrowingsInWonMember 2022-01-01 2022-12-31 0001263043 shg:OverdraftDueToBanksMember 2022-01-01 2022-12-31 0001263043 shg:BorrowingsFromBanksMember 2022-01-01 2022-12-31 0001263043 shg:OthersBorrowingsInForeignCurrencyMember 2022-01-01 2022-12-31 0001263043 shg:CallMoneyMember 2022-01-01 2022-12-31 0001263043 shg:BillsSoldMember 2022-01-01 2022-12-31 0001263043 shg:RepurchaseAgreementsMember 2022-01-01 2022-12-31 0001263043 shg:DomesticCurrencyMember shg:SubordinatedDebtMember 2022-01-01 2022-12-31 0001263043 shg:DomesticCurrencyMember shg:CorporateDebtSecuritiesMember 2022-01-01 2022-12-31 0001263043 shg:CorporateDebtSecuritiesMember shg:ForeignCurrencyMember 2022-01-01 2022-12-31 0001263043 shg:SubordinatedDebtMember shg:ForeignCurrencyMember 2022-01-01 2022-12-31 0001263043 ifrs-full:OptionContractMember shg:OverTheCounterMember shg:ForeignCurrencyRelatedMember 2022-01-01 2022-12-31 0001263043 shg:ForeignCurrencyRelatedMember shg:ExchangeTradedMember ifrs-full:FuturesContractMember 2022-01-01 2022-12-31 0001263043 shg:ForeignCurrencyRelatedMember shg:ExchangeTradedMember 2022-01-01 2022-12-31 0001263043 shg:ForeignCurrencyRelatedMember shg:OverTheCounterMember 2022-01-01 2022-12-31 0001263043 shg:ForeignCurrencyRelatedMember shg:OverTheCounterMember ifrs-full:ForwardContractMember 2022-01-01 2022-12-31 0001263043 ifrs-full:SwapContractMember shg:OverTheCounterMember shg:ForeignCurrencyRelatedMember 2022-01-01 2022-12-31 0001263043 shg:CommodityRelatedMember shg:ExchangeTradedMember shg:CommodityFuturesMember 2022-01-01 2022-12-31 0001263043 shg:ExchangeTradedMember 2022-01-01 2022-12-31 0001263043 shg:CommodityRelatedMember shg:OverTheCounterMember shg:CommodityFuturesAndOptionsMember 2022-01-01 2022-12-31 0001263043 shg:EquityRelatedMember shg:OverTheCounterMember 2022-01-01 2022-12-31 0001263043 shg:ExchangeTradedMember shg:EquityContractMember shg:NotDesignatedAsHedgingInstrumentTradingMember 2022-01-01 2022-12-31 0001263043 shg:EquityOptionsMember shg:OverTheCounterMember shg:EquityRelatedMember 2022-01-01 2022-12-31 0001263043 shg:InterestRatesRelatedMember shg:OverTheCounterMember 2022-01-01 2022-12-31 0001263043 shg:InterestRatesRelatedMember shg:ExchangeTradedMember shg:InterestRateFutureContractMember 2022-01-01 2022-12-31 0001263043 shg:InterestRatesRelatedMember shg:OverTheCounterMember shg:InterestRateForwardsAndSwapsMember 2022-01-01 2022-12-31 0001263043 shg:ExchangeTradedMember shg:InterestRatesRelatedMember 2022-01-01 2022-12-31 0001263043 shg:InterestRatesRelatedMember shg:OverTheCounterMember shg:InterestRateOptionContractMember 2022-01-01 2022-12-31 0001263043 shg:CreditRelatedMember shg:CreditSwapsMember shg:OverTheCounterMember 2022-01-01 2022-12-31 0001263043 shg:EquityRelatedMember shg:ExchangeTradedMember shg:EquityFuturesMember 2022-01-01 2022-12-31 0001263043 shg:EquityRelatedMember shg:ExchangeTradedMember shg:EquityOptionsMember 2022-01-01 2022-12-31 0001263043 shg:CommodityRelatedMember shg:OverTheCounterMember 2022-01-01 2022-12-31 0001263043 shg:EquityRelatedMember shg:OverTheCounterMember shg:EquitySwapsAndForwardsMember 2022-01-01 2022-12-31 0001263043 shg:HedgeFundsMember 2022-01-01 2022-12-31 0001263043 shg:CommodityRelatedMember shg:OverTheCounterMember shg:CommoditySwapsAndForwardsMember 2022-01-01 2022-12-31 0001263043 shg:CommodityRelatedMember shg:ExchangeTradedMember 2022-01-01 2022-12-31 0001263043 shg:AssociatesMapleMobilityFundMember 2022-01-01 2022-12-31 0001263043 shg:AssociatesDaishinNewgenNewTechnologyInvestmentFund1stMember 2022-01-01 2022-12-31 0001263043 shg:AssociatesShinhanSooYoungEntrepreneurInvestmentFundNo.1Member 2022-01-01 2022-12-31 0001263043 shg:AssociatesShinhanEzGeneralInsuranceLtd.Member 2022-01-01 2022-12-31 0001263043 shg:AssociatesKdbcmidasDongaGlobalContentsFundMember 2022-01-01 2022-12-31 0001263043 shg:AssociatesHelioskdbcDigitalContents1stMember 2022-01-01 2022-12-31 0001263043 shg:AssociatesMeritzAISingA330BInvestmentTypePrivatePlacementSpecialAssetFundMember 2022-01-01 2022-12-31 0001263043 shg:AssociatesMeritzAISingA330AInvestmentTypePrivatePlacementSpecialAssetFundMember 2022-01-01 2022-12-31 0001263043 shg:AssociatesDigitalNewDealKappaPrivateEquityFundMember 2022-01-01 2022-12-31 0001263043 shg:AssociatesOnNo.1PrivateEquityFundMember 2022-01-01 2022-12-31 0001263043 shg:AssociatesNauticGreenInnovationEsgCoinvestmentNo.1PrivateEquityFundMember 2022-01-01 2022-12-31 0001263043 shg:AssociatesIbkcbehighFund1stMember 2022-01-01 2022-12-31 0001263043 shg:AssociatesNhDaishinKyoboHealthcare1FundMember 2022-01-01 2022-12-31 0001263043 shg:AssociatesEventusIbkcLibFundMember 2022-01-01 2022-12-31 0001263043 shg:AssociatesSh1.5yearsMaturityInvestmentTypeSecurityInvestmentTrustNo.2Member 2022-01-01 2022-12-31 0001263043 shg:AssociatesShSustainableManagementEsgShortTermBondSecurityFeederInvestmentTrustNo.1Member 2022-01-01 2022-12-31 0001263043 shg:AssociatesCapstoneDevelopFrontierTrustMember 2022-01-01 2022-12-31 0001263043 shg:AssociatesImmGlobalVentureOpportunityLpMember 2022-01-01 2022-12-31 0001263043 shg:AssociatesNhjibkcLabelTechnologyFundMember 2022-01-01 2022-12-31 0001263043 shg:AssociatesShinhanGlobalActiveReitCo.ltdMember 2022-01-01 2022-12-31 0001263043 shg:AssociatesBts2ndPrivateEquityFundMember 2022-01-01 2022-12-31 0001263043 shg:AssociatesKoreaInvestmentGreenNewdealInfraTrustNo.1Member 2022-01-01 2022-12-31 0001263043 shg:AssociatesKdbInvestmentGlobalHealthcarePrivateEquityFundIMember 2022-01-01 2022-12-31 0001263043 shg:AssociatesLogisvalleyShinhanReitCo.ltd.Member 2022-01-01 2022-12-31 0001263043 shg:AssociatesCornerstoneJmFundIMember 2022-01-01 2022-12-31 0001263043 shg:AssociatesIgen2022No.1PrivateEquityFundMember 2022-01-01 2022-12-31 0001263043 shg:AssociatesShinhanCognitiveStartupFundL.p.Member 2022-01-01 2022-12-31 0001263043 shg:AssociatesLbYoungnamLogisticsPrivateTrustNo.40Member 2022-01-01 2022-12-31 0001263043 shg:AssociatesNauticSmartNo.6PrivateEquityFundMember 2022-01-01 2022-12-31 0001263043 shg:AssociatesJMoorimJadeInvestmentFundMember 2022-01-01 2022-12-31 0001263043 shg:AssociatesGenesisEcoNo.1PefMember 2022-01-01 2022-12-31 0001263043 shg:AssociatesNewlakeGrowthCapitalPartners2PefMember 2022-01-01 2022-12-31 0001263043 shg:AssociatesDaehanNo.36OfficeAssetManagementCompanyMember 2022-01-01 2022-12-31 0001263043 shg:AssociatesHankookSmartRealAssetInvestmentTrustNo.3Member 2022-01-01 2022-12-31 0001263043 shg:AssociatesShinhantimeMezzanineBlindFundMember 2022-01-01 2022-12-31 0001263043 shg:AssociatesSksYozmaFundNo.1Member 2022-01-01 2022-12-31 0001263043 shg:AssociatesIBKCMETISGlobalContentsInvestmentFundMember 2022-01-01 2022-12-31 0001263043 shg:AssociatesShinhanJigaeNamsanRoadPrivateSpecialAssetInvestmentTrustMember 2022-01-01 2022-12-31 0001263043 shg:AssociatesKeistoneUnicornPrivateEquityFundMember 2022-01-01 2022-12-31 0001263043 shg:AssociatesKoreaInvestmentTopMezzaninePrivateRealEsateTrustNo.1Member 2022-01-01 2022-12-31 0001263043 shg:AssociatesNhKyoboAiSolutionInvestmentFundMember 2022-01-01 2022-12-31 0001263043 shg:AssociatesSjEsgInnovativeGrowthFundMember 2022-01-01 2022-12-31 0001263043 shg:AssociatesKiwoomShinhanInnovationFund2Member 2022-01-01 2022-12-31 0001263043 shg:AssociatesTf2019BearingPrivateEquityFundSpecializingInStartupAndVentureBusinessMember 2022-01-01 2022-12-31 0001263043 shg:AssociatesHiotaFundMember 2022-01-01 2022-12-31 0001263043 shg:AssociatesStonebridgeShinhanUnicornSecondaryFundMember 2022-01-01 2022-12-31 0001263043 shg:AssociatesKbDistributionPrivateRealEstate31Member 2022-01-01 2022-12-31 0001263043 shg:AssociatesPacificPrivateInvestmentTrustNo.491Member 2022-01-01 2022-12-31 0001263043 shg:AssociatesKiwoomRealEstatePrivatePlacementFundForNormalInvestorsNo.31Member 2022-01-01 2022-12-31 0001263043 shg:AssociatesRifaRealEstatePrivatePlacementFundForNormalInvestoesNo.51Member 2022-01-01 2022-12-31 0001263043 shg:AssociatesFivetreeGeneralPrivateEquityNundNo.15Member 2022-01-01 2022-12-31 0001263043 shg:AssociatesShinhanKunicornFirstFundMember 2022-01-01 2022-12-31 0001263043 shg:ShSeniorLoanProfessionalInvestmentTypePrivateMixedAssetInvestmentTrustNo.2Member 2022-01-01 2022-12-31 0001263043 shg:AssociatesAcurusHyundaiInvestmentPartnersNewTechnologyMember 2022-01-01 2022-12-31 0001263043 shg:AssociatesIGISGLIPProfessionalInvestmentPrivateRealEstateInvestmentTrustNo11Member 2022-01-01 2022-12-31 0001263043 shg:AssociatesIGISGLIPProfessionalInvestmentPrivateRealEstateInvestmentTrustNo12Member 2022-01-01 2022-12-31 0001263043 shg:AssociatesPacificSunnyProfessionalInvestorsPrivatePlacementRealEstateInvestmentCompanyNo45Member 2022-01-01 2022-12-31 0001263043 shg:AssociatesHarvestFundNo.3Member 2022-01-01 2022-12-31 0001263043 shg:AssociatesShinhanSimoneFundIMember 2022-01-01 2022-12-31 0001263043 shg:AssociatesKoreaInvestmentDevelopSeedTrustNo.1Member 2022-01-01 2022-12-31 0001263043 shg:AssociatesTigerGreenAlpahTrustNo.29Member 2022-01-01 2022-12-31 0001263043 shg:AssociatesSticAltGlobalIiPrivateEquityFundMember 2022-01-01 2022-12-31 0001263043 shg:AssociatesNhBrainEvFundMember 2022-01-01 2022-12-31 0001263043 shg:AssociatesDdiLvcMasterRealEstateInvestmentTrustCo.Ltd.Member 2022-01-01 2022-12-31 0001263043 shg:AssociatesFindGreenNewDeal2ndEquityFundMember 2022-01-01 2022-12-31 0001263043 shg:AssociatesShinhanFitrin1stTechnologyBusinessInvestmentAssociationMember 2022-01-01 2022-12-31 0001263043 shg:AssociatesParatusNo.3PrivateEquityFundMember 2022-01-01 2022-12-31 0001263043 shg:AssociatesGoldenRoute2ndStartupVentureSpecializedPrivateEquityFundMember 2022-01-01 2022-12-31 0001263043 shg:AssociatesKoramcoPrivateRealEstateFund143Member 2022-01-01 2022-12-31 0001263043 shg:AssociatesShinhanSmilegateGlobalPefIMember 2022-01-01 2022-12-31 0001263043 shg:AssociatesTCoreIndustrialTechnology1stVenturePefMember 2022-01-01 2022-12-31 0001263043 shg:AssociatesMplusProfessionalPrivateRealEstateFund25Member 2022-01-01 2022-12-31 0001263043 shg:AssociatesPremierLuminousPrivateEquityFundMember 2022-01-01 2022-12-31 0001263043 shg:AssociatesKtcnpGrowthChamp20112PrivateEquityFundMember 2022-01-01 2022-12-31 0001263043 shg:AssociatesFutureCreationNeopluxVentureCapitalFundMember 2022-01-01 2022-12-31 0001263043 shg:AssociatesMasternPrivateRealEstateLoanFundNo2Member 2022-01-01 2022-12-31 0001263043 shg:AssociatesMasternOpportunitySeekingRealEstateFundIIMember 2022-01-01 2022-12-31 0001263043 shg:AssociatesTF2020SSPrivateEquityFundSpecializinginStartupandVentureBusinessMember 2022-01-01 2022-12-31 0001263043 shg:AssociatesNeopluxNo3PrivateEquityFundMember 2022-01-01 2022-12-31 0001263043 shg:AssociatesGyeonggiNeopluxSupermanFundMember 2022-01-01 2022-12-31 0001263043 shg:AssociatesLBScotlandAmazonFulfillmentCenterFund29Member 2022-01-01 2022-12-31 0001263043 shg:AssociatesSHBNPPGreenNewDealEnergyProfessionalInvestmentTypePrivateSpecialAssetInvestmentTrustNo2Member 2022-01-01 2022-12-31 0001263043 shg:AssociatesSimoneMezzanineFundNoThreeMember 2022-01-01 2022-12-31 0001263043 shg:AssociatesKiwoomHeroNo4PrivateEquityFundMember 2022-01-01 2022-12-31 0001263043 shg:AssociatesVogoCanisterProfessionalTrustPrivateFundIMember 2022-01-01 2022-12-31 0001263043 shg:AssociatesEumPrivateEquityFundNo7Member 2022-01-01 2022-12-31 0001263043 shg:AssociatesSwsFundMember 2022-01-01 2022-12-31 0001263043 shg:AssociatesShinhanneoCoreIndustrialTechnologyFundMember 2022-01-01 2022-12-31 0001263043 shg:AssociatesKiwoomPrivateEquityAntManStartupVentureSpecializedPrivateEquityFundMember 2022-01-01 2022-12-31 0001263043 shg:AssociatesShinhanneoMarketfrontier2ndFundMember 2022-01-01 2022-12-31 0001263043 shg:AssociatesUlmusShcInnovationInvestmentFundMember 2022-01-01 2022-12-31 0001263043 shg:AssociatesCuriousFinaleCorporateRecoveryPrivateEquityFundMember 2022-01-01 2022-12-31 0001263043 shg:AssociatesIbkcGlobalContentsInvestmentFundMember 2022-01-01 2022-12-31 0001263043 shg:AssociatesHanyangMeritz1FundMember 2022-01-01 2022-12-31 0001263043 shg:AssociatesPharosDkFundMember 2022-01-01 2022-12-31 0001263043 shg:AssociatesMetaEsgPrivateEquityFundIMember 2022-01-01 2022-12-31 0001263043 shg:AssociatesAves1stCorporateRecoveryPrivateEquityFundMember 2022-01-01 2022-12-31 0001263043 shg:AssociatesTiFirstPropertyPrivateInvestmentTrust1Member 2022-01-01 2022-12-31 0001263043 shg:AssociatesMiraeAssetPartnersXPrivateEquityFundMember 2022-01-01 2022-12-31 0001263043 shg:AssociatesNhsynergyCoreIndustrialNewTechnologyFundMember 2022-01-01 2022-12-31 0001263043 shg:AssociatesFountProfessionalInvestorsPrivateInvestmentTrustNo.3Member 2022-01-01 2022-12-31 0001263043 shg:AssociatesTimefolioTheVenturevSecondMember 2022-01-01 2022-12-31 0001263043 shg:AssociatesSwfvFund1Member 2022-01-01 2022-12-31 0001263043 shg:AssociatesJsShinhanPrivateEquityFundMember 2022-01-01 2022-12-31 0001263043 shg:AssociatesKnt2ndPrivateEquityFundMember 2022-01-01 2022-12-31 0001263043 shg:AssociatesClBuyout1stPefMember 2022-01-01 2022-12-31 0001263043 shg:AssociatesCapstoneReitsNo.26Member 2022-01-01 2022-12-31 0001263043 shg:AssociatesJbHwaseongHadongReitsNo.53Member 2022-01-01 2022-12-31 0001263043 shg:AssociatesRhinosPremierMezzaninePrivateInvestmentFundNo.1Member 2022-01-01 2022-12-31 0001263043 shg:AssociatesJbIncheonBucheonReitsNo.54Member 2022-01-01 2022-12-31 0001263043 shg:AssociatesTresyujinTrustMember 2022-01-01 2022-12-31 0001263043 shg:AssociatesShinhanVcTomorrowVentureFund1Member 2022-01-01 2022-12-31 0001263043 shg:AssociatesShRealEstateLoanInvestmentTypePrivateRealEstateInvestmentTrustNo.2Member 2022-01-01 2022-12-31 0001263043 shg:AssociatesKbOaktreeTrustNo.3Member 2022-01-01 2022-12-31 0001263043 shg:AssociatesHighland20218FundMember 2022-01-01 2022-12-31 0001263043 shg:AssociatesPartners4thGrowthInvestmentFundMember 2022-01-01 2022-12-31 0001263043 shg:AssociatesShinhanMidasDongaSecondaryFundMember 2022-01-01 2022-12-31 0001263043 shg:AssociatesShinhanNeopluxEnergyNewbizFundMember 2022-01-01 2022-12-31 0001263043 shg:AssociatesShinhanAlbatrossTechInvestmentFundMember 2022-01-01 2022-12-31 0001263043 shg:AssociatesKTBNewlakeGlobalHealthcarePEFMember 2022-01-01 2022-12-31 0001263043 shg:AssociatesBNPParibasCardifLifeInsuranceMember 2022-01-01 2022-12-31 0001263043 shg:AssociatesVogoDebtStrategyQualifiedIvPrivateMember 2022-01-01 2022-12-31 0001263043 shg:AssociatesSongrimPartnersMember 2022-01-01 2022-12-31 0001263043 shg:AssociatesKoramcoEuropeCorePrivatePlacementRealEstateFundNo2and2Member 2022-01-01 2022-12-31 0001263043 shg:AssociatesHermesPrivateInvestmentEquityFundMember 2022-01-01 2022-12-31 0001263043 shg:AssociatesPartnerOneValueUpIPrivateEquityFundMember 2022-01-01 2022-12-31 0001263043 shg:AssociatesShMainProfessionalInvestmentTypePrivateMixedAssetInvestmentTrustNo.3Member 2022-01-01 2022-12-31 0001263043 shg:AssociatesOneShinhanGlobalFund1Member 2022-01-01 2022-12-31 0001263043 shg:AssociatesNHAmundiGlobalInfrastructureTrust14Member 2022-01-01 2022-12-31 0001263043 shg:AssociatesJarvisMemorialPrivateInvestmentTrust1Member 2022-01-01 2022-12-31 0001263043 shg:AssociatesMidasAssetGlobalCREDebtPrivateFundNo6Member 2022-01-01 2022-12-31 0001263043 shg:AssociatesKiwoomShinhanInnovationFundIMember 2022-01-01 2022-12-31 0001263043 shg:AssociatesEHealthcareInvestmentFundNo6Member 2022-01-01 2022-12-31 0001263043 shg:AssociatesGenesisNo1PrivateEquityFundMember 2022-01-01 2022-12-31 0001263043 shg:AssociatesAIPEUROGREENPrivateRealEstateInvestmentTrustNo3Member 2022-01-01 2022-12-31 0001263043 shg:AssociatesShinhanNvestorLiquiditySolutionFundMember 2022-01-01 2022-12-31 0001263043 shg:AssociatesShinhanPraxisKGrowthGlobalPrivateEquityFundMember 2022-01-01 2022-12-31 0001263043 shg:AssociatesGenesisNorthAmericaPowerCompanyNo1PEFMember 2022-01-01 2022-12-31 0001263043 shg:AssociatesShSeniorLoanProfessionalInvestmentTypePrivateMixedAssetInvestmentTrustNo.3Member 2022-01-01 2022-12-31 0001263043 shg:AssociatesSamchullyMidstreamPrivatePlacementSpecialAssetFund54Member 2022-01-01 2022-12-31 0001263043 shg:AssociatesDaishinKTNewTechnologyInvestmentFundMember 2022-01-01 2022-12-31 0001263043 shg:AssociatesKBNAHickoryPrivateSpecialAssetFundMember 2022-01-01 2022-12-31 0001263043 shg:AssociatesIGISGlobalCreditFund1501Member 2022-01-01 2022-12-31 0001263043 shg:AssociatesAIPTransportationSpecializedPrivatelyPlacedFundTrust1Member 2022-01-01 2022-12-31 0001263043 shg:AssociatesSooDeliveryPlatformGrowthFundMember 2022-01-01 2022-12-31 0001263043 shg:AssociatesKoreaOmegaProjectFundIIIMember 2022-01-01 2022-12-31 0001263043 shg:AssociatesKiwoomMilestoneProfessionalPrivateRealEstateTrust19Member 2022-01-01 2022-12-31 0001263043 shg:AssociatesShinhanAIMFoFFund1aMember 2022-01-01 2022-12-31 0001263043 shg:MilestonePrivateRealEstateFund3Member 2022-01-01 2022-12-31 0001263043 shg:AssociatesNomuraRifaPrivateRealEstateInvestmentTrust31Member 2022-01-01 2022-12-31 0001263043 shg:AssociatesVestasQualifiedInvestorsPrivateRealEstateFundInvestmentTrustNo37Member 2022-01-01 2022-12-31 0001263043 shg:AssociatesCapeITFundNo3Member 2022-01-01 2022-12-31 0001263043 shg:AssociatesSBCPFVCoLtdMember 2022-01-01 2022-12-31 0001263043 shg:ShBnctProfessionalInvestmentTypePrivateSpecialAssetInvestmentTrustMember 2022-01-01 2022-12-31 0001263043 shg:AssociatesBNWTechInnovationPrivateEquityFundMember 2022-01-01 2022-12-31 0001263043 shg:AssociatesAIPEUROPRIVATEREALESTATETRUSTNo12Member 2022-01-01 2022-12-31 0001263043 shg:AssociatesShinhanHealthcareFund2Member 2022-01-01 2022-12-31 0001263043 shg:AssociatesVogoRealtyPartnersPrivateRealEstateFundVMember 2022-01-01 2022-12-31 0001263043 shg:AssociatesGoduckGangil1PFVCoLtdMember 2022-01-01 2022-12-31 0001263043 shg:AssociatesPebblestoneCGVPrivateRealEstateTrustNo1Member 2022-01-01 2022-12-31 0001263043 shg:AssociatesFidelisGlobalPrivateRealEstateTrustNo2Member 2022-01-01 2022-12-31 0001263043 shg:AssociatesWWGGlobalRealEstateInvestmentTrustno4Member 2022-01-01 2022-12-31 0001263043 shg:AssociatesKoreaCreditBureauMember 2022-01-01 2022-12-31 0001263043 shg:AssociatesFuturePlayShinhanTechInnovationFund1Member 2022-01-01 2022-12-31 0001263043 shg:AssociatesGoduckGangil10PfvCo.LtdMember 2022-01-01 2022-12-31 0001263043 shg:AssociatesNHamundiGlobalInfraPrivateFund16Member 2022-01-01 2022-12-31 0001263043 shg:AssociatesIGISRealestatePrivateInvestmentTrustNo33Member 2022-01-01 2022-12-31 0001263043 shg:AssociatesStonebridgeCorporate1stFundMember 2022-01-01 2022-12-31 0001263043 shg:AssociatesHANAAlternativeEstateProfessionalPrivate122Member 2022-01-01 2022-12-31 0001263043 shg:AssociatesIMMGlobalPrivateEquityFundMember 2022-01-01 2022-12-31 0001263043 shg:AssociatesSparklabsShinhanOpportunityFund1Member 2022-01-01 2022-12-31 0001263043 shg:AssociatesDeutscheGlobalProfessionalInvestmentTypePrivateRealEstateInvestmentTrustNo24Member 2022-01-01 2022-12-31 0001263043 shg:ShCorporateProfessionalInvestmentTypePrivateSecurityInvestmentTrustNo.7Member 2022-01-01 2022-12-31 0001263043 shg:AssociatesShinhanAIMRealEstateFundNo1Member 2022-01-01 2022-12-31 0001263043 shg:ShGlobalInfrastructureProfessionalInvestmentTypePrivateSpecialAssetInvestmentTrustNo.72Member 2022-01-01 2022-12-31 0001263043 shg:AssociatesShCorporateProfessionalInvestmentTypePrivateSecurityInvestmentTrustNo.45Member 2022-01-01 2022-12-31 0001263043 shg:ShDaeguGreenPowerCogenerationSystemProfessionalInvestmentTypePrivateSpecialAssetInvestmentTrustMember 2022-01-01 2022-12-31 0001263043 shg:AssociatesShinhanAIMRealEstateFundNo2Member 2022-01-01 2022-12-31 0001263043 shg:ShSangjuYcExpresswayProfessionalInvestmentTypePrivateSpecialAssetInvestmentTrustMember 2022-01-01 2022-12-31 0001263043 shg:AssociatesStBonanjaFoodTechMember 2022-01-01 2022-12-31 0001263043 shg:AssociatesAoneMezzanineOpportunityProfessionalPrivateMember 2022-01-01 2022-12-31 0001263043 shg:ShbnppJapanPhotovoltaicPrivateSpecialAssetInvestmentTrustNo.2Member 2022-01-01 2022-12-31 0001263043 shg:AssociatesKakaoShinhan1stTNYTFundMember 2022-01-01 2022-12-31 0001263043 shg:AssociatesPacificPrivatePlacementRealEstateFundNo40Member 2022-01-01 2022-12-31 0001263043 shg:AssociatesIMMSpecialSituation12PRIVATEEQUITYFUNDMember 2022-01-01 2022-12-31 0001263043 shg:AssociatesNHAmundiUSInfrastructurePrivateFund2Member 2022-01-01 2022-12-31 0001263043 shg:AssociatesVSCornerstoneFundMember 2022-01-01 2022-12-31 0001263043 shg:AssociatesKBDistributionPrivateRealEstate1Member 2022-01-01 2022-12-31 0001263043 shg:SamsungSraRealEstateProfessionalPrivate45Member 2022-01-01 2022-12-31 0001263043 shg:AssociatesIBKGlobalNewRenewableEnergySpecialAssetProfessionalPrivate2Member 2022-01-01 2022-12-31 0001263043 shg:AssociatesKoreaOmegaShinhanProjectFundIMember 2022-01-01 2022-12-31 0001263043 shg:AssociatesJRAMCHungaryBudapestOfficeFund16Member 2022-01-01 2022-12-31 0001263043 shg:AssociatesAIONELFISPROFESSIONALPRIVATE1Member 2022-01-01 2022-12-31 0001263043 shg:AssociatesNeopluxMarketFrontierSecondaryFundMember 2022-01-01 2022-12-31 0001263043 shg:AssociatesHarvestPrivateEquityFundIiMember 2022-01-01 2022-12-31 0001263043 shg:AssociatesDaishinNewTechnologyInvestmentFund5thMember 2022-01-01 2022-12-31 0001263043 shg:AssociatesCSQUARESNIPERPROFESSIONALPRIVATE10Member 2022-01-01 2022-12-31 0001263043 shg:AssociatesSynergyGreenNewDeal1stNewTechnologyBusinessInvestmentFundMember 2022-01-01 2022-12-31 0001263043 shg:AssociatesPCCAmberstonePrivateEquityFundIMember 2022-01-01 2022-12-31 0001263043 shg:AssociatesNewWave6thFundMember 2022-01-01 2022-12-31 0001263043 shg:AssociatesKAIMRealestatePrivateInvestmentTrust20Member 2022-01-01 2022-12-31 0001263043 shg:AssociatesKIAMCOVietnamSolarSpecialAssetPrivateInvestmentTrustMember 2022-01-01 2022-12-31 0001263043 shg:AssociatesKIAMCOPOWERLOANTRUST4THMember 2022-01-01 2022-12-31 0001263043 ifrs-full:GuaranteesMember ifrs-full:FinancialInstrumentsCreditimpairedMember 2022-01-01 2022-12-31 0001263043 ifrs-full:GuaranteesMember 2022-01-01 2022-12-31 0001263043 ifrs-full:PropertyPlantAndEquipmentMember 2022-01-01 2022-12-31 0001263043 shg:RealEstateMember ifrs-full:LifetimeExpectedCreditLossesMember 2022-01-01 2022-12-31 0001263043 ifrs-full:GuaranteesMember ifrs-full:LifetimeExpectedCreditLossesMember 2022-01-01 2022-12-31 0001263043 shg:RealEstateMember 2022-01-01 2022-12-31 0001263043 shg:SecuritiesMember ifrs-full:LifetimeExpectedCreditLossesMember 2022-01-01 2022-12-31 0001263043 ifrs-full:TwelvemonthExpectedCreditLossesMember 2022-01-01 2022-12-31 0001263043 ifrs-full:LifetimeExpectedCreditLossesMember 2022-01-01 2022-12-31 0001263043 shg:DepositsMember 2022-01-01 2022-12-31 0001263043 shg:RealEstateMember ifrs-full:TwelvemonthExpectedCreditLossesMember 2022-01-01 2022-12-31 0001263043 shg:SecuritiesMember 2022-01-01 2022-12-31 0001263043 ifrs-full:PropertyPlantAndEquipmentMember ifrs-full:FinancialInstrumentsCreditimpairedMember 2022-01-01 2022-12-31 0001263043 shg:OtherFinancialAssetsMember ifrs-full:FinancialInstrumentsCreditimpairedMember 2022-01-01 2022-12-31 0001263043 shg:OtherFinancialAssetsMember 2022-01-01 2022-12-31 0001263043 ifrs-full:PropertyPlantAndEquipmentMember ifrs-full:LifetimeExpectedCreditLossesMember 2022-01-01 2022-12-31 0001263043 ifrs-full:GuaranteesMember ifrs-full:TwelvemonthExpectedCreditLossesMember 2022-01-01 2022-12-31 0001263043 shg:RealEstateMember ifrs-full:FinancialInstrumentsCreditimpairedMember 2022-01-01 2022-12-31 0001263043 shg:DepositsMember ifrs-full:LifetimeExpectedCreditLossesMember 2022-01-01 2022-12-31 0001263043 ifrs-full:FinancialInstrumentsCreditimpairedMember 2022-01-01 2022-12-31 0001263043 shg:SecuritiesMember ifrs-full:FinancialInstrumentsCreditimpairedMember 2022-01-01 2022-12-31 0001263043 shg:DepositsMember ifrs-full:TwelvemonthExpectedCreditLossesMember 2022-01-01 2022-12-31 0001263043 shg:SecuritiesMember ifrs-full:TwelvemonthExpectedCreditLossesMember 2022-01-01 2022-12-31 0001263043 ifrs-full:PropertyPlantAndEquipmentMember ifrs-full:TwelvemonthExpectedCreditLossesMember 2022-01-01 2022-12-31 0001263043 ifrs-full:TwelvemonthExpectedCreditLossesMember shg:OtherFinancialAssetsMember 2022-01-01 2022-12-31 0001263043 shg:DepositsMember ifrs-full:FinancialInstrumentsCreditimpairedMember 2022-01-01 2022-12-31 0001263043 ifrs-full:HedgesOfNetInvestmentInForeignOperationsMember 2022-01-01 2022-12-31 0001263043 ifrs-full:CashFlowHedgesMember ifrs-full:InterestRateRiskMember 2022-01-01 2022-12-31 0001263043 ifrs-full:HedgesOfNetInvestmentInForeignOperationsMember shg:ForeignExchangeRiskMember 2022-01-01 2022-12-31 0001263043 ifrs-full:CashFlowHedgesMember shg:ForeignExchangeRiskMember 2022-01-01 2022-12-31 0001263043 shg:LoanReceivablesMeasuredAtFVTPLMember 2022-01-01 2022-12-31 0001263043 shg:DueFromBanksAtFVTPLMember 2022-01-01 2022-12-31 0001263043 ifrs-full:CommodityPriceRiskMember 2022-01-01 2022-12-31 0001263043 ifrs-full:InterestRateSwapContractMember 2022-01-01 2022-12-31 0001263043 shg:ForeignExchangeRiskMember 2022-01-01 2022-12-31 0001263043 ifrs-full:EquityAttributableToOwnersOfParentMember 2022-01-01 2022-12-31 0001263043 ifrs-full:NoncontrollingInterestsMember 2022-01-01 2022-12-31 0001263043 ifrs-full:AccumulatedOtherComprehensiveIncomeMember 2022-01-01 2022-12-31 0001263043 ifrs-full:IssuedCapitalMember 2022-01-01 2022-12-31 0001263043 shg:HybridBondsMember 2022-01-01 2022-12-31 0001263043 shg:CapitalSurplusMember 2022-01-01 2022-12-31 0001263043 shg:CapitalAdjustmentsMember 2022-01-01 2022-12-31 0001263043 ifrs-full:RetainedEarningsMember 2022-01-01 2022-12-31 0001263043 ifrs-full:FinancialLiabilitiesAtFairValueThroughProfitOrLossDesignatedUponInitialRecognitionCategoryMember 2022-01-01 2022-12-31 0001263043 ifrs-full:OtherAssetsMember 2022-01-01 2022-12-31 0001263043 shg:LoansAtAmortizedCostMember 2022-01-01 2022-12-31 0001263043 ifrs-full:LandMember 2022-01-01 2022-12-31 0001263043 ifrs-full:OtherPropertyPlantAndEquipmentMember 2022-01-01 2022-12-31 0001263043 ifrs-full:BuildingsMember 2022-01-01 2022-12-31 0001263043 ifrs-full:RightofuseAssetsMember 2022-01-01 2022-12-31 0001263043 shg:NetGainLossOnDisposalOfFinancialAssetsAtFairValueThroughProfitOrLossMember 2022-01-01 2022-12-31 0001263043 shg:NetGainLossOnValuationOfFinancialAssetsAtFairValueThroughProfitOrLossMember 2022-01-01 2022-12-31 0001263043 ifrs-full:LifetimeExpectedCreditLossesMember shg:DebtSecuritiesAtAmortisedCostMember 2022-01-01 2022-12-31 0001263043 ifrs-full:LifetimeExpectedCreditLossesMember ifrs-full:FinancialAssetsAtFairValueThroughOtherComprehensiveIncomeCategoryMember 2022-01-01 2022-12-31 0001263043 shg:DebtSecuritiesAtAmortisedCostMember 2022-01-01 2022-12-31 0001263043 ifrs-full:TwelvemonthExpectedCreditLossesMember shg:DebtSecuritiesAtAmortisedCostMember 2022-01-01 2022-12-31 0001263043 ifrs-full:TwelvemonthExpectedCreditLossesMember ifrs-full:FinancialAssetsAtFairValueThroughOtherComprehensiveIncomeCategoryMember 2022-01-01 2022-12-31 0001263043 ifrs-full:GoodwillMember 2022-01-01 2022-12-31 0001263043 ifrs-full:ComputerSoftwareMember 2022-01-01 2022-12-31 0001263043 ifrs-full:IntangibleAssetsUnderDevelopmentMember 2022-01-01 2022-12-31 0001263043 ifrs-full:OtherIntangibleAssetsMember 2022-01-01 2022-12-31 0001263043 shg:CashAndCashEquivalentsMember 2022-01-01 2022-12-31 0001263043 shg:GeneralAssetRiskMember 2022-01-01 2022-12-31 0001263043 shg:FurnitureAndFixturesMember 2022-01-01 2022-12-31 0001263043 shg:DirectorsAndOfficersLiabilityInsuranceMember 2022-01-01 2022-12-31 0001263043 shg:EmployeesMember 2022-01-01 2022-12-31 0001263043 shg:CashAndSecuritiesMember 2022-01-01 2022-12-31 0001263043 shg:SecuritiesFidelityGuaranteeAndLiabilityInsuranceAndOthersMember 2022-01-01 2022-12-31 0001263043 shg:ShareOfOtherComprehensiveIncomeOfAssociatesAndJointVenturesAccountedForUsingEquityMethodThatWillBeReclassifiedToProfitOrLossNetOfTaxMember 2022-01-01 2022-12-31 0001263043 shg:OtherComprehensiveIncomeNetOfSeparateAccountMember 2022-01-01 2022-12-31 0001263043 shg:ShinhanEzGeneralInsuranceLtdMember 2022-01-01 2022-12-31 0001263043 shg:AssociatesStonebridgeShinhanUnicornSecondaryFundMember 2022-01-01 2022-12-31 0001263043 shg:AssociatesShinhanKunicornFirstFundMember 2022-01-01 2022-12-31 0001263043 shg:ShinhanmidasDongaSecondaryFundMember 2022-01-01 2022-12-31 0001263043 shg:AssociatesSynergyShinhanMezzanineNewTechnologyInvestmentFundMember 2022-01-01 2022-12-31 0001263043 shg:AssociatesSHCK2GlobalMaterialFundMember 2022-01-01 2022-12-31 0001263043 shg:AssociatesShinhanAlbatrossGrowthFundMember 2022-01-01 2022-12-31 0001263043 shg:AssociatesGXSHINHANINTEREST1stPrivateEquityFundMember 2022-01-01 2022-12-31 0001263043 shg:AssociatesShinhanPSInvestmentFundNo1Member 2022-01-01 2022-12-31 0001263043 shg:AssociatesSHCULMUSFundNo1Member 2022-01-01 2022-12-31 0001263043 shg:AssociatesShinhanNvestorLiquiditySolutionFundMember 2022-01-01 2022-12-31 0001263043 shg:AssociatesSHINHANCORETRENDGLOBALFUND1Member 2022-01-01 2022-12-31 0001263043 shg:AssociatesKiwoomShinhanInnovationFundIMember 2022-01-01 2022-12-31 0001263043 shg:AssociatesOneShinhanGlobalFund1Member 2022-01-01 2022-12-31 0001263043 shg:OpenShinhanPortfolioInvestmentAssociationNo.1Member 2022-01-01 2022-12-31 0001263043 shg:AssociatesFuturePlayShinhanTechInnovationFund1Member 2022-01-01 2022-12-31 0001263043 shg:AssociatesKoreaCreditBureauMember 2022-01-01 2022-12-31 0001263043 shg:AssociatesSBCPFVCoLtdMember 2022-01-01 2022-12-31 0001263043 shg:IGISPRIVATEREALESTATETRUSTNO331Member 2022-01-01 2022-12-31 0001263043 shg:AssociatesKoreaFinanceSecurityMember 2022-01-01 2022-12-31 0001263043 shg:AssociatesShinhanRhinos1FundMember 2022-01-01 2022-12-31 0001263043 shg:AssociatesShinHanSooYoungEntrepreneurInvestmentFundNo1Member 2022-01-01 2022-12-31 0001263043 shg:AssociatesSHBNPPMAINProfessionalInvestmentTypePrivateMixedAssetInvestmentTrustNo3Member 2022-01-01 2022-12-31 0001263043 shg:KoreaOmegaProjectFundIMember 2022-01-01 2022-12-31 0001263043 shg:NewGreenShinhanMezzanineFundMember 2022-01-01 2022-12-31 0001263043 shg:EDNCENTRALCoLtdMember 2022-01-01 2022-12-31 0001263043 shg:Kakao-Shinhan1stTNYTFundMember 2022-01-01 2022-12-31 0001263043 shg:NeopluxMarketFrontierSecondaryFundMember 2022-01-01 2022-12-31 0001263043 shg:FutureCreationNeopluxVentureCapitalFundMember 2022-01-01 2022-12-31 0001263043 shg:KoFCNeopluxRDBizCreation20131InvestmentMember 2022-01-01 2022-12-31 0001263043 shg:ShinhanWesternTDConsignmentManagementRealEstateInvestmentCoLtdMember 2022-01-01 2022-12-31 0001263043 shg:JsShinhanPrivateEquityFundMember 2022-01-01 2022-12-31 0001263043 shg:UlmusShcInnovationInvestmentFundMember 2022-01-01 2022-12-31 0001263043 shg:SwkshinhanNewTechnologyInvestmentFund1stMember 2022-01-01 2022-12-31 0001263043 shg:ShinhanVcTomorrowVentureFund1Member 2022-01-01 2022-12-31 0001263043 shg:ShinhanTimeMezzanineBlindFundMember 2022-01-01 2022-12-31 0001263043 shg:EtriHoldingsShinhan1stUnicornFundMember 2022-01-01 2022-12-31 0001263043 shg:AssociatesKiwoomShinhanInnovationFund2Member 2022-01-01 2022-12-31 0001263043 shg:ReverentShinhanVistaFundMember 2022-01-01 2022-12-31 0001263043 shg:ShinhanNeoMarketfrontier2ndFundMember 2022-01-01 2022-12-31 0001263043 shg:ShinhanSmilegateGlobalPefIMember 2022-01-01 2022-12-31 0001263043 shg:ShinhanNeopluxEnergyNewbizFundMember 2022-01-01 2022-12-31 0001263043 shg:PacificSunnyProfessionalInvestorsPrivatePlacementRealEstateInvestmentCompanyNo45Member 2022-01-01 2022-12-31 0001263043 shg:NewWave6thFundMember 2022-01-01 2022-12-31 0001263043 shg:SHINHANNEOCoreIndustrialTechnologyFundMember 2022-01-01 2022-12-31 0001263043 shg:KTCNPGrowthChamp20112PrivateEquityFundMember 2022-01-01 2022-12-31 0001263043 shg:NeopluxNo3PrivateEquityFundMember 2022-01-01 2022-12-31 0001263043 shg:GyeonggiNeopluxSupermanFundMember 2022-01-01 2022-12-31 0001263043 shg:Sparklabs-ShinhanOpportunityFund1Member 2022-01-01 2022-12-31 0001263043 shg:AssociatesShinhanPraxisKGrowthGlobalPrivateEquityFundMember 2022-01-01 2022-12-31 0001263043 shg:AssociatesBNPParibasCardifLifeInsuranceMember 2022-01-01 2022-12-31 0001263043 shg:AssociatesSMNewTechnologyBusinessInvestmentFund1Member 2022-01-01 2022-12-31 0001263043 shg:ShinhansneakPeekBiohealthcareBounceBackFundMember 2022-01-01 2022-12-31 0001263043 shg:ShinhanisquareVentureFund1stMember 2022-01-01 2022-12-31 0001263043 shg:ShinhanquantumStartupFundMember 2022-01-01 2022-12-31 0001263043 shg:AssociatesShinhanSimoneFundIMember 2022-01-01 2022-12-31 0001263043 shg:AssociatesShinhanFitrin1stTechnologyBusinessInvestmentAssociationMember 2022-01-01 2022-12-31 0001263043 shg:AssociatesLogisvalleyShinhanReitCo.ltd.Member 2022-01-01 2022-12-31 0001263043 shg:ShinhandevHealthcareFundIMember 2022-01-01 2022-12-31 0001263043 shg:AssociatesShinhanCognitiveStartupFundL.p.Member 2022-01-01 2022-12-31 0001263043 shg:GlobalCommerceFundMember 2022-01-01 2022-12-31 0001263043 shg:ShinhanhgiSocialEnterpriseFundMember 2022-01-01 2022-12-31 0001263043 shg:ShinhanwwgEnergyFundNewTechnologyVentureInvestmentFundMember 2022-01-01 2022-12-31 0001263043 shg:IgisshinhanNewTechnologyFund1Member 2022-01-01 2022-12-31 0001263043 shg:Shinhang.n.techSmartInnovationFundMember 2022-01-01 2022-12-31 0001263043 shg:AssociatesShSustainableManagementEsgShortTermBondSecurityFeederInvestmentTrustNo.1Member 2022-01-01 2022-12-31 0001263043 shg:ShGlobalNetZeroSolutionSecurityInvestmentTrustMember 2022-01-01 2022-12-31 0001263043 shg:DsShinhanContentInvestmentFund1Member 2022-01-01 2022-12-31 0001263043 shg:ShinhanTime1stInvestmentFundMember 2022-01-01 2022-12-31 0001263043 shg:ShinhanSgcEsgFundNo.1Member 2022-01-01 2022-12-31 0001263043 shg:GoduckGangil10PFVCoLtdMember 2022-01-01 2022-12-31 0001263043 ifrs-full:FinancialAssetsAtFairValueThroughProfitOrLossCategoryMember 2022-01-01 2022-12-31 0001263043 shg:DerivativeAssetsAndLiabilitiesHeldForHedgingMember 2022-01-01 2022-12-31 0001263043 shg:DerivativeAssetsAndLiabilitiesHeldForTradingMember 2022-01-01 2022-12-31 0001263043 ifrs-full:Level2OfFairValueHierarchyMember ifrs-full:DebtSecuritiesMember 2022-01-01 2022-12-31 0001263043 shg:OtherFinancialAssetsMember ifrs-full:Level2OfFairValueHierarchyMember 2022-01-01 2022-12-31 0001263043 ifrs-full:Level3OfFairValueHierarchyMember ifrs-full:FinancialAssetsAtAmortisedCostMember 2022-01-01 2022-12-31 0001263043 ifrs-full:Level2OfFairValueHierarchyMember shg:DueFromBanksAtAmortizedCostMember 2022-01-01 2022-12-31 0001263043 ifrs-full:Level3OfFairValueHierarchyMember shg:LoansAtAmortizedCostMember 2022-01-01 2022-12-31 0001263043 ifrs-full:Level2OfFairValueHierarchyMember shg:OtherFinancialLiabilitiesMember 2022-01-01 2022-12-31 0001263043 ifrs-full:Level2OfFairValueHierarchyMember shg:DepositsMember 2022-01-01 2022-12-31 0001263043 ifrs-full:Level3OfFairValueHierarchyMember shg:BorrowingsMember 2022-01-01 2022-12-31 0001263043 ifrs-full:Level2OfFairValueHierarchyMember shg:BorrowingsMember 2022-01-01 2022-12-31 0001263043 ifrs-full:Level3OfFairValueHierarchyMember shg:OtherFinancialAssetsMember 2022-01-01 2022-12-31 0001263043 ifrs-full:Level3OfFairValueHierarchyMember shg:DepositsMember 2022-01-01 2022-12-31 0001263043 ifrs-full:Level3OfFairValueHierarchyMember shg:OtherFinancialLiabilitiesMember 2022-01-01 2022-12-31 0001263043 ifrs-full:Level2OfFairValueHierarchyMember ifrs-full:FinancialAssetsAtAmortisedCostMember 2022-01-01 2022-12-31 0001263043 ifrs-full:Level3OfFairValueHierarchyMember ifrs-full:DebtSecuritiesMember 2022-01-01 2022-12-31 0001263043 ifrs-full:Level2OfFairValueHierarchyMember shg:LoansAtAmortizedCostMember 2022-01-01 2022-12-31 0001263043 shg:ShbnppSangjuYcExpresswayProfessionalInvestmentTypePrivateSpecialAssetInvestmentTrustMember 2022-01-01 2022-12-31 0001263043 shg:ShbnppGlobalInfrastructureProfessionalInvestmentTypePrivateSpecialAssetInvestmentTrustNo.7To2UsdMember 2022-01-01 2022-12-31 0001263043 shg:ShbnppDaeguGreenPowerCogenerationSystemProfessionalInvestmentTypePrivateSpecialAssetInvestmentTrustMember 2022-01-01 2022-12-31 0001263043 shg:ShbnppSeniorLoanProfessionalInvestmentTypePrivateMixedAssetInvestmentTrustNo.2Member 2022-01-01 2022-12-31 0001263043 shg:AssociatesShinHanSooYoungEntrepreneurInvestmentFundNo1Member 2022-01-01 2022-12-31 0001263043 shg:VogoDebtStrategyQualifiedInvPrivateMember 2022-01-01 2022-12-31 0001263043 ifrs-full:InterestRateSwapContractMember ifrs-full:ReserveOfCashFlowHedgesMember 2022-01-01 2022-12-31 0001263043 shg:HedgeOfNetInvestmentMember ifrs-full:ForwardContractMember 2022-01-01 2022-12-31 0001263043 ifrs-full:LongtermBorrowingsMember shg:HedgeOfNetInvestmentMember 2022-01-01 2022-12-31 0001263043 ifrs-full:FairValueHedgesMember ifrs-full:InterestRateSwapContractMember 2022-01-01 2022-12-31 0001263043 ifrs-full:FairValueHedgesMember ifrs-full:ForwardContractMember 2022-01-01 2022-12-31 0001263043 ifrs-full:ReserveOfCashFlowHedgesMember ifrs-full:ForwardContractMember 2022-01-01 2022-12-31 0001263043 ifrs-full:ReserveOfCashFlowHedgesMember ifrs-full:CurrencySwapContractMember 2022-01-01 2022-12-31 0001263043 shg:AssociatesSimoneMezzanineFundNo3Member 2022-01-01 2022-12-31 0001263043 shg:ShbnppBnctProfessionalInvestmentTypePrivateSpecialAssetInvestmentTrustMember 2022-01-01 2022-12-31 0001263043 shg:AssociatesRifaRealEstatePrivatePlacementFundForNormalInvestorsNo.31Member 2022-01-01 2022-12-31 0001263043 shg:AssociatesSHBNPPSeniorLoanProfessionalInvestmentTypePrivateMixedAssetInvestmentTrustNo3Member 2022-01-01 2022-12-31 0001263043 shg:ShinhanEzGeneralInsuranceLtdMember 2022-01-01 2022-12-31 0001263043 shg:ShbnppCorporateProfessionalInvestmentTypePrivateSecurityInvestmentTrustNo.7Member 2022-01-01 2022-12-31 0001263043 shg:AssociatesOthers2022Member 2022-01-01 2022-12-31 0001263043 shg:PureProtectionMember 2022-01-01 2022-12-31 0001263043 shg:GroupPoliciesMember 2022-01-01 2022-12-31 0001263043 shg:EndowmentMember 2022-01-01 2022-12-31 0001263043 shg:IndividualPoliciesMember 2022-01-01 2022-12-31 0001263043 shg:PureEndowmentMember 2022-01-01 2022-12-31 0001263043 shg:DeathMember 2022-01-01 2022-12-31 0001263043 shg:AutomotiveMember 2022-01-01 2022-12-31 0001263043 shg:SavingsMember 2022-01-01 2022-12-31 0001263043 shg:GeneralInsuranceMember 2022-01-01 2022-12-31 0001263043 shg:LongtermMember 2022-01-01 2022-12-31 0001263043 shg:GeneralMember 2022-01-01 2022-12-31 0001263043 ifrs-full:LifeInsuranceContractsMember ifrs-full:FloatingInterestRateMember 2022-01-01 2022-12-31 0001263043 ifrs-full:LifeInsuranceContractsMember 2022-01-01 2022-12-31 0001263043 ifrs-full:NonlifeInsuranceContractsMember shg:AutomotiveMember 2022-01-01 2022-12-31 0001263043 ifrs-full:NonlifeInsuranceContractsMember 2022-01-01 2022-12-31 0001263043 ifrs-full:NonlifeInsuranceContractsMember shg:LongtermMember 2022-01-01 2022-12-31 0001263043 ifrs-full:NonlifeInsuranceContractsMember shg:GeneralMember 2022-01-01 2022-12-31 0001263043 ifrs-full:LifeInsuranceContractsMember ifrs-full:FixedInterestRateMember 2022-01-01 2022-12-31 0001263043 ifrs-full:FinancialAssetsAtFairValueThroughOtherComprehensiveIncomeCategoryMember 2022-01-01 2022-12-31 0001263043 shg:DebtSecuritiesAtAmortisedCostMember 2022-01-01 2022-12-31 0001263043 ifrs-full:PreferenceSharesMember 2022-01-01 2022-12-31 0001263043 ifrs-full:OrdinarySharesMember 2022-01-01 2022-12-31 0001263043 ifrs-full:RightofuseAssetsMember ifrs-full:OtherAssetsMember 2022-01-01 2022-12-31 0001263043 ifrs-full:VehiclesMember ifrs-full:RightofuseAssetsMember 2022-01-01 2022-12-31 0001263043 ifrs-full:LandAndBuildingsMember ifrs-full:RightofuseAssetsMember 2022-01-01 2022-12-31 0001263043 ifrs-full:RightofuseAssetsMember 2022-01-01 2022-12-31 0001263043 shg:SecuritiesAtFVTPLMember 2022-01-01 2022-12-31 0001263043 shg:AssociatesIMMGlobalPrivateEquityFundMember 2022-01-01 2022-12-31 0001263043 shg:IpixelCoLtdMember 2022-01-01 2022-12-31 0001263043 ifrs-full:OtherRelatedPartiesMember 2022-01-01 2022-12-31 0001263043 shg:NomuraRifaPrivateRealEstateInvestmentTrustNo.19Member 2022-01-01 2022-12-31 0001263043 shg:AssociatesGoduckGangil1PFVCoLtdMember 2022-01-01 2022-12-31 0001263043 shg:KTCNPGrowthChamp20112PrivateEquityFundMember 2022-01-01 2022-12-31 0001263043 shg:SHINHANNEOCoreIndustrialTechnologyFundMember 2022-01-01 2022-12-31 0001263043 shg:EDNCENTRALCoLtdMember 2022-01-01 2022-12-31 0001263043 shg:AssociatesShinhanGlobalHealthcareFund2Member 2022-01-01 2022-12-31 0001263043 shg:AssociatesShbnppMainProfessionalInvestmentTypePrivateMixedAssetInvestmentTrustNo.3Member 2022-01-01 2022-12-31 0001263043 shg:AssociateHIOTAFundMember 2022-01-01 2022-12-31 0001263043 shg:AssociateStonebridgeshinhanUnicornSecondaryFundMember 2022-01-01 2022-12-31 0001263043 shg:AccruedcontributionsMember 2022-01-01 2022-12-31 0001263043 ifrs-full:AllowanceForCreditLossesMember 2022-01-01 2022-12-31 0001263043 shg:AllowanceRelatedToAssetRevaluationMember 2022-01-01 2022-12-31 0001263043 ifrs-full:MiscellaneousOtherProvisionsMember 2022-01-01 2022-12-31 0001263043 shg:AccruedExpensesMember 2022-01-01 2022-12-31 0001263043 ifrs-full:NetAmountArisingFromInsuranceContractsMember 2022-01-01 2022-12-31 0001263043 ifrs-full:TemporaryDifferenceMember 2022-01-01 2022-12-31 0001263043 shg:FictitiousDividendMember 2022-01-01 2022-12-31 0001263043 shg:AllowanceForAcceptancesAndGuaranteeMember 2022-01-01 2022-12-31 0001263043 ifrs-full:OtherTemporaryDifferencesMember 2022-01-01 2022-12-31 0001263043 shg:ExtinguishmentOfDepositAndInsuranceLiabilitiesMember 2022-01-01 2022-12-31 0001263043 ifrs-full:PropertyPlantAndEquipmentMember 2022-01-01 2022-12-31 0001263043 ifrs-full:InvestmentsAccountedForUsingEquityMethodMember 2022-01-01 2022-12-31 0001263043 ifrs-full:PresentValueOfDefinedBenefitObligationMember 2022-01-01 2022-12-31 0001263043 ifrs-full:PlanAssetsMember 2022-01-01 2022-12-31 0001263043 shg:FinancialAssetsMeasureedAtFairValueMember 2022-01-01 2022-12-31 0001263043 shg:AccountsReceivableMember 2022-01-01 2022-12-31 0001263043 shg:AccruedIncomeMember 2022-01-01 2022-12-31 0001263043 shg:FinancialInstrumentsMeasuredAtFairValueThroughProfitOrLossMember 2022-01-01 2022-12-31 0001263043 shg:AllowanceForExpensingDepreciationMember 2022-01-01 2022-12-31 0001263043 shg:DepositsMember 2022-01-01 2022-12-31 0001263043 ifrs-full:DerivativesMember 2022-01-01 2022-12-31 0001263043 ifrs-full:FinancialAssetsAtFairValueThroughOtherComprehensiveIncomeCategoryMember 2022-01-01 2022-12-31 0001263043 shg:BorrowingsMember ifrs-full:Level2OfFairValueHierarchyMember 2022-01-01 2022-12-31 0001263043 ifrs-full:FinancialLiabilitiesMember 2022-01-01 2022-12-31 0001263043 shg:RecognisedInProfitOrLossMember ifrs-full:FinancialLiabilitiesAtFairValueThroughProfitOrLossDesignatedUponInitialRecognitionCategoryMember 2022-01-01 2022-12-31 0001263043 shg:RecognisedInProfitOrLossMember shg:DerivativeFinancialInstrumentsLiabilitiesMember 2022-01-01 2022-12-31 0001263043 shg:LoansAtAmortizedCostMember ifrs-full:ConsumerLoansMember ifrs-full:TwelvemonthExpectedCreditLossesMember 2022-01-01 2022-12-31 0001263043 shg:LoansAtAmortizedCostMember ifrs-full:ConsumerLoansMember ifrs-full:LifetimeExpectedCreditLossesMember 2022-01-01 2022-12-31 0001263043 shg:LoansAtAmortizedCostMember 2022-01-01 2022-12-31 0001263043 shg:LoansAtAmortizedCostMember shg:OtherFinancialAssetsMember ifrs-full:TwelvemonthExpectedCreditLossesMember 2022-01-01 2022-12-31 0001263043 shg:DueFromBanksAtAmortizedCostAndOtherFinancialAssetsMember ifrs-full:LifetimeExpectedCreditLossesMember 2022-01-01 2022-12-31 0001263043 shg:LoansAtAmortizedCostMember shg:OtherFinancialAssetsMember ifrs-full:LifetimeExpectedCreditLossesMember 2022-01-01 2022-12-31 0001263043 shg:LoansAtAmortizedCostMember shg:CreditCardReceivablesMember ifrs-full:FinancialInstrumentsCreditimpairedMember 2022-01-01 2022-12-31 0001263043 shg:LoansAtAmortizedCostMember shg:CreditCardReceivablesMember ifrs-full:TwelvemonthExpectedCreditLossesMember 2022-01-01 2022-12-31 0001263043 shg:LoansAtAmortizedCostMember ifrs-full:CorporateLoansMember ifrs-full:FinancialInstrumentsCreditimpairedMember 2022-01-01 2022-12-31 0001263043 ifrs-full:FinancialInstrumentsCreditimpairedMember shg:OtherFinancialAssetsMember shg:LoansAtAmortizedCostMember 2022-01-01 2022-12-31 0001263043 shg:LoansAtAmortizedCostMember ifrs-full:CorporateLoansMember ifrs-full:LifetimeExpectedCreditLossesMember 2022-01-01 2022-12-31 0001263043 shg:LoansAtAmortizedCostMember shg:CreditCardReceivablesMember ifrs-full:LifetimeExpectedCreditLossesMember 2022-01-01 2022-12-31 0001263043 shg:LoansAtAmortizedCostMember ifrs-full:ConsumerLoansMember ifrs-full:FinancialInstrumentsCreditimpairedMember 2022-01-01 2022-12-31 0001263043 ifrs-full:TwelvemonthExpectedCreditLossesMember ifrs-full:CorporateLoansMember shg:LoansAtAmortizedCostMember 2022-01-01 2022-12-31 0001263043 shg:DueFromBanksAtAmortizedCostAndOtherFinancialAssetsMember 2022-01-01 2022-12-31 0001263043 shg:DueFromBanksAtAmortizedCostAndOtherFinancialAssetsMember ifrs-full:TwelvemonthExpectedCreditLossesMember 2022-01-01 2022-12-31 0001263043 shg:DueFromBanksAtAmortizedCostAndOtherFinancialAssetsMember ifrs-full:FinancialInstrumentsCreditimpairedMember 2022-01-01 2022-12-31 0001263043 ifrs-full:TreasurySharesMember 2022-01-01 2022-12-31 0001263043 ifrs-full:FinancialLiabilitiesAtFairValueThroughProfitOrLossCategoryMember 2022-01-01 2022-12-31 0001263043 ifrs-full:CurrencyRiskMember 2022-01-01 2022-12-31 0001263043 ifrs-full:InterestRateRiskMember 2022-01-01 2022-12-31 0001263043 shg:UnusedCreditLineAndFinancialGuaranteeMember 2022-01-01 2022-12-31 0001263043 shg:AssociatesShinhanEzGeneralInsuranceLtd.Member 2022-01-01 2022-12-31 0001263043 ifrs-full:PropertyPlantAndEquipmentSubjectToOperatingLeasesMember 2022-01-01 2022-12-31 0001263043 shg:DebenturesMember 2022-01-01 2022-12-31 0001263043 ifrs-full:LeaseLiabilitiesMember 2022-01-01 2022-12-31 0001263043 ifrs-full:DerivativesMember 2022-01-01 2022-12-31 0001263043 shg:BorrowingsMember 2022-01-01 2022-12-31 0001263043 ifrs-full:FinancialLiabilitiesAtFairValueThroughProfitOrLossCategoryMember 2022-01-01 2022-12-31 0001263043 ifrs-full:CashFlowHedgesMember shg:DiscontinuationOfCashFlowHedgesMember 2022-01-01 2022-12-31 0001263043 shg:DebtSecuritiesIssuanceCostMember shg:ForeignCurrencyMember 2022-01-01 2022-12-31 0001263043 shg:DebtSecuritiesIssuanceCostMember shg:DomesticCurrencyMember 2022-01-01 2022-12-31 0001263043 shg:BondIssuanceCostsMember 2022-01-01 2022-12-31 0001263043 ifrs-full:FairValueHedgesMember shg:ForeignExchangeRiskMember 2022-01-01 2022-12-31 0001263043 ifrs-full:FairValueHedgesMember ifrs-full:InterestRateRiskMember 2022-01-01 2022-12-31 0001263043 ifrs-full:CashFlowHedgesMember shg:ForeignExchangeRiskMember 2022-01-01 2022-12-31 0001263043 ifrs-full:HedgesOfNetInvestmentInForeignOperationsMember shg:ForeignExchangeRiskMember 2022-01-01 2022-12-31 0001263043 ifrs-full:CashFlowHedgesMember ifrs-full:InterestRateRiskMember 2022-01-01 2022-12-31 0001263043 ifrs-full:LegalProceedingsProvisionMember 2022-01-01 2022-12-31 0001263043 ifrs-full:ProvisionForDecommissioningRestorationAndRehabilitationCostsMember 2022-01-01 2022-12-31 0001263043 shg:ProvisionExceptUnusedCreditCommitmentsAndFinancialGuaranteeContractsIssuedMember 2022-01-01 2022-12-31 0001263043 ifrs-full:GuaranteesMember 2022-01-01 2022-12-31 0001263043 ifrs-full:MiscellaneousOtherProvisionsMember 2022-01-01 2022-12-31 0001263043 ifrs-full:FinancialGuaranteeContractsMember ifrs-full:FinancialInstrumentsCreditimpairedMember 2022-01-01 2022-12-31 0001263043 ifrs-full:ProvisionForCreditCommitmentsMember ifrs-full:LifetimeExpectedCreditLossesMember 2022-01-01 2022-12-31 0001263043 ifrs-full:FinancialGuaranteeContractsMember ifrs-full:TwelvemonthExpectedCreditLossesMember 2022-01-01 2022-12-31 0001263043 ifrs-full:ProvisionForCreditCommitmentsMember ifrs-full:TwelvemonthExpectedCreditLossesMember 2022-01-01 2022-12-31 0001263043 shg:ProvisionForUnusedCreditCommitmentsAndFinancialGuaranteeContractsIssuedMember 2022-01-01 2022-12-31 0001263043 ifrs-full:ProvisionForCreditCommitmentsMember ifrs-full:FinancialInstrumentsCreditimpairedMember 2022-01-01 2022-12-31 0001263043 ifrs-full:FinancialGuaranteeContractsMember ifrs-full:LifetimeExpectedCreditLossesMember 2022-01-01 2022-12-31 0001263043 shg:COSPECBIMtechMember 2022-01-01 2022-12-31 0001263043 dei:AdrMember 2022-01-01 2022-12-31 0001263043 ifrs-full:BuildingsMember ifrs-full:BottomOfRangeMember 2022-01-01 2022-12-31 0001263043 ifrs-full:BuildingsMember ifrs-full:TopOfRangeMember 2022-01-01 2022-12-31 0001263043 ifrs-full:OtherPropertyPlantAndEquipmentMember ifrs-full:BottomOfRangeMember 2022-01-01 2022-12-31 0001263043 ifrs-full:OtherPropertyPlantAndEquipmentMember ifrs-full:TopOfRangeMember 2022-01-01 2022-12-31 0001263043 ifrs-full:OtherIntangibleAssetsMember 2022-01-01 2022-12-31 0001263043 ifrs-full:ComputerSoftwareMember 2022-01-01 2022-12-31 0001263043 ifrs-full:CapitalisedDevelopmentExpenditureMember 2022-01-01 2022-12-31 0001263043 ifrs-full:BuildingsMember 2022-01-01 2022-12-31 0001263043 shg:EquitySecuritiesMeasuredAtFairValueThroughOtherComprehensiveIncomeMember 2022-01-01 2022-12-31 0001263043 shg:DebtSecuritiesMeasuredAtFairValueThroughOtherComprehensiveIncomeMember 2022-01-01 2022-12-31 0001263043 ifrs-full:BottomOfRangeMember 2022-01-01 2022-12-31 0001263043 ifrs-full:TopOfRangeMember 2022-01-01 2022-12-31 0001263043 shg:ShinhanEzGeneralInsuranceLtdMember ifrs-full:NoncontrollingInterestsMember 2022-01-01 2022-12-31 0001263043 shg:ShinhanAssetTrustCoLtdMember ifrs-full:NoncontrollingInterestsMember 2022-01-01 2022-12-31 0001263043 ifrs-full:NoncontrollingInterestsMember shg:ShinhanBankJejuBankAndShinhanCapitalMember 2022-01-01 2022-12-31 0001263043 shg:PtBankShinhanIndonesiasCgusMember 2022-01-01 2022-12-31 0001263043 shg:KoreaDigitalAssetCustodyMember 2022-01-01 2022-12-31 0001263043 shg:CjlNo1PrivateEquityFundMember 2022-01-01 2022-12-31 0001263043 shg:AssociatesHermesPrivateInvestmentEquityFundMember 2022-01-01 2022-12-31 0001263043 shg:AssociatesKDBCMidasDongASnowballVentureFundIIMember 2022-01-01 2022-12-31 0001263043 shg:AssociatesPartners4thGrowthInvestmentFundMember 2022-01-01 2022-12-31 0001263043 shg:DeepblueNo.1PrivateEquityFundMember 2022-01-01 2022-12-31 0001263043 shg:AssociatesShinhanAlbatrossTechInvestmentFundMember 2022-01-01 2022-12-31 0001263043 shg:NewlakeGrowthCapitalPartners2PefMember 2022-01-01 2022-12-31 0001263043 shg:AssociatesShinhanGlobalActiveReitCo.ltdMember 2022-01-01 2022-12-31 0001263043 shg:AssociatesDdiLvcMasterRealEstateInvestmentTrustCo.Ltd.Member 2022-01-01 2022-12-31 0001263043 shg:CredianTF2020CorporateFinancialStabilityPrivateEquityFundMember 2022-01-01 2022-12-31 0001263043 shg:TotalReturnSwapAgreementMember shg:LimeAssetManagementMember 2022-01-01 2022-12-31 0001263043 shg:ShinhanEzGeneralInsuranceLtdMember 2022-01-01 2022-12-31 0001263043 dei:BusinessContactMember 2022-01-01 2022-12-31 0001263043 ifrs-full:FinancialAssetsAtFairValueThroughOtherComprehensiveIncomeCategoryMember ifrs-full:TradingSecuritiesMember 2022-01-01 2022-12-31 0001263043 shg:DepositsMember ifrs-full:FinancialAssetsAtAmortisedCostCategoryMember 2022-01-01 2022-12-31 0001263043 ifrs-full:TradingSecuritiesMember ifrs-full:FinancialAssetsAtAmortisedCostCategoryMember 2022-01-01 2022-12-31 0001263043 shg:PropertyAndEquipmentRealEstateMember 2022-01-01 2022-12-31 0001263043 ifrs-full:TradingSecuritiesMember ifrs-full:FinancialAssetsAtFairValueThroughProfitOrLossCategoryMember 2022-01-01 2022-12-31 0001263043 shg:IbkcmetisGlobalContentsInvestmentFundMember 2022-01-01 2022-12-31 0001263043 shg:KbDistributionPrivateRealEstate31Member 2022-01-01 2022-12-31 0001263043 shg:KeistoneUnicornPrivateEquityFundMember 2022-01-01 2022-12-31 0001263043 shg:PacificPrivateInvestmentTrustNo.491Member 2022-01-01 2022-12-31 0001263043 shg:ShinhanSimoneFundIMember 2022-01-01 2022-12-31 0001263043 shg:CapstoneDevelopFrontierTrustMember 2022-01-01 2022-12-31 0001263043 shg:ShSustainableManagementEsgShortTermBondSecurityFeederInvestmentTrustNo.1Member 2022-01-01 2022-12-31 0001263043 shg:Sh1.5yearsMaturityInvestmentTypeSecurityInvestmentTrustNo.2Member 2022-01-01 2022-12-31 0001263043 shg:EventusibkcLibFundMember 2022-01-01 2022-12-31 0001263043 shg:LogisvalleyShinhanReitCo.ltdMember 2022-01-01 2022-12-31 0001263043 shg:KdbInvestmentGlobalHealthcarePrivateEquityFundIMember 2022-01-01 2022-12-31 0001263043 shg:GoldenRoute2ndStartupVentureSpecializedPrivateEquityFundMember 2022-01-01 2022-12-31 0001263043 shg:KoramcoPrivateRealEstateFund143Member 2022-01-01 2022-12-31 0001263043 shg:KoreaInvestmentTopMezzaninePrivateRealEsateTrustNo.1Member 2022-01-01 2022-12-31 0001263043 shg:LbYoungnamLogisticsPrivateTrustNo.40Member 2022-01-01 2022-12-31 0001263043 shg:ShinhancognitiveStartupFundL.pMember 2022-01-01 2022-12-31 0001263043 shg:Igen2022No.1PrivateEquityFundMember 2022-01-01 2022-12-31 0001263043 shg:HelioskdbcDigitalContents1stMember 2022-01-01 2022-12-31 0001263043 shg:ImmGlobalVentureOpportunityLpMember 2022-01-01 2022-12-31 0001263043 shg:HiotaFundMember 2022-01-01 2022-12-31 0001263043 shg:CornerstoneJmFundIMember 2022-01-01 2022-12-31 0001263043 shg:KiwoomRealEstatePrivatePlacementFundForNormalInvestorsNo.31Member 2022-01-01 2022-12-31 0001263043 shg:KoreaInvestmentDevelopSeedTrustNo.1Member 2022-01-01 2022-12-31 0001263043 shg:TigerGreenAlpahTrustNo.29Member 2022-01-01 2022-12-31 0001263043 shg:SticAltGlobalIiPrivateEquityFundMember 2022-01-01 2022-12-31 0001263043 shg:NhbrainEvFundMember 2022-01-01 2022-12-31 0001263043 shg:DdiLvcMasterRealEstateInvestmentTrustCo.LtdMember 2022-01-01 2022-12-31 0001263043 shg:FindgreenNewDeal2ndEquityFundMember 2022-01-01 2022-12-31 0001263043 shg:ParatusNo3PrivateEquityFundMember 2022-01-01 2022-12-31 0001263043 shg:NhdaishinkyoboHealthcare1FundMember 2022-01-01 2022-12-31 0001263043 shg:IbkcbehighFund1stMember 2022-01-01 2022-12-31 0001263043 shg:NauticGreenInnovationEsgCoinvestmentNo.1PrivateEquityFundMember 2022-01-01 2022-12-31 0001263043 shg:OnNo.1PrivateEquityFundMember 2022-01-01 2022-12-31 0001263043 shg:DigitalNewDealKappaPrivateEquityFundMember 2022-01-01 2022-12-31 0001263043 shg:AssociatesOthers2019Member 2022-01-01 2022-12-31 0001263043 shg:StonebridgeshinhanUnicornSecondaryFundMember 2022-01-01 2022-12-31 0001263043 shg:KiwoomshinhanInnovationFund2Member 2022-01-01 2022-12-31 0001263043 shg:AssociatesSHBNPPMAINProfessionalInvestmentTypePrivateMixedAssetInvestmentTrustNo3Member 2022-01-01 2022-12-31 0001263043 shg:RifaRealEstatePrivatePlacementFundForNormalInvestoesNo.51Member 2022-01-01 2022-12-31 0001263043 shg:Shinhanfitrin1stTechnologyBusinessInvestmentAssociationMember 2022-01-01 2022-12-31 0001263043 shg:KoreaInvestmentGreenNewdealInfraTrustNo.1Member 2022-01-01 2022-12-31 0001263043 shg:Bts2ndPrivateEquityFundMember 2022-01-01 2022-12-31 0001263043 shg:ShinhanGlobalActiveReitCo.ltd.Member 2022-01-01 2022-12-31 0001263043 shg:NhjibkcLabelTechnologyFundMember 2022-01-01 2022-12-31 0001263043 shg:SjEsgInnovativeGrowthFundMember 2022-01-01 2022-12-31 0001263043 shg:NhKyoboAiSolutionInvestmentFundMember 2022-01-01 2022-12-31 0001263043 shg:FivetreeGeneralPrivateEquityFundNo.15Member 2022-01-01 2022-12-31 0001263043 shg:ShinhankunicornFirstFundMember 2022-01-01 2022-12-31 0001263043 shg:HarvestFundNo.3Member 2022-01-01 2022-12-31 0001263043 shg:ShinhanLifeInsuranceCoLtdMember shg:MergerMember 2022-01-01 2022-12-31 0001263043 shg:PreferredStockIssueMember 2022-01-01 2022-12-31 0001263043 shg:DepositoryBankOfLocalGovernmentsMember 2022-01-01 2022-12-31 0001263043 currency:CAD 2022-01-01 2022-12-31 0001263043 currency:USD 2022-01-01 2022-12-31 0001263043 currency:JPY 2022-01-01 2022-12-31 0001263043 currency:EUR 2022-01-01 2022-12-31 0001263043 currency:GBP 2022-01-01 2022-12-31 0001263043 currency:AUD 2022-01-01 2022-12-31 0001263043 currency:SGD 2022-01-01 2022-12-31 0001263043 currency:CNY 2022-01-01 2022-12-31 0001263043 currency:SEK 2022-01-01 2022-12-31 0001263043 shg:UnusedCreditCommitmentsMember 2022-01-01 2022-12-31 0001263043 shg:ChangeInAccountingPolicyMember 2022-01-01 2022-12-31 0001263043 shg:IfrsFourAndIfrsNineMember shg:SubsidiaryShinhanLifeInsuranceMember 2022-01-01 2022-12-31 0001263043 shg:IfrsFourAndIfrsNineMember shg:AssociatesShinhanEzGeneralInsuranceLtd.Member 2022-01-01 2022-12-31 0001263043 shg:IfrsSeventeenAndIfrsNineMember shg:AssociatesShinhanEzGeneralInsuranceLtd.Member 2022-01-01 2022-12-31 0001263043 shg:IfrsSeventeenAndIfrsNineMember shg:SubsidiaryShinhanLifeInsuranceMember 2022-01-01 2022-12-31 0001263043 ifrs-full:FinancialEffectOfChangesInAccountingPolicyMember shg:SubsidiaryShinhanLifeInsuranceMember 2022-01-01 2022-12-31 0001263043 ifrs-full:FinancialEffectOfChangesInAccountingPolicyMember shg:AssociatesShinhanEzGeneralInsuranceLtd.Member 2022-01-01 2022-12-31 0001263043 shg:PerformanceSharesMember 2020-12-31 0001263043 shg:EmployeeStockOptionSeventhMember 2020-12-31 0001263043 shg:SubsidiaryOrangeLifeInsuranceMember 2021-01-01 0001263043 ifrs-full:FixedInterestRateMember shg:ParticipatingLifeInsurancePolicyMember shg:SubsidiaryOrangeLifeInsuranceMember 2021-01-01 0001263043 shg:SubsidiaryOrangeLifeInsuranceMember shg:ParticipatingLifeInsurancePolicyMember ifrs-full:FloatingInterestRateMember 2021-01-01 0001263043 shg:SubsidiaryOrangeLifeInsuranceMember shg:NonparticipatingLifeInsurancePolicyMember ifrs-full:FloatingInterestRateMember 2021-01-01 0001263043 shg:SubsidiaryOrangeLifeInsuranceMember shg:NonparticipatingLifeInsurancePolicyMember ifrs-full:FixedInterestRateMember 2021-01-01 0001263043 shg:SubsidiaryOrangeLifeInsuranceMember shg:NonparticipatingLifeInsurancePolicyMember ifrs-full:InsuranceContractsToWhichPremiumAllocationApproachHasBeenAppliedMember 2021-01-01 0001263043 ifrs-full:FloatingInterestRateMember shg:ParticipatingLifeInsurancePolicyMember shg:SubsidiaryShinhanLifeInsuranceMember 2021-01-01 0001263043 shg:SubsidiaryShinhanLifeInsuranceMember shg:NonparticipatingLifeInsurancePolicyMember ifrs-full:FloatingInterestRateMember 2021-01-01 0001263043 shg:SubsidiaryShinhanLifeInsuranceMember shg:NonparticipatingLifeInsurancePolicyMember ifrs-full:FixedInterestRateMember 2021-01-01 0001263043 shg:SubsidiaryShinhanLifeInsuranceMember shg:VariableTypeMember 2021-01-01 0001263043 shg:SubsidiaryShinhanLifeInsuranceMember 2021-01-01 0001263043 shg:SubsidiaryShinhanLifeInsuranceMember shg:ParticipatingLifeInsurancePolicyMember ifrs-full:FixedInterestRateMember 2021-01-01 0001263043 shg:GeneralInsuranceMember 2021-01-01 0001263043 shg:LongtermMember 2021-01-01 0001263043 ifrs-full:BottomOfRangeMember shg:SubsidiaryShinhanLifeInsuranceMember shg:LiabilityAdequacyTestForLifeInsuranceMember 2021-01-01 0001263043 ifrs-full:TopOfRangeMember shg:SubsidiaryShinhanLifeInsuranceMember shg:LiabilityAdequacyTestForLifeInsuranceMember 2021-01-01 0001263043 ifrs-full:BottomOfRangeMember shg:SubsidiaryOrangeLifeInsuranceMember shg:LiabilityAdequacyTestForLifeInsuranceMember 2021-01-01 0001263043 ifrs-full:TopOfRangeMember shg:SubsidiaryOrangeLifeInsuranceMember shg:LiabilityAdequacyTestForLifeInsuranceMember 2021-01-01 0001263043 shg:OtherLongTermInvestmentsMember ifrs-full:BottomOfRangeMember 2021-01-01 0001263043 shg:OtherLongTermInvestmentsMember ifrs-full:TopOfRangeMember 2021-01-01 0001263043 shg:SubsequentEventMember 2023-02-08 0001263043 shg:CommonStockMember 2022-01-01 2022-03-31 0001263043 shg:ConvertiblePreferredStockMember 2022-01-01 2022-03-31 0001263043 shg:CommonStockMember 2022-04-01 2022-06-30 0001263043 shg:ConvertiblePreferredStockMember 2022-04-01 2022-06-30 0001263043 shg:ShinhanEzGeneralInsuranceLtdMember 2022-04-01 2022-06-30 0001263043 shg:CommonStockMember 2022-07-01 2022-09-30 0001263043 shg:ConvertiblePreferredStockMember 2022-07-01 2022-09-30 0001263043 shg:BoardOfDirectorsMember 2021-09-28 0001263043 ifrs-full:TreasurySharesMember 2022-04-25 2022-04-25 0001263043 ifrs-full:TreasurySharesMember 2022-11-23 2022-11-23 0001263043 shg:SubsidiaryShinhanCardMember 2022-07-28 2022-07-28 0001263043 shg:SubsidiaryShinhanLifeInsurancesMember ifrs-full:ContractualServiceMarginRelatedToContractsThatExistedAtTransitionDateToWhichFairValueApproachHasBeenAppliedMember 2022-01-01 0001263043 shg:AssociatesShinhanEzGeneralInsuranceLtd.Member ifrs-full:ContractualServiceMarginRelatedToContractsThatExistedAtTransitionDateToWhichFairValueApproachHasBeenAppliedMember 2022-01-01 0001263043 shg:ShinhanEzGeneralInsuranceLtdMember 2022-06-30 2022-06-30 0001263043 shg:EventsAfterReportingPeriodMember 2023-03-15 2023-03-15 0001263043 ifrs-full:AccumulatedOtherComprehensiveIncomeMember 2019-12-31 0001263043 ifrs-full:IssuedCapitalMember 2019-12-31 0001263043 shg:CapitalSurplusMember 2019-12-31 0001263043 ifrs-full:NoncontrollingInterestsMember 2019-12-31 0001263043 ifrs-full:RetainedEarningsMember 2019-12-31 0001263043 shg:CapitalAdjustmentsMember 2019-12-31 0001263043 shg:HybridBondsMember 2019-12-31 0001263043 ifrs-full:EquityAttributableToOwnersOfParentMember 2019-12-31 0001263043 srt:ParentCompanyMember 2019-12-31 0001263043 ifrs-full:AccumulatedOtherComprehensiveIncomeMember 2020-12-31 0001263043 ifrs-full:EquityAttributableToOwnersOfParentMember 2020-12-31 0001263043 ifrs-full:RetainedEarningsMember 2020-12-31 0001263043 ifrs-full:NoncontrollingInterestsMember 2020-12-31 0001263043 ifrs-full:IssuedCapitalMember 2020-12-31 0001263043 shg:HybridBondsMember 2020-12-31 0001263043 shg:CapitalSurplusMember 2020-12-31 0001263043 shg:CapitalAdjustmentsMember 2020-12-31 0001263043 srt:ParentCompanyMember 2020-12-31 0001263043 shg:ChangeInAccountingPolicyMember 2019-12-31 0001263043 shg:ChangeInAccountingPolicyMember 2020-12-31 0001263043 ifrs-full:ReserveOfOverlayApproachMember 2020-12-31 0001263043 ifrs-full:ReserveOfRemeasurementsOfDefinedBenefitPlansMember 2020-12-31 0001263043 shg:OtherComprehensiveIncomeNetOfSeparateAccountMember 2020-12-31 0001263043 shg:ShareOfOtherComprehensiveIncomeOfAssociatesAndJointVenturesAccountedForUsingEquityMethodThatWillBeReclassifiedToProfitOrLossNetOfTaxMember 2020-12-31 0001263043 ifrs-full:ReserveOfCashFlowHedgesMember 2020-12-31 0001263043 ifrs-full:ReserveOfExchangeDifferencesOnTranslationMember 2020-12-31 0001263043 ifrs-full:ReserveOfChangeInFairValueOfFinancialLiabilityAttributableToChangeInCreditRiskOfLiabilityMember 2020-12-31 0001263043 ifrs-full:ReserveOfGainsAndLossesOnFinancialAssetsMeasuredAtFairValueThroughOtherComprehensiveIncomeMember 2020-12-31 0001263043 shg:NeverBeReclassifiedToProfitOrlossReserveOfShareOfAssociatesAndJointVenturesAccountedForUsingEquityMethodMember 2020-12-31 0001263043 shg:NeverBeReclassifiedToProfitOrlossGainLossOnFinancialAssetAtFairValueThroughOtherComprehensiveIncomeMember 2020-12-31 0001263043 shg:ReserveOfShareOfAssociatesAndJointVenturesAccountedForUsingEquityMethodMember 2020-12-31 0001263043 shg:ReserveOfSeparateAccountMember 2020-12-31 0001263043 shg:FinancialAssetsMeasureedAtFairValueMember 2020-12-31 0001263043 ifrs-full:PropertyPlantAndEquipmentMember 2020-12-31 0001263043 shg:AllowanceForAcceptancesAndGuaranteeMember 2020-12-31 0001263043 shg:DeficitCarriedOverMember 2020-12-31 0001263043 shg:ExtinguishmentOfDepositAndInsuranceLiabilitiesMember 2020-12-31 0001263043 shg:AccruedExpensesMember 2020-12-31 0001263043 shg:FictitiousDividendMember 2020-12-31 0001263043 ifrs-full:OtherTemporaryDifferencesMember 2020-12-31 0001263043 shg:AccruedcontributionsMember 2020-12-31 0001263043 ifrs-full:PresentValueOfDefinedBenefitObligationMember 2020-12-31 0001263043 ifrs-full:PlanAssetsMember 2020-12-31 0001263043 ifrs-full:InvestmentsAccountedForUsingEquityMethodMember 2020-12-31 0001263043 ifrs-full:TemporaryDifferenceMember 2020-12-31 0001263043 ifrs-full:NetAmountArisingFromInsuranceContractsMember 2020-12-31 0001263043 ifrs-full:AllowanceForCreditLossesMember 2020-12-31 0001263043 shg:AllowanceForExpensingDepreciationMember 2020-12-31 0001263043 shg:DepositsMember 2020-12-31 0001263043 shg:AccountsReceivableMember 2020-12-31 0001263043 shg:AccruedIncomeMember 2020-12-31 0001263043 ifrs-full:MiscellaneousOtherProvisionsMember 2020-12-31 0001263043 ifrs-full:DerivativesMember 2020-12-31 0001263043 shg:FinancialInstrumentsMeasuredAtFairValueThroughProfitOrLossMember 2020-12-31 0001263043 shg:AllowanceRelatedToAssetRevaluationMember 2020-12-31 0001263043 shg:DerivativeAssetsAndLiabilitiesHeldForHedgingMember 2020-12-31 0001263043 ifrs-full:FinancialLiabilitiesAtFairValueThroughProfitOrLossDesignatedUponInitialRecognitionCategoryMember 2020-12-31 0001263043 shg:DerivativeAssetsAndLiabilitiesHeldForTradingMember 2020-12-31 0001263043 ifrs-full:FinancialAssetsAtFairValueThroughProfitOrLossCategoryMember 2020-12-31 0001263043 ifrs-full:FinancialAssetsAtFairValueThroughOtherComprehensiveIncomeCategoryMember 2020-12-31 0001263043 ifrs-full:OtherPropertyPlantAndEquipmentMember 2020-12-31 0001263043 ifrs-full:RightofuseAssetsMember 2020-12-31 0001263043 ifrs-full:LandMember 2020-12-31 0001263043 ifrs-full:BuildingsMember 2020-12-31 0001263043 ifrs-full:IntangibleAssetsUnderDevelopmentMember 2020-12-31 0001263043 ifrs-full:ComputerSoftwareMember 2020-12-31 0001263043 ifrs-full:OtherIntangibleAssetsMember 2020-12-31 0001263043 ifrs-full:GoodwillMember 2020-12-31 0001263043 ifrs-full:PlanAssetsMember 2020-12-31 0001263043 ifrs-full:PresentValueOfDefinedBenefitObligationMember 2020-12-31 0001263043 ifrs-full:ProvisionForCreditCommitmentsMember ifrs-full:FinancialInstrumentsCreditimpairedMember 2020-12-31 0001263043 ifrs-full:LifetimeExpectedCreditLossesMember ifrs-full:FinancialGuaranteeContractsMember 2020-12-31 0001263043 ifrs-full:FinancialGuaranteeContractsMember ifrs-full:FinancialInstrumentsCreditimpairedMember 2020-12-31 0001263043 ifrs-full:GuaranteesMember 2020-12-31 0001263043 ifrs-full:MiscellaneousOtherProvisionsMember 2020-12-31 0001263043 ifrs-full:LegalProceedingsProvisionMember 2020-12-31 0001263043 shg:ProvisionExceptUnusedCreditCommitmentsAndFinancialGuaranteeContractsIssuedMember 2020-12-31 0001263043 ifrs-full:ProvisionForDecommissioningRestorationAndRehabilitationCostsMember 2020-12-31 0001263043 ifrs-full:LifetimeExpectedCreditLossesMember ifrs-full:ProvisionForCreditCommitmentsMember 2020-12-31 0001263043 shg:ProvisionForUnusedCreditCommitmentsAndFinancialGuaranteeContractsIssuedMember 2020-12-31 0001263043 ifrs-full:ProvisionForCreditCommitmentsMember ifrs-full:TwelvemonthExpectedCreditLossesMember 2020-12-31 0001263043 ifrs-full:FinancialGuaranteeContractsMember ifrs-full:TwelvemonthExpectedCreditLossesMember 2020-12-31 0001263043 shg:DebenturesMember 2020-12-31 0001263043 shg:BorrowingsMember 2020-12-31 0001263043 ifrs-full:LeaseLiabilitiesMember 2020-12-31 0001263043 ifrs-full:DerivativesMember 2020-12-31 0001263043 ifrs-full:LifetimeExpectedCreditLossesMember shg:DebtSecuritiesAtAmortisedCostMember 2020-12-31 0001263043 shg:DebtSecuritiesAtAmortisedCostMember 2020-12-31 0001263043 ifrs-full:FinancialAssetsAtFairValueThroughOtherComprehensiveIncomeCategoryMember ifrs-full:TwelvemonthExpectedCreditLossesMember 2020-12-31 0001263043 ifrs-full:FinancialAssetsAtFairValueThroughOtherComprehensiveIncomeCategoryMember 2020-12-31 0001263043 ifrs-full:LifetimeExpectedCreditLossesMember ifrs-full:FinancialAssetsAtFairValueThroughOtherComprehensiveIncomeCategoryMember 2020-12-31 0001263043 ifrs-full:TwelvemonthExpectedCreditLossesMember shg:DebtSecuritiesAtAmortisedCostMember 2020-12-31 0001263043 shg:NomuraRifaPrivateRealEstateInvestmentTrustNo.19Member 2020-12-31 0001263043 shg:IGISPRIVATEREALESTATETRUSTNO331Member 2020-12-31 0001263043 shg:EDNCENTRALCoLtdMember 2020-12-31 0001263043 shg:AssociatesGoduckGangil1PFVCoLtdMember 2020-12-31 0001263043 shg:GoduckGangil10PFVCoLtdMember 2020-12-31 0001263043 shg:AssociatesIMMGlobalPrivateEquityFundMember 2020-12-31 0001263043 shg:COSPECBIMtechMember 2020-12-31 0001263043 shg:IpixelCoLtdMember 2020-12-31 0001263043 ifrs-full:OtherRelatedPartiesMember 2020-12-31 0001263043 shg:LoansAtAmortizedCostMember shg:OtherFinancialAssetsMember ifrs-full:TwelvemonthExpectedCreditLossesMember 2020-12-31 0001263043 shg:LoansAtAmortizedCostMember shg:CreditCardReceivablesMember ifrs-full:TwelvemonthExpectedCreditLossesMember 2020-12-31 0001263043 shg:LoansAtAmortizedCostMember ifrs-full:CorporateLoansMember ifrs-full:TwelvemonthExpectedCreditLossesMember 2020-12-31 0001263043 shg:LoansAtAmortizedCostMember 2020-12-31 0001263043 shg:LoansAtAmortizedCostMember ifrs-full:ConsumerLoansMember ifrs-full:FinancialInstrumentsCreditimpairedMember 2020-12-31 0001263043 shg:LoansAtAmortizedCostMember shg:OtherFinancialAssetsMember ifrs-full:LifetimeExpectedCreditLossesMember 2020-12-31 0001263043 shg:LoansAtAmortizedCostMember ifrs-full:CorporateLoansMember ifrs-full:FinancialInstrumentsCreditimpairedMember 2020-12-31 0001263043 shg:DueFromBanksAtAmortizedCostAndOtherFinancialAssetsMember ifrs-full:LifetimeExpectedCreditLossesMember 2020-12-31 0001263043 shg:DueFromBanksAtAmortizedCostAndOtherFinancialAssetsMember ifrs-full:FinancialInstrumentsCreditimpairedMember 2020-12-31 0001263043 ifrs-full:TwelvemonthExpectedCreditLossesMember shg:DueFromBanksAtAmortizedCostAndOtherFinancialAssetsMember 2020-12-31 0001263043 shg:DueFromBanksAtAmortizedCostAndOtherFinancialAssetsMember 2020-12-31 0001263043 shg:LoansAtAmortizedCostMember ifrs-full:CorporateLoansMember ifrs-full:LifetimeExpectedCreditLossesMember 2020-12-31 0001263043 shg:LoansAtAmortizedCostMember ifrs-full:ConsumerLoansMember ifrs-full:TwelvemonthExpectedCreditLossesMember 2020-12-31 0001263043 shg:LoansAtAmortizedCostMember shg:CreditCardReceivablesMember ifrs-full:FinancialInstrumentsCreditimpairedMember 2020-12-31 0001263043 shg:LoansAtAmortizedCostMember shg:OtherFinancialAssetsMember ifrs-full:FinancialInstrumentsCreditimpairedMember 2020-12-31 0001263043 shg:LoansAtAmortizedCostMember shg:CreditCardReceivablesMember ifrs-full:LifetimeExpectedCreditLossesMember 2020-12-31 0001263043 shg:LoansAtAmortizedCostMember ifrs-full:ConsumerLoansMember ifrs-full:LifetimeExpectedCreditLossesMember 2020-12-31 0001263043 ifrs-full:VehiclesMember ifrs-full:RightofuseAssetsMember 2020-12-31 0001263043 ifrs-full:RightofuseAssetsMember 2020-12-31 0001263043 ifrs-full:LandAndBuildingsMember ifrs-full:RightofuseAssetsMember 2020-12-31 0001263043 ifrs-full:OtherAssetsMember ifrs-full:RightofuseAssetsMember 2020-12-31 0001263043 ifrs-full:PropertyPlantAndEquipmentSubjectToOperatingLeasesMember 2020-12-31 0001263043 shg:PureEndowmentMember 2020-12-31 0001263043 shg:DeathMember 2020-12-31 0001263043 shg:PureProtectionMember 2020-12-31 0001263043 shg:GroupPoliciesMember 2020-12-31 0001263043 shg:IndividualPoliciesMember 2020-12-31 0001263043 shg:EndowmentMember 2020-12-31 0001263043 ifrs-full:FloatingInterestRateMember 2020-12-31 0001263043 ifrs-full:FixedInterestRateMember 2020-12-31 0001263043 shg:SavingsMember 2020-12-31 0001263043 ifrs-full:TreasurySharesMember 2020-12-31 0001263043 shg:OtherComprehensiveIncomeNetOfSeparateAccountMember 2021-12-31 0001263043 ifrs-full:ReserveOfOverlayApproachMember 2021-12-31 0001263043 ifrs-full:ReserveOfRemeasurementsOfDefinedBenefitPlansMember 2021-12-31 0001263043 ifrs-full:ReserveOfCashFlowHedgesMember 2021-12-31 0001263043 ifrs-full:ReserveOfGainsAndLossesOnFinancialAssetsMeasuredAtFairValueThroughOtherComprehensiveIncomeMember 2021-12-31 0001263043 shg:ShareOfOtherComprehensiveIncomeOfAssociatesAndJointVenturesAccountedForUsingEquityMethodThatWillBeReclassifiedToProfitOrLossNetOfTaxMember 2021-12-31 0001263043 ifrs-full:ReserveOfExchangeDifferencesOnTranslationMember 2021-12-31 0001263043 ifrs-full:ReserveOfChangeInFairValueOfFinancialLiabilityAttributableToChangeInCreditRiskOfLiabilityMember 2021-12-31 0001263043 ifrs-full:PropertyPlantAndEquipmentMember 2021-12-31 0001263043 shg:AccruedIncomeMember 2021-12-31 0001263043 shg:AccruedcontributionsMember 2021-12-31 0001263043 shg:ExtinguishmentOfDepositAndInsuranceLiabilitiesMember 2021-12-31 0001263043 ifrs-full:NetAmountArisingFromInsuranceContractsMember 2021-12-31 0001263043 ifrs-full:PresentValueOfDefinedBenefitObligationMember 2021-12-31 0001263043 ifrs-full:PlanAssetsMember 2021-12-31 0001263043 shg:AccruedExpensesMember 2021-12-31 0001263043 shg:FinancialAssetsMeasureedAtFairValueMember 2021-12-31 0001263043 shg:AllowanceForAcceptancesAndGuaranteeMember 2021-12-31 0001263043 ifrs-full:AllowanceForCreditLossesMember 2021-12-31 0001263043 shg:AccountsReceivableMember 2021-12-31 0001263043 shg:AllowanceRelatedToAssetRevaluationMember 2021-12-31 0001263043 ifrs-full:TemporaryDifferenceMember 2021-12-31 0001263043 shg:DeficitCarriedOverMember 2021-12-31 0001263043 shg:FictitiousDividendMember 2021-12-31 0001263043 ifrs-full:OtherTemporaryDifferencesMember 2021-12-31 0001263043 ifrs-full:MiscellaneousOtherProvisionsMember 2021-12-31 0001263043 shg:FinancialInstrumentsMeasuredAtFairValueThroughProfitOrLossMember 2021-12-31 0001263043 ifrs-full:InvestmentsAccountedForUsingEquityMethodMember 2021-12-31 0001263043 shg:AllowanceForExpensingDepreciationMember 2021-12-31 0001263043 ifrs-full:DerivativesMember 2021-12-31 0001263043 shg:DepositsMember 2021-12-31 0001263043 ifrs-full:PropertyPlantAndEquipmentSubjectToOperatingLeasesMember 2021-12-31 0001263043 ifrs-full:TreasurySharesMember 2021-12-31 0001263043 ifrs-full:RightofuseAssetsMember 2021-12-31 0001263043 ifrs-full:LandAndBuildingsMember ifrs-full:RightofuseAssetsMember 2021-12-31 0001263043 ifrs-full:VehiclesMember ifrs-full:RightofuseAssetsMember 2021-12-31 0001263043 ifrs-full:OtherAssetsMember ifrs-full:RightofuseAssetsMember 2021-12-31 0001263043 shg:ReserveOfShareOfAssociatesAndJointVenturesAccountedForUsingEquityMethodMember 2021-12-31 0001263043 shg:NeverBeReclassifiedToProfitOrlossReserveOfShareOfAssociatesAndJointVenturesAccountedForUsingEquityMethodMember 2021-12-31 0001263043 shg:NeverBeReclassifiedToProfitOrlossGainLossOnFinancialAssetAtFairValueThroughOtherComprehensiveIncomeMember 2021-12-31 0001263043 shg:ReserveOfSeparateAccountMember 2021-12-31 0001263043 shg:CapitalSurplusMember 2021-12-31 0001263043 ifrs-full:AccumulatedOtherComprehensiveIncomeMember 2021-12-31 0001263043 ifrs-full:EquityAttributableToOwnersOfParentMember 2021-12-31 0001263043 ifrs-full:NoncontrollingInterestsMember 2021-12-31 0001263043 ifrs-full:RetainedEarningsMember 2021-12-31 0001263043 ifrs-full:IssuedCapitalMember 2021-12-31 0001263043 shg:HybridBondsMember 2021-12-31 0001263043 shg:CapitalAdjustmentsMember 2021-12-31 0001263043 ifrs-full:PresentValueOfDefinedBenefitObligationMember 2021-12-31 0001263043 ifrs-full:PlanAssetsMember 2021-12-31 0001263043 shg:DerivativeAssetsAndLiabilitiesHeldForHedgingMember 2021-12-31 0001263043 shg:DerivativeAssetsAndLiabilitiesHeldForTradingMember 2021-12-31 0001263043 ifrs-full:RightofuseAssetsMember 2021-12-31 0001263043 ifrs-full:OtherPropertyPlantAndEquipmentMember 2021-12-31 0001263043 ifrs-full:LandMember 2021-12-31 0001263043 ifrs-full:BuildingsMember 2021-12-31 0001263043 shg:DebenturesMember 2021-12-31 0001263043 ifrs-full:LeaseLiabilitiesMember 2021-12-31 0001263043 ifrs-full:ComputerSoftwareMember 2021-12-31 0001263043 ifrs-full:OtherIntangibleAssetsMember 2021-12-31 0001263043 ifrs-full:IntangibleAssetsUnderDevelopmentMember 2021-12-31 0001263043 ifrs-full:GuaranteesMember 2021-12-31 0001263043 shg:ProvisionExceptUnusedCreditCommitmentsAndFinancialGuaranteeContractsIssuedMember 2021-12-31 0001263043 ifrs-full:FixedInterestRateMember 2021-12-31 0001263043 ifrs-full:FloatingInterestRateMember 2021-12-31 0001263043 shg:COSPECBIMtechMember 2021-12-31 0001263043 shg:IGISPRIVATEREALESTATETRUSTNO331Member 2021-12-31 0001263043 shg:ChangeInAccountingPolicyMember 2021-12-31 0001263043 shg:AssociatesLogisvalleyShinhanReitCo.ltd.Member 2021-12-31 0001263043 ifrs-full:LifeInsuranceContractsMember ifrs-full:FixedInterestRateMember 2021-12-31 0001263043 ifrs-full:LifeInsuranceContractsMember ifrs-full:FloatingInterestRateMember 2021-12-31 0001263043 ifrs-full:LifeInsuranceContractsMember 2021-12-31 0001263043 shg:AutomotiveMember 2021-12-31 0001263043 ifrs-full:ReserveOfExchangeDifferencesOnTranslationMember 2022-12-31 0001263043 shg:ShareOfOtherComprehensiveIncomeOfAssociatesAndJointVenturesAccountedForUsingEquityMethodThatWillBeReclassifiedToProfitOrLossNetOfTaxMember 2022-12-31 0001263043 ifrs-full:ReserveOfRemeasurementsOfDefinedBenefitPlansMember 2022-12-31 0001263043 ifrs-full:ReserveOfChangeInFairValueOfFinancialLiabilityAttributableToChangeInCreditRiskOfLiabilityMember 2022-12-31 0001263043 ifrs-full:ReserveOfOverlayApproachMember 2022-12-31 0001263043 shg:OtherComprehensiveIncomeNetOfSeparateAccountMember 2022-12-31 0001263043 ifrs-full:ReserveOfGainsAndLossesOnFinancialAssetsMeasuredAtFairValueThroughOtherComprehensiveIncomeMember 2022-12-31 0001263043 ifrs-full:ReserveOfCashFlowHedgesMember 2022-12-31 0001263043 ifrs-full:PresentValueOfDefinedBenefitObligationMember 2022-12-31 0001263043 shg:FinancialAssetsMeasureedAtFairValueMember 2022-12-31 0001263043 ifrs-full:DerivativesMember 2022-12-31 0001263043 ifrs-full:MiscellaneousOtherProvisionsMember 2022-12-31 0001263043 shg:AllowanceForExpensingDepreciationMember 2022-12-31 0001263043 ifrs-full:TemporaryDifferenceMember 2022-12-31 0001263043 shg:FictitiousDividendMember 2022-12-31 0001263043 shg:ExtinguishmentOfDepositAndInsuranceLiabilitiesMember 2022-12-31 0001263043 ifrs-full:PropertyPlantAndEquipmentMember 2022-12-31 0001263043 shg:AccruedIncomeMember 2022-12-31 0001263043 shg:DepositsMember 2022-12-31 0001263043 ifrs-full:PlanAssetsMember 2022-12-31 0001263043 shg:AllowanceRelatedToAssetRevaluationMember 2022-12-31 0001263043 ifrs-full:NetAmountArisingFromInsuranceContractsMember 2022-12-31 0001263043 shg:AccruedcontributionsMember 2022-12-31 0001263043 ifrs-full:AllowanceForCreditLossesMember 2022-12-31 0001263043 shg:FinancialInstrumentsMeasuredAtFairValueThroughProfitOrLossMember 2022-12-31 0001263043 shg:AllowanceForAcceptancesAndGuaranteeMember 2022-12-31 0001263043 ifrs-full:InvestmentsAccountedForUsingEquityMethodMember 2022-12-31 0001263043 shg:AccruedExpensesMember 2022-12-31 0001263043 shg:AccountsReceivableMember 2022-12-31 0001263043 ifrs-full:OtherTemporaryDifferencesMember 2022-12-31 0001263043 ifrs-full:PropertyPlantAndEquipmentSubjectToOperatingLeasesMember 2022-12-31 0001263043 ifrs-full:TreasurySharesMember 2022-12-31 0001263043 ifrs-full:OtherAssetsMember ifrs-full:RightofuseAssetsMember 2022-12-31 0001263043 ifrs-full:VehiclesMember ifrs-full:RightofuseAssetsMember 2022-12-31 0001263043 ifrs-full:RightofuseAssetsMember 2022-12-31 0001263043 ifrs-full:LandAndBuildingsMember ifrs-full:RightofuseAssetsMember 2022-12-31 0001263043 shg:NeverBeReclassifiedToProfitOrlossGainLossOnFinancialAssetAtFairValueThroughOtherComprehensiveIncomeMember 2022-12-31 0001263043 shg:ReserveOfSeparateAccountMember 2022-12-31 0001263043 shg:NeverBeReclassifiedToProfitOrlossReserveOfShareOfAssociatesAndJointVenturesAccountedForUsingEquityMethodMember 2022-12-31 0001263043 shg:ReserveOfShareOfAssociatesAndJointVenturesAccountedForUsingEquityMethodMember 2022-12-31 0001263043 ifrs-full:IssuedCapitalMember 2022-12-31 0001263043 shg:HybridBondsMember 2022-12-31 0001263043 ifrs-full:EquityAttributableToOwnersOfParentMember 2022-12-31 0001263043 ifrs-full:RetainedEarningsMember 2022-12-31 0001263043 shg:CapitalAdjustmentsMember 2022-12-31 0001263043 ifrs-full:NoncontrollingInterestsMember 2022-12-31 0001263043 shg:CapitalSurplusMember 2022-12-31 0001263043 ifrs-full:AccumulatedOtherComprehensiveIncomeMember 2022-12-31 0001263043 ifrs-full:PresentValueOfDefinedBenefitObligationMember 2022-12-31 0001263043 ifrs-full:PlanAssetsMember 2022-12-31 0001263043 shg:DerivativeAssetsAndLiabilitiesHeldForHedgingMember 2022-12-31 0001263043 shg:DerivativeAssetsAndLiabilitiesHeldForTradingMember 2022-12-31 0001263043 ifrs-full:OtherPropertyPlantAndEquipmentMember 2022-12-31 0001263043 ifrs-full:RightofuseAssetsMember 2022-12-31 0001263043 ifrs-full:LandMember 2022-12-31 0001263043 ifrs-full:BuildingsMember 2022-12-31 0001263043 ifrs-full:LeaseLiabilitiesMember 2022-12-31 0001263043 shg:DebenturesMember 2022-12-31 0001263043 ifrs-full:ComputerSoftwareMember 2022-12-31 0001263043 ifrs-full:IntangibleAssetsUnderDevelopmentMember 2022-12-31 0001263043 ifrs-full:OtherIntangibleAssetsMember 2022-12-31 0001263043 ifrs-full:GuaranteesMember 2022-12-31 0001263043 shg:ProvisionExceptUnusedCreditCommitmentsAndFinancialGuaranteeContractsIssuedMember 2022-12-31 0001263043 ifrs-full:LifeInsuranceContractsMember 2022-12-31 0001263043 ifrs-full:LifeInsuranceContractsMember ifrs-full:FloatingInterestRateMember 2022-12-31 0001263043 ifrs-full:FixedInterestRateMember ifrs-full:LifeInsuranceContractsMember 2022-12-31 0001263043 ifrs-full:NonlifeInsuranceContractsMember shg:AutomotiveMember 2022-12-31 0001263043 ifrs-full:NonlifeInsuranceContractsMember 2022-12-31 0001263043 ifrs-full:NonlifeInsuranceContractsMember shg:LongtermMember 2022-12-31 0001263043 ifrs-full:NonlifeInsuranceContractsMember shg:GeneralMember 2022-12-31 0001263043 shg:AssociatesLogisvalleyShinhanReitCo.ltd.Member 2022-12-31 0001263043 shg:ChangeInAccountingPolicyMember 2022-12-31 iso4217:KRW xbrli:shares xbrli:pure iso4217:USD utr:Year utr:Day iso4217:KRW xbrli:shares iso4217:USD xbrli:shares utr:D
As filed with the Securities and Exchange Commission on April 20, 2023
SECURITIES AND EXCHANGE COMMISSION
| ☐ |
REGISTRATION STATEMENT PURSUANT TO SECTION 12(b) OR 12(g) OF THE SECURITIES EXCHANGE ACT OF 1934 |
| ☒ |
ANNUAL REPORT PURSUANT TO SECTION 13 OR 15(d) OF THE SECURITIES EXCHANGE ACT OF 1934 |
For the fiscal year ended December 31, 2022
| ☐ |
TRANSITION REPORT PURSUANT TO SECTION 13 OR 15(d) OF THE SECURITIES EXCHANGE ACT OF 1934 |
For the transition period from
to
| ☐ |
SHELL COMPANY REPORT PURSUANT TO SECTION 13 OR 15(d) OF THE SECURITIES EXCHANGE ACT OF 1934 |
Date of event requiring this shell company report
Commission File Number:
001-31798
Shinhan Financial Group Co., Ltd.
(Exact name of registrant as specified in its charter)
|
|
|
|
|
|
(Translation of registrant’s |
|
incorporation or organization) |
20, Sejong-daero 9-gil,
Jung-gu
(Address of principal executive offices)
Park Cheolwoo, +
822 6360 3129 (T),
cheol.park@shinhan.com, +
822 6360 3098 (F), 20,
Sejong-daero 9-gil,
Jung-gu
,
Seoul 04513,
Korea (Name, Telephone,
E-mail
and/or Facsimile number and Address of Company Contact Person)
Securities registered or to be registered pursuant to Section 12(b) of the Act:
|
|
|
|
|
| |
|
|
|
Name of Each Exchange on Which Registered: |
Common stock, par value Won 5,000 per share |
|
|
|
|
American depositary shares |
|
|
|
|
| * |
Not for trading, but only in connection with the listing of American depositary shares on the New York Stock Exchange, pursuant to the requirements of the Securities and Exchange Commission. |
Securities registered or to be registered pursuant to Section 12(g) of the Act:
Securities for which there is a reporting obligation pursuant to Section 15(d) of the Act:
Indicate the number of outstanding shares of each of Shinhan Financial Group’s classes of capital or common stock as of the close of the last full fiscal year covered by this Annual Report:
508,784,869 shares of common stock, par value of Won
5,000
per share.
Indicate by check mark if the registrant is a well-known seasoned issuer, as defined in Rule 405 of the Securities Act:
Yes
☒
No
☐
If this report is an annual or transition report, indicate by check mark if the registrant is not required to file reports pursuant to Section 13 or 15(d) of the Securities Exchange Act of 1934:
☐
☒
Note—Checking the box above will not relieve any registrant required to file reports pursuant to Section 13 or 15(d) of the Securities Exchange Act of 1934 from their obligations under those Sections.
Indicate by check mark whether the registrant: (1) has filed all reports required to be filed by Section 13 or 15(d) of the Securities Exchange Act of 1934 during the preceding 12 months (or for such shorter period that the registrant was required to file such reports), and (2) has been subject to such filing requirements for the past 90 days.
Yes
☒
No
☐
Indicate by check mark whether the registrant has submitted electronically, if any, every Interactive Data File required to be submitted pursuant to Rule 405 of Regulation
S-T
(§232.405 of this chapter) during the preceding 12 months (or for such shorter period that the registrant was required to submit such files).
Yes
☒
No
☐
Indicate by check mark whether the registrant is a large accelerated filer, an accelerated filer, a
non-accelerated
filer, or an emerging growth company. See the definitions of “large accelerated filer,” “accelerated filer,” and “emerging growth company” in Rule
12b-2
of the Exchange Act.
|
|
|
|
|
|
|
|
|
|
|
| |
|
☒ |
|
|
|
Accelerated filer |
|
☐ |
|
|
| |
|
☐ |
|
|
|
Emerging growth company |
|
☐ |
|
|
If an emerging growth company that prepares its financial statements in accordance with U.S. GAAP, indicate by check mark if the registrant has elected not to use the extended transition period for complying with any new or revised financial accounting standards† provided pursuant to Section 13(a) of the Exchange Act.
☐
† The term “new or revised financial accounting standard” refers to any update issued by the Financial Accounting Standards Board to its Accounting Standards Codification after April 5, 2012.
Indicate by check mark whether the registrant has filed a report on and attestation to its management’s assessment of the effectiveness of its internal control over financial reporting under Section 404(b) of the Sarbanes-Oxley Act (15 U.S.C. 7262(b)) by the registered public accounting firm that prepared or issued its audit report.
Yes
☒No
☐
If securities are registered pursuant to Section 12(b) of the Act, indicate by check mark whether the financial statements of the registrant included in the filing reflect the correction of an error to previously issued financial statements. Yes
☐
☒
Indicate by check mark whether any of those error corrections are restatements that required a recovery analysis of incentive based compensation received by any of the registrant’s executive officers during the relevant recovery period pursuant to
§240.10D-1(b). Yes
☐
☒
Indicate by check mark which basis of accounting the registrant has used to prepare the financial statements included in this filing:
|
|
|
|
|
| U.S. GAAP ☐ |
|
International Financial Reporting Standards as issued by the International Accounting Standards Board ☒ |
|
Other ☐ |
If “Other” has been checked in response to the previous question, indicate by check mark which financial statement item the registrant has elected to follow:
Item 17
☐
Item 18
☐
If this is an annual report, indicate by check mark whether the registrant is a shell company (as defined in Rule
12b-2
of the Exchange Act):
Yes
☐
No
☒(APPLICABLE ONLY TO ISSUERS INVOLVED IN BANKRUPTCY PROCEEDINGS DURING THE PAST FIVE YEARS)
Indicate by check mark whether the registrant has filed all documents and reports required to be filed by Section 12, 13 or 15(d) of the Securities Exchange Act of 1934 subsequent to the distribution of securities under a plan confirmed by a court:
Yes
☐
No
☐
CERTAIN DEFINED TERMS, CONVENTIONS AND CURRENCY OF PRESENTATION
Unless otherwise specified or the context otherwise requires:
| |
• |
|
the terms “we,” “us,” “our,” “Shinhan Financial Group,” “SFG” and the “Group” mean Shinhan Financial Group Co., Ltd. and its consolidated subsidiaries; |
| |
• |
|
the terms “Shinhan Financial Group Co., Ltd.,” “our company” and “our holding company” mean Shinhan Financial Group Co., Ltd.; and |
| |
• |
|
“Shinhan Card” refers to Shinhan Card Co., Ltd., “Shinhan Life Insurance” refers to Shinhan Life Insurance Co., Ltd., “Shinhan Securities” refers to Shinhan Securities Co., Ltd. and “Orange Life Insurance” refers to Orange Life Insurance, Ltd. |
All references to “Korea” or the “Republic” contained in this annual report are to the Republic of Korea. All references to the “Government” are to the government of the Republic of Korea. References to the “Financial Services Commission” are to the Financial Services Commission of Korea, and references to the “Financial Supervisory Service” are to the Financial Supervisory Service of Korea, the executive body of the Financial Services Commission.
The fiscal year for us and our subsidiaries ends on December 31 of each year. Unless otherwise specified or the context otherwise requires, all references to a particular year are to the year ended December 31 of that year.
The currency of the primary economic environment in which we operate is Korean Won.
In this annual report, unless otherwise indicated, all references to “Korean Won”, “Won” or “ W ” are to the currency of the Republic of Korea, and all references to “U.S. Dollars,” “Dollars,” “$” or “US$” are to the currency of the United States of America. Unless otherwise indicated, all translations from Won to Dollars were made at W1,260.2 to US$1.00, which was the noon buying rate in the City of New York on December 30, 2022 for cable transfers according to the H.10 statistical release of the Federal Reserve Board (the “Noon Buying Rate”). On April 14, 2023, the Noon Buying Rate was W1,299.1 to US$1.00. The Noon Buying Rate has been volatile recently and the U.S. Dollar amounts referred to in this report should not be relied upon as an accurate reflection of our results of operations. We expect this volatility to continue in the near future. No representation is made that the Won or U.S. Dollar amounts referred to in this report could have been or could be converted into Dollars or Won, as the case may be, at any particular rate or at all.
Unless otherwise indicated, the financial information presented in this annual report has been prepared on a consolidated basis in accordance with International Financial Reporting Standards (“IFRS”) as issued by the International Accounting Standards Board (“IASB”).
Any discrepancies in the tables included herein between totals and sums of the amounts listed are due to rounding.
FORWARD LOOKING STATEMENTS
This annual report includes “forward-looking statements,” as defined in Section 27A of the U.S. Securities Act, as amended, and Section 21E of the U.S. Securities Exchange Act of 1934, as amended (the “Exchange Act”), including statements regarding our expectations and projections for future operating performance and business prospects. The words “believe,” “expect,” “anticipate,” “estimate,” “project” and similar words used in connection with any discussion of our future operating or financial performance identify forward-looking statements. In addition, all statements other than statements of historical facts included in this annual report are forward-looking statements.
1
Although we believe that the expectations reflected in the forward-looking statements are reasonable, we can give no assurance that such expectations will prove to be correct. All forward-looking statements are management’s present expectations of future events and are subject to a number of factors and uncertainties that could cause actual results to differ materially from those described in the forward-looking statements. This annual report discloses, under the caption “Item 3.D. Risk Factors” and elsewhere, important factors that could cause actual results to differ materially from our expectations (“Cautionary Statements”). Included among the factors discussed under the caption “Item 3.D. Risk Factors” are the followings risks related to our business, which could cause actual results to differ materially from those described in the forward-looking statements: the risk of adverse impacts from an economic downturn; increased competition; market volatility in securities and derivatives markets, interest or foreign exchange rates or indices; other factors impacting our operational plans; or legislative and/or regulatory developments. We caution you not to place undue reliance on the forward-looking statements, which speak only as of the date of this annual report. All subsequent written and oral forward-looking statements attributable to us or persons acting on our behalf are expressly qualified in their entirety by the Cautionary Statements.
2
| ITEM 1. |
IDENTITY OF DIRECTORS, SENIOR MANAGEMENT AND ADVISERS |
Not applicable.
| ITEM 2. |
OFFER STATISTICS AND EXPECTED TIMETABLE |
Not applicable.
| ITEM 3.B. |
Capitalization and Indebtedness |
Not applicable.
| ITEM 3.C. |
Reasons for the Offer and Use of Proceeds |
Not applicable.
An investment in the American depositary shares representing our common shares involves a number of risks. You should carefully consider the following information about the risks we face, together with the other information contained in this annual report, in evaluating us and our business.
Summary
The following summarizes some, but not all, of the risks provided below. Please carefully consider all of the information discussed in this Item 3.D. “Risk Factors” in this annual report for a more thorough description of these and other risks:
| |
• |
|
Risks Relating to Our Overall Business |
| |
• |
|
Difficult conditions and turbulence in the Korean and global economy and financial markets may adversely affect our business, asset quality, capital adequacy and earnings. |
| |
• |
|
Competition in the Korean financial services industry is intense, and may further intensify. |
| |
• |
|
The extent to which the COVID-19 pandemic impacts our business, results of operations and financial condition will depend on future developments, which are highly uncertain and difficult to predict. |
| |
• |
|
We and our subsidiaries need to maintain our capital ratios above minimum required levels, and the failure to so maintain could result in the suspension of some or all of our operations. |
| |
• |
|
Liquidity, funding management and credit ratings are critical to our ongoing performance. |
| |
• |
|
Changes in interest rates, foreign exchange rates, bond and equity prices, and other market factors have affected and will continue to affect our business, results of operations and financial condition. |
| |
• |
|
Reforms of London Interbank Offered Rate and other interest rate benchmarks could adversely affect our business, financial condition and results of operations. |
| |
• |
|
We may incur losses associated with our counterparty exposures. |
3
| |
• |
|
Risks Relating to Our Banking Business |
| |
• |
|
We have significant exposure to small- and medium-sized enterprises, and financial difficulties experienced by such enterprises may result in a deterioration of our asset quality. |
| |
• |
|
A decline in the value of the collateral securing our loans or our inability to fully realize the collateral value may adversely affect our credit portfolio. |
| |
• |
|
Guarantees received in connection with our real estate financing may not provide sufficient coverage. |
| |
• |
|
A limited portion of our credit exposure is concentrated in a relatively small number of large corporate borrowers, and future financial difficulties experienced by them may have an adverse impact on us. |
| |
• |
|
The asset quality of our retail loan portfolio may deteriorate. |
| |
• |
|
Any deterioration in the asset quality of our guarantees and acceptances will likely have a material adverse effect on our financial condition and results of operations. |
| |
• |
|
Risks Relating to Our Credit Card Business |
| |
• |
|
Future changes in market conditions as well as other factors, such as stricter regulation, may lead to reduced revenues and deterioration in the asset quality of credit card receivables. |
| |
• |
|
Risks Relating to Our Other Businesses |
| |
• |
|
We may experience significant losses from our investments and, to a lesser extent, trading activities due to market fluctuations. |
| |
• |
|
We may generate losses from our brokerage and other commission- and fee-based business. |
| |
• |
|
Prolonged periods of declining or low interest rates or changes in related accounting standards may reduce or turn negative our investment margin on savings insurance products and result in an increase in the valuation of our liabilities associated with these products. |
| |
• |
|
We may fail to realize the anticipated benefits of and encounter significant risks in connection with mergers and acquisitions. |
| |
• |
|
We may suffer losses or record provisions for credit loss allowance for expected losses in connection with financial products sold by us or our subsidiaries, including Shinhan Securities and Shinhan Bank, which may have a negative impact on us, including our reputation. |
| |
• |
|
Other Risks Relating to Us as the Holding Company |
| |
• |
|
Our ability to continue to pay dividends and service debt will depend on the level of profits and cash flows of our subsidiaries. |
| |
• |
|
Damage to our reputation could harm our business. |
| |
• |
|
Our risk management policies and procedures may not be fully effective at all times. |
| |
• |
|
We may experience disruptions, delays and other difficulties relating to our information technology systems. |
| |
• |
|
Our activities are subject to cyber security risk. |
| |
• |
|
Our customers may become victims to “voice phishing” or other financial scams, for which we may be required to make monetary compensation and suffer damage to our business and reputation. |
| |
• |
|
Legal claims and regulatory risks arise in the conduct of our business. |
4
| |
• |
|
Risks Relating to Law, Regulation and Government Policy |
| |
• |
|
We are a heavily regulated entity and operate in a legal and regulatory environment that is subject to change, and violations could result in penalties and other regulatory actions. |
| |
• |
|
The Government may encourage targeted lending to certain sectors in furtherance of policy objectives, and we may take this factor into account. |
| |
• |
|
The Government may also encourage investments in certain institutions in furtherance of policy objectives, and we may not recoup our investments therein in a timely or otherwise commercially reasonable manner. |
| |
• |
|
The level and scope of government oversight of our retail lending business, particularly regarding mortgage and home equity loans, may change depending on the economic or political climate. |
| |
• |
|
We engage in limited settlement transactions involving Iran and also in limited business in and related to Russia which may subject us to legal or reputational risks. |
| |
• |
|
Risks Relating to Korea |
| |
• |
|
Unfavorable financial and economic conditions in Korea and globally may have a material adverse impact on our asset quality, liquidity and financial performance. |
| |
• |
|
Tensions with North Korea could have an adverse effect on us, the price of our common shares and our American depositary shares. |
| |
• |
|
Risks Relating to Our American Depositary Shares |
| |
• |
|
There are restrictions on withdrawal and deposit of common shares under the depositary facility. |
| |
• |
|
Ownership of our shares is restricted under Korean law. |
| |
• |
|
Holders of our ADSs will not have preemptive rights in certain circumstances. |
| |
• |
|
Holders of our ADSs will not be able to exercise dissent and appraisal rights unless they have withdrawn the underlying shares of our common stock and become our direct stockholders. |
| |
• |
|
The market value of your investment in our ADSs may fluctuate due to the volatility of the Korean securities market. |
| |
• |
|
Your dividend payments and the amount you may realize upon a sale of your ADSs will be affected by fluctuations in the exchange rate between the U.S. Dollar and the Won. |
| |
• |
|
If the Government deems that certain emergency circumstances are likely to occur, it may restrict the depositary bank from converting and remitting dividends in Dollars. |
| |
• |
|
We are generally subject to Korean corporate governance and disclosure standards, which differ in significant respects from those in other countries. |
| |
• |
|
You may not be able to enforce a judgment of a foreign court against us. |
| |
• |
|
We may become a passive foreign investment company (“PFIC”), which could result in adverse U.S. tax consequences to U.S. investors. |
Risks Relating to Our Overall Business
Difficult conditions and turbulence in the Korean and global economy and financial markets may adversely affect our business, asset quality, capital adequacy and earnings.
Most of our assets are located in, and we generate most of our income from, Korea. Accordingly, our business and profitability are largely dependent on the general economic and social conditions in Korea, including interest rates, inflation, exports, personal expenditures and consumption, unemployment, demand for
5
business products and services, debt service burden of households and businesses, the general availability of credit, the asset value of real estate and securities and other factors affecting the financial well-being of our corporate and retail customers.
The Korean economy is closely integrated with, and is significantly affected by, developments in the global economy. In light of the periodic re-proliferation of COVID-19, global inflation caused by rising energy prices and global supply chain disruptions, the Russia-Ukraine conflict and the subsequent economic slowdown, rapidly changing monetary policies (including higher interest rates and quantitative tightening) led by developed countries in reaction to such inflation, instability in the financial industries (including potential for bank runs) and capital flight risks in emerging economies caused by such changes in monetary policy, credit risks of Chinese real estate developers, ongoing US-China trade conflicts, signs of economic slowdown in China and continuing geopolitical and social instability in various parts of the Middle East, including Iraq, Syria and Yemen, among others, significant uncertainty remains as to the global economic prospects in general and has adversely affected, and may continue to adversely affect, the Korean economy. In addition, as the Korean economy matures, it is increasingly exposed to the risk of a “scissor effect,” namely being pursued by competitors in less advanced economies while not having fully caught up with competitors in advanced economies, which risk is amplified by the fact that Korean economy is heavily dependent on exports. The Korean economy also continues to face other difficulties, including sluggishness in domestic consumption and investment, risk of corporate debt liquidity issues, volatility in the real estate market, rising household debt, potential declines in productivity due to aging demographics and low birth rates, and a rise in youth unemployment. Any future deterioration of the global and Korean economies could adversely affect our business, financial condition and results of operations.
In particular, difficulties in financial and economic conditions could result in significant deterioration in the quality of our assets and accumulation of higher provisioning, allowance for credit losses on loans and charge-offs as an increasing number of our corporate and retail customers declare bankruptcy or insolvency or otherwise face increasing difficulties in meeting their debt obligations. For example, in 2011 and 2012, the continuing slump in the real estate market and the shipbuilding industry led to increased delinquency among our corporate borrowers, including some Korean commercial conglomerates knowns as “chaebols,” in such industries, and in certain cases, even insolvency, workouts, recovery proceedings and/or voluntary arrangements with creditors. During the same period, the sustained slump in the real estate market also led to increased delinquency among our retail borrowers, and in particular, borrowers with collective loans for pre-sale of newly constructed apartment units. Recently, various Government-led financial support programs have been introduced in response to the COVID-19 pandemic, rising inflation and economic slowdown, such as loan rescheduling and principal and interest payment deferral programs, have helped financial institutions, including Shinhan Bank, manage their asset quality at a stable level. Such financial support programs have been introduced since April 1, 2020 and are available to small- and medium-sized enterprises and “small office, home office” (“SOHO”) that meet certain criteria, such as that they have not been delinquent on their prior loans and are not subject to liquidation or bankruptcy proceedings. Such financial support programs expired on September 30, 2022. However, the Government has decided, based on discussions with financial institutions, to provide further financial support to the debtors using the financial support programs as of the expiration date of such financial support programs in the forms of (i) the extension of loan maturity dates up to three years, (ii) the postponement of repaying loans up to one year until September 2023, or (iii) the rescheduling of loans under the New Start Fund set up by the Government on October 4, 2022 or loan rescheduling programs led by the financial institutions. Accordingly, Shinhan Bank’s delinquency ratio was 0.24% as of December 31, 2020, 0.19% as of December 31, 2021 and 0.21% as of December 31, 2022. However, despite such financial support programs, there is no assurance that Shinhan Bank will not experience increased level of credit losses on loans from borrowers, particularly those in troubled industries, since the quality of loans to such borrowers may further deteriorate due to a continued slump in volatile industries amid sluggish economic situation or for other reasons. In addition, the COVID-19 outbreak continues to have certain level of impact on global and domestic consumption, most notably in the transportation, tourism, retail, lodging, catering, industrial production and construction industries and any unexpected deterioration of the outbreak may lead to an increase in delinquency and adversely affect Shinhan Bank’s asset
6
quality. Further, Government-led financial support programs or other countermeasures may not achieve their intended results and could also result in unintended consequences or otherwise adversely affect our business, financial condition and results of operations.
Moreover, as was the case during the global financial crisis of 2008-2009, depending on the nature of the difficulties in the financial markets and general economy, we may be forced to scale back certain of our core lending activities and other operations and/or borrow money at a higher funding cost or face a tightening in the net interest spread, any of which may have a negative impact on our earnings and profitability. Furthermore, while we and our principal subsidiaries currently maintain a capital adequacy ratio at a level higher than the required regulatory minimum, there is no guarantee that an even higher capital requirement will not be imposed by the Government in case of a renewed economic crisis.
In addition, given the highly integrated nature of financial systems and economic relationships worldwide, there may be other unanticipated systemic or other risks that may not be presently predictable. Any of these risks, if materialized, may have a material adverse effect on our business, liquidity, financial condition and results of operations.
Competition in the Korean financial services industry is intense, and may further intensify.
Competition in the Korean financial services industry is, and is likely to remain, intense, including as a result of the sustained low interest rate environment (which narrows opportunities to make profit based on the spread between lending rates and funding rates), the continuing sluggishness in the general economy, the growing maturation and saturation of the industry as a whole, the entry of new market participants and deregulation, among others.
In the banking sector, Shinhan Bank competes principally with other national commercial banks in Korea, but also faces competition from a number of additional banking institutions, including branches and subsidiaries of foreign banks operating in Korea, regional banks, Internet-only banks, government-owned development banks and Korea’s specialized banks, such as Korea Development Bank, the Industrial Bank of Korea and the National Federation of Fisheries Cooperatives, as well as various other types of financial service providers, including savings institutions (such as mutual savings and finance companies, credit unions and credit cooperatives), investment companies (such as securities brokerage firms, merchant banking corporations and asset management companies) and life insurance companies. As of December 31, 2022, Korea had six major nationwide domestic commercial banks (including Citibank Korea Inc. and Standard Chartered Bank Korea Limited, both of which are domestic commercial banks acquired by global financial institutions), six regional commercial banks, three Internet-only banks and thirty-five branches and subsidiaries of foreign banks. Foreign financial institutions, many of which have greater experiences and resources than we do, may continue to enter the Korean market and compete with us in providing financial products and services either by themselves or in partnership with existing Korean financial institutions.
In the small- and medium-sized enterprise and retail banking segments, which have been Shinhan Bank’s traditional core businesses, competition is expected to increase further. In recent years, Korean banks, including Shinhan Bank, have increasingly focused on stable asset growth based on quality credit, such as corporate borrowers with high credit ratings, loans to SOHO with high levels of collateralization, and mortgage and home equity loans within the limits of the prescribed loan-to-value ratios and debt-to-income ratios. This common shift in focus toward stable growth based on less risky assets has intensified competition as banks compete for the same limited pool of quality credit by engaging in price competition or by other means although Shinhan Bank has traditionally focused, and will continue to focus, on enhancing profitability rather than increasing asset size or market share, and has avoided, to the extent practicable, engaging in price competition by way of lowering lending rates. In addition, such competition may result in lower net interest margin and reduced overall profitability, especially if the low interest rate environment were to continue for a significant period of time. Shinhan Bank’s net interest margin (on a separate basis) increased to 1.85% in 2022 from 1.62% in 2021 due to,
7
at least partly, increases in base interest rate by the Bank of Korea from 1.00% to 1.25% in January 2022, from 1.25% to 1.50% in April 2022, from 1.50% to 1.75% in May 2022, from 1.75% to 2.25% in July 2022, from 2.25% to 2.50% in August 2022, from 2.50% to 3.00% in October 2022 and from 3.00% to 3.25% in November 2022. The Bank of Korea further raised the base interest rate from 3.25% to 3.50% in January 2023, which may be further increased during 2023. Even if interest rates were to increase, the effect on Shinhan Bank’s results of operations may not be as beneficial as expected, or at all, due to factors such as increased volatility of market interest rates and tighter regulations regarding SOHO loans, including the implementation of additional credit review guidelines for individual businesses. Further, if competing financial institutions seek to expand market share by lowering their lending rates, Shinhan Bank may suffer customer loss, especially among customers who select their lenders principally on the basis of lending rates. In response thereto or for other strategic reasons, Shinhan Bank may subsequently lower its lending rates to stay competitive, which could lead to a further decrease in its net interest margins and outweigh any potential positive impact on the net interest margin from a general rise in market interest rates. Any future decline in Shinhan Bank’s customer base or its net interest margins could have an adverse effect on our results of operations and financial condition.
In the credit card sector, Shinhan Card competes principally with existing “monoline” credit card companies, credit card divisions of commercial banks, consumer finance companies, other financial institutions and, recently, credit card service providers allied with mobile telecommunications service providers in Korea. Competition has been historically intense in this sector and the market has shown signs of saturation as existing and new credit card service providers make significant investments and engage in aggressive marketing campaigns and promotions to acquire new customers and target customers with high credit quality. While competition has subsided somewhat recently due to stricter government regulations, such as curbs on excessive marketing expenses, competition remains intense and credit card issuers may continue to compete with Shinhan Card for customers by offering lower interest rates and fees, higher credit limits, more attractive promotions and incentives and alternative products such as credit card reward points, gift cards and low-interest consumer loan products. As a result, Shinhan Card may lose customers or service opportunities to competing credit card issuers and/or incur higher marketing expenses. Also, over the years, the Government has implemented regulations lowering certain merchant fees chargeable by credit card companies. In 2012, the Government adopted regulations mandating lower merchant fees chargeable to small- and medium-sized enterprises, and beginning January 31, 2016, a further reduction in the merchant fees chargeable to small- and medium-sized enterprises went into effect. The Enforcement Decree of the Specialized Credit Finance Business Act was amended in July 2017 and January 2019 to further expand the range of small- and medium-sized enterprises subject to lower merchant fees. Pursuant to the Specialized Credit Financial Business Act, the rates of fees chargeable to merchants are subject to review and revision every three years, and beginning January 2022, the fees chargeable to small- and medium-sized enterprises with respect to credit cards were further reduced as a result of this periodic review and revision. Additional amendments to regulations requiring further downward adjustments to merchant fees may come into force in the future. For further details on the Government’s regulations on merchant fees chargeable by credit card companies, See “— Risks Relating to Our Credit Card Business — Future changes in market conditions as well as other factors, such as stricter regulation, may lead to reduced revenues and deterioration in the asset quality of credit card receivables.” In March 2023, the Financial Services Commission set up a task force consisting of members of the Financial Services Commission, the Financial Supervisory Service, credit card companies, and consumer groups, to discuss how to improve the merchant commission rate adjustment system in order to address disagreements among the stakeholders involved in the periodic review of the rates of fees charged to merchants.
In addition, since the implementation of the Improper Solicitation and Graft Act in September 2016, revenue growth for corporate cards and service related industries such as dining, floral and entertainment have shown signs of decline, and additional regulations on loans reducing maximum interest rates chargeable from 24% to 20% came into effect in July 2021. These developments have put further downward pressure on the results of operations for credit card companies, including Shinhan Card. Furthermore, the Government’s recent guidelines to bolster consumer protection and protect customers’ personal data in the aftermath of data leaks at certain credit companies (not including Shinhan Card) may result in additional compliance costs for Shinhan
8
Card. Customer attrition, together with any further lowering of fees or reduction in base and market interest rates and/or additional expenses from more extensive marketing and promotional campaigns that Shinhan Card might implement to acquire and retain customers, could reduce its revenues and earnings. Furthermore, the average credit quality of Shinhan Card’s customers may deteriorate if customers with higher credit quality borrow from our competitors rather than Shinhan Card and it may become more difficult for Shinhan Card to attract and maintain quality customers. In general, the growth, market share and profitability of Shinhan Card’s operations may decline or become negative as a result of market saturation in this sector, interest rate competition, pressure to lower fee rates and incur higher marketing expenses, as well as Government regulation and social and economic developments in Korea that are beyond our control, such as changes in consumer confidence levels, spending patterns or public perception of credit card usage and consumer debt. If Shinhan Card fails to maintain or attract new cardholders or increase the card usage by existing customers or experiences deterioration in its asset quality and a rise in delinquency, our business, financial condition and results of operations may be adversely affected. In other financial services sectors, our other subsidiaries also compete in a highly fragmented market. Some of our competitors, particularly major global financial institutions, have greater experience and resources than we do.
Consolidation among our rival institutions and the Government’s privatization efforts may also add competition in the markets in which we and our subsidiaries conduct business. A number of significant mergers and acquisitions in the industry have taken place in Korea recently. In January 2019, Woori Financial Group was established pursuant to a comprehensive stock transfer under the Korean Commercial Code whereby holders of the common stock of Woori Bank and certain of its subsidiaries transferred all of their shares to Woori Financial Group (the new financial holding company) and in return received shares of Woori Financial Group. As a result, Woori Bank and certain of its former wholly-owned subsidiaries became direct and wholly-owned subsidiaries of Woori Financial Group. The Korea Deposit Insurance Corp., which as of April 9, 2021 owned 17.25% of the outstanding common stock of Woori Financial Group, has sold 13.63% of the outstanding common stock of Woori Financial Group in multiple transactions in accordance with its plan that was approved by the Financial Services Commission in June 2019. The Korea Deposit Insurance Corp. sold additional 2.33% of the outstanding common stock of Woori Financial Group in May 2022 and currently owns only 1.29% of the outstanding common stock of Woori Financial Group. In the asset management business sector, Woori Financial Group acquired two asset management companies, Tongyang Asset Management and ABL Global Asset Management (former Allianz Global Investors). In August 2021, KB Financial Group completed the acquisition of Prudential Life Insurance, the former Korean unit of Prudential Financial Inc. Any of these developments may place us at a competitive disadvantage and outweigh any potential benefit to us in the form of opportunities to acquire new customers who are displeased with the level of services at the newly reorganized entities or to provide credit facilities to corporate customers who wish to maintain relationships with a wide range of banks in order to diversify their sources of funding.
On February 1, 2019, we acquired a 59.15% interest in Orange Life Insurance, the former Korean unit of ING Life Insurance, as part of our efforts to diversify and enhance our non-banking businesses. On January 28, 2020, we acquired the remaining interests in Orange Life Insurance by effecting a comprehensive stock exchange under Articles 360-2 of the Korean Commercial Code whereby holders (other than us) of Orange Life Insurance’s common stock transferred all of their shares to us and in return receive shares of our common stock, and hence Orange Life Insurance became our wholly owned subsidiary as of such date. In May 2021, the Financial Services Commission approved the merger of Shinhan Life Insurance and Orange Life Insurance, with Shinhan Life Insurance being the surviving entity upon completion of the merger. Orange Life Insurance was subsequently merged with and into Shinhan Life Insurance in July 2021. On September 29, 2020, we acquired a 96.8% interest in Neoplux Co., Ltd. (“Neoplux”), a venture capital company formerly under the Doosan Group. On December 30, 2020, we acquired the remaining interest in Neoplux by effecting a small-scale stock exchange under Article 360-10 of the Korean Commercial Code, and hence Neoplux has become our wholly owned subsidiary as of such date. On January 11, 2021, Neoplux changed its legal name to Shinhan Venture Investment. In addition, on January 15, 2021, we acquired the remaining 35% interest in Shinhan BNP Paribas Asset Management Co., Ltd. (“Shinhan BNP Paribas Asset Management”) and changed its legal name to Shinhan
9
Asset Management, and hence Shinhan Asset Management has become our wholly-owned subsidiary as of such date. On June 30, 2022 we acquired 94.54% interest in BNP Paribas Cardif General Insurance, which then changed its name to Shinhan EZ General Insurance, Ltd. Subsequently in November 2022, Shinhan EZ General Insurance, Ltd. conducted a paid-in capital increase and our shares decreased to 85.1%. We expect that such consolidation and other structural changes in the financial industry will continue. Other financial institutions may seek to acquire or merge with other entities, and the financial institutions resulting from such consolidation may, by virtue of their increased size and business scope, provide greater competition for us. Increased competition and continuing consolidation may lead to decreased margins, resulting in a material adverse impact on our future profitability.
Regulatory reforms and the general modernization of business practices in Korea have also led to increased competition among financial institutions in Korea. In December 2017, the Financial Services Commission introduced the “my account at a glance” system, which enables consumers to view their key financial account information online, including information on banks, insurances, mutual finance, loan and card issuances on one page. The “my account at a glance” system became available on mobile channels in February 2016 and expanded its scope of services to include savings banks and securities companies. Since their introduction, the integrated automatic payment transfers management service, integrated account management service and “my account at a glance” system have gained widespread acceptance. As the reform of the financial sector continues, competition may become more intense among existing banks, insurance companies, securities companies and other financial organizations, and may lead to significant changes in the current Korean financial market. Moreover, since January 1, 2020, in calculating loan to deposit ratio, retail loans and corporate loans are weighed differently, with retail loans subject to a multiple of 115% and corporate loans (excluding loans to SOHOs) subject to a multiple of 85%, thereby increasing the impact of retail loans and reducing the impact of corporate loans in calculating such ratio. This may further intensify competition for corporate loans and deposits among commercial banks and, as a result, Shinhan Bank may face difficulties in increasing or retaining its corporate loans and deposits, which in turn may result in an increase in its cost of funding.
Furthermore, as the Korean economy further develops and new business opportunities arise, more competitors may enter the financial services industry. For example, as online service providers and technology companies with large-scale user networks, such as Kakao Corp., NAVER and Samsung Electronics, recently make significant inroads in providing virtual payment services through a system based on a growing convergence of financial services and technology commonly referred to as “fintech,” competition for online customers is growing not just among commercial banks, but also from online and mobile payment service providers. In 2015, the Government announced its plans to allow Internet-only banks to operate in Korea. KT consortium’s K-Bank, Kakao consortium’s Kakao Bank and Viva Republica consortium’s Toss Bank commenced operations in April 2017, July 2017 and October 2021, respectively. Internet-only banks may have advantages over traditional banks as the former can pass savings in labor and overhead costs to their customers by offering higher interest rates on deposit accounts, lower loan costs and reduced service fees. Accordingly, commercial banks will likely face increasing pressure to upgrade their service platforms to attract and maintain online users, which represents a growing customer base compared to traditional customers who have primarily conducted banking in-person at physical banking branches.
As part of the Government’s financial policies to promote innovative digital finance, 10 commercial banks, including Shinhan Bank, began offering a preliminary open banking service in October 2019. More local banks and fintech companies joined in December 2019, when the open banking service was fully and officially launched. Open banking service allows each fintech company and bank to provide banking services, such as checking balances and making withdrawals and transfers, with regards to customers’ accounts at other banks. Using open banking service, customers can easily access accounts, products and services across multiple banks, instead of being limited to the accounts, products and services available at the particular bank that they deal with. In addition, on January 9, 2020, the Korean National Assembly passed amendments to three major data privacy laws (the Personal Information Protection Act, the Act on the Promotion of Information and Communications Network Utilization and Information Protection and the Act on the Use and Protection of Credit Information).
10
These amendments introduced the MyData service, allowing and requiring (upon the customer’s request and subject to compliance requirements) financial institutions that have been approved by the Financial Service Commission as a MyData service provider access and sharing of customers’ personal information, credit information and transaction data. On January 27, 2021, Shinhan Bank and Shinhan Card each obtained a license from the Financial Services Commission as a MyData service provider. On January 5, 2023, Shinhan Bank launched the MyData business and Shinhan Card is planning to provide advanced wealth management and various financial services. Until October 13, 2021, the Financial Services Commission granted MyData licenses to 58 companies (46 companies receiving main licenses and 12 companies receiving preliminary licenses), 22 of which were fintech firms (19 companies receiving main licenses and three companies receiving preliminary licenses), and competition between traditional financial institutions like us and fintech firms is expected to intensify, particularly with respect to asset management services. On January 5, 2022, the API-based MyData service was fully implemented and 33 companies (including ten fintech firms) are providing services. As of December 31, 2022, the Financial Services Commission had granted licenses to 64 companies to operate as MyData service providers, 24 of which were fintech or IT firms. If more fintech companies receive authorization as MyData service providers, we expect competition for customers among banks and fintech firms to intensify. In addition, the Financial Services Commission also led discussions in July 2022 about the creation of a government-led platform where consumers can compare loan products from various financial institutions and apply for debt consolidation on a single platform. The platform is expected to launch in May 2023.
Recently, following the global financial crisis, the Government has subjected Korean financial institutions to stricter regulatory requirements and guidelines in areas of asset quality, capital adequacy, liquidity and residential and other lending practices (including a requirement to maintain a certain ratio of core capital to total risk exposure, which was introduced in January 2018 in order to control excessive leverage), which has had a dampening effect on competition. The Financial Services Commission implemented the capital requirements of Basel III, whose minimum requirements were phased in sequentially from December 1, 2013 through full implementation by January 1, 2015, based on the guidelines set forth in the amended Regulation on the Supervision of the Banking Business and the Detailed Regulation on the Supervision of the Banking Business. In addition, the Financial Services Commission has implemented the Basel III requirements relating to liquidity coverage ratio and capital conservation buffer, each of which have been fully phased in as of January 1, 2019. As of January 1, 2016, the Financial Services Commission implemented Basel III requirements relating to accumulation of additional capital for systemically important banks and bank holding companies and countercyclical capital buffer requirements. Each year, the Financial Services Commission may designate banks with significant influence (based on size and connectivity with other financial institutions) on the domestic financial system as a domestic systemically important bank and require the accumulation of additional capital in accordance with the highest of: (i) ratio of common equity capital to risk-weighted assets, ranging from 0.0% to 2.0%, depending on the systematic importance evaluation score, (ii) if the bank’s holding company is a domestic systemically important bank holding company, the capital ratio corresponding to the additional capital required for the bank holding company under the Financial Holding Company Supervision Regulations, or (iii) if the bank is also a global systemically important bank, as defined by the Basel Committee on Banking Supervision (the “Basel Committee”), the capital ratio as required by the Basel Committee. According to the instructions of the Financial Services Commission, domestic systemically important banks, including Shinhan Bank, have been required to maintain an additional capital buffer of 0.25% since January 1, 2016, with such buffer increased by 0.25% annually to reach 1.00% as of January 1, 2019. The Financial Services Commission may also, upon quarterly review, determine and require banks to accumulate a required level of countercyclical capital buffer within the range of 0% to 2.5% of risk-weighted assets, taking into account factors such as the degree of increase in credit relative to the gross domestic product. In July 2021, Shinhan Financial Group, Hana Financial Group, KB Financial Group, NongHyup Financial Group and Woori Financial Group were designated by the Financial Services Commission as domestic systemically important bank holding companies, and Shinhan Bank, Hana Bank, Kookmin Bank, NongHyup Bank and Woori Bank were designated by the Financial Services Commission as domestic systemically important banks. In addition, in July 2021, the Financial Services Commission identified domestic systemically important bank holding companies and domestic systemically important banks as domestic systemically important financial institutions under the Act on the Structural Improvement of the
11
Financial Industry. Domestic systemically important financial institutions are required to prepare and submit their own recovery plans to the Financial Supervisory Service within three months from the date of notification of designation pursuant to the Act on the Structural Improvement of the Financial Industry. However, there is no assurance that these measures will have the effect of curbing competition or that the Government will not reverse or reduce such measures or introduce other deregulatory measures, which may further intensify competition in the Korean financial services industry. For further details on the capital requirements applicable to us, see “Item 4.B. Business Overview — Supervision and Regulation — Principal Regulations Applicable to Financial Holding Companies — Capital Adequacy.”
If, despite our efforts to adapt to the changing macroeconomic environment and comply with new regulations, we are unable to compete effectively in the changing business and regulatory environment, our profit margin and market share may erode and our future growth opportunities may become limited, which could adversely affect our business, financial condition and results of operations.
The extent to which the COVID-19 pandemic impacts our business, results of operations and financial condition will depend on future developments, which are highly uncertain and difficult to predict.
The rapid spread of COVID-19 and global health concerns relating to this outbreak, which was declared a “pandemic” by the World Health Organization in March 2020, have had severe negative impact on, among other things, financial markets, liquidity, economic conditions and trade and could continue to do so or could worsen for an unknown period of time, which could in turn have a material adverse impact on the our business, results of operations and financial condition, including liquidity, asset quality and growth. Risks associated with a prolonged outbreak of COVID-19 may include:
| |
• |
|
an increase in defaults on loan payments from our customers who may not be able to meet payment obligations, which may lead to an increase in delinquency; |
| |
• |
|
depreciation of the Won against major foreign currencies, which may increase our costs in servicing foreign currency-denominated debt and result in foreign exchange losses (see “Changes in interest rates, foreign exchange rates, bond and equity prices, and other market factors have affected and will continue to affect our business, results of operations and financial condition.”); |
| |
• |
|
impairments in the fair value of our investments in companies that may be adversely affected by COVID-19; and |
| |
• |
|
increased cyberattacks and financial crimes under the new working arrangements such as expanded telework for employees. |
The extent to which the COVID-19 pandemic will continue to impact our business, results of operations and financial condition will depend on future developments, including the timeliness and effectiveness of actions taken or not taken to contain and mitigate the effects of COVID-19 both in Korea and internationally by governments, central banks, healthcare providers, health system participants, other businesses and individuals, which are highly uncertain and difficult to predict. Therefore, the Korean and global economy may remain volatile or continue to deteriorate, which may also have the effect of increasing the likelihood and magnitude of the other risks described in this annual report.
We are continuously assessing forward looking information to reasonably estimate the adverse impact of COVID-19 on our asset portfolio. We accumulated W1,105 billion in COVID-19-related provisions since 2020 by reflecting forward looking criteria amid the COVID-19 pandemic, based on discounted cash flow assessment and reclassification of loss allowance stages depending on the extent of credit risk for certain loan assets. It is difficult to estimate the amount, if any, of additional special provisions for credit losses that will be incurred going forward as a result of COVID-19, and there is no guarantee that any such special provisions for credit losses will not be significant during first half of 2023 and beyond, and accordingly, the impact of COVID-19, including any special provisions for credit losses due to COVID-19, may have a material adverse effect on our
12
business, liquidity, financial condition and results of operations. See “Item 5.A. Operating Results — Results of Operations.”
We and our subsidiaries need to maintain our capital ratios above minimum required levels, and the failure to so maintain could result in the suspension of some or all of our operations.
We and our subsidiaries in Korea are required to maintain specified capital adequacy ratios. For example, since January 1, 2015, we and our banking subsidiaries in Korea are required to maintain a minimum common equity Tier I capital adequacy ratio of 4.5%, a Tier I capital adequacy ratio of 6.0% and a total capital (BIS) ratio of 8.0%. These ratios measure the respective regulatory capital as a percentage of risk-weighted assets on a consolidated basis and are determined based on guidelines of the Financial Services Commission. In addition, as further described below, Shinhan Bank is also required to maintain a capital conservation buffer and additional capital as a domestic systemically important bank and may be required to maintain a countercyclical capital buffer. Also, our subsidiaries Shinhan Card, Shinhan Life Insurance and Shinhan Securities are each required to maintain a consolidated adjusted equity capital ratio of 8.0%, a solvency ratio of 100% and a net capital ratio of 100%, respectively.
While we and our subsidiaries currently maintain capital adequacy ratios in excess of the respective required regulatory minimum levels, we or our subsidiaries may not be able to continue to satisfy the capital adequacy requirements for a number of reasons, including an increase in risky assets and provisioning expenses, substitution costs related to the disposal of problem loans, declines in the value of securities portfolios, adverse changes in foreign currency exchange rates, changes in the capital ratio requirements, the guidelines regarding the computation of capital ratios, or the framework set by the Basel Committee upon which the guidelines of the Financial Services Commission are based, or other adverse developments affecting our asset quality or equity capital.
In December 2010, the Basel Committee issued final rules in respect of (i) a global regulatory framework for more resilient banks and banking systems and (ii) an international framework for liquidity risk measurement, standards and monitoring, which together are commonly referred to as “Basel III.” Under Basel III, Tier I capital is defined to include common equity Tier I and additional Tier I capital. Common equity Tier I capital is a new category of capital primarily consisting of common stock, capital surplus, retained earnings and other comprehensive income (progressively phased into the capital ratio calculation over several years). The new minimum capital requirements, including the minimum common equity Tier I requirement of 4.5% and additional mandatory capital conservation buffer requirement of 2.5%, have been fully implemented as of January 1, 2019. Additional discretionary countercyclical capital buffer requirements are also expected to be phased in, which will range at the discretion of national regulators between 0% and 2.5% of risk-weighted assets. Basel III also introduces a minimum leverage ratio requirement. On December 7, 2017, the Basel Committee finalized several key methodologies for measuring risk-weighted assets. The revisions include a standardized approach for credit risk, a standardized approach for operational risk, revisions to the credit valuation adjustment (CVA) risk framework and constraints on the use of internal models. The Basel Committee had also previously finalized a revised standardized model for counterparty credit risk, revisions to the securitization framework and its fundamental review of the trading book, which updates both modeled and standardized approaches for market risk measurement. The revisions also include an output floor set at 72.5% of total risk-weighted assets based on the revised standardized approaches to limit the extent to which banks can reduce risk-weighted asset levels through the use of internal models. In order to provide additional operational capacity for banks and supervisors to respond to the impact of COVID-19 on the global banking system, the Basel Committee has announced deferral of the implementation date of the final Basel III standards by one year, to January 2023, including the revised standardized approach for credit and operational risk, revised CVA framework, and revised market risk framework. The 72.5% output floor is subject to a six-year phase-in period, beginning at 60% in January 2020 and increasing to 72.5% by January 2028. Upon implementation, banks in jurisdictions that permit reference to external credit ratings will be able to take into account external credit ratings in determining the risk weights for certain exposure classes, and different mortgage risk weights will apply depending on the loan-to-value ratio of
13
the mortgage. In addition, the 2017 reforms remove the option to use internal ratings-based approaches for measurement of equity exposures, thus requiring use of the standardized approach. Banks will also need to reflect internal loss data in evaluating operational risk and comply with the principles for sound management of operational risk.
In order to implement the capital requirements under Basel III in Korea, the Regulation on the Supervision of the Banking Business was amended, effective December 1, 2013. Under the amended Regulation on the Supervision of the Banking Business, effective from January 1, 2015, commercial banks in Korea are required to maintain a minimum common equity Tier I ratio of 4.5%, a minimum Tier I capital ratio of 6.0% and a minimum total capital (BIS) ratio of 8.0%. The Regulation on the Supervision of the Banking Business was further amended on December 26, 2014, to implement the liquidity coverage ratio requirements under Basel III in increments of 5% annually, from 80% as of January 1, 2015 to 100% as of January 1, 2019. In April 2020, in response to the COVID-19 pandemic, the Financial Services Commission temporarily lowered the liquidity coverage ratio requirement from 100% to 85%. The Financial Services Commission subsequently decided to gradually restore this ratio on a quarterly basis from the third quarter of 2022, to a ratio of 90% in the third quarter of 2022, 92.5% in the fourth quarter of 2022, 95% in the first quarter of 2023, 97.5% in the second quarter of 2023 and 100% from the third quarter of 2023. However, in October 2022, the Financial Services Commission decided to apply the 92.5% ratio until the end of June 2023 in response to the increasing volatility and uncertainty in the short-term money market, as determined through a financial market inspection meeting. Capital conservation buffer requirements have also been phased in from January 1, 2016 in increments of 0.625% annually, to the effect that commercial banks in Korea are required to maintain a capital conservation buffer of 2.5% as of January 1, 2019. If a commercial bank fails to maintain such capital conservation buffer requirements, such bank will be subject to certain restrictions relating to its use of income, such as distributing dividends and purchasing treasury stock. As of January 1, 2016, the Financial Services Commission implemented Basel III requirements relating to accumulation of additional capital for systemically important banks and bank holding companies and countercyclical capital buffer requirements. Each year, the Financial Services Commission may designate banks with significant influence (based on size and connectivity with other financial institutions) on the domestic financial system as a domestic systemically important bank and require the accumulation of additional capital in accordance with the highest of: (i) ratio of common equity capital to risk-weighted assets, ranging from 0.0% to 2.0%, depending on the systematic importance evaluation score, (ii) if the bank’s holding company is a domestic systemically important bank holding company, the capital ratio corresponding to the additional capital required for the bank holding company under the Financial Holding Company Supervision Regulations, or (iii) if the bank is also a global systemically important bank, as defined by the Basel Committee, the capital ratio as required by the Basel Committee. Shinhan Financial Group and Shinhan Bank were selected as a domestic systemically important bank holding company and domestic systemically important bank, respectively, from 2016 through 2022. According to the instructions of the Financial Services Commission, domestic systemically important banks, including Shinhan Bank, have been required to maintain an additional capital buffer of 0.25% since January 1, 2016, with such buffer increased by 0.25% annually to reach 1.00% as of January 1, 2019. The Financial Services Commission may also, upon quarterly review, determine and require banks to accumulate a required level of countercyclical capital buffer within the range of 0% to 2.5% of risk-weighted assets, taking into account factors such as the degree of increase in credit relative to the gross domestic product. Since March 2016, the Financial Services Commission has maintained countercyclical capital buffer requirements at 0%.
We and our banking subsidiaries are currently, and have been, in full compliance with Basel III requirements as implemented in Korea since its introduction in December 2013. However, there is no assurance that we will continue to be able to be in compliance with Basel III requirements. New requirements under Basel III may require an increase in the credit risk capital requirements in the future, which may require us or our subsidiaries to either improve asset quality or raise additional capital. In addition, if the capital adequacy ratios of us or our subsidiaries were to fall below the required levels, the Financial Services Commission might impose penalties ranging from a warning to suspension or revocation of our or our subsidiaries’ business licenses. In order to maintain the capital adequacy ratios above the required levels, we or our subsidiaries may be required to raise additional capital through equity financing, but there is no assurance that we or our subsidiaries will be able
14
to do so on commercially favorable terms or at all and, even if successful, any such capital raising may have a dilutive effect on our shareholders with respect to their interest in us or on us with respect to our interest in our subsidiaries.
Liquidity, funding management and credit ratings are critical to our ongoing performance.
Liquidity is essential to our business as a financial intermediary, and we may seek additional funding in the near future to satisfy liquidity needs, meet regulatory requirements, enhance our capital levels or fund the growth of our operations as opportunities arise.
For example, Basel III includes an international framework for liquidity risk measurement, standards and monitoring, as noted above, including a new minimum liquidity standard, known as the liquidity coverage ratio, which is designed to ensure that banks have an adequate stock of unencumbered high quality liquid assets (“HQLA”) that can be easily and speedily converted into cash in the private marketplace to survive a significant stress scenario lasting 30 calendar days. The liquidity coverage ratio is computed as (a) the value of a banking organization’s HQLA, divided by (b) its total expected net cash outflows over the next 30 calendar days under stress scenarios. The minimum liquidity coverage ratio is 100%. In January 2013, the Basel Committee released a revised formulation of the liquidity coverage ratio, one of two quantitative liquidity measures approved in December 2010 as part of Basel III. The Basel Committee extended the timetable for full phase-in of the liquidity coverage ratio to the effect that the minimum liquidity coverage ratio was set at 60% as of January 1, 2015 and thereafter was increased in annual increments of 10% so that the minimum liquidity coverage ratio reached 100% as of January 1, 2019. In December 2014, the Financial Services Commission promulgated regulations to implement the liquidity requirements of Basel III, including raising the minimum liquidity coverage ratio to 80% as of January 1, 2015 and thereafter by annual increments of 5% so that the minimum liquidity coverage ratio for commercial banks in Korea is 100% since January 1, 2019. In April 2020, in response to the COVID-19 pandemic, the Financial Services Commission temporarily lowered the liquidity coverage ratio requirement from 100% to 85%. The Financial Services Commission subsequently decided to gradually restore this ratio on a quarterly basis from the third quarter of 2022, to a ratio of 90% in the third quarter of 2022, 92.5% in the fourth quarter of 2022, 95% in the first quarter of 2023, 97.5% in the second quarter of 2023 and 100% from the third quarter of 2023. However, in October 2022, the Financial Services Commission decided to apply the 92.5% ratio until the end of June 2023 in response to the increasing volatility and uncertainty in the short-term money market, as determined through a financial market inspection meeting.
A substantial part of the liquidity and funding requirements for our banking subsidiaries is met through short-term customer deposits, which typically roll over upon maturity. While the volume of our customer deposits has generally been stable over time, customer deposits have from time to time declined substantially due to the popularity of other, higher-yielding investment opportunities, namely stocks and mutual funds, for example, during times of bullish stock markets. During such times, our banking subsidiaries were required to obtain alternative funding at higher costs. There is no assurance that a similar development will not occur in the future. In addition, in recent years, we have faced increasing pricing competition from our competitors with respect to our deposit products. If we do not continue to offer competitive interest rates to our deposit customers, we may lose their business, which has traditionally provided a stable and low-cost source of funding. In addition, even if we are able to match our competitors’ pricing, doing so may result in an increase in our funding costs, which may have an adverse impact on our results of operations.
We and our subsidiaries also raise funds in capital markets and borrow from other financial institutions, the cost of which depends on market rates and the general availability of credit and the terms of which may limit our ability to pay dividends, make acquisitions or subject us to other restrictive covenants. While we and our subsidiaries are not currently facing liquidity difficulties in any material respect, if we or our subsidiaries are unable to obtain the funding we need on terms commercially acceptable to us for an extended period of time for whatever reason, we may not be able to ensure our financial viability, meet regulatory requirements, implement our strategies or compete effectively.
15
Credit ratings affect the cost and other terms upon which we and our subsidiaries are able to obtain funding. Domestic and international rating agencies regularly evaluate us and our subsidiaries, and their ratings of our and our subsidiaries’ long-term debt are based on a number of factors, including our financial strength as well as conditions affecting the financial services industry and the Korean economy in general. There can be no assurance that the rating agencies will maintain our current ratings or outlooks. There is no assurance that Shinhan Bank, Shinhan Card, any of our other major subsidiaries or our holding company will not experience a downgrade in their respective credit ratings and outlooks for reasons related to the general Korean economy or reasons specific to such entity. Any downgrades in the credit ratings and outlooks of us and our subsidiaries will likely increase our cost of funding, limit our access to capital markets and other borrowings, or require us to provide additional credit enhancement in financial transactions, any of which could adversely affect our liquidity, net interest margins and profitability, and in turn, our business, financial condition and results of operations.
Changes in interest rates, foreign exchange rates, bond and equity prices, and other market factors have affected and will continue to affect our business, results of operations and financial condition.
The most significant market risks we face are interest rate, foreign exchange and bond and equity price risks. Changes in interest rate levels, yield curves and spreads may affect the interest rate margin realized between lending and borrowing costs. Changes in foreign currency exchange rates, particularly in the Korean Won to U.S. Dollar exchange rates, affect the value of our assets and liabilities denominated in foreign currencies, the reported earnings of our non-Korean subsidiaries and income from foreign exchange dealings, and substantial and rapid fluctuations in exchange rates may cause difficulty in obtaining foreign currency-denominated financing in the international financial markets on commercial terms acceptable to us or at all. The performance of financial markets may affect bond and equity prices and, therefore, cause changes in the value of our investment and trading portfolios. While we have implemented risk management systems and risk thresholds to mitigate and control these and other market risks to which we are exposed, it is difficult to predict with accuracy changes in economic or market conditions and to anticipate the effects that such changes could have on our business, financial condition and results of operations.
Historically, Korea, like many other countries, has experienced interest rate fluctuations, in part due to the Government’s policy to stabilize the economy through active rate-controlling measures. In November 2017, the Bank of Korea raised the base interest rate to 1.50%, marking the first time it has increased the base interest rate since 2011, and further raised such rate to 1.75% in November 2018. The Bank of Korea reduced the base interest rate from 1.75% to 1.50% in July 2019, from 1.50% to 1.25% in October 2019, from 1.25% to 0.75% in March 2020 and from 0.75% to 0.50% in May 2020. The Bank of Korea raised the base interest rate from 0.50% to 0.75% in August 2021, from 0.75% to 1.00% in November 2021, from 1.00% to 1.25% in January 2022, from 1.25% to 1.50% in April 2022, from 1.50% to 1.75% in May 2022, from 1.75% to 2.25% in July 2022, from 2.25% to 2.50% in August 2022, from 2.50% to 3.00% in October 2022 and from 3.00% to 3.25% in November 2022. The Bank of Korea further raised the base interest rate from 3.25% to 3.50% in January 2023. Interest rate movements, in terms of magnitude and timing as well as their relative impact on our assets and liabilities, have a significant impact on our net interest margin and profitability, particularly with respect to our financial products that are sensitive to such movements. For example, if the interest rates applicable to our loans (which are recorded as assets) increase at a slower pace or by a thinner margin than the interest rates applicable to our deposits (which are recorded as liabilities), our net interest margin will shrink and our profitability will be negatively affected. In addition, the relative size and composition of our variable rate loans and deposits (as compared to our fixed rate loans and deposits) may also impact our net interest margin. Furthermore, the difference in the average repricing frequency of our interest-earning assets (primarily loans) compared to our interest-bearing liabilities (primarily deposits) may also impact our net interest margin. For example, since our deposits tend to have longer terms, on average, than those of our loans, our deposits are on average less sensitive to movements in the base interest rates on which our deposits and loans tend to be pegged, and therefore, a decrease in the base interest rates tends to decrease our net interest margin while an increase in the base interest rates tends to have the opposite effect. While we continually manage our assets and liabilities to minimize our exposure to interest rate volatility, such efforts by us may not mitigate the impact of interest rate volatility in a
16
timely or effective manner, and our net interest margin, and in turn our financial condition and results of operations, could suffer significantly.
The following table sets forth, for the periods and dates indicated, certain information concerning the Noon Buying Rate in Won per US$1.00.
|
|
|
|
|
|
|
|
|
|
|
|
|
|
|
|
|
| Year Ended December 31, |
|
At End of Period |
|
|
Average(1) |
|
|
High |
|
|
Low |
|
| |
|
|
|
|
|
|
|
|
|
|
|
|
| |
|
(Won per US$1.00) |
|
| 2018 |
|
|
1,112.9 |
|
|
|
1,099.3 |
|
|
|
1,141.7 |
|
|
|
1,054.6 |
|
| 2019 |
|
|
1,155.5 |
|
|
|
1,165.8 |
|
|
|
1,220.7 |
|
|
|
1,111.8 |
|
| 2020 |
|
|
1,086.1 |
|
|
|
1,180.6 |
|
|
|
1,267.3 |
|
|
|
1,081.9 |
|
| 2021 |
|
|
1,188.6 |
|
|
|
1,144.9 |
|
|
|
1,198.7 |
|
|
|
1,081.6 |
|
| 2022 |
|
|
1,260.2 |
|
|
|
1,291.8 |
|
|
|
1,440.5 |
|
|
|
1,187.0 |
|
| October |
|
|
1,424.6 |
|
|
|
1,426.1 |
|
|
|
1,440.3 |
|
|
|
1,402.3 |
|
| November |
|
|
1,316.8 |
|
|
|
1,361.8 |
|
|
|
1,424.0 |
|
|
|
1,316.8 |
|
| December |
|
|
1,260.2 |
|
|
|
1,293.6 |
|
|
|
1,322.2 |
|
|
|
1,260.2 |
|
| 2023 (through April 14) |
|
|
1,299.1 |
|
|
|
1,281.8 |
|
|
|
1,325.3 |
|
|
|
1,220.3 |
|
| January |
|
|
1,232.0 |
|
|
|
1,243.1 |
|
|
|
1,272.2 |
|
|
|
1,227.3 |
|
| February |
|
|
1,323.5 |
|
|
|
1,275.4 |
|
|
|
1,323.5 |
|
|
|
1,220.3 |
|
| March |
|
|
1,303.8 |
|
|
|
1,306.0 |
|
|
|
1,324.5 |
|
|
|
1,278.9 |
|
| April (through April 14) |
|
|
1,299.1 |
|
|
|
1,315.6 |
|
|
|
1,325.3 |
|
|
|
1,299.1 |
|
Source: Federal Reserve Board
Note:
| (1) |
The average rate for annual and interim periods were calculated by taking the simple average of the Noon Buying Rates on the last day of each month during the relevant period. The average rates for the monthly periods (or portion thereof) were calculated by taking the simple average of the daily Noon Buying Rates during the relevant month (or portion thereof). |
We have translated certain amounts in Korean Won, which appear in this annual report, into U.S. Dollars for convenience. This does not mean that the Won amounts referred to could have been, or could be, converted into U.S. Dollars at any particular rate, the rates stated above, or at all. Unless otherwise stated, translations of Won amounts to U.S. Dollars are based on the Noon Buying Rate in effect on December 30, 2022, which was W1,260.2 to US$1.00. On April 14, 2023, the Noon Buying Rate in effect was W1,299.1 to US$1.00.
We cannot assure you when and to what extent the Bank of Korea will in the future adjust the base interest rate, to which the market interest rate correlates. A decision to adjust the base interest rate is subject to many policy considerations as well as market factors, including the general economic cycle, inflationary levels, interest rates in other economies and foreign currency exchange rates, among others. In general, a decrease in interest rates adversely affects our interest income due to the different maturity structure for our assets and liabilities as discussed above. In contrast, if there were to be a significant or sustained increase in interest rates, all else being equal, such movement would lead to a decline in the value of traded debt securities and could also raise our funding costs, while reducing loan demand, especially among retail customers. Rising interest rates may therefore require us to re-balance our assets and liabilities in order to minimize the risk of potential mismatches in our asset liability management and to maintain our profitability. In addition, rising interest rates may adversely affect the Korean economy and the financial condition of our corporate and retail borrowers, including holders of our credit cards, which in turn may lead to deterioration of asset quality for our credit portfolio. Since most of our retail and corporate loans bear interest at rates that adjust periodically based on prevailing market rates, a sustained increase in interest rates will increase the funding costs of our borrowers and may adversely affect their ability to make payments on their outstanding loans. See “Item 5.A. Operating Results — Interest Rates.”
17
Replacement of London Interbank Offered Rate and reforms of other interest rate benchmarks could adversely affect our business, financial condition and results of operations.
Many of our products and services have referred to benchmark interest rates such as the London Interbank Offered Rate (“LIBOR”) in many currencies, including the U.S. Dollar. We have also utilized such benchmark interest rates for our own evaluation of financial instruments and various other internal management purposes. In March 2021, the U.K. Financial Conduct Authority (the “FCA”), which has regulatory authority with respect to LIBOR, announced that all LIBOR settings will either cease to be provided by any administrator or no longer be representative (i) after December 31, 2021 in the case of all Sterling, Euro, Swiss franc and Japanese yen settings and the one-week and two month U.S. dollar settings and (ii) after June 30, 2023 in the case of the remaining U.S. dollar settings. While the ICE Benchmark Administration, the administrator of LIBOR, may publish certain LIBOR settings on the basis of a synthetic methodology for “tough legacy” contracts, there is no guarantee that such rates will be determined and published after the announced deadlines nor confirmed to be representative by the FCA.
In light of the transition away from LIBOR, the Secured Overnight Financing Rate (“SOFR”) has been identified by the Alternative Reference Rates Committee convened by the Board of Governors of the U.S. Federal Reserve System and the Federal Reserve Bank of New York as the preferred alternative benchmark reference rate for LIBOR and differs from LIBOR in many respects, including its basis on actual observed transactions in the U.S. treasury market as opposed to LIBOR’s usage of estimations of borrowing rates. While there are a number of international working groups focused on transition plans and the provision of fallback contract language that seek to minimize market disruption, replacement of LIBOR or any other benchmark with a new benchmark rate, such as SOFR, could adversely impact the value of and return on financial instruments and contracts. Moreover, replacement of LIBOR or other benchmark rates could result in market dislocations and have other adverse consequences for market participants, including the potential for increased costs, and litigation risks, including the potential for disputes with counterparties regarding the interpretation and enforceability of fallback contract language in LIBOR-based financial instruments and contracts. In particular, such transition may, among other things:
| |
• |
|
adversely affect the price, liquidity, profitability, and tradability of a wide range of financial instruments, such as loans and derivatives, included in our financial assets and liabilities that reference LIBOR and other interest rate benchmarks; |
| |
• |
|
require negotiations with our counterparties to modify contracts to replace the reference rate for existing contracts based on or linked to LIBOR and other interest rate benchmarks with an alternative interest rate; |
| |
• |
|
result in disputes with customers and counterparties concerning the interpretation of affected contracts or economic adjustments to the alternative interest rate adopted in connection with the replacement of LIBOR and other interest rates and the transition to alternative interest rates, or disputes concerning inappropriate trade practices or abuse of a dominant bargaining position in transactions with customers; |
| |
• |
|
require us to respond to regulatory authorities in connection with the replacement of LIBOR and other interest rates benchmarks and the transition to an alternative interest rate; |
| |
• |
|
require us to develop risk management and other operational systems and processes (including information technology systems) necessary to effectively deal with the replacement of LIBOR and other interest rates and the transition to an alternative interest rate, which may prove challenging or impossible, or incur significant investment and other costs in connection with such replacement and transition; or |
| |
• |
|
result in accounting or other issues, such as by causing hedging accounting items to be derecognized. |
There can be no assurance that a change in the benchmark interest rate and related valuation methods will not have a material adverse effect on our business, results of operations and financial condition.
18
We may incur losses associated with our counterparty exposures.
We face the risk that counterparties will be unable to honor contractual obligations to us or our subsidiaries. These parties may default on their obligations to us or our subsidiaries due to bankruptcy, lack of liquidity, operational failure or other reasons. This risk may arise, for example, from entering into swaps or other derivative contracts under which counterparties have obligations to make payments to us or our subsidiaries or in executing currency or other trades that fail to settle at the required time due to non-delivery by the counterparty or systems failure by clearing agents, exchanges, clearing houses or other financial intermediaries. Any realization of counterparty risk may adversely affect our business, operations and financial condition.
Risks Relating to Our Banking Business
We have significant exposure to small- and medium-sized enterprises, and financial difficulties experienced by such enterprises may result in a deterioration of our asset quality.
Our banking activities are conducted primarily through our wholly-owned subsidiary, Shinhan Bank. One of our core banking businesses has historically been and continues to be lending to small- and medium-sized enterprises (as defined in “Item 4.B. Business Overview — Our Principal Activities — Corporate Banking Services — Small- and Medium-sized Enterprises Banking”). Shinhan Bank’s loans (before allowance for loan losses and deferred loan origination costs and fees) to such enterprises amounted to W108,016 billion as of December 31, 2020, W121,961 billion as of December 31, 2021 and W131,304 billion as of December 31, 2022, representing 29.9%, 31.0% and 31.4%, respectively, of our total loan portfolio as of such dates.
Compared to loans to large corporations, which tend to be better capitalized and better able to weather business downturns, or loans to individuals and households, which tend to be secured with homes and with respect to which the borrowers are therefore less willing to default, loans to small- and medium-sized enterprises have historically had a relatively higher delinquency ratio. Many small- and medium-sized enterprises represent sole proprietorships or small businesses dependent on a relatively limited number of suppliers or customers and tend to be affected to a greater extent than large corporate borrowers by fluctuations in the Korean and global economy. In addition, small- and medium-sized enterprises often maintain less sophisticated financial records than large corporate borrowers. Therefore, it is generally more difficult for banks to judge the level of risk inherent in lending to such enterprises, as compared to large corporations. In addition, many small- and medium-sized enterprises are dependent on business relationships with large corporations in Korea, primarily as suppliers. Any difficulties encountered by those large corporations would likely hurt the liquidity and financial condition of related small- and medium-sized enterprises, including those to which we have exposure, also resulting in an impairment of their ability to repay loans. As large Korean corporations continue to expand into China, Southeast Asia and other countries with lower labor costs and other expenses by relocating their production plants and facilities to such countries, such development may have a material adverse impact on such small- and medium-sized enterprises.
Financial difficulties experienced by small- and medium-sized enterprises as a result of, among other things, recent economic difficulties in Korea and globally and aggressive marketing and intense competition among banks to lend to this segment in recent years, coupled with our efforts to counter asset quality deterioration through conservative lending policy, have led to a fluctuation in the asset quality of our loans to this segment. As of December 31, 2020, 2021 and 2022, Shinhan Bank’s delinquent loans to small- and medium-sized enterprises were W372 billion, W363 billion and W385 billion, respectively, representing delinquency ratios (net of charge-offs and loan sales) of 0.34%, 0.30% and 0.29%, respectively. If the ongoing difficulties in the Korean or global economy were to continue or aggravate, the delinquency ratio for our loans to small- and medium-sized enterprises may rise.
Of particular concern is our exposure to enterprises in the real estate and leasing and construction industries. As of December 31, 2022, Shinhan Bank had outstanding loans (before allowance for credit losses on loans and deferred loan origination costs and fees) to enterprises in the real estate and leasing and construction industries
19
(many of which are small- and medium-sized enterprises) of W41,991 billion and W4,024 billion, respectively, representing 12.1% and 1.2%, respectively, of its total loan portfolio as of such date. We also have other exposure to borrowers in these sectors of the Korean economy, including extending guarantees for the benefit of such companies and holding debt and equity securities issued by such companies. In addition, Shinhan Bank has exposure to borrowers in the shipbuilding and shipping industries, which have yet to stage a meaningful turnaround.
The enterprises in the real estate development and construction industries in Korea, which are heavily concentrated in the housing market, have recently seen modest growth backed by the housing market which has remained strong over the recent few years. However, the Government’s policy measures to stabilize the real estate market, oversupply of residential property, ongoing economic sluggishness in Korea and globally and demographic changes in the Korean population may result in difficulties to the housing market in general as well as these enterprises. We also have limited exposure to real estate project financing, particularly by construction companies that have built residential units in provinces outside the metropolitan Seoul area, which have experienced a relatively low rate of pre-sales, the proceeds from which the construction companies primarily rely on as a key source for liquidity and cash flow.
Any of the foregoing developments may result in deterioration in the asset quality of our banking subsidiaries. See “Item 4.B. Business Overview — Description of Assets and Liabilities — Credit Exposures to Companies in Workout and Recovery Proceedings.” We have been taking active steps to curtail delinquency among our small- and medium-sized enterprise customers, including by way of strengthening loan application review processes and closely monitoring borrowers in troubled sectors. Despite such efforts, there is no assurance that the delinquency ratio for our loans to small- and medium-sized enterprises will not rise in the future, especially if the Korean economy were to face renewed difficulties and, as a result, the liquidity and cash flow of these borrowers deteriorate. A significant rise in the delinquency ratios among these borrowers would lead to increased charge-offs and higher provisioning and reduced interest and fee income, which would have a material adverse effect on our business, financial condition and results of operations.
A decline in the value of the collateral securing our loans or our inability to fully realize the collateral value may adversely affect our credit portfolio.
Most of our mortgage and home equity loans are secured by borrowers’ homes, other real estate, other securities and guarantees (which are principally provided by the Government and other financial institutions), and a substantial portion of our corporate loans are also secured, including by real estate. As of December 31, 2022, the secured portion were collateralized or guaranteed of Shinhan Bank’s loans amounted to W216,801 billion, representing 62.5% of its total loans. No assurance can be given that the collateral value will not materially decline in the future. Shinhan Bank’s general policy for mortgage and home equity loans is to lend up to 40% to 85% of the appraised value of the collateral, but subject to the maximum loan-to-value ratio, debt-to-income ratio and debt service ratio requirements for mortgage loans implemented by the Government, and to periodically re-appraise such collateral. In order to mitigate our loss in the event of a decrease in the value of collateral, we have made effort to increase the proportion of installment principal repayment-based loans and manage the loan-to-value ratio of loans. As of December 31, 2022, installment principal repayment-based housing loans accounted for 53.4% of the housing loans extended by Shinhan Bank, and the loan-to-value ratio of mortgage and home equity loans of Shinhan Bank was 41.7%. Despite these efforts however, if the real estate market in Korea experiences a downturn, the value of the collateral may fall below the outstanding principal balance of the underlying mortgage loans. Borrowers of such under-collateralized mortgages or loans may be forced to pay back all or a portion of such mortgage loans or, if unable to meet the collateral requirement through such repayment, sell the underlying collateral, which sales may lead to a further decline in the price of real estate in general and set off a chain reaction for other borrowers due to the further decline in the value of collateral. Declines in real estate prices reduce the value of the collateral securing our mortgage and home equity loans, and such reduction in the value of collateral may result in our inability to cover the uncollectible portion of our secured loans. A decline in the value of the real estate or other collateral securing our loans, or our inability to
20
obtain additional collateral in the event of such decline, may result in the deterioration of our asset quality and require us to make additional loan loss provisions. In Korea, foreclosure on collateral generally requires a written petition to a Korean court. Foreclosure procedures in Korea generally take 7 to 12 months from initiation to collection depending on the nature of the collateral, and foreclosure applications may be subject to delays and administrative requirements, which may result in a decrease in the recovery value of such collateral. No assurance can be given that we will be able to realize the full value of collateral as a result of, among others, delays in foreclosure proceedings, defects in the perfection of collateral and general declines in collateral value. Our failure to recover the expected value of collateral could expose us to significant losses.
Guarantees received in connection with our real estate financing may not provide sufficient coverage.
Primarily through Shinhan Bank, we, alone or together with other financial institutions, provide financing to real estate development projects, which are concentrated largely in the construction of residential complexes. Developers in Korea commonly use project financing to acquire land and pay for related project development costs. As a market practice, lenders in project financing, including Shinhan Bank, generally receive from general contractors a performance guarantee for the completion of projects by the developers as well as a payment guarantee for the loans raised by a special purpose financing vehicle established by the developers in order to procure the construction orders, as the developers tend to be small and highly leveraged. Shinhan Bank has actively managed and reduced its real estate project financing-related exposure, particularly during sustained downturns in the Korean real estate market. As of December 31, 2022, the total outstanding amount of Shinhan Bank’s real estate project financing-related exposure was W5.7 trillion. However, if defaults were to significantly increase under our existing loans to real estate development projects and the general contractors fail to pay the guaranteed amount necessary to cover the amount of our financings, this may have an adverse effect on our business, financial condition and results of operations.
A limited portion of our credit exposure is concentrated in a relatively small number of large corporate borrowers, and future financial difficulties experienced by them may have an adverse impact on us.
Of Shinhan Bank’s 10 largest corporate exposures as of December 31, 2022, two were companies for which Shinhan Bank was a main creditor bank. All of the 10 companies are or were members of the main debtor groups as identified by the Governor of the Financial Supervisory Service, which are largely comprised of the largest Korean commercial conglomerates known as “chaebols.” As of such date, the total amount of Shinhan Bank’s exposures to the 10 companies was W28,940 billion, or 8.6%, of its total exposures. As of that date, Shinhan Bank’s single largest outstanding exposure to a main debtor group amounted to W5,279 billion, or 1.6%, of its total exposures. Largely due to the continued stagnation in the shipbuilding industry, current and former member companies of the STX Group, one of the leading conglomerates in Korea, entered into voluntary arrangements in 2013 with their creditors (including Shinhan Bank) to improve their credit situation, and STX Offshore & Shipbuilding and STX Heavy Industries, two of the STX Group’s member companies, recently filed for court receivership in May 2016 and July 2016, respectively. Due to stagnation in the construction industry, Keangnam Enterprises Co., Ltd., a large construction company in Korea, also entered into workout proceedings in 2013 and subsequently filed for recovery proceedings in March 2015. Dongbu Steel Co., Ltd. and Sambu Construction Co., Ltd. also experienced significant hardship and entered into workout or recovery proceedings in 2015. Additionally, in October 2015, creditors of Daewoo Shipbuilding & Marine Engineering Co., Ltd., led by Korea Development Bank, announced a restructuring plan that included cash injection and additional loans totaling W4.2 trillion and extensive streamlining measures, and in November 2016, Korea Development Bank agreed to swap W1.8 trillion of debt to equity and the Export-Import Bank of Korea agreed to issue W1 trillion of perpetual bonds. Amid continued deterioration of Daewoo Shipbuilding & Marine Engineering Co., Ltd.’s financial conditions, in March 2017, Korea Development Bank and the Export-Import Bank of Korea further agreed to provide an additional W2.9 trillion in loans and swap W1.6 trillion of debt to equity, provided that other creditors and bondholders agree to certain debt-to-equity swaps and extension of maturities. In January 2016, Hanjin Heavy Industries & Construction Co., Ltd. entered into voluntary restructuring agreements with its creditors due to liquidity shortage in the wake of prolonged industry slowdown. Partly as a result of its active
21
past efforts to reduce exposure to the shipbuilding and construction sectors, Shinhan Bank currently has limited exposure to the aforementioned troubled companies. However, if the credit quality of Shinhan Bank’s exposure to large corporations, including those in the main debtor groups, declines, Shinhan Bank may be required to record additional loan loss provisions in respect of loans and impairment losses in respect of securities, which would adversely affect its financial condition, results of operations and capital adequacy. No assurance can be given that the allowances it has established against these exposures will be sufficient to cover all future losses arising from such exposures, especially in the case of a prolonged or renewed economic downturn.
A limited number of the main debtor groups to which Shinhan Bank has credit exposure are subject to restructuring programs or are otherwise making significant efforts to improve their financial conditions, such as by obtaining intragroup loans and entering into agreements to further improve their capital structures. No assurance can be given that there will not be future restructuring with Shinhan Bank’s major corporate customers or that such restructuring will not result in significant losses to Shinhan Bank with less than full recovery. In addition, if the Government decides to pursue an aggressive restructuring policy with respect to distressed companies, Korean commercial banks, including Shinhan Bank, may face a temporary rise in delinquencies and intensified pressure for additional provisioning. Furthermore, bankruptcies or financial difficulties of large corporations, including chaebol groups, may have an adverse ripple effect of triggering delinquencies and impairment of Shinhan Bank’s loans to small- and medium-sized enterprises that supply parts or labor to such corporations. If Shinhan Bank experiences future losses from its exposure to large corporations, including chaebol groups, it may have a material adverse effect on Shinhan Bank’s business, financial condition and results of operations. See “Item 4.B. Business Overview — Description of Assets and Liabilities — Loans — Loan Portfolio — Exposure to Main Debtor Groups.”
The asset quality of our retail loan portfolio may deteriorate.
In recent years, consumer debt, including lending to households and small unincorporated businesses, has continued to increase in Korea. Shinhan Bank’s portfolio of retail loans is comprised of two principal product types, namely secured retail loans (which are primarily comprised of mortgage and home equity loans secured by real estate) and general purpose loans (which are unsecured loans and tend to carry a higher credit risk). As of December 31, 2022, Shinhan Bank’s retail loan portfolio (before allowance for loan losses and deferred loan origination costs and fees and excluding credit card loans) was W141,550 billion, representing 40.8% of its total loans outstanding. As of December 31, 2020, 2021 and 2022, Shinhan Bank’s non-performing retail loans (excluding credit card loans) were W281 billion, W261 billion and W289 billion, respectively, representing non-performing loan ratios (net of charge-offs and loan sales) of 0.21%, 0.18% and 0.20%, respectively.
Our large exposure to consumer debt means that we are exposed to changes in economic conditions affecting Korean consumers. For example, a rise in unemployment, an increase in interest rates or a decline in housing prices in Korea could adversely affect the ability of consumers to make payments and increase the likelihood of potential defaults. Economic difficulties in Korea that hurt consumers could result in increasing delinquencies and a decline in the asset quality of our household loan portfolio, which may in turn require us to record higher provisions for credit loss and charge-offs and may materially and adversely affect our financial condition and results of operations.
Any deterioration in the asset quality of our guarantees and acceptances will likely have a material adverse effect on our financial condition and results of operations.
In the normal course of banking activities, we make various commitments and incur certain contingent liabilities in the form of guarantees and acceptances. Financial guarantees, which are contracts that require us to make specified payments to reimburse the beneficiary of the guarantee for a loss such beneficiary incurs because the debtor in respect of which the guarantee is given fails to make payments when due in accordance with the terms of the relevant debt instrument, are recognized initially at fair value, and such initial fair value is amortized over the life of the financial guarantee. Other guarantees are recorded as off-balance sheet items in the notes to
22
our financial statements and those guarantees that we have confirmed to make payments are recorded on the statements of financial position. As of December 31, 2022, Shinhan Bank had aggregate guarantees and acceptances of W17,996 billion, for which it provided allowances for losses of W76.9 billion. If there is significant deterioration in the quality of assets underlying our guarantees and acceptances, our allowances may be insufficient to cover actual losses resulting in respect of these liabilities.
Risks Relating to Our Credit Card Business
Future changes in market conditions as well as other factors, such as stricter regulation, may lead to reduced revenues and deterioration in the asset quality of credit card receivables.
As of December 31, 2020, 2021 and 2022, Shinhan Card’s interest-earning credit card assets amounted to W30,977 billion, W34,437 billion and W39,034 billion, respectively. Our large exposure to credit card and other consumer debt means that we are exposed to changes in economic conditions affecting Korean consumers in general. For example, a rise in unemployment, an increase in interest rates, a downturn in the real estate market, or a general contraction or other difficulties affecting the Korean economy may lead Korean consumers to reduce spending (a substantial portion of which is conducted through credit card transactions), which in turn leads to reduced earnings for our credit card business, as well as to higher default rates on credit card loans, deterioration in the quality of our credit card assets and increased difficulties in recovering written-off assets from which a significant portion of Shinhan Card’s revenues is derived. Any of these developments could have a material adverse effect on our business, financial condition and results of operations.
Increasing consumer and corporate spending and borrowing on our card products and growth in card lending balances depend in part on Shinhan Card’s ability to develop and issue new or enhanced card and prepaid products and increase revenue from such products and services, as well as the level of discretionary income among our cardholders, which is largely affected by macroeconomic factors beyond our control. In addition, credit card companies in Korea, including Shinhan Card, may not be able to enjoy any rapid growth in revenue over the long term due to the maturing nature of the credit card industry, in part due to oversaturation of credit card service providers. Shinhan Card’s future earnings and profitability also depend on its ability to attract new cardholders, reduce cardholder attrition, increase merchant coverage and capture a greater share of customers’ total credit card spending in Korea and overseas. Shinhan Card may not be able to manage and expand cardholder benefits in a cost-effective manner or contain the growth of marketing, promotion and reward expenses to a commercially reasonable level. If Shinhan Card is not successful in increasing customer spending, maintaining or expanding its market position and asset growth, or containing costs or cardholder benefits, its financial condition, results of operations and cash flow could be negatively affected.
Non-financial companies, such as e-commerce and retail business, as well as fintech companies have become major competitors in various business areas. Fast-growing online service providers and tech companies joined the financial payment service market, changing the landscape of the payment service industry. Convenient payment service providers such as Kakao Pay, Naver Pay, and Coupang Pay are competing against the payment services of Shinhan Card. As a response to such market changes, Shinhan Card developed the “Shinhan pLay”, which is a platform for mobile application-credit card payment model that can be used for both online and offline payments. Shinhan Card pioneered “touch payment” using magnetic secure transmission technology and commercialized biometric “Face Pay,” which allows for payment without the need for card plates or digital devices. Competition is expected to intensify as MyData services are launched and the sharing of customer personal information, credit information, and transaction data across a variety of digital platforms is expanded.
In addition, Government policies and regulations aimed at protecting small- and medium-sized enterprises, such as the reduction of fees chargeable to small- and medium-sized merchants, may have a material adverse effect on our revenues from Shinhan Card. In January 2012, the Government expanded the definition of a small- and medium-sized merchant to include those with annual sales of up to W200 million and, effective September 2012, lowered fees chargeable to such merchants from 1.8% to 1.5% with respect to credit cards. In January
23
2015, the Government further expanded the definition of a small- and medium-sized merchant to include those with annual sales of more than W200 million and up to W300 million, and imposed a cap on fees chargeable to such merchants at 2.0% with respect to credit cards. In November 2015, the Government announced a further reduction in the merchant fees chargeable to small- and medium-sized enterprises with respect to credit cards, effective January 31, 2016, from 2.0% to 1.3% for merchants with annual sales of more than W200 million and up to W300 million, and from 1.5% to 0.8% for merchants with annual sales of up to W200 million. In July 2017, the Enforcement Decree of the Specialized Credit Finance Business Act was amended to expand the range of small- and medium-sized enterprises subject to lower merchant fees. Upon the amendment, merchants with annual sales of more than W300 million and up to W500 million are subject to merchant fees chargeable with respect to credit cards of 1.3%, and merchants with annual sales of up to W300 million are subject to merchant fees chargeable with respect to credit cards of 0.8%. In January 2019, the government further expanded the definition of a small- and medium-sized merchant to include those with annual sales of more than W500 million and up to W3 billion. Upon the amendment, merchants with annual sales of less than W500 million are subject to merchant fees chargeable with respect to credit cards of 0.8%, merchants with annual sales of more than W500 million and up to W1 billion are subject to merchant fees chargeable with respect to credit cards of 1.4%, and merchants with annual sales of more than W1 billion and up to W3 billion are subject to merchant fees chargeable with respect to credit cards of 1.6%. Effective January 2022, the fees chargeable to small- and medium-sized enterprises with respect to credit cards were further reduced. Upon the amendment, merchants with annual sales of less than W300 million are subject to merchant fees chargeable with respect to credit cards of 0.5%, merchants with annual sales of more than W300 million and up to W500 million are subject to merchant fees chargeable with respect to credit cards of 1.1%, merchants with annual sales of more than W500 million and up to W1 billion are subject to merchant fees chargeable with respect to credit cards of 1.25%, and merchants with annual sales of more than W1 billion and up to W3 billion are subject to merchant fees chargeable with respect to credit cards of 1.5%. Pursuant to the Specialized Credit Financial Business Act, the rates of fees chargeable to merchants are subject to review and revision every three years, starting from 2012, and the rates of fees chargeable may be further adjusted due to changes in relevant regulations or Government policy. A task force comprised of representatives from the credit card industry, consumers, merchants and the Financial Services Commission is expected to convene during 2022 to discuss improvements to the current system of adjustments to merchant commission rates. Additionally, during 2018, the Seoul metropolitan and other regional governments have launched “Zero Pay”, a government sponsored QR code-based mobile payment platform charging little to no transaction fees (up to 0.5% depending on volume of sales) and aimed at reducing transaction fees small businesses pay to credit card companies. The Financial Services Commission also announced its plans to establish an open banking system that would provide fintech firms access to banks’ payment systems at lower costs. Additional amendments to regulations requiring further downward adjustments to merchant fees or Government policies aimed at reducing transaction fees paid to credit card companies may be implemented in the future, placing further downward pressure on the results of operations for credit card companies, including Shinhan Card.
In 2013, the Government also implemented measures regulating marketing costs in order to control excessive marketing campaigns and curtail undue marketing expenses, which had the effect of impeding revenue growth for credit card companies but also reduced or slowed the growth in their marketing expenses. Effective December 2013, the Government also introduced guidelines to curb the interest rates that credit card companies, including Shinhan Card, may charge on card loans and cash advances. Furthermore, the Government also provides tax incentives, among others, for the use of check cards (where the amounts paid with check cards are instantly debited from the customer’s bank accounts) to encourage the use of check cards in lieu of credit cards in an attempt to preempt a potential rise in delinquency among credit card users, and if check cards are widely used in lieu of credit cards, this would reduce interest income from credit cards, which generally have a longer repayment period than that of check cards, and may have an adverse impact on Shinhan Card’s revenues and results of operations. On November 26, 2018, the Financial Services Commission introduced additional guidelines aimed at curtailing excessive marketing expenses for credit card companies, for example by limiting the benefits credit card companies may offer to large corporate credit card clients or merchants as well as requiring a reasonable level of annual service fees for credit card holders. Although these and similar
24
Government initiatives and measures may result in a reduction in marketing expenses, which in turn may help reduce the overall expenses of our credit card business, there is no assurance that Government measures will achieve their intended results, and such measures may result in a decline in the volume of credit card transactions or otherwise adversely affect our business, financial condition and results of operations.
Risks Relating to Our Other Businesses
We may experience significant losses from our investments and, to a lesser extent, trading activities due to market fluctuations.
We enter into and maintain large investment positions in fixed income products, primarily through our treasury and investment operations. These activities are described in “Item 4.B. Business Overview — Our Principal Activities — Other Banking Services.” We also maintain smaller trading positions, including equity and equity-linked securities and derivative financial instruments as part of our operations. Taking these positions entails making assessments about financial market conditions and trends. The revenues and profits we derive from many of these positions and related transactions are dependent on market prices, which are beyond our control. When we own assets such as debt or equity securities, a decline in market prices, for example, as a result of fluctuating market interest rates or stock market indices, can expose us to trading and valuation losses. If market prices move in a way that we have not anticipated, we may experience losses. In addition, when markets are volatile and subject to rapid changes in price directions, actual market prices may be contrary to our assessments and lead to lower than anticipated revenues or profits, or even result in losses, with respect to the related transactions and positions.
We may generate losses from our brokerage and other commission- and fee-based business.
We, through our investment and other subsidiaries, currently provide, and seek to expand the offerings of, brokerage and other commission- and fee-based services. Downturns in stock markets typically lead to a decline in the volume of transactions that we execute for our customers and, therefore, a decline in our non-interest revenues. In addition, because the fees that we charge for managing our clients’ portfolios are often based on the size of the assets under management, a downturn in the stock market, which has the effect of reducing the value of our clients’ portfolios or increasing the amount of withdrawals, also generally reduces the fees we receive from our securities brokerage, trust account management and other asset management services. Even in the absence of a market downturn, below-market performance by our securities, trust account or asset management subsidiaries may result in increased withdrawals and reduced cash inflows, which would reduce the revenue we receive from these businesses. In addition, protracted declines in asset prices can reduce liquidity for assets held by us and lead to material losses if we cannot close out or otherwise dispose of deteriorating positions in a timely way or at commercially reasonable prices. In July 2019, we made a capital contribution of W660 billion by subscribing for new shares of common stock of Shinhan Securities, enabling Shinhan Securities to satisfy the W4 trillion capitalization requirement required to apply to the Financial Services Commission for designation as a mega-investment bank (“mega-IB”). Upon designation as a mega-IB, Shinhan Securities will be able to issue debt securities up to 200% of its capitalization amount and would be able to utilize such proceeds for corporate lending and other businesses. This capital contribution was made in line with our strategic initiative to strengthen our non-banking businesses and capital market activities. However, we cannot assure you that this capital contribution, any designation of Shinhan Securities as a mega-IB or any resulting developments will not have a negative effect on our business, financial condition and results of operations that outweigh any potential benefits, and we may not be successful in furthering our strategic initiative.
Prolonged periods of declining or low interest rates or changes in related accounting standards may reduce or turn negative our investment margin on savings insurance products and result in an increase in the valuation of our liabilities associated with these products.
We, principally through Shinhan Life Insurance, offer fixed rate insurance policies such as savings insurance products that include guaranteed benefits. These products expose us to the risk that changes in interest
25
rates will reduce our investment margin, which is the difference between the amounts that we are required to pay under the contracts and the rate of return we earn on investments intended to support obligations under such contracts. During periods of declining or low interest rates, we may have to invest insurance cash flows and reinvest the cash flows we received as interest or return of principal on our investments in lower yielding instruments. In addition, during periods of declining or low interest rates, fixed rate policies may become relatively more attractive investments to consumers. This could result in an increase in payments we are required to pay on such products and higher percentage of such products remaining in-force from year to year, during a period when our new investments carry lower returns. During periods of sustained lower interest rates, our reserves for policy liabilities may not be sufficient to meet future policy obligations and may need to be strengthened.
Significantly lower or negative investment margins may cause us to accelerate amortization, thereby reducing net income in the affected reporting period and potentially negatively affecting our credit instrument covenants or rating agency assessment of our financial condition. In addition, under IFRS 17, which became effective beginning 2023, insurance contract liabilities will be calculated in terms of market value (as the present value of future insurance cash flows with a provision for risk) instead of book value. As the discount rate will reflect current interest rates rather than book yields, we may have a significantly higher debt balance under IFRS 17 due to higher insurance liabilities, thereby resulting in a decrease in our risk-based capital.
We may fail to realize the anticipated benefits of and encounter significant risks in connection with mergers and acquisitions.
We continue to seek and evaluate opportunities for diversification and growth of our business, including through strategic acquisitions, and have experienced substantial growth through several mergers and acquisitions. On February 1, 2019, we acquired a 59.15% interest in Orange Life Insurance, the former Korean unit of ING Life Insurance, as part of our efforts to diversify and enhance our non-banking businesses. On January 28, 2020, we acquired the remaining interests in Orange Life Insurance by effecting a comprehensive stock exchange under Articles 360-2 of the Korean Commercial Code whereby holders (other than us) of Orange Life Insurance’s common stock transferred all of their shares to us and in return receive shares of our common stock, and hence Orange Life Insurance became our wholly owned subsidiary as of such date. Orange Life Insurance was subsequently merged with and into Shinhan Life Insurance in July 2021. On October 31, 2018, we agreed to acquire Asia Trust Co., Ltd. in order to expand our real estate business capacity and have also acquired certain small-sized overseas financial service companies and asset management companies. On September 29, 2020, we acquired a 96.8% interest in Neoplux, a venture capital company formerly under the Doosan Group. On December 30, 2020, we acquired the remaining interest in Neoplux by effecting a small-scale stock exchange under Article 360-10 of the Korean Commercial Code, and hence Neoplux has become our wholly owned subsidiary as of such date. On January 11, 2021, Neoplux changed its legal name to Shinhan Venture Investment. In addition, on January 15, 2021, we acquired the remaining 35% interest in Shinhan BNP Paribas Asset Management and changed its legal name to Shinhan Asset Management, and hence Shinhan Asset Management has become our wholly-owned subsidiary as of such date. On June 30, 2022 we acquired 94.54% interest in BNP Paribas Cardif General Insurance, which then changed its name to Shinhan EZ General Insurance, Ltd. Subsequently in November 2022, Shinhan EZ General Insurance, Ltd. conducted a paid-in capital increase and our shares decreased to 85.1%. We expect to integrate these and any future acquisitions with our existing businesses and generate synergies and expand our business capabilities. However, we may encounter significant risks, including difficulty in successfully integrating acquired businesses, increased expenses such as working capital requirements or capital expenditures, regulatory risks and financial risks such as potential liabilities of the businesses we acquire. In addition, evaluating potential acquisitions may require us to incur significant expenses or divert management’s attention away from other business issues. As such, no assurance can be given that any completed or contemplated acquisitions will not have a negative effect on our business, financial condition and results of operations that outweigh any potential benefits.
26
We may suffer losses or record provisions for credit loss allowance for expected losses in connection with financial products sold by us or our subsidiaries, including Shinhan Securities and Shinhan Bank, which may have a negative impact on us, including our reputation.
We are subject to lawsuits and other claims in the ordinary course of our business, including with respect to financial products sold by us or our subsidiaries, including Shinhan Securities and Shinhan Bank. We may suffer losses or record provisions for credit loss allowance for expected losses in connection with the sales of such financial products and related legal or other proceedings related to such matters, which may have a negative impact on us, including our reputation.
In August 2019, the Financial Supervisory Service launched an investigation into Lime Asset Management Co., Ltd. (“Lime Asset”), Korea’s largest hedge fund managing approximately W4.1 trillion in assets as of December 31, 2020, including with regards to allegations that Lime Asset had concealed the fact that it had changed the multi-manager trade finance fund’s investment method and concealed losses in their trade finance funds. Beginning in October 2019, Lime Asset suspended withdrawals from certain of its funds, freezing approximately W1.7 trillion in total as of the end of 2019, according to the Financial Supervisory Service. According to Financial Supervisory Service investigations, Lime Asset’s W211 billion trade finance fund was found to have been associated with a debacle involving the International Investment Group LLC (“IIG”), a New York-based investment adviser charged with securities fraud and running a Ponzi scheme. On November 26, 2019, the SEC revoked the registration of IIG for allegedly overvaluing defaulted loans in the fund’s portfolio to conceal losses in its flagship hedge fund and selling at least $60 million in fake loan assets to clients. According to the Financial Supervisory Service, Lime Asset signed a contract with a Singaporean commodity trader, which took over Lime Asset’s ownership stake in an IIG fund in June 2019, with the Singaporean entity issuing promissory notes to Lime Asset, and Lime Asset did not properly disclose to its investors such change in the fund’s investment target from the IIG fund to promissory notes.
Certain investors in funds of Lime Asset have filed dispute mediation claims to the Financial Supervisory Service and criminal and civil claims against Lime Asset, as well as against financial institutions that have sold such products, claiming they learned of the change in the trade finance fund’s investment method and losses only in October 2019 and that they were also misguided and not fully informed of the risks associated with these funds when investing in such products. The Financial Supervisory Service conducted a comprehensive audit in November and December 2019. In February 2020, the Prosecutors’ Office of Korea announced that they had launched an investigation into Lime Asset as well as Shinhan Securities and also searched Shinhan Bank’s headquarters on July 1, 2020 in connection with this matter. In November 2020, the Financial Supervisory Service imposed a partial business suspension on Shinhan Securities and suspension from duties and a cautionary warning to its two former CEOs. On December 5, 2021, the Supreme Court concluded that a former employee of Shinhan Securities was partially guilty on charges of conspiring to conceal from investors Lime Asset’s losses and change in investment target and imposed a sentence of eight years’ imprisonment and a W300 million fine. On December 10, 2021, the Financial Supervisory Service imposed a partial business suspension and a fine of W4 billion on Shinhan Securities, and a cautionary warning on two former employees of Shinhan Securities in connection with alleged violations of the Capital Markets Act and the Act on Real Name Financial Transactions and Confidentiality. On February 14, 2023, a fine of W1.8 billion on Shinhan Securities was confirmed. On March 15, 2023, Seoul Southern District Court imposed a fine of W50 million on Shinhan Securities for violation of the Financial Investment Services and Capital Markets Act of Korea in failing to properly monitor its employees involved in the sale of Lime Asset products. On April 22, 2021, the sanctions committee of the Financial Supervisory Service recommended a partial business suspension and fine of W8.7 billion on Shinhan Bank, a cautionary warning to the CEO of Shinhan Bank, an institutional caution and fine of W50 million on Shinhan Financial Group and a caution to the CEO of Shinhan Financial Group in connection with Shinhan Bank’s alleged improper solicitation of troubled Lime Asset funds and management’s oversight in risk management. On July 11, 2022, the partial business suspension and the fine of W5.7 billion on Shinhan Bank and a cautionary warning to the CEO of Shinhan Bank were confirmed. The fine on Shinhan Financial Group recommended by the sanctions committee will be deliberated at the Securities and Futures Commission of the
27
Financial Services Commission and will be confirmed if approved at a regular meeting of the Financial Services Commission.
In May 2020, Shinhan Securities announced that its board of directors has resolved to compensate certain investors for amounts ranging between 30% to 70% (in the case of retail investors) and 20% to 50% (in the case of institutional investors) of the amount of such investor’s investment in Lime Asset products. In June 2020, Shinhan Bank announced that its board of directors has resolved to make prepayments to investors in certain Lime Asset funds that have reached maturity in an amount equal to 50% of such investor’s investment in the relevant product. On June 30, 2020, the Financial Dispute Mediation Committee of the Financial Supervisory Service recommended through a non-binding ruling for brokerages, including Shinhan Securities, to return 100% of the amount of investors’ investment in certain of Lime Asset products sold after November 2018 in the aggregate of approximately W161 billion. In August 2020, the board of directors of Shinhan Securities resolved to accept the non-binding ruling for certain Lime Asset’s trade finance funds sold around November 2018. With these resolutions by the board of directors of Shinhan Securities, the total amount of compensation to investors of Lime Asset funds that Shinhan Securities has agreed to pay has reached W42.46 billion. On April 19, 2021, the Financial Dispute Mediation Committee of the Financial Supervisory Service recommended through a non-binding ruling that Shinhan Bank compensate investors in such Lime Asset funds in amounts ranging from 40% to 80% of the losses incurred by the investors by way of making prepayments, with adjustments to be made depending on particular facts, such as the nature of the investor (e.g., whether retail or institutional investor, the age and experience level of the investor, etc.) and adequacy of documentation. In 2022, in accordance with such compensation guideline recommended by the Financial Dispute Mediation Committee, Shinhan Bank completed its voluntary settlement process with substantially all of such investors in Lime Asset funds.
In June 2020, the Financial Supervisory Service launched an investigation into Discovery Asset Management Co., Ltd. (“Discovery Asset”), which operated funds that invested in certain funds in the U.S. managed by Direct Lending Investment, LLC (“DLI”). In April 2019, the U.S. Securities and Exchange Commission obtained a preliminary injunction and order appointing a receiver to freeze DLI’s funds based on the complaint that DLI fabricated values of its assets under management and reported returns. In response, Discovery Asset suspended withdrawals from funds under its management, thereby freezing approximately W256 billion in total of its investors’ funds as of April 2019. While neither Shinhan Bank nor Shinhan Securities was involved in sale of such DLI-related funds structured by Discovery Asset, Shinhan Bank and Shinhan Securities did sell other Discovery Asset funds (affected by such suspension of withdrawal) to investors in Korea. Between 2017 and 2019, Shinhan Bank and Shinhan Securities sold approximately W93.6 billion and W50.8 billion, respectively, of such Discovery Asset products (unrelated to DLI funds), of which only Shinhan Bank has recovered approximately W45.1 billion from Discovery Asset. In 2022, Shinhan Bank completed its voluntary settlement process with substantially all of such investors in Discovery Asset funds, and Shinhan Securities is in discussion with the investors to settle these amounts based on mutually agreeable terms.
From May 2017 to December 2018, Shinhan Securities sold approximately W390.7 billion of certain German Heritage derivative-linked securities (“German Heritage DLS Products”). As of December 31, 2022, the principal amount of German Heritage DLS Products that have become eligible for payment but for which payment has been delayed is W379.9 billion. The German Heritage DLS Products are derivative-linked trust products where performance is based on underlying Singapore funds that invest in Germany’s monument status building development projects. Since July 2019, maturity payments have been delayed on the German Heritage DLS Products as recovery on the underlying funds has been delayed. In March 2020, Shinhan Securities announced that its board of directors has resolved to make prepayments to investors who have consented to the extension of maturity in an amount equal to 50% of the amount of such investor’s investments in the German Heritage DLS Products. As of December 31, 2022, Shinhan Securities recognized W343.8 billion in non-operating expenses as provisions for potential future compensation in connection with the sale of German Heritage DLS Products.
The prepayments made or to be made by Shinhan Bank and Shinhan Securities to investors of Lime Asset funds, Discovery Asset funds and German Heritage DLS Products, respectively, as explained above, have been
28
or will be, as the case may be, settled at the time of recovery of the underlying funds. If the amount recovered on the underlying fund is less than the amount prepaid to investors, Shinhan Bank and Shinhan Securities may not be able to recover from investors the amount of the prepaid amount that is in excess of the recovered amount and accordingly suffer losses. Depending on the performance of such underlying funds, we may record provisions for credit loss allowance to account for expected future losses.
During the fiscal year 2022, Shinhan Bank and Shinhan Securities recorded W54.6 billion and W116.2 billion, respectively, for credit loss allowance to account for expected future losses associated with financial products, including Lime Asset, Discovery Asset and German Heritage DLS Products. Depending on a variety of factors, including those outside the control of Shinhan Bank or Shinhan Securities, such as the performance of the underlying funds and progression of discussions with investors, Shinhan Bank or Shinhan Securities may record additional provisions for credit loss allowance to account for expected future losses from these or other financial products, and there is no guarantee that such amounts, if any, will not be significant.
In June 2022, Shinhan Bank voluntarily reported to the Financial Supervisory Service certain overseas wire transfers made in 2020 and 2021 which Shinhan Bank had detected as unusual based on its internal monitoring system. After similar activities were also reported by another major Korean bank, the Financial Supervisory Service launched an investigation in August 2022 into wire transfers made under similar circumstances across all major banks in Korea, including Shinhan Bank. In an interim report released in September 2022, the Financial Supervisory Service reported that approximately more than US$7.2 billion of suspicious overseas wire transfers were made through 12 banks, of which approximately US$2.36 billion had been wired through Shinhan Bank and that at least some of these transfers were allegedly related to cryptocurrency arbitrage transactions. The Financial Supervisory Service and the Seoul Central District Prosecutor’s Office are currently investigating these wire transfers and the parties involved, including in relation to any violation of certain monitoring and reporting obligations under the Foreign Exchange Transactions Act of Korea and the Act on Reporting and Use of Certain Financial Transaction Information of Korea. In December 2022, the Financial Supervisory Service made a recommendation to improve Shinhan Bank’s fraud detection system, including allocating sufficient staff and establishing a computer system dedicated to identifying digital asset-related transactions and assessing risks related to digital asset management. Such investigations are ongoing, and it is difficult to predict the results of these proceedings and the potential impact they may have on us.
Any legal or administrative proceedings in connection with these matters, if brought and particularly if adversely determined, may have a negative impact on us, including our reputation. Accordingly we cannot assure you that these matters and related events will not have an adverse effect on us, including our reputation. For further details, see “Item 8.A. Consolidated Statements and Other Financial Information — Legal Proceedings.” and Note 43 of the notes to our consolidated financial statements included in this annual report.
Other Risks Relating to Us as the Holding Company
Our ability to continue to pay dividends and service debt will depend on the level of profits and cash flows of our subsidiaries.
We are a financial holding company with minimal operating assets other than the shares of our subsidiaries. Our primary source of funding and cash flow is dividends from, or disposition of our interests in, our subsidiaries or our cash resources, most of which are currently the result of borrowings. Since our principal assets are the outstanding capital stock of our subsidiaries, our ability to pay dividends on our common and preferred shares and service debt will mainly depend on the dividend payments from our subsidiaries.
Companies in Korea are subject to certain legal and regulatory restrictions with respect to payment of dividends. For example, under the Korean Commercial Code, dividends may only be paid out of distributable income, which is calculated by subtracting the aggregate amount of a company’s paid-in capital and certain mandatory legal reserves from its net assets, in each case as of the end of the prior fiscal year. In addition,
29
financial companies in Korea, including banks, credit card companies, securities companies and life insurers, such as our subsidiaries, must meet minimum capital requirements and capital adequacy ratios applicable to their respective industries before dividends can be paid. For example, under the Banking Act of 1950, as amended (the “Banking Act”), a bank is required to credit at least 10% of its net profit to a legal reserve each time it pays dividends on distributable income until such time when this reserve equals the amount of its total paid-in capital, and under the Banking Act, the Specialized Credit Financial Business Act and the regulations promulgated by the Financial Services Commission, if a bank or a credit card company fails to meet its required capital adequacy ratio or is otherwise subject to the management improvement measures imposed by the Financial Services Commission, then the Financial Services Commission may restrict the declaration and payment of dividend by such a bank or credit card company. In addition, if our or our subsidiaries’ capital adequacy ratios fall below the required levels, our ability to pay dividends may be restricted by the Financial Services Commission.
Damage to our reputation could harm our business.
We are one of the largest and most influential financial institutions in Korea by virtue of our financial track records, market share and the size of our operations and customer base. Our reputation is critical to maintaining our relationships with clients, investors, regulators and the general public. Our reputation can be damaged in numerous ways, including, among others, employee misconduct (including embezzlement), cyber or other security breaches, litigation, compliance failures, corporate governance issues, failure to properly address potential conflicts of interest, the activities of customers and counterparties over which we have limited or no control, prolonged or exacting scrutiny from regulatory authorities and customers regarding our trade practices, or uncertainty about our financial soundness and our reliability. If we are unable to prevent or properly address these concerns, we could lose our existing or prospective customers and investors, which could adversely affect our business, financial condition and results of operations. For details of the claims, disputes, legal proceedings and government investigations we are subject to, see “Item 8.A. Consolidated Statements and Other Financial Information — Legal Proceedings.”
Our risk management policies and procedures may not be fully effective at all times.
In the course of our operations, we must manage a number of risks, such as credit risks, market risks and operational risks. We seek to monitor and manage our risk exposures through a comprehensive risk management platform, encompassing centralized risk management organization and credit evaluation systems, reporting and monitoring systems, early warning systems and other risk management infrastructure, using a variety of risk management strategies and techniques. See “Item 4.B. Business Overview — Risk Management.” Although we devote significant resources to developing and improving our risk management policies and procedures and expect to continue to do so in the future, our risk management practices may not be fully effective at all times in eliminating or mitigating risk exposures in all market environments or against all types of risk, including risks that are unidentified or unanticipated. For example, in the past, a limited number of our and our subsidiaries’ personnel engaged in embezzlement of substantial amounts for an extended period of time before such activities were detected by our risk management systems. In response to these incidents, we have strengthened our internal control procedures by, among others, implementing a real-time monitoring system, but there is no assurance that such measures will be sufficient to prevent similar employee misconducts in the future. Management of credit, market and operational risk requires, among others, policies and procedures to record properly and verify a large number of transactions and events, and we cannot assure you that these policies and procedures will prove to be fully effective at all times against all the risks we face.
We may experience disruptions, delays and other difficulties relating to our information technology systems.
We rely on our information technology systems to seamlessly provide our wide-ranging financial services as well as for our daily operations, including billing, online and offline financial transactions settlement and record keeping. We continually upgrade, and make substantial expenditures to upgrade, our group-wide information technology system, including in relation to customer data-sharing and other customer relations management
30
systems, particularly in light of the heightened cyber security risks from advances in technology. Despite our best efforts, however, we may experience disruptions, delays, cyber or other security breaches or other difficulties relating to our information technology systems, and may not timely upgrade our systems as currently planned. Any of these developments may have an adverse effect on our business, particularly if our customers perceive us to not be providing the best-in-class cyber security systems and failing to timely and fully rectify any glitches in our information technology systems.
Our activities are subject to cyber security risk.
Our activities have been, and will continue to be, subject to an increasing risk of cyber-attacks, the nature of which is continually evolving. Cyber security risks include unauthorized access, through system-wide “hacking” or other means, to privileged and sensitive customer information, including passwords and account information, and illegal use thereof. Cyber security risk is generally on the rise as a growing number of our customers increasingly rely on our Internet- and mobile phone-based banking services for various types of financial transactions. While we vigilantly protect customer data through encryption and other security programs and have made substantial investments to build and upgrade our systems and defenses to address the growing threats from cyber-attacks, there is no assurance that such data will not be subject to future security breaches. In addition, there can be no assurance that we will not experience a leakage of customer information or other security breaches as a result of illegal activities by our employees, outside consultants or hackers, or otherwise.
In order to minimize the risk of security breaches related to customer and our other proprietary information, we have taken a series of group-wide preventive measures, such as the adoption and implementation of a best-in-class information security system and reinforcement of internal control measures. We are fully committed to maintaining the highest standards of cyber security and consumer protection measures and upgrading them continually. We have implemented the ISO 27001-certified security management system for us and all our subsidiaries, and we have obtained the Information Security Management System certification for most of our subsidiaries. We believe such certifications represent third-party validations that we are in compliance with best-in-class international standards on matters of information security. Our Integrated Security Control Center’s security management system enables us to continuously monitor for signs of potential cyber-attacks and provides us with advance warnings that will allow us to promptly respond to such attacks. Our security management system continuously monitors for signs of potential cyber-attacks and is designed to provide early warning alerts to enable prompt action by us. In order to prevent intentional and accidental security issues by our employees, we have created a violation monitoring system, reinforcing our security measures by preemptively identifying various scenarios of threats and by collecting and analyzing different types of data that allows us to quickly identify any potential security violations. Moreover, we established a new information security lab to build a continuous security research and development system to respond to hacking and other cyber threats. Through these measures, we are developing technical capabilities necessary to respond to the latest security threats. We also provide intensive employee training to our information technology staff and other employees on cyber security and have adopted advanced security infrastructure (including through hiring a highly competent team of information security experts) for online financial services such as mandatory website certification and keyboard security functions. In addition, reviews of our system are conducted, across all of our subsidiaries, through periodic audits and simulation reviews by external experts. In addition, in compliance with applicable regulations we currently carry insurance to cover cyber security breaches up to W10 billion in relation to our banking business and up to W3 billion in the aggregate and up to W1 billion per incident for our securities investment business and have set aside a reserve of W1 billion for our credit card business. In addition, in light of the growing use of mobile devices to access financial services, we have implemented security measures (including encryptions and service terminal monitoring) to provide a secure mobile banking service as well as to prevent illegal leakage or sharing of customer data and otherwise enhance customer privacy. We are also keenly aware of the litigation and regulatory sanctions risks that may arise from security breaches and are aggressively reinforcing a group-wide culture that stresses safety and good custodianship as among our highest priorities. Furthermore, we are actively taking steps to implement preventive and other steps recommended or required by the regulatory authorities in relation to actual and potential financial scams. Although we have not experienced
31
any material security breaches or any similar large scale leakage of customer information recently, given the unpredictable and continually evolving nature of cyber security threats due to advances in technology or other reasons, there is no assurance that, notwithstanding our best efforts at maintaining the best-in-class cyber security systems, we will not be vulnerable to major cyber security attacks in the future.
The public is developing heightened awareness about the importance of keeping their personal data private, and the financial regulators are placing greater emphasis on data protection by financial service providers. For example, under the Personal Information Protection Act, as last amended in August 2020, financial institutions, as personal information manager, may not collect, store, maintain, utilize or provide resident registration numbers of their customers, unless other laws or regulations specifically request or permit the management of resident registration numbers. Further, under the Use and Protection of Credit Information Act, as last amended in December 2021, a financial institution has a higher duty to protect credit information, meaning information necessary to assess the creditworthiness of the counterparty to financial transactions and other commercial transactions. Such regulations have considerably restricted a financial institution’s ability to transfer or provide the information to its affiliate or holding company, and quintuple damages can be imposed on a financial institution for a leakage of such information. In addition, under the Electronic Financial Transaction Act, as last amended in June 2020 with effect from December 2020, a financial institution is primarily responsible for compensating its customers harmed by the financial institution’s cyber security breach, even if the breach is not directly attributable to the financial institution. Recently, on January 9, 2020, the Korean National Assembly passed amendments to three major data privacy laws (the Personal Information Protection Act, the Act on the Promotion of Information and Communications Network Utilization and Information Protection and the Act on the Use and Protection of Credit Information), expanding the scope of personal information that may be shared among financial institutions. With this, we expect cyber security and ensuring confidentiality of customers’ information to become more important than ever for financial institutions. We maintain an integrated system that closely monitors customer information to ensure compliance with data protection laws and regulations as well as our internal policies.
If a cyber or other security breach were to happen with respect to us or any of our subsidiaries, it may result in litigation by affected customers or other third parties (including class actions), compensation for any losses suffered by victims of cyber security attacks, reputational damage, loss of customers, heightened regulatory scrutiny and related sanctions, more stringent compliance with the present and future regulatory restrictions, and other costs related to damage control, reparation and reinforcement of information security systems, any of which may have a material adverse effect on our business, results of operations and financial condition.
Our customers may become victims to “voice phishing” or other financial scams, for which we may be required to make monetary compensation and suffer damage to our business and reputation.
In recent years, financial scams known as voice phishing have been on the rise in Korea. While voice phishing takes many forms and has evolved over time in terms of sophistication, it typically involves the scammer making a phone call to a victim under false pretenses (for example, the scammer pretending to be a member of law enforcement, an employee of a financial institution or even an abductor of the victim’s child) and luring the victim to transfer money to an untraceable account controlled by the scammer. More recently, voice phishing has increasingly taken the form of the scammer “hacking” or otherwise wrongfully obtaining personal financial information of the victim (such as credit card numbers or Internet banking login information) over the telephone or other means and illegally using such information to obtain credit card loans or cash advances through automated telephone banking or Internet banking. Reportedly, a substantial number of such scammers belong to international criminal syndicates with bases overseas, such as China, with operatives in Korea.
In response to the growing incidents of voice phishing, regulatory authorities have undertaken a number of steps to protect consumers against voice phishing and other financial scams. Also in response to the heightened risk, Shinhan Card and our other subsidiaries have established certain fraud detection system that identifies any questionable transactions based on deviations from a customer’s conventional transaction patterns. There is no
32
assurance, however, that these regulatory activities and fraud detection system will have the desired effect of substantially eradicating or even containing the incidents of voice phishing or other financial scams. Also given continual advances in technology and the increasing sophistication of the financial scammers, there is no assurance that we will be able to prevent future financial scams or that the frequency and scope of financial scams will not increase. If financial scams involving us and our subsidiaries were to continue or to become more prevalent, it may result in compensation for any losses suffered by victims thereof, reputational damage, loss of customers, heightened regulatory scrutiny and related sanctions, compliance with the present and future regulatory restrictions, and other costs related to damage control, reparation and reinforcement of our preventive measures, any of which may have a material adverse effect on our business, results of operations and financial condition.
Legal claims and regulatory risks arise in the conduct of our business.
In the ordinary course of our business, we are subject to regulatory oversight and potential legal and administrative liability risk. We are also subject to a variety of other claims, disputes, legal proceedings and government investigations in Korea and other jurisdictions where we are active. See “Item 8.A. Consolidated Statements and Other Financial Information — Legal Proceedings.” These types of proceedings may expose us to substantial monetary and/or reputational damages and legal defense costs, injunctive relief, criminal and civil penalties and the potential for regulatory restrictions on our businesses. The outcome of these matters are highly uncertain and difficult to predict, and they could adversely affect our future business.
While we plan to rigorously defend our positions in the lawsuits or other regulatory proceedings against us, it is difficult to predict the final outcome of such cases. The total amount in dispute may increase during the course of litigation and other lawsuits may be brought against us based on similar allegations. Accordingly, these lawsuits and other proceedings may have a material adverse effect on our business, financial condition and results of operations.
Risks Relating to Law, Regulation and Government Policy
We are a heavily regulated entity and operate in a legal and regulatory environment that is subject to change, and violations could result in penalties and other regulatory actions.
As a financial services provider, we are subject to a number of regulations that are designed to maintain the safety and soundness of Korea’s financial system, to ensure our compliance with economic and other obligations and to limit our risk exposure. These regulations may limit our activities, and changes in these regulations may increase our costs of doing business. Regulatory agencies frequently review regulations relating to our business and implement new regulatory measures, including increasing the minimum required provisioning levels or capital adequacy ratios applicable to us and our subsidiaries from time to time. We expect the regulatory environment in which we operate to continue to change. Changes in regulations applicable to us, our subsidiaries and our or their business or changes in the implementation or interpretation of such regulations could affect us and our subsidiaries in unpredictable ways and could adversely affect our business, results of operations and financial condition.
Furthermore, the Financial Consumer Protection Act (the “FCPA”) was enacted on March 24, 2020 and took effect beginning March 25, 2021. The FCPA unifies the systems for the protection of consumers of financial products, which had been dispersed in various laws, while tightening the existing consumer protection systems to strengthen the rights afforded to consumers of financial products. Banks under the Banking Act are financial instrument distributors subject to the FCPA, and deposit and loan products under the Banking Act are financial instruments subject to the FCPA.
Under the FCPA, a financial instrument distributor who intends to sell financial instruments shall comply with the following requirements: (i) confirmation of suitability and adequacy of financial instruments,
33
(ii) compliance with the duty to explain, (iii) prohibition of unfair sales activities, (iv) prohibition of undue solicitation, and (v) prohibition of false or exaggerated advertising, etc. (collectively, the “Sales Principles”). If a financial instrument distributor breaches any of the Sales Principles, consumers may request the termination of such financial instrument within a period to be prescribed by a Presidential Decree and are entitled to unilaterally terminate the contract if the financial instrument distributor fails to present a justifiable reason for not accepting the consumer’s request. Consumers who purchased a loan product, in particular, shall be entitled to withdraw from the contract within 14 days from the later of (i) the date of receipt of the proceeds pursuant to the contract and (ii) the execution date of the contract (or the date of receipt of the documents necessary for execution of the contract (if required under the FCPA), regardless of whether the financial instrument distributor breached any of the Sales Principles. When a consumer files a lawsuit for damages against a financial instrument distributor for breach of the duty to explain, the financial instrument distributor (and not the consumer) shall bear the burden of proof to prove that no willful conduct or negligence was involved in such breach of the duty to explain. In the event of a dispute with a financial instrument distributor, consumers may apply for mediation to the Dispute Mediation Committee of the Financial Services Commission. If a financial instrument distributor files a lawsuit with a court while such mediation is in progress, the court may suspend the litigation proceedings. For certain small-sum cases, a financial instrument distributor may not file a lawsuit with a court until the completion of such mediation. Financial instrument distributors must accept requests from its consumers to access information for purposes of litigation or mediation. In the event the Financial Services Commission determines that there is a clear risk that a financial product may cause significant damage to the properties of customers, the Financial Services Commission may prohibit or restrict the solicitation of, and execution of a contract for, such financial product.)
We and our subsidiaries have been proactively taking actions necessary to comply with the FCPA, including the examination of our financial products and training of our officers and employees. However, no assurance can be given that the implementation of the FCPA will not adversely affect us our subsidiaries’ businesses or lead to a material adverse effect on their reputation, business, results of operations or financial condition. We may also become subject to other restrictions on our operations as a result of future changes in laws and regulations, including more stringent liquidity and capital requirements under Basel III, which are being adopted in phases in Korea in consideration of, among others, the pace and scope of international adoption of such requirements. Any of these regulatory developments may have a material adverse effect on our ability to expand operations or adequately manage our risks and liabilities. For further details on the principal laws and regulations applicable to us as a holding company and our principal subsidiaries, see “Item 4.B. Business Overview — Supervision and Regulation.”
In addition, violations of law and regulations could expose us to significant liabilities and sanctions. For example, the Financial Supervisory Service conducts periodic audits on us and, from time to time, we have received institutional warnings from the Financial Supervisory Service. If the Financial Supervisory Service determines as part of such audit or otherwise that our financial condition, including the financial conditions of our operating subsidiaries, is unsound or that we have violated applicable law or regulations, including Financial Services Commission orders, or if we or our operating subsidiaries fail to meet the applicable requisite capital ratio or the capital adequacy ratio, as the case may be, set forth under Korean law, the Financial Supervisory Service may ask the Financial Services Commission to order, among other things, cancellations of authorization, permission or registration of the business, suspensions of a part or all of the business, closures of branch offices, recommendations for dismissal of officers or suspensions of officers from performing their duties, or may order, among other things, institutional warnings, institutional cautions, reprimanding warnings on officers, cautionary warnings on officers or cautions on officers. From time to time, our subsidiaries, including Shinhan Bank and Shinhan Card, have been subject to investigations and/or sanctions from the Financial Supervisory Service. See “Item 8.A. Consolidated Statements and Other Financial Information — Legal Proceedings.” If any such measures are imposed on us or our subsidiaries as a result of unsound financial condition or failure to comply with minimum capital adequacy requirements or for other reasons, it will have a material adverse effect on us and our subsidiaries’ business, financial condition and results of operations.
34
The Government may encourage targeted lending to certain sectors in furtherance of policy objectives, and we may take this factor into account.
The Government has encouraged and may in the future encourage targeted lending to certain types of enterprises and individuals in furtherance of government initiatives. The Government, through its regulatory bodies such as the Financial Services Commission, from time to time announces lending policies to encourage Korean banks and financial institutions, including us and our subsidiaries, to lend to particular industries, business groups or customer segments, and, in certain cases, has provided lower cost funding through loans made by the Bank of Korea for further lending to specific customer segments.
For example, the Government has taken and is taking various initiatives to support small- and medium-sized enterprises and low-income individuals, who were disproportionately affected by the downturn in the Korean and global economy in the late 2000s and have yet to fully recover. As part of these initiatives, the Financial Supervisory Service has recently encouraged banks in Korea to increase lending to small- and medium-sized enterprises in order to ease the financial burden on such enterprises amid sluggish economic recovery, and in February 2016, the Bank of Korea announced that it would increase support for loans to small- and medium-sized enterprises in anticipation of growing liquidity difficulties among such enterprises in light of the sustained sluggishness of the general economy and to stimulate trade exports, infrastructure investments and entrepreneurial efforts. The financial regulators have also adopted several measures designed to improve certain lending practices of the commercial banks which practices were perceived as having an unduly prohibitive effect on extending loans to small- to medium-sized enterprises. Moreover, in response to the threat posed to the economy by the COVID-19 outbreak, the Government has implemented various emergency aid initiatives involving Korean banks, including Shinhan Bank, to provide liquidity assistance to small- and medium-sized enterprises. Such initiatives include extending new loans to borrowers with low credit ratings, extending maturity dates on existing loans and deferring interest payment obligations on certain loans. Our participation in such Government initiatives may lead us to extend credit to small- and medium-sized enterprises that we would not otherwise extend, or offer terms on such credit that we would not otherwise offer, in the absence of such initiatives. There is no guarantee that the financial condition and liquidity of the small- and medium-sized enterprises benefiting from such initiatives will improve sufficiently for them to service their debt on a timely basis or at all. Accordingly, an increase in our exposure to small- and medium-sized enterprise borrowers resulting from such Government initiatives may have a material adverse effect on our financial condition and results of operations.
In addition, as a way of supporting the Government’s initiative to assist promising startups, in February 2015, the financial regulators announced that they would encourage the banks in Korea to increase lending to technology companies in the small- to medium-sized enterprise segment and to enhance technology-related credit review capabilities. According to the Korea Federation of Banks, the aggregate balance of loans to technology companies in the small- to medium-sized enterprise segment reached W266.9 trillion, W316.3 trillion and W326 trillion as of December 31, 2020, 2021 and 2022, respectively. Shinhan Bank’s total balance of outstanding loans to technology companies as of December 31, 2020, 2021 and 2022 was W36.6 trillion, W46.2 trillion and W44.8 trillion, respectively.
Furthermore, amid concerns about increasing household debt, the Financial Services Commission increased target proportions for fixed interest rate loans and installment principal repayment-based housing loans for 2020 to 50% and 57.5%, respectively, which remained the same for 2021. The target proportions for fixed interest rate loans and installment principal repayment-based housing loans for 2022 were increased to 52.5% and 60.0%, respectively.
In furtherance of the policy to expand the proportion of fixed rate housing loans, the Financial Services Commission implemented “Relief Debt Conversion” program from March 24 to March 27, 2015 and from March 30 to April 3, 2015, respectively, under which borrowers of eligible housing loans (namely, loans that have been in existence for one year or more since the original loan date, with no delinquency in the past six
35
months, with principal amounts of W500 million or less and for houses valued at W900 million or less that are on a floating rate basis and/or an interest payment only basis) might convert such loans to new fixed rate loans in respect of which the borrowers would be required to repay the principal and interest in installment for a term of 10, 15, 20 or 30 years without a grace period, provided that the new loans pass the maximum loan-to-value ratio of 70% (irrespective of the location of the property) and the maximum debt-to-income ratio of 60% (only in respect of apartment units located in the greater Seoul metropolitan area, subject to certain exceptions). The borrowers were allowed to convert the original loans only at the banks that extended such loans. According to the Financial Services Commission, under this program, approximately 327,000 borrowers converted loans in the aggregate amount of W31.7 trillion to fixed rate loans, of which Shinhan Bank accounted for approximately 13.5%.
On August 26, 2019, the Financial Services Commission announced that it will implement an additional round of the program for up to W20 trillion. Despite tighter thresholds for eligibility, including newly adopted restrictions on annual income, and the imposition of prepayment penalties, the newly implemented program is expected to be substantively similar to the mortgage refinancing program implemented in 2015. Similar to the 2015 program, banks holding newly converted fixed rate loans will be required to sell such loans to Korea Housing Finance Corporation, which will then securitize such loans and issue mortgage-backed securities (backed by such loans) to be purchased by the banks who sold the loans in proportion to the amounts of the loans sold. The amount of loans Shinhan Bank will need to transfer to Korea Housing Finance Corporation is W1.7 trillion, but the amount of mortgage-backed securities Shinhan Bank will need to purchase from Korea Housing Finance Corporation has yet to be determined. Similar to the 2015 program, in the event that market interest rates increase from those applicable during this program’s implementation, we may experience valuation or realization losses on the mortgage-backed securities to be held by Shinhan Bank. Further, Shinhan Bank will be required to hold mortgage-backed securities it purchases from Korea Housing Finance Corporation under the program for a period of one year, and Shinhan Bank also may not be able to sell or otherwise dispose of the mortgage backed securities in the market or otherwise in amounts or at prices commercially reasonable due to the prevailing interest rate environment and/or other market conditions. As a result of this program, we may incur additional costs from recalibrating our asset portfolio and asset-liability management policy. Any of these developments could adversely affect our results of operations and financial condition. Due in large part to such initiatives, fixed interest rate loans and installment principal repayment-based loans accounted for 44.2% and 51.0%, respectively, of the total housing loans extended by commercial banks in Korea as of June 30, 2018, according to data published by the Government in December 2018. Fixed interest rate and installment principal repayment-based housing loans accounted for 49.7% and 53.4%, respectively, of the housing loans extended by Shinhan Bank as of December 31, 2022.
We, on a voluntary basis, may factor the existence of the Government’s policies and encouragements into consideration in making loans although the ultimate decision whether to make loans remains with us and is made based on our internal credit approval procedures and risk management systems independently of Government policies. In addition, in tandem with providing additional loans to small- and medium-sized enterprises and low-income individuals, Shinhan Bank takes active steps to mitigate the potential adverse impacts from making bad loans to enterprises or individuals with high risk profiles as a result of such arrangement, such as by strengthening its loan review and post-lending monitoring processes. However, we cannot assure you that such arrangement did not or will not, or similar or other government-led initiatives in the future will not, result in a suboptimal allocation of our loan portfolio from a risk-reward perspective compared to what we would have allocated based on purely commercial decisions in the absence of such initiatives. The Government may implement similar or other initiatives in the future to spur the overall economy or encourage the growth of targeted industries or relief to certain segments of the population. Specifically, the Government may introduce lending-related initiatives or enforce existing ones in a heightened fashion during times when small- and medium-sized enterprises or low-income households on average are facing an increased level of financial distress or vulnerability due to an economic downturn, which makes lending to them in the volume and the manner suggested by the Government even riskier and less commercially desirable. Accordingly, such policy-driven lending may create enhanced difficulties for us in terms of risk management, deterioration of our asset quality
36
and reduced earnings, compared to what would have been in the absence of such initiatives, which may have an adverse effect on our business, financial condition and results of operations.
The Government may also encourage investments in certain institutions in furtherance of policy objectives, and we may not recoup our investments therein in a timely or otherwise commercially reasonable manner.
In addition to targeted lending, the Government may from time to time encourage or request the financial institutions in Korea, including us and our subsidiaries, to make investments in, or provide other forms of financial support to, certain institutions in furtherance of the Government’s policy objectives. In response thereto, we have made and will continue to make the ultimate decision on whether, how and to what extent we will comply with such encouragements or requests based on our internal risk assessment and in accordance with our risk management systems and policies. At the same time, as a leading member of the financial service industry in Korea and as a responsible corporate citizen we will also fully give due consideration to such encouragements or requests from the Government, especially in relation to the long-term benefit arising from furthering the policy objective of maintaining a sound financial system, even if complying with such requests may involve additional short-term costs and risks to a limited extent.
For example, to deal with a growing number of non-performing loans in the wake of the global financial crisis of 2008-2009, the Government sponsored the establishment of United Asset Management Company Ltd. (“UAMCO”) in October 2009 through capital contributions from six major policy and commercial banks, namely Shinhan Bank, Kookmin Bank, KEB Hana Bank, Industrial Bank of Korea, Woori Bank and Nonghyup Bank. The Government originally planned to dispose of UAMCO during 2015 and establish a new company that specializes in corporate restructuring, but the Government scrapped such plans and instead decided to reorganize UAMCO and expand its restructuring business. As part of an effort to strengthen its balance sheet, UAMCO received additional capital contributions in May 2016 from two new shareholders, Korea Development Bank and the Export-Import Bank of Korea, and two of its existing shareholders, Woori Bank and Nonghyup Bank. In July 2020, UAMCO notified its shareholders of a capital contribution in the aggregate amount of W200.0 billion (to be borne in proportion to the respective shareholding percentages of its shareholders) to improve financial soundness and secure additional investment capacity in case sales of non-performing loans increase due to the COVID-19 pandemic. Accordingly, on July 28, 2020, Shinhan Bank made a capital contribution of W28 billion. Shinhan Bank has committed to contribute W140 billion of capital to UAMCO, of which W113.1 billion has been contributed to date. As of the date hereof, Shinhan Bank holds a 14% equity interest in UAMCO, while seven other policy and commercial banks each hold interests ranging from 2% to 14%.
UAMCO seeks to achieve financial improvement of struggling companies through a wide range of restructuring programs, including debt restructuring, capital injection, asset sales, corporate reorganization, workouts and liquidation and bankruptcy proceedings and is the largest purchaser in Korea of non-performing financial assets generally. Shinhan Bank sold non-performing assets to UAMCO in the amount of W246.5 billion, W92.4 billion and W91.3 billion in 2020, 2021 and 2022, respectively. With an enlarged capital base following the recent capital contributions mentioned above, it is expected that UAMCO will play a more active role in the restructuring of the Korean corporate sector. The Government is also considering an amendment of the Financial Investment Services and Capital Markets Act of Korea to facilitate the business activities of UAMCO.
If UAMCO is successful in its expanded restructuring activities, it is anticipated that financial institutions including us will be able to further enhance their financial soundness by transferring more non-performing loans to UAMCO rather than directly engaging in the restructuring activities of the troubled borrowers. However, Shinhan Bank or other banks may be requested by the Government to make additional capital contributions or loans to UAMCO, which may entail unanticipated costs. Additionally, given the generally poor quality of our non-performing assets, there is no assurance that we will be able to sell such assets held by us to UAMCO on commercially reasonable terms and on a timely basis. Furthermore, there is no assurance that in furtherance of similar or other policy objectives, the Government may not request or otherwise encourage us or our subsidiaries
37
to provide similar or other investments or provide other financial support for which we are not duly compensated or otherwise take up additional risk that we would not normally have undertaken, which may have an adverse effect on our business, financial condition and results of operations.
The level and scope of government oversight of our retail lending business, particularly regarding mortgage and home equity loans, may change depending on the economic or political climate.
Real estate comprises the most significant asset for a substantial number of households in Korea, and movements of housing prices have generally had a significant impact on the domestic economy. Accordingly, regulating housing prices, either in terms of attempting to stem actual or anticipated excessive speculation during times of a suspected housing price bubble and spur the pricing and/or volume of real estate transactions during times of a depressed real estate market by way of tax subsidy, guidelines to lending institutions or otherwise, has been a key policy initiative for the Government.
The regulations on mortgage and home equity loans are susceptible to the changes of housing market cycles and have been revised from time to time. From 2017 to 2022, the Government led by President Moon Jae-in announced and implemented a series of robust polices aimed at taming speculation and deterring the rise of housing prices. However, since the second half of 2022, the Government led by President Yoon Suk Yeol has announced and implemented a series of policies to ease the demand-side regulations in the real estate market in order to prevent housing prices from crashing due to the recent hike in interest rates. For example, the Government has released most areas from “speculative areas”, “overheated speculative areas” and “adjustment targeted areas” (collectively, the “regulated areas”) where tighter loan-to-value ratios and debt-to-income ratios are applicable to mortgage or home equity loans, with only Gangnam-Gu, Seocho-Gu, Songpa-Gu and Yongsan-Gu in the greater Seoul metropolitan area currently remaining as the regulated areas, removed the application of stricter loan-to-value ratio to new loans secured by high-price houses located in the regulated areas and allowed the extension of new loans secured by houses located in the regulated areas to households that already own one or more houses.
The Government also increased the loan-to-value ratio applicable to the regulated areas (i) up to 50% of the appraised value of the houses, except that such maximum loan-to-value ratio is 70% for low-income households that (1) have a combined (in case of married couple) annual income of no more than W90 million, (2) do not currently own any housing and (3) are using the loan to purchase low-price housing valued at W900 million or less (W800 million or less in case of houses located in “adjustment targeted areas”) and (ii) up to 80% of the appraised value of the houses, for new loans to a first-time home buyer with a maximum residential mortgage loan amount of W600 million or less. The regulations on the debt-to-income ratio remained largely unchanged, with the debt-to-income ratio applicable to houses being (i) 60% for those that are located in the greater Seoul metropolitan area but excluding the regulated areas, (ii) 50% for those that are located in “adjustment targeted areas” and (iii) 40% for those that are located in “speculative areas” or “overheated speculative areas”. However, such debt-to-income ratios for houses located in regulated areas are adjusted to 60% for (i) low-income households that (1) have a combined (in case of married couple) annual income of no more than W90 million, (2) do not currently own any housing and (3) are using the loan to purchase low-price housing valued at W900 million or less (W800 million or less in case of houses located in “adjustment targeted areas”) and (ii) first-time homebuyers.
The Financial Services Commission also introduced a debt service ratio and a modified debt-to-income ratio in order to modernize credit review methods and stabilize the management of household debt. The modified debt-to-income ratio, which has been implemented beginning January 31, 2018 reflects (i) both principal and interest payments on the applicable mortgage and home equity loan and existing mortgage and home equity loans and (ii) interest payments on other loans. Previously, debt-to-income ratio had only reflected (i) both principal and interest payments on the applicable mortgage and home equity loan and (ii) interest payments on existing mortgage and home equity loans. Debt service ratios reflect principal and interest payments on both the applicable loan and other loans and have been fully implemented since October 2018. The modified
38
debt-to-income ratios are used as the primary reference index in the evaluation and approval process for mortgage and home equity loans, and debt service ratios are generally used as a supplementary reference index providing additional limits on mortgage and home equity loans. For example, debt service ratios applicable to a loan applicant with a total aggregate loan amount exceeding W100 million (including the applied but not yet extended loan amount) should not exceed 40% unless otherwise specified by the applicable regulations.
In addition, the supervising authorities in Korea from time to time issue administrative instructions to Korean banks, which have the effect of regulating the access of borrowers to housing loans and, as such, demand for real estate properties. For example, the Financial Supervisory Service issued administrative instructions to financial institutions to (except in limited circumstances) verify the borrower’s ability to repay based on proof of income prior to making a mortgage and home equity loan regardless of the type or value of the collateral or the location of the property, which has had the effect of practically barring the grant of any new mortgage and home equity loans to borrowers without verifiable income.
Pursuant to the Regulation on the Supervision of the Banking Business, Shinhan Bank must maintain a loan to deposit ratio of no more than 100%. Since January 1, 2020, in calculating such loan to deposit ratio, retail loans and corporate loans are weighed differently, with retail loans subject to a multiple of 115% and corporate loans (excluding loans to SOHOs) subject to a multiple of 85%, thereby increasing the impact of retail loans and reducing the impact of corporate loans in calculating such ratio. In response to the COVID-19 pandemic, on April 20, 2020, the Financial Services Commission announced a series of measures to temporarily ease the regulations on loan-to-deposit ratio. In particular, the loan-to-deposit ratio of 100% was temporarily increased to 105% and weighing of corporate loans to SOHOs extended since January 1, 2020 to December 31, 2021 also became subject to a multiple of 85% provided such loans are not real estate related. On March 30, 2022, the Financial Services Commission announced plans to cease the temporary easement of regulations relating to the loan-to-deposit ratio as of June 30, 2022 and to gradually normalize the loan-to-deposit ratio back down to 100% beginning July 1, 2022. On October 27, 2022, the Financial Services Commission further announced measures to temporarily ease the loan-to-deposit ratio requirement from 100% to 105% in consideration of the increasing demand for corporate loans due to the contraction of the corporate bond market. This temporary increase will apply through April 2023, subject to further extension depending on the market conditions at the time of expiration of such measures. Additionally, the Detailed Regulation on the Supervision of the Banking Business was amended on June 30, 2018 to provide for a weighted multiple to be applied to mortgage and home equity loans where the loan-to-value ratio exceeds 60% in determining required minimum total capital (BIS) ratio. The Detailed Regulation on the Supervision of the Banking Business was also amended on June 30, 2018 to add “concentration of risk in the retail sector” as an additional criterion when the Financial Supervisory Service evaluates the risk management systems of Korean banks.
There is no assurance that Government measures will achieve their intended results. While any Government measure that is designed to stimulate growth in the real estate sector may result in growth of, and improved profitability for, our retail lending business (particularly with respect to mortgage and home equity loans) at least for the short term, such measure could also result in unintended consequences, including potentially excessive speculation resulting in a “bubble” for the Korean real estate market and a subsequent market crash. In contrast, any Government measure changing the direction of its stimulus measures (for example, in order to preemptively curtail an actual or anticipated bubble in the real estate market) may result in a contraction of the real estate market, a decline in real estate prices and consequently, a reduction in the growth of, and profitability for, our retail and/or other lending businesses, as well as otherwise have an adverse effect on our business, financial condition and results of operations or profitability. See “— Risks Relating to Our Banking Business — A decline in the value of the collateral securing our loans or our inability to fully realize the collateral value may adversely affect our credit portfolio.”
39
We engage in limited settlement transactions involving Iran and also in limited business in and related to Russia which may subject us to legal or reputational risks.
The U.S. Department of the Treasury’s Office of Foreign Assets Control (“OFAC”) administers and enforces certain laws and regulations (“OFAC Sanctions”) that impose restrictions upon dealings with or related to certain countries, governments, entities and individuals that are the subject of OFAC Sanctions, including Iran, and maintains a list of specially designated nationals (the “SDN List”), whose assets are blocked and with whom U.S. persons are generally prohibited from dealing. Some OFAC Sanctions require a U.S. nexus in order to apply (“Primary Sanctions”) while other OFAC Sanctions on certain dealings with or related to Iran, North Korea, and Russia apply even in the absence of a U.S. nexus (“Secondary Sanctions”). Non-U.S. persons are subject to Secondary Sanctions and can also be held liable for violations of Primary Sanctions on various legal grounds, such as causing violations by U.S. persons by engaging in transactions completed in part in the United States. The European Union also enforces certain laws and regulations that impose restrictions upon nationals and entities of, and business conducted in, member states with respect to activities or transactions with certain countries, governments, entities and individuals that are the subject of such laws and regulations. The United Nations Security Council and other governmental entities also impose similar sanctions.
In August 2016, the Government authorized Shinhan Bank to act as a settlement bank for Euro-denominated transactions between Korean and Iranian businesses. Prior to the granting of this permission, payments for business activities were settled only in Korean Won and we did not participate in such settlements. From August 2016 through August 2017, Shinhan Bank processed ten such transactions that resulted in a minimal amount of revenue. Since August 2017, Shinhan Bank has ceased processing any such transactions and has no intention to process any such transactions in the future. We are committed to engaging only in lawful activities and in obeying all relevant OFAC Sanctions and European Union sanctions but cannot guarantee that actions taken by our employees will not violate such sanctions. On May 8, 2018, U.S. President Donald Trump announced his decision to terminate the participation of the United States in the Joint Comprehensive Plan of Action (the “JCPOA”), pursuant to which certain relief of OFAC Sanctions relating to Iran had been provided. Following two wind down periods, one that ended on August 6, 2018 and one that ended on November 4, 2018, all Iran-related Secondary Sanctions that had been waived pursuant to the JCPOA were re-imposed and non-U.S. persons now face risk of Secondary Sanctions for dealing with certain key sectors of the Iranian economy or for providing associated services related to the targeted activities. As such, any Iran-related activities may subject us to OFAC Sanctions and to potential legal or reputational risks.
Shinhan Bank engages in certain limited lending activities in or related to Russia. In response to the Russia-Ukraine conflict, the U.S., E.U., U.K., Korean and other governments have imposed economic sanctions on Russia, Belarus, and certain regions of Ukraine. Such sanctions target, among other persons, a wide range of Russian financial institutions as sanctioned parties as well as the Russian Central Bank and certain other state entities. Russia-related activities may subject us to sanctions and potential legal or reputational risk.
Risks Relating to Korea
Unfavorable financial and economic conditions in Korea and globally may have a material adverse impact on our asset quality, liquidity and financial performance.
We are incorporated in Korea, where most of our assets are located and most of our income is generated. As a result, we are subject to political, economic, legal and regulatory risks specific to Korea, and our business, results of operations and financial condition are substantially dependent on developments relating to the Korean economy. As Korea’s economy is highly dependent on the health and direction of the global economy, and investors’ reactions to developments in one country can have adverse effects on the securities price of companies in other countries, we are also subject to the fluctuations of the global economy and financial markets. Factors that determine economic and business cycles in the Korean or global economy are for the most part beyond our control and inherently uncertain. In addition to discussions of recent developments regarding the global
40
economic and market uncertainties and the risks relating to us as provided elsewhere in this section, factors that could have an adverse impact on Korea’s economy in the future include, among others:
| |
• |
|
continued volatility or deterioration in Korea’s credit and capital markets; |
| |
• |
|
difficulties in the financial sectors in Europe, China and elsewhere and increased sovereign default risks in select countries and the resulting adverse effects on the global financial markets, including possibility of global inflation and the spread of economic downturn to Europe as a result of geopolitical risks arising from Russia-Ukraine conflict; |
| |
• |
|
declines in consumer confidence and a slowdown in consumer spending and corporate investments; |
| |
• |
|
adverse changes or volatility in foreign currency reserve levels, commodity prices (including oil prices), exchange rates (including fluctuation of the U.S. Dollar, the Euro or the Japanese Yen exchange rates or revaluation of the Chinese Renminbi, increased exchange rate volatility as a result of COVID-19 (and recovery therefrom) and consequent government interventions, interest rates, inflation rates or stock markets; |
| |
• |
|
increasing levels of household debt; |
| |
• |
|
increasing delinquencies and credit defaults by retail and small- and medium-sized enterprise borrowers; |
| |
• |
|
continuing adverse conditions in the economies of countries and regions that are important export markets for Korea, such as the United States, Europe, Japan and China, or in emerging market economies in Asia or elsewhere; |
| |
• |
|
the economic impact of any pending or future free trade agreements; |
| |
• |
|
potential escalation of the ongoing trade war between the U.S. and China as each country introduces tariffs on goods traded with the other; |
| |
• |
|
social and labor unrest; |
| |
• |
|
significant fluctuations or decreases in the market prices of Korean real estate; |
| |
• |
|
a decrease in tax revenue and a substantial increase in the Government’s expenditures for fiscal stimulus measures, unemployment compensation and other economic and social programs that, together, would lead to an increased government budget deficit; |
| |
• |
|
financial problems or lack of progress in the restructuring of Korean business groups, other large troubled companies, their suppliers or the financial sector; |
| |
• |
|
loss of investor confidence arising from corporate accounting irregularities and corporate governance issues concerning certain Korean business groups; |
| |
• |
|
increases in social expenditures to support an aging population in Korea or decreases in economic productivity due to the declining population size in Korea; |
| |
• |
|
geopolitical uncertainty and risk of further attacks by terrorist groups around the world, including the actions of the so-called “Islamic State”; |
| |
• |
|
the occurrence of severe health epidemics in Korea and other parts of the world, including COVID-19, Ebola, Middle East Respiratory Syndrome (MERS) and Zika virus outbreaks; |
| |
• |
|
deterioration in economic or diplomatic relations between Korea and its trading partners or allies, including deterioration resulting from territorial or trade disputes or disagreements in foreign policy such as the recent diplomatic tension between Korea and China with respect to the deployment of the Terminal High Altitude Area Defense (THAAD) system in Korea and trade disputes between Korea and the United States with respect to the imposition of anti-dumping duties on Korean steel, washing machines, transformers and solar panels; |
41
| |
• |
|
political uncertainty, or increasing strife among or within political parties in Korea, and political gridlock within the government or in the legislature, which prevents or disrupts timely and effective policy making; |
| |
• |
|
hostilities or political or social tensions involving oil-producing countries in the Middle East and North Africa and any material disruption in the global supply of oil or sudden increase in the price of oil; |
| |
• |
|
political or social tensions involving Russia and any resulting adverse effects on the global supply of oil or the global financial markets; |
| |
• |
|
the occurrence of natural or man-made disasters in Korea (such as the sinking of the Sewol ferry in April 2014, which significantly dampened consumer sentiment in Korea for months) and other parts of the world, particularly in trading partners of Korea; and |
| |
• |
|
an increase in the level of tensions or an outbreak of hostilities between North Korea and Korea or the United States. |
Any future deterioration of the Korean economy could have an adverse effect on our business, financial condition and results of operations.
Tensions with North Korea could have an adverse effect on us, the price of our common shares and our American depositary shares.
Relations between Korea and North Korea have been tense throughout Korea’s modern history. The level of tension between Korea and North Korea has fluctuated and may increase abruptly as a result of current and future events. In particular, there continues to be heightened security tension in the region stemming from North Korea’s hostile military and diplomatic actions, including in respect of its nuclear weapons and long-range missile programs. Some examples from recent years include the following:
| |
• |
|
North Korea renounced its obligations under the Nuclear Non-Proliferation Treaty in January 2003 and conducted six rounds of nuclear tests since October 2006, including claimed detonations of hydrogen bombs, which are more powerful than plutonium bombs, and warheads that can be mounted on ballistic missiles. Over the years, North Korea has also conducted a series of ballistic missile tests, including missiles launched from submarines and intercontinental ballistic missiles that it claims can reach the United States mainland. In response, the Government has repeatedly condemned the provocations and flagrant violations of relevant United Nations Security Council resolutions. Internationally, the United Nations Security Council has passed a series of resolutions condemning North Korea’s actions and significantly expanding the scope of sanctions applicable to North Korea, most recently in November 2022 in response to North Korea’s intercontinental ballistic missile test in November 2022. Over the years, the United States and the European Union have also expanded their sanctions applicable to North Korea. |
| |
• |
|
In February 2016, in retaliation of North Korea’s launch of a long-range rocket, Korea announced that it would halt its operations of the Kaesong Industrial Complex, an industrial complex in the border city of Kaesong, to impede North Korea’s utilization of funds from the industrial complex to finance its nuclear and missile programs. In response, North Korea announced that it would expel all Korean employees from the industrial complex and freeze all Korean assets in the complex. All 280 Korean workers present at Kaesong left hours after the announcement by North Korea, and the complex remains closed as of the date hereof. |
| |
• |
|
In March 2013, North Korea stated that it had entered “a state of war” with Korea, declaring the 1953 armistice invalid, and put its artillery at the highest level of combat readiness to protest the Korea-United States allies’ military drills and additional sanctions imposed on North Korea for its missile and nuclear tests. |
North Korea’s economy also faces severe challenges, including severe inflation and food shortages, which may further aggravate social and political tensions within North Korea. In addition, reunification of Korea and
42
North Korea could occur in the future, which would entail significant economic commitment and expenditure by Korea that may outweigh any resulting economic benefits of reunification.
In April, May and September 2018, President Moon Jae-in met Kim Jong-un in a series of summit meetings to discuss, among other matters, denuclearization of the Korean peninsula. In June 2018, U.S. President Donald Trump and Kim Jong-un in turn had an official summit in Singapore, the first ever meeting between leaders of the United States and North Korea. Subsequent to the Singapore summit, they signed a joint statement, which stated, among others, new peaceful relations and the denuclearization of the Korean peninsula. A second official summit between U.S. President Donald Trump and Kim Jong-un was held in Vietnam in February 2019 but ended abruptly and without an agreement. In June 2019, U.S. President Donald Trump and Kim Jong-un had another summit at the Korean Demilitarized Zone, following which both sides announced a resumption of denuclearization talks. However, in December 2019, North Korea announced its intention to resume missile testing, heightening tensions. On June 16, 2020, North Korea destroyed the joint liaison office in Kaesong, citing anti-regime propaganda allegedly disseminated using balloons across the border by Korean activists, and cut all other communication channels with Korea.
In the aftermath of these developments, there remains significant uncertainty regarding peace talks and the denuclearization of the Korean peninsula. As such, there can be no assurance that the level of tension on the Korean peninsula will not escalate in the future or that the political regime in North Korea may not suddenly collapse. Any further increase in tension or uncertainty relating to the military, political or economic stability in the Korean peninsula, including a breakdown of diplomatic negotiations over the North Korean nuclear program, occurrence of military hostilities, heightened concerns about the stability of North Korea’s political leadership or its actual collapse, a leadership crisis, a breakdown of high-level contacts or accelerated reunification could have a material adverse effect on our business, financial condition and results of operations, as well as the price of our common shares and our American depositary shares.
Risks Relating to Our American Depositary Shares
There are restrictions on withdrawal and deposit of common shares under the depositary facility.
Under the deposit agreement, holders of shares of our common stock may deposit those shares with the depositary bank’s custodian in Korea and obtain American depositary shares, and holders of American depositary shares may surrender American depositary shares to the depositary bank and receive shares of our common stock. However, under current Korean laws and regulations, the depositary bank is required to obtain our prior consent for the number of shares to be deposited in any given proposed deposit which exceeds the difference between (1) the aggregate number of shares deposited by us for the issuance of American depositary shares (including deposits in connection with the initial and all subsequent offerings of American depositary shares and stock dividends or other distributions related to these American depositary shares) and (2) the number of shares on deposit with the depositary bank at the time of such proposed deposit. We have consented to the deposit of outstanding shares of common stock as long as the number of American depositary shares outstanding at any time does not exceed 40,432,628. As a result, if you surrender American depositary shares and withdraw shares of common stock, you may not be able to deposit the shares again to obtain American depositary shares.
Ownership of our shares is restricted under Korean law.
Under the Financial Holding Companies Act, any single shareholder (together with certain persons in a special relationship with such shareholder) may acquire beneficial ownership of up to 10% of the total issued and outstanding shares with voting rights of a bank holding company controlling national banks such as us. In addition, any person, except for a “non-financial business group company” (as defined below), may acquire in excess of 10% of the total voting shares issued and outstanding of a financial holding company which controls a national bank, provided that a prior approval from the Financial Services Commission is obtained each time such person’s aggregate holdings exceed 10% (or 15% in the case of a financial holding company controlling regional
43
banks only), 25% or 33% of the total voting shares issued and outstanding of such financial holding company. The Government and the Korea Deposit Insurance Corporation are exempt from this limit. Furthermore, certain non-financial business group companies (i.e., (i) any same shareholder group with aggregate net assets of all non-financial business companies belonging to such group of not less than 25% of the aggregate net assets of all members of such group; (ii) any same shareholder group with aggregate assets of all non-financial business companies belonging to such group of not less than W2 trillion; (iii) any mutual fund in which the same shareholder group identified in (i) or (ii) above owns more than 4% of the total shares issued and outstanding of such mutual fund; (iv) any private equity fund (a) where a person falling under any of items (i) through (ii) above is a limited partner holding not less than 10% of the total amount of contributions to the private equity fund, or (b) where a person falling under any of items (i) through (iii) above is a general partner, or (c) where the total equity of the private equity fund acquired by each affiliate belonging to several enterprise groups subject to the limitation on mutual investment is 30% or more of the total amount of contributions to the private equity fund; or (v) the investment purpose company concerned, where a private equity fund falling under item (iv) above acquires or holds stocks in excess of 4% of the shares or equity of such company or exercises de facto control over significant managerial matters of such company through appointment or dismissal of executives or in any other manner)) may not acquire beneficial ownership in us in excess of 4% of our outstanding voting shares, provided that such non-financial business group companies may acquire beneficial ownership of up to 10% of our outstanding voting shares with the approval of the Financial Services Commission under the condition that such non-financial business group companies will not exercise voting rights in respect of such shares in excess of the 4% limit. See “Item 4.B. Business Overview — Supervision and Regulation — Principal Regulations Applicable to Financial Holding Companies — Restrictions on Financial Holding Company Ownership.” To the extent that the total number of shares of our common stock that you and your affiliates own together exceeds these limits, you will not be entitled to exercise the voting rights for the excess shares, and the Financial Services Commission may order you to dispose of the excess shares within a period of up to six months. Failure to comply with such an order would result in a fine of up to W100 million, plus an additional charge of up to 0.03% of the book value of such shares per day until the date of disposal.
Holders of our ADSs will not have preemptive rights in certain circumstances.
The Korean Commercial Code and our articles of incorporation require us, with some exceptions, to offer shareholders the right to subscribe for new shares in proportion to their existing ownership percentage whenever new shares are issued. If we offer any rights to subscribe for additional shares of our common stock or any rights of any other nature, the depositary bank, after consultation with us, may make the rights available to you or use reasonable efforts to dispose of the rights on your behalf and make the net proceeds available to you. The depositary bank, however, is not required to make available to you any rights to purchase any additional shares unless it deems that doing so is lawful and feasible and:
| |
• |
|
a registration statement filed by us under the U.S. Securities Act of 1933, as amended, is in effect with respect to those shares; or |
| |
• |
|
the offering and sale of those shares is exempt from or is not subject to the registration requirements of the U.S. Securities Act. |
We are under no obligation to file any registration statement with the U.S. Securities and Exchange Commission. If a registration statement is required for you to exercise preemptive rights but is not filed by us, you will not be able to exercise your preemptive rights for additional shares and you will suffer dilution of your equity interest in us.
Holders of our ADSs will not be able to exercise dissent and appraisal rights unless they have withdrawn the underlying shares of our common stock and become our direct stockholders.
Under Korean law, in some limited circumstances, including the transfer of the whole or any significant part of our business and the merger or consolidation of us with another company, dissenting stockholders have the
44
right to require us to purchase their shares under Korean law. However, under our deposit agreement, holders of our American depositary shares do not have, and may not instruct the depositary as to the exercise of, any dissenter’s rights provided to the holders of our common shares under Korean law. Therefore, if holders of our American depositary shares wish to exercise dissenting rights, they must withdraw the underlying common stock from the American depositary shares facility (and incur charges relating to that withdrawal) and become our direct stockholders prior to the record date of the shareholders’ meeting at which the relevant transaction is to be approved, in order to exercise dissent and appraisal rights.
The market value of your investment in our ADSs may fluctuate due to the volatility of the Korean securities market.
Our common stock is listed on the KRX KOSPI Division of the Korea Exchange, which has a smaller market capitalization and is more volatile than the securities markets in the United States and many European countries. The market value of ADSs may fluctuate in response to the fluctuation of the trading price of shares of our common stock on the Stock Market Division of the Korea Exchange. The Stock Market Division of the Korea Exchange has experienced substantial fluctuations in the prices and volumes of sales of listed securities and the Stock Market Division of the Korea Exchange has prescribed a fixed range in which share prices are permitted to move on a daily basis. Like other securities markets, including those in developed markets, the Korean securities market has experienced problems including market manipulation, insider trading and settlement failures. The recurrence of these or similar problems could have a material adverse effect on the market price and liquidity of the securities of Korean companies, including our common stock and ADSs, in both the domestic and the international markets.
The Government has the potential ability to exert substantial influence over many aspects of the private sector business community, and in the past has exerted that influence from time to time. For example, the Government has promoted mergers to reduce what it considers excess capacity in a particular industry and has also encouraged private companies to publicly offer their securities. Similar actions in the future could have the effect of depressing or boosting the Korean securities market, whether or not intended to do so. Accordingly, actions by the government, or the perception that such actions are taking place, may take place or has ceased, may cause sudden movements in the market prices of the securities of Korean companies in the future, which may affect the market price and liquidity of our common stock and ADSs.
Your dividend payments and the amount you may realize upon a sale of your ADSs will be affected by fluctuations in the exchange rate between the U.S. Dollar and the Won.
Investors who purchase the American depositary shares will be required to pay for them in U.S. Dollars. Our outstanding shares are listed on the Korea Exchange and are quoted and traded in Won. Cash dividends, if any, in respect of the shares represented by the American depositary shares will be paid to the depositary bank in Won and then converted by the depositary bank into U.S. Dollars, subject to certain conditions. Accordingly, fluctuations in the exchange rate between the Won and the U.S. Dollar will affect, among other things, the amounts a registered holder or beneficial owner of the American depositary shares will receive from the depositary bank in respect of dividends, the U.S. Dollar value of the proceeds which a holder or owner would receive upon sale in Korea of the shares obtained upon surrender of American depositary shares and the secondary market price of the American depositary shares.
If the Government deems that certain emergency circumstances are likely to occur, it may restrict the depositary bank from converting and remitting dividends in Dollars.
If the Government deems that certain emergency circumstances are likely to occur, it may impose restrictions such as requiring foreign investors to obtain prior Government approval for the acquisition of Korean
45
securities or for the repatriation of interest or dividends arising from Korean securities or sales proceeds from disposition of such securities. These emergency circumstances include any or all of the following:
| |
• |
|
sudden fluctuations in interest rates or exchange rates; |
| |
• |
|
extreme difficulty in stabilizing the balance of payments; and |
| |
• |
|
a substantial disturbance in the Korean financial and capital markets. |
The depositary bank may not be able to secure such prior approval from the government for the payment of dividends to foreign investors when the Government deems that there are emergency circumstances in the Korean financial markets.
Other Risks
We are generally subject to Korean corporate governance and disclosure standards, which differ in significant respects from those in other countries.
Companies in Korea, including us, are subject to corporate governance standards applicable to Korean public companies which differ in many respects from standards applicable in other countries, including the United States. As a reporting company registered with the Securities and Exchange Commission and listed on the New York Stock Exchange, we are, and in the future will be, subject to certain corporate governance standards as mandated by the Sarbanes-Oxley Act of 2002. However, foreign private issuers, including us, are exempt from certain corporate governance requirements under the Sarbanes-Oxley Act or under the rules of the New York Stock Exchange. For significant differences, see “Item 16G. Corporate Governance.” There may also be less publicly available information about Korean companies, such as us, than is regularly made available by public or non-public companies in other countries. Such differences in corporate governance standards and less public information could result in less than satisfactory corporate governance practices or disclosure to investors in certain countries.
You may not be able to enforce a judgment of a foreign court against us.
We are a corporation with limited liability organized under the laws of Korea. All or substantially all of our directors and officers and other persons named in this annual report reside in Korea, and all or a substantial portion of the assets of our directors and officers and other persons named in this annual report and substantially all of our assets are located in Korea. As a result, it may not be possible for holders of the American depository shares to effect service of process within the United States, or to enforce against them or us in the United States judgments obtained in United States courts based on the civil liability provisions of the federal securities laws of the United States. There is doubt as to the enforceability in Korea, either in original actions or in actions for enforcement of judgments of United States courts, of civil liabilities predicated on the United States federal securities laws.
We may become a passive foreign investment company (“PFIC”), which could result in adverse U.S. tax consequences to U.S. investors.
Based upon the past and projected composition of our income and assets and valuation of our assets, we do not believe that we were a PFIC for 2022, and we do not expect to be a PFIC in 2023 or to become one in the foreseeable future, although there can be no assurance in this regard. If, however, we become a PFIC, such characterization could result in adverse U.S. tax consequences to you if you are a U.S. investor. For example, if we become a PFIC, our U.S. investors may become subject to increased tax liabilities under U.S. tax laws and regulations and will become subject to burdensome reporting requirements. Our PFIC status is determined on an annual basis and depends on the composition of our income and assets. Specifically, we will be classified as a PFIC for U.S. tax purposes if either: (i) 75% or more of our gross income in a taxable year is passive income, or (ii) the average percentage of our assets by value in a taxable year which produce or are held for the production
46
of passive income (which generally includes cash) is at least 50%. Special rules treat certain income earned by a non-U.S. corporation engaged in the active conduct of a banking business as non-passive income. See “Item 10.E. Taxation — Certain United States Federal Income Tax Consequences — Passive Foreign Investment Company Rules.” We cannot assure you that we will not be a PFIC for 2023 or any future taxable year.
| ITEM 4. |
INFORMATION ON THE COMPANY |
| ITEM 4.A. |
History and Development of the Company |
Introduction
We are one of the leading financial institutions in Korea in terms of total assets, revenues, profitability and capital adequacy, among others. Incorporated on September 1, 2001, we are the first privately-held financial holding company to be established in Korea. Since inception, we have developed and introduced a wide range of financial products and services in Korea and aimed to deliver comprehensive financial solutions to clients through a convenient one-portal network. According to reports by the Financial Supervisory Service, we are the second largest financial services provider in Korea (as measured by consolidated total assets as of December 31, 2022) and operate the second largest banking business (as measured by consolidated total bank assets as of December 31, 2022) and the largest credit card business (as measured by total credit purchase volume in 2022) in Korea.
We have experienced substantial growth through several mergers and acquisitions. On February 1, 2019, we acquired a 59.15% interest in Orange Life Insurance, the former Korean unit of ING Life Insurance, as part of our efforts to diversify and enhance our non-banking businesses. On January 28, 2020, we acquired the remaining interests in Orange Life Insurance by effecting a comprehensive stock exchange under Articles 360-2 of the Korean Commercial Code whereby holders (other than us) of Orange Life Insurance’s common stock transferred all of their shares to us and in return receive shares of our common stock, and hence Orange Life Insurance became our wholly owned subsidiary as of such date. Orange Life Insurance was subsequently merged with and into Shinhan Life Insurance in July 2021. On June 30, 2022 we acquired 94.54% interest in BNP Paribas Cardif General Insurance, which then changed its name to Shinhan EZ General Insurance, Ltd. Subsequently in November 2022, Shinhan EZ General Insurance, Ltd. conducted a paid-in capital increase and our shares decreased to 85.1%.
As of December 31, 2022, we have 16 direct and 35 indirect subsidiaries offering a wide range of financial products and services, including commercial banking, corporate banking, private banking, credit card, asset management, brokerage and insurance services. We believe that such breadth of services will help us to meet the diversified needs of our present and potential clients. We currently serve approximately 19 million active customers, which we believe is the largest customer base in Korea, through approximately 24,527 employees at approximately 1,397 network branches group-wide. While over 80% of our revenues have been historically derived from Korea, we aim to serve the needs of our customers through a global network of 248 offices in the United States, Canada, the United Kingdom, Japan, the People’s Republic of China, Germany, India, Australia, Hong Kong, Vietnam, Cambodia, Kazakhstan, Singapore, Mexico, Uzbekistan, Myanmar, Poland, Indonesia, the Philippines and the United Arab Emirates.
Our registered office and corporate headquarters are located at 20, Sejong-daero 9-gil, Jung-gu, Seoul, Korea 04513 and our telephone number is +822 6360 3000.
Our Strategy
‘Excellent Shinhan’ for 2020 and beyond
The Group has implemented the ‘2020 SMART Project’ since 2017, and we have seen this strategy result in balanced growth across the Group, such as expanding and strengthening the Group’s offerings, establishing new
47
subsidiaries, acquisitions of domestic and foreign financial companies, upgrading digital platforms and promoting sustainable management. In 2020, we established a new mid-term group-wide strategy known as ‘F.R.E.S.H. 2020s’, building upon and replacing the existing 2020 SMART Project. ‘F.R.E.S.H.’ stands for ‘Fundamental’ (solid fundamentals), ‘Resilience’ (ability to adapt to and overcome crisis situations), ‘Ecosystem’ (creating an integrated digital ecosystem), ‘Sustainability’ (consistent Group-wide effort to achieve sustainable growth) and ‘Human-talent’ (talented human resources leading the Fourth Industrial Revolution). Under this ‘F.R.E.S.H. 2020s’ initiative, we have established seven detailed strategic directions for 2022 and beyond to allow us to achieve distinguished and sustainable growth despite uncertainties and become a leading financial group.
Under the unique growth directive summarized as ‘F.R.E.S.H.’, we have established seven detailed strategic directions for 2022 that comprehensively consider the management environment in 2022.
| |
1. |
Conversion to Innovative and Open Digital Platforms |
We plan to accelerate all-around digital transformation, particularly through developing innovative digital platforms, acquiring a competitive advantage in data-based businesses, fostering digital startups and creating new business models through competitive partnerships. In addition, we will continue to scale-up our group-wide digital capabilities and human resources.
| |
2. |
Pursuit of Efficient Growth |
We plan to efficiently enhance our profitability by developing existing business lines and investing in future growth areas. To strengthen the efficiency of our existing business lines, we aim to improve the quality of our core businesses, enhance our non-interest income generating businesses, strategically allocate our existing resources, promote new business opportunities and expand our business portfolio to discover future growth areas.
| |
3. |
Global connectivity and expansion |
We will look to diversify our global business model by shifting our focus from a volume-based expansion to a more advanced quality focused growth initiative for our global business, implementing our unique localization strategies and increasing cooperation and cross-selling across the Group. We will also work to increase our global product sourcing capabilities and foreign asset management capabilities.
| |
4. |
Sustainable Performance |
Our plans to foster sustainable finance consist of three strategic pillars – (1) environmentally friendly, (2) inclusive and (3) trust-based business management system. In 2020, we declared “Zero Carbon Drive”, as part of our vision to go carbon-neutral by 2050. We plan to promote environmentally sustainable development through financing of projects aimed at reducing carbon and greenhouse gas emission. Moreover, in December 2019 we launched the Triple-K Project to provide promising start-ups and tech companies with systematic support in our efforts to promote inclusive and innovative growth ecosystems.
| |
5. |
Proactive Risk Management |
Due to continuously increasing uncertainty and unstable market conditions, we place particular importance on the proactive management of risk. We will continue to enhance our core risk management competencies, including by upgrading our Group-wide digital capabilities and IT infrastructure. We also intend to develop a sophisticated customer protection system with a greater emphasis on customer-oriented risk management.
| |
6. |
Development of a Dynamic Organization System |
To further efficient management on a Group-wide basis, we plan to develop a dynamic Group-wide portfolio system. In particular, we plan to efficiently streamline our portfolio across various Group subsidiaries,
48
while strengthening each subsidiaries’ organizational efficiency and flexibility, and establish a customer-oriented organizational system.
| |
7. |
Convergent Human Resources Management |
In order to recruit and retain talent, we plan to go beyond simply improving our human resources system by establishing an innovative human resource management platform. Our specific plans include fostering a healthy working environment, creating a flexible organization and innovative culture. Moreover, we intend to increase our brand value, allowing us to target and recruit talented professionals.
We have built a balanced portfolio across the financial industry and plan to enhance market competitiveness and reduce costs by further optimizing each of our business lines. In 2021, we established a new vision of “More Friendly, More Secure, More Creative”, and are promoting organizational capacity, strengthening of each subsidiaries, enhancing organizational efficiency and flexibility, and establishing a customer-oriented organizational system in accordance with such vision.
“Convergence Talent Management” serves as the foundation for other core strategic initiatives, and we will continue to build and grow a talented workforce that possesses traits and capabilities required to thrive in the digital era. In particular, we have promoted “Shinhan RE:BOOT”, a major transformation of our corporate culture since 2021. We intend to accelerate the execution of strategies and changes within the Group through cultural transformation projects such as data-driven working methods, a fast and flexible organizational culture, and HR digitalization.
Our History and Development
On September 1, 2001, we were formed as a financial holding company under the Financial Holding Companies Act, as a result of acquiring all of the issued shares of the following four entities from their former shareholders in exchange for shares of our common stock: (i) Shinhan Bank, a nationwide commercial bank listed on the Korea Exchange, (ii) Shinhan Securities Co., Ltd., a securities brokerage company listed on the Korea Exchange, (iii) Shinhan Capital Co., Ltd., a leasing company listed on the Korea Exchange Korean Securities Dealers Automated Quotations (“KRX KOSDAQ”), and (iv) Shinhan Investment Trust Management Co., Ltd., a privately held investment trust management company. On September 10, 2001, the common stock of our holding company was listed on what is currently the KRX KOSPI Market.
Since our inception, we have expanded our operations, in large part, through strategic acquisitions, establishing subsidiaries or formation of joint ventures. Our key acquisitions, capital contributions and joint venture formations are described as below:
|
|
|
|
|
|
|
| Date of Acquisition |
|
Entity |
|
Principal Activities |
|
Method of Establishment |
| April 2002 |
|
Jeju Bank |
|
Regional banking |
|
Acquisition from Korea Deposit Insurance Corporation |
|
|
|
|
| July 2002 |
|
Shinhan Securities Co., Ltd.(1) |
|
Securities and investment |
|
Acquisition from the SsangYong Group |
|
|
|
|
| August 2002 |
|
Shinhan BNP Paribas Investment Trust Management Co., Ltd.(2) |
|
Investment advisory |
|
50:50 joint venture with BNP Paribas |
|
|
|
|
| August 2003 |
|
Chohung Bank |
|
Commercial banking |
|
Acquisition from creditors |
49
|
|
|
|
|
|
|
| Date of Acquisition |
|
Entity |
|
Principal Activities |
|
Method of Establishment |
|
|
|
|
| December 2005 |
|
Shinhan Life Insurance |
|
Life insurance services |
|
Acquisition from shareholders |
|
|
|
|
| March 2007 |
|
LG Card |
|
Credit card services |
|
Acquisition from creditors |
|
|
|
|
| January 2012 |
|
Tomato Mutual Savings Bank(3) |
|
Savings bank |
|
Purchase and assumption of assets and liabilities from creditors |
|
|
|
|
| January 2013 |
|
Yehanbyoul Savings Bank(4) |
|
Savings bank |
|
Acquisition from Korea Deposit Insurance Corporation |
|
|
|
|
| October 2017 |
|
Shinhan REITs Management |
|
Real estate asset management |
|
Newly established |
|
|
|
|
| February 2019, January 2020 |
|
Orange Life Insurance(5) |
|
Life insurance services |
|
Acquisition from majority shareholders and subsequent comprehensive stock exchange |
|
|
|
|
| May 2019 |
|
Asia Trust Co. Ltd.(6) |
|
Real estate trust business |
|
Acquisition from majority shareholders |
|
|
|
|
| August 2019 |
|
Shinhan AI. Co., Ltd. |
|
Investment advisory |
|
Incorporated and joined as a wholly-owned subsidiary |
|
|
|
|
| September 2020, December 2020 |
|
Shinhan Venture Investment)(7) |
|
Venture capital |
|
Acquisition from majority shareholders and subsequent comprehensive stock exchange |
|
|
|
|
| January 2021 |
|
Shinhan Asset Management(8) |
|
Asset management services |
|
Acquisition of remaining interests from BNP Paribas Asset Management Holding |
|
|
|
|
| June 2022 |
|
Shinhan EZ General Insurance(9) |
|
General insurance services |
|
Acquisition of BNP Paribas Cardif General Insurance |
Notes:
| (1) |
Renamed as Shinhan Investment Corp. from Goodmorning Shinhan Securities Co., Ltd. effective August 2009 and renamed again as Shinhan Securities Co., Ltd. from Shinhan Investment Corp. effective October 2022. |
| (2) |
In January 2009, SH Asset Management Co., Ltd. and Shinhan BNP Paribas Investment Trust Management merged to form Shinhan BNP Paribas Asset Management. |
| (3) |
Shinhan Hope Co., Ltd. was established on December 12, 2011, to purchase and assume certain assets and liabilities of Tomato Mutual Savings Bank. On December 28, 2011, Shinhan Hope Co., Ltd. obtained a savings bank license, changed its name to Shinhan Savings Bank and became our direct subsidiary. |
50
| (4) |
In January 2013, we entered into a share purchase agreement with Korea Deposit Insurance Corporation for the acquisition of Yehanbyoul Savings Bank, a savings bank located in Korea, for W45.3 billion, and received regulatory approval to merge Yehanbyoul Savings Bank into our existing subsidiary Shinhan Saving Bank. On April 1, 2013, Shinhan Savings Bank and Yehanbyoul Savings Bank merged into a single entity, with Yehanbyoul Savings Bank being the surviving entity and the newly merged bank being named Shinhan Savings Bank. |
| (5) |
On February 1, 2019, we acquired a 59.15% interest in Orange Life Insurance, the former Korean unit of ING Life Insurance, as part of our efforts to diversify and enhance our non-banking businesses. On January 28, 2020, we acquired the remaining interests in Orange Life Insurance by effecting a comprehensive stock exchange under Articles 360-2 of the Korean Commercial Code whereby holders (other than us) of Orange Life Insurance’s common stock transferred all of their shares to us and in return receive shares of our common stock, and hence Orange Life Insurance became our wholly owned subsidiary as of such date. Orange Life Insurance was subsequently merged with and into Shinhan Life Insurance in July 2021. |
| (6) |
In October 2018, we announced the acquisition of a 60.0% interest in Asia Trust Co. Ltd. According to the transaction agreement, we seek to complete the acquisition by acquiring the remaining 40.0% shares in Asia Trust Co. Ltd. by 2022. The acquisition was approved by the Financial Services Commission on February 17, 2019 and closed on May 2, 2019. Upon closing, Asia Trust Co. Ltd. became our direct subsidiary. In May 2022, Asia Trust Co. Ltd. changed its name to Shinhan Asset Trust Co., Ltd. |
| (7) |
On September 29, 2020, we acquired a 96.8% interest in Neoplux, a venture capital company formerly under the Doosan Group. On December 30, 2020, we acquired the remaining interest in Neoplux by effecting a small-scale stock exchange under Article 360-10 of the Korean Commercial Code, and hence Neoplux has become our wholly owned subsidiary as of such date. On January 11, 2021, Neoplux changed its legal name to Shinhan Venture Investment. |
| (8) |
On January 15, 2021, we acquired the remaining 35% interest in Shinhan BNP Paribas Asset Management from BNP Paribas Asset Management Holding and changed its legal name to Shinhan Asset Management, and hence Shinhan Asset Management has become our wholly-owned subsidiary as of such date. |
| (9) |
On June 30, 2022 we acquired 94.54% interest in BNP Paribas Cardif General Insurance, which then changed its name to Shinhan EZ General Insurance, Ltd. Subsequently in November 2022, Shinhan EZ General Insurance, Ltd. conducted a paid-in capital increase and our shares decreased to 85.1%. |
| ITEM 4.B. |
Business Overview |
Unless otherwise specifically mentioned, the following business overview is presented on a consolidated basis under IFRS.
Our Principal Activities
We provide comprehensive financial services, principally consisting of the following:
| |
• |
|
commercial banking services, mainly consisting of: |
| |
• |
|
retail banking, which primarily focuses on making loans to or receiving deposits from individual customers (including high net-worth individuals and families) and, to a lesser extent, not-for-profit institutions such as hospitals, airports and schools; |
| |
• |
|
corporate banking, which primarily focuses on making loans to or receiving deposits from for-profit corporations, including small- and medium-sized enterprises, and providing investment banking services to corporate clients; |
| |
• |
|
international banking, which primarily focuses on management of overseas subsidiaries and branch operations and other international businesses; and |
| |
• |
|
other banking, which consists of treasury business (including internal asset and liability management and other non-deposit funding activities), securities investing and trading and derivatives trading, as well as administration of the overall banking operations. |
51
| |
• |
|
securities brokerage services; |
| |
• |
|
life insurance services; |
| |
• |
|
specialized credit services; |
| |
• |
|
asset management services, including securities investment trust management, investment advisory, call transaction, domestic and foreign private equity fund business, alternative investments through formation of private equity funds on a private placement basis and other management services; and |
| |
• |
|
other services - savings banking services, loan collection and credit reporting, collective investment administrative services, financial system development services, real estate trust services, investment advisory services, venture capital services, and non-life insurance services. |
In addition to the above-mentioned business activities, we, at the holding company level, have the following business departments and planning offices, the primary functions of which are to support cross-divisional management with respect to these specific functional areas: group & global investment banking business department, global market & securities planning office, global business planning office, wealth management planning office and retirement pension planning office.
Our principal business activities are not subject to any material seasonal trends. Although we have a number of overseas branches and subsidiaries, substantially all of our assets are located, and substantially all of our revenues are generated, in Korea.
Deposit-Taking Activities
Principally through Shinhan Bank, we offer many deposit products that target different customer segments with features tailored to each segment’s financial and other profiles. Our deposit products consist principally of the following:
| |
• |
|
Demand deposits. Demand deposits do not accrue interest or accrue interest at a lower rate than time or savings deposits and allow the customer to deposit and withdraw funds at any time. If interest-bearing, demand deposits have interest accruing at a fixed or variable rate depending on the period and the amount of deposit. Demand deposits constituted 18.7%, 19.8% and 18.5% of our total deposits as of December 31, 2020, 2021 and 2022, respectively. Demand deposits paid average interest of 0.33%, 0.32% and 0.47% in 2020, 2021 and 2022, respectively. |
| |
• |
|
Time and savings deposits. Time deposits generally require the customer to maintain a deposit for a fixed term during which the deposit accrues interest at a fixed rate or a variable rate based on certain financial indexes, including the “cost of funds index,” or COFIX, published by the Korean Federation of Banks. If the deposit is withdrawn prior to the end of the fixed term, the customer is paid a lower interest rate than that originally offered. The term typically ranges from one month to five years. Time deposits constituted 47.8%, 43.8% and 51.4% of our total deposits as of December 31, 2020, 2021 and 2022, respectively, and paid average interest of 1.46%, 1.05% and 2.04% in 2020, 2021 and 2022, respectively. Savings deposits allow the customer to deposit and withdraw funds at any time and accrue interest at an adjustable interest rate, which is typically lower than the rate applicable to time or installment deposits. Savings deposits constituted 31.7%, 31.9% and 26.2% of our total deposits as of December 31, 2020, 2021 and 2022, respectively, and paid average interest of 0.32%, 0.23% and 0.40% in 2020, 2021 and 2022, respectively. |
| |
• |
|
Other deposits. Other deposits consist mainly of certificates of deposit. Certificates of deposit typically have maturities from 30 days to two years. Interest rates on certificates of deposit are determined based on the length of the deposit and prevailing market interest rates. Certificates of deposit are sold at a discount to their face value, reflecting the interest payable on the certificates of deposit. Certificates of |
52
| |
deposit constituted 1.8%, 4.5% and 3.9% of our total deposits as of December 31, 2020, 2021 and 2022, respectively and paid average interest of 1.42%, 0.91% and 1.97% in 2020, 2021 and 2022, respectively. |
We also offer deposits which provide the customer with preferential rights to housing subscriptions under the Housing Law and Rules on Housing Supply (the “Housing Law”), and eligibility for mortgage and home equity loans. As a result of an amendment to the Housing Law in June 2015, new subscriptions to housing subscription savings accounts, housing subscription time deposits accounts and housing subscription installment savings accounts became no longer available after September 1, 2015. Instead, general housing subscription savings accounts (which combine all of the functions of the aforementioned three accounts) presently remain available to all. The contribution period is from the subscription date to the date on which the account holder is selected as the purchaser of a house, and the required monthly contribution amount is from a minimum of W20,000 to a maximum of W500,000. The interests accrued on general housing subscription savings accounts are paid in lump sum upon termination of the account, and such interests shall be calculated at the interest rate determined and announced by the Ministry of Land, Infrastructure and Transport. Those who have a general housing subscription savings account and meet certain other criteria are granted a preferential subscription right for the purchase of a house. In the case of privately funded houses, the aggregate amount of contributions made to the account must be at least the applicable deposit threshold amount for the location and area of the relevant house (from W2 million up to W15 million). It is impossible to change the account holder name of a general housing subscription savings account except in the case of inheritance by the death of the original account holder. For information on our deposits in Korean Won based on the principal types of deposit products we offer, see “— Description of Assets and Liabilities — Funding — Deposits.”
The rate of interest payable on our deposit products may vary significantly, depending on average funding costs, the rate of return on our interest-earning assets, prevailing market interest rates among financial institutions and other major financial indicators.
We also offer court deposit services for litigants in Korean courts, which involve providing effectively an escrow service for litigants involved in certain types of legal or other proceedings. Chohung Bank historically was a dominant provider of such services since 1958, and following the acquisition of Chohung Bank, we continue to hold a dominant market share in these services. Such deposits typically carry interest rates lower than the market rates (by approximately 0.5% per annum) and amounted to W6,816 billion, W7,610 billion and W7,308 billion as of December 31, 2020, 2021 and 2022, respectively.
The Monetary Policy Committee of the Bank of Korea imposes a reserve requirement on Won currency deposits at commercial banks at rates ranging from 0% to 7%, based generally on maturity and the type of deposit instrument. See “— Supervision and Regulation — Principal Regulations Applicable to Banks — Liquidity.”
The Depositor Protection Act provides for a deposit insurance system under which the Korea Deposit Insurance Corporation guarantees repayment of eligible bank deposits to depositors up to W50 million per depositor and W50 million per insured under the defined contribution retirement pension per bank. See “— Supervision and Regulation — Principal Regulations Applicable to Banks — Deposit Insurance System.”
Retail Banking Services
Overview
We provide retail banking services primarily through Shinhan Bank, and, to a significantly lesser extent, through Jeju Bank, a regional commercial bank. Our retail loans, before allowance for credit losses on loans and deferred loan origination costs and fees and excluding credit card receivables, amounted to W160,417 billion as of December 31, 2022.
53
Retail banking services include mortgage and home equity lending and retail lending as well as demand, savings and fixed deposit-taking, checking account services, electronic banking and automatic teller machines (“ATM”) services, bill paying services, payroll and check-cashing services, currency exchange and wire fund transfer. We believe that providing modern and efficient retail banking services is important to maintaining our public profile and as a source of fee-based income. Accordingly, we believe that our retail banking services and products will become increasingly important in the coming years as the domestic banking sector further develops and becomes more complex.
Retail banking has been and will continue to remain one of our core businesses. Our strategy in retail banking is to provide prompt and comprehensive services to retail customers through increased automation and improved customer service, as well as a streamlined branch network focused on sales. The retail segment places an emphasis on targeting high net-worth individuals.
Retail Lending Activities
We offer various retail loan products, consisting principally of loans to individuals and households. Our retail loan products target different segments of the population with features tailored to each segment’s financial profile and other characteristics, including customer’s occupation, age, loan purpose, collateral requirements and the duration of the customer’s relationship with Shinhan Bank. Our retail loans consist principally of the following:
| |
• |
|
Mortgage and home equity loans, which are mostly comprised of mortgage loans that are used to finance home purchases and are generally secured by the housing unit being purchased; and |
| |
• |
|
Other retail loans, which are loans made to customers for any purpose other than mortgage and home equity loans and the terms of which vary based primarily upon the characteristics of the borrower and which are either unsecured or secured, or guaranteed by deposits or by a third party. Other retail loans also include advance loans extended on an unsecured basis to retail borrowers the use of proceeds for which is restricted to financing of home purchases prior to the completion of the construction. |
As of December 31, 2022, our mortgage and home equity loans and other retail loans accounted for 50.9% and 49.1% of our total retail loans, respectively.
For secured loans, our policy is to lend up to 40% to 100% of the appraisal value of the collateral, after taking into account the value of any lien or other security interest that has priority over our security interest (other than petty claims). For mortgage and home equity loans, our general policy is to lend up to 40% to 85% of the appraisal value of the collateral, but subject to the maximum loan-to-value ratio, debt-to-income ratio and debt service ratio requirements for mortgage loans implemented by the Government. The loan-to-value ratio of secured loans, including mortgage and home equity loans, is updated on a monthly basis using the most recent appraisal value of the collateral, and maximum loan-to-value ratios are further adjusted based on factors such as the location of the secured property, nature and purpose of the loans and level of competition in the market. Since January 11, 2019, maximum loan-to-value ratios are determined and may be adjusted in increments of 1% (as opposed to increments of 5%, which was the case prior to January 11, 2019), allowing us to set more precise and tailored maximum loan-to-value ratios for secured loans. As of December 31, 2022, the loan-to-value ratio of mortgage and home equity loans of Shinhan Bank was 41.70%. As of December 31, 2022, substantially all of its mortgage and home equity loans were secured by residential property.
Under the Regulation on the Supervision of the Banking Business and the Detailed Regulation on the Supervision of the Banking Business, our banking subsidiaries were subject to, when extending mortgage and home equity loans, the maximum loan-to-value ratio of 70% (irrespective of the location of the property, subject to certain exceptions) and the maximum debt-to-income ratio of 60% (only in respect of housing units located in the greater Seoul metropolitan area, subject to certain exceptions).
54
On January 31, 2018, the existing debt-to-income requirement was replaced by the modified debt-to-income ratio requirement, which reflects (i) both principal and interest payments on the applicable mortgage and home equity loan and existing mortgage and home equity loans and (ii) interest payments on other loans. The previous debt-to-income requirement had only reflected (i) both principal and interest payments on the applicable mortgage and home equity loan and (ii) interest payments on existing mortgage and home equity loans.
The regulations on mortgage and home equity loans are susceptible to the changes of housing market cycles and have been revised from time to time. From 2017 to 2022, the Government led by President Moon Jae-in announced and implemented a series of robust polices aimed at taming speculation and deterring the rise of housing prices. However, since the second half of 2022, the Government led by President Yoon Suk Yeol has announced and implemented a series of policies to ease the demand-side regulations in the real estate market in order to prevent housing prices from crashing due to the recent hike in interest rates. For example, the Government has released most areas from “speculative areas”, “overheated speculative areas” and “adjustment targeted areas” (collectively, the “regulated areas”) where tighter loan-to-value ratios and debt-to-income ratios are applicable to mortgage or home equity loans, with only Gangnam-Gu, Seocho-Gu, Songpa-Gu and Yongsan-Gu in the greater Seoul metropolitan area currently remaining as the regulated areas, removed the application of stricter loan-to-value ratio to new loans secured by high-price houses located in the regulated areas and allowed the extension of new loans secured by houses located in the regulated areas to households that already own one or more houses.
The Government also increased the loan-to-value ratio applicable to the regulated areas (i) up to 50% of the appraised value of the houses, except that such maximum loan-to-value ratio is 70% for low-income households that (1) have a combined (in case of married couple) annual income of no more than W90 million, (2) do not currently own any housing and (3) are using the loan to purchase low-price housing valued at W900 million or less (W800 million or less in case of houses located in “adjustment targeted areas”) and (ii) up to 80% of the appraised value of the houses, for new loans to a first-time home buyer with a maximum residential mortgage loan amount of W600 million or less. The regulations on the debt-to-income ratio remained largely unchanged, with the debt-to-income ratio applicable to houses being (i) 60% for those that are located in the greater Seoul metropolitan area but excluding the regulated areas, (ii) 50% for those that are located in “adjustment targeted areas” and (iii) 40% for those that are located in “speculative areas” or “overheated speculative areas”. However, such debt-to-income ratios for houses located in regulated areas are adjusted to 60% for (i) low-income households that (1) have a combined (in case of married couple) annual income of no more than W90 million, (2) do not currently own any housing and (3) are using the loan to purchase low-price housing valued at W900 million or less (W800 million or less in case of houses located in “adjustment targeted areas”) and (ii) first-time homebuyers.
The Financial Services Commission also introduced a debt service ratio and a modified debt-to-income ratio in order to modernize credit review methods and stabilize the management of household debt. The modified debt-to-income ratio, which has been implemented beginning January 31, 2018 reflects (i) both principal and interest payments on the applicable mortgage and home equity loan and existing mortgage and home equity loans and (ii) interest payments on other loans. Previously, debt-to-income ratio had only reflected (i) both principal and interest payments on the applicable mortgage and home equity loan and (ii) interest payments on existing mortgage and home equity loans. Debt service ratios reflect principal and interest payments on both the applicable loan and other loans and have been fully implemented since October 2018. The modified debt-to-income ratios are used as the primary reference index in the evaluation and approval process for mortgage and home equity loans, and debt service ratios are generally used as a supplementary reference index providing additional limits on mortgage and home equity loans. For example, debt service ratios applicable to a loan applicant with a total aggregate loan amount exceeding W100 million (including the applied but not yet extended loan amount) should not exceed 40% unless otherwise specified by the applicable regulations.
In addition, the supervising authorities in Korea from time to time issue administrative instructions to Korean banks, which have the effect of regulating the access of borrowers to housing loans and, as such, demand
55
for real estate properties. For example, the Financial Supervisory Service issued administrative instructions to financial institutions to (except in limited circumstances) verify the borrower’s ability to repay based on proof of income prior to making a mortgage and home equity loan regardless of the type or value of the collateral or the location of the property, which has had the effect of practically barring the grant of any new mortgage and home equity loans to borrowers without verifiable income.
Our banking subsidiaries extend mortgage and home equity loans in compliance with the applicable regulations and administrative instructions by the relevant supervising authorities.
The following table sets forth a breakdown of our retail loans.
|
|
|
|
|
|
|
|
|
|
|
|
|
| |
|
As of December 31, |
|
| |
|
2020 |
|
|
2021 |
|
|
2022 |
|
| |
|
|
|
|
|
|
|
|
|
| |
|
(In billions of Won, except percentages) |
|
| Retail loans(1) |
|
|
|
|
|
|
|
|
|
|
|
|
| Mortgage and home equity loans |
|
W |
73,188 |
|
|
W |
79,860 |
|
|
W |
81,724 |
|
| Other retail loans |
|
|
73,602 |
|
|
|
79,146 |
|
|
|
78,693 |
|
| Percentage of retail loans to total gross loans |
|
|
40.7 |
% |
|
|
40.4 |
% |
|
|
38.4 |
% |
Note:
| (1) |
Before allowance for credit losses on loans and deferred loan origination costs and fees and excludes credit card receivables. |
The total mortgage and home equity loans amounted to W81,724 billion as of December 31, 2022, and as of such date, consisted of amortizing loans (whose principal is repaid by part of the installment payments) in the amount of W50,046 billion and non-amortizing loans in the amount of W31,678 billion. In addition, as of December 31, 2022, we also provided lines of credit in the aggregate outstanding amount of W737 billion for non-amortizing loans.
Pricing
The interest rates payable on Shinhan Bank’s retail loans are either periodically adjusted floating rates (based on a base rate determined for three-month, six-month or twelve-month periods derived using an internal transfer price system, which reflects the market cost of funding, as adjusted to account for expenses related to lending and the profit margin of the relevant loan products) or fixed rates that reflect the market cost of funding, as adjusted to account for expenses related to lending and the profit margin. Fixed rate loans are offered only on a limited basis and at a premium to floating rate loans. For unsecured loans, which Shinhan Bank provides on a floating or fixed rate basis, interest rates thereon reflect a margin based on, among other things, the borrower’s credit score as determined during its loan approval process. For secured loans, the credit limit is based on the type of collateral, priority with respect to the collateral and the loan-to-value ratio. Shinhan Bank may adjust the pricing of these loans to reflect the borrower’s current and/or expected future contribution to Shinhan Bank’s profitability. The interest rate on Shinhan Bank’s loan products may become adjusted at the time the loan is extended. If a loan is repaid within three years following the date of the loan, the borrower is required to pay an early repayment fee, which is typically 0.7% to 1.4%, depending on types of loans and applicable interest rates, of the outstanding principal amount of and accrued and unpaid interest on the loan, multiplied by a fraction the numerator of which is the number of the remaining days on the loan until maturity and the denominator of which is the number of days comprising the term of the loan or three years, whichever is greater.
As of December 31, 2022, Shinhan Bank’s three-month, six-month and twelve-month base rates were 3.98%, 4.36% and 4.36%, respectively. As of December 31, 2022, Shinhan Bank’s fixed rates for mortgage and home equity loans with a maturity of five years was 5.39%. Shinhan Bank’s fixed rates for other retail loans with a maturity of one year ranged from 5.16% to 14.00%, depending on the credit scores of its customers. As of
56
December 31, 2022, 93.3% of Shinhan Bank’s total retail loans were floating rate loans and 6.7% were fixed rate loans. As of the same date, 94.1% of Shinhan Bank’s retail loans with maturity of more than one year were floating rate loans and 5.9% were fixed rate loans.
The interest rate charged to customers by our banking subsidiaries is based, in part, on the “cost of funds index”, or COFIX, which is published by the Korean Federation of Banks. COFIX is computed based on the weighted average interest of select funding products (including time deposits, housing and other installment savings deposits, repos, discounted bills and senior non-convertible financial debentures) of eight major Korean banks (comprised of Shinhan Bank, Kookmin Bank, Woori Bank, KEB Hana Bank, Nonghyup Bank, Industrial Bank of Korea, Citibank Korea Inc. and Standard Chartered Bank Korea Limited). Each bank then independently determines the interest rate applicable to its respective customers by adding a spread to the COFIX based on the difference between the COFIX and such bank’s general funding costs, administration fees, the customer’s credit score, the maturity of the loan and other customer-specific premiums and discounts based on the customer relationship with such bank. These interest rates are typically adjusted on a monthly basis. In January 2019, the Financial Services Commission announced plans to reflect rates for short term deposits such as demand deposits when computing the “cost of funds index,” or COFIX, which is expected to result in lower interest rates for household loans compared to the previous COFIX rate.
Private Banking
Historically, we have focused on customers with high net-worth. Our retail banking services include providing private banking services to high net-worth customers who seek personal advice in complex financial matters. Our aim in private banking is to help enhance wealth accumulation by, and increase the financial sophistication of, our high net-worth clients by offering them customized wealth management solutions and comprehensive financial services including asset portfolio and fund management, tax consulting, real estate management and family office services, among others. Since the end of 2011, in order to preemptively respond to evolving customer needs and promote asset growth by inducing greater synergy between commercial banking and investment advisory services offered by Shinhan Securities, Shinhan Bank launched private wealth management centers which combine certain branches of Shinhan Bank with those of Shinhan Securities located in the same area. Shinhan Bank’s strength in private banking has been widely recognized by a number of significant industry awards in recent years, including the grand prize at the Premium Brand Index by Korean Standards Association, Chosun Ilbo and Ministry of Trade, Industry and Energy (awarded 15 consecutive years), the Korea Prestige Brand Award by the Korea Economic Daily (awarded seven consecutive years), the Star Brand Award by Maekyung Media Group (awarded six consecutive years) and National Brand Award by Chosun Ilbo (awarded five consecutive years) in 2022.
As of December 31, 2022, Shinhan Bank operated 25 private wealth management service centers nationwide, including 17 in Seoul, 3 in Gyeonggi province and 5 in cities located in other regions in Korea. As of December 31, 2022, Shinhan Bank had approximately 19,462 private banking customers, who typically are required to have W500 million or more in deposits with Shinhan Bank to qualify for its private banking services.
Corporate Banking Services
Overview
We provide corporate banking services, primarily through Shinhan Bank, to small- and medium-sized enterprises, including enterprises known as SOHO (standing for “small office, home office”), which are small enterprises operated by individuals or households, and, to a lesser extent, to large corporations, including corporations that are affiliated with chaebols. We also lend to government-controlled enterprises.
57
The following table sets forth the balances and percentage of our total loans (before allowance for credit losses on loans and deferred loan origination costs and fees) attributable to each category of our corporate lending business as of the dates indicated.
|
|
|
|
|
|
|
|
|
|
|
|
|
|
|
|
|
|
|
|
|
|
|
|
|
| |
|
As of December 31, |
|
| |
|
2020 |
|
|
2021 |
|
|
2022 |
|
| |
|
|
|
|
|
|
|
|
|
|
|
|
|
|
|
|
|
|
| |
|
(In billions of Won, except percentages) |
|
| Small- and medium-sized enterprises loans(1) |
|
W |
108,016 |
|
|
|
29.9 |
% |
|
W |
121,961 |
|
|
|
31.0 |
% |
|
W |
131,304 |
|
|
|
31.4 |
% |
| Large corporate loans |
|
|
35,289 |
|
|
|
9.8 |
|
|
|
40,368 |
|
|
|
10.3 |
|
|
|
49,368 |
|
|
|
11.8 |
|
| Others(2) |
|
|
46,950 |
|
|
|
13.0 |
|
|
|
46,139 |
|
|
|
11.7 |
|
|
|
48,278 |
|
|
|
11.6 |
|
|
|
|
|
|
|
|
|
|
|
|
|
|
|
|
|
|
|
|
|
|
|
|
|
|
| Total corporate loans |
|
W |
190,255 |
|
|
|
52.7 |
% |
|
W |
208,468 |
|
|
|
53.0 |
% |
|
W |
228,950 |
|
|
|
54.8 |
% |
|
|
|
|
|
|
|
|
|
|
|
|
|
|
|
|
|
|
|
|
|
|
|
|
|
Notes:
| (1) |
Represents the principal amount of loans extended to corporations meeting the definition of small- and medium-sized enterprises under the Basic Act on Small- and Medium-sized Enterprises and its Presidential Decree. |
| (2) |
Includes loans to governmental agencies, loans to banks and other corporate loans, including loans originated by subsidiaries other than Shinhan Bank which are classified as corporate loans for purposes of financial reporting. |
Small- and Medium-sized Enterprises Banking
Under the Basic Act on Small- and Medium-sized Enterprises (the “SME Basic Act”) and the related Presidential Decree, as amended and effective from November 15, 2022, in order to qualify as a small- and medium-sized enterprise, (i) the enterprise’s total assets at the end of the immediately preceding fiscal year must be less than W500 billion, (ii) the enterprise must meet the standards prescribed by the Presidential Decree in relation to the average and total annual sales revenues applicable to the type of its main business, and (iii) the enterprise must meet the standards of management independence from ownership as prescribed by the Presidential Decree, including non-membership in a conglomerate as defined in the Monopoly Regulation and Fair Trade Act. An enterprise shall not qualify as a small- or medium-sized enterprise if it is incorporated into, or is deemed to be incorporated into a business group subject to disclosure under the Monopoly Regulation and Fair Trade Act. Non-profit enterprises that satisfy certain requirements prescribed in the SME Basic Act and its Presidential Decree may qualify as a small- and medium-sized enterprise. Furthermore, cooperatives and federations of cooperatives as prescribed by the Presidential Decree are deemed as small- and medium-sized enterprises, effective from April 15, 2014. As of December 31, 2022, we made loans to 499,616 small- and medium-sized enterprises for an aggregate amount of W131,304 billion (before allowance for credit losses on loans and deferred loan origination costs and fees).
We believe that Shinhan Bank, whose traditional focus has been on small- and medium-sized enterprises lending, is well-positioned to succeed in the small- and medium-sized enterprises market in light of its marketing capabilities (which we believe have provided Shinhan Bank with significant customer loyalty) and its prudent risk management practices, including conservative credit rating systems for credit approval. To maintain or increase its market share of small- and medium-sized enterprises lending, Shinhan Bank:
| |
• |
|
has accumulated a market-leading expertise and familiarity as to customers and products. We believe Shinhan Bank has an in-depth understanding of the credit risks embedded in this market segment, allowing Shinhan Bank to develop loan and other products specifically tailored to the needs of this market segment; |
| |
• |
|
operates a relationship management system to provide customer services that are tailored to small- and medium-sized enterprises. Shinhan Bank currently has relationship management teams in 185 banking branches, of which 53 are corporate banking branches and 132 are hybrid banking branches |
58
| |
designed to serve both retail customers and, to a limited extent, corporate customers. These relationship management teams market products, and review and approve smaller loans with less credit risks; and |
| |
• |
|
continues to focus on cross-selling loan products with other products. For example, when Shinhan Bank lends to small- and medium-sized enterprises, it also explores opportunities to cross-sell retail loans or deposit products to the employees of these enterprises or to provide financial advisory services. |
Large Corporate Banking
Large corporate customers consist primarily of member companies of chaebols and financial institutions. Our large corporate loans amounted to W49,368 billion (before allowance for credit losses on loans and deferred loan origination costs and fees) as of December 31, 2022. Large corporate customers tend to have better credit profiles than small- and medium-sized enterprises, and accordingly, Shinhan Bank has expanded its focus on these customers as part of its risk management policy.
Shinhan Bank aims to be a one-stop financial solution provider that also partners with its corporate clients in their corporate expansion and growth endeavors. To that end, Shinhan Bank provides a wide range of corporate banking services, including investment banking, real estate financing, overseas real estate project financing, large development project financing, infrastructure financing, structured financing, equity investments/venture investments, mergers and acquisitions consulting, securitization and derivatives services, including securities and derivative products and foreign exchange trading. Shinhan Bank, through its Hong Kong branch, also arranges financing for, and offers consulting services to, Korean companies expanding their business overseas, particularly in Asia.
Digital Corporate Banking
Shinhan Bank offers corporate customers a web-based total cash management service known as “Shinhan Bizbank.” Shinhan Bizbank supports substantially all types of banking transactions ranging from basic transaction history inquiries and fund transfers to opening letters of credit, trade finance, payment management, collection management, sales settlement service, acquisition settlement service, business-to-business settlement service, sweeping, pooling, ERP interface service, host-to-host banking solutions, SWIFT SCORE service and global cash and liquidity management service. In addition, Shinhan Bank provides customers with integrated and advanced access to its financial services through its “Inside Bank” program, which combines Internet banking, capital management services and enterprise resource planning to better serve corporate customers. The Inside Bank program also seeks to provide customized financial services to meet the comprehensive needs of target corporate customers ranging from conglomerates to small enterprises in various industries, with the goal of enhancing convenience to our corporate customers in accessing our financial services as well as assisting them to strategically manage their funds. In line with Shinhan Bank’s efforts to facilitate non-face-to-face online transactions for corporate transactions, in 2018, Shinhan Bank upgraded its virtual account-based corporate fund management service, known as “Shinhan Damoa Service”, making it available on mobile channels. In addition, Shinhan Bank has made the fund transfers via phone number service (allowing customers to make fund transfers without the recipients’ account number), which was previously only available for personal banking customers, available for corporate banking customers as well. As part of Shinhan Bank’s effort to lower settlement fees for small business owners, in May 2019, Shinhan Bank launched “ZeroPay Biz Shinhan”, an account-based mobile payment service enabling vendors to easily receive payments from customers’ accounts by scanning the vendor’s QR code with a smartphone. In October 2020, Shinhan Bank upgraded the “Shinhan S Corporate Bank” platform to launch “Shinhan SOL Biz”, a non-face-to-face application for corporate clients, with the goal of improving the platform so that Shinhan Bank can offer non-face-to-face channels to corporate clients that are as convenient and user-friendly as Shinhan Bank’s online retail banking platforms. In August 2021, Shinhan Bank launched a non-face-to-face name verification for corporate banking customers via smartphone using Shinhan SOL Biz, enabling corporate customers to open new bank accounts without visiting a branch.
59
Corporate Lending Activities
Our principal loan products for corporate customers are working capital loans and facilities loans. Working capital loans, which include discounted notes and trade financing, are generally loans used for general working capital purposes. Facilities loans are provided to finance the purchase of equipment and construction of manufacturing plants. As of December 31, 2022, working capital loans and facilities loans amounted to W72,446 billion and W83,506 billion, respectively, representing 45.3% and 52.2% of our total Won-denominated corporate loans. Working capital loans generally have a maturity of one year, but may be extended on an annual basis for an aggregate term of three years in the case of unsecured loans and five or ten years in the case of secured loans. Facilities loans have a maximum maturity of 15 years, are typically repaid in semiannual installments per annum and may be entitled to a grace period not exceeding one-third of the loan term with respect to the first repayment; facilities loans with a term of three years or less may be paid in full at maturity.
Loans to corporations may be unsecured or secured by real estate, deposits or guaranty certificates. As of December 31, 2022, secured loans and guaranteed loans (including loans secured by guaranty certificates issued by credit guarantee insurance funds) accounted for 68.1% and 14.2%, respectively, of our Won-denominated loans to small- and medium-sized enterprises. As of December 31, 2022, 46.5% of the corporate loans were secured by real estate.
When evaluating whether to extend loans to corporate customers, Shinhan Bank reviews their creditworthiness, credit score, value of any collateral and/or third party guarantee. The value of collateral is computed using a formula that takes into account the appraised value of the collateral, any prior liens or other claims against the collateral and an adjustment factor based on a number of considerations including, with respect to property, the average value of any nearby property sold in a court-supervised auction during the previous year. Shinhan Bank revalues collateral when a secured loan is renewed or if a trigger event occurs with respect to the loan in question.
Pricing
Shinhan Bank determines the price for its corporate loan products based principally on their respective cost of funding and the expected loss rate based on the borrower’s credit risk. As of December 31, 2022, 69.9% of Shinhan Bank’s corporate loans with outstanding maturities of one year or more had variable interest rates as determined by the applicable market rates.
More specifically, interest rates on Shinhan Bank’s corporate loans are generally determined as follows:
Interest rate = (Shinhan Bank’s periodic market floating rate or reference rate) plus transaction cost plus credit spread plus risk premium plus or minus discretionary adjustment.
Depending on the market condition and the agreement with the borrower, Shinhan Bank may use either its periodic market floating rate or the reference rate as the base rate in determining the interest rate for the borrower. As of December 31, 2022, Shinhan Bank’s periodic market floating rates (which are based on a base rate determined for a three-month, six-month, one-year, two-year, three-year or five-year period, as applicable, as derived using Shinhan Bank’s market rate system) were 3.98% for three months, 4.36% for six months, 4.36% for one year, 4.43% for two years, 4.54% for three years and 4.67% for five years. As of the same date, Shinhan Bank’s reference rate was 4.00%. The reference rate refers to the base lending rate used by Shinhan Bank and is determined annually by Shinhan Bank’s Asset & Liability Management Committee based on, among others, Shinhan Bank’s funding costs, cost efficiency ratio and discretionary margin.
Transaction cost reflects the standardized transaction cost assigned to each loan product and other miscellaneous costs, including contributions to the Credit Guarantee Fund, and education taxes. The Credit
60
Guarantee Fund is a statutorily created entity that provides credit guarantees to loans made by commercial banks and is funded by mandatory contributions from commercial banks in the amount of approximately 0.22% of all loans (excluding certain loans such as facility loans) made by them.
The credit spread is added to the periodic floating rate to reflect the expected loss based on the borrower’s credit rating and the value of any collateral or payment guarantee. In addition, Shinhan Bank adds a risk premium which takes into account the potential of unexpected loss that may exceed the expected loss from the credit rating assigned to a particular borrower.
A discretionary adjustment rate is added or subtracted to reflect the borrower’s current and/or future contribution to Shinhan Bank’s profitability. If additional credit is provided by way of a guarantee, the adjustment rate is subtracted to reflect such change in the credit spread. In addition, depending on the price and other terms set by competing banks for similar borrowers, Shinhan Bank may reduce the interest rate to compete more effectively with other banks.
International Business
Shinhan Bank also engages in treasury and investment activities in international capital markets, principally including foreign currency-denominated securities trading, foreign exchange trading and services, trade-related financial services, international factoring services and foreign banking operations through its overseas branches and subsidiaries. Shinhan Bank aims to become a leading bank in Asia and expand its international business by focusing on further bolstering its overseas network, localizing its overseas operations and diversifying its product offerings, particularly in terms of asset management, in order to meet the various financing needs of its current and potential customers overseas.
Other Banking Services
Other banking businesses carried on by Shinhan Bank include treasury business (including internal asset and liability management and other non-deposit funding activities), trading of, and investment in, debt securities and, to a lesser extent, equity securities for its own accounts, derivative trading activities, as well as managing back-office functions.
Treasury
Shinhan Bank’s treasury division provides funds to all of Shinhan Bank’s business operations and ensures the liquidity of its operation. To secure stable long-term funds, Shinhan Bank uses fixed and floating rate notes, debentures, structured financing and other advanced funding methods. As for overseas funding, Shinhan Bank closely monitors the feasibility of raising funds in currencies other than the U.S. Dollar, such as the Japanese Yen and the Euro. In addition, Shinhan Bank makes call loans and borrows call money in the short-term money market. Call loans are short-term lending among banks and financial institutions in either Korean Won or foreign currencies with a minimum transaction amount of W100 million and maturities of typically one day.
Securities Investment and Trading
Shinhan Bank invests in and trades securities for its own accounts in order to maintain adequate sources of liquidity and to generate interest income, dividend income and capital gains. Shinhan Bank’s trading and investment portfolios consist primarily of Korean treasury securities and debt securities issued by Government agencies, local governments or certain government-invested enterprises, debt securities issued by financial institutions and equity securities listed on the KRX KOSPI Market and KRX KOSDAQ Market of the Korea Exchange. For a detailed description of our securities investment portfolio, see “— Description of Assets and Liabilities — Investment Portfolio.”
61
Derivatives Trading
Shinhan Bank provides to its customers, and to a limited extent, trades for its proprietary accounts, a broad range of derivatives products, which include:
| |
• |
|
interest rate swaps, options, and futures relating to interest rate risks; |
| |
• |
|
cross-currency swaps, largely for Korean Won against U.S. Dollars, Japanese Yen and Euros; |
| |
• |
|
equity and equity-linked options; |
| |
• |
|
foreign currency forwards, options and swaps; |
| |
• |
|
commodity forwards, swaps and options; |
| |
• |
|
credit derivatives; and |
| |
• |
|
KOSPI 200 indexed equity options. |
Shinhan Bank’s outstanding derivatives commitments in terms of notional amount were W217,006 billion, W241,415 billion and W239,620 billion in 2020, 2021 and 2022, respectively. Such derivative operations generally focus on addressing the needs of Shinhan Bank’s corporate clients to enter into derivatives contracts to hedge their risk exposure and entering into back-to-back derivatives to hedge Shinhan Bank’s risk exposure that results from such client contracts.
Shinhan Bank also enters into derivative contracts to hedge the interest rate and foreign currency risk exposures that arise from its own assets and liabilities. In addition, to a limited extent, Shinhan Bank engages in the proprietary trading of derivatives within its regulated open position limits. See “— Description of Assets and Liabilities — Derivatives.”
Trust Account Management Services
Overview
Shinhan Bank’s trust account management services involve management of trust accounts, primarily in the form of money trusts. Trust account customers are typically individuals seeking higher rates of return than those offered by bank account deposits. Because deposit reserve requirements do not apply to deposits held in trust accounts as opposed to deposits held in bank accounts, and regulations governing trust accounts tend to be less strict, Shinhan Bank is generally able to offer higher rates of return on trust account products than on bank deposit products.
Trust account products generally require higher minimum deposit amounts than those required by comparable bank account deposit products. Unlike bank deposit products, deposits in trust accounts are invested primarily in securities (consisting principally of debt securities and beneficiary certificate for real estate financing) and, to a lesser extent, in loans, as the relative shortage of funding sources require that trust accounts be invested in a higher percentage of liquid assets.
Under the Banking Act, the Financial Investment Services and Capital Markets Act and the Trust Act, assets in trust accounts are required to be segregated from other assets of the trustee bank and are unavailable to satisfy the claims of the depositors or other creditors of such bank. Accordingly, trust accounts that are not guaranteed as to principal (or as to both principal and interest) are accounted for and reported separately from the bank accounts. See “— Supervision and Regulation.” Trust accounts are regulated by the Trust Act and the Financial Investment Services and Capital Markets Act, and most national commercial banks offer similar trust account products. Shinhan Bank earns income from trust account management services, which is recorded as net trust management fees.
62
As of December 31, 2020, 2021 and 2022, Shinhan Bank had total trust assets of W96,269 billion, W92,077 billion and W95,855 billion, respectively, comprised principally of securities investments of W21,427 billion, W22,438 billion and W22,316 billion, respectively; real property investments of W12,696 billion, W10,926 billion and W9,767 billion, respectively; and loans with an aggregate principal amount of W348 billion, W396 billion and W461 billion, respectively. Securities investments consisted of corporate bonds, government-related bonds and other securities, primarily commercial paper. As of December 31, 2020, 2021 and 2022, debt securities accounted for 21.7%, 23.8% and 22.8%, respectively, and equity securities constituted 0.6%, 0.6% and 0.5%, respectively, of Shinhan Bank’s total trust assets. Loans made by trust accounts are similar in type to those made by bank accounts, except that they are made only in Korean Won. As of December 31, 2020, 2021 and 2022, 72.2%, 76.0% and 83.4%, respectively, of the amount of loans from the trust accounts were collateralized or guaranteed. In making investment from funds received for each trust account, each trust product maintains investment guidelines applicable to each such product which set forth, among other things, company-, industry- and security-specific limitations.
Trust Products
In Korea, trust products typically take the form of money trusts, which are discretionary trusts over which (except in the case of a specified money trust) the trustees have investment discretion subject to applicable law and is commingled and managed jointly for each type of trust account. The specified money trusts are established on behalf of customers who give specific directions as to how their trust assets should be invested.
Money trusts managed by Shinhan Bank’s trust account business amounted to W51,998 billion, W53,763 billion and W61,110 billion as of December 31, 2020, 2021 and 2022, respectively.
Shinhan Bank offers variable rate trust products through its retail branch network. As of December 31, 2020, 2021 and 2022, Shinhan Bank’s variable rate trust accounts amounted to W47,930 billion, W49,831 billion and W57,590 billion, respectively, of which principal guaranteed variable rate trust accounts amounted to W4,067 billion, W3,931 billion and W3,519 billion, respectively. Variable rate trust accounts offer their holders variable rates of return on the principal amount of the deposits in the trust accounts and do not offer a guaranteed return on the principal of deposits, except in the limited cases of principal guaranteed variable rate trust accounts, for which payment of the principal amount is guaranteed. Shinhan Bank charges a lump sum or a fixed percentage of the assets held in such trusts as a management fee, and, depending on the trust products, is also entitled to additional fees in the event of early termination of the trusts by the customer. Korean banks, including Shinhan Bank, are currently allowed to guarantee the principal of the following types of variable rate trust account products: (i) existing individual pension trusts, (ii) new individual pension trusts, (iii) existing retirement pension trusts, (iv) new retirement pension trusts, (v) pension trusts and (vi) employee retirement benefit trusts. Shinhan Bank also offers an insignificant amount of guaranteed fixed rate trust products (amounting to W1.0 billion, W1.0 billion and W1.0 billion as of December 31, 2020, 2021 and 2022, respectively), which provide to its holders a guaranteed return of the principal as well as a guaranteed fixed rate of return. These products are carry-overs from past offerings, and Shinhan Bank no longer offers guaranteed fixed rate trust products.
Credit Card Services
Products and Services
We currently provide our credit card services principally through our credit card subsidiary, Shinhan Card, and to a limited extent, Jeju Bank.
Shinhan Card offers a wide range of credit card and other services, principally consisting of the following:
| |
• |
|
credit card services, which involve providing cardholders with credit up to a preset limit to purchase products and services. Repayment for credit card purchases may be made either (i) on a lump-sum |
63
| |
basis, namely, in full at the end of a monthly billing cycle or (ii) on a revolving basis subject to a minimum monthly payment. The minimum monthly payment for holders of credit cards issued before December 30, 2014 is the greater of (x) 5% to 20% of the amount outstanding (depending on the cardholder’s credit) or (y) W30,000. The minimum monthly payment for holders of credit cards issued on or after December 30, 2014 is the greater of (x) 10% to 20% of the amount outstanding (depending on the cardholder’s credit) or (y) W50,000. Currently, the outstanding credit card balance subject to the revolving basis payments generally accrues interest at the effective annual rates of approximately 5.4% to 19.9%. |
| |
• |
|
cash advances, which enable the cardholders to withdraw cash subject to a preset limit from an ATM or a bank branch. Repayments for cash advances may be made either on a lump-sum basis or, in the case of credit cards issued before December 30, 2014, on a revolving basis. Currently, the lump-sum cash advances generally accrue interest at the effective annual rates of approximately 5.5% to 19.9% and the revolving cash advances generally accrue interest at a minimum rate of 6.4% to 19.9% of the outstanding balance (depending on the cardholder’s credit). |
| |
• |
|
installment purchases, which provide customers with an option to purchase products and services from select merchants on an installment basis for which repayments must be made in equal amounts over a fixed term generally ranging from two to 24 months, and for certain limited types of cards, up to 36 months. Currently, the outstanding installment purchase balances generally accrue interest at the effective annual rates of approximately 9.5% to 19.9%. |
| |
• |
|
card loans, which enable cardholders to receive, up to a preset limit, a loan which is generally unsecured. Repayment of card loans is made generally by (i) repaying principal and interest in equal amounts on an installment basis over a fixed term of two to 36 months, (ii) repaying the principal and interest amounts in full at maturity, or (iii) making interest-only payments during the initial grace period of either three months or six months and repaying the principal and interest amounts on a monthly installment basis over the remaining period of typically two to 36 months. Currently, the outstanding card loan balances generally accrue interest at the effective annual rates of approximately 5.36% to 23.9%. Delinquent credit card receivables can also be restructured into loans, which we classify as card loans, and these loans generally accrue interest at the effective annual rates of approximately 11.9% to 19.5% over a fixed term whose maximum is 72 months. |
Shinhan Card derives revenues from annual membership fees paid by credit cardholders, interest charged on credit card balances, fees and interest charged on cash advances and card loans, interest charged on late and deferred payments and merchant fees paid by retail and service establishments. Merchant fees and interest on cash advances constitute the largest source of revenue.
The annual membership fees for credit cards vary depending on the type of credit card and the benefits offered thereunder. For standard credit cards and most of the affinity and co-branded cards, Shinhan Card charges an annual membership fee ranging from W1,000 to W2,000,000 per credit card, depending on the type of the card and the cardholder profile. Certain government affinity cards have no annual membership fee. If Shinhan Card’s customers make cash advances using ATMs of a financial institution other than Shinhan Card, Shinhan Card also charges a usage fee for such cash advances in an amount equivalent to the fees charged by such financial institution for the use of its ATM plus costs to cover Shinhan Card’s related administration expenses.
Any accounts that are unpaid when due are deemed to be delinquent accounts, for which Shinhan Card levies a late charge in lieu of the interest rates applicable prior to default. The late charge rate currently ranges from 7.3% to 20.0% per annum. Since the first half of 2018, instead of levying a late charge in lieu of interest rates prior to default, Shinhan Card maintained the interest rates prior to default but added a late charge rate of 3% in addition to the interest rates prior to default.
Merchant discount fees, which are processing fees Shinhan Card charges to merchants, can be up to the regulatory limit of 2.3% of the purchased amount depending on the merchant used, with the average charge for
64
credit cards being 1.43% in 2022. For small- and medium-sized merchants, the applicable regulations impose reduced fee rates of 0.8% (in the case of merchants with annual sales of W300 million or less) and 1.3% (in the case of merchants with annual sales of more than W300 million and up to W500 million), respectively, of the purchased amount.
Although making payments on a revolving basis is more common in many other countries, this payment method is still in its early stages of development in Korea. Cardholders in Korea are generally required to repay their purchases within approximately 14 to 44 days of purchase depending on their payment cycle, except in the case of installment purchases where the repayment term is typically three to six months. Accounts that remain unpaid after this period are deemed to be delinquent, and Shinhan Card levies late charges on and closely monitors such accounts. For purchases made on an installment basis, Shinhan Card charges interest on unpaid amounts at rates that vary according to the terms of repayment.
Cardholders are required to settle their outstanding balances in accordance with the terms of the credit cards they hold. Cardholders are required to select the monthly settlement date when they open the credit card account and may subsequently change the settlement date but no more than once every 60 days. Settlement dates at or around the end of each month are the most popular since salaries are typically paid at the end of the month.
In addition to credit card services, Shinhan Card also offers check cards, which are similar to debit cards in the United States and many other countries, to retail and corporate customers. A check card can be used at any of the merchants that accept credit cards issued by Shinhan Card and the amount charged to a check card is directly debited from the cardholder’s designated bank account. Check cards have a low risk of default and involve minimal funding costs. Although Shinhan Card does not charge annual membership fees on the majority of check cards, merchants are charged fees on the amount purchased using check cards at a rate between 0.50% and 2.50%, depending on the type of business, which is lower than the corresponding fee charged for credit card use.
Recently, the Financial Services Commission has allowed certain financial institutions, including Shinhan Card, to test innovative financial services. Shinhan Card obtained approval from the Financial Services Commission to test nine business: (i) peer-to-peer credit card remittance services whereby individuals can send money to others directly using credit cards, (ii) a credit scoring system that evaluates individual business owners’ credit standing based on their revenue records and history of credit card use, (iii) small-scale investment using credit cards, (iv) face recognition payments, (v) house rent payments using credit cards, (vi) rental brokerage platforms, (vii) overseas remittance using credit cards, (viii) quick payment to small merchants using credit card reward points and (ix) family cards for underage children. As of December 31, 2022, six businesses have been successfully commercialized, and we expect to launch the remaining three services in the foreseeable future.
Credit Card Products
Shinhan Card offers a wide range of credit card products tailored for credit cardholders’ lives and to satisfy their preferences and needs. Credit card products offered by Shinhan Card include:
| |
• |
|
cards that provide additional benefits such as frequent flyer miles and reward program points that can be redeemed by the customer for complementary services, prices or cash; |
| |
• |
|
platinum cards and other preferred membership cards, which have higher credit limits and provide additional services in return for higher annual membership fees; |
| |
• |
|
cards with additional features to preferred customers, such as revolving credit cards, travel services and insurance; |
| |
• |
|
cards with fraud detection and security systems to prevent the misuse of credit cards and to encourage the use of credit cards over the Internet; |
| |
• |
|
corporate and affinity cards that are issued to employees or members of particular companies or organizations; and |
65
| |
• |
|
mobile phone cards allowing customers to conduct wireless credit card transactions through their mobile phones. |
Customers and Merchants
In addition to internal growth through cross-selling, we seek to enhance our market position by selectively targeting new customers with high net-worth and solid credit quality through the use of a sophisticated and market-oriented risk management system. Shinhan Card screens its credit card applicants and sets individualized credit limits for such applicants according to internal guidelines based on a comprehensive credit scoring system. We also seek to provide a wide variety of differentiated products and services tailored to our customers’ individualized needs through precision analysis and customer segmentation based on the “big data” we have compiled on our approximately 22 million customers. We have also formed a team dedicated to the “fintech” business by actively pursuing technology developments and strategic alliances with key partners as well as additional teams focused on innovation and creating new sources of value for our clients through the development of big data and digital platforms and provision of big data-based consulting services. In 2019, utilizing an innovative platform based on big data analysis, Shinhan Card launched a “Super Personalization Service”, aimed at providing our individual customers with tailored and personalized services that meet their individual needs. As Shinhan Card has obtained a license from the Financial Services Commission as a MyData service provider, Shinhan Card has been able to utilize additional external data to enhance its ability to further refine and tailor personalized services for its customers. In 2022, Shinhan Card further leveraged its existing big data capabilities by diversifying and accelerating revenue-generating businesses such as MyData-based loan brokerage, big data sales, credit bureau for small businesses, and commercial real estate analysis. In 2023, Shinhan Card plans to expand its capabilities as a platform company based on investments in big data and digital technology will seek to increase profitability by expanding and connecting its multiple financial and non-financial platforms. Additionally, Shinhan Card plans to advance big data marketing and data as a service business, further personalizing its marketing and servicing methods based on data-driven services such as open banking, digital document management and MyData. Shinhan Card seeks to optimize data processing to align its internal services, systems, processes, and channels and use such data by utilizing artificial intelligence, machine learning and robotic process automation throughout the financial services it provides in order to enhance customer experience.
The following table sets forth the number of customers of Shinhan Card and the number of merchants at which Shinhan Card can be used for purchases as of the dates indicated.
|
|
|
|
|
|
|
|
|
|
|
|
|
| |
|
As of December 31, |
|
| |
|
2020 |
|
|
2021 |
|
|
2022 |
|
| |
|
|
|
|
|
|
|
|
|
| |
|
(In thousands, except percentages) |
|
| Shinhan Card: |
|
|
|
|
|
|
|
|
|
|
|
|
| Number of credit card holders(1) |
|
|
13,056 |
|
|
|
13,283 |
|
|
|
13,316 |
|
| Personal accounts |
|
|
12,861 |
|
|
|
13,091 |
|
|
|
13,140 |
|
| Corporate accounts |
|
|
195 |
|
|
|
192 |
|
|
|
176 |
|
| Active ratio(2) |
|
|
95.86 |
% |
|
|
96.62 |
% |
|
|
96.61 |
% |
| Number of merchants |
|
|
2,741 |
|
|
|
2,894 |
|
|
|
3,032 |
|
Notes:
| (1) |
Represents the number of cardholders whose card use is not subject to suspension or termination as of the relevant date. |
| (2) |
Represents the ratio of accounts used at least once within the last six months to the total accounts as of year-end. |
66
Installment Finance
Shinhan Card provides installment finance services to customers to facilitate purchases of durable consumer goods such as new and used cars, appliances, computers and other home electronics products. Revenues from installment finance operations accounted for 3.87% of Shinhan Card’s total operating revenue in 2022. Shinhan Card pays the merchants when Shinhan Card’s customers purchase such goods, and the customers remit monthly installment payments to Shinhan Card over a number of months, generally up to 36 months (and, in the case of installment financings for automobile purchases, up to 72 months), as agreed with the customers. For installment finance products for new cars, Shinhan Card historically charged, in addition to interest, an initial financing fee of up to 9.9% of the purchase price, depending on the customer’s credit score, the installment period and installment amount. Initial financing fees charged in connection with installment finance products for new cars, however, were abolished effective March 2, 2013 pursuant to the Financial Consumer Report (Automobile Financings) issued by the Financial Supervisory Service on January 29, 2013. Shinhan Card has installment financing arrangements with over 42,000 merchants in Korea, including major car dealers, manufacturers and large retailers with nationwide networks, such as electronics goods stores.
Shinhan Card promptly processes installment financing applications and, based on the extensive credit information it possesses or can access, it is able to offer flexible installment payment terms tailored to individual needs of the customers. Shinhan Card also devotes significant efforts to developing and maintaining its relationships with merchants, which are the most important source of referrals for installment finance customers. Shinhan Card makes prompt payments to merchants for goods purchased by the installment finance customers.
Auto Lease
Shinhan Card provides auto leasing financing to retail customers and corporations. Revenues from auto lease operations accounted for 6.64%, 9.19% and 10.83% of Shinhan Card’s total operating revenue in 2020, 2021 and 2022, respectively.
Securities Brokerage Services
Overview
Through Shinhan Securities, we provide a wide range of financial investment services to our diversified customer base including corporations, institutional investors, governments and individuals. Financial investment services offered by Shinhan Securities range from securities brokerage services, investment advice and financial planning services, and investment banking services such as underwriting and mergers and acquisitions advisory services. Subject to market conditions, Shinhan Securities also engages in equity- and stock index-linked derivatives sales and brokerage, proprietary trading and brokerage services for futures involving interest rates, currency and commodities as well as foreign exchange margin trading.
As of December 31, 2022, according to internal data, Shinhan Securities’ annual market share of Korean equity brokerage market was 7.99% (consisting of 2.59% in the retail segment, 0.40% in the institutional segment and 5.01% in the international segment) in terms of total brokerage volume, ranking seventh among securities firms in Korea. As of the same date, according to internal data, Shinhan Securities’ annual market share of Korean options and futures brokerage market were 14.23% and 20.40%, respectively, in terms of total brokerage volume with respect to these products.
Products and Services
Shinhan Securities provides principally the following services:
| |
• |
|
retail client services. These services include equity and bond brokerage, investment advisory and financial planning services to retail customers, with a focus on high net-worth individuals. The fees |
67
| |
generated include brokerage commissions for the purchase and sale of securities, asset management fees, interest income from credit extensions (including in the form of stock subscription loans), margin transaction loans and loans secured by deposited securities. |
| |
• |
|
institutional client services: |
| |
• |
|
brokerage services. These services include brokerage of stocks, corporate bonds, futures and options provided to Shinhan Securities’ institutional and international customers and sale of institutional financial products. These services are currently supported by a team of approximately 60 research analysts that specialize in equity, bonds and derivatives research. |
| |
• |
|
investment banking services. These services include a wide array of investment banking services to Shinhan Securities’ corporate customers, such as domestic and international initial public offerings, mergers and acquisitions advisory services, bond issuances, underwriting, capital increase, asset-backed securitizations, issuance of convertible bonds and bonds with warrants, structured financing, issuance of asset-backed commercial papers and project financings involving infrastructure, real estate and shipbuilding. |
Shinhan Securities also engages, to a limited extent, in proprietary trading in equity and debt securities, derivative products and over-the-counter market products.
With respect to brokerage services, in the face of intense competition in the domestic brokerage industry, Shinhan Securities primarily focuses on strengthening profitability through service differentiation and efficient management of its distribution network rather than enlarging its market share indiscriminately through lowering fees and commissions. Shinhan Securities’ service differentiation efforts include offering its customers opportunities to purchase stocks in a wide range of countries (currently more than 29 countries), leveraging synergy opportunities afforded by affiliation with other Shinhan entities such as offering brokerage accounts maintained at Shinhan Bank and Shinhan Capital.
With respect to investment banking services, Shinhan Securities concentrates on equity capital markets, debt capital markets, project finance and mergers and acquisitions. To a limited extent, Shinhan Securities also engages in private equity investments through formation of private equity funds by soliciting investors on a private placement basis. To better serve its international customers, Shinhan Securities has established four overseas service centers in Hong Kong, New York, Vietnam and Indonesia. In July 2015, we acquired a 100% stake in Nam An Securities (subsequently launched as Shinhan Securities Vietnam Co., Ltd.), a Vietnamese securities services firm that provides investment banking and asset management services. In addition, in order to capitalize on the rapid growth opportunity and as part of its expansion efforts in Indonesia, Shinhan Securities acquired a 99% stake in PT Makinta Securities, an Indonesian investment banking firm in July 2016 and subsequently launched it as an overseas subsidiary offering investment banking and brokerage services under the name PT Shinhan Sekuritas Indonesia in December 2016. To further expand and stabilize our global businesses, we made further capital investments totaling US$62 million in December 2017 in our subsidiaries located in Hong Kong, New York, Vietnam and Indonesia. In 2018, we acquired PT Archipelago Asset Management, the first acquisition of an Indonesian asset management firm by a Korean financial group, which we believe will strengthen our business portfolio in Indonesia and enhance our competitiveness in the Asian financial markets.
Life Insurance Services
Overview
We provide life insurance products and services primarily through Shinhan Life Insurance. Shinhan Life Insurance provides services through diversified distribution channels consisting of financial planners, telemarketers, agency marketers and bancassurance specialists. Shinhan Life Insurance had total assets of W36,778 billion, W70,536 billion and W66,754 billion as of December 31, 2020, 2021 and 2022, respectively, and net profits of W178 billion, W392 billion and W464 billion for the years ended December 31, 2020, 2021
68
and 2022, respectively. Total assets and net profits of Shinhan Life Insurance in 2021 included Orange Life Insurance’s total assets and net profits after Orange Life Insurance was subsequently merged with and into Shinhan Life Insurance in July 2021.
Since the merger, Shinhan Life Insurance has focused on post-merger integration initiatives to bring together the core capabilities of Shinhan Life Insurance and Orange Life, based on a new motto of “NewLife, adding new values to life.” In 2022, Shinhan Life Insurance successfully developed an integrated IT system by combining the resources of the two companies.
Products and Services
Shinhan Life Insurance provides principally the following services:
| |
• |
|
Life insurance. Shinhan Life Insurance develops products that are marketed to customer bases in various age groups through tailored marketing strategies and in-depth analysis of customer databases, backed by support for and training of competent insurance consultants. For example, Shinhan Life Insurance has launched innovative products that offer customized underwriting and premium options. |
| |
• |
|
General agent (“GA”). Shinhan Life Insurance acquired reputable GA organizations to lay the foundation for stable growth within the GA market. |
| |
• |
|
Healthcare service. As part of the efforts to grow its non-insurance services, Shinhan Life Insurance’s healthcare services help bring in new customers by giving them access to a wide range of content based on their platform. |
To better serve its international customers, Shinhan Life Insurance established Shinhan Life Insurance Vietnam Co., Ltd. in Vietnam which began its business operations in January 2021.
In response to the implementation of IFRS 17, Shinhan Life Insurance has updated its management strategies, settlement process and internal control systems. In addition, Shinhan Life Insurance upgraded its insurance risk measurement system in anticipation of a new regulatory solvency regime for insurance companies, the Korean-Insurance Capital Standard (the “K-ICS”). See “Item 3.D. Risk Factors — Risks Related to Our Other Businesses — Prolonged periods of declining or low interest rates or changes in related accounting standards may reduce or turn negative our investment margin on savings insurance products and result in an increase in the valuation of our liabilities associated with these products.”
Non-Life Insurance Services
We provide a wide range of general insurance products through Shinhan EZ General Insurance. Shinhan EZ Insurance was established in 2003 as Daum Direct Car Insurance. On June 30, 2022, we acquired BNP Paribas Cardif General Insurance and changed its name to Shinhan EZ General Insurance. General insurance products offered by Shinhan EZ General Insurance include collateral protection insurance, motor insurance, SMART repair and extend warranty. Shinhan EZ General Insurance also intends to switch to a digital insurance business model. Shinhan EZ General Insurance aims to offer innovative insurance products suitable for collaboration with startups based on advanced digital channels, in addition to traditional insurance products, such as health, injury, travel and leisure insurance. Shinhan EZ General Insurance is seeking to pursue sustainable growth by creating new business opportunities and collaborating with various startups and our affiliates and is also planning to expand coverage within the automotive insurance market.
Specialized Credit Services
We provide leasing and equipment financing services to our corporate customers mainly through Shinhan Capital. Shinhan Capital provides customers with leasing, installment financing and new technology financing,
69
equipment leasing, and corporate credit financing. Shinhan Capital’s strength has traditionally been in leasing of ships, printing machines, automobiles and other specialty items, but it also offers other leasing and financing services, such as corporate restructuring services for financially troubled companies, project financing for real estate and infrastructure development, corporate leasing and equipment financing.
Other Services
Through our other subsidiaries, we also provide asset management, savings banking, loan collection and credit reporting, collective investment administration and financial system development services. Through Shinhan Asset Management, which merged with Shinhan Alternative Investment Management in January 2022 (in addition to Shinhan Securities), we are also engaged in alternative investments through formation of private equity funds by soliciting investors on a private placement basis.
Asset Management Services
In addition to personalized wealth management services provided as part of our private banking and securities brokerage services, we also provide asset management services through Shinhan BNP Paribas Asset Management, formerly a joint venture with BNP Paribas Asset Management Holding, of which we and BNP Paribas Asset Management Holding held 65:35 interests, respectively. On January 15, 2021, we acquired the remaining 35% interest in Shinhan BNP Paribas Asset Management and changed its legal name to Shinhan Asset Management, and hence Shinhan Asset Management has become our wholly-owned subsidiary as of such date. Shinhan Asset Management ranked fifth among asset managers in Korea in terms of assets under management. As of December 31, 2022, and provides a wide range of investment products, including traditional equity/fixed income funds as well as alternative investment products, to retail and institutional clients. As a former joint venture with BNP Paribas Asset Management Holding, we believe Shinhan Asset Management derives significant benefits from BNP Paribas’s global network of investment professionals and expertise in the asset management industry. As of December 31, 2022, Shinhan Asset Management had assets under management amounting to W101,407 billion. To a limited extent, Shinhan Securities also provides asset management services for discretionary accounts, see “— Securities Brokerage Services.”
Savings Banking
Through Shinhan Savings Bank, we provide savings banking services in accordance with the Mutual Savings Bank Act to customers that generally would not, due to their credit profile, qualify for our commercial banking services or who seek higher returns on their deposits than those offered by our commercial banking subsidiaries. Established in December 2011, Shinhan Savings Bank offers savings and other deposit products with relatively higher interest rates and loans (usually in relatively small amounts and on customer-tailored terms and including loans for which we receive credit support from the Government) primarily to small- to medium-sized enterprises and low income households who would not generally qualify for our commercial banking services. Shinhan Savings Bank has assumed the assets and liabilities of Tomato Savings Bank, which we acquired in January 2012, and has merged into Yehanbyoul Savings Bank, which we acquired in March 2013, with Yehanbyoul Savings Bank as the surviving entity with its name changed to Shinhan Savings Bank. Both Tomato Savings Bank and Yehanbyoul Savings Bank were facing liquidity troubles due to difficulties in the real estate project financing business as a result of the prolonged slump in the Korean real estate market at the time we acquired them. We closely monitor the business activities and product offerings of Shinhan Savings Bank to ensure its financial soundness.
Loan Collection and Credit Reporting
We centralize credit collection and credit reporting operations for our subsidiaries through Shinhan Credit Information Co. Ltd. (“Shinhan Credit Information”), which also provides similar services to third party customers. Shinhan Credit Information’s services include debt collection, credit inquiries, credit reporting, civil
70
application/petition services and process agent services, among others. Shinhan Credit Information also manages participants in credit recovery programs and provides support to the Kookmin Happy Fund, which is a Government-established fund that supports retail borrowers with low credit scores by purchasing defaulted loans from creditors or providing credit guarantees to enable such borrowers to refinance at lower rates.
Collective Investment Administration Services
We provide integrated collective investment administration services through Shinhan AITAS Co., Ltd. Shinhan AITAS provides general management service, asset management systems, accounting systems and trading systems to asset management companies and institutional investors. The target customers for these collective investment administration services are asset managers, investment advisors and institutional investors, and Shinhan AITAS seeks to provide a comprehensive service package including the computation of the reference value for funds, evaluation of fund performance, provision of trading systems and fund-related legal administrative services.
Alternative Investments
To a limited extent, through Shinhan Asset Management, which merged with Shinhan Alternative Investment Management in January 2022, we are also engaged in private equity investments through formation of private equity funds. The private equity funds receive funding from investors on a private placement basis, which funds are then invested in alternative assets and equity securities in companies for a variety of reasons, including management control, business turnaround or corporate governance improvements.
Financial System Development Services
We provide financial system development services through Shinhan DS, which offers system integration, system management, IT outsourcing, business process outsourcing and IT consulting services.
Real Estate Investment Trust (REIT) Asset Management
Through our wholly owned subsidiary, Shinhan REITs Management Co., Ltd., we provide real estate investment and management services to real estate investment trusts.
Real Estate Trust Services
Shinhan Asset Trust Co., Ltd. is a comprehensive real estate trust service provider, providing services including land development trust, management trust, proxy and agency businesses and consulting, etc.
Artificial Intelligence Based Investment Consulting
Shinhan AI. Co., Ltd. is an artificial intelligence-based investment consulting company established to enhance our competitiveness in the digital age and provide differentiated investment consulting services, with plans to expand business into the asset management sector.
Venture Capital Investment
Shinhan Venture Investment Co, Ltd. is an alternative investment management firm specializing in identifying and investing in start-up companies as well as small to mid-sized companies and also promoting the formation and operation of early stage investment funds and private equity investment funds.
Our Distribution Network
We offer a wide range of financial services to retail and corporate customers through a variety of distribution networks and channels established by our subsidiaries. The following table presents the geographical
71
distribution of our distribution network based on the branch offices and other distribution channels of our principal subsidiaries, as of December 31, 2022.
|
|
|
|
|
|
|
|
|
|
|
|
|
|
|
|
|
|
|
|
|
|
|
|
|
| |
|
Shinhan
Bank |
|
|
Jeju
Bank |
|
|
Shinhan
Card |
|
|
Shinhan
Securities |
|
|
Shinhan
Life
Insurance |
|
|
Total |
|
| Distribution Channels in Korea(1) |
| Seoul metropolitan |
|
|
301 |
|
|
|
1 |
|
|
|
10 |
|
|
|
38 |
|
|
|
117 |
|
|
|
467 |
|
| Gyeonggi province |
|
|
153 |
|
|
|
— |
|
|
|
1 |
|
|
|
11 |
|
|
|
28 |
|
|
|
193 |
|
| Six major cities: |
|
|
137 |
|
|
|
1 |
|
|
|
10 |
|
|
|
19 |
|
|
|
46 |
|
|
|
213 |
|
| Incheon |
|
|
52 |
|
|
|
— |
|
|
|
1 |
|
|
|
3 |
|
|
|
6 |
|
|
|
62 |
|
| Busan |
|
|
29 |
|
|
|
1 |
|
|
|
3 |
|
|
|
4 |
|
|
|
17 |
|
|
|
54 |
|
| Gwangju |
|
|
11 |
|
|
|
— |
|
|
|
1 |
|
|
|
3 |
|
|
|
6 |
|
|
|
21 |
|
| Daegu |
|
|
20 |
|
|
|
— |
|
|
|
1 |
|
|
|
4 |
|
|
|
8 |
|
|
|
33 |
|
| Ulsan |
|
|
11 |
|
|
|
— |
|
|
|
1 |
|
|
|
2 |
|
|
|
3 |
|
|
|
17 |
|
| Daejeon |
|
|
14 |
|
|
|
— |
|
|
|
3 |
|
|
|
3 |
|
|
|
6 |
|
|
|
26 |
|
|
|
|
|
|
|
|
|
|
|
|
|
|
|
|
|
|
|
|
|
|
|
|
|
|
| Sub-total |
|
|
591 |
|
|
|
2 |
|
|
|
21 |
|
|
|
68 |
|
|
|
191 |
|
|
|
873 |
|
|
|
|
|
|
|
|
|
|
|
|
|
|
|
|
|
|
|
|
|
|
|
|
|
|
| Others |
|
|
130 |
|
|
|
30 |
|
|
|
8 |
|
|
|
13 |
|
|
|
27 |
|
|
|
208 |
|
|
|
|
|
|
|
|
|
|
|
|
|
|
|
|
|
|
|
|
|
|
|
|
|
|
| Total |
|
|
721 |
|
|
|
32 |
|
|
|
29 |
|
|
|
81 |
|
|
|
218 |
|
|
|
1,081 |
|
|
|
|
|
|
|
|
|
|
|
|
|
|
|
|
|
|
|
|
|
|
|
|
|
|
Note:
| (1) |
Includes our main office and those of our subsidiaries. |
Banking Service Channels
Our banking services are primarily provided through an extensive branch network, specializing in retail and corporate banking services, as complemented by self-service terminals and electronic banking, as well as an overseas services network.
As of December 31, 2022, Shinhan Bank’s branch network in Korea comprised of 721 service centers, consisting of 521 retail banking service centers (including 25 private wealth management service centers and 118 retail offices), 15 large corporate banking service centers, 53 corporate banking services centers and 132 hybrid banking branches. Shinhan Bank’s banking branches are designed to provide one-stop banking services tailored to their respective target customers. Recently, Shinhan Bank has been actively adopting digital technology to improve operational efficiency of its banking service channels. For example, Shinhan Bank introduced digital kiosks to banking branches, established ‘Paperless Banking’ by replacing paper applications with electronic documents, implemented a “robotic process automation system” for the automation of certain tasks and processes and increased the volume of client communications through non-face-to-face platforms.
Retail Banking Channels
In Korea, many retail transactions are conducted in cash or with credit cards, and conventional checking accounts are generally not offered or used as widely as in other countries such as the United States. An extensive retail branch network has traditionally played an important role as the main platform for a wide range of banking transactions. However, a growing number of customers are turning to other service channels to meet their banking needs, such as Internet banking, mobile banking and other forms of non-face-to-face platforms. In response to such changes, Shinhan Bank has recently focused on reorganizing its retail branch network, including shifting, merger or closure of certain branches that are considered redundant.
Recently, one of the key initiatives at Shinhan Bank has been to target high net-worth individuals through private banking. Our private banking services are provided principally through private banking relationship managers who, within target customer groups, assist clients in developing individual investment strategies. We
72
believe that such relationship managers help us foster enduring relationships with our clients. Private banking customers also have access to Shinhan Bank’s retail branch network and other general banking products Shinhan Bank offers through its retail banking operations.
Corporate Banking Channels
Shinhan Bank currently provides corporate banking services through corporate banking service centers primarily designed to serve large corporate customers and hybrid banking branches designed to serve retail as well as small-business corporate customers. Small- and medium-sized enterprises have traditionally been Shinhan Bank’s core corporate customers and we plan to continue to maintain Shinhan Bank’s strength vis-à-vis these customers.
Self-Service Terminals
In order to complement its banking branch network, Shinhan Bank maintains an extensive network of automated banking machines, which are located in branches and in unmanned outlets. These automated banking machines consist of ATMs, cash dispensers and passbook printers. In December 2015, Shinhan Bank introduced digital kiosks, a new generation of automated self-service machines featuring biometric authentication technology and the ability to perform a wide range of services that were not available through traditional ATMs, such as opening new accounts, issuance of debit and check cards, foreign currency exchange and overseas remittance of foreign currency. As of December 31, 2022, Shinhan Bank had 4,849 ATMs, 7 cash dispensers and 224 digital kiosks. Shinhan Bank has actively promoted the use of these distribution outlets in order to provide convenient service to customers, as well as to maximize the marketing and sales functions at the branch level, reduce employee costs and improve profitability. In 2022, automated banking machine transactions accounted for a substantial portion of total deposit and withdrawal transactions of Shinhan Bank in terms of the number of transactions and fee revenue generated, respectively.
Digital Banking
Shinhan Bank’s digital banking services are more comprehensive than those available at the counter, including services such as 24-hour account balance posting, real-time account transfer, overseas remittance, and loan requests. As of December 31, 2022, Shinhan Bank had 22,233,989 subscribers to its Internet banking services and 15,218,836 users of its smart banking apps, representing an increase of 6.2% and 9.6%, respectively, compared to December 31, 2021. Shinhan Bank continues to experience a rise in the number of online and mobile banking users. Shinhan Bank began offering online and mobile banking initially to save costs rather than to increase revenues, but it is exploring ways to increase revenues through online and mobile banking. These services offer customers more straightforward and convenient access to banking services without limitations of time and space and offer tailored and customized service to each customer. In February 2018, Shinhan Bank launched “SOL,” a mobile banking application integrating Shinhan Bank’s six previously existing mobile applications. Shinhan Bank began offering an open banking service in October 2019, allowing customers to access accounts, products, and services across multiple banks using only SOL. In November 2019, Shinhan Bank also launched “SOL Global,” a mobile banking application for foreigners, allowing foreign customers to use open banking and other financial services. In 2020, Shinhan Bank expanded the network of financial institutions accessible through SOL’s open banking service. It implemented upgrades that allowed users to customize the user interface to reflect personal asset management preferences. In addition, Shinhan Bank launched the “MoneyVerse” service in December 2021, which utilizes the financial MyData service and enables customers to transfer assets held in other institutions, such as banks, securities, insurance, pension, real estate, and automobiles, to Shinhan SOL. The service made it possible to conduct an integrated inquiry and management of assets. Shinhan Bank is promoting various efforts to transform SOL into a digital platform that goes beyond a financial service platform and becomes closely connected to customers’ lives. In 2020 and 2021, Shinhan Bank launched the COVID-19 Government relief application service through SOL, allowing users to apply for Government emergency funds through the mobile application. In addition, in February 2020, Shinhan Bank
73
launched a medical insurance claim service on SOL, allowing users to easily submit medical insurance claims by sending photos of supporting documents through the SOL mobile application. In line with the recent trends of “live commerce,” in October 2020, Shinhan Bank launched “SOL Live,” a live broadcast marketing stream channel for financial products. Shinhan Bank also promoted digital innovation at its existing offline branches in 2021. For example, customers are greeted by an AI concierge and they can choose to use smart kiosk that enables self-service banking and digital service including remote video consulting. By taking part in the Consumer Electronics Show 2021, Shinhan Bank was able to introduce its innovative branch services and digital service devices such as digital desks that offer AI-powered customer service assistance and live video chat with service representatives to the world. Additionally, in 2022, Shinhan Bank launched “New SOL”, an upgraded version of SOL that offers enhanced user experience and improved usability. New SOL has been transformed into a banking platform that is specifically designed based on customer feedback gathered during the application’s planning phase. Due to improvements in software framework, the speed of the mobile application has improved substantially, along with the user experience. Chatbots have also been upgraded, and they now have improved multi-tasking capabilities in addressing user requests and inquiries. Shinhan Bank intends to continue introducing a range of innovative technologies that will enhance customer experience and open up new business opportunities, such as face recognition technology for user identity verification and voice banking services powered by artificial intelligence. Shinhan Bank will also continue to focus on security measures for privacy protection and financial crime detection. Also in 2022, Shinhan Bank launched a customer communication channel where customers are invited to submit their ideas on financial and banking services in general and also to post their feedback on our products and services.
Overseas Distribution Network
The table below sets forth Shinhan Bank’s overseas banking subsidiaries and branches as of December 31, 2022.
|
|
|
|
|
|
|
| Business Unit |
|
Location |
|
Year Established
or
Acquired |
|
| Subsidiaries(1) |
|
|
|
|
|
|
|
|
|
| Shinhan Bank Europe GmbH(2) |
|
Frankfurt, Germany |
|
|
1994 |
|
| Shinhan Bank America |
|
New York, U.S.A. |
|
|
1990 |
|
| Shinhan Bank (China) Limited |
|
Beijing, China |
|
|
2008 |
|
| Shinhan Bank (Cambodia) PLC |
|
Phnom Penh, Cambodia |
|
|
2007 |
|
| Shinhan Bank Kazakhstan Limited |
|
Almaty, Kazakhstan |
|
|
2008 |
|
| Shinhan Bank Canada |
|
Toronto, Canada |
|
|
2009 |
|
| Shinhan Bank Japan(3) |
|
Tokyo, Japan |
|
|
2009 |
|
| Shinhan Bank Vietnam Ltd.(4) |
|
Ho Chi Minh City, Vietnam |
|
|
2011 |
|
| Banco Shinhan de Mexico(5) |
|
Mexico City, Mexico |
|
|
2015 |
|
| PT Bank Shinhan Indonesia(6) |
|
Jakarta, Indonesia |
|
|
2016 |
|
|
|
|
| Branches |
|
|
|
|
|
|
| New York |
|
U.S.A. |
|
|
1989 |
|
| Singapore |
|
Singapore |
|
|
1990 |
|
| London |
|
United Kingdom |
|
|
1991 |
|
| Mumbai |
|
India |
|
|
1996 |
|
| Hong Kong |
|
China |
|
|
2006 |
|
| New Delhi |
|
India |
|
|
2006 |
|
| Poonamallee |
|
India |
|
|
2010 |
|
| Pune |
|
India |
|
|
2014 |
|
| Manila |
|
Philippines |
|
|
2015 |
|
| Dubai |
|
United Arab Emirates |
|
|
2015 |
|
74
|
|
|
|
|
|
|
| Business Unit |
|
Location |
|
Year Established
or
Acquired |
|
| Sydney |
|
Australia |
|
|
2016 |
|
| Yangon |
|
Myanmar |
|
|
2016 |
|
| Ahmedabad |
|
India |
|
|
2016 |
|
| Ranga Reddy |
|
India |
|
|
2016 |
|
|
|
|
| Representative Offices(7) |
|
|
|
|
|
|
| Mexico |
|
Mexico City, Mexico |
|
|
2008 |
|
| Uzbekistan |
|
Tashkent, Uzbekistan |
|
|
2009 |
|
| Poland(2) |
|
Wroclaw, Poland |
|
|
2014 |
|
| Hungary(8) |
|
Budapest, Hungary |
|
|
2021 |
|
Notes:
| (1) |
Shinhan Bank’s subsidiary in Hong Kong SAR, China, Shinhan Asia Ltd., was liquidated as of July 14, 2020. |
| (2) |
Shinhan Bank Europe GmbH established a representative office in Poland in 2014. |
| (3) |
While Shinhan Bank established the subsidiary in Japan in 2009, Shinhan Bank has provided banking services in Japan through a branch structure since 1986. |
| (4) |
Prior to the establishment of this subsidiary in 2011, Shinhan Bank provided banking services in Vietnam through a branch since 1995. |
| (5) |
Banco Shinhan de Mexico commenced operations in March 2018. |
| (6) |
Shinhan Bank acquired a 98.01% stake in Bank Metro Express and a 100% stake in Centratama Nasional Bank, two banks in Indonesia, in November 2015 and December 2016, respectively. On March 3, 2016, Bank Metro Express obtained a license to conduct business activities in the name of PT Shinhan Bank Indonesia. Centratama Nasional Bank was merged with PT Bank Shinhan Indonesia on December 6, 2016. |
| (7) |
Shinhan Bank’s representative office in Myanmar was closed as of June 8, 2018. |
| (8) |
Shinhan Bank’s representative office in Hungary commenced operations on October 19, 2021. |
Currently, our overseas subsidiaries and branches are primarily engaged in trade financing and local currency funding for Korean companies and Korean nationals in the overseas markets, as well as providing foreign exchange services in conjunction with Shinhan Bank’s headquarters. On a limited basis, these overseas branches and subsidiaries also engage in investment and trading of securities of foreign issuers. In the future, as part of our globalization efforts, we plan to expand our coverage of local customers in the overseas markets by providing a wider range of services in retail and corporate banking, and to that end, we have increasingly established subsidiaries in lieu of branches in select markets and in 2011 merged two of our Vietnam banking subsidiaries in order to enhance our presence and enable greater flexibility in its service offerings in these markets. We plan to maintain our focus on organic growth, while we may selectively pursue acquisitions in markets where it is difficult to obtain local banking licenses through greenfield entry. In furtherance of this objective, Shinhan Bank acquired a 98.01% stake in Bank Metro Express and a 100% stake in Centratama Nasional Bank, two banks in Indonesia, in November 2015 and December 2016, respectively. Shinhan Bank completed the merger of the two banks in December 2016. Shinhan Bank also opened additional branches in Australia, Myanmar and India in the second half of 2016. In April 2017, Shinhan Bank Vietnam Co., Ltd. acquired ANZ Bank (Vietnam) Limited’s retail division. In 2017, Shinhan Bank became the first Korean Bank to obtain a license to set up a local subsidiary in Mexico and started local business in Mexico in March 2018. We plan to continue our efforts to expand our overseas banking service network and global operations.
Credit Card Distribution Channels
Shinhan Card primarily uses four distribution channels to attract new credit card customers: (i) the banking and credit card branch network, (ii) sales agents, (iii) business partnerships and affiliations with vendors and (iv) digital platforms such as Shinhan pLay.
75
As of December 31, 2022, the branch network for our credit card operations consisted of 876 branches of Shinhan Bank and 29 card sales branches of Shinhan Card. The use of the established distribution network of Shinhan Bank is part of the group-wide cross-selling efforts of selling credit card products to existing banking customers. In 2022, the number of new cardholders acquired through our banking distribution network accounted for approximately 16.4% of the total number of new cardholders. We believe that the banking distribution network will continue to provide a stable and low-cost venue for acquiring high-quality credit cardholders.
The sales agents represented the most significant source of Shinhan Card’s new cardholders in 2022, and the number of new cardholders acquired through sales agents accounted for approximately 30.9% of the total number of Shinhan Card’s new cardholders in 2022. As of December 31, 2022, Shinhan Card had 1,372 sales agents, who were independent contractors. These sales agents assist prospective customers with the application process and customer service. Compensation of these sales agents is generally tied to the transaction volume of the customers introduced by them, and we believe this system helps to enhance profitability.
As a way of acquiring new cardholders, Shinhan Card also has business partnership and affiliation arrangements with a number of vendors, including gas stations, major retailers, airlines and telecommunication and Internet service providers. Shinhan Card plans to continue to leverage its alliances with such vendors to attract new cardholders.
As part of a group-wide initiative to streamline our operations and create a digital-friendly business platform, Shinhan Card has strategically expanded its digital platforms. In October 2021, Shinhan Card launched “Shinhan pLay”, a mobile platform providing consolidated financial and non-financial services. In addition to providing traditional financial services such as payment, open banking and asset management as well as services provided through traditional customer service means such as call centers and website applications, Shinhan pLay also offers a variety of non-financial content including entertainment, shopping, personal certificates and memberships in order to better provide customized financial services aimed at meeting the comprehensive needs of customers. In addition to providing traditional payment services, Shinhan pLay utilizes digital technology such as artificial intelligence and big data to provide real-time customized services tailored to individual users and integrated access across services provided by various merchants and affiliates.
In November 2014, as an initial step to exploring potential opportunities overseas, Shinhan Card established its first overseas subsidiary in Kazakhstan, LLP MFO Shinhan Finance, as Kazakhstan was deemed to have relatively low entry barriers to foreign financial institutions, high growth potential for retail operations and the possibility of leveraging Shinhan Bank’s network. LLP MFO Shinhan Finance obtained its business license in the first half of 2015 and commenced operations in July 2015, including installment financing and credit loans. In 2018, LLP MFO Shinhan Finance expanded its sales channels and introduced new credit loan products, while in 2019, the company further expanded its sales coverage while enhancing its risk management capabilities. In 2021, LLP MFO Shinhan Finance established a foundation for its automobile finance business through a captive partnership with a local dealership in Kazakhstan.
In December 2015, Shinhan Card acquired a majority stake in PT Swadharma Indotama Finance, a multi finance company in Indonesia, and changed its legal name to PT Shinhan Indo Finance. PT Shinhan Indo Finance engages in corporate and retail operations, including installment financing and financial leases, and began offering credit card services in January 2017 after obtaining its credit card business license in December 2016. In 2018, PT Shinhan Indo Finance began to expand its retail business across Indonesia. In 2019, PT Shinhan Indo Finance launched its joint finance product with Shinhan Bank, maintaining a conservative approach to its retail business while steadily increasing its corporate leasing assets, particularly corporate fleet vehicle finance products. In 2020, PT Shinhan Indo Finance focused on expanding its fleet business and improving its financial performance. In 2023, PT Shinhan Indo Finance plans to maintain its fleet-centered strategy and also plans to explore additional partnerships for new businesses.
In March 2016, to accelerate our global business expansion, we established Shinhan Microfinance, a local subsidiary in Myanmar. Shinhan Microfinance obtained its microfinance business license in July 2016 and
76
launched operations in September 2016. In 2017, it expanded its business operations from Yangon to nearby Bago. In 2018, Shinhan Microfinance increased its assets and profit volume by diversifying the range of microfinance products it offers. In 2019, Shinhan Microfinance actively expanded its sales network and sought long term growth opportunities. In 2020, Shinhan Microfinance has grown significantly despite the spread of COVID-19 by expanding its branch network and launching new products. In 2023, Shinhan Microfinance plans to focus on risk management to achieve stable growth amidst the continued instability from the COVID-19 situation.
In January 2018, Shinhan Card acquired Prudential Vietnam Finance Company Limited in order to gain a stronger presence in Vietnam and increase synergy with Shinhan Bank and Shinhan Securities’ Vietnam operations. In July 2019, Shinhan Card changed its legal name into Shinhan Vietnam Finance Company Ltd. (“Shinhan Vietnam Finance Company”). Utilizing its relatively lower funding cost resulting from cooperation with other affiliates in Vietnam such as Shinhan Bank and Shinhan Securities, Shinhan Vietnam Finance was able to expand its asset base, reaching total assets of US$647.3 million as of December 31, 2022. As part of its diversification efforts, new products such as automobile loans, niche loans, and easy loans were launched in 2021, resulting in increased sales. The State Bank of Vietnam recently introduced Circular 18, which amends the regulation on consumer lending activities in Circular 43 and is aimed at improving soundness of Vietnam’s consumer finance industry and facilitating a transition towards a cashless society by regulating the proportion of direct disbursements (for example, cash loans) to the total outstanding loans. According to the amendment, the rate of total consumer loans with direct disbursements to total consumer credit balance should gradually be decreased to 30% by 2024. In 2020, in concurrence with the State Bank of Vietnam’s policies promoting consumer finance and movement towards a cashless society, Shinhan Vietnam Finance Company further diversified its offerings to include installment financing for automobiles and durable goods. Shinhan Vietnam Finance Company also launched iShinhan 3.0, a non-face-to-face loan platform. Shinhan Vietnam Finance Company plans to grow into a leading consumer finance company in Vietnam by accelerating digital transformation to increase business efficiency and create customer value. In response to the new regulatory changes, Shinhan Vietnam Finance plans to further diversify its business offerings and continue to leverage Shinhan Card’s digitalization capabilities to increase efficiency and provide customers with innovative services.
Securities Brokerage Distribution Channels
Our securities brokerage services are conducted principally through Shinhan Securities. As of December 31, 2022, Shinhan Securities had 81 service centers nationwide, and four overseas subsidiaries based in Hong Kong, New York, Vietnam and Indonesia to service our corporate customers.
Approximately 60% of our brokerage branches are located in the Seoul metropolitan area with a focus on attracting high net-worth individual customers as well as enhancing synergy with our retail and corporate banking branch network. We plan to continue to explore new business opportunities, particularly in the corporate customer segment, through further cooperation between Shinhan Securities and Shinhan Bank.
Insurance Sales and Distribution Channels
We sell and provide our insurance services primarily through Shinhan Life Insurance. In addition to distributing bancassurance products through our bank branches, also distribute a wide range of life insurance products through their own branch network, agency network of financial planners and telemarketers, as well as through the Internet. As of December 31, 2022, Shinhan Life Insurance had 218 branches and 9 customer support centers. These branches are staffed by financial planners, telemarketers, agent marketers and bancassurance to meet the various needs of our insurance and lending customers. Our group-wide customer support centers arrange for policy loans (namely loans secured by the cash surrender value of the underlying insurance policy) for our insurance customers and, to a limited extent, other loans to other customers, and also handle insurance payments.
77
Information Technology
We dedicate substantial resources to maintaining a sophisticated information technology system to support our operations management and provide high quality customer service. Our information and technology system is operated at a group-wide level based on comprehensive group-wide information collection and processing. We also operate a single group-wide enterprise information technology system known as “enterprise data warehouse” for customer relations management capabilities, risk management systems and data processing. We continually upgrade our group-wide information technology system in order to apply the best-in-class technology to our risk management systems to reflect the changes in our business environment as well as enhance differentiation from our competitors.
In 2013, we completed the construction of the Shinhan Data Center, which is responsible for comprehensive management of information technology systems for our subsidiaries on a group-wide basis. This center ensures a stable use of a central information processing facilities for at least 15 years and is designed to maximize operational and cost efficiency as well as enhance information security by combining the various data centers previously used by our subsidiaries. All of our subsidiaries relocated their information management capabilities to this center in 2014.
The information technology system for each of our subsidiaries is currently backed up on a real-time basis. In 2014, we converted the pre-existing data center to a back-up and disaster recovery center for all our subsidiaries’ operations in order to provide customer services in a continued seamless manner even in the case of an interruption at Shinhan Data Center. We believe that our centralized back-up systems, including our data back-up centers and disaster recovery centers, enable more efficient back-up at a higher level of security.
In order to enhance security and trustworthiness of our financial services, we are continuously working to improve our information security systems and our customers’ financial safety. Due to such improvements, we believe our fraud detection system has been preventing a substantial volume of voice phishing and fraud attempts. For example, we launched a group-wide customer information consent management system in June 2022 and expanded its scope to include six subsidiaries, enabling our customers to easily monitor how their information is used and make a better informed decision in giving consent.
At the subsidiary level, we also continue to increase investment in information and communication technologies (“ICT”) to improve the quality of customer service in line with changing market trends. As of December 31, 2022, over the last five years the number of our employees in ICT sector has increased by 122% and the ICT budget has grown by 32%. As a result of this continued investment, our digital platforms were able to offer more services focused on the needs of the customer. In October 2022, Shinhan Bank launched New SOL, a new mobile application that operates at a substantially faster speed and offers unique features including customized home screen and transaction records editable by users. Shinhan Card’s pLay app improved in-app customer support and increased the range of payment options available to its users by launching the open pay service, which enables users to register and make payments with credit cards issued by other credit card companies. Shinhan Securities’ mobile application called “Alpha” plans to implement more customer-friendly user experience and Shinhan Life also launched “Square”, an all-in-one insurance service platform.
In addition, in order to further improve customer convenience and experience, we plan to launch a universal mobile application in 2023 which will provide integrated services selected from the 1,400 services currently offered by Shinhan Financial Group. Additionally, as part of our ICT modernization strategy, we plan on strengthening our ICT capabilities based on utilization of public cloud and microservice architecture.
Competition
Competition in the Korean financial services industry is, and is likely to remain, intense, including as a result of the sustained low interest rate environment (which narrows opportunities to make profit based on the
78
spread between lending rates and funding rates), the continuing sluggishness in the general economy, the growing maturation and saturation of the industry as a whole, the entry of new market participants and deregulation, among others.
In the banking sector, Shinhan Bank competes principally with other national commercial banks in Korea, but also faces competition from a number of additional banking institutions, including branches and subsidiaries of foreign banks operating in Korea, regional banks, Internet-only banks, government-owned development banks and Korea’s specialized banks, such as Korea Development Bank, the Industrial Bank of Korea and the National Federation of Fisheries Cooperatives, as well as various other types of financial service providers, including savings institutions (such as mutual savings and finance companies, credit unions and credit cooperatives), investment companies (such as securities brokerage firms, merchant banking corporations and asset management companies) and life insurance companies. As of December 31, 2022, Korea had six major nationwide domestic commercial banks (including Citibank Korea Inc. and Standard Chartered Bank Korea Limited, both of which are domestic commercial banks acquired by global financial institutions), six regional commercial banks, three Internet-only banks and thirty-five branches and subsidiaries of foreign banks. Foreign financial institutions, many of which have greater experiences and resources than we do, may continue to enter the Korean market and compete with us in providing financial products and services either by themselves or in partnership with existing Korean financial institutions.
In the small- and medium-sized enterprise and retail banking segments, which have been Shinhan Bank’s traditional core businesses, competition is expected to increase further. In recent years, Korean banks, including Shinhan Bank, have increasingly focused on stable asset growth based on quality credit, such as corporate borrowers with high credit ratings, loans to SOHO with high levels of collateralization, and mortgage and home equity loans within the limits of the prescribed loan-to-value ratios and debt-to-income ratios. This common shift in focus toward stable growth based on less risky assets has intensified competition as banks compete for the same limited pool of quality credit by engaging in price competition or by other means although Shinhan Bank has traditionally focused, and will continue to focus, on enhancing profitability rather than increasing asset size or market share, and has avoided, to the extent practicable, engaging in price competition by way of lowering lending rates. In addition, such competition may result in lower net interest margin and reduced overall profitability, especially if the low interest rate environment were to continue for a significant period of time. Shinhan Bank’s net interest margin (on a separate basis) increased to 1.85% in 2022 from 1.62% in 2021 due to, at least partly, increases in base interest rate by the Bank of Korea from 1.00% to 1.25% in January 2022, from 1.25% to 1.50% in April 2022, from 1.50% to 1.75% in May 2022, from 1.75% to 2.25% in July 2022, from 2.25% to 2.50% in August 2022, from 2.50% to 3.00% in October 2022 and from 3.00% to 3.25% in November 2022. The Bank of Korea further raised the base interest rate from 3.25% to 3.50% in January 2023, which may be further increased during 2023. Even if interest rates were to increase, the effect on Shinhan Bank’s results of operations may not be as beneficial as expected, or at all, due to factors such as increased volatility of market interest rates and tighter regulations regarding SOHO loans, including the implementation of additional credit review guidelines for individual businesses. Further, if competing financial institutions seek to expand market share by lowering their lending rates, Shinhan Bank may suffer customer loss, especially among customers who select their lenders principally on the basis of lending rates. In response thereto or for other strategic reasons, Shinhan Bank may subsequently lower its lending rates to stay competitive, which could lead to a further decrease in its net interest margins and outweigh any potential positive impact on the net interest margin from a general rise in market interest rates. Any future decline in Shinhan Bank’s customer base or its net interest margins could have an adverse effect on our results of operations and financial condition.
In the credit card sector, Shinhan Card competes principally with existing “monoline” credit card companies, credit card divisions of commercial banks, consumer finance companies, other financial institutions and, recently, credit card service providers allied with mobile telecommunications service providers in Korea. Competition has been historically intense in this sector and the market has shown signs of saturation as existing and new credit card service providers make significant investments and engage in aggressive marketing campaigns and promotions to acquire new customers and target customers with high credit quality. While
79
competition has subsided somewhat recently due to stricter government regulations, such as curbs on excessive marketing expenses, competition remains intense and credit card issuers may continue to compete with Shinhan Card for customers by offering lower interest rates and fees, higher credit limits, more attractive promotions and incentives and alternative products such as credit card reward points, gift cards and low-interest consumer loan products. As a result, Shinhan Card may lose customers or service opportunities to competing credit card issuers and/or incur higher marketing expenses. Also, over the years, the Government has implemented regulations lowering certain merchant fees chargeable by credit card companies. In 2012, the Government adopted regulations mandating lower merchant fees chargeable to small- and medium-sized enterprises, and beginning January 31, 2016, a further reduction in the merchant fees chargeable to small- and medium-sized enterprises went into effect. The Enforcement Decree of the Specialized Credit Finance Business Act was amended in July 2017 and January 2019 to further expand the range of small- and medium-sized enterprises subject to lower merchant fees. Pursuant to the Specialized Credit Financial Business Act, the rates of fees chargeable to merchants are subject to review and revision every three years, and beginning January 2022, the fees chargeable to small- and medium-sized enterprises with respect to credit cards were further reduced as a result of this periodic review and revision. Additional amendments to regulations requiring further downward adjustments to merchant fees may come into force in the future. For further details on the Government’s regulations on merchant fees chargeable by credit card companies, See “Item 3.D. Risk Factors — Risks Relating to Our Credit Card Business — Future changes in market conditions as well as other factors, such as stricter regulation, may lead to reduced revenues and deterioration in the asset quality of credit card receivables.” In March 2023, the Financial Services Commission set up a task force consisting of members of the Financial Services Commission, the Financial Supervisory Service, credit card companies, and consumer groups, to discuss how to improve the merchant commission rate adjustment system in order to address disagreements among the stakeholders involved in the periodic review of the rates of fees charged to merchants.
In addition, since the implementation of the Improper Solicitation and Graft Act in September 2016, revenue growth for corporate cards and service related industries such as dining, floral and entertainment have shown signs of decline, and additional regulations on loans reducing maximum interest rates chargeable from 24% to 20% came into effect in July 2021. These developments have put further downward pressure on the results of operations for credit card companies, including Shinhan Card. Furthermore, the Government’s recent guidelines to bolster consumer protection and protect customers’ personal data in the aftermath of data leaks at certain credit companies (not including Shinhan Card) may result in additional compliance costs for Shinhan Card. Customer attrition, together with any further lowering of fees or reduction in base and market interest rates and/or additional expenses from more extensive marketing and promotional campaigns that Shinhan Card might implement to acquire and retain customers, could reduce its revenues and earnings. Furthermore, the average credit quality of Shinhan Card’s customers may deteriorate if customers with higher credit quality borrow from our competitors rather than Shinhan Card and it may become more difficult for Shinhan Card to attract and maintain quality customers. In general, the growth, market share and profitability of Shinhan Card’s operations may decline or become negative as a result of market saturation in this sector, interest rate competition, pressure to lower fee rates and incur higher marketing expenses, as well as Government regulation and social and economic developments in Korea that are beyond our control, such as changes in consumer confidence levels, spending patterns or public perception of credit card usage and consumer debt. If Shinhan Card fails to maintain or attract new cardholders or increase the card usage by existing customers or experiences deterioration in its asset quality and a rise in delinquency, our business, financial condition and results of operations may be adversely affected. In other financial services sectors, our other subsidiaries also compete in a highly fragmented market. Some of our competitors, particularly major global financial institutions, have greater experience and resources than we do.
Consolidation among our rival institutions and the Government’s privatization efforts may also add competition in the markets in which we and our subsidiaries conduct business. A number of significant mergers and acquisitions in the industry have taken place in Korea recently. In January 2019, Woori Financial Group was established pursuant to a comprehensive stock transfer under the Korean Commercial Code whereby holders of the common stock of Woori Bank and certain of its subsidiaries transferred all of their shares to Woori Financial
80
Group (the new financial holding company) and in return received shares of Woori Financial Group. As a result, Woori Bank and certain of its former wholly-owned subsidiaries became direct and wholly-owned subsidiaries of Woori Financial Group. The Korea Deposit Insurance Corp., which as of April 9, 2021 owned 17.25% of the outstanding common stock of Woori Financial Group, has sold 13.63% of the outstanding common stock of Woori Financial Group in multiple transactions in accordance with its plan that was approved by the Financial Services Commission in June 2019. The Korea Deposit Insurance Corp. sold additional 2.33% of the outstanding common stock of Woori Financial Group in May 2022 and currently owns only 1.29% of the outstanding common stock of Woori Financial Group. In the asset management business sector, Woori Financial Group acquired two asset management companies, Tongyang Asset Management and ABL Global Asset Management (former Allianz Global Investors). In August 2021, KB Financial Group completed the acquisition of Prudential Life Insurance, the former Korean unit of Prudential Financial Inc. Any of these developments may place us at a competitive disadvantage and outweigh any potential benefit to us in the form of opportunities to acquire new customers who are displeased with the level of services at the newly reorganized entities or to provide credit facilities to corporate customers who wish to maintain relationships with a wide range of banks in order to diversify their sources of funding.
On February 1, 2019, we acquired a 59.15% interest in Orange Life Insurance, the former Korean unit of ING Life Insurance, as part of our efforts to diversify and enhance our non-banking businesses. On January 28, 2020, we acquired the remaining interests in Orange Life Insurance by effecting a comprehensive stock exchange under Articles 360-2 of the Korean Commercial Code whereby holders (other than us) of Orange Life Insurance’s common stock transferred all of their shares to us and in return receive shares of our common stock, and hence Orange Life Insurance became our wholly owned subsidiary as of such date. In May 2021, the Financial Services Commission approved the merger of Shinhan Life Insurance and Orange Life Insurance, with Shinhan Life Insurance being the surviving entity upon completion of the merger. Orange Life Insurance was subsequently merged with and into Shinhan Life Insurance in July 2021. On September 29, 2020, we acquired a 96.8% interest in Neoplux, a venture capital company formerly under the Doosan Group. On December 30, 2020, we acquired the remaining interest in Neoplux by effecting a small-scale stock exchange under Article 360-10 of the Korean Commercial Code, and hence Neoplux has become our wholly owned subsidiary as of such date. On January 11, 2021, Neoplux changed its legal name to Shinhan Venture Investment. In addition, on January 15, 2021, we acquired the remaining 35% interest in Shinhan BNP Paribas Asset Management and changed its legal name to Shinhan Asset Management, and hence Shinhan Asset Management has become our wholly-owned subsidiary as of such date. On June 30, 2022 we acquired 94.54% interest in BNP Paribas Cardif General Insurance, which then changed its name to Shinhan EZ General Insurance, Ltd. Subsequently in November 2022, Shinhan EZ General Insurance, Ltd. conducted a paid-in capital increase and our shares decreased to 85.1%. We expect that such consolidation and other structural changes in the financial industry will continue. Other financial institutions may seek to acquire or merge with other entities, and the financial institutions resulting from such consolidation may, by virtue of their increased size and business scope, provide greater competition for us. Increased competition and continuing consolidation may lead to decreased margins, resulting in a material adverse impact on our future profitability.
Regulatory reforms and the general modernization of business practices in Korea have also led to increased competition among financial institutions in Korea. In December 2017, the Financial Services Commission introduced the “my account at a glance” system, which enables consumers to view their key financial account information online, including information on banks, insurances, mutual finance, loan and card issuances on one page. The “my account at a glance” system became available on mobile channels in February 2016 and expanded its scope of services to include savings banks and securities companies. Since their introduction, the integrated automatic payment transfers management service, integrated account management service and “my account at a glance” system have gained widespread acceptance. As the reform of the financial sector continues, competition may become more intense among existing banks, insurance companies, securities companies and other financial organizations, and may lead to significant changes in the current Korean financial market. Moreover, since January 1, 2020, in calculating loan to deposit ratio, retail loans and corporate loans are weighed differently, with retail loans subject to a multiple of 115% and corporate loans (excluding loans to SOHOs) subject to a multiple
81
of 85%, thereby increasing the impact of retail loans and reducing the impact of corporate loans in calculating such ratio. This may further intensify competition for corporate loans and deposits among commercial banks and, as a result, Shinhan Bank may face difficulties in increasing or retaining its corporate loans and deposits, which in turn may result in an increase in its cost of funding.
Furthermore, as the Korean economy further develops and new business opportunities arise, more competitors may enter the financial services industry. For example, as online service providers and technology companies with large-scale user networks, such as Kakao Corp., NAVER and Samsung Electronics, recently make significant inroads in providing virtual payment services through a system based on a growing convergence of financial services and technology commonly referred to as “fintech,” competition for online customers is growing not just among commercial banks, but also from online and mobile payment service providers. In 2015, the Government announced its plans to allow Internet-only banks to operate in Korea. KT consortium’s K-Bank, Kakao consortium’s Kakao Bank and Viva Republica consortium’s Toss Bank commenced operations in April 2017, July 2017 and October 2021, respectively. Internet-only banks may have advantages over traditional banks as the former can pass savings in labor and overhead costs to their customers by offering higher interest rates on deposit accounts, lower loan costs and reduced service fees. Accordingly, commercial banks will likely face increasing pressure to upgrade their service platforms to attract and maintain online users, which represents a growing customer base compared to traditional customers who have primarily conducted banking in-person at physical banking branches.
As part of the Government’s financial policies to promote innovative digital finance, 10 commercial banks, including Shinhan Bank, began offering a preliminary open banking service in October 2019. More local banks and fintech companies joined in December 2019, when the open banking service was fully and officially launched. Open banking service allows each fintech company and bank to provide banking services, such as checking balances and making withdrawals and transfers, with regards to customers’ accounts at other banks. Using open banking service, customers can easily access accounts, products and services across multiple banks, instead of being limited to the accounts, products and services available at the particular bank that they deal with. In addition, on January 9, 2020, the Korean National Assembly passed amendments to three major data privacy laws (the Personal Information Protection Act, the Act on the Promotion of Information and Communications Network Utilization and Information Protection and the Act on the Use and Protection of Credit Information). These amendments introduced the MyData service, allowing and requiring (upon the customer’s request and subject to compliance requirements) financial institutions that have been approved by the Financial Service Commission as a MyData service provider access and sharing of customers’ personal information, credit information and transaction data. On January 27, 2021, Shinhan Bank and Shinhan Card each obtained a license from the Financial Services Commission as a MyData service provider. On January 5, 2023, Shinhan Bank launched the MyData business and Shinhan Card is planning to provide advanced wealth management and various financial services. Until October 13, 2021, the Financial Services Commission granted MyData licenses to 58 companies (46 companies receiving main licenses and 12 companies receiving preliminary licenses), 22 of which were fintech firms (19 companies receiving main licenses and three companies receiving preliminary licenses), and competition between traditional financial institutions like us and fintech firms is expected to intensify, particularly with respect to asset management services. On January 5, 2022, the API-based MyData service was fully implemented and 33 companies (including ten fintech firms) are providing services. As of December 31, 2022, the Financial Services Commission had granted licenses to 64 companies to operate as MyData service providers, 24 of which were fintech or IT firms. If more fintech companies receive authorization as MyData service providers, we expect competition for customers among banks and fintech firms to intensify. In addition, the Financial Services Commission also led discussions in July 2022 about the creation of a government-led platform where consumers can compare loan products from various financial institutions and apply for debt consolidation on a single platform. The platform is expected to launch in May 2023.
Recently, following the global financial crisis, the Government has subjected Korean financial institutions to stricter regulatory requirements and guidelines in areas of asset quality, capital adequacy, liquidity and residential and other lending practices (including a requirement to maintain a certain ratio of core capital to total
82
risk exposure, which was introduced in January 2018 in order to control excessive leverage), which has had a dampening effect on competition. The Financial Services Commission implemented the capital requirements of Basel III, whose minimum requirements were phased in sequentially from December 1, 2013 through full implementation by January 1, 2015, based on the guidelines set forth in the amended Regulation on the Supervision of the Banking Business and the Detailed Regulation on the Supervision of the Banking Business. In addition, the Financial Services Commission has implemented the Basel III requirements relating to liquidity coverage ratio and capital conservation buffer, each of which have been fully phased in as of January 1, 2019. As of January 1, 2016, the Financial Services Commission implemented Basel III requirements relating to accumulation of additional capital for systemically important banks and bank holding companies and countercyclical capital buffer requirements. Each year, the Financial Services Commission may designate banks with significant influence (based on size and connectivity with other financial institutions) on the domestic financial system as a domestic systemically important bank and require the accumulation of additional capital in accordance with the highest of: (i) ratio of common equity capital to risk-weighted assets, ranging from 0.0% to 2.0%, depending on the systematic importance evaluation score, (ii) if the bank’s holding company is a domestic systemically important bank holding company, the capital ratio corresponding to the additional capital required for the bank holding company under the Financial Holding Company Supervision Regulations, or (iii) if the bank is also a global systemically important bank, as defined by the Basel Committee, the capital ratio as required by the Basel Committee. According to the instructions of the Financial Services Commission, domestic systemically important banks, including Shinhan Bank, have been required to maintain an additional capital buffer of 0.25% since January 1, 2016, with such buffer increased by 0.25% annually to reach 1.00% as of January 1, 2019. The Financial Services Commission may also, upon quarterly review, determine and require banks to accumulate a required level of countercyclical capital buffer within the range of 0% to 2.5% of risk-weighted assets, taking into account factors such as the degree of increase in credit relative to the gross domestic product. In July 2021, Shinhan Financial Group, Hana Financial Group, KB Financial Group, NongHyup Financial Group and Woori Financial Group were designated by the Financial Services Commission as domestic systemically important bank holding companies, and Shinhan Bank, Hana Bank, Kookmin Bank, NongHyup Bank and Woori Bank were designated by the Financial Services Commission as domestic systemically important banks. In addition, in July 2021, the Financial Services Commission identified domestic systemically important bank holding companies and domestic systemically important banks as domestic systemically important financial institutions under the Act on the Structural Improvement of the Financial Industry. Domestic systemically important financial institutions are required to prepare and submit their own recovery plans to the Financial Supervisory Service within three months from the date of notification of designation pursuant to the Act on the Structural Improvement of the Financial Industry. However, there is no assurance that these measures will have the effect of curbing competition or that the Government will not reverse or reduce such measures or introduce other deregulatory measures, which may further intensify competition in the Korean financial services industry. For further details on the capital requirements applicable to us, see “Item 4.B. Business Overview — Supervision and Regulation — Principal Regulations Applicable to Financial Holding Companies — Capital Adequacy.”
If, despite our efforts to adapt to the changing macroeconomic environment and comply with new regulations, we are unable to compete effectively in the changing business and regulatory environment, our profit margin and market share may erode and our future growth opportunities may become limited, which could adversely affect our business, financial condition and results of operations. See “Item 3.D. Risk Factors — Risks Relating to Our Overall Business — Competition in the Korean financial services industry is intense, and may further intensify” and “— Supervision and Regulation.”
83
Description of Assets and Liabilities
Loans
As of December 31, 2022, our total gross loan portfolio was W417,827 billion, which represented an increase of 6.2% from W393,474 billion on December 31, 2021. The increase in our portfolio primarily reflects a 9.8 % increase in corporate loans and an 0.9% increase in retail loans.
Asset Quality Ratios
|
|
|
|
|
|
|
|
|
|
|
|
|
| |
|
As of December 31, |
|
| |
|
2020 |
|
|
2021 |
|
|
2022 |
|
| |
|
|
|
|
|
|
|
|
|
| |
|
(In billions of Won, except percentages) |
|
| Total gross loans |
|
W |
360,804 |
|
|
W |
393,474 |
|
|
W |
417,827 |
|
| Total allowance for credit losses on loans |
|
W |
3,061 |
|
|
W |
3,167 |
|
|
W |
3,651 |
|
| Allowance for credit losses on loans as a percentage of total loans |
|
|
0.85 |
% |
|
|
0.80 |
% |
|
|
0.87 |
% |
| Impaired loans(1) |
|
W |
2,011 |
|
|
W |
1,864 |
|
|
W |
2,084 |
|
| Impaired loans as a percentage of total loans |
|
|
0.56 |
% |
|
|
0.47 |
% |
|
|
0.50 |
% |
| Allowance as a percentage of impaired loans |
|
|
152.21 |
% |
|
|
169.90 |
% |
|
|
175.19 |
% |
| Total non-performing loans(2) |
|
W |
1,689 |
|
|
W |
1,826 |
|
|
W |
2,028 |
|
| Non-performing loans as a percentage of total loans |
|
|
0.47 |
% |
|
|
0.46 |
% |
|
|
0.49 |
% |
| Allowance as a percentage of total assets |
|
|
0.51 |
% |
|
|
0.49 |
% |
|
|
0.54 |
% |
Notes:
| (1) |
Impaired loans include (i) loans for which the borrower has defaulted under Basel standards applicable during the relevant period and (ii) loans that qualify as “troubled debt restructurings” applicable during the relevant period. |
| (2) |
Non-performing loans are defined as loans, whether corporate or retail, that are past due more than 90 days. |
Loan Types
The following table presents our loans by type as of the dates indicated. Except where specified otherwise, all loan amounts stated below are before deduction of allowance for credit losses on loans. Total loans reflect our loan portfolio, including past due amounts.
|
|
|
|
|
|
|
|
|
|
|
|
|
| |
|
As of December 31, |
|
| |
|
2020(6) |
|
|
2021(6) |
|
|
2022(6) |
|
| |
|
|
|
|
|
|
|
|
|
| |
|
(In billions of Won) |
|
| Domestic: |
|
|
|
|
| Corporate |
|
|
|
|
|
|
|
|
|
|
|
|
| Corporate loans(1) |
|
W |
159,833 |
|
|
W |
178,315 |
|
|
W |
194,749 |
|
| Public and other(2) |
|
|
3,735 |
|
|
|
3,469 |
|
|
|
3,897 |
|
| Loans to banks(3) |
|
|
1,419 |
|
|
|
862 |
|
|
|
1,205 |
|
| Lease financing |
|
|
1,689 |
|
|
|
1,497 |
|
|
|
682 |
|
|
|
|
|
|
|
|
|
|
|
|
|
|
| Total — Corporate |
|
|
166,676 |
|
|
|
184,143 |
|
|
|
200,533 |
|
|
|
|
|
|
|
|
|
|
|
|
|
|
| Retail |
|
|
|
|
|
|
|
|
|
|
|
|
| Mortgages and home equity |
|
|
72,345 |
|
|
|
79,018 |
|
|
|
80,937 |
|
| Other retail(4) |
|
|
65,627 |
|
|
|
69,459 |
|
|
|
67,571 |
|
|
|
|
|
|
|
|
|
|
|
|
|
|
| Total — Retail |
|
|
137,972 |
|
|
|
148,477 |
|
|
|
148,508 |
|
|
|
|
|
|
|
|
|
|
|
|
|
|
| Credit cards |
|
|
23,598 |
|
|
|
25,817 |
|
|
|
20,388 |
|
|
|
|
|
|
|
|
|
|
|
|
|
|
| Total domestic |
|
|
328,246 |
|
|
|
358,437 |
|
|
|
369,429 |
|
|
|
|
|
|
|
|
|
|
|
|
|
|
84
|
|
|
|
|
|
|
|
|
|
|
|
|
| |
|
As of December 31, |
|
| |
|
2020(6) |
|
|
2021(6) |
|
|
2022(6) |
|
| |
|
|
|
|
|
|
|
|
|
| |
|
(In billions of Won) |
|
| Foreign: |
|
|
|
|
|
|
|
|
|
|
|
|
| Corporate |
|
|
|
|
|
|
|
|
|
|
|
|
| Corporate loans(1) |
|
|
19,422 |
|
|
|
21,244 |
|
|
|
22,080 |
|
| Public and other(2) |
|
|
— |
|
|
|
— |
|
|
|
— |
|
| Loans to banks(3) |
|
|
4,073 |
|
|
|
2,988 |
|
|
|
6,224 |
|
| Lease financing |
|
|
84 |
|
|
|
93 |
|
|
|
113 |
|
|
|
|
|
|
|
|
|
|
|
|
|
|
| Total — Corporate |
|
|
23,579 |
|
|
|
24,325 |
|
|
|
28,417 |
|
|
|
|
|
|
|
|
|
|
|
|
|
|
| Retail |
|
|
|
|
|
|
|
|
|
|
|
|
| Mortgages and home equity |
|
|
843 |
|
|
|
842 |
|
|
|
787 |
|
| Other retail(4) |
|
|
7,975 |
|
|
|
9,687 |
|
|
|
11,122 |
|
|
|
|
|
|
|
|
|
|
|
|
|
|
| Total — Retail |
|
|
8,818 |
|
|
|
10,529 |
|
|
|
11,909 |
|
|
|
|
|
|
|
|
|
|
|
|
|
|
| Credit cards |
|
|
161 |
|
|
|
183 |
|
|
|
8,072 |
|
|
|
|
|
|
|
|
|
|
|
|
|
|
| Total foreign |
|
|
32,558 |
|
|
|
35,037 |
|
|
|
48,398 |
|
|
|
|
|
|
|
|
|
|
|
|
|
|
| Total loans(5) |
|
W |
360,804 |
|
|
W |
393,474 |
|
|
W |
417,827 |
|
|
|
|
|
|
|
|
|
|
|
|
|
|
Notes:
| (1) |
Consists primarily of working capital loans, general purpose loans, bills purchased and trade-related notes and excludes loans to public institutions and commercial banks. |
| (2) |
Consists of working capital loans and loan facilities to public institutions and non-profit organizations. |
| (3) |
Consists of interbank loans and call loans. |
| (4) |
Consists of general unsecured loans and loans secured by collateral other than housing to retail customers. |
| (5) |
As of December 31, 2020, 2021 and 2022, 87.5%, 87.0% and 86.1% of our total gross loans, respectively, were Won-denominated. |
| (6) |
Loan amounts include loans at amortized cost and loans at fair value classified in accordance with IFRS 9. Corporate loans include loans at fair value in the amount of W2,017 billion, W1,683 billion and W2,389 billion as of December 31, 2020, 2021 and 2022, respectively. |
Loan Portfolio
The total exposure of us or our banking subsidiaries to any single borrower and exposure to any single group of companies belonging to the same conglomerate is limited by law to 25% of the Net Total Equity Capital (as defined in “— Supervision and Regulation”).
85
Twenty Largest Exposures by Individual Borrower
As of December 31, 2022, our 20 largest exposures, consisting of loans, securities and guarantees and acceptances, totaled W84,780.2 billion. The following table sets forth our total exposures to these top 20 borrowers as of December 31, 2022.
|
|
|
|
|
|
|
|
|
|
|
|
|
|
|
|
|
|
|
|
|
|
|
|
|
| |
|
As of December 31, 2022 |
|
| |
|
Loans in
Won
Currency |
|
|
Loans in
Foreign
Currency |
|
|
Securities |
|
|
Guarantees
and
Acceptances |
|
|
Others |
|
|
Total
Exposure |
|
| |
|
|
|
|
|
|
|
|
|
|
|
|
|
|
|
|
|
|
| |
|
(In billions of Won) |
|
| Ministry of Economy & Finance |
|
W |
0.0 |
|
|
W |
— |
|
|
W |
34,240.9 |
|
|
W |
— |
|
|
W |
— |
|
|
W |
34,240.9 |
|
| Korea Housing Finance Corporation |
|
|
0.0 |
|
|
|
— |
|
|
|
9,027.9 |
|
|
|
— |
|
|
|
— |
|
|
|
9,027.9 |
|
| Korea Development Bank |
|
|
0.9 |
|
|
|
126.7 |
|
|
|
6,991.5 |
|
|
|
— |
|
|
|
— |
|
|
|
7,119.1 |
|
| Bank of Korea |
|
|
0.0 |
|
|
|
— |
|
|
|
7,057.0 |
|
|
|
0.1 |
|
|
|
— |
|
|
|
7,057.1 |
|
| Industrial Bank of Korea |
|
|
335.9 |
|
|
|
228.1 |
|
|
|
4,616.5 |
|
|
|
— |
|
|
|
— |
|
|
|
5,180.6 |
|
| Export-Import Bank of Korea |
|
|
— |
|
|
|
25.3 |
|
|
|
2,455.4 |
|
|
|
70.2 |
|
|
|
— |
|
|
|
2,551.0 |
|
| LG Display |
|
|
355.6 |
|
|
|
836.8 |
|
|
|
149.7 |
|
|
|
669.6 |
|
|
|
— |
|
|
|
2,011.8 |
|
| United States of America |
|
|
— |
|
|
|
— |
|
|
|
1,888.1 |
|
|
|
— |
|
|
|
— |
|
|
|
1,888.1 |
|
| Woori Bank |
|
|
941.0 |
|
|
|
25.3 |
|
|
|
639.1 |
|
|
|
— |
|
|
|
— |
|
|
|
1,605.5 |
|
| Nong Hyup Bank |
|
|
599.5 |
|
|
|
138.5 |
|
|
|
664.3 |
|
|
|
64.4 |
|
|
|
— |
|
|
|
1,466.8 |
|
| Korea Land & Housing Corporation |
|
|
0.0 |
|
|
|
— |
|
|
|
1,450.6 |
|
|
|
— |
|
|
|
— |
|
|
|
1,450.6 |
|
| Korea Expressway Corporation |
|
|
0.0 |
|
|
|
— |
|
|
|
1,374.5 |
|
|
|
— |
|
|
|
— |
|
|
|
1,374.5 |
|
| KEB Hana Bank |
|
|
557.5 |
|
|
|
187.1 |
|
|
|
584.8 |
|
|
|
31.4 |
|
|
|
— |
|
|
|
1,360.8 |
|
| NH Investment & Securities |
|
|
815.2 |
|
|
|
— |
|
|
|
529.1 |
|
|
|
— |
|
|
|
— |
|
|
|
1,344.3 |
|
| Korea Electric Power Corporation |
|
|
0.3 |
|
|
|
— |
|
|
|
1,207.1 |
|
|
|
39.5 |
|
|
|
— |
|
|
|
1,246.9 |
|
| KB Bank |
|
|
516.2 |
|
|
|
104.9 |
|
|
|
597.3 |
|
|
|
21.2 |
|
|
|
— |
|
|
|
1,239.5 |
|
| Hyundai Steel |
|
|
340.7 |
|
|
|
458.6 |
|
|
|
381.5 |
|
|
|
22.6 |
|
|
|
0.0 |
|
|
|
1,203.5 |
|
| SK Hynix |
|
|
733.5 |
|
|
|
190.1 |
|
|
|
237.2 |
|
|
|
9.5 |
|
|
|
— |
|
|
|
1,170.3 |
|
| Lotte Hotel |
|
|
100.5 |
|
|
|
375.5 |
|
|
|
320.8 |
|
|
|
362.7 |
|
|
|
— |
|
|
|
1,159.4 |
|
| Mirae Asset Securities |
|
|
400.3 |
|
|
|
31.7 |
|
|
|
649.7 |
|
|
|
— |
|
|
|
— |
|
|
|
1,081.7 |
|
|
|
|
|
|
|
|
|
|
|
|
|
|
|
|
|
|
|
|
|
|
|
|
|
|
| Total |
|
W |
5,697.4 |
|
|
W |
2,728.7 |
|
|
W |
75,063.0 |
|
|
W |
1,291.1 |
|
|
W |
0.0 |
|
|
W |
84,780.2 |
|
|
|
|
|
|
|
|
|
|
|
|
|
|
|
|
|
|
|
|
|
|
|
|
|
|
86
Exposure to Main Debtor Groups
As of December 31, 2022, our total exposure to the main debtor groups as identified by the Governor of the Financial Supervisory Service amounted to W33,007.3 billion. The main debtor groups are largely comprised of chaebols. The following table shows, As of December 31, 2022, our total exposures to the 10 main debtor groups to which we have the largest exposure.
|
|
|
|
|
|
|
|
|
|
|
|
|
|
|
|
|
|
|
|
|
|
|
|
|
| |
|
As of December 31, 2022 |
|
| Main Debtor Groups |
|
Loans in
Won
Currency |
|
|
Loans in
Foreign
Currency |
|
|
Securities |
|
|
Guarantees
and
Acceptances |
|
|
Others |
|
|
Total
Exposure |
|
| |
|
|
|
|
|
|
|
|
|
|
|
|
|
|
|
|
|
|
| |
|
(In billions of Won) |
|
| Hyundai Motors |
|
W |
904.8 |
|
|
W |
2,879.4 |
|
|
W |
1,786.6 |
|
|
W |
670.5 |
|
|
W |
0.1 |
|
|
W |
6,241.4 |
|
| Samsung |
|
|
485.4 |
|
|
|
1,500.3 |
|
|
|
1,311.7 |
|
|
|
1,701.8 |
|
|
|
0.0 |
|
|
|
4,999.2 |
|
| SK |
|
|
1,730.9 |
|
|
|
930.1 |
|
|
|
1,479.5 |
|
|
|
495.6 |
|
|
|
0.0 |
|
|
|
4,636.1 |
|
| Lotte |
|
|
582.1 |
|
|
|
851.3 |
|
|
|
1,646.5 |
|
|
|
793.4 |
|
|
|
0.0 |
|
|
|
3,873.2 |
|
| LG |
|
|
768.7 |
|
|
|
1,027.6 |
|
|
|
974.7 |
|
|
|
1,031.3 |
|
|
|
0.0 |
|
|
|
3,802.3 |
|
| Hyundai Heavy Industries |
|
|
143.8 |
|
|
|
199.3 |
|
|
|
275.8 |
|
|
|
2,046.2 |
|
|
|
0.0 |
|
|
|
2,665.2 |
|
| LS |
|
|
318.3 |
|
|
|
762.8 |
|
|
|
199.9 |
|
|
|
877.5 |
|
|
|
0.0 |
|
|
|
2,158.5 |
|
| Hanwha |
|
|
213.9 |
|
|
|
431.3 |
|
|
|
861.9 |
|
|
|
623.2 |
|
|
|
0.0 |
|
|
|
2,130.3 |
|
| GS |
|
|
99.2 |
|
|
|
370.3 |
|
|
|
404.3 |
|
|
|
379.5 |
|
|
|
0.0 |
|
|
|
1,253.4 |
|
| KT |
|
|
132.1 |
|
|
|
126.1 |
|
|
|
785.9 |
|
|
|
203.8 |
|
|
|
0.0 |
|
|
|
1,247.9 |
|
|
|
|
|
|
|
|
|
|
|
|
|
|
|
|
|
|
|
|
|
|
|
|
|
|
| Total |
|
W |
5,379.2 |
|
|
W |
9,078.5 |
|
|
W |
9,726.7 |
|
|
W |
8,822.8 |
|
|
W |
0.1 |
|
|
W |
33,007.3 |
|
|
|
|
|
|
|
|
|
|
|
|
|
|
|
|
|
|
|
|
|
|
|
|
|
|
Loan Concentration by Industry
The following table shows the aggregate balance of our corporate loans by industry concentration as of December 31, 2022.
|
|
|
|
|
|
|
|
|
| |
|
As of December 31, 2022 |
|
| Industry |
|
Aggregate Loan
Balance |
|
|
Percentage of Total
Corporate Loan Balance |
|
| |
|
|
|
|
|
|
| |
|
(In billions of Won) |
|
|
(Percentages) |
|
| Manufacturing |
|
W |
60,967 |
|
|
|
26.6 |
% |
| Real estate, leasing and service |
|
|
49,915 |
|
|
|
21.8 |
|
| Retail and wholesale |
|
|
28,364 |
|
|
|
12.4 |
|
| Finance and insurance |
|
|
25,260 |
|
|
|
11.0 |
|
| Transportation, storage and communication |
|
|
5,921 |
|
|
|
2.6 |
|
| Hotel and leisure |
|
|
9,927 |
|
|
|
4.3 |
|
| Construction |
|
|
5,057 |
|
|
|
2.2 |
|
| Other service(1) |
|
|
25,360 |
|
|
|
11.1 |
|
| Other(2) |
|
|
18,179 |
|
|
|
8.0 |
|
|
|
|
|
|
|
|
|
|
| Total |
|
W |
228,950 |
|
|
|
100 |
% |
|
|
|
|
|
|
|
|
|
Notes:
| (1) |
Includes other service industries such as publication, media and education. |
| (2) |
Includes other industries such as agriculture, forestry, mining, electricity and gas. |
Maturity Analysis
The following table sets out the scheduled maturities (presented in terms of time remaining until maturity) of our loan portfolio as of December 31, 2022. The amounts below are before allowance for credit losses on
87
loans and deferred loan origination costs and fees. In the case of installment payment loans, maturities have been adjusted to take into account the timing of installment payments.
|
|
|
|
|
|
|
|
|
|
|
|
|
|
|
|
|
|
|
|
|
| |
|
As of December 31, 2022 |
|
| |
|
1 Year or Less |
|
|
Over 1 Year but
Not More Than
5 Years |
|
|
Over 5 Year but
Not More Than
15 Years |
|
|
Over 15
Years(1) |
|
|
Total |
|
| |
|
|
|
|
|
|
|
|
|
|
|
|
|
|
|
| |
|
(In billions of Won) |
|
| Corporate: |
|
|
|
|
|
|
|
|
|
|
|
|
|
|
|
|
|
|
|
|
| Corporate loans |
|
W |
136,186 |
|
|
W |
72,765 |
|
|
W |
6,941 |
|
|
W |
937 |
|
|
W |
216,829 |
|
| Public and other |
|
|
2,318 |
|
|
|
1,198 |
|
|
|
280 |
|
|
|
101 |
|
|
|
3,897 |
|
| Loans to banks |
|
|
7,128 |
|
|
|
229 |
|
|
|
72 |
|
|
|
— |
|
|
|
7,429 |
|
| Lease financing |
|
|
243 |
|
|
|
547 |
|
|
|
5 |
|
|
|
— |
|
|
|
795 |
|
|
|
|
|
|
|
|
|
|
|
|
|
|
|
|
|
|
|
|
|
|
| Total corporate |
|
W |
145,875 |
|
|
W |
74,739 |
|
|
W |
7,298 |
|
|
W |
1,038 |
|
|
W |
228,950 |
|
|
|
|
|
|
|
|
|
|
|
|
|
|
|
|
|
|
|
|
|
|
| Retail: |
|
|
|
|
|
|
|
|
|
|
|
|
|
|
|
|
|
|
|
|
| Mortgage and home equity |
|
W |
17,491 |
|
|
W |
22,792 |
|
|
W |
17,779 |
|
|
W |
23,662 |
|
|
W |
81,724 |
|
| Other retail |
|
|
44,479 |
|
|
|
20,533 |
|
|
|
4,459 |
|
|
|
9,222 |
|
|
|
78,693 |
|
|
|
|
|
|
|
|
|
|
|
|
|
|
|
|
|
|
|
|
|
|
| Total retail |
|
W |
61,970 |
|
|
W |
43,325 |
|
|
W |
22,238 |
|
|
W |
32,884 |
|
|
W |
160,417 |
|
|
|
|
|
|
|
|
|
|
|
|
|
|
|
|
|
|
|
|
|
|
| Credit cards |
|
W |
24,175 |
|
|
W |
4,027 |
|
|
W |
258 |
|
|
W |
— |
|
|
W |
28,460 |
|
|
|
|
|
|
|
|
|
|
|
|
|
|
|
|
|
|
|
|
|
|
| Total loans |
|
W |
232,020 |
|
|
W |
122,091 |
|
|
W |
29,794 |
|
|
W |
33,922 |
|
|
W |
417,827 |
|
|
|
|
|
|
|
|
|
|
|
|
|
|
|
|
|
|
|
|
|
|
Note:
| (1) |
Includes overdue loans. |
We may roll over our corporate loans (primarily consisting of working capital loans and facility loans) and retail loans (to the extent not payable in installments) after we conduct our standard loan reviews in accordance with our loan review procedures. Working capital loans may generally be extended on an annual basis for an aggregate term of up to five years. Facilities loans, which are generally secured, may generally be extended on an annual basis for a maximum of 15 years from the initial loan date. Retail loans may be extended for additional terms of up to 12 months for an aggregate term of ten years from the initial loan date for both unsecured loans and secured loans other than mortgages and home equity loans which can be extended up to 30 years in aggregate.
88
Interest Rate Sensitivity
The following table presents a breakdown of our loans in terms of interest rate sensitivity as of December 31, 2022.
|
|
|
|
|
|
|
|
|
|
|
|
|
| |
|
As of December 31, 2022 |
|
| |
|
Due Within 1 Year |
|
|
Due After 1 Year |
|
|
Total |
|
| |
|
|
|
|
|
|
|
|
|
| |
|
(In billions of Won) |
|
| Fixed rate loans(1) |
|
|
|
|
|
|
|
|
|
|
|
|
| Corporate: |
|
|
|
|
|
|
|
|
|
|
|
|
| Corporate loans |
|
W |
58,984 |
|
|
W |
30,139 |
|
|
W |
89,123 |
|
| Public and other |
|
|
927 |
|
|
|
352 |
|
|
|
1,279 |
|
| Loans to banks |
|
|
6,924 |
|
|
|
276 |
|
|
|
7,200 |
|
| Lease financing |
|
|
65 |
|
|
|
65 |
|
|
|
130 |
|
|
|
|
|
|
|
|
|
|
|
|
|
|
| Total corporate |
|
|
66,900 |
|
|
|
30,832 |
|
|
|
97,732 |
|
|
|
|
|
|
|
|
|
|
|
|
|
|
| Retail: |
|
|
|
|
|
|
|
|
|
|
|
|
| Mortgage and home equity |
|
|
137 |
|
|
|
3,015 |
|
|
|
3,152 |
|
| Other retail |
|
|
6,516 |
|
|
|
6,955 |
|
|
|
13,471 |
|
|
|
|
|
|
|
|
|
|
|
|
|
|
| Total retail |
|
|
6,653 |
|
|
|
9,970 |
|
|
|
16,623 |
|
|
|
|
|
|
|
|
|
|
|
|
|
|
| Credit cards |
|
|
233 |
|
|
|
2 |
|
|
|
235 |
|
|
|
|
|
|
|
|
|
|
|
|
|
|
| Total fixed rate loans |
|
|
73,786 |
|
|
|
40,804 |
|
|
|
114,590 |
|
|
|
|
|
|
|
|
|
|
|
|
|
|
|
|
|
|
| Variable rate loans(2) |
|
|
|
|
|
|
|
|
|
|
|
|
| Corporate: |
|
|
|
|
|
|
|
|
|
|
|
|
| Corporate loans |
|
|
77,202 |
|
|
|
50,504 |
|
|
|
127,706 |
|
| Public and other |
|
|
1,391 |
|
|
|
1,227 |
|
|
|
2,618 |
|
| Loans to banks |
|
|
204 |
|
|
|
25 |
|
|
|
229 |
|
| Lease financing |
|
|
178 |
|
|
|
487 |
|
|
|
665 |
|
|
|
|
|
|
|
|
|
|
|
|
|
|
| Total corporate |
|
|
78,975 |
|
|
|
52,243 |
|
|
|
131,218 |
|
|
|
|
|
|
|
|
|
|
|
|
|
|
| Retail: |
|
|
|
|
|
|
|
|
|
|
|
|
| Mortgage and home equity |
|
|
17,354 |
|
|
|
61,218 |
|
|
|
78,572 |
|
| Other retail |
|
|
37,963 |
|
|
|
27,259 |
|
|
|
65,222 |
|
|
|
|
|
|
|
|
|
|
|
|
|
|
| Total retail |
|
|
55,317 |
|
|
|
88,477 |
|
|
|
143,794 |
|
|
|
|
|
|
|
|
|
|
|
|
|
|
| Credit cards |
|
|
23,942 |
|
|
|
4,283 |
|
|
|
28,225 |
|
|
|
|
|
|
|
|
|
|
|
|
|
|
| Total variable rate loans |
|
|
158,234 |
|
|
|
145,003 |
|
|
|
303,237 |
|
|
|
|
|
|
|
|
|
|
|
|
|
|
| Total loans |
|
W |
232,020 |
|
|
W |
185,807 |
|
|
W |
417,827 |
|
|
|
|
|
|
|
|
|
|
|
|
|
|
Notes:
| (1) |
Fixed rate loans are loans for which the interest rate is fixed for the entire term of the loan. |
| (2) |
Variable or adjustable rate loans are for which the interest rate is not fixed for the entire term of the loan. |
For additional information regarding our management of interest rate risk, see “— Risk Management.”
Nonaccrual Loans and Past Due Accruing Loans
Except in the case of repurchased loans, we generally recognize interest income on nonaccrual loans using the rate of interest used to discount the future cash flows of such loans for the purpose of measuring impairment
89
loss. Generally, we discontinue accruing of interest on loans (other than repurchased loans) when payment of interest and/or principal becomes past due by 90 days. Loans (other than repurchased loans) are not reclassified as accruing until interest and principal payments are brought current.
We generally do not request borrowers to make immediate repayment of the whole outstanding principal balances and related accrued interest on loans whose interest payments are past due up to 14 days, 60 days, and 30 days in the case of commercial loans, mortgages and home equity loans and other retail loan, respectively.
Interest foregone is interest due on nonaccrual loans that has not been accrued in our books of account. In 2020, 2021 and 2022, we would have recorded gross interest income of W 59 billion, W66 billion and W92 billion, respectively, on loans accounted for on a nonaccrual basis throughout the respective years, or since origination for loans held for part of the year, had the loans been current with respect to their original contractual terms. The amount of interest income on those loans that was included in our net income in 2019, 2020 and 2021 were W33 billion, W30 billion and W46 billion, respectively.
The following table shows, at the dates indicated, the amount of loans that are placed on a nonaccrual basis and accruing loans which are past due one day or more. The term “accruing but past due one day” includes loans which are still accruing interest but on which principal or interest payments are contractually past due one day or more. We continue to accrue interest on loans where the total amount of loan outstanding, including accrued interest, is fully secured by cash on deposits.
|
|
|
|
|
|
|
|
|
|
|
|
|
| |
|
As of December 31, |
|
| |
|
2020 |
|
|
2021 |
|
|
2022 |
|
| |
|
|
|
|
|
|
|
|
|
| |
|
(In billions of Won) |
|
| Loans accounted for on a nonaccrual basis(1) |
|
|
|
|
|
|
|
|
|
|
|
|
| Domestic: |
|
|
|
|
|
|
|
|
|
|
|
|
| Corporate |
|
W |
874 |
|
|
W |
780 |
|
|
W |
848 |
|
| Retail |
|
|
438 |
|
|
|
384 |
|
|
|
521 |
|
| Credit cards |
|
|
88 |
|
|
|
68 |
|
|
|
74 |
|
| Foreign: |
|
|
|
|
|
|
|
|
|
|
|
|
| Corporate |
|
|
265 |
|
|
|
340 |
|
|
|
432 |
|
| Retail |
|
|
29 |
|
|
|
43 |
|
|
|
36 |
|
| Credit cards |
|
|
18 |
|
|
|
44 |
|
|
|
35 |
|
|
|
|
|
|
|
|
|
|
|
|
|
|
| Sub-total |
|
|
1,712 |
|
|
|
1,659 |
|
|
|
1,946 |
|
|
|
|
|
|
|
|
|
|
|
|
|
|
| Accruing loans which are contractually past due one day or more as to principal or interest |
|
|
|
|
|
|
|
|
|
|
|
|
| Domestic: |
|
|
|
|
|
|
|
|
|
|
|
|
| Corporate |
|
|
279 |
|
|
|
114 |
|
|
|
256 |
|
| Retail |
|
|
609 |
|
|
|
550 |
|
|
|
912 |
|
| Credit cards |
|
|
413 |
|
|
|
344 |
|
|
|
610 |
|
| Foreign: |
|
|
|
|
|
|
|
|
|
|
|
|
| Corporate |
|
|
50 |
|
|
|
51 |
|
|
|
34 |
|
| Retail |
|
|
52 |
|
|
|
44 |
|
|
|
55 |
|
| Credit cards |
|
|
18 |
|
|
|
39 |
|
|
|
45 |
|
|
|
|
|
|
|
|
|
|
|
|
|
|
| Sub-total |
|
|
1,421 |
|
|
|
1,142 |
|
|
|
1,912 |
|
|
|
|
|
|
|
|
|
|
|
|
|
|
| Total |
|
W |
3,133 |
|
|
W |
2,801 |
|
|
W |
3,858 |
|
|
|
|
|
|
|
|
|
|
|
|
|
|
Note:
| (1) |
“Troubled debt restructuring” and loans for which payment of interest and/or principal became past due by 90 days or more (adjusting for any overlap due to loans that satisfy both prongs so as to avoid double counting) may be included in loans accounted for on a nonaccrual basis. |
90
Troubled Debt Restructurings
The following table presents, at the dates indicated, our loans which are “troubled debt restructurings.” These loans mainly consist of corporate loans that have been restructured through the process of workout and recovery proceedings. See “— Credit Exposures to Companies in Workout and Recovery Proceedings.” These loans accrue interest at rates lower than the original contractual terms, or involve the extension of the original contractual maturity as a result of a variation of terms upon restructuring.
|
|
|
|
|
|
|
|
|
|
|
|
|
| |
|
As of December 31, |
|
| |
|
2020 |
|
|
2021 |
|
|
2022 |
|
| |
|
|
|
|
|
|
|
|
|
| |
|
(In billions of Won) |
|
| Loans classified as “troubled debt restructurings” (excluding nonaccrual and past due loans) |
|
W |
96 |
|
|
W |
91 |
|
|
W |
30 |
|
| Loans classified as “troubled debt restructurings” (including nonaccrual and past due loans) |
|
W |
290 |
|
|
W |
237 |
|
|
W |
143 |
|
The following table presents, for the periods indicated and with respect to the restructured loans, the amounts that would have been recorded as our interest income under the original contract terms of the restructured loans, and the amounts that were actually recorded as our interest income for such loans under the restructured contractual terms of such loans.
|
|
|
|
|
|
|
|
|
|
|
|
|
| |
|
As of December 31, |
|
| |
|
2020 |
|
|
2021 |
|
|
2022 |
|
| |
|
|
|
|
|
|
|
|
|
| |
|
(In billions of Won) |
|
| Interest income under the original contractual terms of the restructured loans(1) |
|
W |
13 |
|
|
W |
10 |
|
|
W |
7 |
|
| Interest income under the restructured contractual terms of the restructured loans(1) |
|
W |
3 |
|
|
W |
2 |
|
|
W |
2 |
|
Note:
| (1) |
Includes nonaccrual and past due loans. |
The following table presents a breakdown of the outstanding balance and specific allowance for credit losses on loans as of December 31, 2020, 2021 and 2022 of corporate loans classified as “troubled debt restructurings” (including nonaccrual and past due loans) by the type of restructuring to which such loans are subject.
|
|
|
|
|
|
|
|
|
|
|
|
|
|
|
|
|
|
|
|
|
|
|
|
|
| |
|
As of December 31, |
|
| |
|
2020 |
|
|
2021 |
|
|
2022 |
|
| |
|
Outstanding
Balance |
|
|
Allowance |
|
|
Outstanding
Balance |
|
|
Allowance |
|
|
Outstanding
Balance |
|
|
Allowance |
|
| |
|
|
|
|
|
|
|
|
|
|
|
|
|
|
|
|
|
|
| |
|
(In billions of Won) |
|
| Workout |
|
W |
190 |
|
|
W |
86 |
|
|
W |
160 |
|
|
W |
54 |
|
|
W |
65 |
|
|
W |
32 |
|
| Recovery Proceedings |
|
|
95 |
|
|
|
28 |
|
|
|
74 |
|
|
|
24 |
|
|
|
74 |
|
|
|
18 |
|
| Others(1) |
|
|
5 |
|
|
|
5 |
|
|
|
3 |
|
|
|
— |
|
|
|
4 |
|
|
|
3 |
|
|
|
|
|
|
|
|
|
|
|
|
|
|
|
|
|
|
|
|
|
|
|
|
|
|
| Total |
|
W |
290 |
|
|
W |
119 |
|
|
W |
237 |
|
|
W |
78 |
|
|
W |
143 |
|
|
W |
53 |
|
|
|
|
|
|
|
|
|
|
|
|
|
|
|
|
|
|
|
|
|
|
|
|
|
|
Note:
| (1) |
Principally consists of loans subject to corporate turnaround or corporate reorganization pursuant to the Debtor Rehabilitation and Bankruptcy Act (also known as the Consolidated Insolvency Act). |
The following table presents the outstanding balance and specific allowance for credit losses on loans as of December 31, 2020, 2021 and 2022 of retail loans (including nonaccrual and past due loans) subject to credit rehabilitation programs for retail borrowers. All such loans became modified under credit rehabilitation programs and became beneficiaries of maturity extension and interest rate reductions, while a substantially limited portion of such loans also became beneficiaries of debt forgiveness and deferral. For more information on the credit
91
rehabilitation program, see “— Credit Exposures to Companies in Workout and Recovery Proceedings — Credit Rehabilitation Programs for Delinquent Consumer and Small- and Medium-sized Enterprise Borrowers.”
|
|
|
|
|
|
|
|
|
|
|
|
|
|
|
|
|
|
|
|
|
|
|
|
|
| |
|
As of December 31, |
|
| |
|
2020 |
|
|
2021 |
|
|
2022 |
|
| |
|
Outstanding
Balance |
|
|
Allowance |
|
|
Outstanding
Balance |
|
|
Allowance |
|
|
Outstanding
Balance |
|
|
Allowance |
|
| |
|
|
|
|
|
|
|
|
|
|
|
|
|
|
|
|
|
|
| |
|
(In billions of Won) |
|
| Retail loans subject to credit rehabilitation programs(1) |
|
W |
148 |
|
|
W |
81 |
|
|
W |
125 |
|
|
W |
49 |
|
|
W |
249 |
|
|
W |
129 |
|
Note:
| (1) |
Includes nonaccrual and past due loans. |
The following table presents, as of the dates indicated and with respect to corporate loans, the amounts of restructured loans that were considered impaired and classified as nonaccrual pursuant to our general interest accrual policy as described in “— Accrual Policy for Restructured Loans.” The table also presents, for the periods indicated and with respect to corporate loans, the amounts of total charge-off on restructured loans and the amounts of charge-off as part of debt-to-equity conversions.
|
|
|
|
|
|
|
|
|
|
|
|
|
| |
|
As of and for the year ended December 31, |
|
| |
|
2020 |
|
|
2021 |
|
|
2022 |
|
| |
|
|
|
|
|
|
|
|
|
| |
|
(In billions of Won) |
|
| Impaired and nonaccrual restructured loans |
|
W |
194 |
|
|
W |
146 |
|
|
W |
113 |
|
| Total charge-off of restructured loans |
|
W |
80 |
|
|
W |
58 |
|
|
W |
16 |
|
| Charge-off as part of debt-to-equity conversion |
|
W |
59 |
|
|
W |
32 |
|
|
W |
— |
|
Credit Exposures to Companies in Workout and Recovery Proceedings
Our credit exposures to restructuring are monitored and managed by our Corporate Credit Support Department. As of December 31, 2022, 0.03% of our total loans, or W143 billion (of which W113 billion was classified as nonaccrual and W30 billion was classified as accruing), was under restructuring. Restructuring of our credit exposures generally takes the form of workout and recovery proceedings.
Workout
The original Corporate Restructuring Promotion Act (Act No. 6504) was enacted on August 14, 2001 in order to facilitate the out-of-court restructuring of insolvent companies. This law expired on December 31, 2005, and new Corporate Restructuring Promotion Acts were enacted on August 3, 2007 (expired on December 31, 2010), May 19, 2011 (expired on December 31, 2013), January 1, 2014 (expired on December 31, 2015), March 18, 2016 (expired on June 30, 2018) and October 16, 2018 (to be expired on October 15, 2023, the new CRPA enacted and implemented on October 16, 2018 is hereinafter referred to as the “CRPA”).
If the ‘main Creditor Financial Institution’ of a Failing Company provided notice of convening a Creditor Committee (defined below) on or before October 15, 2023, any proceedings commenced by such Creditor Committee will remain subject to the CRPA even after October 15, 2023 unless and until such proceedings are completed or discontinued.
The following is a summary of the key provisions of the CRPA. The CRPA applies to a financial creditor (the “Financial Creditor”) who has financial claims against a debtor company by ‘providing credit’ to such debtor company or other third parties. “Provision of Credit” is defined in the CRPA as any transaction determined by the Financial Supervisory Commission to fall under any of the following:
| |
• |
|
purchase of promissory notes and debentures or bonds; |
92
| |
• |
|
providing advance payments on acceptances and guarantees under a payment guarantee; |
| |
• |
|
any direct or indirect financial transaction which may cause a loss to a counterparty as a consequence of a payment failure by a debtor company; or |
| |
• |
|
any transaction other than the transactions set out above which may have in substance the same effect as the transactions set out above. |
The “debtor company” is defined under the CRPA as a company established under the Korean Commercial Code or other person performing profit-making activities. The Failing Company means a debtor company deemed, through a credit evaluation carried out in the manner set out in the CRPA, by its ‘main Creditor Financial Institution’ as having difficulty to repay debts to its financial creditor without external financial support or an additional loan (excluding loans obtained in the course of conducting normal financial transactions).
Once the debtor company is notified by the main Creditor Financial Institution to fall under the definition of Failing Company, such company may submit its business restructuring plan and the list of its Financial Creditors, and apply to such main Creditor Financial Institution for commencement of the management procedure to be assumed by a committee of Financial Creditors (the “Creditor Committee”) or such main Creditor Financial Institution.
Under the CRPA, the main Creditor Financial Institution of a Failing Company is required to take or arrange one of the following actions if it determines that there is a possibility that the financial condition of the Failing Company may be rehabilitated or brought back to normal in accordance with its business restructuring plan:
| |
• |
|
convocation of the first meeting of the Creditor Committee to decide whether to commence the management of the Failing Company by the Creditor Committee; or |
| |
• |
|
assumption of management of the Failing Company by the main Creditor Financial Institution. |
Under the CRPA, in order to call for the first meeting of the Creditor Committee, the main Creditor Financial Institution is required to notify the Financial Creditors, the Failing Company and the Financial Supervisory Service. However, the main Creditor Financial Institution may omit the notification to some extent of the Financial Creditors who are set out in the CRPA such as a Financial Creditor who does not perform the financial business or a Financial Creditor who has only small claims against the Failing Company. The Financial Creditors who do not receive the notification from the main Creditor Financial Institution will be excluded from the Creditor Committee; provided that if they nevertheless want to attend the meeting, the main Creditor Financial Institution may not exclude such Financial Creditors. When the main Creditor Financial Institution calls for the first meeting of the Creditor Committee, it may require the Financial Creditors to grant a moratorium on the enforcement of claims (including the enforcement of security interests) until the end of the first meeting of the Creditor Committee. In addition, at the first meeting of the Creditor Committee, the Financial Creditors may resolve to declare a moratorium for up to one month (or three months if an investigation of the Failing Company’s financial status is necessary) from the commencement date of the management procedure (which may be extended by one additional month by resolutions of the Creditor Committee).
The Financial Creditors who attend the first meeting of the Creditor Committee may resolve, among other things: (i) commencement of the management procedure, (ii) composition of the Financial Creditors who will participate in such management procedure and (iii) declaration of moratorium mentioned above.
Once the management procedure commences, the main Creditor Financial Institution is required to prepare the corporate restructuring plan of the Failing Company considering the investigation results of the Failing Company’s financial status and submit such plan to the Creditor Committee for approval thereof. The corporate
93
restructuring plan may include, among other things, the matters regarding rescheduling of debt owed by the Failing Company, provision of new credit and the business restructuring plan of the Failing Company. If the corporate restructuring plan is not approved by the date the moratorium period ends, the Creditor Committee’s management of the Failing Company shall be deemed to have terminated.
The resolution at the Creditor Committee is generally passed by an approval of the Financial Creditors representing at least 75% of the outstanding credit to the Failing Company of the Financial Creditors who constitute the Creditor Committee; provided that if a single Financial Creditor holds at least 75% of the outstanding credit, the resolution shall be passed by an approval of not less than 40% of the total number of the Financial Creditors who constitute the Creditor Committee, including such single Financial Creditor. An additional approval of the Financial Creditors holding interests in 75% or more of the total amount of the secured claims owned by the Financial Creditors constituting the Creditor Committee against the Failing Company is required with respect to the debt rescheduling of the Failing Company.
A Financial Creditor which has opposed the resolutions of the Creditor Committee in respect of the commencement of management of the Failing Company by the Creditor Committee, establishment of or amendment to the corporate restructuring plan, extension of management procedure, the rescheduling of claims or provision of new credit (the “Opposing Financial Creditor”) may, within seven days of such resolutions, request the main Creditor Financial Institutions to purchase its outstanding claims against the Failing Company, stating the type and number of claims. The Financial Creditors that have approved such resolutions (the “Approving Financial Creditors”) shall jointly purchase such claims within six months of such request.
The purchase price and terms of such purchase shall be determined by mutual agreement of the Approving Financial Creditors and the Opposing Financial Creditor. Pending the agreement of such matters, the payments shall be made at a provisional price, and adjusting payments made once an agreement has been reached. If no such agreement is reached, then such matters shall be determined by the coordination committee established under the CRPA.
Recovery Proceedings
Under the Debtor Rehabilitation and Bankruptcy Act, which took effect on April 1, 2006, court receiverships have been replaced with recovery proceedings. In a recovery proceeding, unlike court receivership proceedings where the management of the debtor company was vested in a court appointed receiver, the existing chief executive officer of the debtor company may continue to manage the debtor company, provided, that (i) neither fraudulent conveyance nor concealment of assets existed, (ii) the financial failure of the debtor company was not due to gross negligence of such chief executive officer, and (iii) no creditors’ meeting was convened to request, based on reasonable cause, a court-appointed receiver to replace such chief executive officer. Recovery proceeding may be commenced by any insolvent debtor. Furthermore, in an effort to meet global standards, international bankruptcy procedures have been introduced in Korea under which a receiver of a foreign bankruptcy proceeding may, upon receiving Korean court approval of the ongoing foreign bankruptcy proceeding, apply for or participate in a Korean bankruptcy proceeding. Similarly, a receiver in a domestic recovery proceeding or a bankruptcy trustee is allowed to perform its duties in a foreign country where an asset of the debtor is located to the extent the applicable foreign law permits.
As of December 31, 2022, the total loan amount subject to recovery proceedings was W74 billion. No loan amount was subject to court receivership or composition proceedings.
Loans in the process of workout and recovery proceedings are reported as nonaccrual loans on our statements of financial position as described in “— Nonaccrual Loans and Past Due Accruing Loans” above since generally, they are past due by more than 90 days and interest does not accrue on such loans. Restructured loans that meet the definition of a troubled debt restructuring are reported as troubled debt restructurings as described above in “— Troubled Debt Restructurings.” Such restructured loans are reported as either loans or securities on our statements of financial position depending on the type of instrument we receive as a result of the restructuring.
94
Credit Rehabilitation Programs for Delinquent Consumer and Small- and Medium-sized Enterprise Borrowers
In light of the gradual increase in delinquencies in credit card and other consumer credit, the Government has implemented a number of measures intended to support the rehabilitation of the credit of delinquent consumer borrowers. These measures may affect the amount and timing of our collections and recoveries on our delinquent consumer credits.
The Credit Counseling and Recovery Service offers two programs for individual debtors, the pre-workout program and the individual workout program, both of which are available to individuals with total debt amounts of W1.5 billion or less (secured debt amount of W1 billion or less and unsecured debt amount of W500 million or less). The pre-workout program is offered to individuals whose delinquency period is between 31 days and 89 days (including those whose delinquency period is between one day and 30 days but with annual income of W40 million or less and cumulative delinquency period of 30 days or more within the year immediately preceding the application date), and the individual workout program is offered to individuals whose delinquency period is three months or more. When an individual debtor applies for the pre-workout or individual workout program, the Credit Counseling and Recovery Service will deliberate and resolve on a debt restructuring plan, and once the creditor financial institution that is in a credit recovery support agreement with the Credit Counseling and Recovery Service and holding the majority of each of the unsecured claims and secured claims to the relevant individual debtor agrees to such debt restructuring plan, the plan will be finalized and debt restructuring measures, such as extension of maturity, adjustment of interest rates or reduction of debt, will be taken according to the pre-workout program or individual workout program applied for.
Under the Debtor Rehabilitation and Bankruptcy Act, a qualified individual debtor with outstanding debts in an aggregate amount not exceeding threshold amounts of W1 billion of unsecured debt and/or W1.5 billion of secured debt may restructure his or her debts through a court-supervised debt restructuring that is binding on creditors.
Once a borrower is deemed to be eligible to participate in the pre-workout program, we promptly sell the collateral underlying such borrower’s secured loans to mitigate our losses, and we may restructure such borrower’s unsecured loans (regardless of their type) as follows:
| |
• |
|
Extension of maturity: Based on considerations of the type of loan, the total loan amount, the repayment amount and the probability of repayment, the maturity of unsecured loans may be extended by up to 10 years and maturity of secured loans may be extended by up to 20 years with a grace period not exceeding three years. |
| |
• |
|
Interest rate adjustment: The interest rate of unsecured loans may be adjusted to 50% of the original interest rate within the range of the highest interest rate of 10% per annum and the lowest interest rate of 5% per annum; provided that if the original interest rate is less than 5% per annum, no adjustment applies. The adjusted interest rate applies to the principal amount following any adjustment thereto as part of the pre-workout program, and no interest accrues on the interest already accrued or fees payable. |
| |
• |
|
Debt forgiveness: Debt forgiveness under the pre-workout program is limited to the default interest. |
| |
• |
|
Deferral: If the foregoing three measures are deemed to be insufficient in terms of providing meaningful assistance to a qualifying borrower due to layoff, unemployment, business closure, disaster or earnings loss, loan repayment may be deferred for a maximum of three year, provided that the pre-workout committee may extend such deferral period every six months, for a period not to exceed six months, upon the borrower’s application. The deferral period is not counted toward the repayment period, and interest accrues at 2% per annum during the deferral period. |
In 2022, the aggregate amount of our retail credit (including credit card receivables) which became subject to the pre-workout program was W249 billion. We believe that our participation in such pre-workout program has not had a material impact on the overall asset quality of our retail loans and credit card portfolio or on our results of operations and financial condition to date.
95
Loan Modification Programs for Loans under Troubled Debt Restructuring
We generally offer the following types of concessions in relation to restructured loans: reduction of interest rate, forgiveness of overdue interest, extension of the term for repayment of principal, conversion of debt into equity or a combination of the foregoing. The nature and degree of such concessions vary depending on, among other things, the creditworthiness of the borrower, the size of loans being restructured, the existing terms of the loans and other factors deemed relevant by the relevant creditors’ committee. We generally do not restructure an existing loan into multiple new loans. Recently, various Government-led financial support programs have been introduced in response to the COVID-19 pandemic, rising inflation and economic slowdown, such as loan rescheduling and principal and interest payment deferral programs, have helped financial institutions, including Shinhan Bank, manage their asset quality at a stable level. Such financial support programs have been introduced since April 1, 2020 and are available to small- and medium-sized enterprises and SOHOs that meet certain criteria, such as that they have not been delinquent on their prior loans and are not subject to liquidation or bankruptcy proceedings. Such financial support programs expired on September 30, 2022. However, the Government has decided, based on discussions with financial institutions, to provide further financial support to the debtors using the financial support programs as of the expiration date of such financial support programs in the forms of (i) the extension of loan maturity dates up to 3 years, (ii) the postponement of repaying loans up to 1 year until September 2023, or (iii) the rescheduling of loans under the New Start Fund set up by the Government on October 4, 2022 or loan rescheduling programs led by the financial institutions. Our participation in such Government initiatives may lead us to extend credit to small- and medium-sized enterprises and SOHOs that we would not otherwise extend, or offer terms on such credit that we would not otherwise offer, in the absence of such initiatives. There is no guarantee that the financial condition and liquidity of the small- and medium-sized enterprises benefiting from such initiatives will improve sufficiently for them to service their debt on a timely basis or at all. Accordingly, an increase in our exposure to small- and medium-sized enterprise borrowers resulting from such Government initiatives may have a material adverse effect on our financial condition and results of operations. We have classified the loans subject to loan rescheduling and principal and interest payment deferral under such financial support programs into stage 2 loans. For further details of our exposures due to such financial support programs, see Note 49 of the notes to our consolidated financial statements included in this annual report. For a discussion of expected credit losses related to the COVID-19 pandemic, see Note 4 of the notes to our consolidated financial statements included in this annual report.
The following table presents a breakdown of the gross amount of loans under restructuring as of December 31, 2020, 2021 and 2022 by our loan modification programs, as further categorized according to the loan category and performing versus non-performing status at each fiscal year end.
|
|
|
|
|
|
|
|
|
|
|
|
|
| As of December 31, 2020 |
|
| Modification Programs |
|
Non-Performing |
|
|
Performing |
|
|
Total |
|
| |
|
|
|
|
|
|
|
|
|
| |
|
(In billions of Won) |
|
| Extension of due date for principal and interest |
|
W |
3 |
|
|
W |
— |
|
|
W |
3 |
|
| Reduction of interest rate |
|
|
29 |
|
|
|
186 |
|
|
|
215 |
|
| Forgiveness of principal |
|
|
— |
|
|
|
— |
|
|
|
— |
|
| Equity conversion |
|
|
— |
|
|
|
— |
|
|
|
— |
|
| Additional lending(1) |
|
|
— |
|
|
|
1 |
|
|
|
1 |
|
| Others(2) |
|
|
35 |
|
|
|
36 |
|
|
|
71 |
|
|
|
|
|
|
|
|
|
|
|
|
|
|
| Total |
|
W |
67 |
|
|
W |
223 |
|
|
W |
290 |
|
|
|
|
|
|
|
|
|
|
|
|
|
|
96
|
|
|
|
|
|
|
|
|
|
|
|
|
| As of December 31, 2021 |
|
| Modification Programs |
|
Non-Performing |
|
|
Performing |
|
|
Total |
|
| |
|
|
|
|
|
|
|
|
|
| |
|
(In billions of Won) |
|
| Extension of due date for principal and interest |
|
W |
5 |
|
|
W |
— |
|
|
W |
5 |
|
| Reduction of interest rate |
|
|
16 |
|
|
|
156 |
|
|
|
172 |
|
| Forgiveness of principal |
|
|
— |
|
|
|
— |
|
|
|
— |
|
| Equity conversion |
|
|
— |
|
|
|
— |
|
|
|
— |
|
| Additional lending(1) |
|
|
— |
|
|
|
— |
|
|
|
— |
|
| Others(2) |
|
|
28 |
|
|
|
33 |
|
|
|
61 |
|
|
|
|
|
|
|
|
|
|
|
|
|
|
| Total |
|
W |
49 |
|
|
W |
189 |
|
|
W |
238 |
|
|
|
|
|
|
|
|
|
|
|
|
|
|
|
|
|
|
|
|
|
|
|
|
|
|
|
| As of December 31, 2022 |
|
| Modification Programs |
|
Non-Performing |
|
|
Performing |
|
|
Total |
|
| |
|
|
|
|
|
|
|
|
|
| |
|
(In billions of Won) |
|
| Extension of due date for principal and interest |
|
W |
13 |
|
|
W |
10 |
|
|
W |
23 |
|
| Reduction of interest rate |
|
|
6 |
|
|
|
61 |
|
|
|
67 |
|
| Forgiveness of principal |
|
|
— |
|
|
|
— |
|
|
|
— |
|
| Equity conversion |
|
|
— |
|
|
|
— |
|
|
|
— |
|
| Additional lending(1) |
|
|
— |
|
|
|
— |
|
|
|
— |
|
| Others(2) |
|
|
40 |
|
|
|
13 |
|
|
|
53 |
|
|
|
|
|
|
|
|
|
|
|
|
|
|
| Total |
|
W |
59 |
|
|
W |
84 |
|
|
W |
143 |
|
|
|
|
|
|
|
|
|
|
|
|
|
|
Notes:
| (1) |
Represents additional loans provided to the borrower at favorable terms as part of the restructuring package, which may include extension of the due date or reduction of interest rate, among others. |
| (2) |
Principally consists of restructured loans whose restructuring terms were not determined as of the date indicated. A loan is deemed to be subject to restructuring upon the commencement of the recovery proceedings or when the relevant creditors’ committee or our credit officer determines that the borrower will be subject to workout, and in many cases the restructuring terms for such loans are not determined at the time such loans are deemed to be subject to restructuring. |
Debt-to-equity Conversion
We distinguish between loans that we consider to be collectible under modified terms and loans that we consider to be uncollectible regardless of any modification of terms. With respect to loans that are in the latter category, we convert a portion of such loans into equity securities following negotiation with the borrowers and charge off the remainder of such loans as further described below. The equity securities so converted are recorded at fair value, based on the market value of such securities if available or the appraisal value of such securities by an outside appraiser if a market value is unavailable. In 2022, the Bank did not have any loans restructured into equity securities.
Debt-to-equity conversion generally has two primary benefits. One, the debt-to-equity conversion reduces the amount of loans and related interest expenses of the borrower, resulting in lesser debt burden and greater liquidity for the borrower, a greater likelihood of its exit from restructuring and the repayment of its obligations to us. Two, in the case of a successful turnaround of the borrower, we are entitled to the upside gains from the increase in the value of the equity securities so converted. Notwithstanding these benefits, however, the resulting impact from the debt-to-equity conversion on our interest income is generally not material as the loans being converted as part of restructuring are generally deemed to be uncollectible regardless any modification of terms. As for the impact on our asset classification, we generally apply the same asset classification standards to both
97
non-restructured and restructured loans. As for restructured loans, we also consider additional factors such as the borrower’s adherence to its business plans and execution of the self-help measures, among others, to the extent applicable. In consideration of such criteria, we generally classify loans subject to workout as “precautionary.” For a general discussion of our loan classifications, see “Item 4.B. Business Overview — Supervision and Regulation — Principal Regulations Applicable to Financial Holding Companies — Capital Adequacy.”
Evaluation of Loan Modification Programs
We currently do not conduct a systematic or quantitative evaluation of the success of any particular concession by type, whether historically, relative to each other or relative to other financial institutions in Korea, although we do monitor on an individual basis the compliance by the borrower with the modified terms of the restructured loans. This is principally due to the following reasons.
One, in the case of large corporations subject to or about to be subject to restructuring, which represents the most significant restructuring cases in Korea, the restructuring process is generally not driven by us, but by a creditors’ committee involving several large creditor financial institutions, and in the case of very large corporations or corporations that are members of large business conglomerates, the process frequently involves the guidance of the Government in light of the potential ripple effects of the restructuring on the general economy. Hence, it is difficult for us to collect data that would help us to evaluate the success of a particular concession based on the credit profile of the borrower and the type of concessions offered.
Two, the unavailability of systematic analysis notwithstanding, our general sense is that the restructuring cases in Korea have, to a large part, been successful as measured in terms of the ability of the borrowers to exit restructuring programs relatively quickly and further that the failed cases have not been particularly material. As a result, to date, we have not found it particularly necessary or helpful to expend the time and resources required to conduct a systematic analysis for purposes of evaluating the success of concessions by the type of a particular concession offered.
We do, however, measure the success of concessions in limited ways, that is, principally in terms of how well the borrower complies with the terms and conditions of the restructuring plan as agreed between the borrower and its creditor institutions. A restructuring plan typically includes a business plan and self-help measures to be undertaken by the borrower. We monitor the borrower’s compliance with the restructuring plan on a periodic basis (namely, annual, semiannual or quarterly in accordance with the terms of the restructuring plan) and evaluate the success thereof principally in terms of three attributes: (i) the progress in the execution of the business plan, (ii) the progress in the execution of the self-help measures and (iii) other qualitative factors such as major developments in the general economy, the regulatory environment, the competitive landscape, the quality of senior management and personnel, and transparency in management. We also closely monitor the cash inflows and outflows of the borrower, and the creditors’ committee typically has the right to participate in decision-making related to major spending and borrowings by the borrower.
Accrual Policy for Restructured Loans
For purposes of our accrual policy, we classify restructured loans principally into (i) loans subject to workout pursuant to the Corporate Restructuring Promotion Act and (ii) loans subject to recovery proceedings pursuant to the Debtor Rehabilitation and Bankruptcy Act, which is the comprehensive bankruptcy-related law in Korea. See “— Credit Exposures to Companies in Workout and Recovery Proceedings.” As for loans subject to workout, our general policy is to discontinue accruing interest on a loan when payment of principal and/or interest thereon becomes past due by 90 days or more, as described above in “— Nonaccrual Loans and Past Due Accruing Loans”. Interest is recognized on these loans on a cash basis (i.e., when collected) from the date such loan is reclassified as non-accruing, and such loans are not reclassified as accruing until the overdue principal and/or interest amounts are paid in full. This general policy also applies to loans subject to workout even if such loans are restructured loans. In the case of loans subject to recovery proceedings, we discontinue accruing
98
interest immediately upon the borrowers becoming subject to recovery proceedings (even if such loans are not yet delinquent) in light of the heightened uncertainty regarding the borrower’s ability to repay. Interest on such loans is recognized on a cash basis and such loans are not reclassified as accruing until the borrower exits recovery proceedings. Accordingly, under our accrual policy, the number of payments made on a nonaccrual restructured loan is not a relevant factor in determining whether to reinstate such loan to the accrual status.
Determination of Performance of Restructured Loans
In determining whether a borrower has satisfactorily performed its obligations under the existing loan terms, we principally review the payment history of the borrower, namely whether the borrower has been delinquent by one day or more pursuant to our general interest accrual policy. In determining whether a borrower has shown the capacity to continue to perform under the restructured terms, we primarily rely upon the assessment of our credit officers (or the creditors’ committee in the case of large corporate borrowers with significant outstanding loans) of the likelihood of the borrower’s ability to repay under the restructured terms, which assessment takes into account the size of the loans in question, the credit profile of the borrower, the original terms of the loans and other factors deemed relevant by the relevant credit officers. Depending on various factors such as the size of the loans in question and the credit profile of the borrower, we or the relevant creditors’ committee, as the case may be, sometimes engage an outside advisory firm to perform further due diligence in order to supplement the aforementioned assessment. In certain cases, the borrowers also submit self-help proposals to facilitate obtaining the approval for restructuring, which measures are then also taken into consideration by our credit officers or the relevant creditors’ committees, as the case may be, in determining their future capacity to continue to perform under the restructured terms.
Charge-off of Restructured Loans
As for loans that we consider to be collectible under modified terms (for example, by extending the due date for the payment of principal and/or interest or reducing the interest rate below the applicable interest rate to a rate below the prevailing market rate, or a combination of the foregoing), we generally restructure such loans under the modified terms and do not charge off any portion of such loans.
As for loans that we consider to be uncollectible regardless of any modification of terms, we negotiate with the borrower to have a portion of such loans converted into equity securities (usually common stock) of the borrower in consideration, among others, of (i) the degree to which such conversion will alleviate the debt burdens and liquidity concerns of the borrower, (ii) our potential upside from the gain in the value of the equity securities compared to the likelihood of collection if the loans were not converted into equity securities, and (iii) the borrower’s concerns regarding its shareholding structure subsequent to such conversion. We then charge off the remainder of the loans not converted into equity securities. The value of the equity securities so converted is recorded at fair value, based on the market value of such securities if available or the appraisal value of such securities by an outside appraiser if a market value is unavailable.
Since we generally do not accrue interest on loans subject to recovery proceedings while we generally accrue interest on loans subject to workout unless past due by 90 days or more, charge-off is not a relevant factor we consider when determining the accrual status of a particular restructured loan.
We continue to accrue interest on restructured loans if we conclude that repayment of interest and principal contractually due on the entire debt is reasonably assured. Such conclusion is reached only after we have carefully reviewed the borrower’s ability to repay based on an assessment, among others, of various factors such as the size of the loans in question and the credit quality of the borrower by our credit officer or the relevant creditors’ committee as supplemented by the due diligence by outside advisory firms, as the case may be.
Potential Problem Loans
We operate an “early warning system” in order to enable a more systematic and real-time monitoring of loans with significant potential of default. This system assists our management in making decisions by
99
identifying loans which have serious doubt as to the ability of the borrowers to comply with their respective loan repayment terms as well as loans with significant potential of non-repayment.
We classify potential problem loans as loans that are designated as “early warning loans” and reported to the Financial Supervisory Service. The “early warning loans” designation applies to borrowers that have been (i) identified by our early warning system as exhibiting signs of credit risk based on the relevant borrower’s financial data, credit information and/or transactions with banks and, following such identification and (ii) designated by our loan officers as potential problem loans on their evaluation of known information about such borrowers’ possible credit problems. Such loans are required to be reported on a quarterly basis to the Financial Supervisory Service. If a borrower’s loans are designated as “early warning loans” pursuant to the process described above and included in our quarterly report to the Financial Supervisory Service, we consider this to be an indication of serious doubt as to such borrower’s ability to comply with repayment terms in the near future. As of December 31, 2022, we had W132 billion of potential problem loans.
Provisioning Policy
Loans
We conduct periodic and systematic detailed reviews of our loan portfolios to identify credit risks and to establish the overall allowance for credit losses on loans. Our management believes the allowance for credit losses on loans reflects the best estimate of the expected credit losses as of the date of each statement of financial position.
At each reporting date, we assess whether the credit risk on a financial instrument has increased significantly since initial recognition. When making the assessment, we use the change in the risk of a default occurring over the expected life of the financial instrument instead of the change in the amount of expected credit losses. Upon assessment, each asset is classified as in one of the following three stages, which is used as the basis of calculating the loss allowances at the 12-month expected credit losses (“ECL”) or the lifetime ECL, depending on the stage.
|
|
|
|
|
| Category |
|
Provision for credit loss allowance |
| Stage 1 |
|
When credit risk has not increased significantly since the initial recognition |
|
12-months ECL: The ECL associated with the probability of default events occurring within the next 12 months |
| Stage 2 |
|
When credit risk has increased significantly since the initial recognition |
|
Lifetime ECL: A lifetime ECL associated with the probability of default events occurring over the remaining lifetime |
| Stage 3 |
|
When assets are impaired |
To make that assessment, we compare the risk of default of the financial instrument as at the reporting date with such risk of default as at the date of initial recognition, taking into account reasonable supporting information that is available without undue cost or effort and is indicative of significant increases in credit risk since initial recognition. Supporting information also includes historical default data held by us and analysis conducted by internal credit risk rating specialists.
We assign an internal credit risk rating to each individual exposure based on observable data and historical experiences that have been found to have a reasonable correlation with the risk of default. The internal credit risk rating is determined by considering both qualitative and quantitative factors that indicate the risk of default, which may vary depending on the nature of the exposure and the type of borrower.
We accumulate information after analyzing the information regarding exposure to credit risk and default information by the type of product and borrower as well as results of internal credit risk assessment. For some portfolios, we use information obtained from external credit rating agencies when performing these analyses.
100
We apply statistical techniques to estimate (i) the probability of default for the remaining life of the exposure from the accumulated data and (ii) the changes in the estimated probability of default over time.
We use the indicators defined as per portfolio to determine the significant increase in credit risk. Such indicators generally consist of changes in the risk of default estimated from changes in the internal credit risk rating, qualitative factors, days of delinquency and others.
We consider a financial asset to be in default if it meets one or more of the following conditions:
| |
• |
|
if a borrower is overdue 90 days or more from the contractual payment date, or |
| |
• |
|
if we determine that it is not possible to recover principal and interest without enforcing the collateral on a financial asset. |
We use the following indicators when determining whether a borrower is in default:
| |
• |
|
qualitative factors (e.g., breach of contract terms), |
| |
• |
|
quantitative factors (e.g., if the same borrower does not perform more than one payment obligations to us, the number of days past due per payment obligation. However, in the case of a specific portfolio, we use the number of days past due for each financial instrument), and |
| |
• |
|
internal and external data. |
The definition of default applied by us generally conforms to the definition of default defined for regulatory capital management purposes. However, depending on the situation, the information used to determine whether default has incurred and the extent thereof may vary.
We measure expected credit losses on a forward-looking basis, and expected credit losses reflects information presented by internal experts based on a variety of sources. For purposes of estimating such forward-looking information, we utilize economic outlook and projections published by domestic and overseas research institutes or government and public agencies.
We reflect future macroeconomic conditions anticipated from a bias-free, neutral standpoint in measuring expected credit losses. Expected credit losses in this respect reflect conditions that are most likely to occur and are based on the same assumptions that we use in our business plan and management strategy.
Key variables used in measuring expected credit losses are as follows:
| |
• |
|
Probability of default (PD) |
| |
• |
|
Loss given default (LGD) |
| |
• |
|
Exposure at default (EAD) |
These variables have been estimated from historical experience data by using statistical techniques developed internally by Shinhan Bank and have been adjusted to reflect forward-looking information. When measuring expected credit losses on financial assets, Shinhan Bank reflects a period of expected credit loss measurement based on a contractual maturity. Shinhan Bank takes into consideration the extension rights held by a borrower when deciding the contractual maturity.
Risk factors such as PD, LGD and EAD are collectively estimated according to the following criteria:
| |
• |
|
Internal credit risk rating, |
101
| |
• |
|
Industry that the borrower belongs to, |
| |
• |
|
Location of the borrower or collateral, and |
The criteria for classification of groups are periodically reviewed to maintain homogeneity of the group and are adjusted if necessary. We use external benchmark information to supplement internal information for a particular portfolio that does not have sufficient internal data accumulated from the past experience.
Credit Cards
Prior to 2017, we established an allowance for the credit card portfolio using a roll-rate model. A roll-rate model is a statistical tool used to monitor the progression of loans based on aging of the balance and established loss rates. The actual loss rates derived from this model are used to project the percentage of losses within each aging category based on performance over a five-year look-back period. Basel II requires a minimum of nine years of data collection (consisting of a minimum five-year observation period for defaults and a minimum four-year observation period for post-default recoveries) as a necessary condition to using the internal model approach. After its merger with LG Card in 2007, Shinhan Card has worked to establish a risk management system and met the Basel II nine-year data collection requirement in October 2016. Through the operation of a credit review system and risk management system based on Basel II requirements, we have gained the necessary data to create internal models that can calculate PD/LGD and credit conversion factors for different groups of borrowers of financial assets.
At the end of December 2016, the Financial Supervisory Service granted Shinhan Card final approval to use the internal model approach. During the first quarter of 2017, Shinhan Card completed the establishment of the IFRS loan loss calculation system, for example, by replacing Basel II risk components with risk components for financial reporting in accordance with IAS 39, and Shinhan Card revised the calculation methodology of loan losses from a roll-rate model to an internal model approach.
The internal model approach calculates separate default rates and loss given default for different groups of customers, differentiated based on the characteristics of both the customers and the products that they use. The internal model approach disaggregates customers into more than twice the number of groups than does the roll-rate model. Whereas the roll-rate model does not distinguish between customers with high and low risks of default when calculating roll rates, the internal model approach allows for a more sophisticated calculation of loan loss that reflects the customers’ credit ratings.
Our general policy is to be proactive in our collection procedures, and we therefore emphasize collections at an early stage of delinquency, although we increase the level of collection efforts as the delinquency period increases with respect to the relevant account. Efforts to collect from cardholders whose account balances are up to 30 days past due are generally made by our credit support centers at Shinhan Card.
For credit card accounts with balances that are more than 30 days past due, we generally assign collection to collection companies such as Shinhan Credit Information, a subsidiary of ours, and Mirae Credit Information. For credit card accounts that are charged off, we outsource collection to collection companies such as Shinhan Credit Information, Mirae Credit Information Services Corp. and Koryo Credit Information.
102
Loan Aging Schedule
The following table shows our loan aging schedule (excluding accrued interest) for all loans as of the dates indicated.
|
|
|
|
|
|
|
|
|
|
|
|
|
|
|
|
|
|
|
|
|
|
|
|
|
|
|
|
|
|
|
|
|
|
|
|
|
| |
|
Current |
|
|
Past Due
Up to 3 Months |
|
|
Past Due
3-6 Months |
|
|
Past Due More
Than 6 Months |
|
|
Total |
|
| As of December 31, |
|
Amount |
|
|
% |
|
|
Amount |
|
|
% |
|
|
Amount |
|
|
% |
|
|
Amount |
|
|
% |
|
|
Amount |
|
| |
|
|
|
|
|
|
|
|
|
|
|
|
|
|
|
|
|
|
|
|
|
|
|
|
|
|
|
| |
|
(In billions of Won, except percentages) |
|
| 2020 |
|
|
357,729 |
|
|
|
99.15 |
|
|
|
1,386 |
|
|
|
0.38 |
|
|
|
769 |
|
|
|
0.21 |
|
|
|
920 |
|
|
|
0.26 |
|
|
|
360,804 |
|
| 2021 |
|
|
390,297 |
|
|
|
99.19 |
|
|
|
1,351 |
|
|
|
0.34 |
|
|
|
773 |
|
|
|
0.20 |
|
|
|
1,053 |
|
|
|
0.27 |
|
|
|
393,474 |
|
| 2022 |
|
|
413,887 |
|
|
|
99.06 |
|
|
|
1,912 |
|
|
|
0.46 |
|
|
|
923 |
|
|
|
0.22 |
|
|
|
1,105 |
|
|
|
0.26 |
|
|
|
417,827 |
|
Non-Performing Loans
Non-performing loans are defined as loans past due by more than 90 days. The following table shows, as of the dates indicated, the amount of the total non-performing loan portfolio and as a percentage of our total loans.
|
|
|
|
|
|
|
|
|
|
|
|
|
| |
|
As of December 31, |
|
| |
|
2020 |
|
|
2021 |
|
|
2022 |
|
| |
|
|
|
|
|
|
|
|
|
| |
|
(In billions of Won, except percentages) |
|
| Total non-performing loans |
|
W |
1,689 |
|
|
W |
1,826 |
|
|
W |
2,028 |
|
| As a percentage of total loans |
|
|
0.47 |
% |
|
|
0.46 |
% |
|
|
0.49 |
% |
103
Analysis of Non-Performing Loans
The following table sets forth, for the periods indicated, the total non-performing loans by the borrower type.
|
|
|
|
|
|
|
|
|
|
|
|
|
|
|
|
|
|
|
|
|
|
|
|
|
|
|
|
|
|
|
|
|
|
|
|
|
| |
|
As of December 31, |
|
| |
|
2020 |
|
|
2021 |
|
|
2022 |
|
| |
|
Total Loans |
|
|
Non-
Performing
Loans (1) |
|
|
Ratio of
Non-
Performing
Loans |
|
|
Total Loans |
|
|
Non-
Performing
Loans (1) |
|
|
Ratio of
Non-
Performing
Loans |
|
|
Total Loans |
|
|
Non-
Performing
Loans (1) |
|
|
Ratio of
Non-
Performing
Loans |
|
| |
|
|
|
|
|
|
|
|
|
|
|
|
|
|
|
|
|
|
|
|
|
|
|
|
|
|
|
| |
|
(In billions of Won, except percentages) |
|
| Domestic: |
|
|
|
|
|
|
|
|
|
|
|
|
|
|
|
|
|
|
|
|
|
|
|
|
|
|
|
|
|
|
|
|
|
|
|
|
| Corporate |
|
|
|
|
|
|
|
|
|
|
|
|
|
|
|
|
|
|
|
|
|
|
|
|
|
|
|
|
|
|
|
|
|
|
|
|
| Corporate loans |
|
W |
159,833 |
|
|
W |
465 |
|
|
|
0.29 |
% |
|
W |
178,315 |
|
|
W |
468 |
|
|
|
0.26 |
% |
|
W |
194,749 |
|
|
W |
513 |
|
|
|
0.26 |
% |
| Public and other (2) |
|
|
3,735 |
|
|
|
14 |
|
|
|
0.37 |
|
|
|
3,469 |
|
|
|
13 |
|
|
|
0.37 |
|
|
|
3,897 |
|
|
|
10 |
|
|
|
0.26 |
|
| Loans to banks |
|
|
1,419 |
|
|
|
— |
|
|
|
— |
|
|
|
862 |
|
|
|
— |
|
|
|
— |
|
|
|
1,205 |
|
|
|
— |
|
|
|
— |
|
| Lease financing |
|
|
1,689 |
|
|
|
11 |
|
|
|
0.65 |
|
|
|
1,497 |
|
|
|
7 |
|
|
|
0.47 |
|
|
|
682 |
|
|
|
6 |
|
|
|
0.88 |
|
|
|
|
|
|
|
|
|
|
|
|
|
|
|
|
|
|
|
|
|
|
|
|
|
|
|
|
|
|
|
|
|
|
|
|
|
|
| Total corporate |
|
|
166,676 |
|
|
|
490 |
|
|
|
0.29 |
|
|
|
184,143 |
|
|
|
488 |
|
|
|
0.27 |
|
|
|
200,533 |
|
|
|
529 |
|
|
|
0.26 |
|
|
|
|
|
|
|
|
|
|
|
|
|
|
|
|
|
|
|
|
|
|
|
|
|
|
|
|
|
|
|
|
|
|
|
|
|
|
| Retail |
|
|
|
|
|
|
|
|
|
|
|
|
|
|
|
|
|
|
|
|
|
|
|
|
|
|
|
|
|
|
|
|
|
|
|
|
| Mortgage and home equity |
|
|
72,345 |
|
|
|
63 |
|
|
|
0.09 |
|
|
|
79,018 |
|
|
|
56 |
|
|
|
0.07 |
|
|
|
80,937 |
|
|
|
69 |
|
|
|
0.09 |
|
| Other retail |
|
|
65,627 |
|
|
|
380 |
|
|
|
0.58 |
|
|
|
69,459 |
|
|
|
455 |
|
|
|
0.66 |
|
|
|
67,571 |
|
|
|
557 |
|
|
|
0.82 |
|
|
|
|
|
|
|
|
|
|
|
|
|
|
|
|
|
|
|
|
|
|
|
|
|
|
|
|
|
|
|
|
|
|
|
|
|
|
| Total retail |
|
|
137,972 |
|
|
|
443 |
|
|
|
0.32 |
|
|
|
148,477 |
|
|
|
511 |
|
|
|
0.34 |
|
|
|
148,508 |
|
|
|
626 |
|
|
|
0.42 |
|
|
|
|
|
|
|
|
|
|
|
|
|
|
|
|
|
|
|
|
|
|
|
|
|
|
|
|
|
|
|
|
|
|
|
|
|
|
| Credit cards |
|
|
23,598 |
|
|
|
458 |
|
|
|
1.94 |
|
|
|
25,817 |
|
|
|
427 |
|
|
|
1.65 |
|
|
|
20,388 |
|
|
|
494 |
|
|
|
2.42 |
|
|
|
|
|
|
|
|
|
|
|
|
|
|
|
|
|
|
|
|
|
|
|
|
|
|
|
|
|
|
|
|
|
|
|
|
|
|
| Total domestic |
|
|
328,246 |
|
|
|
1,391 |
|
|
|
0.42 |
|
|
|
358,437 |
|
|
|
1,426 |
|
|
|
0.40 |
|
|
|
369,429 |
|
|
|
1,649 |
|
|
|
0.45 |
|
|
|
|
|
|
|
|
|
|
|
|
|
|
|
|
|
|
|
|
|
|
|
|
|
|
|
|
|
|
|
|
|
|
|
|
|
|
| Foreign: |
|
|
32,558 |
|
|
|
298 |
|
|
|
0.92 |
|
|
|
35,037 |
|
|
|
400 |
|
|
|
1.14 |
|
|
|
48,398 |
|
|
|
379 |
|
|
|
0.78 |
|
|
|
|
|
|
|
|
|
|
|
|
|
|
|
|
|
|
|
|
|
|
|
|
|
|
|
|
|
|
|
|
|
|
|
|
|
|
| Total |
|
W |
360,804 |
|
|
W |
1,689 |
|
|
|
0.47 |
% |
|
W |
393,474 |
|
|
W |
1,826 |
|
|
|
0.46 |
% |
|
W |
417,827 |
|
|
W |
2,028 |
|
|
|
0.49 |
% |
|
|
|
|
|
|
|
|
|
|
|
|
|
|
|
|
|
|
|
|
|
|
|
|
|
|
|
|
|
|
|
|
|
|
|
|
|
Notes:
| (1) |
The number of days past due of restructured credit card loans is calculated from the first date of non-payment regardless of subsequent modification of terms. |
| (2) |
Includes debtors such as local and regional authorities, state-owned enterprises and non-profit organizations. |
104
Non-Performing Loans by Industry
The following table sets forth a breakdown of our non-performing corporate loans by industry as of December 31, 2022.
|
|
|
|
|
|
|
|
|
| Industry |
|
Aggregate Non-
Performing Corporate
Loan Balance |
|
|
Percentage of Total
Non-Performing Corporate
Loan Balance |
|
| |
|
|
|
|
|
|
| |
|
(In billions of Won) |
|
|
(Percentages) |
|
| Construction |
|
W |
24 |
|
|
|
2.9 |
% |
| Manufacturing |
|
|
127 |
|
|
|
15.2 |
|
| Real estate, leasing and service |
|
|
68 |
|
|
|
8.1 |
|
| Retail and wholesale |
|
|
48 |
|
|
|
5.7 |
|
| Finance and insurance |
|
|
42 |
|
|
|
5.0 |
|
| Hotel and leisure |
|
|
28 |
|
|
|
3.3 |
|
| Transportation, storage and communication |
|
|
29 |
|
|
|
3.5 |
|
| Other service(1) |
|
|
46 |
|
|
|
5.5 |
|
| Other(2) |
|
|
426 |
|
|
|
50.8 |
|
|
|
|
|
|
|
|
|
|
| Total |
|
W |
838 |
|
|
|
100.0 |
% |
|
|
|
|
|
|
|
|
|
Notes:
| (1) |
Includes other service industries such as publication, media and education. |
| (2) |
Includes other industries such as agriculture, forestry, mining, electricity and gas. |
Top 20 Non-Performing Loans
As of December 31, 2022, our 20 largest non-performing loans accounted for 31.3% of our total non-performing loan portfolio. The following table shows, at the date indicated, certain information regarding our 20 largest non-performing loans.
|
|
|
|
|
|
|
|
|
|
|
|
|
| |
|
|
|
As of December 31, 2022 |
|
| |
|
|
|
Industry |
|
Gross Principal
Outstanding |
|
|
Allowance for
credit losses on
loans |
|
| |
|
|
|
(In billions of Won) |
|
| 1 |
|
Borrower A |
|
Other service |
|
W |
134 |
|
|
W |
— |
|
| 2 |
|
Borrower B |
|
Other service |
|
|
125 |
|
|
|
98 |
|
| 3 |
|
Borrower C |
|
Other service |
|
|
78 |
|
|
|
— |
|
| 4 |
|
Borrower D |
|
Other service |
|
|
56 |
|
|
|
56 |
|
| 5 |
|
Borrower E |
|
Other service |
|
|
38 |
|
|
|
— |
|
| 6 |
|
Borrower F |
|
Other service |
|
|
35 |
|
|
|
— |
|
| 7 |
|
Borrower G |
|
Finance and insurance |
|
|
25 |
|
|
|
15 |
|
| 8 |
|
Borrower H |
|
Other service |
|
|
19 |
|
|
|
11 |
|
| 9 |
|
Borrower I |
|
Real estate, leasing and service |
|
|
17 |
|
|
|
4 |
|
| 10 |
|
Borrower J |
|
Finance and insurance |
|
|
15 |
|
|
|
15 |
|
| 11 |
|
Borrower K |
|
Transportation, storage, and communication |
|
|
14 |
|
|
|
11 |
|
| 12 |
|
Borrower L |
|
Other service |
|
|
13 |
|
|
|
— |
|
| 13 |
|
Borrower M |
|
Real estate, leasing and service |
|
|
12 |
|
|
|
— |
|
| 14 |
|
Borrower N |
|
Transportation, storage, and communication |
|
|
11 |
|
|
|
9 |
|
| 15 |
|
Borrower O |
|
Real estate, leasing and service |
|
|
10 |
|
|
|
1 |
|
| 16 |
|
Borrower P |
|
Hotel and leisure |
|
|
10 |
|
|
|
4 |
|
105
|
|
|
|
|
|
|
|
|
|
|
|
|
| |
|
|
|
As of December 31, 2022 |
|
| |
|
|
|
Industry |
|
Gross Principal
Outstanding |
|
|
Allowance for
credit losses on
loans |
|
| |
|
|
|
(In billions of Won) |
|
| 17 |
|
Borrower Q |
|
Real estate, leasing and service |
|
|
7 |
|
|
|
2 |
|
| 18 |
|
Borrower R |
|
Manufacturing |
|
|
6 |
|
|
|
1 |
|
| 19 |
|
Borrower S |
|
Real estate, leasing and service |
|
|
5 |
|
|
|
— |
|
| 20 |
|
Borrower T |
|
Retail and wholesale |
|
|
5 |
|
|
|
2 |
|
|
|
|
|
|
|
|
|
|
|
|
|
|
|
|
|
|
|
|
W |
635 |
|
|
W |
229 |
|
|
|
|
|
|
|
|
|
|
|
|
|
|
Non-Performing Loan Strategy
One of our primary objectives is to prevent our loans from becoming non-performing. Through our corporate credit rating system, which is designed to prevent our loan officers from extending new loans to borrowers with high credit risks based on the borrower’s credit rating, we seek to reduce credit risk related to future non-performing loans. Our early warning system is designed to bring any sudden increase in a borrower’s credit risk to the attention of our loan officers, who then closely monitor such loans.
If a loan becomes non-performing notwithstanding such preventive mechanism, an officer at the branch level responsible for monitoring non-performing loans will commence due diligence on the borrower’s assets, send a notice demanding payment or a notice that we will take or prepare for legal action.
At the same time, we also initiate our non-performing loan management process, which includes:
| |
• |
|
identifying loans subject to a proposed sale by assessing the estimated losses from such sale based on the estimated recovery value of collateral, if any, for such non-performing loans; |
| |
• |
|
identifying loans subject to charge-off based on the estimated recovery value of collateral, if any, for such non-performing loans and the estimated rate of recovery of unsecured loans; and |
| |
• |
|
to a limited extent, identifying commercial loans subject to normalization efforts based on the cash-flow situation of the borrower. |
Once the details of a non-performing loan are identified, we pursue early solutions for recovery. Actual recovery efforts for non-performing loans are handled by the relevant department, depending on the nature of such loans and the borrower, among others. The officers or agents of the responsible departments and units use a variety of methods to resolve non-performing loans, including:
| |
• |
|
making phone calls and paying visits to the borrower to request payment; |
| |
• |
|
continuing to assess and evaluate assets of our borrowers; and |
| |
• |
|
if necessary, initiating legal action such as foreclosures, attachment and litigation. |
In order to promote speedy recovery on loans subject to foreclosures and litigation, the branch responsible for handling these loans may transfer them to the relevant unit at headquarters.
Our policy is to commence legal action within one month after default on promissory notes and four months after delinquency of payment on other types of loans. For loans to insolvent or bankrupt borrowers or when we conclude that it is not possible to recover through normal procedures, we take prompt legal actions regardless of the grace period.
In addition to making efforts to collect on these non-performing loans, we take other measures to reduce the level of our non-performing loans, including:
| |
• |
|
selling non-performing loans to third parties including the Korea Asset Management Corporation; |
106
| |
• |
|
entering into asset-backed securitization transactions with respect to non-performing loans; |
| |
• |
|
managing retail loans that are three months or more past due through Shinhan Credit Information under an agency agreement; and |
| |
• |
|
using third-party collection agencies including credit information companies. |
In 2022, we sold non-performing loans in the amount of W40 billion to third parties, including W25 billion transferred to UAMCO, Ltd., an investment management company. Loans transferred to third parties meet the criteria of true sale and are derecognized accordingly.
The following table presents a roll-forward of our non-performing loans in 2022.
|
|
|
|
|
| |
|
(In billions of Won) |
|
| Non-performing loans as of December 31, 2021 |
|
W |
1,826 |
|
|
|
|
|
|
| Additional non-performing loans due to delinquency |
|
|
915 |
|
| Loans sold |
|
|
(40 |
) |
| Loans charged off |
|
|
(439 |
) |
| Loans modified and returned to performing |
|
|
(15 |
) |
| Other adjustments(1) |
|
|
(219 |
) |
|
|
|
|
|
| Non-performing loans as of December 31, 2022 |
|
W |
2,028 |
|
|
|
|
|
|
Note:
| (1) |
Represents loans paid down or paid off and loans returned to performing other than as a result of modification. We do not separately collect and analyze data relating to non-performing loans other than those that were sold, charged off, modified and returned to performing, or transferred to held-for-sale investment portfolio. |
Loan Charge-offs
Our gross charge-offs decreased by 2.8% from W1,185 billion in 2021 to W1,152 billion in 2022, primarily due to a decrease in the amount of charge-offs for corporate loans in 2022 compared to 2021. Our gross charge-offs decreased by 2.9% from W1,220 billion in 2020 to W1,185 billion in 2021, primarily due to a decrease in the amount of charge-offs for corporate loans in 2021 compared to 2020.
In 2022, the charge-off on restructured loans amounted to W16 billion. With respect to a loan that we consider to be uncollectible regardless of any modification of terms, we convert a portion of such loan into equity securities following negotiation with the borrower and charge off the remainder of such loan as previously discussed in “— Troubled Debt Restructurings — Charge-off of Loans Subject to Restructuring.” The equity securities so converted are recorded at fair value, based on the market value of such securities if available or the appraisal value of such securities by an outside appraiser if a market value is unavailable.
We attempt to minimize loans to be charged off by practicing a sound credit approval process based on credit risk analysis prior to extending loans and a systematic management of outstanding loans. For charge-off of restructured loans, see “— Loan Modification Programs for Loans under Restructuring — Charge-off of Restructured Loans” above.
Loans to be Charged-off
Loans are charged off if they are deemed to be uncollectible by falling under any of the following categories:
| |
• |
|
loans for which collection is not foreseeable due to insolvency or bankruptcy, dissolution or the termination of the debtor’s business; |
107
| |
• |
|
loans for which collection is not foreseeable due to the death or disappearance of debtors; |
| |
• |
|
loans for which collection expenses exceed the collectible amount; |
| |
• |
|
loans for which collection is not possible through legal or any other means; |
| |
• |
|
payments in arrears in respect of credit cards that are overdue for more than six months; |
| |
• |
|
payments outstanding on unsecured retail loans that are overdue for more than 12 months; |
| |
• |
|
payments in arrears in respect of leases that are overdue for more than 12 months; |
| |
• |
|
the portion of loans classified as “estimated loss,” net of any recovery from collateral, which is deemed to be uncollectible; or |
| |
• |
|
domestic loans that are required by the Financial Supervisory Service to be charged-off, or loans held by our foreign subsidiaries or branches for which a charge-off or special provisioning is required by the relevant regulatory authority. |
Timeline for Charge-off
Shinhan Bank’s loans to be charged-off must be charged-off within one year of the month they are deemed to be uncollectible. If such loans are not charged-off within one year, the reason for the delay must be reported to Shinhan Bank’s Audit Department.
Procedure for Charge-off Approval
An application for Shinhan Bank’s loans to be charged-off is submitted by the relevant branch or department to the Credit Collection Department. The Credit Collection Department refers the application to the Audit Department for their review to ensure compliance with Shinhan Bank’s internal procedures for charge-offs. The Credit Collection Department, after reviewing the application to confirm that it meets relevant requirements, seeks approval from the Financial Supervisory Service for the charge-offs, which is typically granted. Once the Financial Supervisory Service approves (except for household loans with estimated losses of W10 million or less, whose charge-off is considered automatically approved by the Financial Supervisory Service), loans are charged-off upon approval by the President of Shinhan Bank. As for Shinhan Card, it generally charges off receivables that are 180 days past due following internal review.
Treatment of Loans Charged-off
Once loans are charged off, they are derecognized from our statements of financial position and are classified as charged-off loans. We continue collection efforts in respect of these loans through third-party collection agencies, including the Korea Asset Management Corporation, and Shinhan Credit Information, which is our subsidiary. The General Manager of the Credit Collection Department must report to the Financial Supervisory Service the amounts of loans permanently written off or recovered during each reporting period.
Treatment of Collateral
When we determine that a loan collateralized by real estate cannot be recovered through normal collection channels, we generally petition a court to foreclose and sell the collateral through a court-supervised auction within one month after default and insolvency and within four months after delinquency. However, this procedure does not apply to companies under restructuring, recovery proceedings, workout or other court proceedings where there are restrictions on such auction procedures. Filing of such petition with the court generally encourages the debtor to repay the overdue loan. If a debtor ultimately fails to repay and the court grants its approval for foreclosure, we sell the collateral and recover the principal amount and interest accrued up to the sales price, net of expenses incurred from the auction. Foreclosure proceedings under the laws and regulations of Korea typically take seven months to one year from initiation to collection depending on the nature of the collateral.
108
Financial Statement Presentation
Our financial statements generally report as charge-offs all unsecured retail loans that are overdue for more than 12 months. Leases are charged off when past due for more than 12 months. For collateral dependent loans, we charge off the excess of the book value of the subject loan over the amount received or to be received from the sale of the underlying collateral when the collateral is sold as part of a foreclosure proceeding and its sale price becomes known through court publication as part of such proceeding.
Net Charge-offs
The following table sets forth, for the periods indicated, the net charge-offs.
|
|
|
|
|
|
|
|
|
|
|
|
|
|
|
|
|
|
|
|
|
|
|
|
|
|
|
|
|
|
|
|
|
|
|
|
|
| |
|
As of December 31, |
|
| |
|
2020 |
|
|
2021 |
|
|
2022 |
|
| |
|
Average
Loan |
|
|
Net
Charge-
Offs |
|
|
Ratio |
|
|
Average
Loan |
|
|
Net
Charge-
Offs |
|
|
Ratio |
|
|
Average
Loan |
|
|
Net
Charge-
Offs |
|
|
Ratio |
|
| |
|
|
|
|
|
|
|
|
|
|
|
|
|
|
|
|
|
|
|
|
|
|
|
|
|
|
|
| |
|
(In billions of Won, except percentages) |
|
|
|
|
| Domestic: |
|
|
|
|
|
|
|
|
|
|
|
|
|
|
|
|
|
|
|
|
|
|
|
|
|
|
|
|
|
|
|
|
|
|
|
|
| Corporate |
|
|
|
|
|
|
|
|
|
|
|
|
|
|
|
|
|
|
|
|
|
|
|
|
|
|
|
|
|
|
|
|
|
|
|
|
| Corporate loans |
|
W |
152,819 |
|
|
W |
252 |
|
|
|
0.16 |
% |
|
W |
169,539 |
|
|
W |
215 |
|
|
|
0.13 |
% |
|
W |
187,098 |
|
|
W |
197 |
|
|
|
0.11 |
% |
| Public and other |
|
|
3,583 |
|
|
|
3 |
|
|
|
0.08 |
|
|
|
3,608 |
|
|
|
— |
|
|
|
— |
|
|
|
3,569 |
|
|
|
1 |
|
|
|
0.03 |
|
| Loans to banks |
|
|
1,446 |
|
|
|
— |
|
|
|
— |
|
|
|
1,470 |
|
|
|
— |
|
|
|
— |
|
|
|
1,117 |
|
|
|
— |
|
|
|
— |
|
| Lease financing |
|
|
1,758 |
|
|
|
20 |
|
|
|
1.14 |
|
|
|
1,565 |
|
|
|
21 |
|
|
|
1.34 |
|
|
|
485 |
|
|
|
8 |
|
|
|
1.65 |
|
|
|
|
|
|
|
|
|
|
|
|
|
|
|
|
|
|
|
|
|
|
|
|
|
|
|
|
|
|
|
|
|
|
|
|
|
|
| Total corporate |
|
|
159,606 |
|
|
|
275 |
|
|
|
0.17 |
|
|
|
176,182 |
|
|
|
236 |
|
|
|
0.13 |
|
|
|
192,269 |
|
|
|
206 |
|
|
|
0.11 |
|
|
|
|
|
|
|
|
|
|
|
|
|
|
|
|
|
|
|
|
|
|
|
|
|
|
|
|
|
|
|
|
|
|
|
|
|
|
| Retail |
|
|
|
|
|
|
|
|
|
|
|
|
|
|
|
|
|
|
|
|
|
|
|
|
|
|
|
|
|
|
|
|
|
|
|
|
| Mortgage and home equity |
|
|
61,189 |
|
|
|
3 |
|
|
|
— |
|
|
|
65,778 |
|
|
|
15 |
|
|
|
0.02 |
|
|
|
70,306 |
|
|
|
2 |
|
|
|
0.00 |
|
| Other retail |
|
|
68,495 |
|
|
|
153 |
|
|
|
0.22 |
|
|
|
75,992 |
|
|
|
140 |
|
|
|
0.18 |
|
|
|
81,744 |
|
|
|
109 |
|
|
|
0.13 |
|
|
|
|
|
|
|
|
|
|
|
|
|
|
|
|
|
|
|
|
|
|
|
|
|
|
|
|
|
|
|
|
|
|
|
|
|
|
| Total retail |
|
|
129,684 |
|
|
|
156 |
|
|
|
0.12 |
|
|
|
141,770 |
|
|
|
155 |
|
|
|
0.11 |
|
|
|
152,050 |
|
|
|
111 |
|
|
|
0.07 |
|
|
|
|
|
|
|
|
|
|
|
|
|
|
|
|
|
|
|
|
|
|
|
|
|
|
|
|
|
|
|
|
|
|
|
|
|
|
| Credit cards |
|
|
20,781 |
|
|
|
380 |
|
|
|
1.83 |
|
|
|
21,792 |
|
|
|
351 |
|
|
|
1.61 |
|
|
|
23,761 |
|
|
|
363 |
|
|
|
1.53 |
|
|
|
|
|
|
|
|
|
|
|
|
|
|
|
|
|
|
|
|
|
|
|
|
|
|
|
|
|
|
|
|
|
|
|
|
|
|
| Total domestic |
|
|
310,071 |
|
|
|
811 |
|
|
|
0.26 |
|
|
|
339,744 |
|
|
|
742 |
|
|
|
0.22 |
|
|
|
368,080 |
|
|
|
680 |
|
|
|
0.18 |
|
|
|
|
|
|
|
|
|
|
|
|
|
|
|
|
|
|
|
|
|
|
|
|
|
|
|
|
|
|
|
|
|
|
|
|
|
|
| Foreign: |
|
|
34,617 |
|
|
|
59 |
|
|
|
0.17 |
|
|
|
37,447 |
|
|
|
55 |
|
|
|
0.15 |
|
|
|
41,005 |
|
|
|
90 |
|
|
|
0.22 |
|
|
|
|
|
|
|
|
|
|
|
|
|
|
|
|
|
|
|
|
|
|
|
|
|
|
|
|
|
|
|
|
|
|
|
|
|
|
| Total |
|
W |
344,688 |
|
|
W |
870 |
|
|
|
0.25 |
% |
|
W |
377,191 |
|
|
W |
797 |
|
|
|
0.21 |
% |
|
W |
409,085 |
|
|
W |
770 |
|
|
|
0.19 |
% |
|
|
|
|
|
|
|
|
|
|
|
|
|
|
|
|
|
|
|
|
|
|
|
|
|
|
|
|
|
|
|
|
|
|
|
|
|
Investment Portfolio
Investment Policy
We invest in and trade Won-denominated and, to a lesser extent, foreign currency-denominated securities for our own account in order to:
| |
• |
|
maintain the stability and diversification of our assets; |
| |
• |
|
maintain adequate sources of back-up liquidity to match our funding requirements; and |
| |
• |
|
supplement income from our core lending activities. |
When making an investment decision with respect to particular securities, we consider macroeconomic trends, industry analysis and credit evaluation, among others.
109
Our securities investment activities are subject to a number of regulatory guidelines, including limitations prescribed under the Financial Holding Companies Act and the Banking Act. Generally, a financial holding company is prohibited from acquiring more than 5% of the total issued and outstanding shares of another finance-related company (other than its direct and indirect subsidiaries). Furthermore, under these regulations, Shinhan Bank must limit its investments in shares and securities with a maturity in excess of three years (other than monetary stabilization bonds issued by the Bank of Korea and national government bonds) to 100.0% of the sum of Tier I and Tier II capital (less any deductions) of Shinhan Bank. Generally, Shinhan Bank is also prohibited from acquiring more than 15.0% of the shares with voting rights issued by any other corporation (other than for the purpose of establishing or acquiring a subsidiary). Further information on the regulatory environment governing our investment activities is set out in “— Supervision and Regulation — Principal Regulations Applicable to Banks — Restrictions on Investments in Property,” “— Principal Regulations Applicable to Banks — Restrictions on Shareholdings in Other Companies,” “— Principal Regulations Applicable to Financial Holding Companies — Liquidity” and “— Principal Regulations Applicable to Financial Holding Companies — Restrictions on Shareholdings in Other Companies.”
Book Value and Fair Value
The following tables set out the book value and fair value of investments in our investment portfolio as of the dates indicated.
|
|
|
|
|
|
|
|
|
|
|
|
|
|
|
|
|
|
|
|
|
|
|
|
|
| |
|
As of December 31, |
|
| |
|
2020 |
|
|
2021 |
|
|
2022 |
|
| |
|
Book
Value |
|
|
Fair
Value |
|
|
Book
Value |
|
|
Fair
Value |
|
|
Book
Value |
|
|
Fair
Value |
|
| |
|
|
|
|
|
|
|
|
|
|
|
|
|
|
|
|
|
|
| |
|
(In billions of Won) |
|
| Securities at fair value through other comprehensive income |
|
|
|
|
|
|
|
|
|
|
|
|
|
|
|
|
|
|
|
|
|
|
|
|
| Equity securities |
|
W |
907 |
|
|
W |
907 |
|
|
W |
1,031 |
|
|
W |
1,031 |
|
|
W |
1,568 |
|
|
W |
1,568 |
|
| Debt securities: |
|
|
|
|
|
|
|
|
|
|
|
|
|
|
|
|
|
|
|
|
|
|
|
|
| Korean treasury and governmental agencies |
|
|
17,834 |
|
|
|
17,834 |
|
|
|
23,742 |
|
|
|
23,742 |
|
|
|
23,591 |
|
|
|
23,591 |
|
| Debt securities issued by financial institutions |
|
|
20,054 |
|
|
|
20,054 |
|
|
|
19,702 |
|
|
|
19,702 |
|
|
|
19,031 |
|
|
|
19,031 |
|
| Corporate debt securities |
|
|
15,690 |
|
|
|
15,690 |
|
|
|
15,827 |
|
|
|
15,827 |
|
|
|
13,959 |
|
|
|
13,959 |
|
| Debt securities issued by foreign government |
|
|
1,536 |
|
|
|
1,536 |
|
|
|
1,945 |
|
|
|
1,945 |
|
|
|
3,607 |
|
|
|
3,607 |
|
| Mortgage-backed and asset-backed securities |
|
|
2,295 |
|
|
|
2,295 |
|
|
|
2,591 |
|
|
|
2,591 |
|
|
|
1,906 |
|
|
|
1,906 |
|
|
|
|
|
|
|
|
|
|
|
|
|
|
|
|
|
|
|
|
|
|
|
|
|
|
| Total — Securities at fair value through other comprehensive income |
|
W |
58,316 |
|
|
W |
58,316 |
|
|
W |
64,838 |
|
|
W |
64,838 |
|
|
W |
63,662 |
|
|
W |
63,662 |
|
|
|
|
|
|
|
|
|
|
|
|
|
|
|
|
|
|
|
|
|
|
|
|
|
|
| Securities at amortized cost |
|
|
|
|
|
|
|
|
|
|
|
|
|
|
|
|
|
|
|
|
|
|
|
|
| Debt securities: |
|
|
|
|
|
|
|
|
|
|
|
|
|
|
|
|
|
|
|
|
|
|
|
|
| Korean treasury and governmental agencies |
|
W |
30,698 |
|
|
W |
32,147 |
|
|
W |
33,425 |
|
|
W |
33,579 |
|
|
W |
36,932 |
|
|
W |
32,874 |
|
| Debt securities issued by financial institutions |
|
|
4,071 |
|
|
|
4,222 |
|
|
|
3,718 |
|
|
|
3,772 |
|
|
|
6,764 |
|
|
|
6,528 |
|
| Corporate debt securities |
|
|
5,065 |
|
|
|
5,467 |
|
|
|
5,010 |
|
|
|
7,546 |
|
|
|
5,930 |
|
|
|
7,400 |
|
| Debt securities issued by foreign government |
|
|
1,118 |
|
|
|
1,245 |
|
|
|
1,254 |
|
|
|
798 |
|
|
|
1,439 |
|
|
|
947 |
|
| Mortgage-backed and asset-backed securities |
|
|
6,331 |
|
|
|
6,373 |
|
|
|
6,523 |
|
|
|
3,910 |
|
|
|
6,906 |
|
|
|
3,794 |
|
|
|
|
|
|
|
|
|
|
|
|
|
|
|
|
|
|
|
|
|
|
|
|
|
|
| Total — Securities at amortized cost |
|
W |
47,283 |
|
|
W |
49,454 |
|
|
W |
49,930 |
|
|
W |
49,605 |
|
|
W |
57,971 |
|
|
W |
51,543 |
|
|
|
|
|
|
|
|
|
|
|
|
|
|
|
|
|
|
|
|
|
|
|
|
|
|
110
|
|
|
|
|
|
|
|
|
|
|
|
|
|
|
|
|
|
|
|
|
|
|
|
|
| |
|
As of December 31, |
|
| |
|
2020 |
|
|
2021 |
|
|
2022 |
|
| |
|
Book
Value |
|
|
Fair
Value |
|
|
Book
Value |
|
|
Fair
Value |
|
|
Book
Value |
|
|
Fair
Value |
|
| |
|
|
|
|
|
|
|
|
|
|
|
|
|
|
|
|
|
|
| |
|
(In billions of Won) |
|
| Financial assets at fair value through profit or loss |
|
|
|
|
|
|
|
|
|
|
|
|
|
|
|
|
|
|
|
|
|
|
|
|
| Equity securities |
|
W |
1,736 |
|
|
W |
1,736 |
|
|
W |
2,375 |
|
|
W |
2,375 |
|
|
W |
2,624 |
|
|
W |
2,624 |
|
| Debt securities: |
|
|
|
|
|
|
|
|
|
|
|
|
|
|
|
|
|
|
|
|
|
|
|
|
| Korean treasury and governmental agencies |
|
|
4,038 |
|
|
|
4,038 |
|
|
|
3,557 |
|
|
|
3,557 |
|
|
|
3,832 |
|
|
|
3,832 |
|
| Debt securities issued by financial institutions |
|
|
14,013 |
|
|
|
14,013 |
|
|
|
13,627 |
|
|
|
13,627 |
|
|
|
11,636 |
|
|
|
11,636 |
|
| Corporate debt securities |
|
|
19,181 |
|
|
|
19,181 |
|
|
|
21,245 |
|
|
|
21,245 |
|
|
|
17,260 |
|
|
|
17,260 |
|
| Debt securities issued by foreign governments |
|
|
210 |
|
|
|
210 |
|
|
|
404 |
|
|
|
404 |
|
|
|
473 |
|
|
|
473 |
|
| Mortgage-backed and asset-backed securities |
|
|
595 |
|
|
|
595 |
|
|
|
265 |
|
|
|
265 |
|
|
|
338 |
|
|
|
338 |
|
| Other debt securities(1) |
|
|
17,050 |
|
|
|
17,050 |
|
|
|
19,130 |
|
|
|
19,130 |
|
|
|
17,990 |
|
|
|
17,990 |
|
|
|
|
|
|
|
|
|
|
|
|
|
|
|
|
|
|
|
|
|
|
|
|
|
|
| Sub-total — Securities at fair value |
|
|
56,823 |
|
|
|
56,823 |
|
|
|
60,603 |
|
|
|
60,603 |
|
|
|
54,153 |
|
|
|
54,153 |
|
|
|
|
|
|
|
|
|
|
|
|
|
|
|
|
|
|
|
|
|
|
|
|
|
|
| Others: |
|
|
|
|
|
|
|
|
|
|
|
|
|
|
|
|
|
|
|
|
|
|
|
|
| Loans at fair value |
|
|
2,017 |
|
|
|
2,017 |
|
|
|
1,683 |
|
|
|
1,683 |
|
|
|
2,389 |
|
|
|
2,389 |
|
| Due from banks at fair value |
|
|
63 |
|
|
|
63 |
|
|
|
34 |
|
|
|
34 |
|
|
|
26 |
|
|
|
26 |
|
| Gold/Silver deposits |
|
|
188 |
|
|
|
188 |
|
|
|
84 |
|
|
|
84 |
|
|
|
76 |
|
|
|
76 |
|
|
|
|
|
|
|
|
|
|
|
|
|
|
|
|
|
|
|
|
|
|
|
|
|
|
| Total — Financial assets at fair value through profit or loss |
|
W |
59,091 |
|
|
W |
59,091 |
|
|
W |
62,404 |
|
|
W |
62,404 |
|
|
W |
56,644 |
|
|
W |
56,644 |
|
|
|
|
|
|
|
|
|
|
|
|
|
|
|
|
|
|
|
|
|
|
|
|
|
|
Note:
| (1) |
Other debt securities included puttable equity investment, beneficiary certificates and restricted reserve for claims of customers’ deposits (trusts) classified as debt instruments in accordance with IFRS 9. |
Maturity Analysis
The following table categorizes our securities at amortized cost by maturity and weighted average yield as of December 31, 2022.
|
|
|
|
|
|
|
|
|
|
|
|
|
|
|
|
|
|
|
|
|
|
|
|
|
|
|
|
|
|
|
|
|
|
|
|
|
|
|
|
|
| |
|
As of December 31, 2022 |
|
| |
|
1 Year or Less |
|
|
Over 1 but within 5
Years |
|
|
Over 5 but within
10 Years |
|
|
Over 10 Years |
|
|
Total |
|
| |
|
Carrying
Amount |
|
|
Weighted
Average
Yield(1) |
|
|
Carrying
Amount |
|
|
Weighted
Average
Yield(1) |
|
|
Carrying
Amount |
|
|
Weighted
Average
Yield(1) |
|
|
Carrying
Amount |
|
|
Weighted
Average
Yield(1) |
|
|
Carrying
Amount |
|
|
Weighted
Average
Yield(1) |
|
| |
|
|
|
|
|
|
|
|
|
|
|
|
|
|
|
|
|
|
|
|
|
|
|
|
|
|
|
|
|
|
| |
|
(In billions of Won, except percentages) |
|
| Korean treasury securities and government agencies |
|
W |
4,553 |
|
|
|
1.57 |
% |
|
W |
12,600 |
|
|
|
2.90 |
% |
|
W |
7,010 |
|
|
|
3.66 |
% |
|
W |
12,769 |
|
|
|
2.35 |
% |
|
W |
36,932 |
|
|
|
2.69 |
% |
| Debt securities issued by financial institutions |
|
|
642 |
|
|
|
4.90 |
|
|
|
5,226 |
|
|
|
3.84 |
|
|
|
98 |
|
|
|
5.11 |
|
|
|
798 |
|
|
|
3.10 |
|
|
|
6,764 |
|
|
|
3.87 |
|
| Corporate debt securities |
|
|
473 |
|
|
|
2.15 |
|
|
|
2,262 |
|
|
|
3.76 |
|
|
|
817 |
|
|
|
3.59 |
|
|
|
2,378 |
|
|
|
3.00 |
|
|
|
5,930 |
|
|
|
3.30 |
|
| Debt securities issued by foreign governments |
|
|
233 |
|
|
|
3.64 |
|
|
|
429 |
|
|
|
3.70 |
|
|
|
164 |
|
|
|
7.33 |
|
|
|
613 |
|
|
|
2.78 |
|
|
|
1,439 |
|
|
|
3.72 |
|
| Mortgage-backed securities and asset-backed securities |
|
|
582 |
|
|
|
1.95 |
|
|
|
2,838 |
|
|
|
2.13 |
|
|
|
1,814 |
|
|
|
2.85 |
|
|
|
1,672 |
|
|
|
2.37 |
|
|
|
6,906 |
|
|
|
2.36 |
|
|
|
|
|
|
|
|
|
|
|
|
|
|
|
|
|
|
|
|
|
|
|
|
|
|
|
|
|
|
|
|
|
|
|
|
|
|
|
|
|
|
| Total |
|
W |
6,483 |
|
|
|
2.05 |
% |
|
W |
23,355 |
|
|
|
3.11 |
% |
|
W |
9,903 |
|
|
|
3.58 |
% |
|
W |
18,230 |
|
|
|
2.48 |
% |
|
W |
57,971 |
|
|
|
2.88 |
% |
|
|
|
|
|
|
|
|
|
|
|
|
|
|
|
|
|
|
|
|
|
|
|
|
|
|
|
|
|
|
|
|
|
|
|
|
|
|
|
|
|
111
Note:
| (1) |
The weighted-average yield for the portfolio represents the yield to maturity for each individual security, weighted using its amortized cost. |
Concentrations of Risk
The following table presents securities held by us whose aggregate book value exceeded 10% of our stockholders’ equity as of December 31, 2022. As of December 31, 2022, 10% of our stockholders’ equity was W5,113 billion.
|
|
|
|
|
|
|
|
|
| |
|
As of December 31, 2022 |
|
| |
|
Book Value |
|
|
Fair Value |
|
| |
|
|
|
|
|
|
| |
|
(In billions of Won) |
|
| Name of issuer: |
|
|
|
|
|
|
|
|
| Ministry of Strategy and Finance |
|
W |
61,823 |
|
|
W |
58,541 |
|
| The Korea Development Bank |
|
|
7,087 |
|
|
|
7,001 |
|
| The Bank of Korea |
|
|
8,077 |
|
|
|
8,078 |
|
| The Korea Housing Finance Corp |
|
|
8,953 |
|
|
|
8,196 |
|
| Industrial Bank of Korea |
|
|
5,396 |
|
|
|
5,394 |
|
All of the above entities are either an agency of the Government or an entity controlled by the Government.
Credit-Related Commitments and Guarantees
In the normal course of our operations, we make various commitments and guarantees to meet the financing and other business needs of our customers. Commitments and guarantees are usually in the form of, among others, commitments to extend credit, commercial letters of credit, standby letters of credit and performance guarantees. The contractual amount of these financial instruments represents the maximum possible loss amount if the account party draws down the commitment or we should fulfill our obligation under the guarantee and the account party fails to perform under the contract.
The following table sets forth our credit-related commitments and guarantees as of the dates indicated.
|
|
|
|
|
|
|
|
|
|
|
|
|
| |
|
As of December 31, |
|
| |
|
2020 |
|
|
2021 |
|
|
2022 |
|
| |
|
|
|
|
|
|
|
|
|
| |
|
(In billions of Won) |
|
| Commitments to extend credit |
|
W |
99,512 |
|
|
W |
101,055 |
|
|
W |
107,848 |
|
| Commercial letters of credit |
|
|
2,700 |
|
|
|
3,505 |
|
|
|
3,138 |
|
| Others(1) |
|
|
108,040 |
|
|
|
113,723 |
|
|
|
119,543 |
|
|
|
|
|
|
|
|
|
|
|
|
|
|
| Total |
|
W |
210,252 |
|
|
W |
218,283 |
|
|
W |
230,529 |
|
|
|
|
|
|
|
|
|
|
|
|
|
|
Note:
| (1) |
Consists of financial guarantees, performance guarantees, liquidity facilities to special purpose entities, acceptances, guarantee on trust accounts, endorsed bills and unused credit limits on credit cards. |
We have credit-related commitments that are not reflected in our statements of financial position, which primarily consist of commitments to extend credit and commercial letters of credit. Commitments to extend credit, including credit lines, represent unfunded portions of authorizations to extend credit in the form of loans. These commitments expire on fixed dates and a customer is required to comply with predetermined conditions to draw funds under the commitments. Commercial letters of credit are undertakings on behalf of customers authorizing third parties to make drawdowns up to a stipulated amount under specific terms and conditions. They are generally short-term and collateralized by the underlying shipments of goods to which they relate.
112
We also have guarantees that are recorded on our statements of financial position at their fair value at inception which are amortized over the life of the guarantees. Such guarantees generally include standby letters of credit, other financial and performance guarantees and liquidity facilities to special purpose entities. Standby letters of credit are irrevocable obligations to pay third-party beneficiaries when our customers fail to repay loans or debt instruments, which are generally in foreign currencies. A substantial portion of these standby letters of credit is secured by collateral, including trade-related documents. Other financial and performance guarantees are irrevocable assurances that we will pay beneficiaries if our customers fail to perform their obligations under certain contracts. Liquidity facilities to special purpose entities are irrevocable commitments to provide contingent liquidity credit lines to special purpose entities established by our customers in the event that a triggering event such as shortage of cash occurs.
The commitments and guarantees do not necessarily represent our exposure since they often expire unused.
Derivatives
As discussed under “— Our Principal Activities — Other Banking Services — Derivatives Trading” above, we engage in derivatives trading activities primarily on behalf of our customers so that they may hedge their risks and also enter into back-to-back derivatives with other financial institutions to cover exposures arising from such transactions. In addition, we enter into derivatives transactions to hedge against risk exposures arising from our own assets and liabilities, some of which are non-trading derivatives that do not qualify for hedge accounting treatment.
113
The following table shows, As of December 31, 2022, the gross notional or contractual amounts of derivatives held or issued for (i) trading and (ii) non-trading that qualify for hedge accounting.
|
|
|
|
|
|
|
|
|
|
|
|
|
| |
|
As of December 31, 2022 |
|
| |
|
Underlying
Notional
Amount(1) |
|
|
Estimated
Fair Value
Assets |
|
|
Estimated
Fair Value
Liabilities |
|
| |
|
|
|
|
|
|
|
|
|
| |
|
(In billions of Won) |
|
| Trading: |
|
|
|
|
|
|
|
|
|
|
|
|
| Foreign exchange derivatives: |
|
|
|
|
|
|
|
|
|
|
|
|
| Future and forward contracts |
|
W |
130,264 |
|
|
W |
3,090 |
|
|
W |
2,840 |
|
| Swaps |
|
|
40,558 |
|
|
|
1,626 |
|
|
|
1,807 |
|
| Options |
|
|
1,328 |
|
|
|
15 |
|
|
|
14 |
|
|
|
|
|
|
|
|
|
|
|
|
|
|
| Sub-total |
|
|
172,150 |
|
|
|
4,731 |
|
|
|
4,661 |
|
|
|
|
|
|
|
|
|
|
|
|
|
|
| Interest rate derivatives: |
|
|
|
|
|
|
|
|
|
|
|
|
| Future and forward contracts |
|
|
2,784 |
|
|
|
2 |
|
|
|
1 |
|
| Swaps |
|
|
131,974 |
|
|
|
773 |
|
|
|
1,063 |
|
| Options |
|
|
227 |
|
|
|
5 |
|
|
|
2 |
|
|
|
|
|
|
|
|
|
|
|
|
|
|
| Sub-total |
|
|
134,985 |
|
|
|
780 |
|
|
|
1,066 |
|
|
|
|
|
|
|
|
|
|
|
|
|
|
| Credit derivatives: |
|
|
|
|
|
|
|
|
|
|
|
|
| Swaps |
|
|
5,155 |
|
|
|
424 |
|
|
|
19 |
|
|
|
|
|
|
|
|
|
|
|
|
|
|
| Sub-total |
|
|
5,155 |
|
|
|
424 |
|
|
|
19 |
|
|
|
|
|
|
|
|
|
|
|
|
|
|
| Equity derivatives: |
|
|
|
|
|
|
|
|
|
|
|
|
| Swaps and forward contracts |
|
|
4,009 |
|
|
|
170 |
|
|
|
394 |
|
| Options |
|
|
2,322 |
|
|
|
14 |
|
|
|
147 |
|
| Future contracts |
|
|
2,443 |
|
|
|
31 |
|
|
|
100 |
|
|
|
|
|
|
|
|
|
|
|
|
|
|
| Sub-total |
|
|
8,774 |
|
|
|
215 |
|
|
|
641 |
|
|
|
|
|
|
|
|
|
|
|
|
|
|
| Commodity derivatives: |
|
|
|
|
|
|
|
|
|
|
|
|
| Swaps and forward contracts |
|
|
898 |
|
|
|
11 |
|
|
|
137 |
|
| Options |
|
|
8 |
|
|
|
— |
|
|
|
1 |
|
| Future contracts |
|
|
70 |
|
|
|
3 |
|
|
|
1 |
|
|
|
|
|
|
|
|
|
|
|
|
|
|
| Sub-total |
|
|
976 |
|
|
|
14 |
|
|
|
139 |
|
|
|
|
|
|
|
|
|
|
|
|
|
|
| Total |
|
W |
322,040 |
|
|
W |
6,164 |
|
|
W |
6,526 |
|
|
|
|
|
|
|
|
|
|
|
|
|
|
| Non-trading: |
|
|
|
|
|
|
|
|
|
|
|
|
| Hedge accounting: |
|
|
|
|
|
|
|
|
|
|
|
|
| Foreign exchange derivatives: |
|
|
|
|
|
|
|
|
|
|
|
|
| Swaps |
|
W |
4,647 |
|
|
W |
158 |
|
|
W |
72 |
|
| Future and forward contracts |
|
|
1,250 |
|
|
|
23 |
|
|
|
38 |
|
|
|
|
|
|
|
|
|
|
|
|
|
|
| Sub-total |
|
|
5,897 |
|
|
|
181 |
|
|
|
110 |
|
|
|
|
|
|
|
|
|
|
|
|
|
|
| Interest rate derivatives: |
|
|
|
|
|
|
|
|
|
|
|
|
| Swaps |
|
|
16,475 |
|
|
|
117 |
|
|
|
1,069 |
|
|
|
|
|
|
|
|
|
|
|
|
|
|
| Total |
|
W |
22,372 |
|
|
W |
298 |
|
|
W |
1,179 |
|
|
|
|
|
|
|
|
|
|
|
|
|
|
Note:
| (1) |
Notional amounts in foreign currencies were converted into Won at prevailing exchange rates as of December 31, 2022. |
114
Funding
We obtain funding from a variety of sources, both domestic and foreign. Our principal source of funding is customer deposits obtained from our banking operations, and we from time to time issue equity and debt securities, including preferred shares. In addition, our subsidiaries acquire funding through call money, borrowings from the Bank of Korea, other short-term borrowings, corporate debentures and other long-term debt, including debt and equity securities issuances, asset-backed securitizations and repurchase transactions, to complement, or if necessary, replace funding through customer deposits. For further details relating to funding by us and our subsidiaries, see “Item 5.B. Liquidity and Capital Resources.”
Deposits
Although the majority of our bank deposits are short-term, the majority of our depositors have historically rolled over their deposits at maturity, providing our banking operation with a stable source of funding.
The following table shows the average balances of our deposits and the average rates paid on our deposits for the periods indicated, and the outstanding balances of uninsured deposits as of the ends of periods indicated.
|
|
|
|
|
|
|
|
|
|
|
|
|
|
|
|
|
|
|
|
|
|
|
|
|
| |
|
2020 |
|
|
2021 |
|
|
2022 |
|
| |
|
Average
Balance(1) |
|
|
Average Rate
Paid |
|
|
Average
Balance(1) |
|
|
Average Rate
Paid |
|
|
Average
Balance(1) |
|
|
Average Rate
Paid |
|
| |
|
|
|
|
|
|
|
|
|
|
|
|
|
|
|
|
|
|
| |
|
(In billions of Won, except percentages) |
|
| Non-interest-bearing deposits: |
|
W |
3,908 |
|
|
|
— |
|
|
W |
4,818 |
|
|
|
— |
|
|
W |
5,390 |
|
|
|
— |
|
| Interest-bearing deposits: |
|
|
|
|
|
|
|
|
|
|
|
|
|
|
|
|
|
|
|
|
|
|
|
|
| Demand deposits |
|
W |
50,751 |
|
|
|
0.33 |
% |
|
W |
65,907 |
|
|
|
0.32 |
% |
|
W |
68,656 |
|
|
|
0.47 |
% |
| Savings deposits |
|
|
91,474 |
|
|
|
0.32 |
|
|
|
106,172 |
|
|
|
0.23 |
|
|
|
108,419 |
|
|
|
0.40 |
|
| Time deposits |
|
|
154,516 |
|
|
|
1.46 |
|
|
|
153,718 |
|
|
|
1.05 |
|
|
|
174,029 |
|
|
|
2.04 |
|
| Other deposits |
|
|
8,482 |
|
|
|
1.42 |
|
|
|
11,180 |
|
|
|
0.91 |
|
|
|
17,169 |
|
|
|
1.97 |
|
|
|
|
|
|
|
|
|
|
|
|
|
|
|
|
|
|
|
|
|
|
|
|
|
|
| Total interest-bearing deposits |
|
W |
305,223 |
|
|
|
0.93 |
% |
|
W |
336,977 |
|
|
|
0.65 |
% |
|
W |
368,273 |
|
|
|
1.26 |
% |
|
|
|
|
|
|
|
|
|
|
|
|
|
|
|
|
|
|
|
|
|
|
|
|
|
|
|
|
|
| |
|
2020 |
|
|
2021 |
|
|
2022 |
|
| |
|
(In billions of Won) |
|
| Uninsured deposits |
|
|
W242,927 |
|
|
|
W275,519 |
|
|
|
W288,754 |
|
|
|
|
|
|
|
|
|
|
|
|
|
|
Note:
| (1) |
Average balances are based on (a) daily balances of Shinhan Bank and (b) quarterly balances for other subsidiaries. |
For a breakdown of deposit products, see “— Our Principal Activities — Deposit-taking Activities,” except that cover bills sold are recorded on short-term borrowings and securities sold under repurchase agreements are recorded as secured borrowings.
115
Uninsured Time Deposits
The following table shows the amount of time deposits that exceed the insurance limit as of December 31, 2022, and the amount of time deposits that are otherwise uninsured, segregated by remaining maturity as of December 31, 2022.
|
|
|
|
|
| |
|
As of December 31, 2022 |
|
| |
|
|
|
| |
|
(In billions of Won) |
|
| Portion of Time deposits in excess of insurance limit: |
|
W |
98,427 |
|
| Time deposits otherwise uninsured with a maturity of: |
|
|
|
|
| Maturing within three months |
|
W |
24,459 |
|
| After three but within six months |
|
|
9,798 |
|
| After six but within 12 months |
|
|
19,416 |
|
| After 12 months |
|
|
4,262 |
|
|
|
|
|
|
| Total |
|
W |
57,935 |
|
|
|
|
|
|
116
Short-term Borrowings
The following table presents information regarding our short-term borrowings (borrowings with a maturity of one year or less) for the periods indicated.
|
|
|
|
|
|
|
|
|
|
|
|
|
|
|
|
|
|
|
|
|
|
|
|
|
|
|
|
|
|
|
|
|
|
|
|
|
|
|
|
|
|
|
|
|
|
|
|
|
|
|
|
|
|
|
|
|
|
|
|
|
| |
|
2020 |
|
|
2021 |
|
|
2022 |
|
| |
|
Balance
Outstanding |
|
|
Average
Balance
Outstanding(1) |
|
|
Highest
Balances at
Any
Month-end |
|
|
Weighted
Average
Interest
Rate(2) |
|
|
Year-end
Interest Rate |
|
|
Balance
Outstanding |
|
|
Average
Balance
Outstanding(1) |
|
|
Highest
Balances at
Any
Month-end |
|
|
Weighted
Average
Interest
Rate(2) |
|
|
Year-end
Interest Rate |
|
|
Balance
Outstanding |
|
|
Average
Balance
Outstanding(1) |
|
|
Highest
Balances at
Any
Month-end |
|
|
Weighted
Average
Interest
Rate(2) |
|
|
Year-end
Interest Rate |
|
| |
|
|
|
|
|
|
|
|
|
|
|
|
|
|
|
|
|
|
|
|
|
|
|
|
|
|
|
|
|
|
|
|
|
|
|
|
|
|
|
|
|
|
|
|
|
| |
|
(In billions of Won, except for percentages) |
|
| Borrowings from |
|
|
|
|
|
|
|
|
|
|
|
|
|
|
|
|
|
|
|
|
|
|
|
|
|
|
|
|
|
|
|
|
|
|
|
|
|
|
|
|
|
|
|
|
|
|
|
|
|
|
|
|
|
|
|
|
|
|
|
|
| The Bank of Korea(3) |
|
W |
5,351 |
|
|
W |
3,479 |
|
|
W |
5,351 |
|
|
|
0.30 |
% |
|
|
0.25 |
% |
|
W |
5,278 |
|
|
W |
5,310 |
|
|
W |
5,545 |
|
|
|
0.25 |
% |
|
|
0.25 |
% |
|
W |
5,100 |
|
|
W |
5,082 |
|
|
W |
5,157 |
|
|
|
0.62 |
% |
|
|
0.25 – 1.75 |
% |
| Call money |
|
|
1,760 |
|
|
|
1,221 |
|
|
|
1,760 |
|
|
|
1.60 |
|
|
|
0.35 – 0.55 |
|
|
|
1,535 |
|
|
|
1,575 |
|
|
|
2,015 |
|
|
|
1.31 |
|
|
|
(0.30) – 1.52 |
|
|
|
1,276 |
|
|
|
2,301 |
|
|
|
3,750 |
|
|
|
2.65 |
|
|
|
0.00 – 6.30 |
|
| Other short-term borrowings(4) |
|
|
24,360 |
|
|
|
25,401 |
|
|
|
27,347 |
|
|
|
1.05 |
|
|
|
0.00 – 12.45 |
|
|
|
28,559 |
|
|
|
25,602 |
|
|
|
28,559 |
|
|
|
0.75 |
|
|
|
(0.49) – 12.29 |
|
|
|
34,002 |
|
|
|
33,757 |
|
|
|
38,263 |
|
|
|
1.73 |
|
|
|
0.00 – 21.20 |
|
|
|
|
|
|
|
|
|
|
|
|
|
|
|
|
|
|
|
|
|
|
|
|
|
|
|
|
|
|
|
|
|
|
|
|
|
|
|
|
|
|
|
|
|
|
|
|
|
|
|
|
|
|
|
|
|
|
|
|
|
|
|
|
W |
31,471 |
|
|
W |
30,101 |
|
|
W |
34,458 |
|
|
|
0.98 |
% |
|
|
|
|
|
W |
35,372 |
|
|
W |
32,487 |
|
|
W |
36,119 |
|
|
|
0.70 |
% |
|
|
|
|
|
W |
40,378 |
|
|
W |
41,140 |
|
|
W |
47,170 |
|
|
|
1.65 |
% |
|
|
|
|
|
|
|
|
|
|
|
|
|
|
|
|
|
|
|
|
|
|
|
|
|
|
|
|
|
|
|
|
|
|
|
|
|
|
|
|
|
|
|
|
|
|
|
|
|
|
|
|
|
|
|
|
|
|
|
|
|
|
|
|
|
Notes:
| (1) |
Average balances are based on (a) daily balances of Shinhan Bank and (b) quarterly balances for other subsidiaries. |
| (2) |
Weighted-average interest rates are calculated by dividing the total interest expenses by the average amount borrowed. |
| (3) |
Borrowings from the Bank of Korea generally mature within one month for borrowings in Won and six months for borrowings in foreign currencies. |
| (4) |
Other short-term borrowings included bonds sold under repurchase agreements and borrowings in domestic and foreign currencies. |
Our short-term borrowings have maturities of less than one year and are generally unsecured with the exception of borrowings from the Bank of Korea, which are generally secured with securities at fair value through other comprehensive income or at amortized cost held by us.
117
Risk Management
Overview
As a financial services provider, we are exposed to various risks relating to our lending, credit card, insurance, securities investment, trading and leasing businesses, our deposit taking and borrowing activities and our operating environment. The principal risks to which we are exposed are credit risk, market risk, interest rate risk, liquidity risk and operational risk. These risks are recognized, measured and reported in accordance with risk management guidelines established at our holding company level and implemented at the subsidiary level through a carefully stratified checks-and-balances system.
We believe that our risk management system has been instrumental to building our reputation as a well-managed and prudent financial service provider and withstanding various external shocks. In particular, during the global financial crisis of 2008 and 2009, we believe our risk management provided effective early warning signals which helped us to proactively reconfigure our asset portfolio and substantially reduce our exposure to troubled debtors and thereby avoid what could have been a substantially greater credit loss during such crisis, and we are carefully upgrading and refining our risk management system in the face of current and potential economic difficulties at global, regional and domestic levels.
Our group-wide risk management philosophy is to instill a culture of effective risk management and awareness at all levels of our organization and pursue a proper balance between risk and return in our business activities in order to achieve a sustainable growth. In particular, our group-wide risk management is guided by the following core principles:
| |
• |
|
carrying out all business activities within prescribed risk tolerance levels and prudently balancing profitability and risk management; |
| |
• |
|
standardizing the risk management process and monitoring compliance at a group-wide level; |
| |
• |
|
operating a prudent risk management decision making system backed by active participation by management; |
| |
• |
|
creating and operating a risk management organization independent of business activities; |
| |
• |
|
operating a performance management system that enhances clear and prompt identification of risks when making business decisions; |
| |
• |
|
aiming to achieve preemptive and practical risk management; and |
| |
• |
|
prudent preparation for known and unknown contingencies. |
We take the following steps to implement the foregoing risk management principles:
| |
• |
|
risk capital management — Risk capital refers to capital necessary to compensate for losses in case of a potential risk being realized, and risk capital management refers to the process of asset management based on considerations of risk exposure and risk appetite for our total assets so that we can maintain an appropriate level of risk capital. As part of our risk capital management, we and our subsidiaries have adopted and maintain various risk planning processes and reflect such risk planning in our business and financial planning. We also maintain a risk limit management system to ensure that risks in our business do not exceed prescribed limits. |
| |
• |
|
risk monitoring — We proactively, preemptively and periodically review risks that may impact our overall operations, including through a multidimensional risk monitoring system. Currently, each of our subsidiaries is required to report to the holding company any factors that could have a material impact on group-wide risk management, and the holding company reports to our chief risk officer and other members of our senior management the results of risk monitoring weekly, monthly and on an ad hoc basis as needed. In addition, we perform preemptive risk management through a “risk dashboard |
118
| |
system” under which we closely monitor any increase in asset size, risk levels and sensitivity to external factors with respect to the major asset portfolios of each of our subsidiaries, and to the extent such monitoring yields any warning signals, we promptly analyze the causes and, if necessary, formulate and implement actions in response thereto. |
| |
• |
|
risk review — Prior to entering any new business, offering any new products or changing any major policies, we review any relevant risk factors based on a prescribed risk management checklist and, in the case of changes for which assessment of risk factors is difficult, perform reasonable decision-making in order to avoid taking any unduly risky action. The risk management departments of all our subsidiaries are required to review all new businesses, products and services prior to their launch and closely monitor the development of any related risks following their launch, and in the case of any action that involves more than one subsidiary, the relevant risk management departments are required to consult with the risk management team at the holding company level prior to making any independent risk reviews. |
| |
• |
|
crisis management — We maintain a group-wide risk management system to detect the early warning signals of any crisis and, in the event of a crisis actually happening, to respond on a timely, efficient and flexible basis so as to ensure our survival as a going concern. Each of our subsidiaries maintains crisis planning for three levels of contingencies, namely, “alert,” “imminent crisis” and “crisis,” determination of which is made based on quantitative and qualitative monitoring and consequence analysis, and upon the occurrence of any such contingency, is required to respond according to a prescribed contingency plan. At the holding company level, we maintain and install a crisis detection and response system which is applied consistently group-wide, and upon the occurrence of an “imminent crisis” or “crisis” event at a subsidiary level, we directly take charge of the situation at the holding company level so that we manage it on a concerted group-wide basis. |
Organization
Our risk management system is organized along the following hierarchy (from top to bottom): at the holding company level, the Group Risk Management Committee, the Group Risk Management Council, the Group Chief Risk Officer and the Group Risk Management Team, and at the subsidiary level, the Risk Management Committee, the Chief Risk Officer and the Risk Management Team of the relevant subsidiary. The Group Risk Management Committee, which is under the supervision of our holding company’s board of directors, sets the basic group-wide risk management policies and strategies. Our Group Chief Risk Officer reports to the Group Risk Management Committee, and the Group Risk Management Council coordinates the risk management policies and strategies at the group level as well as at the subsidiary level among each of our subsidiaries. Each of our subsidiaries also has a separate Risk Management Committee, Risk Management Working Committee and Risk Management Team, whose tasks are to implement the group-wide risk management policies and strategies at the subsidiary level as well as to set risk management policies and strategies specific to such subsidiary in line with the group-wide guidelines. We also have the Group Risk Management Team, which supports our Chief Risk Officer in his or her risk management and supervisory role.
In order to maintain the group-wide risk at an appropriate level, we use a hierarchical risk limit system under which the Group Risk Management Committee assigns reasonable risk limits for the entire group and each of our subsidiaries, and the Risk Management Committee and the Risk Management Working Committee of each of our subsidiaries manage the subsidiary-specific risks by establishing and managing risk limits in more detail by type of risk and type of product for each department and division within such subsidiary. Further details follow.
At the holding company level:
| |
• |
|
Group Risk Management Committee — The Group Risk Management Committee consists of four outside directors of our holding company. The Group Risk Management Committee convenes at least |
119
| |
quarterly and on an ad hoc basis as needed. Specifically, the Group Risk Management Committee does the following: (i) establish the overall risk management policies consistent with management strategies, (ii) set reasonable risk limits for the entire group and each of our subsidiaries, (iii) approve appropriate investment limits or permissible loss limits, (iv) enact and amend risk management regulations, and (v) decide other risk management-related issues the board of directors or the Group Risk Management Committee sees fit to discuss. The results of the Group Risk Management Committee meetings are reported to the board of directors of our holding company. The Group Risk Management Committee makes decisions through affirmative votes by a majority of the committee members. |
| |
• |
|
Group Risk Management Council — Comprised of the Group Chief Risk Officer and Chief Risk Officers of each of our subsidiaries, the Group Risk Management Council provides a forum for risk management executives from each subsidiary to discuss our group-wide risk management guidelines and strategy in order to maintain consistency in the group-wide risk policies and strategies. |
| |
• |
|
Group Chief Risk Officer — The Group Chief Risk Officer assists the Group Risk Management Committee by implementing the risk policies and strategies as well as ensuring consistency in the risk management systems of our subsidiaries. Furthermore, the Group Chief Risk Officer evaluates the Chief Risk Officer of each subsidiary in addition to monitoring the risk management practices of each subsidiary. |
| |
• |
|
Group Risk Management Team — This team provides support and assistance to the Group Chief Risk Officer in carrying out his or her responsibilities. |
At the subsidiary level:
| |
• |
|
Risk Management Committee — In order to maintain group-wide risk at an appropriate level, we have established a hierarchical risk limit system where the Group Risk Management Committee establishes risk limits for us and our subsidiaries, and each of our subsidiaries establishes and manages risk limits in more detail by type of risk and type of product for each department and division within such subsidiary. In accordance with the group risk management policies and strategies, the Risk Management Committee at the subsidiary level establishes its own risk management policies and strategies in more detail and the respective risk management department implements those policies and strategies. |
| |
• |
|
Risk Management Team — The Risk Management Team, operating independently from the business units of each of our subsidiaries, monitors, assesses, manages and controls the overall risk of its operations and reports all major risk-related issues to the Group Risk Management Team at the holding company level, which then reports to the Group Chief Risk Officer. |
120
The following is a flowchart of our risk management system at the holding company level and the subsidiary level.
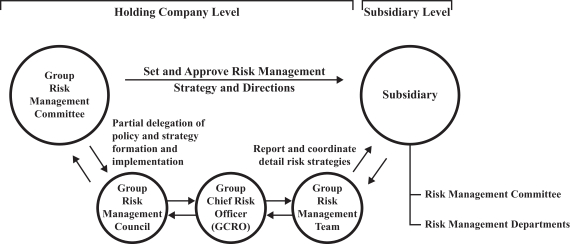
Credit Risk Management
Credit risk, which is the risk of loss from default by borrowers, other obligors or other counterparties to the transactions that we have entered into, is the greatest risk we face. Our credit risk management encompasses all areas of credit that may result in potential economic loss, including not just transactions that are recorded on our balance sheets, but also off-balance-sheet transactions such as guarantees, loan commitments and derivatives transactions. A substantial majority of our credit risk relates to the operations of Shinhan Bank and Shinhan Card.
Credit Risk Management of Shinhan Bank
Shinhan Bank’s credit risk management is guided by the following principles:
| |
• |
|
achieve a profit level corresponding to the level of risks involved; |
| |
• |
|
improve asset quality and achieve an optimal mix of asset portfolios; |
| |
• |
|
avoid excessive loan concentration in a particular borrower or sector; |
| |
• |
|
closely monitor the borrower’s ability to repay the debt; and |
| |
• |
|
provide financial support to advance the growth of select customers. |
Major policies for Shinhan Bank’s credit risk management, including Shinhan Bank’s overall credit risk management plan and credit policy guidelines, are determined by the Risk Policy Committee of Shinhan Bank, the executive decision-making body for management of credit risk. The Risk Policy Committee is headed by the Chief Risk Officer, and also comprises of the Chief Credit Officer and the heads of each business unit. In order to separate the loan approval functions from credit policy decision-making, Shinhan Bank has a Credit Review Committee that performs credit review evaluations with a focus on improving the asset quality of and profitability from the loans being made and operates separately from the Risk Policy Committee. Both the Risk Policy Committee and the Credit Review Committee make decisions by a vote of two-thirds or more of the attending members of the respective committees, which must constitute at least two-thirds of the respective committee members to satisfy the respective quorum.
121
Shinhan Bank complies with credit risk management procedures pursuant to internal guidelines and regulations and continually monitors and improves these guidelines and regulations. Its credit risk management procedures include:
| |
• |
|
credit evaluation and approval; |
| |
• |
|
credit review and monitoring; and |
| |
• |
|
credit risk assessment and control. |
Credit Evaluation and Approval
All loan applicants and guarantors are subject to credit evaluation before approval of any loans. Credit evaluation of loan applicants is carried out by senior officers of Shinhan Bank specifically charged with granting loan approvals. Loan evaluation is carried out by a group rather than by an individual reviewer through an objective and deliberative process. Credit ratings of loan applicants and guarantors influence loan interest rates, the level of internal approval required, credit exposure limits, calculation of potential losses and estimated cost of capital, and therefore are determined objectively and independently by the relevant business unit. Shinhan Bank uses a credit scoring system for retail loans and a credit-risk rating system for corporate loans.
Each of Shinhan Bank’s borrowers is assigned a credit rating, which is based on a comprehensive internal credit evaluation system that considers a variety of criteria. For retail borrowers, the credit rating takes into account the borrower’s biographic details, past dealings with Shinhan Bank and external credit rating information, among other things. For corporate borrowers, the credit rating takes into account financial indicators as well as non-financial indicators such as industry risk, operational risk and management risk, among other things. The credit rating, once assigned, serves as the fundamental instrument for Shinhan Bank’s credit risk management, and is applied to a wide range of credit risk management processes, including credit approval, credit limit management, loan pricing and computation of allowance for credit losses on loans. Shinhan Bank has separate credit evaluation systems for retail customers, SOHO customers and corporate customers, which are further segmented and refined to meet Basel II requirements, which requirements have not changed under Basel III.
Retail Loans
Loan applications for retail loans are reviewed in accordance with Shinhan Bank’s credit scoring system and the objective statistics models for secured and unsecured loans maintained and operated by Shinhan Bank’s Retail Banking Division. Shinhan Bank’s credit scoring system is an automated credit approval system used to evaluate loan applications and determine the appropriate pricing for the loan, and takes into account factors such as a borrower’s personal information, transaction history with Shinhan Bank and other financial institutions and other relevant credit information. The applicant is assigned a score, which is used to determine (i) whether to approve the applicant’s loan, (ii) the amount of loan to be granted, and (iii) the interest rates thereon. The applicant’s score also determines whether the applicant is approved for credit, conditionally approved, subject to further assessment, or denied. If the applicant becomes subject to further assessment, the appropriate discretionary body, either at the branch level or at the headquarter level, makes a reassessment based on qualitative as well as quantitative factors, such as credit history, occupation and past relationship with Shinhan Bank.
For mortgage and home equity loans and loans secured by real estate, Shinhan Bank evaluates the value of the real estate offered as collateral using a proprietary database, which contains information about real estate values throughout Korea. In addition, Shinhan Bank uses up-to-date information provided by third parties regarding the real estate market and property values in Korea. While Shinhan Bank uses internal staff from the processing centers to appraise the value of the real estate collateral, Shinhan Bank also hires certified appraisers to review and co-sign the appraisal value of real estate collateral that have an appraisal value exceeding W3 billion, as initially determined by the processing centers. Shinhan Bank also reevaluates internally, on a summary basis, the appraisal value of collateral at least every year.
122
For loans secured by securities, deposits or other assets other than real estate, Shinhan Bank requires borrowers to observe specified collateral ratios in respect of secured obligations.
Corporate Loans
Shinhan Bank rates all of its corporate borrowers using internally developed credit evaluation systems. These systems consider a variety of criteria (quantitative, qualitative, financial and non-financial) in order to standardize credit decisions and focus on the quality of borrowers rather than the size of loans. The quantitative considerations include the borrower’s financial and other data, while the qualitative considerations are based on the judgment of Shinhan Bank’s credit officers as to the borrower’s ability to repay. Financial considerations include financial variables and ratios based on customer’s financial statements, such as return on assets and cash flow to total debt ratios, and non-financial considerations include, among other things, the industry to which the borrower’s businesses belong, the borrower’s competitive position in its industry, its operating and funding capabilities, the quality of its management and controlling stockholders (based in part on interviews with its officers and employees), technological capabilities and labor relations.
In addition, in order to enhance the accuracy of its internal credit reviews, Shinhan Bank also considers reports prepared by external credit rating services, such as Nice Information Service and Korea Rating & Data (KoDATA), and monitors and improves the effectiveness of the credit risk-rating systems using a database that it updates continually with actual default records.
Based on the scores calculated under the credit rating system, which takes into account the evaluation criteria described above and the probability of default, Shinhan Bank assigns the borrower one of 23 grades (from the highest of AAA to the lowest of D3). Grades AA through B are further broken down into “+”, “0” or “-.” Grades AAA through B- are classified as normal, grade CCC precautionary, and grades CC through D3 non-performing. The credit risk-rating model is further differentiated by the size of the corporate borrower and the type of credit facilities.
Loan Approval Process
Loans are generally approved after evaluations and approvals by the relationship manager at the branch level as well as the committee of the applicable business unit at Shinhan Bank. The approval limit for retail loans is made based on Shinhan Bank’s automated credit scoring system. In the case of large corporate loans, approval limits are also reviewed and approved by a Credit Officer at the headquarter level. Depending on the size and the importance of the loan, the approval process is further reviewed by the Credit Officer Committee or the Master Credit Officer Committee. If the loan is considered significant or the amount exceeds the discretion limit of the Master Credit Officer Committee, further evaluation is made by the Credit Review Committee, which is Shinhan Bank’s highest decision-making body in relation to credit approval. The Credit Review Committee’s evaluation and approval of loan limits vary depending on the borrower’s credit ratings as determined by Shinhan Bank’s internal credit rating system and the borrower’s size of business. For example, for borrowers with a credit rating of B-, the Credit Review Committee evaluates and approves unsecured loans in excess of W10 billion and secured loans in excess of W15 billion, whereas for borrowers with a credit rating of AAA, the Credit Review Committee evaluates and approves unsecured loans in excess of W60 billion and secured loans in excess of W120 billion. The Credit Review Committee holds at least two meetings a week to approve applications for large-sized loans whose principal amounts exceed prescribed levels set by it.
123
The chart below summarizes the credit approval process of our banking operation. The Master Credit Officer and the Head of Business Division do not make individual decisions on loan approval, but are part of the decision-making process at the group level.
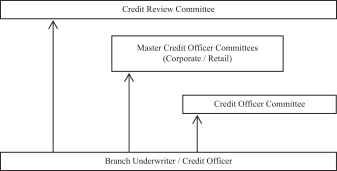
The reviewer at each level of the review process may in its discretion approve loans up to a maximum amount per loan assigned to such level. The discretionary loan approval limit for each level of the loan approval process takes into account the total amount of loans extended to the borrower, the credit level of the applicant based on credit review, the existence and value of collateral, the size of business and the level of credit risk established by the credit rating system. The discretionary loan amount approval limit ranges from W50 million for unsecured retail loans with a credit rating of B-, which are subject to approvals by the retail branch manager, to W120 billion for secured loans with a credit rating of AAA, which are subject to approvals by the Master Credit Officer Committee. Any loans exceeding the maximum discretionary loan amount approval limit must be approved by the Credit Review Committee.
Credit Review and Monitoring
Shinhan Bank continually reviews and monitors credit risks primarily with respect to borrowers. In particular, Shinhan Bank’s automated early warning system conducts daily examination for borrowers using financial and non-financial factors, and the branch manager and the credit officer must conduct periodic loan monitoring and report to an independent Credit Review Department which analyzes the results in detail and adjusts monitoring grades and credit ratings accordingly. Based on these reviews, Shinhan Bank adjusts a borrower’s credit rating, credit limit and credit policies. In addition, the group credit ratings of the main debtor groups, if applicable, may be adjusted followed by a periodic review of the main debtor groups, as identified by the Governor of the Financial Supervisory Service based on their outstanding credit exposures. Shinhan Bank also continually reviews other factors, such as industry-specific conditions for the borrower’s business and its domestic and overseas asset base and operations, in order to ensure that the assigned ratings are appropriate. The Credit Review Department provides credit review reports, independent of underwriting, to the Chief Risk Officer on a monthly basis.
The early warning system performs automatic daily checks for borrowers to whom Shinhan Bank has credit exposure (which represents the total outstanding amount due from a borrower, net of collateral for deposit, installment savings, guarantees and import guarantee money). When the early warning systems detect warning signals, such signals and other findings from the loan monitoring are reviewed by the Credit Review Department. In addition, Shinhan Bank carries out credit review in a timely manner on each borrower in accordance with changes in credit risk factors based on changes in the economic environment. The results of such credit review are continually reported to the Chief Risk Officer of Shinhan Bank.
Depending on the nature of the signals detected by the early warning system, a borrower may be classified as “worsening credit” and become subject to evaluation for a possible downgrade in credit rating, or may be initially classified as “showing early warning signs” or become reinstated to the “normal borrower” status. For
124
borrowers classified as “showing early warning signs,” the relevant branch manager gathers information and conducts a review of the borrower to determine whether the borrower should be classified as a worsening credit or whether to impose management improvement warnings or implement joint creditors’ management. If the borrower becomes non-performing, Shinhan Bank’s collection department directly manages such borrower’s account in order to maximize recovery rate, and conducts auctions, court proceedings, sale of assets or corporate restructuring as needed.
Pursuant to the foregoing credit review and monitoring procedures and in order to promptly prevent deterioration of loan qualities, Shinhan Bank classifies potentially problematic borrowers into (i) borrowers that show early warning signals, (ii) borrowers that require precaution, (iii) borrowers that require observation and (iv) normal borrowers, and treats them differentially accordingly.
In order to curtail delinquency among its corporate customers, Shinhan Bank primarily takes the following measures: (i) systematic monitoring of borrowers with outstanding loans, (ii) heightened monitoring of borrowers with bad credit history and/or borrowers that belong to troubled industries and (iii) assignment of industry-specific lending caps, as adjusted for whether specific industries are particularly sensitive to general business cycles and/or are troubled at a given time.
Systematic monitoring of borrowers with outstanding loans. Shinhan Bank currently applies a heightened monitoring system to corporate borrowers with outstanding loans (other than guaranteed loans and loans secured by specified types of collaterals such as deposits with us or letters of credit). Under this monitoring system, each borrower is assigned to one of the following ratings:
| |
• |
|
“Normal Company” — a borrower who is determined to have a low probability of insolvency with a credit rating above CCC (sub-borrower rating applicable); |
| |
• |
|
“Observation Company” — a borrower that carries some risk of affecting the corporate insolvency in the future and is subject to consistent observation to detect any change of such risk; |
| |
• |
|
“Precaution Company” — a borrower with a possibility of insolvency due to an increase in risk of default and therefore requires detailed inspection of the credit quality of such borrower and precaution in extending any further loans; |
| |
• |
|
“Early Warning Company” — a borrower with a high possibility of insolvency; and |
| |
• |
|
“Problematic Reorganized Company” — a borrower currently undergoing rehabilitation procedures, such as management improvement plans, workout or corporate recovery or showing no signs of recovery. |
Shinhan Bank conducts systematic monitoring of the foregoing borrowers at intervals depending on the borrower’s monitoring grade determined by the early warning system (for example, every 3 or 6 months for an “Observation Company”, and 3 months for borrowers with a monitoring grade below “Precaution Company” or borrowers with a credit rating below CCC, and no regular monitoring for a “Normal Company”). In addition, the Review Credit Officer may request more frequent monitoring if the borrower is showing signs of deteriorated credit quality. For borrowers with outstanding loan amounts of W2 billion or more, Shinhan Bank also monitors the revenues and earnings of such borrower on a quarterly basis within five to seven weeks following the end of each quarter depending on the borrower’s credit profile.
Heightened monitoring of borrowers with bad credit history and/or borrowers that belong to troubled industries. In addition to the systematic monitoring discussed above, Shinhan Bank also carries out additional monitoring for borrowers that, among others, (i) are rated as “requiring observation,” “requiring precaution” or “with early warning signs” as noted above, (ii) have prior history of delinquency or restructuring or (iii) have borrowings that are classified as substandard or below. Based on the heightened monitoring of these borrowers, Shinhan Bank adjusts contingency planning as to how the overall asset quality of a specific industry should be
125
managed for each phase of the business cycle, how Shinhan Bank should limit or reduce its credit exposure to such borrowers, and how our group-wide delinquency and non-performing ratio would be changed, among other things.
Credit Risk Assessment and Control
In order to assess credit risk in a systematic manner, Shinhan Bank has developed and upgraded systems designed to quantify credit risk based on selection and monitoring of various statistics, including delinquency rate, non-performing loan ratio, expected loan losses and weighted average risk rating.
Shinhan Bank controls loan concentration by monitoring and managing loans at two levels: portfolio level and individual loan account level. In order to maintain portfolio-level credit risk at an appropriate level, Shinhan Bank manages its loans using value-at-risk (“VaR”) limits for the entire bank as well as for each of its business units. In order to prevent concentration of risk in a particular borrower or borrower class, Shinhan Bank also manages credit risk by borrower, industry, country and other detailed categories.
Shinhan Bank measures credit risk using internally accumulated data. Shinhan Bank measures expected and unexpected losses with respect to total assets monthly, which Shinhan Bank refers to when setting risk limits for, and allocating capital to, its business groups. Expected loss is calculated based on the probability of default, the loss given default, the exposure at default and the past bankruptcy rate and recovery rate, and Shinhan Bank provides allowance for loan losses accordingly. Shinhan Bank makes provisioning at a level which is the higher of the Financial Supervisory Service requirement or Shinhan Bank’s internal calculation. Unexpected loss is predicted based on VaR, which is used to determine compliance with the aggregate credit risk limit for Shinhan Bank as well as the credit risk limit for the relevant department within Shinhan Bank. Shinhan Bank uses the AIRB method as proposed by the Basel Committee to compute VaR at the account-specific level as well as to measure risk adjusted performance.
Credit Risk Management of Shinhan Card
Major policies for Shinhan Card’s credit risk management are determined by Shinhan Card’s Risk Management Council, and Shinhan Card’s Risk Management Committee is responsible for approving them. Shinhan Card’s Risk Management Council is headed by the Chief Risk Officer, and also comprises of the heads of each business unit, supporting unit and relevant department at Shinhan Card. Shinhan Card’s Risk Management Council convenes at least once every month and may also convene on an ad hoc basis as needed. Shinhan Card’s Risk Management Committee is comprised of three Non-Standing Directors. Shinhan Card’s Risk Management Committee convenes at least once every quarter and may also convene on an ad hoc basis as needed.
The risk of loss from default by the cardholders or credit card loan borrowers is Shinhan Card’s greatest credit risk. Shinhan Card manages its credit risk based on the following principles:
| |
• |
|
achieve profit at a level corresponding to the level of risks involved; |
| |
• |
|
improve asset quality and achieve an optimal mix of asset portfolios; and |
| |
• |
|
closely monitor borrower’s ability to repay the debt. |
Credit Card Approval Process
Shinhan Card uses an automated credit scoring system to approve credit card applications or credit card authorizations. The credit scoring system is divided into two sub-systems: the behavior scoring system and the application scoring system. The behavior scoring system is based largely on the credit history of the cardholder or borrower, and the application scoring system is based largely on personal information of the applicant. For
126
credit card applicants with whom we have an existing relationship, Shinhan Card’s credit scoring system considers internally gathered information such as the ability to repay, total assets, the length of the existing relationship and the applicant’s contribution to Shinhan Card’s profitability. The credit scoring system also automatically conducts credit checks on all credit card applicants. Shinhan Card gathers information about the applicant’s transaction history with financial institutions, including banks and credit card companies, from a number of third party credit reporting agencies including, among others, National Information & Credit Evaluation Inc. and Korea Credit Bureau. These credit checks reveal a list of the delinquent customers of all credit card issuers in Korea.
If a credit score assigned to an applicant is above the minimum threshold, the application is approved unless overridden based on other considerations such as delinquencies with other credit card companies. For a credit card application by a long-standing customer with a good credit history, Shinhan Card may, on a discretionary basis, approve the application notwithstanding the assigned credit score unless overridden by other considerations. All of these factors also serve as the basis for setting a credit limit for approved applications.
The following describes the process of how Shinhan Card sets credit limits for credit cards, cash advances and card loans:
| |
• |
|
Credit purchase and cash advance limits — These limits are set based on the applicant’s limit request and Shinhan Card’s credit screening criteria. Unless a cardholder requests a reduction in the credit purchase and/or cash advance limit, Shinhan Card is required to provide prior notice to the cardholder for any reduction in such cardholder’s limit. However, if the account holder defaults or the cardholder’s credit limit is reduced according to the terms of the card agreement, Shinhan Card may lower the credit limit before notifying the account holder. |
| |
• |
|
Card loan limit — This limit is set monthly by Shinhan Card based on the cardholder’s credit rating and transaction history. The card loan limit can be adjusted monthly based on the cardholder’s credit standing without prior notification. |
Monitoring
Shinhan Card continually monitors all cardholders and accounts using a behavior scoring system. The behavior scoring system predicts a cardholder’s payment pattern by evaluating the cardholder’s credit history, card usage and amounts, payment status and other relevant data. The behavior score is recalculated each month and is used to manage the accounts and approval of additional loans and other products to the cardholder. Shinhan Card also uses the scoring system to monitor its overall risk exposure and to modify its credit risk management strategy.
Loan Application Review and On-going Credit Review
When reviewing new applications and conducting an ongoing credit review for retail loans, installment purchase loans and personal leases, Shinhan Card uses criteria substantially similar to those used in the credit underwriting system and the credit review system for cardholders. For retail loans, installment purchase loans and personal leases to existing cardholders, Shinhan Card reviews their card usage history in addition to other factors such as their income, occupation and assets.
Fraud Loss Prevention
Shinhan Card seeks to minimize losses from the fraudulent use of credit cards issued by it. Shinhan Card focuses on preventing fraudulent uses and, following the occurrence of a fraudulent use, makes investigations in order to make the responsible party bear the losses. Misuses of lost credit cards account for a substantial majority of Shinhan Card’s fraud-related losses. Through its fraud loss prevention system, Shinhan Card seeks to detect, on a real-time basis, transactions that are unusual or inconsistent with prior usage history and calls are made to
127
the relevant cardholders to confirm their purchases. A team at Shinhan Card dedicated to investigating fraud losses also examines whether the cardholder was at fault by, for example, not reporting a lost card or failing to endorse the card, or whether the relevant merchant was negligent in checking the identity of the user. Fault may also lie with delivery companies that fail to deliver credit cards to the relevant applicant. In such instances, Shinhan Card attempts to recover fraud losses from the responsible party. To prevent misuse of a card as well as to manage credit risk, Shinhan Card’s information technology system will automatically suspend the use of a card (i) when, as a result of ongoing monitoring, fraudulent use or loss of the card is suspected based on the account holder’s credit score, or (ii) at the request of the account holder.
Approximately 94% of Shinhan Card’s cardholders consent to Shinhan Card’s accessing their travel records to detect any misuse of credit cards while they are traveling abroad. Shinhan Card also offers cardholders additional fraud protection through a fee-based texting service. At the cardholder’s option, Shinhan Card notifies the cardholder of any credit card activity in his or her account by sending a text message to his or her mobile phone. This notification service allows customers to quickly and easily identify any fraudulent use of their credit cards.
Credit Risk Management of Shinhan Securities
In accordance with the guidelines of the Financial Supervisory Service, Shinhan Securities assesses its credit risks (including through VaR analyses) and allocates the maximum limit for the credit amount at risk by department. Shinhan Securities also assesses the counterparty risks in all credit-related transactions, such as loans, acquisition financings and derivative transactions and takes corresponding risk management measures. In assessing the credit risk of a corporate counterparty, Shinhan Securities considers such counterparty’s corporate credit rating obtained from Shinhan Group Corporate Credit Rating System. Through its risk management system, Shinhan Securities also closely monitors credit risk exposures by counterparty, industry, conglomerates, credit ratings and country. Shinhan Securities conducts credit risk stress tests on a daily basis based on probability of default and also conducts more advanced stress tests from time to time, the results of which are then reported to its management as well as the Group Chief Risk Officer to support group-wide credit risk management.
Credit Risk Management of Shinhan Life Insurance
Shinhan Life Insurance also assesses credit risks for all of its credit-related transactions, including provision of loans and acquisitions of financial instruments. Shinhan Life Insurance conducts additional risk reviews for new types of investments and financial instruments, such as those denominated in currencies it previously did not deal with. In assessing the credit risk of corporate customers, Shinhan Life Insurance considers such corporation’s credit rating obtained from Shinhan Group Corporate Credit Rating System. Through its risk management system Shinhan Life Insurance conducts credit risk monitoring based on the credit history of debtors. To closely monitor credit risk, Shinhan Life Insurance’s loan review department performs periodic loan review of its loan assets and plans on-site inspections where necessary. Furthermore, in the retail business, Shinhan Life Insurance operates its own credit-scoring system to assess credit risk and update customers’ behavior scores.
Market Risk Management
Market risk is the risk of loss generated by fluctuations in market prices such as interest rates, foreign exchange rates and equity prices. The principal market risks to which we are exposed are interest rate risk and, to a lesser extent, foreign exchange and equity price risk. These risks stem from our trading and non-trading activities relating to financial instruments such as loans, deposits, securities and financial derivatives. We divide market risk into risks arising from trading activities and risks arising from non-trading activities.
Our market risks arise primarily from Shinhan Bank, and to a lesser extent, Shinhan Securities, our securities trading and brokerage subsidiary, which faces market risk relating to its trading activities.
128
Shinhan Bank’s Risk Management Committee establishes overall market risk management principles for both the trading and non-trading activities of Shinhan Bank. Based on these principles, the Risk Policy Committee acts as the executive decision-making body in relation to Shinhan Bank’s market risks in terms of setting its risk management policies and risk limits in relation to market risks and assets and controlling market risks arising from trading and non-trading activities of Shinhan Bank. The Risk Policy Committee consists of deputy presidents in charge of Shinhan Bank’s seven business groups and Shinhan Bank’s Chief Risk Officer and the Chief Financial Officer. At least on a monthly basis, the Risk Policy Committee reviews and approves reports relating to, among others, the position and VaR with respect to Shinhan Bank’s trading activities and the position, VaR, duration gap and market value analysis and net interest income simulation with respect to its non-trading activities. In addition, Shinhan Bank’s Risk Engineering Department comprehensively manages market risks on an independent basis from Shinhan Bank’s operating departments, and functions as the middle office of Shinhan Bank. Shinhan Bank measures market risk with respect to all assets and liabilities in bank accounts and trust accounts in accordance with the regulations promulgated by the Financial Services Commission.
Shinhan Securities manages its market risk based on its overall risk limit established by its risk management committee as well as the risk limits and detailed risk management guidelines for each product and department established by its Risk Management Working Committee. Shinhan Securities’ Risk Management Working Committee is the executive decision-making body for managing market risks related to Shinhan Securities, and determines, among other things, Shinhan Securities’ overall market risk management policies and strategies, and assesses and approves trading activities and limits. In addition, Shinhan Securities’ Risk Management Department manages various market risk limits and monitors operating conditions on an independent basis from Shinhan Securities’ operating departments. Shinhan Securities assesses the adequacy of these limits at least annually. In addition, Shinhan Securities assesses the market risks of its trading assets. The assessment procedure is based on the standard procedures set by the Financial Supervisory Service as well as an internally developed model. Shinhan Securities assesses the risk amount and VaR, and manages the risk by setting a risk limit per sector as well as a VaR limit.
Shinhan Life Insurance manages its market risk based on its overall risk limit established by its risk management committee. Shinhan Life Insurance manages market risk in regard to assets that are subject to trading activities and foreign exchange positions. Shinhan Life Insurance assesses the market risk amount and the 10-day VaR, a procedure based on the delta-normal method, and manages market risk by setting a 10-day VaR limit. Shinhan Life Insurance assessed the adequacy of these limits at least annually and implements back tests on market risk determinations by comparing daily profit and loss against one-day VaR in 2017.
Shinhan Card does not have any assets with significant exposure to market risks and therefore does not maintain a risk management policy with respect to market risks.
We use financial information prepared on a separate basis according to IFRS for the market risk management of our subsidiaries and, unless otherwise specified herein, financial information in this annual report presented for quantitative market risk disclosure relating to our subsidiaries have been prepared in accordance with IFRS on a separate basis.
Market Risk Exposure from Trading Activities
Shinhan Bank’s trading activities principally consist of:
| |
• |
|
trading activities to realize short-term profits from trading in the equity and debt securities markets and the foreign currency exchange markets based on Shinhan Bank’s short-term forecast of changes in market situation and customer demand, for its own account as well as for the trust accounts of Shinhan Bank’s customers; and |
129
| |
• |
|
trading activities primarily to realize profits from arbitrage transactions involving derivatives such as swaps, forwards, futures and options, and, to a lesser extent, to sell derivative products to Shinhan Bank’s customers and to cover market risk associated with those trading activities. |
Shinhan Securities’ trading activities principally consist of trading for customers and for proprietary accounts equity and debt securities and derivatives based on stock prices, stock indexes, interest rates, foreign currency exchange rates and commodity prices.
As a result of these trading activities, Shinhan Bank is exposed principally to interest rate risk, foreign currency exchange rate risk and equity risk, and Shinhan Securities is exposed principally to equity risk and interest rate risk.
Interest Rate Risk
Shinhan Bank’s exposure to interest rate risk arises primarily from Won-denominated debt securities, directly held or indirectly held through beneficiary certificates, and, to a lesser extent, from interest rate derivatives. Shinhan Bank’s exposure to interest rate risk arising from foreign currency-denominated trading debt securities is minimal since its net position in those securities is not significant. As Shinhan Bank’s trading accounts are marked-to-market daily, it manages the interest rate risk related to its trading accounts using VaR, a market value-based tool.
Shinhan Securities’ interest rate risk arises primarily from management of its interest rate-sensitive asset portfolio, which mainly consists of debt securities, interest rate swaps and government bond futures, and the level of such risk exposure depends largely on the variance between the interest rate movement assumptions built into the asset portfolio and the actual interest rate movements and the spread between a derivative product and its underlying assets. Shinhan Securities quantifies and manages the interest rate-related exposure by daily conducting VaR and stress tests on a marked-to-market basis.
Foreign Currency Exchange Rate Risk
Shinhan Bank’s exposure to foreign currency exchange rate risk mainly relates to its assets and liabilities, including derivatives such as foreign currency forwards and futures and currency swaps, which are denominated in currencies other than the Won. Shinhan Bank manages foreign currency exchange rate risk, including the corresponding risks faced by its overseas branches, on a consolidated basis by covering all of its foreign exchange spot and forward positions in both trading and non-trading accounts.
Shinhan Bank’s net foreign currency open position represents the difference between its foreign currency assets and liabilities as offset against forward foreign currency positions, and is Shinhan Bank’s principal exposure to foreign currency exchange rate risk. The Risk Policy Committee oversees Shinhan Bank’s foreign currency exposure for both trading and non-trading activities by establishing limits for the net foreign currency open position, loss limits and VaR limits. Shinhan Bank centrally monitors and manages its foreign exchange positions through its Financial Engineering Center. Dealers in the Financial Engineering Center manage Shinhan Bank’s consolidated position within preset limits through spot trading, forward contracts, currency options, futures and swaps and foreign currency swaps. Shinhan Bank sets a limit for net open positions by currency. The limits for currencies other than the U.S. Dollar, Japanese Yen, Euro and Chinese Yuan are set in a conservative manner in order to minimize trading in such currencies.
Shinhan Securities faces foreign currency exchange rate risk in relation to the following product offerings: currency forwards, currency swaps and currency futures. Shinhan Securities centrally monitors and manages transactions involving such products through its Fixed Income, Currency & Commodities Departments. Shinhan Securities’ Risk Management Working Committee, which is delegated with the authority to approve foreign currency-related transactions and limits on the related open positions, manages the related foreign exchange risk
130
by setting nominal limits on the amounts of foreign exchange-related products and monitoring compliance with such limits on a daily basis. As of December 31, 2022, Shinhan Securities’ net open position related to foreign currency-related products was US$1,339 million, and its open positions related to the sale of Won-U.S. Dollar forwards and Won-U.S. Dollar futures were US$533 million and US$(107) million, respectively.
Shinhan Capital manages its foreign exchange risk resulting from the difference in its foreign currency assets and liabilities through derivative transactions such as forwards or swaps and maintains its net exposure at US$13.02 million.
The net open foreign currency positions held by our other subsidiaries are insignificant.
The following table shows Shinhan Bank’s net foreign currency open positions as of December 31, 2020, 2021 and 2022. Positive amounts represent long exposures and negative amounts represent short exposures.
|
|
|
|
|
|
|
|
|
|
|
|
|
| |
|
As of December 31, |
|
| Currency |
|
2020 |
|
|
2021 |
|
|
2022 |
|
| |
|
|
|
|
|
|
|
|
|
| |
|
(In millions of US$) |
|
| U.S. Dollars |
|
$ |
(299.4 |
) |
|
$ |
(15.6 |
) |
|
$ |
40.8 |
|
| Japanese Yen |
|
|
3.9 |
|
|
|
447.3 |
|
|
|
467.7 |
|
| Euro |
|
|
12.4 |
|
|
|
23.6 |
|
|
|
5.3 |
|
| Others |
|
|
1,201.2 |
|
|
|
2,247.7 |
|
|
|
2,320.9 |
|
|
|
|
|
|
|
|
|
|
|
|
|
|
| Total |
|
$ |
918.0 |
|
|
$ |
2,703.1 |
|
|
$ |
2,834.6 |
|
|
|
|
|
|
|
|
|
|
|
|
|
|
Equity Risk
Shinhan Bank’s equity risk related to trading activities mainly involves trading equity portfolios of Korean companies and Korea Stock Price Index futures and options. The trading equity portfolio consists of stocks listed on the KRX KOSPI Market or the KRX KOSDAQ Market of the Korea Exchange and nearest-month or second nearest-month futures contracts under strict limits on diversification as well as limits on positions. Shinhan Bank maintains strict scrutiny of these activities in light of the volatility in the Korean stock market and closely monitors the loss limits and the observance thereof. Although Shinhan Bank holds a substantially smaller amount of equity securities than debt securities in its trading accounts, the VaR of trading account equity risk is generally higher than that of trading account interest rate risk due to high volatility in the value of equity securities. As of December 31, 2020, 2021 and 2022, Shinhan Bank held W13.7 billion, W171.7 billion and W74.0 billion, respectively, of equity securities in its trading accounts (including the trust accounts).
Shinhan Securities’ equity risk related to trading activities also mainly involves the trading of equity portfolio of Korean companies and Korea Stock Price Index futures and options. As of December 31, 2020, 2021 and 2022, the total amount of equity securities at risk held by Shinhan Securities was W53.8 billion, W55.3 billion and W21.7 billion, respectively.
Equity positions held by our other subsidiaries are insignificant.
131
Management of Market Risk from Trading Activities
The following tables present an overview of market risk, measured by VaR, from trading activities of Shinhan Bank and Shinhan Securities, respectively, as of and for the year ended December 31, 2022. For market risk management purposes, Shinhan Bank includes in the computation of total VaR its trading portfolio in bank accounts and assets in trust accounts, in each case, for which it guarantees principal or fixed return in accordance with the Financial Services Commission regulations.
|
|
|
|
|
|
|
|
|
|
|
|
|
|
|
|
|
| |
|
Trading Portfolio VaR for the Year 2022 |
|
| |
|
Average |
|
|
Minimum |
|
|
Maximum |
|
|
As of
December 31, 2022 |
|
| |
|
|
|
|
|
|
|
|
|
|
|
|
| |
|
(In billions of Won) |
|
| Shinhan Bank:(1) |
|
|
|
|
|
|
|
|
|
|
|
|
|
|
|
|
| Interest rate |
|
W |
44.7 |
|
|
W |
24.3 |
|
|
W |
64.6 |
|
|
W |
53.8 |
|
| Foreign exchange(2) |
|
|
191.0 |
|
|
|
161.8 |
|
|
|
262.5 |
|
|
|
252.5 |
|
| Equities |
|
|
20.3 |
|
|
|
13.4 |
|
|
|
24.9 |
|
|
|
21.7 |
|
| Option volatility(3) |
|
|
0.1 |
|
|
|
0.0 |
|
|
|
0.2 |
|
|
|
0.1 |
|
| Less: portfolio diversification(4) |
|
|
(33.8 |
) |
|
|
(10.9 |
) |
|
|
(77.3 |
) |
|
|
(63.0 |
) |
|
|
|
|
|
|
|
|
|
|
|
|
|
|
|
|
|
| Total VaR(5) |
|
W |
222.4 |
|
|
W |
188.7 |
|
|
W |
274.9 |
|
|
W |
265.1 |
|
|
|
|
|
|
|
|
|
|
|
|
|
|
|
|
|
|
| Shinhan Securities: (1) |
|
|
|
|
|
|
|
|
|
|
|
|
|
|
|
|
| Interest rate |
|
W |
30.00 |
|
|
W |
17.12 |
|
|
W |
44.13 |
|
|
W |
39.58 |
|
| Equities |
|
|
36.10 |
|
|
|
14.51 |
|
|
|
63.96 |
|
|
|
25.76 |
|
| Foreign exchange |
|
|
31.71 |
|
|
|
13.45 |
|
|
|
63.48 |
|
|
|
63.48 |
|
| Option volatility(3) |
|
|
70.02 |
|
|
|
40.81 |
|
|
|
103.93 |
|
|
|
43.10 |
|
| Less: portfolio diversification(4) |
|
|
(64.64 |
) |
|
|
(147.83 |
) |
|
|
(9.07 |
) |
|
|
(74.89 |
) |
|
|
|
|
|
|
|
|
|
|
|
|
|
|
|
|
|
| Total VaR |
|
W |
103.19 |
|
|
W |
76.82 |
|
|
W |
127.67 |
|
|
W |
97.04 |
|
|
|
|
|
|
|
|
|
|
|
|
|
|
|
|
|
|
Notes:
| (1) |
Shinhan Bank and Shinhan Securities’ 10-day VaR is based on a 99.9% confidence level. |
| (2) |
Includes both trading and non-trading accounts as Shinhan Bank and Shinhan Securities manage foreign exchange risk on a total position basis. |
| (3) |
Volatility implied from the option price using the Black-Scholes or a similar model. |
| (4) |
Calculation of portfolio diversification effects is conducted on different days’ scenarios for different risk components. Total VaRs are less than the simple sum of the risk component VaRs due to offsets resulting from portfolio diversification. |
| (5) |
Includes trading portfolios in Shinhan Bank’s bank accounts and assets in trust accounts, in each case, for which it guarantees principal or fixed return. |
Shinhan Bank generally manages its market risk from the trading activities of its portfolios on an aggregated basis. To control its trading portfolio market risk, Shinhan Bank uses position limits, VaR limits, stop loss limits, Greek limits and stressed loss limits. In addition, it establishes separate limits for investment securities. Shinhan Bank maintains risk control and management guidelines for derivative trading based on the regulations and guidelines promulgated by the Financial Services Commission, and measures market risk from trading activities to monitor and control the risk of its operating divisions and teams that perform trading activities. Shinhan Bank manages VaR measurements and limits on a daily basis based on automatic interfacing of its trading positions into its market risk measurement system. In addition, Shinhan Bank presets limits on loss, sensitivity, investment and stress for its trading departments and desks and monitors such limits and observance thereof on a daily basis.
Value-at-risk analysis. Shinhan Bank uses 10-day and one-day VaRs to measure its market risk. Shinhan Bank calculates (i) 10-day VaRs on a daily basis based on data for the previous 12 months for the holding periods of 10 days and (ii) one-day VaRs on a daily basis based on data for the previous 12 months for the
132
holding periods of one day. A 10-day VaR and one-day VaR are statistically estimated maximum amounts of loss that can occur for 10 days and one day, respectively, under normal market conditions. If a VaR is measured using a 99% confidence level, the actual amount of loss may exceed the expected VaR, on average, once out of every 100 business days, while if a VaR is measured using a 99.9% confidence level, the actual amount of loss may exceed the expected VaR, on average, once out of 1,000 business days.
Shinhan Bank currently uses the 10-day 99% confidence level-based VaR and stressed VaR for purposes of calculating the regulatory capital used in reporting to the Financial Supervisory Service. Stressed VaR reflects the potential significant loss in the current trading portfolio based on scenarios derived from a crisis simulation during the preceding 12 months. Shinhan Bank also uses the more conservative 10-day 99.9% confidence level-based VaR for purposes of calculating its “economic” capital used for internal management purposes, which is a concept used in determining the amount of Shinhan Bank’s requisite capital in light of the market risk. In addition, Shinhan Bank uses the one-day 99% confidence level-based VaR on a supplemental basis for purposes of setting and managing risk limits specific to each desk or team in its operating units as well as for back-testing purposes. For Shinhan Bank, the amount of losses (either actual or virtual) exceeded the one-day 99% confidence level-based VaR amount two times in 2020, one time in 2021 and five times in 2022. The increased frequency of instances in which the amount of losses exceeded the VaR amount in 2022 was primarily because the foreign currency exchange market experienced unusually high volatility. The VaR exceptions referred to above were all due to the amount of virtual losses exceeding the VaR amount. Virtual losses represent the potential changes in the value of a portfolio when simulating the same portfolio with market variables of the next trading day.
Shinhan Securities currently uses the same 10-day 99.9% confidence level-based historical VaR for purposes of calculating its “economic” capital used for internal management purposes, although such model is not subject to regulatory review or reporting requirements. In addition, Shinhan Securities applies this VaR as a risk limit for the entire company as well as individual departments and products, and the adequacy of such VaR is reviewed by way of daily back-testing. When computing VaR, Shinhan Securities does not assume any particular probability distribution and calculates it through a simulation of the “full valuation” method based on changes of market variables such as stock prices, interest rates and foreign exchange rates in the past one year. For Shinhan Securities, the amount of losses (either actual or virtual) exceeded the one-day 99% confidence level-based VaR amount four times in 2020, zero times in 2021 and zero times in 2022. The VaR exceptions referred to above were all due to the amount of virtual losses exceeding the VaR amount.
Value-at-risk is a commonly used market risk management technique. However, VaR models have the following shortcomings:
| |
• |
|
VaR estimates possible losses over a certain period at a particular confidence level using past market movement data. Past market movement, however, is not necessarily a reliable indicator of future events, particularly those that are extreme in nature; |
| |
• |
|
VaR may underestimate the probability of extreme market movements; |
| |
• |
|
Shinhan Bank’s VaR models assume that a holding period of generally one to 10 days is sufficient prior to liquidating the underlying positions, but such assumption regarding the length of the holding period may actually prove to be inadequate; |
| |
• |
|
The 99.9% confidence level does not take into account or provide indication of any losses that might occur beyond this confidence level; and |
| |
• |
|
VaR does not capture all complex effects of various risk factors on the value of positions and portfolios and could underestimate potential losses. |
Currently, Shinhan Bank and Shinhan Securities conduct back-testing of VaR results against actual outcomes on a daily basis.
Shinhan Bank operates an integrated market risk management system which manages Shinhan Bank’s Won-denominated and foreign-denominated accounts. This system uses historical simulation to measure both
133
linear risks arising from products such as equity and debt securities and nonlinear risks arising from other products including options. We believe that this system enables Shinhan Bank to generate elaborate and consistent VaR information and to perform sensitivity analysis and back testing in order to check the validity of the models on a daily basis. Shinhan Life Insurance also measures market risks based on a VaR analysis.
Stress test. In addition to VaR, Shinhan Bank performs stress tests to measure market risk. As VaR assumes normal market situations, Shinhan Bank assesses its market risk exposure to unlikely abnormal market fluctuations through the stress test. Stress test is a valuable supplement to VaR since VaR does not cover potential loss if the market moves in a manner which is outside Shinhan Bank’s normal expectations. Stress test projects the anticipated change in value of holding positions under certain scenarios assuming that no action is taken during a stress event to change the risk profile of a portfolio.
Shinhan Bank uses seven relatively simple but fundamental scenarios for stress test by taking into account four market risk components: foreign currency exchange rates, stock prices, and Won-denominated interest rates and foreign currency-denominated interest rates. For the worst case scenario, Shinhan Bank assumes instantaneous and simultaneous movements in four market risk components: appreciation of Won by 20%, a decrease in Korea Exchange Composite Index by 30% and increases in Won-denominated and U.S. Dollar-denominated interest rates by 200 basis points each, respectively. Under this worst-case scenario, the market value of Shinhan Bank’s trading portfolio would have declined by W626 billion as of December 31, 2022. Shinhan Bank performs stress test on a daily basis and reports the results to its Risk Policy Committee on a monthly basis and its Risk Management Committee on a quarterly basis.
Shinhan Securities uses nine scenarios for stress tests by taking into account four market risk components: stock prices (both in terms of stock market indices and ß-based individual stock prices), interest rates for Won-denominated loans, foreign currency exchange rates and historical volatility. As of December 31, 2022, under the worst case scenario assuming a 1% point increase in the three-year government bond yield, the market value of Shinhan Securities’ trading portfolio would have fluctuated by W48 billion for one day.
Shinhan Bank sets limits on stress testing for its overall operations. Shinhan Securities sets limits on stress testing for its overall operations as well as at its department level. Although Shinhan Life Insurance does not set any limits on stress testing, it monitors the impact of market turmoil or other abnormalities. In the case of Shinhan Bank, Shinhan Securities and Shinhan Life Insurance, if the potential impact is large, their respective head of Risk Management will notify such impact and may request a portfolio restructuring or other proper action.
Hedging and Derivative Market Risk
The principal objective of our group-wide hedging strategy is to manage market risk within established limits. We use derivative instruments to hedge our market risk as well as to make profits by trading derivative products within preset risk limits. Our derivative trading includes interest rate and cross-currency swaps, foreign currency forwards and futures, stock index and interest rate futures, and stock index and currency options.
While we use derivatives for hedging purposes, derivative transactions by nature involve market risk since we take trading positions for the purpose of making profits. These activities consist primarily of the following:
| |
• |
|
arbitrage transactions to make profits from short-term discrepancies between the spot and derivative markets or within the derivative markets; |
| |
• |
|
sales of tailor-made derivative products that meet various needs of our corporate customers, principally of Shinhan Bank and Shinhan Securities, and related transactions to reduce their exposure resulting from those sales; |
| |
• |
|
taking positions in limited cases when we expect short-swing profits based on our market forecasts; and |
| |
• |
|
trading to hedge our interest rate and foreign currency risk exposure as described above. |
134
In accordance with accounting requirements under IFRS 9, “Financial Instruments”, which has replaced IAS 39, “Financial Instruments: Recognition and Measurement” since January 1, 2018, we have implemented internal processes which include a number of key controls designed to ensure that fair value is measured appropriately, particularly where a fair value model is internally developed and used to price a significant product.
Shinhan Bank assesses the adequacy of the fair market value of a new product derived from its internal model prior to the launch of such product. The assessment process involves the following:
| |
• |
|
computation of an internal dealing system market value (based on assessment by the quantitative analysis team of the adequacy of the formula and the model used to compute the market value as derived from the dealing system); |
| |
• |
|
computation of the market value as obtained from an outside credit evaluation company; and |
| |
• |
|
following comparison of the market value derived from an internal dealing system to that obtained from outside credit evaluation companies, determination as to whether to use the internally developed market value based on inter-departmental consensus. |
The dealing system market value, which is used officially by Shinhan Bank after undergoing the assessment process above, does not undergo a sampling process that confirms the value based on review of individual transactions, but is subject to an additional assessment procedure of comparing such value against the profits derived from the dealing systems based on the deal portfolio sensitivity.
Shinhan Securities follows an internal policy as set by its Fair Value Evaluation Committee for computing and assessing the adequacy of fair value of all of its over-the-counter derivative products. Shinhan Securities computes the fair value based on an internal model and internal risk management systems and assesses the adequacy of the fair value through cross-departmental checks as well as comparison against fair values obtained from outside credit evaluation companies. See Note 3 of the notes to our consolidated financial statements included in this annual report.
Market risk from derivatives is not significant since derivative trading activities of Shinhan Bank and Shinhan Securities are primarily driven by arbitrage and customer deals with highly limited open trading positions. Market risk from derivatives is also not significant for Shinhan Life Insurance as its derivative trading activities are limited to those within preset risk limits and are subject to heavy regulations imposed on the insurance industry. Market risk from derivatives is not significant for our other subsidiaries since the amount of such positions by our other subsidiaries is insignificant.
Market Risk Management for Non-trading Activities
Interest Rate Risk
Interest rate risk represents Shinhan Bank’s principal market risk from non-trading activities. Interest rate risk is the risk of loss resulting from interest rate fluctuations that adversely affect the financial condition and results of operations of Shinhan Bank. Shinhan Bank’s interest rate risk primarily relates to the differences between the timing of rate changes for interest-earning assets and that for interest-bearing liabilities.
Interest rate risk affects Shinhan Bank’s earnings and the economic value of Shinhan Bank’s net assets as follows:
| |
• |
|
Earnings: interest rate fluctuations have an effect on Shinhan Bank’s net interest income by affecting its interest-sensitive operating income and expenses. |
| |
• |
|
Economic value of net assets: interest rate fluctuations influence Shinhan Bank’s net worth by affecting the present value of cash flows from the assets, liabilities and other transactions of Shinhan Bank. |
135
Accordingly, Shinhan Bank measures and manages interest rate risk for non-trading activities by taking into account the effects of interest rate changes on both its income and net asset value. Shinhan Bank measures and manages interest rate risk on a daily and monthly basis with respect to all interest-earning assets and interest-bearing liabilities in Shinhan Bank’s bank accounts (including derivatives denominated in Won which are principally interest rate swaps entered into for the purpose of hedging) and in trust accounts, except that Shinhan Bank measures VaRs on a monthly basis. Most of Shinhan Bank’s interest-earning assets and interest-bearing liabilities are denominated in Won.
Interest Rate Risk Management
The principal objectives of Shinhan Bank’s interest rate risk management are to generate stable net interest income and to protect Shinhan Bank’s net asset value against interest rate fluctuations. Through its asset and liability management system, Shinhan Bank monitors and manages its interest rate risk based on various analytical measures such as interest rate gap, duration gap and net present value and net interest income simulations, and monitors on a monthly basis its interest rate VaR limits, interest rate earnings at risk (“EaR”) limits and interest rate gap ratio limits. Shinhan Bank measures its interest rate VaR and interest rate EaR based on interest rate risk in the banking book standardized approach presented by the Bank for International Settlements (the “IRRBB standardized approach”). IRRBB, which is part of the Basel capital framework’s Pillar 2 and subject to the Committee’s guidance set out in the 2004 revised principles for the management and supervision of interest rate risk, refers to current or prospective risk to a bank’s capital and earnings arising from adverse movements in interest rates that affect the bank’s banking book position. Interest rate risk is managed by reflecting possible future interest rate environments and customer behavior based on the IRRBB standardized approach. Interest rate VaR is measured by the change in economic value of equity under six types of scenarios (parallel up, parallel down, stiffener, flattener, short-term interest rate-up and short-term interest rate-down). Interest rate EaR is measured by the largest loss amount based on two types of scenarios (parallel up and parallel down). The Risk Policy Committee sets the interest rate risk limits for Shinhan Bank’s Won-denominated and foreign currency-denominated non-trading accounts and trust accounts, and the Risk Management Committee sets Shinhan Bank’s overall interest rate risk limit, in both cases, at least annually. The Risk Management Department monitors Shinhan Bank’s compliance with these limits and reports the monitoring results to the Risk Policy Committee on a monthly basis and the Risk Management Committee on a quarterly basis. Shinhan Bank uses interest rate swaps to control its interest rate exposure limits.
Interest rate VaR represents the maximum anticipated loss in a net present value calculation (computed as the present value of interest-earning assets minus the present value of interest-bearing liabilities), whereas interest rate EaR represents the maximum anticipated loss in a net earnings calculation (computed as interest income minus interest expenses) for the immediately following one-year period, in each case, as a result of negative movements in interest rates. Therefore, interest rate VaR is a more expansive concept than interest rate EaR in that the former covers all interest-earning assets and all interest-bearing liabilities, whereas the latter covers only those interest-earning assets and interest-bearing liabilities that are exposed to interest rate volatility for a one-year period.
Hence, for interest rate VaRs, the duration gap (namely, the weighted average duration of all interest-earning assets minus the weighted average duration of all interest-bearing liabilities) can be a more critical factor than the relative sizes of the relevant assets and liabilities in influencing interest rate VaRs. In comparison, for interest rate EaRs, the relative sizes of the relevant assets and liabilities in the form of the “one year or less interest rate” gap (namely, the volume of interest-earning assets with maturities of less than one year minus the volume of interest-bearing liabilities with maturities of less than one year) are the most critical factor in influencing the interest rate EaRs.
On a monthly basis, we monitor whether the non-trading positions for interest rate VaR and EaR exceed their respective limits as described above.
136
Interest rate VaR cannot be meaningfully compared to the 10-day 99% confidence level based VaR (“market risk VaR”) for managing trading risk principally because (i) the underlying assets are different (namely, non-trading interest-bearing assets as well as liabilities in the case of the interest rate VaR, compared to trading assets only in the case of the market risk VaR), and (ii) interest rate VaR is sensitive to interest rate movements only while the market risk VaR is sensitive to interest rate movements as well as other factors such as foreign currency exchange rates, stock market prices and option volatility.
Even if comparison were to be made between the interest rate VaR and the interest rate portion only of the market risk VaR, we do not believe such comparison would be meaningful since the interest rate VaR examines the impact of interest rate movements on both assets and liabilities (which will likely have offsetting effects), whereas the interest rate portion of the market VaR examines the impact of interest rate movements on assets only.
Shinhan Bank uses various analytical methodologies to measure and manage its interest rate risk for non-trading activities on a daily and monthly basis, including the following analyses:
| |
• |
|
Interest rate gap analysis; |
| |
• |
|
Market value analysis; and |
| |
• |
|
Net interest income simulation analysis. |
Interest Rate Gap Analysis
Shinhan Bank performs an interest gap analysis to measure the difference between the amount of interest-earning assets and that of interest-bearing liabilities at each maturity and re-pricing date for specific time intervals by preparing interest rate gap tables in which Shinhan Bank’s interest-earning assets and interest-bearing liabilities are allocated to the applicable time intervals based on the expected cash flows and re-pricing dates.
On a daily basis, Shinhan Bank performs interest rate gap analysis for Won- and foreign currency-denominated assets and liabilities in its bank and trust accounts. Shinhan Bank’s gap analysis includes Won-denominated derivatives (which are interest rate swaps for the purpose of hedging) and foreign currency-denominated derivatives (which are currency swaps for the purpose of hedging), which are managed centrally at the Financial Engineering Center. Through the interest rate gap analysis that measures interest rate sensitivity gaps, cumulative gaps and gap ratios, Shinhan Bank assesses its exposure to future interest risk fluctuations. For interest rate gap analysis, Shinhan Bank assumes and uses the following maturities for different types of assets and liabilities:
| |
• |
|
With respect to the maturities and re-pricing dates of Shinhan Bank’s assets, Shinhan Bank assumes that the maturity of Shinhan Bank’s prime rate-linked loans is the same as that of its fixed-rate loans. Shinhan Bank excludes equity securities from interest-earning assets. |
| |
• |
|
With respect to the maturities and re-pricing of Shinhan Bank’s liabilities, Shinhan Bank assumes that money market deposit accounts and “non-core” demand deposits under the Financial Services Commission guidelines have a maturity of one month or less for both Won-denominated accounts and foreign currency-denominated accounts. |
| |
• |
|
With respect to “core” demand deposits under the Financial Services Commission guidelines, Shinhan Bank assumes that they have maturities of eight different intervals ranging from one month to five years. |
137
The following tables show Shinhan Bank’s interest rate gaps as of December 31, 2022 for (i) Won-denominated non-trading bank accounts, including derivatives entered into for the purpose of hedging and (ii) foreign currency-denominated non-trading bank accounts, including derivatives entered into for the purpose of hedging.
Won-denominated non-trading bank accounts(1)
|
|
|
|
|
|
|
|
|
|
|
|
|
|
|
|
|
|
|
|
|
|
|
|
|
|
|
|
|
| |
|
As of December 31, 2022 |
|
| |
|
0-3
Months |
|
|
3-6
Months |
|
|
6-12
Months |
|
|
1-2
Years |
|
|
2-3
Years |
|
|
Over 3
Years |
|
|
Total |
|
| |
|
|
|
|
|
|
|
|
|
|
|
|
|
|
|
|
|
|
|
|
|
| |
|
(In billions of Won, except percentages) |
|
| Interest-earning assets |
|
|
152,799 |
|
|
|
82,871 |
|
|
|
40,672 |
|
|
|
36,040 |
|
|
|
23,812 |
|
|
|
30,891 |
|
|
|
367,085 |
|
| Fixed rates |
|
|
25,737 |
|
|
|
20,040 |
|
|
|
24,452 |
|
|
|
25,431 |
|
|
|
16,300 |
|
|
|
17,318 |
|
|
|
129,280 |
|
| Floating rates |
|
|
126,712 |
|
|
|
62,071 |
|
|
|
11,400 |
|
|
|
8,338 |
|
|
|
7,512 |
|
|
|
13,573 |
|
|
|
229,605 |
|
| Interest rate swaps |
|
|
350 |
|
|
|
760 |
|
|
|
4,820 |
|
|
|
2,270 |
|
|
|
0 |
|
|
|
0 |
|
|
|
8,200 |
|
|
|
|
|
|
|
|
|
| Interest-bearing liabilities |
|
|
177,253 |
|
|
|
49,663 |
|
|
|
80,055 |
|
|
|
22,540 |
|
|
|
16,302 |
|
|
|
26,859 |
|
|
|
372,673 |
|
| Fixed liabilities |
|
|
80,227 |
|
|
|
35,238 |
|
|
|
67,062 |
|
|
|
9,968 |
|
|
|
3,538 |
|
|
|
1,931 |
|
|
|
197,964 |
|
| Floating liabilities |
|
|
88,827 |
|
|
|
14,425 |
|
|
|
12,993 |
|
|
|
12,573 |
|
|
|
12,764 |
|
|
|
24,928 |
|
|
|
166,510 |
|
| Interest rate swaps |
|
|
8,200 |
|
|
|
0 |
|
|
|
0 |
|
|
|
0 |
|
|
|
0 |
|
|
|
0 |
|
|
|
8,200 |
|
|
|
|
|
|
|
|
|
| Sensitivity gap |
|
|
(24,454 |
) |
|
|
33,208 |
|
|
|
(39,383 |
) |
|
|
13,499 |
|
|
|
7,510 |
|
|
|
4,032 |
|
|
|
(5,588 |
) |
| Cumulative gap |
|
|
(24,454 |
) |
|
|
8,754 |
|
|
|
(30,629 |
) |
|
|
(17,130 |
) |
|
|
(9,620 |
) |
|
|
(5,588 |
) |
|
|
(5,588 |
) |
| % of total assets |
|
|
(6.66 |
)% |
|
|
2.38 |
% |
|
|
(8.34 |
)% |
|
|
(4.67 |
)% |
|
|
(2.62 |
)% |
|
|
(1.52 |
)% |
|
|
(1.52 |
)% |
Foreign currency-denominated non-trading bank accounts(1)
|
|
|
|
|
|
|
|
|
|
|
|
|
|
|
|
|
|
|
|
|
|
|
|
|
| |
|
As of December 31, 2022 |
|
| |
|
0-3
Months |
|
|
3-6
Months |
|
|
6-12
Months |
|
|
1-3
Years |
|
|
Over 3
Years |
|
|
Total |
|
| |
|
|
|
|
|
|
|
|
|
|
|
|
|
|
|
|
|
|
| |
|
(In millions of US$, except percentages) |
|
| Interest-earning assets |
|
|
30,229 |
|
|
|
10,089 |
|
|
|
4,925 |
|
|
|
5,525 |
|
|
|
6,356 |
|
|
|
57,125 |
|
| Interest-bearing liabilities |
|
|
33,112 |
|
|
|
7,488 |
|
|
|
7,607 |
|
|
|
7,397 |
|
|
|
7,727 |
|
|
|
63,333 |
|
|
|
|
|
|
|
|
| Sensitivity gap |
|
|
(2,883 |
) |
|
|
2,601 |
|
|
|
(2,683 |
) |
|
|
(1,872 |
) |
|
|
(1,371 |
) |
|
|
(6,208 |
) |
| Cumulative gap |
|
|
(2,883 |
) |
|
|
(282 |
) |
|
|
(2,965 |
) |
|
|
(4,837 |
) |
|
|
(6,208 |
) |
|
|
(6,208 |
) |
| % of total assets |
|
|
(5.05 |
)% |
|
|
(0.49 |
)% |
|
|
(5.19 |
)% |
|
|
(8.47 |
)% |
|
|
(10.87 |
)% |
|
|
(10.87 |
)% |
Note:
| (1) |
Includes merchant banking accounts. |
Duration Gap Analysis
Shinhan Bank performs a duration gap analysis to measure the differential effects of interest rate risk on the market value of its assets and liabilities by examining the difference between the durations of Shinhan Bank’s interest-earning assets and those of its interest-bearing liabilities, which durations represent their respective weighted average maturities calculated based on their respective discounted cash flows using applicable yield curves. These measurements are done on a daily basis and for each operating department, account, product and currency, the respective durations of interest-earning assets and interest-bearing liabilities.
The following tables show duration gaps and market values of Shinhan Bank’s Won-denominated interest-earning assets and interest-bearing liabilities in its non-trading accounts as of December 31, 2022 and changes in these market values when interest rate increases by one percentage point.
138
Duration as of December 31, 2022 (for non-trading Won-denominated bank accounts(1))
|
|
|
|
|
| |
|
Duration as of
December 31,
2022 |
|
| |
|
(In months) |
|
| Interest-earning assets |
|
|
9.22 |
|
| Interest-bearing liabilities |
|
|
11.14 |
|
| Gap |
|
|
(1.92 |
) |
Note:
| (1) |
Includes merchant banking accounts and derivatives for the purpose of hedging. |
Market Value Analysis
Shinhan Bank performs a market value analysis to measure changes in the market value of Shinhan Bank’s interest-earning assets compared to that of its interest-bearing liabilities based on the assumption of parallel shifts in interest rates. These measurements are done on a monthly basis.
Market Value as of December 31, 2022 (for non-trading Won-denominated bank accounts(1))
|
|
|
|
|
|
|
|
|
|
|
|
|
| |
|
Market Value as of December 31,
2022 |
|
| |
|
Actual |
|
|
1% Point
Increase |
|
|
Changes |
|
| |
|
|
|
|
|
|
|
|
|
| |
|
(In billions of Won) |
|
| Interest-earning assets |
|
|
373,695 |
|
|
|
371,124 |
|
|
|
(2,571 |
) |
| Interest-bearing liabilities |
|
|
384,780 |
|
|
|
381,588 |
|
|
|
(3,192 |
) |
| Gap |
|
|
(11,085 |
) |
|
|
(10,464 |
) |
|
|
621 |
|
Note:
| (1) |
Includes merchant banking accounts and derivatives for the purpose of hedging. |
Net Interest Income Simulation
Shinhan Bank performs net interest income simulation to measure the effects of the change in interest rate on its results of operations. Such simulation uses the deterministic analysis methodology to measure the estimated changes in Shinhan Bank’s annual net interest income (interest income less interest expenses) under the current maturity structure, using different scenarios for interest rates (assuming parallel shifts) and funding requirements. For simulations involving interest rate changes, based on the assumption that there is no change in funding requirements, Shinhan Bank applies three scenarios of parallel shifts in interest rate: (1) no change, (2) a 1% point increase in interest rates and (3) a 1% point decrease in interest rates.
139
The following table illustrates by way of an example the simulated changes in Shinhan Bank’s annual net interest income for 2021 with respect to Won-denominated interest-earning assets and interest-bearing liabilities, using Shinhan Bank’s net interest income simulation model, assuming (a) the maturity structure and funding requirement of Shinhan Bank as of December 31, 2022 and (b) the same interest rates as of December 31, 2022 and a 1% point increase or decrease in the interest rates.
|
|
|
|
|
|
|
|
|
|
|
|
|
|
|
|
|
|
|
|
|
|
|
|
|
|
|
|
|
| |
|
Simulated Net Interest Income for 2022 |
|
| |
|
(For Non-Trading Won-Denominated Bank Accounts(1)) |
|
| |
|
Assumed Interest Rates |
|
|
Change in Net
Interest Income |
|
|
Change in Net
Interest Income |
|
| |
|
No
Change |
|
|
1%
Point
Increase |
|
|
1%
Point
Decrease |
|
|
Amount
(1%
Point
Increase) |
|
|
%
Change
(1%
Point
Increase) |
|
|
Amount
(1%
Point
Decrease) |
|
|
%
Change
(1%
Point
Decrease) |
|
| |
|
|
|
|
|
|
|
|
|
|
|
|
|
|
|
|
|
|
|
|
|
| |
|
(In billions of Won, except percentages) |
|
| Simulated interest income |
|
|
17,573 |
|
|
|
19,616 |
|
|
|
15,530 |
|
|
|
2,043 |
|
|
|
11.63 |
% |
|
|
(2,043 |
) |
|
|
(11.63 |
)% |
| Simulated interest expense |
|
|
10,551 |
|
|
|
12,113 |
|
|
|
8,990 |
|
|
|
1,562 |
|
|
|
14.80 |
% |
|
|
(1,562 |
) |
|
|
(14.80 |
)% |
| Net interest income |
|
|
7,021 |
|
|
|
7,503 |
|
|
|
6,540 |
|
|
|
482 |
|
|
|
6.86 |
% |
|
|
(482 |
) |
|
|
(6.86 |
)% |
Note:
| (1) |
Includes merchant banking accounts and derivatives entered into for the purpose of hedging. |
Shinhan Bank’s Won-denominated interest-earning assets and interest-bearing liabilities in non-trading accounts have a maturity structure that benefits from an increase in interest rates, because the re-pricing periods for interest-earning assets in Shinhan Bank’s non-trading accounts are, on average, shorter than those of the interest-bearing liabilities in these accounts. This is primarily due to a sustained low interest rate environment in the recent years in Korea, which resulted in a significant increase in demand for floating rate loans (which tend to have shorter maturities or re-pricing periods than fixed rate loans) as a portion of Shinhan Bank’s overall loans, which in turn led to the shortening, on average, of the maturities or re-pricing periods of Shinhan Bank’s loans on an aggregate basis. As a result, Shinhan Bank’s net interest income tends to decrease during times of a decrease in the market interest rates while the opposite is generally true during times of an increase in the market interest rates.
Interest Rate VaRs for Non-trading Assets and Liabilities
Shinhan Bank measures VaRs for interest rate risk from non-trading activities on a monthly basis. The following table shows, as of and for the year ended December 31, 2022, the VaRs of interest rate mismatch risk for other assets and liabilities, which arises from mismatches between the re-pricing dates for Shinhan Bank’s non-trading interest-earning assets (including available-for-sale investment securities) and those for its interest-bearing liabilities. Under the regulations of the Financial Services Commission, Shinhan Bank includes in calculation of these VaRs interest-earning assets and interest-bearing liabilities in its bank accounts and its merchant banking accounts.
|
|
|
|
|
|
|
|
|
|
|
|
|
|
|
|
|
| |
|
VaR for the Year 2022(1) |
|
| |
|
Average |
|
|
Minimum |
|
|
Maximum |
|
|
As of
December 31 |
|
| |
|
|
|
|
|
|
|
|
|
|
|
|
| |
|
(In billions of Won) |
|
| Interest rate mismatch — non-trading assets and
liabilities |
|
|
584 |
|
|
|
287 |
|
|
|
1,113 |
|
|
|
860 |
|
Note:
| (1) |
One-year VaR results computed based on the interest rate risk in the banking book standardized approach presented by the Bank for International Settlements. See “— Interest Rate Risk Management.” |
140
Interest Rate Risk for Other Subsidiaries
Shinhan Card monitors and manages its interest rate risk for all its interest-bearing assets and liabilities (including off-balance sheet items) in terms of the impact on its earnings and net asset value from changes in interest rates. Shinhan Card primarily uses interest rate VaR and EaR analyses to measure its interest rate risk.
The interest rate VaR analysis used by Shinhan Card principally focuses on the maximum impact on its net asset value from adverse movements in interest rates and consists of (i) historical interest rate VaR analysis and (ii) interest rate gap analysis. The historical interest rate VaR analysis is made through simulation of net asset value based on the interest rate volatility over a fixed past period to produce expected future interest rate scenarios and computes the maximum value at risk at a 99.9% confidence level by analyzing the net present value distribution under each such scenario. As for interest rate gap analysis, Shinhan Card computes the value at risk based on the duration proxies and interest rate shocks for each time interval as recommended under the Basel Accord.
The interest rate EaR analysis used by Shinhan Card computes the maximum loss in net interest income for a one-year period following adverse movements in interest rates, based on an interest rate gap analysis using the time intervals and the “middle of time band” as recommended under the Basel Accord.
Shinhan Securities uses historical interest rate VaR analysis based on its internal model to monitor and manage its interest rate risk. The historical interest rate VaR analysis is made through simulation of net asset value based on the interest rate volatility over the past three years to compute the maximum value at risk at a 99.9% confidence level. Shinhan Securities also measures its level of IRRBB exposure.
Shinhan Life Insurance monitors and manages its interest rate risk for its investment assets and liabilities based on simulations of its asset-liability management system. These simulations typically involve subjecting Shinhan Life Insurance’s current and future assets and liabilities to more than 2,000 market scenarios based on varying assumptions, such as new debt purchases and current investment portfolios, so as to derive its net asset value forecast for the next one year at a 99.9% confidence level.
Interest rate risk for our other subsidiaries is insignificant.
Equity Risk
Substantially all of Shinhan Bank’s equity risk relates to its portfolio of common stock in Korean companies. As of December 31, 2022, Shinhan Bank held an aggregate amount of W344.6 billion of equity interest in unlisted foreign companies (including W0.03 billion invested in unlisted private equity funds).
The equity securities in Won held in Shinhan Bank’s investment portfolio consist of stocks listed on the KRX KOSPI Market or the KRX KOSDAQ Market of the Korea Exchange and certain non-listed stocks. Shinhan Bank sets exposure limits for most of these equity securities to manage their related risk. As of December 31, 2022, Shinhan Bank held equity securities in an aggregate amount of W1,482.7 billion in its non-trading accounts, including equity securities in the amount of W279.8 billion that it held, among other reasons, for management control purposes and as a result of debt-to-equity conversion as a part of reorganization proceedings of the companies to which it had extended loans.
As of December 31, 2022, Shinhan Bank held Won-denominated convertible bonds in an aggregate amount of W22.0 billion and did not hold any Won-denominated exchangeable bonds or Won-denominated bonds with warrants, in each case, in its non-trading accounts. Shinhan Bank does not measure equity risk with respect to convertible bonds, exchangeable bonds or bonds with warrants, and the interest rate risk of these equity-linked securities are measured together with the other debt securities. As such, Shinhan Bank measures interest rate risk VaRs but not equity risk VaRs for these equity-linked securities.
141
Liquidity Risk Management
Liquidity risk is the risk of insolvency, default or loss due to disparity between inflow and outflow of funds, including the risk of having to obtain funds at a high price or to dispose of securities at an unfavorable price due to lack of available funds. Each of our subsidiaries seeks to minimize liquidity risk through early detection of risk factors related to the sourcing and managing of funds that may cause volatility in liquidity and by ensuring that it maintains an appropriate level of liquidity through systematic management. At the group-wide level, we manage our liquidity risk by conducting monthly stress tests that compare liquidity requirements under normal situations against those under three types of stress situations, namely, our group-specific internal crisis, crisis in the external market and a combination of internal and external crisis. In addition, in order to preemptively and comprehensively manage liquidity risk, we measure and monitor liquidity risk management using various indices, including the “limit management index,” “early warning index” and “monitoring index.”
Shinhan Bank applies the following basic principles for liquidity risk management:
| |
• |
|
raise funds in sufficient amounts, at the optimal time at reasonable costs; |
| |
• |
|
maintain liquidity risk at appropriate levels and preemptively manage them through a prescribed risk limit system and an early warning signal detection system; |
| |
• |
|
secure stable sources of revenue and minimize actual losses by implementing an effective asset-liability management based on diversified sources of funding with varying maturities; |
| |
• |
|
monitor and manage daily and intra-daily liquidity positions and risk exposures for timely payment and settlement of financial obligations due under both normal and crisis situations; |
| |
• |
|
conduct periodic liquidity stress test in anticipation of any potential liquidity crisis and establish and implement contingency funding plans in case of an actual crisis; and |
| |
• |
|
consider liquidity-related costs, benefits of and risks in determining the pricing of our products and services, performance evaluations and approval of launching of new products and services. |
Each of our subsidiaries manages liquidity risk in accordance with the risk limits and guidelines established internally and by the relevant regulatory authorities. Pursuant to principal regulations applicable to financial holding companies and banks as promulgated by the Financial Services Commission, we, at the holding company level, are required to maintain a liquidity coverage ratio and a foreign currency liquidity coverage ratio. These ratios require us to maintain the relevant ratios above certain minimum levels.
Shinhan Bank manages its liquidity risk within the limits set on Won and foreign currency accounts in accordance with the regulations of the Financial Services Commission. The Financial Services Commission implemented a minimum liquidity coverage ratio requirement for Korean banks, including Shinhan Bank, of at least 90.0% as of January 1, 2017, 95.0% as of January 1, 2018 and 100.0% as of January 1, 2019. Financial Services Commission defines liquidity coverage ratio as high quality liquid assets that can be immediately converted into cash with little or no loss in value, as divided by the net amount of cash outflow for the next 30 day period, under the stress level established according to the liquidity coverage ratio, pursuant to the Regulation on the Supervision of the Banking Business, which was amended as of June 28, 2016 to implement the liquidity coverage ratio requirements under Basel III. In addition to the liquidity coverage ratio, the Financial Supervisory Commission introduced the net stable funding ratio into the Regulation on the Supervision of the Banking Business that came into effect in January 2018. Whereas liquidity coverage ratio is aimed at measuring liquidity for the next 30-day period, net stable funding ratio, calculated as the ratio of available stable funding to required stable funding, is aimed at measuring liquidity for the next one-year period. A bank’s available stable funding is the portion of its capital and liabilities that are safely expected to remain with the bank for more than one year. A bank’s required stable funding is the amount of stable funding that it is required to hold given the liquidity characteristics and residual maturities of its assets and the contingent liquidity risk arising from its off-balance sheet exposures. Shinhan Bank is required by the Financial Services Commission to maintain a net stable funding ratio of at least 100%.
142
With respect to foreign currency liquidity coverage ratio, the Regulation on the Supervision of the Banking Business requires that financial institutions dealing with foreign exchange affairs (i.e., banks) whose foreign-currency denominated liabilities are equal to or greater than US$500 million or 5% of its total liabilities, as of the end of the immediately preceding half-year period, maintain a foreign currency liquidity coverage ratio of 60% or higher beginning January 1, 2017, 70% or higher beginning January 1, 2018 and 80% or higher beginning January 1, 2019. The term “foreign currency liquidity coverage ratio” means the ratio of high quality liquidity assets to the net cash outflow in respect of foreign-currency denominated assets and liabilities for the next 30 days.
In April 2020, in response to the COVID-19 pandemic, the Financial Services Commission temporarily lowered the liquidity coverage ratio requirement from 100% to 85%. The Financial Services Commission subsequently decided to gradually restore this ratio on a quarterly basis from the third quarter of 2022, to a ratio of 90% in the third quarter of 2022, 92.5% in the fourth quarter of 2022, 95% in the first quarter of 2023, 97.5% in the second quarter of 2023 and 100% from the third quarter of 2023. However, in October 2022, the Financial Services Commission decided to apply the 92.5% ratio until the end of June 2023 in response to the increasing volatility and uncertainty in the short-term money market, as determined through a financial market inspection meeting.
Shinhan Bank’s Treasury Department is in charge of liquidity risk management with respect to Shinhan Bank’s Won and foreign currency funds. The Treasury Department submits Shinhan Bank’s monthly funding and asset management plans to Shinhan Bank’s Asset and Liability Committee for approval, based on the analysis of various factors, including macroeconomic indices, interest rate and foreign exchange movements and maturity structures of Shinhan Bank’s assets and liabilities. Shinhan Bank’s Risk Engineering Department measures Shinhan Bank’s liquidity coverage ratio on a daily basis and net stable funding ratio on a monthly basis and reports whether they are in compliance with the respective limits to Shinhan Bank’s Risk Policy Committee, which sets and monitors Shinhan Bank’s liquidity coverage ratio and net stable funding ratio on a monthly basis.
The following tables show Shinhan Bank’s (i) average liquidity coverage ratio, (ii) average foreign currency liquidity coverage ratio, and (iii) net stable funding ratio, each for the month of December 2022 in accordance with the regulations of the Financial Services Commission.
Shinhan Bank’s Average Liquidity Coverage Ratio for the Month of December 2022
|
|
|
|
|
| |
|
For the Month of December 2022 |
|
| |
|
(in billions of Won, except percentages) |
|
| High quality liquid assets (A) |
|
W |
83,735 |
|
| Net cash outflows over the next 30 days (B) |
|
|
85,549 |
|
| Cash outflow |
|
|
116,683 |
|
| Cash inflow |
|
|
31,134 |
|
| Liquidity coverage ratio (A/B) |
|
|
97.88 |
% |
Shinhan Bank’s Average Foreign Currency Liquidity Coverage Ratio for the Month of December 2022
|
|
|
|
|
| |
|
For the Month of December 2022 |
|
| |
|
(in millions of US$, except percentages) |
|
| High quality liquid assets (A) |
|
$ |
6,885 |
|
| Net cash outflows over the next 30 days (B) |
|
|
4,858 |
|
| Cash outflow |
|
|
17,244 |
|
| Cash inflow |
|
|
12,386 |
|
| Liquidity coverage ratio (A/B) |
|
|
141.32 |
% |
143
Shinhan Bank’s Net Stable Funding Ratio for the Month of December 2022
|
|
|
|
|
| |
|
For the Month of December 2022 |
|
| |
|
(in billions of Won, except percentages) |
|
| Available stable funding (A) |
|
W |
292,867 |
|
| Required stable funding (B) |
|
|
266,253 |
|
| Net stable funding ratio (A/B) |
|
|
110.00 |
% |
Shinhan Bank maintains diverse sources of liquidity to facilitate flexibility in meeting its funding requirements. Shinhan Bank funds its operations principally by accepting deposits from retail and corporate depositors, accessing the call loan market (a short-term market for loans with maturities of less than one month), issuing debentures and borrowing from the Bank of Korea. Shinhan Bank uses the funds primarily to extend loans or purchase securities. Generally, deposits are of shorter average maturity than loans or investments.
Shinhan Card manages its liquidity risk according to the following principles: (i) provide a sufficient volume of necessary funding in a timely manner at a reasonable cost, (ii) establish an overall liquidity risk management strategy, including in respect of liquidity management targets, policy and internal control systems, and (iii) manage its liquidity risk in conjunction with other risks based on a comprehensive understanding of the interaction among the various risks. As for any potential liquidity shortage at or near the end of each month, Shinhan Card maintains liquidity at a level sufficient to withstand credit shortage for three months.
In addition, Shinhan Card manages liquidity risk by setting and complying with specific guidelines for various measures of liquidity, including the breakdown of contractual payment obligations by maturity, overseas funding, the ratio of asset-backed securitized borrowings to the total borrowing, the ratio of requisite liquidity to reserve liquidity, and the ratio of fixed interest rate borrowings to floating interest rate borrowings. Furthermore, Shinhan Card closely monitors various indicators of a potential liquidity crisis, such as the actual liquidity gap ratio (in relation to the different maturities for assets as compared to liabilities), the liquidity buffer ratio. Shinhan Card also has contingency plans in place in case of any emergency or crisis. In managing its liquidity risk, Shinhan Card focuses on a prompt response system based on periodic monitoring of the relevant early signals, stress testing and contingency plan formulations. Shinhan Card identifies its funding needs on a daily, monthly, quarterly and annual basis based on the maturity schedule of its liabilities as well as short-term liquidity needs, based upon which it formulates its funding plans using diverse sources such as corporate debentures, commercial papers, asset-backed securitizations and credit line facilities. When entering into asset-backed securitizations, Shinhan Card provides sufficient credit enhancements to avoid triggering early amortization events. In addition, prior to entering into any funding transaction and related derivative transaction, Shinhan Card conducts pre-transaction risk analyses, including in respect of counterparty credit risk and its total exposure limit by country and by financial institution.
Shinhan Card also manages its liquidity risk within the limits set on Won accounts in accordance with the regulations of the Financial Services Commission. Under the Specialized Credit Financial Business Act and the regulations thereunder, credit card companies in Korea are required to maintain a Won liquidity ratio of at least 100.0%.
144
The following tables show Shinhan Card’s liquidity status and limits for Won-denominated accounts as of December 31, 2022 in accordance with the regulations of the Financial Services Commission.
Shinhan Card’s Won-denominated accounts
|
|
|
|
|
|
|
|
|
|
|
|
|
|
|
|
|
|
|
|
|
|
|
|
|
|
|
|
|
|
|
|
|
| |
|
As of December 31, 2022 |
|
| Won-Denominated
Accounts |
|
7 Days
or Less |
|
|
1 Month
or Less |
|
|
3 Months
or Less |
|
|
6 Months
or Less |
|
|
1 Year or
Less |
|
|
Over
1 Year |
|
|
Over
2 Years |
|
|
Total |
|
| |
|
|
|
|
|
|
|
|
|
|
|
|
|
|
|
|
|
|
|
|
|
|
|
|
| |
|
(In billions of Won, except percentages) |
|
| Assets |
|
W |
3,202 |
|
|
W |
14,180 |
|
|
W |
21,102 |
|
|
W |
25,064 |
|
|
W |
30,118 |
|
|
W |
35,803 |
|
|
W |
7,306 |
|
|
W |
43,109 |
|
| Liabilities |
|
|
952 |
|
|
|
4,217 |
|
|
|
5,863 |
|
|
|
7,521 |
|
|
|
11,444 |
|
|
|
19,217 |
|
|
|
13,401 |
|
|
|
32,618 |
|
| Liquidity ratio |
|
|
|
|
|
|
|
|
|
|
360 |
% |
|
|
|
|
|
|
|
|
|
|
|
|
|
|
|
|
|
|
|
|
Shinhan Securities manages its liquidity risk for its Won-denominated accounts by setting a limit of W300 billion on each of its seven-day, one-month and three-month liquidity gap, a limit of 110% on its one-month and three-months liquidity ratios and a limit of W50 billion on its liquidity VaR. As for its foreign currency-denominated accounts, Shinhan Securities manages the liquidity risk on a quarterly basis in compliance with the guidelines of the Financial Supervisory Service, which requires the seven-day and one-month maturity mismatch ratios to be 0% and -10% or higher, respectively, and the three months liquidity ratio to be 80% or higher.
Our other subsidiaries fund their operations primarily through call money, bank loans, commercial paper, corporate debentures and asset-backed securities. Our holding company acts as a funding vehicle for long-term financing of our subsidiaries whose credit ratings are lower than the holding company, including Shinhan Card and Shinhan Capital, to lower the overall funding costs within regulatory limitations. Under the Monopoly Regulation and Fair Trade Act, however, a financial holding company is prohibited from borrowing funds in excess of 200% of its total stockholders’ equity.
In addition to liquidity risk management under the normal market situations, we have contingency plans to effectively cope with possible liquidity crisis. Liquidity crisis arises when we would not be able to effectively manage the situations with our normal liquidity management measures due to, among other reasons, inability to access our normal sources of funds or epidemic withdrawals of deposits as a result of various external or internal factors, including a collapse in the financial markets or abrupt deterioration of our credit. We have contingency plans corresponding to different stages of liquidity crisis: namely, “alert stage,” “imminent-crisis stage” and “crisis stage,” based on the following liquidity indices:
| |
• |
|
indices that reflect the market movements such as interest rates and stock prices; |
| |
• |
|
indices that reflect financial market sentiments, an example being the size of money market funds; and |
| |
• |
|
indices that reflect our internal liquidity condition. |
Operational Risk Management
Operational risk is difficult to quantify and subject to different definitions. The Basel Committee defines operational risk as the risk of loss resulting from inadequate or failed internal processes, people and systems or from other external events. Similarly, we define operational risk as the risks related to our overall management other than credit risk, market risk, interest rate risk and liquidity risk. These include risks arising from system failure, human error, non-adherence to policy and procedures, fraud, inadequate internal controls and procedures or environmental changes and resulting in financial and non-financial loss. We monitor and assess operational risks related to our business operations, including administrative risk, information technology risk (including cyber security risk), managerial risk and legal risk, with a view to minimizing such losses.
Our holding company’s Audit Committee, which consists of three outside directors, one of whom is an accounting or financial expert as required by internal control regulations under the Act on Corporate Governance
145
of Financial Companies, oversees and monitors our operational compliance with legal and regulatory requirements. The Audit Committee also oversees management’s operations and may, at any time it deems appropriate, demand additional operations-related reporting from management and inspects our asset condition. At the holding company level, we define each subsidiary’s operational process and establish an internal review system applicable to each subsidiary. Each subsidiary’s operational risk is internally monitored and managed at the subsidiary level and the Group Internal Audit Department at our holding company, which reports to our Audit Committee, continuously monitors the integrity of our subsidiaries’ operational risk management system. Our holding company’s board of directors and the Group Risk Management Committee establish our basic policies for internal control at the group level. The Group Internal Audit Department at our holding company is directly responsible for overseeing our internal controls with a focus on legal, regulatory, operational and reputational risks. The Group Internal Audit Department audits both our and our subsidiaries’ operations and asset condition in accordance with our annual audit plan, which is approved by the Audit Committee, and submits regular reports to the Audit Committee pursuant to our internal reporting system. If the Group Internal Audit Department discovers any non-compliance with operational risk procedures or areas of weaknesses, it promptly alerts the business department in respect of which such non-compliance was discovered and demands implementation of corrective measures. Implementation of such corrective measures is subsequently reviewed by the Group Internal Audit Department.
To monitor and manage operational risk, Shinhan Bank maintains a system of comprehensive policies and has in place a control framework designed to provide a stable and well-managed operational environment throughout the organization. Currently, the primary responsibility for ensuring compliance with our banking operational risk procedures remains with each of the business units and operational teams. In addition, the Audit Department, the Risk Management Department and the Compliance Department of Shinhan Bank also play important roles in reviewing and maintaining the integrity of Shinhan Bank’s internal control environment.
The operational risk management system of Shinhan Bank is managed by the operational risk team under the Risk Management Department. The current system principally consists of risk control self-assessment, risk quantification using key risk indicators, loss data collection, scenario analysis and operational risk capital measurement. Shinhan Bank operates several educational and awareness programs designed to have all of its employees to be familiar with this system. In addition, Shinhan Bank has a designated operational risk manager at each of its departments and branch offices, who serves as a coordinator between the operational risk team at the headquarters and the employees in the front office and seeking to provide centralized feedback to further improve the operational risk management system.
As of December 31, 2022, Shinhan Bank has conducted risk control self-assessments on its departments as well as domestic and overseas branch offices, from which it collects systematized data on all of its branch offices, and uses the findings from such self-assessments to improve the procedures and processes for the relevant departments or branch offices. In addition, Shinhan Bank has accumulated risk-related data since 2003, improved the procedures for monitoring operational losses and is developing risk simulation models. In addition, Shinhan Bank selects and monitors, at the department level, approximately 350 key risk indicators.
The Audit Committee of Shinhan Bank, which consists of one standing director and two outside directors, is an independent inspection authority that supervises Shinhan Bank’s internal controls and compliance with established ethical and legal principles. The Audit Committee performs internal audits of, among other matters, Shinhan Bank’s overall management and accounting, and supervises its Audit Department, which assists Shinhan Bank’s Audit Committee. Shinhan Bank’s Audit Committee also reviews and evaluates Shinhan Bank’s accounting policies and their changes, financial and accounting matters and fairness of financial reporting.
Shinhan Bank’s Audit Committee, Audit Department and Compliance Department supervise and perform the following duties:
| |
• |
|
general audits, including full-scale audits performed annually for the overall operations, sectional audits of selected operations performed as needed, and periodic and irregular spot audits; |
146
| |
• |
|
special audits, performed when the Audit Committee deems it necessary or pursuant to requests by the chief executive officer or supervisory authorities such as the Financial Supervisory Service; |
| |
• |
|
day-to-day audits, performed by the standing member of Shinhan Bank’s Audit Committee for material transactions or operations that are subject to approval by the heads of Shinhan Bank’s operational departments or senior executives; |
| |
• |
|
real-time monitoring audits, performed by the computerized audit system to identify any irregular transactions and take any necessary actions; and |
| |
• |
|
self-audits as a self-check by each operational department to ensure its compliance with our business regulations and policies, which include daily audits, monthly audits and special audits. |
In addition to these audits and compliance activities, Shinhan Bank’s Risk Management Department designates operational risk management examiners to monitor the appropriateness of operational risk management frameworks and the functions and activities of the board of directors, relevant departments and business units, and conducts periodic checks on the operational risk and reports such findings. Shinhan Bank’s Audit Department also reviews in advance proposed banking products or other business or service plans with a view to minimizing operational risk. General audits, special audits, day-to-day audits and real-time monitoring audits are performed by Shinhan Bank’s examiners, and self-audits are performed by the self-auditors of the relevant operational departments.
As for Shinhan Securities, its audit department conducts an annual inspection as to whether the internal policy and procedures of Shinhan Securities relating to its overall operational risk management are being effectively complied. The inspection has a particular focus on the appropriateness of the scope of operational risks and the collection, maintenance and processing of relevant operating data. Shinhan Securities, through its operational risk management system, also conducts self-assessments of risks, collects loss data and manages key risk indicators. The operational risk management system is supervised by its audit department, compliance department and risk management department, as well as a risk management officer in each of Shinhan Securities’ departments.
Shinhan Card’s audit committee reviews whether the internal policy and procedures of Shinhan Card are effective and implements measures to improve such policies as needed. Shinhan Card’s audit committee also contributes to work efficiency, financial risk minimization and management rationalization. Shinhan Card is developing an operational risk management system in accordance with the Financial Supervisory Service’s oversight guidelines regarding operational risk measurement, which it plans to use to assess operational risk by department in order to identify operational risk factors and to assess and mitigate potential risks on a periodic basis.
Shinhan Life Insurance’s Risk Management Department and Compliance Department reviews whether the internal policy and procedures of Shinhan Life Insurance are being effectively complied with. Shinhan Life Insurance implemented an operational risk management process in 2018 by setting up key risk indicators in each department and utilizes it to assess operational risk, collect data and manage key indicators. Furthermore, Shinhan Life Insurance established a standard roadmap to improve its operational risk assessment capabilities. Shinhan Life Insurance established an Operational Risk Management Team in an effort to improve its operational risk assessment capabilities and implement operational risk management systems. In order to reduce operational risk across products, projects, outsourcings and sales channels, risk assessments are conducted, and high risk areas are identified on a regular basis and then subject to heightened risk monitoring. In addition, Shinhan Life developed a business continuity plan to prepare for disastrous events and conduct annual drills. Shinhan Life Insurance plans to advance its operational risk management system and to enhance operational risk management capabilities in additional areas by establishing an operational risk management system in response to the implementation of Basel III operational risk requirements.
In addition to internal audits and inspections, the Financial Supervisory Service conducts general annual audits of our and our subsidiaries’ operations. The Financial Supervisory Service also performs special audits as
147
the need arises on particular aspects of our and our subsidiaries’ operations such as risk management, credit monitoring and liquidity. In the ordinary course of these audits, the Financial Supervisory Service routinely issues warning notices where it determines that a regulated financial institution or such institution’s employees have failed to comply with the applicable laws or rules, regulations and guidelines of the Financial Supervisory Service. We and our subsidiaries have in the past received, and expect in the future to receive, such notices and we have taken and will continue to take appropriate actions in response to such notices. For example, in October 2018, the Financial Supervisory Service requested Shinhan Bank to submit supporting documents in connection with allegations of inadequate compliance controls. In November 2018, the Financial Supervisory Service notified Shinhan Bank of an institutional caution for alleged deficiencies in its customer due diligence and imposed an administrative fine of W100 million citing negligence in carrying out its customer verification obligations. In December 2019, the Financial Supervisory Service notified Shinhan Bank of an institutional caution and imposed an administrative fine of W3 billion for alleged prohibited activities, including promotional activities for specified money trusts, investment solicitation for derivatives and management of trust properties. In 2021, the Korea Exchange imposed a total of three penalties on Shinhan Securities for regulatory violations, totaling W2.7 million in fines. In 2021, the Financial Supervisory Service imposed a total of eight penalties against Shinhan Securities for regulatory violations, totaling W4,092 million in fines, which include a fine of W1,800 million for certain employees’ violation of conflict of interest obligations in connection with the Lime Asset incident and a fine of W1,160 million for violation of rules against advertising certain money trust products. In 2022, the Korea Exchange imposed a total of four penalties on Shinhan Securities for regulatory violations, totaling W2.0 million in fines. In 2022, the Financial Supervisory Service imposed a total of four penalties against Shinhan Securities for regulatory violations, totaling W600.9 million in fines. In January 2020, the Financial Supervisory Service notified Shinhan Life Insurance of an institutional caution and imposed an administrative fine of W266 million for allegedly omitting certain information regarding the level of expenses deducted from premiums paid when selling savings insurance products over the telephone. In February 2021, the Financial Supervisory Service notified Shinhan Bank of an institutional warning and imposed an administrative fine of W2.1 billion for reasons including alleged violation of internal regulations and reporting procedures in connection with Shinhan Bank’s designation as the primary bank for Seoul Metropolitan Government in 2018. In March 2021, the Financial Supervisory Service notified Shinhan Bank of an institutional caution and imposed an administrative fine of W31.2 million for alleged violation of the safety standard in operating its information system in respect of the electronic financial transaction and alleged negligence in notifying its customers of the errors occurred to the electronic financial transaction and measures taken to correct the errors. In January 2021, the Financial Services Commission imposed a fine of W28.8 million on Shinhan Card citing failure to discard personal information after transaction. For further details, see “Item 8.A. Consolidated Statements and Other Financial Information — Legal Proceedings.”
We consider legal risk as a part of operational risk. The uncertainty of the enforceability of obligations of our customers and counterparties, including foreclosure on collateral, creates legal risk. Changes in laws and regulations could also adversely affect us. Legal risk is higher in new areas of business where the law is often untested in the courts although legal risk can also increase in our traditional business to the extent that the legal and regulatory landscape in Korea changes and many new laws and regulations governing the banking industry remain untested. We seek to minimize legal risk by using stringent legal documentation, employing procedures designed to ensure that transactions are properly authorized and consulting legal advisers. The Compliance Department operates Shinhan Financial Group’s compliance system. This system is designed to ensure that all employees of Shinhan Financial Group and its subsidiaries comply with the relevant laws and regulations. The compliance system’s main function is to monitor the degree of improvement in compliance with the relevant laws and regulations, maintain internal controls (including ensuring that each department has established proper internal policies and that it complies with those policies) and educate employees about observance of the relevant laws and regulations. The Compliance Department also supervises the management, execution and performance of self-audits.
148
Upgrades to Risk Management Systems
Our recent material upgrades in relation to risk management systems are as follows.
Shinhan Financial Group
In May 2015, we developed and implemented a credit review system to unify our corporate credit review and risk measurements, allowing us and our subsidiaries to utilize a uniform and consistent credit review system with respect to each borrower. In addition, in preparation of full implementation of Basel III requirements relating to liquidity coverage ratios for bank holding companies and to enhance our liquidity risk management capabilities, we have implemented a Basel III liquidity coverage ratio risk management system by which we calculate our liquidity coverage ratio each month.
Shinhan Bank
In order to strengthen risk management of its overseas subsidiaries and effectively comply with local and domestic regulations, Shinhan Bank is in the process of laying out a global risk management system network, which records the risk data of its overseas subsidiaries. Shinhan Bank seeks to leverage the development of this system for further overseas expansion and stable growth of existing overseas subsidiaries. To date, Shinhan Bank has completed the development of such system for its subsidiaries in China, Japan, Vietnam, the United States, Canada, India, Europe and Mexico. Shinhan Bank also plans to expand the application of this system to its other overseas subsidiaries.
Shinhan Bank has also completed development of a system to calculate stressed VaR based on Basel II standards in order to prepare for stress situations such as the global financial crisis in 2008. Shinhan Bank has received approval for such system from the Financial Supervisory Service and has been implemented since 2012.
In 2012, Shinhan Bank developed a system for improving collection and recovery of bad assets through enhanced LGD data processing. In addition, in 2012, Shinhan Bank received approvals from the Financial Supervisory Service for upgrades to its credit evaluation modeling for risk assessment of small- to medium-sized enterprises that are not required to be audited by outside accounting firms and for SOHOs, which upgrades related to factoring in the credit profile of the head of such enterprises and SOHOs. In 2014, Shinhan Bank further upgraded the credit evaluation modeling for risk assessment of small- and medium-size enterprises that are not required to be audited by outside accounting firms by entirely revamping the modeling for enterprises subject to outside audits, enterprises that are not subject to outside auditors and enterprise heads. Such upgraded modeling was approved by the Financial Supervisory Service, and Shinhan Bank began implementation of the upgraded system since 2014. In 2014, Shinhan Bank reclassified its credit evaluation models for risk assessment of enterprises into the following four categories: (i) IFRS (enterprises subject to external audits under IFRS as adopted by Korea), (ii) GAAP (enterprises subject to external audits under Generally Accepted Accounting Principles), (iii) small- and medium-size enterprises and (iv) SOHO. Such reclassification was approved by the Financial Supervisory Service, and Shinhan Bank began to implement the system in 2015.
In addition, in 2013, Shinhan Bank obtained approval from the Financial Supervisory Service to use an internal evaluation model with respect to Basel II credit risks related to Shinhan Bank’s retail and SOHO exposures. In 2016, Shinhan Bank developed a new internal evaluation model and obtained approval from the Financial Supervisory Service to use the new model with respect to Basel II credit risks related to Shinhan Bank’s retail exposures. In addition, Shinhan Bank received another approval in 2016 for LGD data processing using the AIRB approach in order to reflect changes in economic conditions such as prolonged recovery periods and low interest rates, and the newly approved LGD data processing will replace existing LGD data processing for both retail and SOHO exposures.
Shinhan Bank also upgraded the asset and liability management system in 2012 in order to timely comply with Basel III, IFRS and other regulatory requirements as well as to upgrade the quality of risk-related data. In
149
2014, Shinhan Bank upgraded the liquidity coverage ratio and net stable funding ratio systems under Basel III in order to facilitate daily measurement and efficient management.
Following the approval by the Financial Supervisory Service of the advanced measurement approach for risk management, Shinhan Bank has re-established the operational risk management system in order to further enhance its operational risk management capabilities.
Shinhan Card
In 2012, Shinhan Card completed further upgrades to its credit risk measurement system in satisfaction of the Basel II standards, as well as other regulatory requirements and internal needs in order to address the ongoing volatility in the economic and regulatory environment. In December 2016, Shinhan Card obtained approval from the Financial Supervisory Service to use a new internal evaluation model with respect to Basel III credit risks related to its retail and SOHO exposures.
Shinhan Securities
In 2016, Shinhan Securities established a Risk Engineering Team and updated its market risk management system to increase its value assessment capabilities for over-the-counter derivatives, strengthen its VaR risk analysis capabilities and improve various simulation functions. Beginning in 2017, the Risk Engineering Team conducts value assessment and reviews over-the-counter derivatives directly using various enhanced simulation functions such as updated stress tests in order to stabilize financial accounting prices and enhance the risk management of over-the-counter derivatives. In January 2019, the Risk Engineering Team was elevated to a department, becoming the Risk Engineering Department, expanding the scope of products reviewed by the department and strengthening its simulation analysis capabilities.
Shinhan Life Insurance
In 2017, Shinhan Life Insurance updated its interest rate risk measurement system, called the ALM system, in anticipation of IFRS 17 and the K-ICS, a new insurance liability market valuation system designed to replace the existing risk based capital system. In 2018, the new asset liability management system implemented an interest rate risk management system based on the Europe Solvency II standard. The asset liability management system can measure both asset and liability based on marking to market valuation. Shinhan Life Insurance also updated its interest rate risk management system to control net income margin volatility resulting from market interest rate changes and has tailored its business scheme to this system in order to better manage risk and profits and match the duration of its assets and liabilities. In 2019, Shinhan Life Insurance further upgraded its insurance risk measurement system in anticipation of the K-ICS, which is expected to become effective in 2023. The upgraded system can more elaborately measure insurance risk associated with mortality, longevity, morbidity, disability, lapse and expenses. Shinhan Life Insurance measures its insurance risk using shock scenarios and parameters calibration based on internal statistical estimates.
150
Supervision and Regulation
Principal Regulations Applicable to Financial Holding Companies
General
The Korean financial holding companies and their subsidiaries are regulated by the Financial Holding Companies Act (last amended on January 1, 2023, Law No. 19211). In addition, Korean financial holding companies and their subsidiaries are subject to the regulations and supervision of the Financial Services Commission and the Financial Supervisory Service.
Pursuant to the Financial Holding Companies Act, the Financial Services Commission regulates various activities of financial holding companies. For instance, it approves the application for setting up a new financial holding company and promulgates regulations on the capital adequacy of financial holding companies and their subsidiaries and other regulations relating to the supervision of financial holding companies.
The Financial Supervisory Service is subject to the instructions and directives of the Financial Services Commission and carries out supervision and examination of financial holding companies and their subsidiaries. In particular, the Financial Supervisory Service sets forth liquidity and capital adequacy requirements for financial holding companies and reporting requirements pursuant to the authority delegated to the Financial Supervisory Service under the Financial Services Commission regulations, pursuant to which financial holding companies are required to submit quarterly reports on business performance, financial status and other matters prescribed in the Presidential Decree of the Financial Holding Companies Act.
Under the Financial Holding Companies Act, the establishment of a financial holding company must be approved by the Financial Services Commission. A financial holding company is required to be mainly engaged in controlling its subsidiaries by holding the shares or equities of the subsidiaries in the amount of not less than 50% of aggregate amount of such financial holding company’s assets based on the latest balance sheet. A financial holding company is prohibited from engaging in any profit-making businesses other than controlling the management of its subsidiaries and certain ancillary businesses as prescribed in the Presidential Decree of the Financial Holding Companies Act which includes the following businesses:
| |
• |
|
financially supporting its subsidiaries and the subsidiaries of its subsidiaries (the “direct and indirect subsidiaries”), including lending properties with economic values such as monies and securities, guaranteeing obligation performance and other direct or indirect transactions involving transactional credit risk; |
| |
• |
|
raising capital necessary for the investment in subsidiaries or providing financial support to its direct and indirect subsidiaries; |
| |
• |
|
supporting the business of its direct and indirect subsidiaries for the joint development and marketing of new products; |
| |
• |
|
supporting the operations of its direct and indirect subsidiaries by providing access to data processing, legal and accounting resources; and |
| |
• |
|
pursuing any other activities exempted from authorization, permission or approval under the applicable laws and regulations. |
The Financial Holding Companies Act requires every financial holding company (other than any financial holding company that is controlled by any other financial holding company) or its subsidiaries to obtain the prior approval from the Financial Services Commission before acquiring control of another company or to file with the Financial Services Commission a report within thirty days after acquiring such control. Permission to liquidate or to merge with any other company must be obtained in advance from the Financial Services Commission. A financial holding company must report to the Financial Services Commission regarding certain events including:
| |
• |
|
when there is a change of its largest shareholder; |
151
| |
• |
|
when there is a change of principal shareholders of a bank holding company; |
| |
• |
|
when the shareholding of the largest shareholder or a principal shareholder as prescribed under the Financial Holding Companies Act or a person who is in a special relationship with such largest or principal shareholder (as defined under the Presidential Decree of the Financial Holding Companies Act) changes by 1% or more of the total issued and outstanding voting shares of the financial holding company; |
| |
• |
|
when there is a change of its name; |
| |
• |
|
when there is a cause for dissolution; and |
| |
• |
|
when it or its subsidiary ceases to control any of its respective direct and indirect subsidiaries by disposing of the shares of such direct and indirect subsidiaries. |
Capital Adequacy
The Financial Holding Companies Act does not provide for a minimum paid-in capital of financial holding companies. All financial holding companies, however, are required to maintain a specified level of solvency. In addition, in its allocation of the net profit earned in a fiscal term, a financial holding company is required to set aside in its legal reserve an amount equal to at least 10% of the net income after tax each time it pays dividends on its net profits earned until its legal reserve reaches at least the aggregate amount of its paid-in capital.
A financial holding company controlling banks or other financial institutions conducting banking business as prescribed in the Financial Holding Company Act (hereinafter, the “bank holding company”) is required to maintain a minimum consolidated equity capital ratio of 8.0%. “Consolidated equity capital ratio” is defined as the ratio of equity capital as a percentage of risk-weighted assets on a consolidated basis, determined in accordance with the Financial Services Commission requirements that have been formulated based on the Bank of International Settlements standards. “Equity capital,” as applicable to bank holding companies, is defined as the sum of Tier I capital, Tier II capital, and Tier III capital less any deductible items, each as defined under the Regulation on the Supervision of Financial Holding Companies. “Risk-weighted assets” is defined as the sum of credit risk-weighted assets and market risk-weighted assets.
For regulatory reporting purposes, we maintain allowances for credit losses on the following loan classifications that classify corporate and retail loans as required by the Financial Services Commission. In making these classifications, we take into account a number of factors, including the financial position, profitability and transaction history of the borrower, the value of any collateral or guarantee taken as security for the extension of credit, probability of default and loss amount in the event of default. This classification method, and our related provisioning policy, is intended to reflect the borrower’s capacity to repay. To the extent there is any conflict between the Financial Services Commission guidelines and our internal analysis in such classifications, we adopt whichever is more conservative.
152
The following table sets forth loan classifications according to the guidelines of the Financial Services Commission.
|
|
|
| Loan Classification |
|
Loan Characteristics |
|
|
| Normal |
|
Loans extended to customers that, based on our consideration of their business, financial position and future cash flows, do not raise concerns regarding their ability to repay the loans. |
|
|
| Precautionary |
|
Loans extended to customers that (i) based on our consideration of their business, financial position and future cash flows, show potential risks with respect to their ability to repay the loans, although showing no immediate default risk or (ii) are in arrears for one month or more but less than three months. |
|
|
| Substandard |
|
(i) Loans extended to customers that, based on our consideration of their business, financial position and future cash flows, are judged to have incurred considerable default risks as their ability to repay has deteriorated; or (ii) the portion that we expect to collect of total loans (a) extended to customers that have been in arrears for three months or more, (b) extended to customers that have incurred serious default risks due to the occurrence of, among other things, final refusal to pay their debt instruments, entry into liquidation or bankruptcy proceedings or closure of their businesses, or (c) extended to customers who have outstanding loans that are classified as “doubtful” or “estimated loss.” |
|
|
| Doubtful |
|
Loans exceeding the amount that we expect to collect of total loans to customers that: (i) based on our consideration of their business, financial position and future cash flows, have incurred serious default risks due to noticeable deterioration in their ability to repay; or (ii) have been in arrears for three months or more but less than 12 months. |
|
|
| Estimated loss |
|
Loans exceeding the amount that we expect to collect of total loans to customers that: (i) based on our consideration of their business, financial position and future cash flows, are judged to be accounted as a loss because the inability to repay became certain due to serious deterioration in their ability to repay; (ii) have been in arrears for 12 months or more; or (iii) have incurred serious risks of default in repayment due to the occurrence of, among other things, final refusal to pay their debt instruments, liquidation or bankruptcy proceedings or closure of their business. |
In accordance with the Regulations for the Supervision of Financial Institutions, we establish regulatory reserve for loan loss in the amount of the difference between allowance for credit losses as calculated pursuant to our provisioning policy in accordance with IFRS and allowance for credit losses based on the loan classifications set forth above as required by the Financial Services Commission. In determining consolidated equity capital ratio, we deduct regulatory reserve for loan loss from equity capital.
153
Liquidity
All financial holding companies are required to match the maturities of their assets to those of liabilities in accordance with the Financial Holding Companies Act in order to ensure liquidity. Financial holding companies are required to submit quarterly reports regarding their liquidity to the Financial Supervisory Service and must:
| |
• |
|
maintain a Won liquidity ratio (defined as Won assets due within one month, including marketable securities, divided by Won liabilities due within one month) of not less than 100%; |
| |
• |
|
maintain a foreign currency liquidity ratio (defined as foreign currency liquid assets due within three months divided by foreign currency liabilities due within three months) of not less than 80% except for financial holding companies with a foreign currency liability to total assets ratio of less than 1%; |
| |
• |
|
maintain a ratio of foreign currency liquid assets due within seven days less foreign currency liabilities due within seven days divided by total foreign currency assets of not less than 0%, except for financial holding companies with a foreign currency liability to total assets ratio of less than 1%; and |
| |
• |
|
maintain a ratio of foreign currency liquid assets due within a month less foreign currency liabilities due within a month divided by total foreign currency assets of not less than negative 10% except for financial holding companies with a foreign currency liability to total assets ratio of less than 1%. |
Financial Exposure to Any Single Customer and Major Shareholders
Subject to certain exceptions, the total sum of credit (as defined in the Presidential Decree of the Financial Holding Companies Act, the Bank Act, the Presidential Decree of the Financial Investment Services and Capital Markets Act, the Insurance Act, the Mutual Savings Bank Act and the Specialized Credit Financial Business Act, respectively) of a financial holding company and its direct and indirect subsidiaries which are banks, merchant banks or securities companies (“Financial Holding Company Total Credit”) extended to a single group of companies that belong to the same conglomerate as defined in the Monopoly Regulation and Fair Trade Act will not be permitted to exceed 25% of the Net Total Equity Capital.
“Net Total Equity Capital” for the purpose of the calculation of financial exposure to any single customer and Major Shareholder (as defined below) as applicable to us and our subsidiaries is defined under the Presidential Decree of the Financial Holding Companies Act as
| |
(i) |
in the case of a financial holding company, the shareholders’ equity as defined under Article 24-3, Section 7(2) of the Presidential Decree of the Financial Holding Companies Act, which represents the difference between the total assets less total liabilities on the balance sheet as of the end of the most recent quarter; |
| |
(ii) |
in the case of a bank, the shareholders’ equity as defined under Article 2, Section 1(5) of the Bank Act, which represents the sum of Tier I and Tier II capital amounts determined according to the standards set by the BIS; |
| |
(iii) |
in the case of a merchant bank, the capital amount as defined in Article 342, Section (1) of the Financial Investment Services and Capital Markets Act; |
| |
(iv) |
in the case of a financial investment company, the shareholders’ equity as defined under Article 37, Section 3 of the Presidential Decree of the Financial Investment Services and Capital Markets Act, which represents the total shareholders’ equity as adjusted as determined by the Financial Services Commission, such as the amount of increase or decrease in paid-in capital after the end of the most recent fiscal year; |
| |
(v) |
in the case of an insurance company, the shareholders’ equity as defined under Article 2, Section 15 of the Insurance Act, which represents the sum of items designated by the Presidential Decree, such as paid-in-capital, capital surplus, earned surplus and any equivalent items, less the value of good will and other equivalent items; |
154
| |
(vi) |
in the case of a mutual savings bank, the shareholders’ equity as defined under Article 2, Section 4 of the Mutual Savings Bank Act, which represents the sum of Tier I and Tier II capital amounts determined in accordance with the standards set by the Bank for International Settlements; and |
| |
(vii) |
in the case of a credit card company or a specialty credit provider, the shareholders’ equity as defined under Article 2, Section 19 of the Specialized Credit Financial Business Act, which represents the sum of the items designated by the Presidential Decree, such as paid-in-capital, capital surplus, earned surplus and any equivalent items; |
| |
(i) |
the amount of shares in direct and indirect subsidiaries held by the financial holding company; |
| |
(ii) |
the amount of shares in the direct and indirect subsidiaries that are cross-held by such subsidiaries; and |
| |
(iii) |
the amount of shares in the financial holding company held by its direct and indirect subsidiaries. |
The Financial Holding Company Total Credit to a single individual or legal entity may not exceed 20% of the Net Total Equity Capital.
Furthermore, the total sum of credits (as defined under the Financial Holding Companies Act, the Banking Act and the Financial Investment Services and Capital Markets Act, respectively) of a bank holding company and its direct and indirect subsidiaries (“Bank Holding Company Total Credit”) extended to a “Major Shareholder” (together with the persons who have special relationship with such Major Shareholder) (as defined below) generally may not exceed the smaller of (x) 25% of the Net Total Equity Capital and (y) the amount of the equity capital of the financial holding company multiplied by the shareholding ratio of such Major Shareholder, subject to certain exceptions.
“Major Shareholder” is defined under the Financial Holding Companies Act as follows:
(a) a shareholder holding (together with persons who have a special relationship with such shareholder as defined in the Presidential Decree of the Financial Holding Companies Act) in excess of 10% (or in the case of a financial holding company controlling regional banks only, 15%) in the aggregate of the financial holding company’s total issued and outstanding voting shares; or
(b) a shareholder holding (together with persons who have a special relationship with such shareholder as defined in the Presidential Decree of the Financial Holding Companies Act) more than 4% in the aggregate of the total issued and outstanding voting shares of the financial holding company controlling national banks (other than a financial holding company controlling regional banks only), excluding shares related to the shareholding restrictions on non-financial business group companies as described below, where such shareholder is the largest shareholder or has actual control over the major business affairs of the financial holding company through, for example, appointment and dismissal of the officers pursuant to the Presidential Decree of the Financial Holding Companies Act.
In addition, the total sum of the Bank Holding Company Total Credit extended to all of a bank holding company’s Major Shareholder may not exceed 25% of the Net Total Equity Capital. Furthermore, the bank holding company and its direct and indirect subsidiaries that intend to extend the Bank Holding Company Total Credit to the bank holding company’s Major Shareholder not less than the lesser of (i) the amount equivalent to 0.1% of the Net Total Equity Capital or (ii) W5 billion, with respect to a single transaction, must obtain prior unanimous board resolutions and then, immediately after the completion of the transaction, must file a report with the Financial Services Commission and publicly disclose the filing of such report (for example, through a website).
155
Restrictions on Transactions among Direct and Indirect Subsidiaries and Financial Holding Company
Generally, a direct or indirect subsidiary of a financial holding company may not extend credit to the financial holding company which directly or indirectly controls such subsidiary. In addition, a direct or indirect subsidiary of a financial holding company may not extend credit to any other single direct or indirect subsidiary of the financial holding company in excess of 10% of its stockholders’ equity and to any other direct and indirect subsidiaries of the financial holding company in excess of 20% of its stockholders’ equity in the aggregate. The direct or indirect subsidiaries of a financial holding company must obtain an appropriate level of collateral for the credits extended to the other direct and indirect subsidiaries unless otherwise approved by the Financial Services Commission. The appropriate level of collateral for each type of such collateral is as follows:
| |
(i) |
For deposits and installment savings, obligations of the Government or the Bank of Korea, obligations guaranteed by the Government or the Bank of Korea, obligations secured by securities issued or guaranteed by the Government or the Bank of Korea: 100% of the amount of the credit extended; |
| |
(ii) |
(a) For obligations of local governments under the Local Autonomy Act, local public enterprises under the Local Public Enterprises Act, and investment institutions and other quasi-investment institutions under the Basic Act on the Management of Government-Invested Institution (hereinafter, the “public institutions and others”); (b) obligations guaranteed by the public institutions and others; and (c) obligations secured by the securities issued or guaranteed by public institutions and others: 110% of the amount of the credit extended; and |
| |
(iii) |
For any property other than those set forth in the above (i) and (ii): 130% of the amount of the credit extended. |
Subject to certain exceptions, a direct or indirect subsidiary of a financial holding company is prohibited from owning the shares of any other direct or indirect subsidiaries (other than those directly controlled by the direct and indirect subsidiaries in question) in common control by the financial holding company. However, a direct or indirect subsidiary of a financial holding company may invest as a limited partner in a private equity fund that is a direct or indirect subsidiary of the same financial holding company. The transfer of certain assets subject to or below the precautionary criteria between the financial holding company and its direct or indirect subsidiary or between the direct and indirect subsidiaries of a financial holding company is prohibited except for (i) the transfer to an asset-backed securitization company, typically a special purpose entity, or the entrustment with a trust company, under the Asset-Backed Securitization Act, (ii) the transfer to a mortgage-backed securitization company under the Mortgage-Backed Securitization Company Act, (iii) the transfer or in-kind contribution to a corporate restructuring vehicle under the Corporate Restructuring Investment Company Act or (iv) the acquisition by a corporate restructuring company under the Industrial Development Act.
Disclosure of Management Performance
For the purpose of protecting the depositors and investors in the direct or indirect subsidiaries of the financial holding companies, the Financial Services Commission requires financial holding companies to disclose certain material matters including (i) financial condition and profit and loss of the financial holding company and its direct and indirect subsidiaries, (ii) how capital was raised by the financial holding company and its direct and indirect subsidiaries and how such capital was used, (iii) any sanctions levied on the financial holding company and its direct and indirect subsidiaries under the Financial Holding Companies Act or any corrective measures or sanctions under the Law on Improvement of Structure of Financial Industry or (iv) occurrence of any non-performing assets or financial incident which may have a material adverse effect.
Restrictions on Shareholdings in Other Companies
Subject to certain exceptions, a bank holding company may not own more than 5% of the total issued and outstanding shares of another company (other than its direct and indirect subsidiaries). If the financial holding company owns shares of another company (other than its direct and indirect subsidiaries) which is not a finance-related company, the financial holding company is required to exercise its voting rights in the same manner and
156
same proportion as the other shareholders of the company exercise their voting rights in favor of or against any resolutions under consideration at the shareholders’ meeting of the company.
Restrictions on Shareholdings by Direct and Indirect Subsidiaries
Generally, a direct subsidiary of a financial holding company is prohibited from controlling any other company; provided that a direct subsidiary of a financial holding company may control (as an indirect subsidiary of the financial holding company): (i) subsidiaries in foreign jurisdiction related to the business of the subsidiary that are engaged in a financial business, (ii) certain financial institutions related to the business of the subsidiary which are engaged in the business that the direct subsidiary may conduct without any licenses or permits, (iii) certain financial institutions whose business is related to the business of the direct subsidiary as prescribed under the Presidential Decree of the Financial Holding Companies Act (for example, the companies which a bank subsidiary may control are limited to credit information companies, credit card companies, trust business companies, securities investment management companies, investment advisory companies, futures business companies, and asset management companies), (iv) certain financial institutions whose business is related to financial business as prescribed by the Ordinance of the Prime Minister, and (v) certain companies which are not financial institutions but whose business is related to the financial business of the financial holding company as prescribed by the Presidential Decree of the Financial Holding Companies Act (e.g. finance-related research company, finance-related information technology company, etc.). Acquisition by the direct subsidiaries of such indirect subsidiaries requires a prior permission from the Financial Services Commission or a report to be submitted to the Financial Services Commission, depending on the types of the indirect subsidiaries and the amount of total assets of the indirect subsidiaries.
An indirect subsidiary of a financial holding company is prohibited from controlling any other company, provided, however, that in the case where a company held control over another company at the time such company initially became an indirect subsidiary of a financial holding company, such indirect subsidiary shall be required to dispose of its interest in such other company within two years after becoming an indirect subsidiary of a financial holding company.
A subsidiary of a financial holding company may invest in a special purpose company as its largest shareholder for purposes of making investments under the Act on Private Investment in Social Infrastructure without being deemed as controlling such special purpose company.
In addition, a private equity fund established in accordance with the Financial Investment Services and Capital Markets Act is not considered to be a subsidiary of a financial holding company even if the financial holding company is the largest investor in the private equity fund unless the financial holding company is the asset management company for the private equity fund.
Restrictions on Transactions Between a Financial Holding Company and its Major Shareholder
A bank holding company and its direct and indirect subsidiaries are prohibited from acquiring (including acquisition by a trust account of its subsidiary bank) shares issued by such bank holding company’s Major Shareholder in excess of 1% of the Net Total Equity Capital. In addition, the financial holding company and its direct and indirect subsidiaries which intend to acquire shares issued by such Major Shareholder not less than the lesser of (i) the amount equivalent to 0.1% of the Net Total Equity Capital or (ii) W5 billion, with respect to a single transaction, must obtain prior unanimous board resolutions and then, immediately after the acquisition, must file a report with the Financial Services Commission and publicly disclose the filing of such report (for example, through a website).
Restrictions on Financial Holding Company Ownership
Under the Financial Holding Companies Act, foreign financial institutions are permitted to establish financial holding companies in Korea. Pursuant to the Presidential Decree of the Financial Holding Companies
157
Act, a foreign financial institution can control a financial holding company if, subject to satisfying certain other conditions, it, together with its specially-related persons, holds 100% of the total shares in the financial holding company.
In addition, any single shareholder and persons who stand in a special relationship with such shareholder (as defined under the Presidential Decree to the Financial Holding Companies Act) may acquire beneficial ownership of up to 10% of the total issued and outstanding shares with voting rights of a financial holding company controlling national banks (or 15% in the case of a financial holding company controlling regional banks only). The Government and the Korea Deposit Insurance Corporation are not subject to such a ceiling.
However, “non-financial business group companies” (as defined below) may not acquire beneficial ownership of shares of a bank holding company in excess of 4% of such financial holding company’s outstanding voting shares, provided that such non-financial business group companies may acquire beneficial ownership of up to 10% of such financial holding company’s outstanding voting shares with the approval of the Financial Services Commission under the condition that such non-financial business group companies will not exercise voting rights in respect of such shares in excess of the 4% limit. In addition, any person (whether a Korean national or a foreigner), with the exception of non-financial business group companies described above, may also acquire in excess of 10% of total voting shares issued and outstanding of a financial holding company which controls national bank, provided that an approval from the Financial Services Commission is obtained in instances where the total holding exceeds 10% (or 15% in the case of a financial holding company controlling regional banks only), 25% or 33% of the total voting shares issued and outstanding of such bank holding company.
“Non-financial business group companies” are defined under the Financial Holding Companies Act as companies, which include:
| |
(i) |
any same shareholder group with aggregate net assets of all non-financial business companies belonging to such group of not less than 25% of the aggregate net assets of all members of such group; |
| |
(ii) |
any same shareholder group with aggregate assets of all non-financial business companies belonging to such group of not less than W2 trillion; |
| |
(iii) |
any mutual fund in which the same shareholder group identified in item (i) or (ii) above holds more than 4% of the total shares issued and outstanding of such mutual fund; |
| |
(iv) |
any private equity fund (x) which has a partner with limited liability that falls under item (i), (ii) or (iii) above and holds equity equivalent to 10% or greater of the total amount invested by the private equity fund, (y) which has a partner with unlimited liability that falls under item (i), (ii) or (iii) above or (z) whose affiliates belonging to an enterprise group subject to limitation on mutual investment hold in aggregate equity equivalent to 30% or greater of the total amount invested by such private equity fund; or |
| |
(v) |
any investment purpose company in which a private equity fund that falls under item (iv) above acquires and holds no less than 4% of such company’s shares or equity or exercises de-facto influence on such company’s significant managerial matters. |
Sharing of Customer Information among Financial Holding Companies and their Subsidiaries
Under the Act on Use and Protection of Credit Information, any individual customer’s credit information may only be disclosed or otherwise used by financial institutions to determine, establish or maintain existing commercial transactions with them and only after obtaining written consent to use information. In addition, under the Act on Real Name Financial Transactions and Confidentiality, an individual working at a financial institution may not provide or reveal information or data concerning the contents of financial transactions to other persons unless such individual receives a request or consent in writing from the holder of a title deed, except under
158
certain exceptions stipulated in the Act. Under the Financial Holding Company Act, a financial holding company and its direct and indirect subsidiaries, however, may share certain credit information of individual customers among themselves for internal management purposes outlined in the Enforcement Decree of the Financial Holding Company Act (such as credit risk management, internal control and customer analysis) without the customers’ written consent, provided they adhere to the methods and procedures for provision of such information set forth therein. A financial investment company subsidiary of a financial holding company with a dealing and/or brokerage license may provide the financial holding company and its other direct and indirect subsidiaries information relating to the aggregate amount of cash or securities that a customer of the financial investment company has deposited for internal management purposes outlined in the Enforcement Decree of the Financial Holding Company Act, provided they adhere to the methods and procedures for provision of such information set forth therein. Certain amendments to the Financial Holding Company Act, which became effective on November 29, 2014, limit the scope of credit information that may be shared without the customers’ prior consent and require certain procedures for provision of customer information as prescribed by the Financial Services Commission. Beginning on November 29, 2014, notice must be given to customers at least once a year regarding (i) the provider of customer information, (ii) the recipient of customer information, (iii) the purpose of providing the information and (iv) the categories of the information provided.
The Act on Corporate Governance of Financial Companies
The Act on Corporate Governance of Financial Companies came into effect as of August 1, 2016. The Act was enacted to address calls for strengthened regulations on corporate governance of financial companies and to serve as a uniform regulation on corporate governance matters applicable to all financial companies in place of the separate regulations for each sector that existed. The Act contains several key measures, including, but not limited, to (i) condition of eligibility of officers of financial companies and standards for determining whether financial companies’ officers may hold concurrent positions in other companies, (ii) standards for composition and operation of board of directors, (iii) standards for establishment, composition and operation of committees of the board of directors, (iv) internal control and risk management, (v) requirements and procedures for the approval of a change of major shareholders and (vi) special regulations for rights of minority shareholders of financial companies.
Financial Investment Services and Capital Markets Act
General
The Financial Investment Services and Capital Markets Act categorizes capital markets-related business into six different functions, as follows:
| |
• |
|
dealing (trading and underwriting of “financial investment products” (as defined below)); |
| |
• |
|
brokerage (brokerage of financial investment products); |
| |
• |
|
collective investment (establishment of collective investment schemes and the management thereof); |
| |
• |
|
discretionary investment management; and |
| |
• |
|
trusts (together with the five businesses set forth above, the “Financial Investment Businesses”). |
Accordingly, all financial businesses relating to financial investment products are reclassified as one or more of the Financial Investment Businesses described above, and financial institutions are subject to the regulations applicable to their relevant Financial Investment Businesses, irrespective of the type of the financial institution it is. For example, under the Financial Investment Services and Capital Markets Act, derivative businesses conducted by securities companies and future companies will be subject to the same regulations under the Financial Investment Services and Capital Markets Act, at least in principle.
159
The banking business and insurance business are not subject to the Financial Investment Services and Capital Markets Act and will continue to be regulated under separate laws; provided, however, that they may become subject to the Financial Investment Services and Capital Markets Act if their activities involve any financial investment businesses requiring a license based on the Financial Investment Services and Capital Markets Act.
Comprehensive Definition of Financial Investment Products
In an effort to encompass the various types of securities and derivative products available in the capital markets, the Financial Investment Services and Capital Markets Act sets forth a comprehensive term “financial investment products,” defined to mean all financial products with a risk of loss in the invested amount (in contrast to “deposits,” which are not financial investment products for which the invested amount is protected or preserved). Financial investment products are classified into two major categories: (i) “securities” (relating to financial investment products where the risk of loss is limited to the invested amount) and (ii) “derivatives” (relating to financial investment products where the risk of loss may exceed the invested amount). As a result of the general and open-ended manner in which financial investment products are defined, any future financial product could potentially fall under the definition of financial investment products, which would enable Financial Investment Companies (as defined below) to handle a broader range of financial products. Under the Financial Investment Services and Capital Markets Act, securities companies, asset management companies, futures companies and other entities engaging in any Financial Investment Business are classified as “Financial Investment Companies.”
License System
Financial Investment Companies are able to choose what Financial Investment Business to engage in (through the “check the box” method set forth in the relevant license application), by specifying the desired (i) Financial Investment Business, (ii) financial investment product and (iii) target customers to which financial investment products may be sold (namely, general investors or professional investors). Licenses will be issued under the specific business sub-categories described above. For example, it would be possible for a Financial Investment Company to obtain a license to engage in the Financial Investment Business of (i) dealing (ii) over-the-counter derivatives products (iii) only with professional investors.
Expanded Business Scope of Financial Investment Companies
Under the previous regulatory regime in Korea, it was difficult for a financial institution to explore a new line of business or expand upon its existing line of business. For example, a financial institution licensed as a securities company generally could not engage in the asset management business. In contrast, under the Financial Investment Services and Capital Markets Act, pursuant to the integration of its current business involving financial investment products into a single Financial Investment Business, a licensed Financial Investment Company is permitted to engage in all types of Financial Investment Businesses, subject to compliance with the relevant regulations, for example, maintaining an adequate “Ethical Screens,” to the extent required. As to incidental businesses (i.e., a financial related business which is not a Financial Investment Business), the Financial Investment Services and Capital Markets Act generally allows a Financial Investment Company to freely engage in such incidental businesses by shifting away from the previous system of permitting only the listed activities towards a more comprehensive system. In addition, a Financial Investment Company is permitted (i) to outsource marketing activities by contracting with “introducing brokers” that are individuals but not employees of the Financial Investment Company, (ii) to engage in foreign exchange business related to their Financial Investment Business and (iii) to participate in the settlement network, pursuant to an agreement among the settlement network participants.
Improvement in Investor Protection Mechanism
While the Financial Investment Services and Capital Markets Act broadens the scope of financial businesses in which financial institutions are permitted to engage, a more rigorous investor-protection mechanism is
160
imposed upon Financial Investment Companies dealing in financial investment products. The Financial Investment Services and Capital Markets Act makes a distinction between general investors and sophisticated investors and provides new or enhanced protections to general investors. For instance, the Financial Investment Services and Capital Markets Act expressly provides for strict know-your-customer rules for general investors and imposes an obligation on Financial Investment Companies that they should market financial investment products suitable to each general investor considering his or her personal attributes, including investment objective, net worth, and investment experience. Under the Financial Investment Services and Capital Markets Act, a Financial Investment Company can be held liable if a general investor proves (i) damages or losses relating to such general investor’s investment in financial investment products solicited by such Financial Investment Company and (ii) absence of explanation, false explanation, or omission of material fact (without having to prove fault or causation). In case there are any conflicts of interest between the Financial Investment Companies and investors, the Financial Investment Services and Capital Markets Act expressly requires (i) disclosure of any conflict of interest to investors and (ii) mitigation of conflicts of interest to a comfortable level or abstention from the relevant transaction.
Other Regulatory Changes Related to Securities and Investments
The Financial Investment Services and Capital Markets Act brought changes to various rules in securities regulations including those relating to public disclosure, insider trading and proxy contests, which had previously been governed by the Securities and Exchange Act. For example, the 5% and 10% reporting obligations under the Securities and Exchange Act have become more stringent under the Financial Investment Services and Capital Markets Act. For instance, the number of events requiring an investor to update its 5% report have increased under the Financial Investment Services and Capital Markets Act. Previously, only a change in the shareholding of 1% or more or in the purpose of shareholding (such as an intention to influence management) could trigger the obligation to update the 5% report. The Government has issued detailed regulations stipulating additional events requiring updates to 5% reports, such as the change in the type of holding and change in any major aspect of the relevant contract. As for the 10% report filing obligation, the initial filing is expected to be required to be made within five business days of the date of the event triggering the 10% reporting obligation, compared to 10 calendar days under the previous law. The due date for reporting a subsequent change after the initial 10% report filing has been reduced from the 10th day of the first month immediately following the month in which such change took place to five business days of the date of such change. Under the previous law, there had been a limitation on the type of investment vehicles that could be used in a collective investment scheme (namely, to trusts and corporations), the type of funds that could be used for collective investments, and the types of assets and investment securities a fund could invest in. However, the Financial Investment Services and Capital Markets Act significantly liberalizes these restrictions, permitting all legal entities, including limited liability companies or partnerships, to be used for the purpose of collective investments, allowing the formation of fund complexes and permitting investment funds to invest in a wide variety of different assets and investment instruments.
Principal Regulations Applicable to Banks
General
The banking system in Korea is governed by the Banking Act and the Bank of Korea Act of 1950, as amended (the “Bank of Korea Act”). In addition, Korean banks are subject to the regulations and supervision of the Bank of Korea, the Bank of Korea’s Monetary Policy Committee, the Financial Services Commission and its executive body, the Financial Supervisory Service.
The Bank of Korea, established in June 1950 under the Bank of Korea Act, performs the customary functions of a central bank. It seeks to contribute to the sound development of the national economy by price stabilization through establishing and implementing efficient monetary and credit policies. The Bank of Korea acts under instructions of the Monetary Policy Committee, the supreme policy-making body of the Bank of Korea.
161
Under the Bank of Korea Act, the Monetary Policy Committee’s primary responsibilities are to formulate monetary and credit policies and to determine the operations, management and administration of the Bank of Korea. The Financial Services Commission, established on April 1, 1998 as the Financial Supervisory Commission and later changed its name to the Financial Services Commission on March 3, 2008, regulates commercial banks pursuant to the Banking Act, including establishing guidelines on capital adequacy of commercial banks, and promulgates regulations relating to supervision of banks. Furthermore, pursuant to the Amendment to the Government Organization Act and the Banking Act on May 24, 1999, the Financial Services Commission, instead of the Ministry of Strategy and Finance, now regulates market entry into the banking business.
The Financial Supervisory Service is subject to the instructions and directives of the Financial Services Commission and carries out supervision and examination of commercial banks. In particular, the Financial Supervisory Service sets requirements both for the prudent control of liquidity and for capital adequacy and establishes reporting requirements pursuant to the authority delegated to it under the Financial Services Commission regulations, pursuant to which banks are required to submit annual reports on financial performance and shareholdings, regular reports on management strategy and non-performing loans, including write-offs, and management of problem companies and plans for the settlement of bad loans.
Under the Banking Act, approval to commence a commercial banking business or a long-term financing business must be obtained from the Financial Services Commission. Commercial banking business is defined as the lending of funds acquired predominantly from the acceptance of deposits for a period not exceeding one year or, subject to the limitation established by the Financial Services Commission, for a period between one year and three years. Long-term financing business is defined as the lending, for periods in excess of one year, of funds acquired predominantly from paid-in capital, reserves or other retained earnings, the acceptance of deposits with maturities of at least one year, or the issuance of bonds or other securities. A bank wishing to enter any business other than commercial banking and long-term financing businesses, such as the trust business, must obtain approval from the Financial Services Commission. Approval to merge with any other banking institution, to liquidate, to close a banking business or to transfer all or a part of a business must also be obtained from the Financial Services Commission.
If the Financial Services Commission deems a bank’s financial condition to be unsound or if a bank fails to meet the applicable capital adequacy ratio set forth under Korean law, the Financial Services Commission may order, among others:
| |
• |
|
capital increases or reductions; |
| |
• |
|
suspension of officers’ performance of their duties and appointment of custodians; |
| |
• |
|
stock cancellations or consolidations; |
| |
• |
|
transfers of a part or all of business; |
| |
• |
|
sale of assets and bar on acquisition of high-risk assets; |
| |
• |
|
closures or downsizing of branch offices or workforce; |
| |
• |
|
mergers or becoming a subsidiary under the Financial Holding Companies Act of a financial holding company; |
| |
• |
|
acquisition of a bank by a third party; |
| |
• |
|
suspensions of a part or all of business operation (not more than six months in the case of suspension of all business operations); or |
| |
• |
|
assignments of contractual rights and obligations relating to financial transactions. |
162
Capital Adequacy
The Banking Act requires nationwide banks to maintain a minimum paid-in capital of W100 billion and regional banks to maintain a minimum paid-in capital of W25 billion.
In addition to minimum capital requirements, all banks including foreign bank branches in Korea are required to maintain a prescribed solvency position. A bank must also set aside as its legal reserve an amount equal to at least 10% of its net profits after tax each time it pays dividends on net profits earned until such time when the reserve equals the amount of its total paid-in capital.
Under the Banking Act, the capital of a bank is divided into two categories: Tier I and Tier II capital. Tier I capital (typically referred to as “Core Capital”) consists of (i) the capital that can absorb losses incurred by a bank such as capital, capital surplus and earned surplus generated from the issuance of common shares (collectively, “Common Stock Capital”), and (ii) the capital that can absorb the losses of a bank after depletion of the Common Stock Capital such as capital and capital surplus generated from the issuance of Tier I capital instruments satisfying the requirements designated by the Financial Supervisory Service (collectively, “Other Core Capital”). Tier II capital (typically referred to as “Supplementary Capital”) represents the capital which is equivalent to, but not included in, the Core Capital and can absorb losses incurred upon the liquidation of a bank such as capital and capital surplus generated from the issuance of Tier II capital instruments satisfying the requirements designated by the Financial Supervisory Service and allowance for bad debts set aside for loans classified as “normal” or “precautionary.”
Under the Detailed Regulations on the Supervision of the Banking Business, Tier I capital instruments must satisfy, among others, the following requirements in order to be recognized as Other Core Capital:
| |
(i) |
the price for such instruments shall have been fully paid through the procedure for issuance, and the instruments shall be in a perpetual form with no cause triggering a step-up or redemption; |
| |
(ii) |
such instruments shall be bound by a special agreement on being subordinate to depositors, general creditors and subordinated debt of the bank (referring to a special agreement under which subordinated creditors’ right to claim payment shall take effect only after unsubordinated creditors’ claims are fully paid, when bankruptcy or any similar incident occurs; hereinafter the same shall apply) but shall not fall within liabilities exceeding assets at the time when bankruptcy is declared under the Debtor Rehabilitation and Bankruptcy Act; |
| |
(iii) |
the payment of dividends or interests shall be suspended from the date when the bank is designated as a “insolvent financial institution” under the Act on Structural Improvement of the Financial Industry of Korea or under the Depositor Protection act of Korea as applicable, or the Financial Supervisory Service takes measures under the Regulations on the Supervision of the Banking Business such as the managerial improvement recommendation, the managerial improvement request, the managerial improvement order and the emergency measures against the bank to the date when the above-mentioned event is removed; |
| |
(iv) |
the payment of dividends or interests shall not be determined in connection with the credit rating of the bank; |
| |
(v) |
the dividends may only be paid out of distributable income; |
| |
(vi) |
the bank shall be able to revoke in its sole discretion the payment of dividends or interests at any time; |
| |
(vii) |
the cancellation of paying dividends must not impose restrictions on the bank except in relation to dividends to common stockholders; |
| |
(viii) |
the revocation of the payment of dividends or interests shall not be deemed as the event of defaults, and the bank shall be able to use in its sole discretion the amount which was revoked to pay as dividends or interests to redeem any other debts of the bank then due and payable; |
163
| |
(ix) |
such instruments shall not be redeemed within five years from the issuance date and the bank shall be able to determine in its sole discretion whether it redeems such instruments even after five years from the issuance date, and the instruments shall not be subject to any condition that arouse investors’ expectation to have the instruments redeemed or any condition that imposes a burden of redemption upon the issuing bank in fact; |
| |
(x) |
the requirements prescribed in Appendix 3-5 (Trigger Events for Contingent Capital Securities) of the Detailed Enforcement Rules of Regulation on Supervision of Banking Business shall be satisfied; |
| |
(xi) |
the bank or the person who has de facto control over the bank shall not purchase capital instruments or provide a purchaser of such securities with funds for the purchase by providing a collateral or guarantee for payment or by lending a loan, shall not raise the priority of its claims, legally or economically, for the price paid for the securities, and shall not provide a collateral or guarantee to the purchasers of the securities directly or via a related company; and |
| |
(xii) |
such capital instruments shall have no condition that hinders the issuing bank’s procurement or expansion of capital in the future. |
Under the Detailed Regulations on the Supervision of the Banking Business, Tier II capital instruments must satisfy, among others, the following requirements in order to be recognized as Supplementary Capital:
| |
(i) |
the procedure for issuance shall have been completed, the price for such capital instruments shall have been fully paid, and the capital instruments shall be bound by a special agreement of subordination to deposits and ordinary debts; |
| |
(ii) |
the maturity shall not be less than five years from the issuance date, and Tier II capital instruments shall not be redeemed within five years from the issuance date; |
| |
(iii) |
there is no condition to promote the bank to redeem such capital instruments such as a step-up provision, and the bank shall be able to determine in its sole discretion whether to redeem such instruments prior to the maturity date, and the instruments shall not be subject to any condition that arouse investors’ expectation to have the instruments redeemed or any condition that imposes a burden of redemption upon the issuing bank in fact; |
| |
(iv) |
other than the case where the bank is subject to the bankruptcy or liquidation, the holder of Tier II capital instruments shall not have the right to require bank to pay the principal or interests of such instruments earlier than the original due date thereof; |
| |
(v) |
the payment of dividends or interests shall not be determined in connection with the credit rating of the bank; |
| |
(vi) |
the requirements prescribed in Appendix 3-5 (Trigger Events for Contingent Capital Securities) of the Detailed Enforcement Rules of Regulation on Supervision of Banking Business shall be satisfied; |
| |
(vii) |
the bank or any person or entity over which the bank exercises substantial control shall not purchase the capital instruments issued by such bank nor provide, directly or indirectly, the funds to acquire the capital instruments by providing any collateral or guaranty or loan in favor of the person or entity which tries to acquire such instruments; and |
| |
(viii) |
the bank shall not enhance, legally or economically, the payment priority of the capital instruments, nor provide, directly or indirectly through its affiliated company, any collateral or guaranty in favor of the person or entity which acquires such instruments. |
All banks must meet standards regarding minimum ratios of Tier I and Tier II capital (less any capital deductions) to risk-weighted assets, determined in accordance with the Financial Services Commission requirements that have been formulated based on the BIS Standards. These standards were adopted and became effective in 1996. Under these regulations, all domestic banks and foreign bank branches are required to meet the minimum ratio of Tier I and Tier II capital (less any capital deductions) to risk-weighted assets of 8%.
164
Furthermore, as Basel III was adopted and is being implemented in stages in Korea since December 1, 2013, all banks in Korea are required to meet minimum ratios of common stock capital (less any capital deductions) and core capital (less any capital deductions) to risk-weighted assets as set out in the Regulation on the Supervision of the Banking Business. The required minimum ratio of common stock capital (less any capital deductions) to risk-weighted assets is 4.5%, and the required minimum ratio of core capital (less any capital deductions) to risk-weighted assets is 6.0%. In addition, additional capital conservation buffer requirements have been implemented in stages from January 1, 2016 to January 1, 2019. Under such requirements, all banks in Korea are required to maintain a capital conservation buffer of 0.625% from January 1, 2016, which was gradually increased to 1.25% on January 1, 2017, 1.875% on January 1, 2018 and 2.5% on January 1, 2019.
Under the Regulation on the Supervision of the Banking Business and the Detailed Regulations promulgated thereunder, Korean banks apply the following risk-weight ratios in respect of their home mortgage loans:
| |
(i) |
for those banks adopting a standardized approach for calculating credit risk-weighted assets, the risk-weight ratio of 35% (only in the case where the loan is fully secured by a first ranking mortgage) but, with respect to high risk home mortgage loans (even if such loans are fully secured by a first ranking mortgage) the risk-weight ratio of 50% and 70% for second-level high risk home mortgage loans; and |
| |
(ii) |
for those banks adopting an internal ratings-based approach for calculating credit risk-weighted assets, a risk-weight ratio calculated with reference to the probability of default, loss given default and exposure at default, each as defined in the Detailed Regulations on the Supervision of the Banking Business. |
In Korea, Basel II, a convention entered into by the Basel committee in June 2004 for the purpose of improving risk management and increasing capital adequacy of banks, was implemented in January 2008. Pursuant to Basel II, operational risk, such as inadequate procedure, loss risk by employees, internal system, occurrence of unexpected event, as well as credit risk and market risk, is taken into account in calculating the risk-weighted assets, in addition to maintaining the capital adequacy ratio of 8% for banks. Under Basel II, the capital requirements for credit risk can be calculated by the internal rating based (IRB) approach or the standardized approach.
Under the standardized approach, a home mortgage loan fully secured by a first ranking mortgage over the residential property is risk-weighted at 35%, but certain home mortgage loans with loan-to-value ratio exceeding 60% are risk weighted at 50% pursuant to an amendment of the Detailed Regulation on the Supervision of the Banking Business on December 31, 2018.
Under the Regulation on the Supervision of the Banking Business, banks shall set aside allowances for bad debts for each class of soundness in accordance with IFRS as adopted by Korea. If the amount for each class of soundness calculated in accordance with the following criteria exceeds the allowances for bad debts set aside, the excess amount shall, at the time of each settlement of accounts, be set aside as regulatory reserve for credit losses.
| |
• |
|
0.85% of normal credits (or 0.9% in the case of normal credits comprising loans to certain industries including construction, retail and wholesale sales, accommodations, restaurant, real estate and lease, 1.0% in the case of normal credits comprising loans to individuals and households, 2.5% in the case of normal credits comprising credit card loans and 1.1% in the case of normal credits comprising other credit card receivables); |
| |
• |
|
7% of precautionary credits (or 10% in the case of precautionary credits comprising loans to individuals and households, 50% in the case of precautionary credits comprising credit card loans and 40% in the case of precautionary credits comprising other credit card receivables); |
| |
• |
|
20% of substandard credits (or 10% in the case of substandard credits comprising assets for which the bank has the right to receive payment in priority pursuant to the Corporate Restructuring Promotion |
165
| |
Act of Korea or Paragraph 180, Subparagraph 2 of the Debtor Rehabilitation and Bankruptcy Act of Korea (the “Priority Assets”), 20% in the case of normal credits comprising loans to individuals and households, 65% in the case of substandard credits comprising credit card loans and 60% in the case of substandard credits comprising other credit card receivables); |
| |
• |
|
50% of doubtful credits (or 25% in the case of doubtful credits comprising Priority Assets, 55% in the case of doubtful credits comprising loans to individuals and households and 75% in the case of doubtful credits comprising credit card loans and other credit card receivables); and |
| |
• |
|
100% of estimated loss credits (or 50% in the case of estimated loss credits comprising of Priority Assets). |
Furthermore, under the Regulation on the Supervision of the Banking Business, banks must maintain allowances for bad debts and regulatory reserve for credit losses in respect of their confirmed guarantees (including confirmed acceptances) and outstanding non-used credit lines in an aggregate amount calculated at the same rates applicable to normal, precautionary, substandard, doubtful and estimated loss credits comprising their outstanding loans and other credits as set forth above.
As of January 1, 2016, the Financial Services Commission implemented Basel III requirements relating to accumulation of additional capital for systemically important banks and bank holding companies and countercyclical capital buffer requirements. Each year, the Financial Services Commission may designate banks with significant influence (based on size and connectivity with other financial institutions) on the domestic financial system as a domestic systemically important bank and require the accumulation of additional capital in accordance with the highest of: (i) ratio of common equity capital to risk-weighted assets, ranging from 0.0% to 2.0%, depending on the systematic importance evaluation score, (ii) if the bank’s holding company is a domestic systemically important bank holding company, the capital ratio corresponding to the additional capital required for the bank holding company under the Financial Holding Company Supervision Regulations, or (iii) if the bank is also a global systemically important bank, as defined by the Basel Committee, the capital ratio as required by the Basel Committee. Shinhan Financial Group and Shinhan Bank were selected as a domestic systemically important bank holding company and domestic systemically important bank, respectively, from 2016 through 2022. According to the instructions of the Financial Services Commission, domestic systemically important banks, including Shinhan Bank, have been required to maintain an additional capital buffer of 0.25% since January 1, 2016, with such buffer increased by 0.25% annually to reach 1.00% as of January 1, 2019. The Financial Services Commission may also, upon quarterly review, determine and require banks to accumulate a required level of countercyclical capital buffer within the range of 0% to 2.5% of risk-weighted assets, taking into account factors such as the degree of increase in credit relative to the gross domestic product. Since March 2016, the Financial Services Commission has maintained countercyclical capital buffer requirements at 0%. The Detailed Regulation on the Supervision of the Banking Business was also amended on June 30, 2018 to add “concentration of risk in the retail sector” as an additional criterion when the Financial Supervisory Service evaluates the risk management systems of Korean banks.
Liquidity
All banks are required to match the maturities of their assets and liabilities in accordance with the Banking Act in order to ensure adequate liquidity. Banks may not invest in excess of an amount exceeding 100% of their Tier I and Tier II capital (less any capital deductions) in stocks and other securities with a period remaining to maturity of over three years. However, this restriction does not apply to government bonds or to Monetary Stabilization Bonds issued by the Bank of Korea.
The Financial Services Commission requires Korean banks to maintain a liquidity coverage ratio of at least 90.0% as of January 1, 2017, 95.0% as of January 1, 2018 and 100.0% as of January 1, 2019. The Financial Services Commission defines liquidity coverage ratio as high quality liquid assets that can be immediately converted into cash with little or no loss in value, as divided by the net amount of cash outflow for the next 30 day
166
period, under the stress level established according to the liquidity coverage ratio, pursuant to the Regulation on the Supervision of the Banking Business, which was amended as of June 28, 2016 to implement the liquidity coverage ratio requirements under Basel III.
With respect to foreign currency liquidity coverage ratio, the Regulation on the Supervision of the Banking Business requires that financial institutions dealing with foreign exchange affairs (i.e., banks) whose foreign-currency denominated liabilities are equal to or greater than US$500 million or 5% of its total liabilities, as of the end of the immediately preceding half-year period, maintain a foreign currency liquidity coverage ratio of 60% or higher beginning January 1, 2017, 70% or higher beginning January 1, 2018 and 80% or higher beginning January 1, 2019. The term “foreign currency liquidity coverage ratio” means the ratio of high-liquidity assets to the net cash outflow in respect of foreign-currency denominated assets and liabilities for the next 30 days.
In April 2020, in response to the COVID-19 pandemic, the Financial Services Commission temporarily lowered the liquidity coverage ratio requirement from 100% to 85%. The Financial Services Commission subsequently decided to gradually restore this ratio on a quarterly basis from the third quarter of 2022, to a ratio of 90% in the third quarter of 2022, 92.5% in the fourth quarter of 2022, 95% in the first quarter of 2023, 97.5% in the second quarter of 2023 and 100% from the third quarter of 2023. However, in October 2022, the Financial Services Commission decided to apply the 92.5% ratio until the end of June 2023 in response to the increasing volatility and uncertainty in the short-term money market, as determined through a financial market inspection meeting.
The Monetary Policy Committee of the Bank of Korea is authorized to fix and alter minimum reserve requirements that banks must maintain against their deposit liabilities. The current minimum reserve ratio is 7.0% of average balances for Won-denominated demand deposits outstanding, 0.0% of average balances for Won-denominated employee asset establishment savings deposits, employee long-term savings deposits, employee house purchase savings deposits, long-term house purchase savings deposits, household long-term savings deposits and employee preferential savings deposits outstanding (with respect to employee-related deposits and household long-term savings deposits, only if such deposits were made prior to February 28, 2013) and 2.0% of average balances for Won-denominated time and savings deposits, mutual installments, housing installments and certificates of deposit outstanding. For foreign currency deposit liabilities, a 2.0% minimum reserve ratio is applied to time deposits with a maturity of one month or longer, certificates of deposit with a maturity of 30 days or longer, and savings deposits with a maturity of six months or longer and a 7.0% minimum reserve ratio is applied to other deposits, while a 1.0% minimum reserve ratio is applied for offshore accounts, immigrant accounts and resident accounts opened by financial institutions (excluding bank holding companies) and The Export-Import Bank of Korea as well as foreign currency certificates of deposit held by account holders of such offshore accounts, immigrant accounts and resident accounts opened by financial institutions (excluding bank holding companies) and The Export-Import Bank of Korea.
Loan-to-Deposit Ratio
In December 2009, the Financial Supervisory Service announced that it would introduce a new set of regulations on the loan-to-deposit ratio by amending the Regulation on the Supervision of the Banking Business upon its determination that the overall liquidity of banks in Korea had become unstable due to the ongoing increase in the loan-to-deposit ratio resulting from banks expanding their asset size too competitively by granting mortgages on houses and loans to small- and medium-sized enterprises over the last couple of years. The Regulation on the Supervision of the Banking Business, which was amended as of August 19, 2010 and December 26, 2014 and took effect on January 1, 2014 and January 1, 2015, respectively, requires banks with Won-denominated loans of not less than W2 trillion in value as of the last month of the immediately preceding quarter to maintain a ratio of Won-denominated loans (excluding certain types of loans using funds borrowed from Korea Development Bank or the Government or loans made under certain operational rules of Korea Federation of Banks) to Won-denominated deposits (excluding certificates of deposit) and the balance of the covered bonds under the Act on Issuance of Covered Bonds, the maturity of which is not less than five years
167
(only in case when such financing from the issuance of covered bonds is used in Won currency and up to 1% of Won-denominated deposits) of no more than 100%. Since January 1, 2020, in calculating such loan to deposit ratio, retail loans and corporate loans are weighed differently, with retail loans subject to a multiple of 115% and corporate loans (excluding loans to SOHOs) subject to a multiple of 85%, thereby increasing the impact of retail loans and reducing the impact of corporate loans in calculating such ratio. In response to the COVID-19 pandemic, on April 20, 2020, the Financial Services Commission announced a series of measures to temporarily ease the regulations on loan-to-deposit ratio. In particular, the loan-to-deposit ratio maximum of 100% was temporarily increased to 105% and weighing of corporate loans to SOHOs extended since January 1, 2020 to December 2021 also became subject to a multiple of 85% provided such loans are not real estate related. On March 30, 2022, the Financial Services Commission announced plans to cease the temporary easement of regulations relating to the loan-to-deposit ratio as of June 30, 2022 and to gradually normalize the loan-to-deposit ratio back down to 100% beginning July 1, 2022. On October 27, 2022, the Financial Services Commission further announced measures to temporarily ease the loan-to-deposit ratio requirement from 100% to 105% in consideration of the increasing demand for corporate loans due to the contraction of the corporate bond market. This temporary increase will apply through April 2023, subject to further extension depending on the market conditions at the time of expiration of such measures. Shinhan Bank’s loan-to-deposit ratio as of December 31, 2022 was 94.59%, based on monthly average balances.
Financial Exposure to Any Single Customer and Major Shareholders
Under the Banking Act, the sum of material credit exposures by a bank, namely, the total sum of its credits to single individuals, legal entities or persons sharing credit risk with such individuals or legal entities such as companies belonging to the same enterprise groups as defined under the Monopoly Regulation and Fair Trade Act that exceed 10% of the sum of Tier I and Tier II capital (less any capital deductions), must not exceed five times the sum of Tier I and Tier II capital (less any capital deductions), subject to certain exceptions. Subject to certain exceptions, no bank is permitted to extend credit (including loans, guarantees, purchases of securities (only in the nature of a credit) and such other transactions which directly or indirectly create credit risk) in excess of 20% of the sum of Tier I and Tier II capital (less any capital deductions) to an individual or a legal entity, and no bank may grant credit in excess of 25% of the sum of Tier I and Tier II capital (less any capital deductions) to individuals, legal entities and companies that belong to the same enterprise group as defined in the Monopoly Regulation and Fair Trade Act.
Under the Banking Act, certain restrictions apply to extending credits to a major shareholder. The definition of a “major shareholder” is as follows:
| |
• |
|
a shareholder holding (together with persons who have a special relationship with such shareholder as defined in the Presidential Decree of the Banking Act) in excess of 10% (or in the case of regional banks, 15%) in the aggregate of the bank’s total issued and outstanding voting shares; or |
| |
• |
|
a shareholder holding (together with persons who have a special relationship with such shareholder as defined in the Presidential Decree of the Banking Act) more than 4% in the aggregate of the total issued and outstanding voting shares of a bank (other than a regional bank), where such shareholder is the largest shareholder or is able to actually control the major business affairs of the bank, for example, through appointment and dismissal of the chief executive officer or of the majority of the executives. |
Under the Banking Act, banks are prohibited from extending credits in the amount greater than the lesser of (1) 25% of the sum of such bank’s Tier I and Tier II capital (less any capital deductions) and (2) the relevant major shareholder’s shareholding ratio multiplied by the sum of the bank’s Tier I and Tier II capital (less any capital deductions) to a major shareholder (together with persons who have special relationship with such major shareholder as defined in the Presidential Decree of the Banking Act). Also, no bank is allowed to grant credit to its major shareholders in the aggregate in excess of 25% of its Tier I and Tier II capital (less any capital deductions).
168
When managing the credit risk of banks, among the methods for providing credit support by banks, a loan agreement, a purchase agreement for asset-backed commercial papers, purchase of subordinate beneficiary certificates, and assumption of liability by providing warranty against default under asset-backed securitization are examples of creating financial exposure to banks.
Interest Rates
Korean banks remain dependent on the acceptance of deposits as their primary source of funds. Currently, there are no legal controls on interest rates on bank loans in Korea, except for the cap of 20.0% per annum on interest rates on loans to individuals or small corporations, as defined under the Framework Act on Small and Medium Enterprises under the Act on Registration of Credit Business, Etc. and Protection of Finance Users.
Lending to Small- and Medium-sized Enterprises
When commercial banks (including Shinhan Bank) make Won-denominated loans to certain startup, venture, innovative and other strategic small- and medium-sized enterprises specially designated by the Bank of Korea as “priority borrowers,” the Bank of Korea generally provides the underlying funding to these banks at concessionary rates for up to 50% of all such loans made to the priority borrowers subject to a monthly-adjusted limit prescribed by the Bank of Korea provided that if such loans to priority borrowers made by all commercial banks exceed the prescribed limit for a given month, the concessionary funding for the following month will be allocated to each commercial bank in proportion to such bank’s lending to priority borrowers two months prior to the time of such allocation, which has the effect that, if a particular bank lags other banks in making loans to priority borrowers, the amount of funding such bank can receive from the Bank of Korea at concessionary rates will be proportionately reduced.
Disclosure of Management Performance
For the purpose of enforcing mandatory disclosure of management performance so that the general public, especially depositors and stockholders, will be in a better position to monitor banks, the Financial Services Commission requires commercial banks to disclose certain matters as follows:
| |
• |
|
loans bearing no profit made to a single business group in an amount exceeding 10% of the sum of the bank’s Tier I and Tier II capital (less any capital deductions) as of the end of the previous month (where the loan exposure to such borrower is calculated pursuant to the criteria under the Detailed Regulations promulgated under the Regulation on the Supervision of the Banking Business), except where the loan exposure to a single business group is not more than W4 billion; and |
| |
• |
|
any loss due to court judgments or similar decisions in civil proceedings in an amount exceeding 1% of the sum of the bank’s Tier I and Tier II capital (less any capital deductions) as of the end of the previous month, except where the loss is not more than W1 billion. |
Restrictions on Lending
According to the Banking Act, commercial banks are prohibited from making any of the following categories of loans:
| |
• |
|
loans made directly or indirectly on the pledge of a bank’s own shares; |
| |
• |
|
loans made directly or indirectly to enable a natural or a legal person to buy the bank’s own shares; |
| |
• |
|
loans made to any of the bank’s officers or employees other than de minimis loans of up to (1) W20 million in the case of a general loan, (2) W50 million in the case of a general loan plus a housing loan, or (3) W60 million in the aggregate for general loans, housing loans and loans to pay damages arising from wrongful acts of employees in financial transactions; |
169
| |
• |
|
credit (including loans) secured by a pledge of shares of a subsidiary corporation of the bank or to enable a natural or juridical person to buy shares of a subsidiary corporation of the bank; and |
| |
• |
|
loans to any officers or employees of a subsidiary corporation of the bank, other than general loans of up to W20 million or general and housing loans of up to W50 million in the aggregate. |
Recent Regulations Relating to Retail Household Loans
The Financial Services Commission has implemented a number of changes in recent years to the regulations relating to retail household lending by banks. Under the currently applicable regulations:
| |
• |
|
as to any new loans secured by houses (including apartments) located nationwide, the loan-to-value ratio (the aggregate principal amount of loans secured by such collateral over the appraised value of the collateral) shall not exceed 70%; |
| |
• |
|
as to any new loans secured by houses (including apartments) located in “speculative areas”, “overheated speculative areas” or “adjustment targeted areas”, in each case, as designated by the Government, the loan-to-value ratio should not exceed 50%, except that such maximum loan-to-value ratio is (x) 70% for low-income households that (i) have a combined (in case of married couple) annual income of no more than W90 million , (ii) do not currently own any housing and (iii) are using the loan to purchase low-price housing valued at W900 million or less (W800 million or less in the case of houses located in “adjustment targeted areas”) and (y) 80% for first-time homebuyers with a maximum residential mortgage loan amount of W600 million or less; |
| |
• |
|
as to any new loans secured by houses (including apartments) located nationwide to be extended to a household that already owns one or more houses, the maximum loan-to-value ratio must be adjusted to 10% lower than the applicable loan-to-value ratio described above; |
| |
• |
|
as to any new loans secured by houses (including apartments) located in “speculative areas”, “overheated speculative areas” or “adjustment targeted areas”, in each case as designated by the Government, to be extended to a household that already owns one or more houses, the loan to value ratio should not exceed 30% subject to certain exceptions under the applicable regulations; |
| |
• |
|
as to any new loans secured by houses (including apartments) located in “speculative areas”, “overheated speculative areas” or “adjustment targeted areas”, in each case, as designated by the Government, the borrower’s debt-to-income ratio (calculated as (1) the aggregate annual total payment amount of (x) the principal of and interest on loans secured by such housing and existing mortgage and home equity loans and (y) the interest on other debts of the borrower over (2) the borrower’s annual income) should not exceed 40% (50% for those that are located in “adjustment targeted areas”), except that such maximum debt-to-income ratio is 60% for (a) low-income households that (i) have a combined (in case of married couple) annual income of less than W90 million, (ii) do not currently own any housing and (iii) are using the loan to purchase low-price housing valued at W900 million or less (W800 million or less in case of houses located in “adjustment targeted areas”) and (b) first-time homebuyers; |
| |
• |
|
as to any new loans secured by apartments to be extended to a household that already owns one or more houses but wishes to purchase additional houses located in an unregulated Seoul metropolitan area, the maximum debt-to-income ratio must be adjusted to 10% lower than the applicable debt-to-income ratio described above; and |
| |
• |
|
as to any new loans extended to a household that already has an aggregate loan amount exceeding W100 million (including the loan application amount and the revolving amount in case of a revolving loan), such household’s debt-service-ratio (calculated as (1) the aggregate annual total payment amount of the principal of and interest on financial liabilities divided by (2) the household’s annual income) should not exceed 40% unless otherwise specified by the applicable regulations. |
170
Restrictions on Investments in Property
A bank may possess real estate property only to the extent necessary for conducting its business; provided that the aggregate value of such real estate property must not exceed 60% of the sum of its Tier I and Tier II capital (less any capital deductions). Any property acquired by a bank (1) through the exercise of its rights as a secured party or (2) the acquisition of which is prohibited by the Banking Act must be disposed of within three years, unless otherwise provided by the regulations thereunder.
Restrictions on Shareholdings in Other Companies
Under the Banking Act, a bank may not own more than 15% of shares outstanding with voting rights of another company, except where, among other reasons:
| |
• |
|
the company issuing such shares is engaged in a business that falls under the category of financial businesses set forth by the Financial Services Commission (including companies which business purpose is to own equity interests in private equity funds); or |
| |
• |
|
the acquisition of shares by the bank is necessary for corporate restructuring of such company and is approved by the Financial Services Commission. |
In the above cases, a bank must satisfy either of the following requirements:
| |
• |
|
the total investment in companies in which the bank owns more than 15% of the outstanding shares with voting rights does not exceed 20% of the sum of Tier I and Tier II capital (less any capital deductions); or |
| |
• |
|
the total investment in companies in which the bank owns more than 15% of the outstanding shares with voting rights does not exceed 30% of the sum of Tier I and Tier II capital (less any capital deductions) where the acquisition satisfies the requirements determined by the Financial Services Commission. |
The Banking Act provides that a bank using its bank accounts and its trust accounts is not permitted to acquire the shares issued by the Major Shareholder of such bank in excess of an amount equal to 1% of the sum of Tier I and Tier II capital (less any capital deductions).
Restrictions on Bank Ownership
Under the Banking Act, subject to certain exceptions, a single shareholder and persons who stand in a special relationship with such shareholder (as described in the Presidential Decree to the Banking Act) may acquire beneficial ownership of up to 10% of a national bank’s total issued and outstanding shares with voting rights and up to 15% of a regional bank’s total issued and outstanding shares with voting rights. The government, the Korea Deposit Insurance Corporation and financial holding companies qualifying under the Financial Holding Companies Act are not subject to such ceilings. However, non-financial business group companies — namely, (1) any same shareholder group with an aggregate net assets of all non-financial companies belonging to such group of not less than 25% of the aggregate net assets of all corporations that are members of such group; (2) any group with aggregate assets of all non-financial companies belonging to such group of not less than W2 trillion; (3) any mutual fund in which the same shareholder group, as described in items (1) and (2) above, owns more than 4% of the total shares issued and outstanding; (4) a private equity fund (under the Financial Investment Services and Capital Markets Act) where (i) the general partner of such private equity fund, (ii) the limited partner whose equity holding ratio in such private equity fund is 10% or more, or (iii) the limited partners, being member companies of a single group of companies that belong to the same conglomerate as defined in the Monopoly Regulation and Fair Trade Act, whose aggregate equity holding ratio in such private equity fund is 30% or more falls under either of item (1) to (3) above; or (5) a special purpose company of a private equity fund where a private equity fund, as described in item (4) above, owns 4% or more of the special
171
purpose company’s issued and outstanding shares or has actual control over the major business affairs of the special purpose company through, for example, appointment and dismissal of the officers – may not acquire beneficial ownership of shares of a national bank in excess of 4% of such bank’s outstanding voting shares, provided that such non-financial business group companies may acquire beneficial ownership of:
| |
• |
|
up to 10% of a national bank’s outstanding voting shares with the approval of the Financial Services Commission under the condition that such non-financial group companies will not exercise voting rights in respect of such shares in excess of the 4% limit; and |
| |
• |
|
in the event that a foreigner, as defined in the Foreign Investment Promotion Act, owns not less than 10% of a national bank’s outstanding voting shares, up to 10% of such bank’s outstanding voting shares without the approval of the Financial Services Commission, and in excess of 10%, 25% or 33% of such bank’s outstanding voting shares, with the approval of the Financial Services Commission, up to the number of shares owned by such foreigner. |
In addition, any person (whether a Korean national or a foreigner), with the exception of non-financial business group companies described above, may also acquire in excess of 10% of a national bank’s total voting shares issued and outstanding, provided that an approval from the Financial Services Commission is obtained in instances where the total holding exceeds 10% (or 15% in the case of regional banks), 25% or 33% of the bank’s total voting shares issued and outstanding.
Deposit Insurance System
The Depositor Protection Act provides, through a deposit insurance system, insurance for certain deposits of banks in Korea. Under the Depositor Protection Act, all banks governed by the Banking Act, including Shinhan Bank and Jeju Bank, are required to pay to the Korea Deposit Insurance Corporation an insurance premium on a quarterly basis at such rate as determined by the Presidential Decree to the Depositor Protection Act, which shall not exceed 0.5% of the bank’s insurable deposits in any given year. The current insurance premium is 0.02% of insurable deposits for each quarter. If the Korea Deposit Insurance Corporation pays the insured amount, it will acquire the claims of the depositors within the payment amount. Under current rules, the Korea Deposit Insurance Corporation insures only up to a total of W50 million per an individual for deposits and interest in a single financial institution, regardless of when the deposits were made and the size of the deposits.
The Financial Consumer Protection Act
The Financial Consumer Protection Act (the “FCPA”) was enacted on March 24, 2020 and took effect beginning March 25, 2021. The FCPA unifies the systems for the protection of consumers of financial products, which had been dispersed in various laws, while tightening the existing consumer protection systems to strengthen the rights afforded to consumers of financial products. Banks under the Banking Act are financial instrument distributors subject to the FCPA, and deposit and loan products under the Banking Act are financial instruments subject to the FCPA.
Under the FCPA, a financial instrument distributor who intends to sell financial instruments shall comply with the following requirements: (i) confirmation of suitability and adequacy of financial instruments, (ii) compliance with the duty to explain, (iii) prohibition of unfair sales activities, (iv) prohibition of undue solicitation, and (v) prohibition of false or exaggerated advertising, etc. (collectively, the “Sales Principles”). If a financial instrument distributor breaches any of the Sales Principles, consumers may request the termination of such financial instrument within a period to be prescribed by a Presidential Decree and are entitled to unilaterally terminate the contract if the financial instrument distributor fails to present a justifiable reason for not accepting the consumer’s request. Consumers who purchased a loan product, in particular, shall be entitled to withdraw from the contract within 14 days from the later of (i) the date of receipt of the proceeds pursuant to the contract and (ii) the execution date of the contract (or the date of receipt of the documents necessary for execution of the contract (if required under the FCPA), regardless of whether the financial instrument distributor breached any of
172
the Sales Principles. When a consumer files a lawsuit for damages against a financial instrument distributor for breach of the duty to explain, the financial instrument distributor (and not the consumer) shall bear the burden of proof to prove that no willful conduct or negligence was involved in the breach of such duty to explain. In the event of a dispute with a financial instrument distributor, consumers may apply for mediation to the Dispute Mediation Committee of the Financial Services Commission. If a financial instrument distributor files a lawsuit with a court while such mediation is in progress, the court may suspend the litigation proceedings. For certain small-sum cases, a financial instrument distributor may not file a lawsuit with a court until the completion of such mediation. Financial instrument distributors must accept requests from its consumers to access information for purposes of litigation or mediation. In the event the Financial Services Commission determines that there is a clear risk that a financial product may cause significant damage to the properties of customers, the Financial Services Commission may prohibit or restrict the solicitation of, and execution of a contract for, such financial product.
Trust Business
A bank that intends to enter into the trust business must obtain the approval of the Financial Services Commission. Trust activities of banks are governed by the Financial Investment Services and Capital Markets Act. Banks engaged in the banking business and trust business are subject to certain legal and accounting procedures requirements, including the following:
| |
• |
|
under the Banking Act, the Financial Investment Services and Capital Markets Act and the Trust Act, assets accepted in trust by a bank in Korea must be segregated from its other assets in the accounts of such bank; accordingly, banks engaged in the banking and trust businesses must maintain two separate accounts, the “banking accounts” and the “trust accounts,” and two separate sets of records which provide details of their banking and trust businesses, respectively; and |
| |
• |
|
assets comprising the trust accounts are not available to depositors or other general creditors of such bank in the event the trustee is liquidated or is wound up. |
In the event that a bank qualifies and operates as a collective investment business entity, a trustee, a custodian or a general office administrator under the Financial Investment Services and Capital Markets Act, it is required to establish relevant operation and management systems to prevent potential conflicts of interest among the banking business, the collective investment business, the trustee or custodian business and general office administration. These measures include:
| |
• |
|
prohibitions against officers, directors and employees of one particular business operation from serving as an officer, director and employee in another business operation, except where an officer or a director (1) serving in two or more business operations with no significant conflict of interest in accordance with the Presidential Decree on the Financial Investment Services and Capital Markets Act or (2) serving in a trustee business or a custodian business and simultaneously serving in a general office administrator business in accordance with the Financial Investment Services and Capital Markets Act; |
| |
• |
|
prohibitions against the joint use or sharing of computer equipment or office equipment; and |
| |
• |
|
prohibitions against the sharing of information by and among officers, directors and employees engaged in the different business operations. |
A bank which qualifies and operates as a collective investment business entity may engage in the sale of beneficiary certificates of investment trusts which are managed by such bank. However, such bank is prohibited from engaging in the following activities:
| |
• |
|
acting as trustee of an investment trust managed by such bank; |
| |
• |
|
purchasing with such bank’s own funds beneficiary certificates of an investment trust managed by such bank; |
173
| |
• |
|
using in its sales activities of other collective investment securities information relating to the trust property of an investment trust managed by such bank; |
| |
• |
|
selling through other banks established under the Banking Act beneficiary certificates of an investment trust managed by such bank; |
| |
• |
|
establishing a short-term financial collective investment vehicle; and |
| |
• |
|
establishing a mutual fund. |
Laws and Regulations Governing Other Business Activities
To enter the foreign exchange business, a bank must register with the Minister of the Ministry of Strategy and Finance. The foreign exchange business is governed by the Foreign Exchange Transaction Law. To enter the securities business, a bank must obtain the approval of the Financial Services Commission. The securities business is governed by regulations under the Financial Investment Services and Capital Markets Act. Pursuant to the above-mentioned laws, banks are permitted to engage in the foreign exchange business and the underwriting business for government and other public bonds.
In 2018, regulatory authorities are encouraging financial institutions to lower the ATM usage fees in order to decrease the financial expense burden on consumers. Further, in light of the increasing household debt, regulatory authorities are encouraging financial institutions to gradually increase the proportion of the principal of retail loans that are subject to the fixed interest rates from 14% in 2012 to 45% by 2017.
Principal Regulations Applicable to Credit Card Companies
General
Any person, including a bank, wishing to engage in the credit card business must obtain a license from the Financial Services Commission. In addition, in order to enter the credit card business, a bank must obtain a license from the Financial Services Commission (hereinafter, a bank which obtains such license is defined as “licensed bank engaged in the credit card business”). The credit card business is regulated and governed by the Specialized Credit Financial Business Act. Under the Specialized Credit Financial Business Act and regulations thereunder, a company in the same conglomerate group (as defined in the Monopoly Regulation and Fair Trade Act) may engage in the credit card business even though another company in the same conglomerate group is already engaged in such business, which was previously not permitted.
The Specialized Credit Financial Business Act establishes guidelines on capital adequacy and provides for other regulations relating to the supervision of credit card companies. The Specialized Credit Financial Business Act delegates regulatory authority over credit card companies to the Financial Services Commission and its executive body, the Financial Supervisory Service.
A licensed bank engaging in the credit card business is regulated by the Financial Services Commission and the Financial Supervisory Service.
The Financial Services Commission regulates credit card companies and licensed banks engaged in the credit card business by establishing guidelines or regulations on management of such companies. Moreover if the Financial Services Commission deems the financial condition of a credit card company or a licensed bank engaged in the credit card business to be unsound or such companies fail to satisfy the guidelines or regulations, the Financial Services Commission may take certain measures to improve the financial condition of such companies.
Restrictions on Scope of Business
Under the Specialized Credit Financial Business Act, a credit card company may conduct only the following types of business: (i) credit card business as licensed or other specialized credit finance businesses as registered
174
pursuant to the Specialized Credit Financial Business Act; (ii) the businesses ancillary to the credit card business, (for example, providing cash advance loans to existing credit card holders, issuing and settling of debit cards and issuing, selling and settling of pre-paid cards); (iii) provision of unsecured or secured loans; (iv) provision of discount on notes; (v) purchase, management and collection of account receivables originated by companies in the course of providing goods and services; (vi) provision of payment guarantee; (vii) asset management business under the Asset Backed Securitization Act; (viii) credit investigation; and (ix) other incidental businesses related to the foregoing. Under the Specialized Credit Financial Business Act, a credit card company’s scope of business includes “businesses that utilize existing manpower, assets or facilities in a credit card company, as designated by the Financial Services Commission.” Under the current regulation established by the Financial Services Commission, a credit card company may engage in various types of business including, but not limited to, e-commerce, operation of insurance agency, delegation of card issuance, supply of payment settlement system, loan brokerage and brokerage of collective investment securities.
A credit card company’s average balance of claim amounts arising from the advance of loans to credit card holders (excluding such claims arising from the re-advance of loans to credit card holders following a change in the maturity or interest rate of such loans as part of a debt restructuring) as of the end of each quarter may not exceed the sum of the following amounts:
| |
• |
|
Average balance of claims during a quarter arising from the purchase of goods or services by credit card holders with credit cards; and |
| |
• |
|
Amount of debit card usage during a quarter by debit card members. |
Capital Adequacy
The Specialized Credit Financial Business Act provides for a minimum paid-in capital amount of: (i) W20 billion in the case of a specialized credit financial business company which wishes to engage in no more than two kinds of core businesses (i.e., credit card, installment finance, leasing and new technology business) and (ii) W40 billion in the case of an specialized credit financial business company, which wishes to engage in three or more kinds of core businesses.
Under the Specialized Credit Financial Business Act and regulations thereof, a credit card company must maintain a “capital adequacy ratio,” defined as the ratio of adjusted equity capital to adjusted total asset, of 8% or more and a “delinquent claim ratio,” defined as the ratio of delinquent claims to total claims as set forth under the regulations relating to the Specialized Credit Financial Business Act, of less than 10%.
Under the Specialized Credit Financial Business Act and regulations thereof, the minimum ratio of allowances for losses on loans, leased assets (except assets subject to an operating lease) and suspense receivables as of the date of accounting settlement (including semiannual preliminary accounts settlement) would be 0.5% of normal assets, 1% of precautionary assets and 20% of substandard assets, 75% of doubtful assets and 100% of estimated loss assets, and the minimum ratio of allowances for losses on card assets would be 1.1% (or 2.5%, in the case of card loan assets and revolving assets) of normal assets, 40% (or 50%, in the case of card loan assets and revolving assets) of precautionary assets, 60% (or 65%, in the case of card loan assets and revolving assets) of substandard assets, 75% of doubtful assets and 100% of estimated loss assets. In addition, a credit card company has to reserve a certain amount calculated according to relevant regulations as loss allowances for unused credit limits.
Liquidity
Under the Specialized Credit Financial Business Act and regulations thereunder, a credit card company must maintain a Won liquidity ratio (Won-denominated current assets/Won-denominated current liabilities) of 100% or more. In addition, once a credit card company is registered as a foreign exchange business institution with the Minister of the Ministry of Strategy and Finance, such credit card company is required to (1) maintain a foreign-currency liquidity ratio within three months (defined as foreign-currency liquid assets due within three
175
months divided by foreign-currency liabilities due within three months) of not less than 80%, (2) maintain a ratio of foreign-currency liquid assets due within seven days (defined as foreign-currency liquid assets due within seven days less foreign-currency liabilities due within seven days, divided by total foreign-currency assets) of not less than 0% and (3) maintain a ratio of foreign-currency liquid assets due within a month (defined as foreign-currency liquid assets due within a month less foreign-currency liabilities due within a month, divided by total foreign-currency assets) of not less than negative 10%. The Financial Services Commission requires a credit card company to submit quarterly reports with respect to the maintenance of these ratios.
Restrictions on Funding
Under the Specialized Credit Financial Business Act, a credit card company may raise funds using only the following methods: (i) borrowing from financial institutions, (ii) issuing corporate debentures or notes, (iii) selling securities held by the credit card company, (iv) transferring claims held by the credit card company, (v) borrowing and issuing foreign currency securities after registering itself as a foreign exchange business institutions under the Foreign Exchange Transactions Law, (vi) transferring claims held by the credit card company in connection with its businesses, or (vii) issuing securities backed by the claims held by the credit card company relating to its businesses.
Furthermore, a credit card company may borrow funds from offshore or issue foreign currency denominated securities once it is registered as a foreign exchange business institution with the Minister of the Ministry of Strategy and Finance.
A credit card company must ensure that its total asset does not exceed eight times the amount of its equity capital. However, if the credit card company cannot comply with such limit due to the occurrence of unavoidable events such as drastic changes in the domestic and global financial markets, such limit of its total assets compared to the equity capital may be adjusted by a resolution of the Financial Services Commission. A non-credit card company must ensure that its total asset does not exceed ten times the amount of its equity capital.
Restrictions on Loans to Affiliate Companies
Under the Specialized Credit Financial Business Act and regulations thereof, a credit card company may not provide loans exceeding 50% of its equity capital, in the aggregate, to its specially related persons (as defined under the relevant laws) including, but not limited to, its affiliates.
Restrictions on Assistance to Other Companies
Under the Specialized Credit Financial Business Act, a credit card company may not engage in any of the following acts in conjunction with other financial institutions or companies: (i) holding voting shares under cross shareholding or providing credit for the purpose of avoiding the restrictions on loans to affiliate companies; (ii) acquiring shares under cross shareholding for the purpose of avoiding the limitation on purchase of its treasury shares under the Korean Commercial Code or the Financial Investment Services and Capital Markets Act; or (iii) other acts which are likely to have a material adverse effect on the interests of transaction parties as stipulated by the Presidential Decree to the Specialized Credit Financial Business Act, which are not yet provided.
A credit card company also may not extend credit for enabling another person to purchase the shares of such credit card company or to arrange financing for the purpose of avoiding the restrictions on loans to affiliate companies.
176
Restrictions on Investment in Real Estate
Under the Specialized Credit Financial Business Act and the regulations thereof, a credit card company may possess real estate only to the extent that such business conduct is designated by such laws and regulations, with certain exceptions such as for the purposes of factoring or leasing or as a result of enforcing its security rights, provided that the Financial Services Commission may limit the maximum amount a credit card company may invest in real estate investments for business purposes up to a percentage equal to or in excess of 100% of its equity capital.
Restrictions on Shareholding in Other Companies
Under the Specialized Credit Financial Business Act and the Act on the Structural Improvement of the Financial Industry, a credit card company and its affiliate financial institutions (together a “group”) are required to obtain prior approval of the Financial Services Commission if such credit card company, together with its affiliate financial institutions, (i) owns 20% or more of outstanding voting shares of a target company or (ii) owns 5% or more of outstanding voting shares of a target company, and shall be deemed to have control of the target company, including being the largest shareholder of such target company or otherwise.
Disclosure and Reports
Pursuant to the Specialized Credit Financial Business Act and the regulations thereof, the ordinary disclosure requirement for a credit card company is to disclose any material matters relating to management performance, profits and losses, corporate governance, competence of the employees or risk management within three months from the end of each fiscal year and within two months from the end of the first half of the fiscal year. In addition, a credit card company is required to disclose on an on-going basis certain matters such as the occurrence of non-performing loans, a financial incident or losses exceeding certain amounts. In addition, under the regulations issued by the Financial Services Commission, a credit card company or a licensed bank engaging in the credit card business must submit such report as required by the Governor of the Financial Supervisory Service, with certain important matters being reported as frequently as each month. In addition, all companies engaged in the specialized credit financial business under the Specialized Credit Financial Business Act, including, without limitation, credit card companies, must file a report to the Financial Supervisory Service regarding the result of settlement of accounts within one month after the end of its fiscal year. Also, these companies are required to conduct a provisional settlement of accounts for each quarter and file a report to the Financial Supervisory Service within one month after the end of such quarter.
Risk of Loss Due to Lost, Stolen, Forged or Altered Credit Cards
Under the Specialized Credit Financial Business Act, upon notice from the holder of a credit card or a debit card of its loss or theft, a credit card company or a licensed bank engaged in the credit card business, as the case may be, is liable for any loss arising from the unauthorized use of credit cards or debit cards thereafter as well as any loss from unauthorized transactions made within 60 days prior to such notice. However, a credit card company or a licensed bank engaged in the credit card business, as the case may be, may transfer to the cardholder all or part of the risks of loss associated with unauthorized transactions made within 60 days prior to such notice, in accordance with the standard terms and conditions agreed between the credit card company or the licensed bank engaged in the credit card business, as the case may be, and the cardholder, provided that the loss or theft must be due to the cardholder’s willful misconduct or negligence. Disclosure of a cardholder’s password under duress or threat to the cardholder’s or his/her family’s life or health will not be deemed as the cardholder’s willful misconduct or negligence.
Moreover, a credit card company or a licensed bank engaged in the credit card business, as the case may be, is also responsible for any losses resulting from the use of forged or altered credit cards, debit cards and pre-paid cards. However, a credit card company or a licensed bank engaged in the credit card business, as the case may
177
be, may transfer all or part of this risk of loss to holders of credit cards in the event of willful misconduct or gross negligence by holders of such cards if the terms and conditions of the written agreement entered between the credit card company or a licensed bank engaged in the credit card business, as the case may be, and holders of such cards specifically provide for such transfer. For these purposes, disclosure of a customer’s password that is made intentionally or through gross negligence, or the transfer of or giving as collateral of the credit card or debit card, is considered willful misconduct or gross negligence.
In addition, the Specialized Credit Financial Business Act prohibits a credit card company from transferring to merchants the risk of loss arising from lost, stolen, forged or altered credit cards, debit cards or pre-paid cards; provided, however, that a credit card company may enter into an agreement with a merchant under which the merchant agrees to be responsible for such loss if caused by the merchant’s gross negligence or willful misconduct.
Each credit card company or a licensed bank engaged in the credit card business must institute appropriate measures such as establishing reserves, purchasing insurance or joining a cooperative association in order to fulfill its obligations related to the risk of loss arising from unauthorized use due to lost, stolen, forged or altered credit cards, debit cards or pre-paid cards.
Under the Specialized Credit Financial Business Act, the Financial Services Commission may take necessary measures to maintain credit order and protect consumers by establishing standards to be complied with by credit card companies relating to:
| |
• |
|
maximum limits for cash advances on credit cards; |
| |
• |
|
restrictions on debit cards with respect to per day or per transaction usage; |
| |
• |
|
aggregate issuance limits and maximum limits on the amount per card on pre-paid cards; |
| |
• |
|
calculation and determination of credit limits; |
| |
• |
|
determination of the amount limit of credit cards; |
| |
• |
|
provisions included in credit card agreements; |
| |
• |
|
management of credit card merchants; |
| |
• |
|
collection on claims; or |
| |
• |
|
classification of credit card holders for purposes of determining the fees applicable to such holders. |
Lending Ratio in Ancillary Business
Pursuant to the Presidential Decree of the Specialized Credit Financial Business Act, as amended in January 2020, a credit card company must maintain a quarterly average balance of receivables arising from cash advances to credit card holders (excluding cash advances incurred by re-lending to a credit card holder after modifying the terms and conditions, such as maturity or interest rate, of the original cash advance for debt rescheduling purposes) no greater than its aggregate quarterly average balance of receivables arising from credit card holders’ purchase of goods and services (excluding the amount of receivables arising from the purchase of goods and services using an exclusive use card for business purposes) plus its aggregate quarterly amount of payments made by members using their debit cards.
Issuance of New Cards and Solicitation of New Card Holders
The Presidential Decree of the Specialized Credit Financial Business Act establishes the conditions under which a credit card company or a licensed bank engaged in the credit card business may issue new cards and solicit new members. Specifically, new credit cards may be issued only to the following persons that meet all of
178
the following criteria: (i) age of 19 years or more as defined in the Korean Civil Code, or age of 18 years or more with evidence of employment as of the date of the credit card application; (ii) satisfaction of a minimum credit score as publicly announced by the Financial Services Commission, provided that the minimum personal credit score requirement will not apply in the case where (a) the credit card company can confirm through objective evidence that an applicant is sufficiently capable of paying for his or her credit card use or such applicant can provide objective evidence therefor, or (b) a credit card function is added to an existing debit card for added convenience to the card holder and the credit card function is subject to limits determined by the Financial Services Commission; (iii) satisfaction of the application scoring system for the relevant credit; and (iv) verification of personal identity.
In addition, a credit card company or a licensed bank engaged in the credit card business, as the case may be, may not engage in the following methods of soliciting credit card holders: (i) providing economic benefits or conditioning such benefits in excess of 10% of the annual credit card fee (in the case of no-annual fee credit cards, the average annual fees will be W10,000) in connection with issuance of credit cards; (ii) solicitation on streets and private roads as prescribed under the Road Act and Private Road Act, public place and corridors used by the general public; (iii) solicitation through visits, except those visits made upon prior consent and visits to a business area; (iv) solicitation through pyramid sales methods; and (v) solicitation through the Internet, as further discussed below.
In addition, a credit card company or a licensed bank engaged in the credit card business is required to check whether the credit card applicant has any delinquent debt owed to any other credit card company or other financial institutions which the applicant is unable to repay, and also require, in principle, with respect to solicitations made through the Internet, the certified electronic signature of the applicant. Moreover, persons who intend to engage in solicitation of credit card applicants must register with the Financial Services Commission, unless the solicitation is made by officers or employees of a credit card company or a company in business alliance with such credit card company.
Compliance Rules on Collection of Receivable Claims
Pursuant to the Specialized Credit Financial Business Act and its regulations, a credit card company or a licensed bank engaged in the credit card business are prohibited from collecting its claims by way of:
| |
• |
|
exerting violence or threat of violence; |
| |
• |
|
informing a Related Party (a guarantor of the debtor, blood relative or fiancée of the debtor, a person living in the same household as the debtor or a person working in the same workplace as the debtor) of the debtor’s liability without just cause; |
| |
• |
|
providing false information relating to the debtor’s obligation to the debtor or his or her Related Party; |
| |
• |
|
threatening to sue or suing the debtor for fraud despite lack of affirmative evidence to establish that the debtor has submitted forged or false documentation with respect to his/her capacity to make payment; |
| |
• |
|
visiting or telephoning the debtor during late hours between 9:00 p.m. and 8:00 a.m.; and |
| |
• |
|
utilizing other uncustomary methods to collect the receivables thereby invading the privacy or the peacefulness in the workplace of the debtor or his or her Related Party. |
Principal Regulations Applicable to Financial Investment Companies
General
The securities business is regulated and governed by the Financial Investment Services and Capital Markets Act. Financial investment companies are under the regulation and supervision of the Financial Services Commission, the Financial Supervisory Service and the Securities and Futures Commission.
179
Under the Financial Investment Services and Capital Markets Act, a financial investment company may engage in dealing, brokerage, collective investment, investment advice, discretionary investment management or trust businesses if it has obtained relevant licenses from the Financial Services Commission.
A financial investment company may also engage in certain businesses ancillary to the primary business or certain other additional businesses by submitting a report to the Financial Services Commission within two weeks from the commencement of the business without obtaining any separate license. Approval to merge with any other entity or to transfer all or substantially all of a business must also be obtained from the Financial Services Commission.
Under the Act on the Structural Improvement of the Financial Industry, if the Government deems a financial investment company’s financial condition to be unsound or if a financial investment company fails to meet the applicable Net Operating Equity Ratio (as defined below), the government may order certain sanctions, including among others, sanctions against a financial investment company or its officers or employees, capital increase or reduction and a suspension or assignment of a part or all of business operation.
Regulations on Financial Soundness — Capital Adequacy
The Financial Investment Services and Capital Markets Act sets forth various types of brokerage and/or dealing business licenses based on (i) the scope of products and services that may be provided by each type of the brokerage and/or dealing licensee and (ii) the type of customers to which such products and services may be provided. For example, a financial investment company engaged in the brokerage, dealing and underwriting businesses with retail investors as well as professional investors in connection with all types of securities is required to have a minimum paid-in capital of W53 billion in order to obtain a license for such brokerage, dealing and underwriting businesses.
Under the Financial Investment Service Regulations, as amended and effective as of January 31, 2019, the soundness requirement of financial investment companies changed from the previous net operating equity ratio requirement to a net equity ratio requirement. The net equity ratio is calculated according to the following formula:
Net Equity Ratio = (Net Operating Equity – Total Risk) / Equity Capital Maintenance Requirement for Each Service Unit
The terms “Net Operating Equity” and “Total Risk” for the purpose of the above-stated formula are defined and elaborated in the regulations of the Financial Services Commission. Generally, the Net Operating Equity, the Total Risk and the Equity Capital Maintenance Requirement for Each Service Unit are to be calculated according to the following formula:
Net Operating Equity = Net assets (total assets - total liabilities) - the total of items that may be deducted + the total of items that may be added;
Total Risk = market risk + counterparty risk + management risk; and
Equity Capital Maintenance Requirement for Each Service Unit = Mandatory Equity Capital to be Required for Each Licensed Service Unit × 70%
The regulations of the Financial Services Commission require, among other things, financial investment companies to maintain the net equity ratio at a level equal to or higher than 100% at the end of each quarter of the fiscal year.
In addition, all Korean companies, including financial investment companies, are required to set aside, as a legal reserve, 10% of the cash portion of the annual dividend or interim dividend in each fiscal year until the reserve reaches 50% of the stated capital.
180
Under the Financial Investment Services and Capital Markets Act and regulations thereunder, the minimum ratio of allowances for losses on loans and suspense receivables specified under such regulations is 0.5% of normal assets, 2% of precautionary assets, 20% of substandard assets, 75% of doubtful assets and 100% of estimated loss assets.
Other Provisions on Financial Soundness
The Financial Investment Services and Capital Markets Act, the Presidential Decree of the Financial Investment Services and Capital Markets Act and the regulations of the Financial Services Commission also include certain provisions which are designed to regulate certain types of activities relating to the management of the assets of a securities company, subject to certain exceptions. Such provisions include:
| |
• |
|
restrictions on the holdings by a securities company of securities issued by another company which is the largest shareholder or the major shareholder (each as defined under the Financial Investment Services and Capital Markets Act) of such securities company; and |
| |
• |
|
restrictions on providing money or credit to the largest shareholder (including specially-related persons of such shareholder), major shareholders, officers and specially-related persons of the securities company. |
Principal Regulations Applicable to Insurance Companies
General
Insurance companies are regulated and governed by the Insurance Business Act (the “Insurance Business Act”). In addition, insurance companies in Korea are under the regulation and supervision of the Financial Services Commission and its governing entity, the Financial Supervisory Service.
Under the Insurance Business Act, approval to commence an insurance business must be obtained from the Financial Services Commission based on the type of insurance businesses, which are classified as life insurance business, non-life insurance business and third type insurance business. Life insurance business means an insurance business which deals with life insurance policies or pension insurance policies (including retirement insurance policies). Non-life insurance business means an insurance business which deals with fire insurance policies, marine insurance policies, car insurance policies, guaranty insurance policies, reinsurance policies, liability insurance policies or other insurance policies prescribed under the Presidential Decree of the Insurance Business Act. Third type insurance business means an insurance business which deals with injury insurance policies, health insurance policies or nursing care insurance policies. Under the Insurance Business Act, insurance companies are not allowed to engage in both a life insurance business and a non-life insurance business, subject to certain exceptions.
If the Government deems an insurance company’s financial condition to be unsound or if an insurance company fails to properly manage the business as set forth under relevant Korean law, the government may order certain sanctions including, among others, sanctions against an insurance company or its officers or employees, capital increase or reduction and a suspension or assignment of a part or all of business operation.
Capital Adequacy
The Insurance Business Act requires a minimum paid-in capital of W30 billion for an insurance company; provided, that, the insurance company which intends to engage in only certain types of insurance policies may have a lower paid-in capital pursuant to the Presidential Decree of the Insurance Business Act.
In addition to the minimum capital requirement, an insurance company is required to maintain a Solvency Margin Ratio of 100% or more. “Solvency Margin Ratio” is the ratio of the Solvency Margin to the Standard
181
Amount of the Solvency Margin. Solvency Margin is the aggregate amount of net assets and amounts that are liabilities in the balance sheet but are usable to cover loss risk (e.g., the amount of subordinated liabilities), less the amount that the Governor of the Financial Supervisory Service deems unusable to compensate for losses incurred by unexpected risks of an insurance company, among assets or capital in the balance sheet, such as stock discounts and treasury stocks. The Standard Amount of Solvency Margin for life insurance companies is defined under the regulation of the Financial Services Commission.
On January 1, 2023, the Financial Supervisory Service introduced the K-ICS, a new regulatory solvency regime for insurance companies, based on the International Capital Standard developed by the International Association of Insurance Supervisors, which is similar in substance to the Solvency II Directive of the European Union. Under the K-ICS, at the time of computation of the Solvency Margin, insurance contract liabilities are expected to be measured based on market value, rather than book value, and at the time of computation of the Standard Amount of the Solvency Margin, risks associated with termination, business expenses, longevity, catastrophes and asset concentration risks are added, which would require a number of insurance companies in Korea with a large portfolio of high guaranteed rate of return products to obtain additional capital to meet their capital adequacy requirements. However, the Financial Supervisory Service has allowed for deduction from available capital on a gradual basis and for gradual recognition of risks in relation to required capital for up to 10 years. Even if the Solvency Margin Ratio under the K-ICS is less than 100%, corrective measures will be withheld in case the Solvency Margin Ratio under the prior risk-based capital regime exceeds 100% for up to five years, to ease the burden on insurance companies.
Under the Insurance Business Act, the Presidential Decree and other regulations thereunder, for each accounting period, insurance companies are required to appropriate policy reserve that is earmarked for future payments of insurance money, refund and dividends to policyholders (hereinafter collectively referred to as “Insurance Money”) for each insurance contract. However, if an insurance company has reinsured a portion of its insurance contracts with a creditworthy reinsurance company in order to lower its overall risk, in principle, the insurance company is not required to appropriate policy reserve for the reinsured contracts. Instead, the reinsurance company is required to appropriate such policy reserve for the reinsured contracts. The Insurance Business Act was amended on January 24, 2011 to classify the insurance products into two categories: (i) reportable insurance products and (ii) voluntary insurance products. Under this amendment, only the changes to the terms and conditions of the reportable insurance products require a prior report and approval from the Financial Supervisory Service and the voluntary insurance products can be sold without prior approval from the Financial Supervisory Service. The policy reserve needs to be appropriated in accordance with the policy reserve calculation method for each insurance product as stipulated in amended Insurance Business Act.
The policy reserve amount consists of the following: (i) insurance contract liabilities (the sum of (a) the amount reserved by applying current estimates of future cash flow in order to pay the insurance proceeds, etc. for which an event of payment under the insurance policy has occurred as of the end of each fiscal year and (b) the amount reserved by applying current estimates of future cash flow in order to pay the insurance proceeds, etc. in the future although an event of payment under the insurance policy has not occurred as of the end of each fiscal year), (ii) investment contract liabilities (amounts reserved by insurance companies for the payment of insurance proceeds, etc. in the future for insurance contracts classified as investment contracts among insurance contracts) and (iii) amounts reserved by applying current estimates on future cash flows in the manner prescribed by the Financial Services Commission.
Pursuant to the regulations established by the Financial Services Commission, insurance companies are required to maintain allowances for outstanding loans, accounts receivables and other credits (including accrued income, payment on account, and bills receivables or dishonored) in an aggregate amount covering not less than 0.5% of normal credits, 2% of precautionary credits, 20% of substandard credits, 50% of doubtful credits and 100% of estimated loss credits, provided that the minimum ratio of allowances for certain type of outstanding loans by insurance companies to individuals and households (including, retail loans, housing loans, and other forms of retail loans extended to individuals not registered for business), is increased to 1% of normal credits, 10% of
182
precautionary credits and 55% of doubtful credits. Furthermore, the regulations on insurance companies became more stringent in September 2010 by adding a requirement that insurance companies maintain allowance for bad debts in connection with real estate project financing loans in excess of 0.9% of normal credits and 7% of precautionary credits.
Variable Insurance and Bancassurance Agents
Variable insurance is regulated pursuant to the Insurance Business Act and the Financial Investment Services and Capital Markets Act. In order for an insurance company to sell variable insurance to a policyholder and operate such variable insurance, the insurance company must obtain a license with respect to collective investment business from the Financial Services Commission and register as a selling company with the Financial Services Commission. In this case, according to the Financial Investment Services and Capital Markets Act, an insurance company will be regulated as an investment trust and assets acquired in connection with variable insurance must be held by a trust company that is registered with the Financial Services Commission pursuant to the Financial Investment Services and Capital Markets Act.
According to the Financial Investment Services and Capital Markets Act, insurance companies may operate variable insurance through (i) mandating all of the management and the management instruction business to another asset management company, (ii) operating by way of discretionary investment all of the assets constituting the investment advisory assets out of the investment trust assets, or (iii) operating all of the investment trust assets into other collective investment securities, thereby allowing all of the particular variable insurance assets to be outsourced.
The Insurance Business Act permits banks, securities companies, credit card companies and other financial institutions to register as insurance agents or insurance brokers and engage in the insurance business (the “Bancassurance Agents”), who are currently permitted to sell all types of life and non-life insurance products, except for protection type insurance products, such as whole life insurance, critical illness insurance and automobile insurance.
Restrictions on Investment of Assets
According to the Insurance Business Act, insurance companies are prohibited from making any of the following investment of assets:
| |
• |
|
owning any real estate (excluding any real estate owned as a result of enforcing their own security interest) other than real estate for conducting its business as designated by the Presidential Decree. In any case, the total amount of real estate owned by an insurance company must not exceed 25% of its Total Assets, provided that investment in real estate for a separate account is limited to 15% of the assets of such separate account; |
| |
• |
|
loans made for the purpose of speculation in commodities or securities; |
| |
• |
|
loans made directly or indirectly to enable a natural or legal person to buy their own shares; |
| |
• |
|
loans made directly or indirectly to finance political campaigns and other similar activities; and |
| |
• |
|
loans made to any of the insurance company’s officers or employees other than loans based on insurance policy or de minimis loans of up to (1) W20 million in the case of a general loan, (2) W50 million in the case of a general loan plus a housing loan, or (3) W60 million in the aggregate for general loans and housing loans. |
In addition, insurance companies are not allowed to exceed 50% of its Total Assets with respect to holding foreign currency under the Foreign Exchange Transaction Act or owning offshore real estate.
183
Regulations on Class Actions Regarding Securities
The Law on Class Actions Regarding Securities was enacted as of January 20, 2004 and last amended on May 28, 2013. The Law on Class Actions Regarding Securities governs class actions suits instituted by one or more representative plaintiff(s) on behalf of 50 or more persons who claim to have been damaged in a capital markets transaction involving securities issued by a listed company in Korea.
Applicable causes of action with respect to such suits include:
| |
• |
|
claims for damages caused by misleading information contained in a securities statement; |
| |
• |
|
claims for damages caused by the filing of a misleading business report, semi-annual report, or quarterly report; |
| |
• |
|
claims for damages caused by insider trading or market manipulation; and |
| |
• |
|
claims instituted against auditors for damages caused by accounting irregularities. |
Any such class action may be instituted upon approval from the presiding court and the outcome of such class action will have a binding effect on all potential plaintiffs who have not joined the action, with the exception of those who have filed an opt out notice with such court.
U.S. Regulations
As a substantial majority of our and our subsidiaries’ operations are in Korea, we are primarily subject to the regulations and supervision of the Financial Services Commission and the Financial Supervisory Service. Our subsidiaries, however, have limited operations in the United States, and we own a bank in the United States. Therefore, we and our U.S. operations are subject to U.S. supervision, regulation and enforcement by relevant authorities in the United States with regard to our U.S. operations.
U.S. Banking Regulations
Our operations in the United States are subject to a variety of regulatory regimes. Shinhan Bank maintains an uninsured branch in New York, which is licensed by the New York State Department of Financial Services (the “Department”) and registered with the banking authority of Korea. Shinhan Bank’s New York branch is subject to regulation and examination by the Department under its licensing authority. In addition, the Board of Governors of the Federal Reserve System (the “Federal Reserve Board”) exercises examination and regulatory authority over Shinhan Bank’s U.S. branch. We also own a non-member state chartered bank, Shinhan Bank America, which is regulated by the Department, as its chartering authority, and by the Federal Deposit Insurance Corporation (“FDIC”), as its primary federal banking regulator and as the insurer of its deposits. Our U.S. branch and U.S. bank subsidiary are subject to restrictions on their respective activities, as well as prudential restrictions, such as limits on extensions of credit to a single borrower, and restrictions on transactions with affiliates, among other things. We are also a financial holding company and a bank holding company under U.S. banking laws and our U.S. operations are subject to regulation, supervision and enforcement by the Federal Reserve Board.
Shinhan Bank’s U.S. Branch
The Department, as the licensing authority of Shinhan Bank’s U.S. branch, has the authority, in certain circumstances, to take possession of the business and property of Shinhan Bank located in New York. Such circumstances generally include violations of law, unsafe business practices and insolvency. If the Department exercised this authority over the New York branch of Shinhan Bank, all assets of Shinhan Bank located in New York would generally be applied first to satisfy creditors of the New York branch. Any remaining assets would be applied to satisfy creditors of other U.S. offices of Shinhan Bank, after which any residual assets of the New York branch would be returned to the principal office of Shinhan Bank, and made available for application pursuant to any Korean insolvency proceeding.
184
Financial Holding Company
In addition to the direct regulation of Shinhan Bank’s U.S. branch by the Department and the Federal Reserve Board, because we operate a U.S. branch and have a subsidiary bank in the U.S., our nonbanking activities in the United States are subject to regulation by the Federal Reserve Board pursuant to the International Banking Act of 1978, the Bank Holding Company Act of 1956 (the “BHC Act”), and other laws. We have elected to be a “financial holding company” under the BHC Act. Financial holding companies may engage in a broader spectrum of activities than bank holding companies or foreign banking organizations that are not financial holding companies, including underwriting and dealing in securities. To maintain our financial holding company status and engage in activities permissible for a financial holding company, (i) we and our U.S. subsidiary bank located in New York are required to be “well capitalized” and “well managed,” (ii) our U.S. branch is required to meet certain examination ratings, and (iii) our subsidiary bank in New York is required to maintain a rating of at least “satisfactory” under the Community Reinvestment Act of 1977 (the “CRA”).
A major focus of U.S. governmental policy relating to financial institutions in recent years has been aimed at fighting money laundering and terrorist financing. Regulations applicable to us and our subsidiaries impose obligations to maintain effective policies, procedures and controls to detect, prevent and report money laundering and terrorist financing and to verify the identities of clients. Failure of a financial institution to maintain and implement adequate programs to combat money laundering and terrorist financing could have serious consequences for the firm, both in legal terms and in terms of our reputation.
The Dodd-Frank Wall Street Reform and Consumer Protection Act (the “Dodd-Frank Act”), which was enacted on July 21, 2010 in response to the financial crisis, impacts the financial services industry by addressing, among other issues, systemic risk oversight, bank capital standards, the liquidation of failing systemically important institutions, over-the-counter and cleared derivatives, the ability of banking entities, including non-U.S. banks with branches in the U.S., like us, to engage in proprietary trading activities and invest in hedge funds and private equity funds (the so-called Volcker rule), consumer and investor protection, hedge fund registration, securitization, investment advisors, shareholder “say on pay,” the role of credit-rating agencies, and more. The Dodd-Frank Act requires various federal banking and financial regulatory authorities to adopt a broad range of implementing rules and regulations. Such authorities have significant discretion in drafting the implementing rules and regulations.
The Dodd-Frank Act provides regulators with tools to impose greater capital, leverage and liquidity requirements and other prudential standards, particularly for financial institutions that pose significant systemic risk. Pursuant to the Dodd-Frank Act, the Federal Reserve Board has implemented rules that establish enhanced prudential standards for the U.S. operations of foreign banking organizations (“FBOs”) such as us. In imposing such heightened prudential standards on non-U.S. banks such as us, the Federal Reserve Board is directed to take into account the principle of national treatment and equality of competitive opportunity, and the extent to which the foreign bank holding company is subject to comparable home country standards.
On May 24, 2018, the Economic Growth, Regulatory Relief and Consumer Protection Act (the “Reform Act”) was signed into law. Among other regulatory changes, the Reform Act amends various sections of the Dodd-Frank Act, including by raising the asset threshold for automatic application of enhanced prudential standards to FBOs under the Dodd-Frank Act from $50 billion in total global consolidated assets to $250 billion. The bill exempted FBOs with total global consolidated assets of less than $100 billion from these enhanced prudential standards effective immediately upon enactment of the bill. In October 2019, the Federal Reserve Board issued a final rule to implement the Reform Act’s changes to the application of enhanced prudential standards with respect to U.S. bank holding companies and FBOs (the “EPS Tailoring Rule”). The EPS Tailoring Rule delineates three categories of enhanced prudential standards (“EPS categories”) applicable to FBOs based on an FBO’s asset size and other factors such as the degree of the cross-jurisdictional activity, reliance on short-term wholesale funding, nonbank assets, and off-balance sheet exposures of an FBO’s U.S. operations. The EPS Tailoring Rule generally determines the stringency of enhanced prudential standards applicable to FBOs based
185
on the risk profile of the FBO’s U.S. operations, rather than its global footprint, with most enhanced prudential standards applying only to FBOs with combined U.S. assets of at least $100 billion. FBOs with global assets of $100 billion or more and a relatively limited U.S. presence, such as us, are subject to certain minimum standards under the EPS Tailoring Rule, with the Federal Reserve Board relying primarily on compliance with comparable home-country prudential standards with respect to such FBOs.
If our size or risk profile were to increase, our combined U.S. operations may be subject to certain further enhanced prudential standards. In particular, enhanced prudential standards applicable to FBOs require an FBO with both significant total global consolidated assets and significant U.S. assets (excluding the total assets of each U.S. branch and agency) to establish a U.S. top-tier intermediate holding company (“IHC”) over all U.S. bank and nonbank subsidiaries, and generally subject such an FBO’s IHC to the same capital adequacy standards, including minimum risk based capital and leverage requirements, liquidity, liquidity risk management, stress testing and single counterparty credit limits as those applicable to U.S. bank holding companies in the same EPS category under the EPS Tailoring Rule. In addition, certain enhanced prudential standards will apply to the combined U.S. operations of an FBO whether or not the FBO is required to establish a U.S. IHC. We continue to assess the full impact of these enhanced prudential requirements and the EPS Tailoring Rule on our business.
In addition, as an FBO with more than $250 billion in total global consolidated assets that does not otherwise meet certain category thresholds identified in the EPS Tailoring Rule, we are currently required to submit periodically to the Federal Reserve Board and FDIC a resolution plan for the orderly resolution of our U.S. operations under the U.S. Bankruptcy Code or other applicable insolvency laws in a rapid and orderly fashion in the event of future material financial distress or failure. If the Federal Reserve Board and the FDIC jointly determine that the resolution plan is not credible and the deficiencies are not cured in a timely manner, they may jointly impose more stringent capital, leverage or liquidity requirements or restrictions on our growth, activities or operations. If we were to fail to address the deficiencies in the resolution plan when required, we could eventually be required to divest certain assets or operations.
In October 2019, the Federal Reserve Board and FDIC issued a final rule addressing the applicability of resolution planning requirements for FBOs (the “FBO Resolution Plan Rule”). The FBO Resolution Plan Rule applies reduced resolution plan filing requirements to FBOs that have $250 billion or more in total global consolidated assets and that do not otherwise meet certain category thresholds identified in the EPS Tailoring Rule, such as us, requiring such FBOs to submit a reduced content resolution plan every three years.
In July 2019, U.S. federal regulatory agencies adopted amendments to the Volcker Rule regulations to implement the Volcker Rule amendments included in the Reform Act, and also in 2019 such U.S. federal regulatory agencies adopted certain targeted amendments to the Volcker Rule regulations to simplify and tailor certain compliance requirements relating to the Volcker Rule. In June 2020, U.S. federal regulatory agencies adopted additional revisions to the Volcker Rule’s restrictions on banking entities sponsoring and investing in certain covered hedge funds and private equity funds, including by adopting new exemptions allowing banking entities to sponsor and invest without limit in credit funds, venture capital funds, customer facilitation funds and family wealth management vehicles (the “Covered Fund Amendments”). The Covered Fund Amendments also loosen certain other restrictions on extraterritorial fund activities and direct parallel or co-investments made alongside covered funds. The Covered Fund Amendments therefore should expand the ability of banking entities to invest in and sponsor private funds. The ultimate consequences of the Reform Act on the Fund and its activities remain uncertain, and it remains unclear whether any particular other legislative or regulatory proposals will be enacted or adopted.
Shinhan Bank America
Shinhan Bank America, a state chartered bank that is located in New York and is not a member of the Federal Reserve Board, is subject to extensive regulation and examination by the Department, as its chartering authority, and by the FDIC, as the insurer of its deposits and as its primary federal banking regulator. The federal
186
and state laws and regulations which are applicable to banks regulate, among other things, the activities in which they may engage and the locations at which they may engage in them, their investments, their reserves against deposits, the timing of the availability of deposited funds and transactions with affiliates. Shinhan Bank America must file reports with the Department and the FDIC concerning its activities and financial condition, in addition to obtaining regulatory approvals prior to entering into certain transactions, such as establishing branches and mergers with, or acquisitions of, other depository institutions. The Department and the FDIC periodically examine the bank to test Shinhan Bank America’s safety and soundness and its compliance with various regulatory requirements. This comprehensive regulatory and supervisory framework restricts the activities in which a bank can engage and is intended primarily for the protection of the FDIC insurance fund and the bank’s depositors. Regulatory authorities have extensive discretion in connection with their supervisory and enforcement activities and examination policies, which include setting policies with respect to the classification of assets and the establishment of adequate loan loss reserves. Any change in such regulations, whether by the Department, the FDIC or as a result of the enactment of legislation, could have a material adverse impact on Shinhan Bank America and its operations.
Capital Requirements. The FDIC imposes capital adequacy standards on state-chartered banks like Shinhan Bank America. The “prompt corrective action” framework under the Federal Deposit Insurance Corporation Improvement Act of 1991 (“FDICIA”), provides, among other things, for expanded regulation of insured depository institutions, including banks, and their parent holding companies. As required by FDICIA, the federal banking agencies have established five capital tiers ranging from “well capitalized” to “critically undercapitalized” for insured depository institutions. In order for our U.S. bank subsidiary to be classified as “well capitalized,” which is necessary in order for us to maintain our financial holding company status, it must maintain a minimum 5% Tier I leverage ratio, a 6.5% common equity Tier I capital ratio, a 8% Tier I risk-based capital ratio and a 10% total risk-based capital ratio.
In order for Shinhan Bank America to be classified as “adequately capitalized” under FDICIA’s prompt corrective action standards, which is necessary in order for Shinhan Bank America to avoid certain restrictions under FDICIA, it must maintain a minimum 4% Tier I leverage ratio, a 4.5% common equity Tier I capital ratio, a 6% Tier I risk-based capital ratio and a 8% total risk-based capital ratio.
As of December 31, 2022, Shinhan Bank America exceeded all of the capital ratio standards for a well-capitalized bank with a Tier I leverage ratio of 11.32%, a common equity Tier I risk-based capital ratio of 16.13%, a Tier I risk-based capital ratio of 16.13% and a total risk-based capital ratio of 16.99%.
Activities and Investments of New York-Chartered Banks. Shinhan Bank America derives its lending, investment and other authority primarily from the applicable provisions of New York State Banking Law and the regulations of the Department, as well as FDIC regulations and other federal laws and regulations. See “— Activities and Investments of FDIC-Insured State-Chartered Banks” below. These New York laws and regulations authorize Shinhan Bank America to invest in real estate mortgages, consumer and commercial loans, certain types of debt securities, including certain corporate debt securities and obligations of federal, State and local governments and agencies, and certain other assets. A bank’s aggregate lending powers are not subject to percentage of asset limitations, but, as discussed below, there are limits on the amount of credit exposure that a bank may have to a single borrower or group of related borrowers. A New York-chartered bank may also exercise trust powers upon approval of the Department. Shinhan Bank America does not currently have trust powers.
With certain limited exceptions, Shinhan Bank America may not make loans or extend credit for commercial, corporate or business purposes (including lease financing) to a single borrower, the aggregate amount of which would be in excess of 15% of Shinhan Bank America’s net worth, on an unsecured basis, and 25% of the net worth if the excess is collateralized by readily marketable collateral or collateral otherwise having a value equal to the amount by which the loan exceeds 15% of Shinhan Bank America’s net worth. In calculating the amount of outstanding loans or credit to a particular borrower for this purpose, Shinhan Bank America must include its credit exposure arising from derivative transactions with the borrower.
187
Activities and Investments of FDIC-Insured State-Chartered Banks. The activities and equity investments of FDIC-insured, state-chartered banks are generally limited to those that are permissible for national banks. Under regulations dealing with equity investments, an insured state bank generally may not directly or indirectly acquire or retain any equity investment of a type, or in an amount, that is not permissible for a national bank. An insured state bank may, among other things, (i) acquire or retain a majority interest in a subsidiary that is engaged in activities that are permissible for the bank itself to engage in, (ii) invest as a limited partner in a partnership the sole purpose of which is direct or indirect investment in the acquisition, rehabilitation or new construction of a qualified housing project, provided that such limited partnership investments may not exceed 2% of the bank’s total assets, and (iii) acquire up to 10% of the voting stock of a company that solely provides or reinsures directors’, trustees’ and officers’ liability insurance coverage or bankers’ blanket bond group insurance coverage for insured depository institutions. In addition, an FDIC-insured state-chartered bank may not directly, or indirectly through a subsidiary, engage as “principal” in any activity that is not permissible for a national bank unless the FDIC has determined that such activities would pose no significant risk to the insurance fund of which it is a member and the bank is in compliance with applicable regulatory capital requirements.
Regulatory Enforcement Authority. Applicable banking laws include substantial enforcement powers available to federal banking regulators. This enforcement authority includes, among other things, the ability to assess civil money penalties, to issue cease-and-desist or removal orders and to initiate injunctive actions against banking organizations and institution-affiliated parties, as defined. In general, these enforcement actions may be initiated for violations of laws and regulations and unsafe or unsound practices. Other actions or inactions may provide the basis for enforcement action, including misleading or untimely reports filed with regulatory authorities. On June 12, 2017, Shinhan Bank America entered into a consent order with the FDIC with respect to certain weaknesses relating to its anti-money laundering compliance program. Shinhan Bank America has taken corrective measures and provides periodic reports to the FDIC with regard to such matters.
Under the New York State Banking Law, the Department may issue an order to a New York-chartered banking institution to appear and explain an apparent violation of law, to discontinue unauthorized or unsafe practices and to keep prescribed books and accounts. Upon a finding by the Department that any director, trustee or officer of any banking organization has violated any law, or has continued unauthorized or unsafe practices in conducting the business of the banking organization after having been notified by the Department to discontinue such practices, such director, trustee or officer may be removed from office by the Department after notice and an opportunity to be heard. The Department also may take possession of a banking organization under specified statutory criteria.
Prompt Corrective Action. Section 38 of the Federal Deposit Insurance Act provides the federal banking regulators with broad power to take “prompt corrective action” to resolve the problems of undercapitalized institutions. The extent of the regulators’ powers depends on whether the institution in question is “well capitalized,” “adequately capitalized,” “undercapitalized,” “significantly undercapitalized” or “critically undercapitalized.” A bank is deemed to be (i) “well capitalized” if it has total risk-based capital ratio of 10.0% or greater, has a Tier I risk-based capital ratio of 8.0% or greater, has a common equity Tier I capital ratio of 6.5% or greater, has a Tier I leverage capital ratio of 5.0% or greater, and is not subject to specified requirements to meet and maintain a specific capital level for any capital measure, (ii) “adequately capitalized” if it has a total risk-based capital ratio of 8.0% or greater, has a Tier I risk-based capital ratio of 6.0% or greater, has a common equity Tier I capital ratio of 4.5% or greater, has a Tier I leverage capital ratio of 4.0% or greater and does not meet the definition of “well capitalized,” (iii) “undercapitalized” if it has a total risk-based capital ratio that is less than 8.0%, has a Tier I risk-based capital ratio that is less than 6.0%, has a common equity Tier I capital ratio of less than 4.5%, or has a Tier I leverage capital ratio that is less than 4.0%, (iv) “significantly undercapitalized” if it has a total risk-based capital ratio that is less than 6.0%, has a Tier I risk-based capital ratio that is less than 4.0%, has a common equity Tier I capital ratio that is less than 3.0%, or has or a Tier I leverage capital ratio that is less than 3.0%, and (v) “critically undercapitalized” if it has a ratio of tangible equity to total assets that is equal to or less than 2.0%. The regulations also provide that a federal banking regulator may, after notice and an opportunity for a hearing, reclassify a “well capitalized” institution as “adequately capitalized” and may require
188
an “adequately capitalized” institution or an “undercapitalized” institution to comply with supervisory actions as if it were in the next lower category if the institution is in an unsafe or unsound condition or engaging in an unsafe or unsound practice. The federal banking regulator may not, however, reclassify a “significantly undercapitalized” institution as “critically undercapitalized.”
An institution generally must file a written capital restoration plan which meets specified requirements, as well as a performance guaranty by each company that controls the institution, with an appropriate federal banking regulator within 45 days of the date that the institution receives notice or is deemed to have notice that it is “undercapitalized,” “significantly undercapitalized” or “critically undercapitalized.” Immediately upon becoming undercapitalized, an institution becomes subject to statutory provisions, which, among other things, set forth various mandatory and discretionary restrictions on the operations of such an institution.
FDIC Insurance. Shinhan Bank America’s deposits are insured by the FDIC. As insurer, the FDIC is authorized to conduct examinations of, and to require reporting by, FDIC-insured institutions. It also may prohibit any FDIC-insured institution from engaging in any activity the FDIC determines by regulation or order to pose a serious threat to the FDIC.
During the 2008-2009 financial crisis, there were many failures and near-failures among financial institutions. The FDIC insurance fund reserve ratio, representing the ratio of the fund to the level of insured deposits, declined due to losses caused by bank failures and the FDIC then increased its deposit insurance premiums on remaining institutions in order to replenish the insurance fund. The Dodd-Frank Act requires the FDIC to maintain the ratio of the FDIC insurance fund to estimated total insured deposits (“Reserve Ratio”) at 1.35%. If bank failures in the future are more costly than the FDIC currently anticipates, then the FDIC may be required to continue to impose higher insurance premiums. Any such increase would increase our non-interest expense. Thus, despite the prudent steps Shinhan Bank America may take to avoid the mistakes made by other banks, its costs of operations may increase as a result of those mistakes by others.
Extraordinary growth in insured deposits during the first and second quarters of 2020 caused the Reserve Ratio to decline below the statutory minimum of 1.35%, resulting in the FDIC establishing a restoration plan on September 15, 2020 which contemplates the Reserve Ratio returning to 1.35% within 8 years. In October 2022, the FDIC adopted a final rule, applicable to all insured depository institutions, to increase the initial base deposit insurance assessment rates uniformly by 2%, beginning in the first quarterly assessment period of 2023. The rate increase is intended to increase the likelihood that the Reserve Ratio reaches the statutory minimum of 1.35% by September 30, 2028. The new assessment rates will remain in effect unless and until the Reserve Ratio meets or exceeds the FIDC’s long-term goal of a 2% Reserve Ratio. Progressively lower assessment rate schedules will take effect when the Reserve Ratio reaches 2%, and again when it reaches 2.5%.
As a result of the Dodd-Frank Act, the increase in the standard FDIC insurance limit from US$100,000 to US$250,000 was made permanent. The Dodd-Frank Act also removed the prohibition on banks paying interest on demand deposits.
The FDIC may terminate the deposit insurance of any insured depository institution, including Shinhan Bank America, if it determines, after a hearing, that the institution has engaged or is engaging in unsafe or unsound practices, is in an unsafe or unsound condition to continue operations, or has violated any applicable law, regulation, order or any condition imposed by an agreement with the FDIC. It also may suspend deposit insurance temporarily during the hearing process for the permanent termination of insurance, if the institution has no tangible capital. If insurance of accounts is terminated, the accounts at the institution at the time of the termination, less subsequent withdrawals, shall continue to be insured for a period of six months to two years, as determined by the FDIC. Management is aware of no existing circumstances that would result in termination of Shinhan Bank America’s deposit insurance.
Brokered Deposits. Under federal law and applicable regulations, (i) a well-capitalized bank may solicit and accept, renew or roll over any brokered deposit without restriction, (ii) an adequately capitalized bank may not
189
accept, renew or roll over any brokered deposit unless it has applied for and been granted a waiver of this prohibition by the FDIC and (iii) an undercapitalized bank may not (x) accept, renew or roll over any brokered deposit or (y) solicit deposits by offering an effective yield that exceeds by more than 75 basis points the prevailing effective yields on insured deposits of comparable maturity in such institution’s normal market area or in the market area in which such deposits are being solicited. The term “undercapitalized insured depository institution” is defined to mean any insured depository institution that fails to meet the minimum regulatory capital requirement prescribed by its appropriate federal banking agency. The FDIC may, on a case-by-case basis and upon application by an adequately capitalized insured depository institution, waive the restriction on brokered deposits upon a finding that the acceptance of brokered deposits does not constitute an unsafe or unsound practice with respect to such institution. In January 2021, the FDIC adopted rules on aspects of FDIC’s brokered deposit and interest rate regulations. The impact of these rules on Shinhan Bank America’s operations in the future is uncertain. Shinhan Bank America had an aggregate amount of US$10 million of brokered deposits outstanding as of December 31, 2022.
Community Reinvestment and Consumer Protection Laws. In connection with its lending activities, Shinhan Bank America is subject to a variety of federal laws designed to protect borrowers and promote lending to various sectors of the economy and population. Included among these are the Home Mortgage Disclosure Act, Real Estate Settlement Procedures Act, Truth-in-Lending Act, Equal Credit Opportunity Act, Fair Credit Reporting Act and CRA.
The CRA requires FDIC insured banks to define the assessment areas that they serve, identify the credit needs of those assessment areas and take actions that respond to the credit needs of the community. The FDIC must conduct regular CRA examinations of Shinhan Bank America and assign it a CRA rating of “outstanding,” “satisfactory,” “needs improvement” or “unsatisfactory.” Shinhan Bank America is also subject to provisions of the New York State Banking Law which impose similar obligations to serve the credit needs of its assessment areas. The Department and the FDIC each periodically assess a bank’s compliance, and makes the assessment available to the public. Federal and New York State laws both require consideration of these ratings when reviewing a bank’s application to engage in certain transactions, including mergers, asset purchases and the establishment of branch offices. A negative assessment may serve as a basis for the denial of any such application. Shinhan Bank America has received “satisfactory” ratings from both the Department and the FDIC in its most recent CRA performance evaluation.
In May 2022, the FDIC and other federal regulatory agencies proposed comprehensive amendments to the CRA regulatory framework. Among other things, the proposed amendments are intended to reflect changes in the banking industry, including the expanded role of mobile and online bank and to tailor performance standards to account for differences in bank size, business models and local conditions. It remains unclear whether the FDIC or other regulatory agencies will adopt final rules amending the CRA. If such rules were to be adopted, we cannot predict at this time the extent to which the scope of such final rules would resemble the proposed rules or the CRA regulations that are currently in effect. It also remains unclear whether any other particular legislative or regulatory proposals will be enacted or adopted concerning CRA requirements applicable to us. To the extent any such final amendments to CRA requirements applicable to us are adopted, such regulatory developments may impact the ability of Shinhan Bank America to achieve “satisfactory” CRA performance ratings.
The Dodd-Frank Act created the Consumer Financial Protection Bureau (the “Bureau”) with broad authority to regulate and enforce consumer protection laws. The Bureau has the authority to adopt regulations under numerous existing federal consumer protection statutes. The Bureau may also decide that a particular consumer financial product or service, or the manner in which it is offered, is an unfair, deceptive, or abusive act or practice. If the Bureau so decides, it has the authority to outlaw such act or practice.
Limitations on Dividends. The payment of dividends by Shinhan Bank America is subject to various regulatory requirements. Under New York State Banking Law, a New York-chartered stock bank may declare and pay dividends out of its net profits, unless there is an impairment of capital, but approval of the
190
Superintendent of Banks is required if the total of all dividends declared in a calendar year would exceed the total of its net profits for that year combined with its retained net profits of the preceding two years, subject to certain adjustments.
Assessments. Banking institutions are required to pay assessments to both the FDIC and the Department to fund the operations of those agencies. The assessments are based upon the amount of Shinhan Bank America’s total assets. Shinhan Bank America must also pay an examination fee to the Department when it conducts an examination.
Transactions with Related Parties. Shinhan Bank America’s authority to engage in transactions with related parties or “affiliates” (i.e., any entity that controls or is under common control with an institution) is limited by Sections 23A and 23B of the Federal Reserve Act. Section 23A limits the aggregate amount of transactions with any individual affiliate to 10% of the capital and surplus of the institution and also limits the aggregate amount of transactions with all affiliates to 20% of the institution’s capital and surplus. The term “affiliate” includes, for this purpose, us and any company that we control other than Shinhan Bank America and its subsidiaries.
Loans to affiliates must be secured by collateral with a value that depends on the nature of the collateral. The purchase of low quality assets from affiliates is generally prohibited. Loans and asset purchases with affiliates must be on terms and under circumstances, including credit standards, that are substantially the same or at least as favorable to the institution as those prevailing at the time for comparable transactions with nonaffiliated companies. In the absence of comparable transactions, such transactions may only occur under terms and circumstances, including credit standards that in good faith would be offered to or would apply to nonaffiliated companies. Shinhan Bank America’s authority to extend credit to executive officers, directors and 10% shareholders, as well as entities controlled by such persons, is governed by Regulation O of the Federal Reserve Board. Regulation O generally requires such loans to be made on terms substantially similar to those offered to unaffiliated individuals (except for preferential loans made in accordance with broad based employee benefit plans), places limits on the amount of loans Shinhan Bank America may make to such persons based, in part, on Shinhan Bank America’s capital position, and requires certain approval procedures to be followed.
Standards for Safety and Soundness. FDIC regulations require that Shinhan Bank America adopt procedures and systems designed to foster safe and sound operations in the areas of internal controls, information systems, internal audit systems, loan documentation, credit underwriting, interest rate risk exposure, asset growth, asset quality, earnings and compensation, fees and benefits. Among other things, these regulations prohibit compensation and benefits and arrangements that are excessive or that could lead to a material financial loss. If Shinhan Bank America fails to meet any of these standards, it will be required to submit to the FDIC a plan specifying the steps that will be taken to cure the deficiency. If it fails to submit an acceptable plan or fails to implement the plan, the FDIC will require it to correct the deficiency and until corrected, may impose restrictions on it.
The FDIC has also adopted regulations that require Shinhan Bank America to adopt written loan policies and procedures that are consistent with safe and sound operation, are appropriate for its size, and must be reviewed by its board of directors annually. Shinhan Bank America has adopted such policies and procedures, the material provisions of which are discussed above as part of the discussion of our lending operations.
U.S. Regulation of Other U.S. Operations
In the United States, Shinhan Securities America Inc., our U.S.-registered broker-dealer subsidiary, is subject to regulations that cover all aspects of the securities business, including, sales methods, trade practices among broker-dealers, use and safekeeping of clients’ funds and securities, capital structure; record-keeping, the financing of clients’ purchases, and the conduct of directors, officers and employees.
Shinhan Securities America Inc. is regulated by a number of different government agencies and self-regulatory organizations, including the SEC and the Financial Industry Regulatory Authority (“FINRA”). Our
191
U.S. subsidiaries are also regulated by some or all of the NYSE, the Municipal Securities Rulemaking Board, the U.S. Department of the Treasury, the Federal Reserve Board and the Commodities Futures Trading Commission. In addition, the U.S. states, provinces and territories have local securities commissions that regulate and monitor activities in the interest of investor protection. These regulators have a variety of sanctions available, including the authority to conduct administrative proceedings that can result in censure, fines, the issuance of cease-and-desist orders or the suspension or expulsion of the broker-dealer or its directors, officers or employees.
FINRA is dedicated to investor protection and market integrity through effective and efficient regulation and complementary compliance and technology-based services. FINRA covers a broad spectrum of securities businesses, including, registering and educating industry participants, examining securities firms, writing rules, enforcing those rules and the federal securities laws, informing and educating the investing public, providing trade reporting and other industry utilities, and administering a dispute resolution forum for investors and registered firms. It also performs market regulation under contract for the NASDAQ Stock Market, the American Stock Exchange and the Chicago Climate Exchange.
Many of the provisions of the Dodd-Frank Act discussed above will affect the operation of Shinhan Securities America, as well as our U.S. banking operations. Again, the impact of this statute on our operations will depend on the final regulations ultimately adopted by various agencies and oversight boards in coming years.
Shinhan Bank America may be impacted by provisions of the Coronavirus Aid, Relief, and Economic Security Act, or CARES Act, or other legislation or regulations adopted in response to the COVID-19 pandemic, which may contain certain temporary regulatory forbearance measures applicable during the COVID-19 pandemic.
192
| ITEM 4.C. |
Organizational Structure |
We currently have 16 direct and 35 indirect subsidiaries. The following diagram provides an overview of our organizational structure, including our significant subsidiaries and our ownership of such subsidiaries as of the date of this annual report:
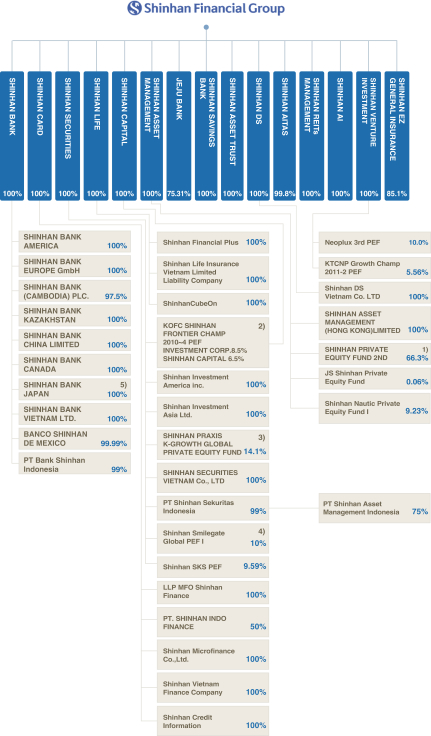
193
| 1) |
We and our subsidiaries currently own 96.74% in the aggregate. |
| 2) |
We and our subsidiaries currently own 34.6% in the aggregate. |
| 3) |
We and our subsidiaries currently own 18.9% in the aggregate. |
| 4) |
We and our subsidiaries currently own 14.21% in the aggregate. |
| 5) |
SBJ BANK own 100% in the aggregate. |
All of our subsidiaries are incorporated in Korea, except for the following:
| |
• |
|
Shinhan Bank America (incorporated in the United States); |
| |
• |
|
Shinhan Bank Canada (incorporated in Canada); |
| |
• |
|
Shinhan Bank (China) Limited (incorporated in the People’s Republic of China); |
| |
• |
|
Shinhan Bank Europe GmbH (incorporated in Germany); |
| |
• |
|
Shinhan Bank Kazakhstan Limited (incorporated in Kazakhstan); |
| |
• |
|
Shinhan Bank Japan (incorporated in Japan); |
| |
• |
|
Shinhan Bank (Cambodia) PLC (incorporated in Cambodia); |
| |
• |
|
Shinhan Bank Vietnam Ltd. (incorporated in Vietnam); |
| |
• |
|
PT Bank Shinhan Indonesia (incorporated in Indonesia); |
| |
• |
|
Banco Shinhan de Mexico (incorporated in Mexico); |
| |
• |
|
LLP MFO Shinhan Finance (incorporated in Kazakhstan); |
| |
• |
|
PT Shinhan Indo Finance (incorporated in Indonesia); |
| |
• |
|
Shinhan Microfinance Co., Ltd. (incorporated in Myanmar); |
| |
• |
|
Shinhan Vietnam Finance Company Ltd. (incorporated in Vietnam); |
| |
• |
|
Shinhan Investment America Inc. (incorporated in the United States); |
| |
• |
|
Shinhan Investment Asia Ltd. (incorporated in Hong Kong); |
| |
• |
|
Shinhan Securities Vietnam Co., Ltd. (incorporated in Vietnam); |
| |
• |
|
PT Shinhan Sekuritas Indonesia (incorporated in Indonesia); |
| |
• |
|
Shinhan Asset Management Indonesia (incorporated in Indonesia); |
| |
• |
|
Shinhan Asset Management (Hong Kong) Limited (incorporated in Hong Kong); |
| |
• |
|
Shinhan DS Vietnam Co. Limited (incorporated in Vietnam); and |
| |
• |
|
SBJ DNX (incorporated in Japan). |
The following table provides information regarding certain of our properties in Korea.
|
|
|
|
|
|
|
|
|
|
|
| |
|
|
|
Area
(In square meters) |
|
| Type of Facility |
|
Location |
|
Building |
|
|
Site (If
Different) |
|
| Registered office and corporate headquarters |
|
20, Sejong-daero 9-gil, Jung-gu, Seoul, Korea 04513 |
|
|
59,519 |
|
|
|
5,418 |
|
| Shinhan Card headquarters |
|
100, Eulji-ro, Jung-gu, Seoul, Korea 04551 |
|
|
65,774 |
|
|
|
4,634 |
|
| Shinhan Centennial Building |
|
29, Namdaemun-ro 10-gil, Jung-gu, Seoul, Korea 04540 |
|
|
19,697 |
|
|
|
1,389 |
|
194
|
|
|
|
|
|
|
|
|
|
|
| |
|
|
|
Area
(In square meters) |
|
| Type of Facility |
|
Location |
|
Building |
|
|
Site (If
Different) |
|
| Shinhan Bank Gwanggyo Branch |
|
54, Cheonggyecheon-ro, Jung-gu, Seoul, Korea 04540 |
|
|
16,727 |
|
|
|
6,783 |
|
| Shinhan Myongdong Branch |
|
43, Myeongdong-gil, Jung-gu, Seoul, Korea 04534 |
|
|
8,936 |
|
|
|
1,017 |
|
| Shinhan Youngdungpo Branch |
|
27, Yeongjung-ro, Yeoungdeungpo-gu, Seoul, Korea 07301 |
|
|
6,171 |
|
|
|
1,983 |
|
| Shinhan Back Office Support Center |
|
1311, Jungang-ro, Ilsandong-gu, Goyang-si, Gyeonggi-do, Korea 10401 |
|
|
25,238 |
|
|
|
5,856 |
|
| Shinhan Bank Back Office and Call Center |
|
251, Yeoksam-ro, Gangnam-gu, Seoul, Korea 06225 |
|
|
40,806 |
|
|
|
7,964 |
|
| Shinhan Bank Back Office and Storage Center |
|
1221, 1sunwhan-ro, Sangdang-gu, Cheongju-Si, Chungcheongbuk-do, Korea 28777 |
|
|
6,019 |
|
|
|
5,376 |
|
| Shinhan Card Yoksam-Dong Building |
|
176, Yeoksam-ro, Gangnam-gu, Seoul, Korea 06248 |
|
|
7,348 |
|
|
|
1,185 |
|
| Shinhan Data Center |
|
67, Digital Valley-ro, Suji-gu, Yongin-si, Gyeonggi-do, Korea 16878 |
|
|
45,277 |
|
|
|
9,114 |
|
Our subsidiaries own or lease various land and buildings for their branches and sales offices.
As of December 31, 2022, Shinhan Bank had a countrywide network of 721 branches. Approximately 20% of these facilities were housed in buildings owned by us, while the remaining branches were leased properties. Lease terms are generally between two to three years and generally do not exceed five years. As of December 31, 2022, Jeju Bank had 31 branches of which we own 12 of the buildings in which the facilities are located, representing 38.7% of its total branches. Lease terms are generally between one to two years and seldom exceed five years.
As of December 31, 2022, Shinhan Card had 29 branches, including its headquarters, all but three of which were leased. Lease terms are generally between one to two years. As of December 31, 2022, Shinhan Securities had a nationwide network of 80 branches of which we own five of the buildings. As of December 31, 2022, Shinhan Life Insurance had 218 branches, which we lease for a term of generally one to two years.
The net book value of all the properties owned by us on December 31, 2022 was W2,803 billion. We do not own any material properties outside of Korea.
| ITEM 4A. |
UNRESOLVED STAFF COMMENTS |
We do not have any unresolved comments from the staff of the U.S. Securities and Exchange Commission regarding our periodic reports under the Securities Exchange Act of 1934, as amended.
| ITEM 5. |
OPERATING AND FINANCIAL REVIEW AND PROSPECTS |
You should read the following discussion and analysis of our financial condition and results of operations together with our consolidated financial statements and notes thereto included in this annual report. The following discussion is based on our consolidated financial statements, which have been prepared in accordance with IFRS.
195
| ITEM 5.A. |
Operating Results |
Overview
We are one of the leading financial institutions in Korea in terms of total assets, revenues, profitability and capital adequacy, among others. Incorporated on September 1, 2001, we are the first privately-held financial holding company to be established in Korea. Since inception, we have developed and introduced a wide range of financial products and services in Korea and aimed to deliver comprehensive financial solutions to clients through a convenient one-portal network. According to reports by the Financial Supervisory Service, we are the second largest financial services provider in Korea (as measured by consolidated total assets as of December 31, 2022) and operate the second largest banking business (as measured by consolidated total bank assets as of December 31, 2022) and the largest credit card business (as measured by total credit purchase volume in 2022) in Korea.
Most of our assets are located in, and we generate most of our income from, Korea. Accordingly, our business and profitability are largely dependent on the general economic and social conditions in Korea, including interest rates, inflation, exports, personal expenditures and consumption, unemployment, demand for business products and services, debt service burden of households and businesses, the general availability of credit, the asset value of real estate and securities and other factors affecting the financial well-being of our corporate and retail customers. The Korean economy is closely integrated with, and is significantly affected by, developments in the global economy and financial markets. In recent years, the global economy and financial markets experienced adverse conditions and volatility, which also had an adverse impact on the Korean economy and in turn on our business and profitability. See “Item 3.D. Risk Factors — Risks Relating to Our Overall Business — Difficult conditions and turbulence in the Korean and global economy and financial markets may adversely affect our business, asset quality, capital adequacy and earnings.”
We derive most of our income from interest earned on our corporate and retail loans, net of funding costs (which primarily consist of interest payable on customer deposits). Net interest income is largely a function of the average volume of loans and the net interest spread thereon.
In 2021, the average volume of retail loans increased by 8.9% from 2020, primarily as a result of continued increase in home rental long-term deposit loans. In 2021, the average volume of corporate loans increased by 10.2% from 2020, primarily as a result of policies to support small and medium sized enterprises amidst the prolonged COVID-19 pandemic.
In 2022, the average volume of retail loans increased by 4.0% from 2021, primarily as a result of an increase in home mortgage loans. In 2022, the average volume of corporate loans increased by 12.1% from 2021, primarily as a result of the policies to support small- and medium-sized enterprises amidst the prolonged COVID-19 pandemic as discussed above.
From 2020 to 2021, both the average yield on interest-earning assets and the average rate on interest-bearing liabilities decreased primarily due to a decrease in the weighted average base interest from 0.71% in 2020 to 0.61% in 2021 resulting from decreases in the base interest rate set by the Bank of Korea. The average balance increased for both interest-earning assets and interest-bearing liabilities. Shinhan Bank’s net interest income increased by 11.5% from W5,928 billion in 2020 to W6,611 billion in 2021. Net interest income after provision for loan losses amounted to W5,284 billion and W6,265 billion in 2020 and 2021, respectively. Shinhan Bank’s operating income increased by 23.1% from W2,914 billion in 2020 to W3,587 billion in 2021.
From 2021 to 2022, both the average yield on interest-earning assets and the average rate on interest-bearing liabilities increased primarily as a result of the continuous rise in benchmark interest rates set by the Bank of Korea during 2022. The average balance increased for both interest-earning assets and interest-bearing liabilities. Shinhan Bank’s net interest income increased by 24.1% from W6,611 billion in 2021 to W8,205 billion in 2022. Net interest income after provision for loan losses amounted to W6,265 billion and W7,626 billion in 2021 and 2022, respectively. Shinhan Bank’s operating income increased by 16.1% from W3,587 billion in 2021 to W4,163 billion in 2022.
196
As for Shinhan Card, its operating revenue is largely dependent on transaction volume and less sensitive to interest rate movements than our banking business, since merchant fees (representing a fixed percentage of a credit card purchase amount) provide a stable source of income and our credit card business enjoys more diversified sources of funding, including commercial paper, corporate debentures (which have maturities longer than most bank deposit products) and asset-backed securitizations. The credit card transaction volume is largely dependent on the overall trends of the general Korean economy, such as general consumer spending patterns in Korea. Shinhan Card’s operating revenues increased by 6.6% from W4,091 billion in 2020 to W4,360 billion in 2021, largely due to an increase in gains on hedging items as well as a decrease in losses on hedging items resulting from the change in foreign currency exchange rates. In addition, fees and commission income increased by 9.4% from W1,479 billion in 2020 to W1,618 billion in 2021, primarily as a result of an increase in fees and commission income from lease operations and, to a lesser extent, an increase in fees income on credit cards, which was offset in part by a decrease in fees expense on credit cards. Shinhan Card’s operating revenues increased by 9.2% from W4,360 billion in 2021 to W4,760 billion in 2022, largely due to an increase in the average balance of operating leased assets resulting from the expansion of operating assets. In addition, fees and commission income increased by 8.7% from W1,618 billion in 2021 to W1,758 billion in 2022, primarily as a result of an increase in the average balance of operating leased assets resulting from the expansion of operating assets.
The following provides a discussion of the major trends surrounding the general economy and the financial services sector in Korea in 2022 and our current outlook for 2023 as they relate to our core businesses. The following discussion represents the subjective view of our management and may significantly differ from the actual results for 2023.
Trends in the Korean Economy
The global economy experienced a slowdown in growth in 2022, and despite some indications that energy supply and demand is stabilizing and the pace of inflation is slowing down in certain countries, concerns of prolonged global downturn remain. We expect continued volatility in the international financial market, as the U.S. Federal Reserve Board’s target interest rate is expected to be higher than originally estimated after the announcement of the unemployment rate and price indicators in the U.S. that exceeded market expectations. Rapidly shifting U.S. dollar exchange rate and long-term market interest rates are also contributing to increasing volatility in the market. Major factors that are expected to affect the global economy and international financial markets include rate of global inflation, changes in monetary policy in major economies, relative strength of the U.S. dollar, the recovery of the Chinese economy, and other geopolitical risks. In addition, the recent collapse of major financial institutions such as Silicon Valley Bank and Credit Suisse has caused rising preference for safer assets and has increased skepticism about the viability of additional interest rates increases by the U.S. Federal Reserve Board.
The Korean economy’s growth has slowed down in 2022, more so in comparison to some other major countries. This was largely due to slowdown in the IT sector leading to a decline in exports, and the recovery of consumption has also been sluggish. While the employment rate has remained relatively stable, its recovery from the effects of COVID-19 has been rather slow. Global economic slowdown has been negatively affecting Korea’s exports, and domestic consumption is also expected to remain sluggish primarily to due rising inflation and interest rates. Interest rate fluctuations have been inflicting particularly negative impact on private consumption, capital expenditure and investment, leading to a decrease in asset prices. In response to these market changes, the Government has been adopting various stabilizing measures, many of which are deregulatory. The Government and the Bank of Korea also implemented emergency measures in response to the corporate debt liquidity issues that occurred in the second half of 2022 in the aftermath of a default in the bonds issued by Gangwon Jungdo Development Corp. In 2023, it is expected that the Korean economy will continue its sluggish growth trend due to the global economic slowdown and rising interest rates.
While the U.S. Federal Reserve Board’s quantitative tightening will continue to pressure the Government and Bank of Korea, domestic market conditions and concerns regarding exodus of foreign capital may make it
197
difficult for the Bank of Korea to increase the base rates further in Korea. The Government is expected to prioritize price stability and to continue its tightening stance for a significant period of time, as the inflation rate is expected to remain higher than policy target levels and economic conditions remain uncertain. In February 2023, the Monetary Policy Committee of Korea announced that the base interest would remain at the current level of 3.50% after a series of raises since August 2021. Interest rate movements are uncertain and will depend, in part, on domestic and international economic conditions, employment rate, and price trends.
Recent Developments and Outlook for the Korean Financial Sector
Commercial Banking
Since the financial crisis in 2008, the asset size of Korean commercial banks has consistently grown year over year, including in 2022. Asset quality of commercial banks in Korea continued to improve, primarily as a result of Korean commercial banks’ risk management efforts and the Government-led financial support programs recently introduced in response to the COVID-19 pandemic such as loan rescheduling and principal and interest payment deferral programs. Corporate loans increased amidst such Government-led financial support programs and increases in Government expenditures and fiscal stimulus measures. Although household loans decreased as a result of the Government-led household loans management measures and increases in the base interest rate set by the Bank of Korea, net income for Korean commercial banks generally increased in 2022 compared to 2021, primarily due to relatively higher growth in corporate loan assets and improvement in net interest margin following interest rate increases.
In 2023, asset growth for commercial banks in Korea is expected to slow due to a variety of factors, including the Russia-Ukraine conflict and the subsequent economic slowdown and global inflation, volatility in the base interest rate and the continued strengthening of the Government’s policies to curb growth of household debt, including tightened regulation on mortgage as well as credit loans. In response to this market volatility and increased risk of defaults on loan payments, particularly by small- and medium-sized enterprises, Korean commercial banks have generally increased their loan loss provisions in 2022 compared to 2021. If such trend of increasing loan loss provisions continues, it may have adverse effects on Korean commercial banks’ asset quality and capacity to supply new loans. For further details, see “Item 3.D. Risk Factors — Risks Relating to Our Banking Business — We have significant exposure to small- and medium-sized enterprises, and financial difficulties experienced by such enterprises may result in a deterioration of our asset quality.”
In addition, as the demand for consumer protection in investment products increases, the banks’ organization and key performance indicators are expected to be readjusted, and fees and commission income generally is expected to decrease. Competition between banks and fintech firms is expected to further intensify due to the accelerated transition to digital and contactless financial services. The resulting competition is expected to go beyond traditional price-based competition, requiring banks to focus on recruiting talented and innovative individuals and also on offering customized products and services based on big data analysis and integrating financial services with customers’ daily life patterns in order to attract high net-worth individuals and younger customers. The Government’s policies focusing on protection of consumers and encouraging inclusive financial policies are also expected to lead to further competition among banks for relevant businesses, such as businesses to support the middle class, socially disadvantaged classes, small businesses and startups. Environmental, social, and governance (ESG) issues, as well as the opportunities and risks associated with them, are becoming increasingly important to commercial banks. We believe that strengthening risk management capabilities will become increasingly important and have a more direct impact on the financial performance of commercial banks in Korea.
Credit Cards
In 2022, the prolonged impact of COVID-19 increased uncertainty in the Korean credit card industry, and a series of challenges contributed to the market’s volatility, including increased “untact” (non-face-to-face) consumption, uncertain economic forecasts, a complex regulatory environment, and growing competition with fintech companies. Although the scale and profitability of Korean credit card businesses have generally increased
198
steadily in recent years, the potential for additional quantitative growth may be limited given the ratio of credit card payment has already reached approximately 80% of total retail consumption.
In 2023, credit card companies will need to manage emerging issues in traditional financial services business, which includes efficient financing and household debt risk management, as well as to effectively respond to increasingly stringent regulatory environments, which include lower maximum interests on loans, reduced merchant fees and tightened debt-to-service ratio regulations on financial products. The competition in credit lending is likely to further intensify with the rise of loan brokerage platforms, launch of refinancing platforms, and aggressive marketing by internet-only banks. Additionally, the role of digital platforms is expected to grow in importance as integrated financial services such as open banking and MyData have become prevalent, requiring credit card companies to develop customer-friendly digital platforms. As a result, credit card companies will need to enhance their core financial services business capabilities, while also evolving and innovating their digital business in order to satisfy the demanding needs of credit card customers.
Securities
In 2022, securities companies continued their efforts to diversify revenue sources other than traditional brokerage services, expanding into investment banking and sales and trading in an effort to reduce the impact of stock price fluctuations on the profitability of securities companies. Competition has particularly intensified as entry barriers into the securities industry is relatively low and there are a limited number of factors allowing companies to differentiate its services with other financial companies. Despite the introduction of new net capital ratio requirements in 2016, which regulate minimum equity capital requirements for each authorized business unit separately and were intended to loosen restrictions on businesses, management of traditional net capital ratios remains important as it directly affects credit rating. In addition, introducing leverage ratio regulations, for example, the application of the BIS capital adequacy ratio, is expected to give larger securities firms an advantage over their smaller competitors as larger securities firms will have larger capital buffers compared to small and medium-sized firms.
In 2023, securities companies are expected to face a difficult business environment as a result of the market uncertainty and fierce competition. Increasing volatilities in financial indices and interest rates are expected to weaken financial market sentiments, and competition with fintech companies and other securities companies is expected to intensify. The brokerage services industry is also implementing systematic changes in response to the Government’s strengthening financial consumer protection measures. Competition for expanding ICT infrastructure is expected to intensify further in order to develop future growth opportunities created by the increase in digital service users and tech-savvy young customers. As more securities companies enter the wealth management and corporate and investment banking markets, more companies are expected to combine and integrate their banking and financial investment services. Moreover, fintech companies such as KakaoPay and Toss have entered the online brokerage and asset management markets through the launch of KakaoPay Securities Corp. and Toss Securities, respectively, in February 2021, further intensifying competition within the segment. Accordingly, securities companies will need to diversify and strengthen their investment banking divisions in order to mitigate the rising volatility and consequent fluctuations in the brokerage market. Specifically, acquisition finance and structured finance have recently grown and have become a new focus for securities companies as a result of the Government’s policies to develop corporate finance industry.
Life Insurance
In 2022, the life insurance industry’s overall revenue continued to decline due to interest rate volatility, competition against tech companies who have been expanding into the life insurance market, slowing growth of the Korean economy, aging population and low birthrates.
In 2023, the life insurance industry’s overall profitability is expected to continue to decline as the factors mentioned above continue to persist, and it is expected that risk management and underwriting (risk takeover) capability will become an increasingly important factor in life insurance companies’ ability to strategically reduce business expenses. In addition, the demands for health insurance products and retirement pension
199
insurance have increased steadily, and as a result it is expected that sales channels, products, and digital-based competitiveness will become more important in the future. As the line between financial and non-financial sectors become blurry and the life insurance market matures, we expect overall growth potential for the industry to be limited and the importance of developing differentiated products and services tailored to customers’ individualized needs and expanding digital-based customer services to become increasingly important. In addition, the K-ICS will require insurance companies to apply market price valuation to their assets and liabilities in calculating capital requirement ratios in line with the new IFRS 17 accounting standards, thereby posing further challenges which may result in increased volatility for life insurance companies in Korea. See “Item 3.D. Risk Factors — Risks Related to Our Other Businesses — Prolonged periods of declining or low interest rates or changes in related accounting standards may reduce or turn negative our investment margin on savings insurance products and result in an increase in the valuation of our liabilities associated with these products.”
Specialized Credit
The specialized credit business cannot accept customer deposits and generally involves providing a combination of four types of financing: equipment and facilities leasing, installment finance, new technology finance and credit card services, and sources funding primarily by issuing debentures and commercial papers. The specialized credit business generally targets customers with higher risk profile in return for higher return compared to customers of commercial banks, which makes risk management (including customer screening) a particularly key factor for commercial success of this business.
Due, in part, to the variety of services being offered and the broad range of potential customers, specialized credit providers often find it relatively easy to develop new customer segments and provide niche offerings. In September 2015, the National Assembly of Korea passed an amendment to the Credit Finance Business Act, which, among other things, reduced entry barriers into the credit finance industry by lowering the minimum capital requirements for new entrants. Due to the relatively low barriers of entry, however, competition is intense and has further intensified as commercial banks have been offering automobile loan offerings as well as medium-interest loan products and peer-to-peer companies and lenders have been expanding their credit loan businesses as well. Although the size of the overall industry has increased primarily due to recent increases in automobile financing (installment, lease and auto loan) and investments in, and loans to, tech companies, overall profitability has declined in recent years and competition has been further intensifying.
Asset Management
In 2023, diversification of investment strategies is expected to continue due to increased difficulty in generating profits from traditional assets as a result of increased interest rate volatility and uncertainties in global markets. In particular, direct investment and demand for alternative investment opportunities, such as real estate and alternative assets, is expected grow as investors seek to offset increases in base interest rates with high-yield investment products. In addition, it is expected that interest in retirement pension-linked products will continue to grow, as will online sales. Such growth in alternative investments is expected to offer new opportunities; however, increasing market volatility due to governments’ monetary policies, prolonged impact of COVID-19 situation, stricter regulation on private equity activities and increased risk of class action suits from investors may pose additional risks.
The total amount of assets under management by Shinhan Asset Management, increased by 74.5% to W101.4 trillion as of December 31, 2022 from W58.1 trillion as of December 31, 2021. The total amount of fund assets under management increased by 75.1% to W101.4 trillion as of December 31, 2022 from W57.9 trillion as of December 31, 2021. The total amount of discretionary investment contracts increased by 95% to W43.6 trillion as of December 31, 2022 from W22.3 trillion as of December 31, 2021. Operating profit decreased by 34% to W28.6 billion in 2022 from W43.3 billion in 2021 and net profit decreased by 38.2% to W19.9 billion in 2022 from W32.2 billion in 2021 due primarily to due to the sluggish capital market.
As estimated returns on investments in the Korean market are expected to remain low due to slowing growth of the Korean economy, demand for investments in overseas markets and non-financial assets is expected to
200
increase. Demand for long-term investment products in the public fund market, such as individual annuity funds and retirement pension funds, is expected to continue to rise. Demand from investors looking to invest in ESG products is expected to continue to be strong as new ESG products are introduced into the market and gradually attract interest from retail investors.
Interest Rates
Interest rate movements, in terms of magnitude and timing as well as their relative impact on our assets and liabilities, have a significant impact on our net interest margins and profitability, particularly with respect to its financial products that are sensitive to such movements. For example, if the interest rates applicable to Shinhan Bank’s loans (which are recorded as our assets) decrease at a faster pace or by a wider margin, or increase at a slower pace or by a thinner margin, compared to the interest rates applicable to its deposits (which are recorded as our liabilities), Shinhan Bank’s net interest margin will shrink and its profitability will be negatively affected. In addition, the relative size and composition of Shinhan Bank’s variable rate loans and deposits (as compared to our fixed rate loans and deposits) may also impact Shinhan Bank’s net interest margin. Furthermore, the difference in the average repricing frequency of Shinhan Bank’s interest-earning assets (primarily loans) compared to its interest-bearing liabilities (primarily deposits) may also impact its net interest margin. For example, since Shinhan Bank’s deposits currently have a longer term, on average, than that of its loans, its deposits are on average less sensitive to movements in the base interest rates on which its deposits and loans tend to be pegged, and therefore, an increase in the base interest rates tends to increase its net interest margin while a decrease in the base interest rates tends to have the opposite effect. Since Shinhan Bank is one of our principal operating subsidiaries, its net interest margin and profitability have a substantial effect on our overall net interest margin and profitability. While we continually manage our assets and liabilities to minimize our exposure to the interest rate volatility, such efforts by us may not mitigate the impact of interest rate volatility in a timely or effective manner.
The interest rate charged to customers by our banking subsidiaries is based, in part, on the “cost of funds index,” or COFIX, which is published by the Korean Federation of Banks. COFIX is computed based on the weighted average interest of select funding products (including time deposits, housing and other installment savings deposits, repos, discounted bills and senior non-convertible financial debentures) of eight major Korean banks (comprised of Shinhan Bank, Kookmin Bank, Woori Bank, KEB Hana Bank, Nonghyup Bank, Industrial Bank of Korea, Citibank Korea and Standard Chartered Bank Korea). Each bank then independently determines the interest rate applicable to its respective customers by adding a spread to the COFIX based on the difference between the COFIX and such bank’s general funding costs, administration fees, the customer’s credit score, the maturity of the loan and other customer-specific premiums and discounts based on the customer relationship with such bank. These interest rates are typically adjusted on a monthly basis.
The following table shows certain benchmark Won-denominated borrowing interest rates as of the dates indicated.
|
|
|
|
|
|
|
|
|
|
|
|
|
|
|
|
|
|
|
|
|
|
|
|
|
| |
|
Corporate
Bond Rates(1) |
|
|
Treasury
Bond Rates(2) |
|
|
Certificate of
Deposit Rates(3) |
|
|
COFIX
Balance-
Based(4) |
|
|
New COFIX
Balance-Based(5) |
|
|
COFIX New
Borrowing-Based(6) |
|
| June 30, 2018 |
|
|
2.77 |
|
|
|
2.12 |
|
|
|
1.65 |
|
|
|
1.83 |
|
|
|
— |
|
|
|
1.82 |
|
| December 31, 2018 |
|
|
2.29 |
|
|
|
1.82 |
|
|
|
1.93 |
|
|
|
1.95 |
|
|
|
— |
|
|
|
1.96 |
|
| June 30, 2019 |
|
|
1.80 |
|
|
|
1.47 |
|
|
|
1.78 |
|
|
|
2.00 |
|
|
|
— |
|
|
|
1.85 |
|
| December 31, 2019 |
|
|
1.78 |
|
|
|
1.36 |
|
|
|
1.53 |
|
|
|
1.81 |
|
|
|
1.55 |
|
|
|
1.63 |
|
| June 30, 2020 |
|
|
1.57 |
|
|
|
0.85 |
|
|
|
0.79 |
|
|
|
1.55 |
|
|
|
1.26 |
|
|
|
1.06 |
|
| December 31, 2020 |
|
|
1.39 |
|
|
|
0.97 |
|
|
|
0.66 |
|
|
|
1.21 |
|
|
|
0.96 |
|
|
|
0.90 |
|
| June 30, 2021 |
|
|
1.81 |
|
|
|
1.45 |
|
|
|
0.67 |
|
|
|
1.02 |
|
|
|
0.81 |
|
|
|
0.82 |
|
| December 31, 2021 |
|
|
2.41 |
|
|
|
1.80 |
|
|
|
1.28 |
|
|
|
1.19 |
|
|
|
0.94 |
|
|
|
1.55 |
|
| June 30, 2022 |
|
|
4.36 |
|
|
|
3.55 |
|
|
|
2.02 |
|
|
|
1.68 |
|
|
|
1.31 |
|
|
|
1.98 |
|
| December 31, 2022 |
|
|
4.67 |
|
|
|
3.73 |
|
|
|
3.98 |
|
|
|
3.19 |
|
|
|
2.65 |
|
|
|
4.34 |
|
Source: Korea Financial Investment Association Bond Information Service
201
Notes:
| (1) |
Measured by the yield on three-year AA- rated corporate bonds. |
| (2) |
Measured by the yield on three-year treasury bonds. |
| (3) |
Measured by the yield on certificates of deposit (with maturity of 91 days). |
| (4) |
Measured based on the weighted average of the borrowing rates for the monthly ending balances of the funding made by the commercial banks that are subject of the COFIX reporting. |
| (5) |
New COFIX on Outstanding Balance (the “New COFIX”) is a new benchmark COFIX introduced since July 2019. The New COFIX also takes into account other deposits such as inter-bank time deposits and non-resident deposits and other funding sources such as subordinated bonds and convertible bonds in calculating the weighted average of the borrowing rates for the monthly ending balances of the funding made by the commercial banks that are subject of the COFIX reporting. |
| (6) |
Measured based on the weighted average of the borrowing rates for new funding for each month made by the commercial banks that are subject of the COFIX reporting. |
Average Balance Sheet and Volume and Rate Analysis
Average Balances and Related Interest
The following table shows our average balances and interest rates, as well as the net interest spread, net interest margin and asset liability ratio, for the years ended December 31, 2020, 2021 and 2022.
|
|
|
|
|
|
|
|
|
|
|
|
|
|
|
|
|
|
|
|
|
|
|
|
|
|
|
|
|
|
|
|
|
|
|
|
|
| |
|
For the Year Ended December 31, |
|
| |
|
2020 |
|
|
2021 |
|
|
2022 |
|
| |
|
Average
Balance(1) |
|
|
Interest
Income/
Expense |
|
|
Yield / Rate |
|
|
Average
Balance(1) |
|
|
Interest
Income/
Expense |
|
|
Yield / Rate |
|
|
Average
Balance(1) |
|
|
Interest
Income/
Expense |
|
|
Yield / Rate |
|
| |
|
|
|
|
|
|
|
|
|
|
|
|
|
|
|
|
|
|
|
|
|
|
|
|
|
|
|
| |
|
(In billions of Won, except percentages) |
|
| Assets: |
|
|
|
|
|
|
|
|
|
|
|
|
|
|
|
|
|
|
|
|
|
|
|
|
|
|
|
|
|
|
|
|
|
|
|
|
| Interest-earning assets |
|
|
|
|
|
|
|
|
|
|
|
|
|
|
|
|
|
|
|
|
|
|
|
|
|
|
|
|
|
|
|
|
|
|
|
|
| Due from banks(2) |
|
W |
12,099 |
|
|
W |
142 |
|
|
|
1.17 |
% |
|
W |
10,476 |
|
|
W |
87 |
|
|
|
0.83 |
% |
|
W |
12,854 |
|
|
W |
274 |
|
|
|
2.13 |
% |
| Loans(3) |
|
|
|
|
|
|
|
|
|
|
|
|
|
|
|
|
|
|
|
|
|
|
|
|
|
|
|
|
|
|
|
|
|
|
|
|
| Retail loans |
|
|
139,099 |
|
|
|
4,446 |
|
|
|
3.20 |
|
|
|
151,535 |
|
|
|
4,560 |
|
|
|
3.01 |
|
|
|
157,570 |
|
|
|
6,130 |
|
|
|
3.89 |
|
| Corporate loans |
|
|
174,937 |
|
|
|
5,272 |
|
|
|
3.01 |
|
|
|
192,743 |
|
|
|
5,331 |
|
|
|
2.77 |
|
|
|
216,119 |
|
|
|
7,989 |
|
|
|
3.70 |
|
| Securities purchased with agreements to resell |
|
|
3,751 |
|
|
|
35 |
|
|
|
0.94 |
|
|
|
3,685 |
|
|
|
31 |
|
|
|
0.85 |
|
|
|
3,669 |
|
|
|
72 |
|
|
|
1.96 |
|
| Other corporate loans |
|
|
171,186 |
|
|
|
5,237 |
|
|
|
3.06 |
|
|
|
189,058 |
|
|
|
5,300 |
|
|
|
2.80 |
|
|
|
212,450 |
|
|
|
7,917 |
|
|
|
3.73 |
|
| Public and other loans |
|
|
3,596 |
|
|
|
103 |
|
|
|
2.85 |
|
|
|
3,627 |
|
|
|
97 |
|
|
|
2.68 |
|
|
|
3,617 |
|
|
|
133 |
|
|
|
3.67 |
|
| Loans to banks |
|
|
5,597 |
|
|
|
76 |
|
|
|
1.35 |
|
|
|
6,019 |
|
|
|
46 |
|
|
|
0.76 |
|
|
|
6,097 |
|
|
|
155 |
|
|
|
2.54 |
|
| Credit card loans |
|
|
23,307 |
|
|
|
1,875 |
|
|
|
8.04 |
|
|
|
24,641 |
|
|
|
1,891 |
|
|
|
7.67 |
|
|
|
27,369 |
|
|
|
1,979 |
|
|
|
7.23 |
|
|
|
|
|
|
|
|
|
|
|
|
|
|
|
|
|
|
|
|
|
|
|
|
|
|
|
|
|
|
|
|
|
|
|
|
|
|
| Total loans |
|
|
346,536 |
|
|
|
11,772 |
|
|
|
3.40 |
|
|
|
378,565 |
|
|
|
11,925 |
|
|
|
3.15 |
|
|
|
410,772 |
|
|
|
16,386 |
|
|
|
3.99 |
|
|
|
|
|
|
|
|
|
|
|
|
|
|
|
|
|
|
|
|
|
|
|
|
|
|
|
|
|
|
|
|
|
|
|
|
|
|
| Securities(4) |
|
|
155,860 |
|
|
|
2,778 |
|
|
|
1.78 |
|
|
|
165,970 |
|
|
|
2,648 |
|
|
|
1.60 |
|
|
|
174,284 |
|
|
|
3,355 |
|
|
|
1.92 |
|
| Other interest-earning assets |
|
|
— |
|
|
|
82 |
|
|
|
— |
|
|
|
— |
|
|
|
64 |
|
|
|
— |
|
|
|
— |
|
|
|
94 |
|
|
|
— |
|
|
|
|
|
|
|
|
|
|
|
|
|
|
|
|
|
|
|
|
|
|
|
|
|
|
|
|
|
|
|
|
|
|
|
|
|
|
| Total interest-earning assets |
|
W |
514,495 |
|
|
W |
14,774 |
|
|
|
2.87 |
% |
|
W |
555,011 |
|
|
W |
14,724 |
|
|
|
2.65 |
% |
|
W |
597,910 |
|
|
W |
20,109 |
|
|
|
3.36 |
% |
|
|
|
|
|
|
|
|
|
|
|
|
|
|
|
|
|
|
|
|
|
|
|
|
|
|
|
|
|
|
|
|
|
|
|
|
|
| Non-interest-earning assets |
|
|
|
|
|
|
|
|
|
|
|
|
|
|
|
|
|
|
|
|
|
|
|
|
|
|
|
|
|
|
|
|
|
|
|
|
| Cash and due from banks |
|
W |
14,574 |
|
|
|
|
|
|
|
|
|
|
W |
17,291 |
|
|
|
|
|
|
|
|
|
|
W |
18,362 |
|
|
|
|
|
|
|
|
|
| Derivative assets |
|
|
3,892 |
|
|
|
|
|
|
|
|
|
|
|
4,073 |
|
|
|
|
|
|
|
|
|
|
|
6,137 |
|
|
|
|
|
|
|
|
|
| Property and equipment and intangible assets |
|
|
9,537 |
|
|
|
|
|
|
|
|
|
|
|
9,488 |
|
|
|
|
|
|
|
|
|
|
|
9,736 |
|
|
|
|
|
|
|
|
|
| Other non-interest-earning assets |
|
|
36,016 |
|
|
|
|
|
|
|
|
|
|
|
39,693 |
|
|
|
|
|
|
|
|
|
|
|
44,235 |
|
|
|
|
|
|
|
|
|
|
|
|
|
|
|
|
|
|
|
|
|
|
|
|
|
|
|
|
|
|
|
|
|
|
|
|
|
|
|
|
|
|
|
|
|
|
| Total non-interest-earning assets |
|
W |
64,019 |
|
|
|
|
|
|
|
|
|
|
W |
70,545 |
|
|
|
|
|
|
|
|
|
|
W |
78,470 |
|
|
|
|
|
|
|
|
|
|
|
|
|
|
|
|
|
|
|
|
|
|
|
|
|
|
|
|
|
|
|
|
|
|
|
|
|
|
|
|
|
|
|
|
|
|
| Total assets |
|
W |
578,514 |
|
|
W |
14,774 |
|
|
|
|
|
|
W |
625,556 |
|
|
W |
14,724 |
|
|
|
|
|
|
W |
676,380 |
|
|
W |
20,109 |
|
|
|
|
|
|
|
|
|
|
|
|
|
|
|
|
|
|
|
|
|
|
|
|
|
|
|
|
|
|
|
|
|
|
|
|
|
|
|
|
|
|
202
|
|
|
|
|
|
|
|
|
|
|
|
|
|
|
|
|
|
|
|
|
|
|
|
|
|
|
|
|
|
|
|
|
|
|
|
|
| |
|
For the Year Ended December 31, |
|
| |
|
2020 |
|
|
2021 |
|
|
2022 |
|
| |
|
Average
Balance(1) |
|
|
Interest
Income/
Expense |
|
|
Yield / Rate |
|
|
Average
Balance(1) |
|
|
Interest
Income/
Expense |
|
|
Yield / Rate |
|
|
Average
Balance(1) |
|
|
Interest
Income/
Expense |
|
|
Yield / Rate |
|
| |
|
|
|
|
|
|
|
|
|
|
|
|
|
|
|
|
|
|
|
|
|
|
|
|
|
|
|
| |
|
(In billions of Won, except percentages) |
|
| Liabilities: |
|
|
|
|
|
|
|
|
|
|
|
|
|
|
|
|
|
|
|
|
|
|
|
|
|
|
|
|
|
|
|
|
|
|
|
|
| Interest-bearing liabilities |
|
|
|
|
|
|
|
|
|
|
|
|
|
|
|
|
|
|
|
|
|
|
|
|
|
|
|
|
|
|
|
|
|
|
|
|
| Deposits |
|
|
|
|
|
|
|
|
|
|
|
|
|
|
|
|
|
|
|
|
|
|
|
|
|
|
|
|
|
|
|
|
|
|
|
|
| Demand deposits |
|
W |
50,751 |
|
|
W |
167 |
|
|
|
0.33 |
% |
|
W |
65,907 |
|
|
W |
209 |
|
|
|
0.32 |
% |
|
W |
68,656 |
|
|
W |
322 |
|
|
|
0.47 |
% |
| Savings deposits |
|
|
91,474 |
|
|
|
293 |
|
|
|
0.32 |
|
|
|
106,172 |
|
|
|
243 |
|
|
|
0.23 |
|
|
|
108,419 |
|
|
|
431 |
|
|
|
0.40 |
|
| Time deposits |
|
|
154,516 |
|
|
|
2,262 |
|
|
|
1.46 |
|
|
|
153,718 |
|
|
|
1,620 |
|
|
|
1.05 |
|
|
|
174,029 |
|
|
|
3,551 |
|
|
|
2.04 |
|
| Other deposits |
|
|
8,482 |
|
|
|
121 |
|
|
|
1.42 |
|
|
|
11,180 |
|
|
|
102 |
|
|
|
0.91 |
|
|
|
17,169 |
|
|
|
339 |
|
|
|
1.97 |
|
|
|
|
|
|
|
|
|
|
|
|
|
|
|
|
|
|
|
|
|
|
|
|
|
|
|
|
|
|
|
|
|
|
|
|
|
|
| Total interest-bearing deposits |
|
|
305,223 |
|
|
|
2,843 |
|
|
|
0.93 |
|
|
|
336,977 |
|
|
|
2,174 |
|
|
|
0.65 |
|
|
|
368,273 |
|
|
|
4,643 |
|
|
|
1.26 |
|
|
|
|
|
|
|
|
|
|
|
|
|
|
|
|
|
|
|
|
|
|
|
|
|
|
|
|
|
|
|
|
|
|
|
|
|
|
| Financial liabilities designated at FVTPL |
|
|
— |
|
|
|
— |
|
|
|
— |
|
|
|
— |
|
|
|
— |
|
|
|
— |
|
|
|
30 |
|
|
|
1 |
|
|
|
4.34 |
|
| Borrowings |
|
|
|
|
|
|
|
|
|
|
|
|
|
|
|
|
|
|
|
|
|
|
|
|
|
|
|
|
|
|
|
|
|
|
|
|
| Securities sold with agreements to repurchases |
|
|
10,032 |
|
|
|
71 |
|
|
|
0.71 |
|
|
|
10,905 |
|
|
|
62 |
|
|
|
0.57 |
|
|
|
10,876 |
|
|
|
208 |
|
|
|
1.91 |
|
| Other borrowings |
|
|
28,288 |
|
|
|
356 |
|
|
|
1.26 |
|
|
|
31,018 |
|
|
|
269 |
|
|
|
0.87 |
|
|
|
39,270 |
|
|
|
731 |
|
|
|
1.86 |
|
| Total interest-bearing borrowings |
|
|
38,320 |
|
|
|
427 |
|
|
|
1.11 |
|
|
|
41,923 |
|
|
|
331 |
|
|
|
0.79 |
|
|
|
50,146 |
|
|
|
939 |
|
|
|
1.87 |
|
| Debt securities issued |
|
|
74,435 |
|
|
|
1,554 |
|
|
|
2.09 |
|
|
|
77,137 |
|
|
|
1,390 |
|
|
|
1.80 |
|
|
|
80,637 |
|
|
|
1,901 |
|
|
|
2.36 |
|
| Other interest-bearing liabilities |
|
|
4,207 |
|
|
|
67 |
|
|
|
1.60 |
|
|
|
5,805 |
|
|
|
60 |
|
|
|
1.04 |
|
|
|
6,373 |
|
|
|
161 |
|
|
|
2.53 |
|
|
|
|
|
|
|
|
|
|
|
|
|
|
|
|
|
|
|
|
|
|
|
|
|
|
|
|
|
|
|
|
|
|
|
|
|
|
| Total interest-bearing liabilities |
|
W |
422,185 |
|
|
W |
4,891 |
|
|
|
1.16 |
% |
|
W |
461,842 |
|
|
W |
3,955 |
|
|
|
0.86 |
% |
|
W |
505,459 |
|
|
W |
7,645 |
|
|
|
1.51 |
% |
|
|
|
|
|
|
|
|
|
|
|
|
|
|
|
|
|
|
|
|
|
|
|
|
|
|
|
|
|
|
|
|
|
|
|
|
|
| Non-interest-bearing liabilities |
|
|
|
|
|
|
|
|
|
|
|
|
|
|
|
|
|
|
|
|
|
|
|
|
|
|
|
|
|
|
|
|
|
|
|
|
| Non-interest-bearing deposits |
|
W |
3,908 |
|
|
|
|
|
|
|
|
|
|
W |
4,818 |
|
|
|
|
|
|
|
|
|
|
W |
5,390 |
|
|
|
|
|
|
|
|
|
| Derivatives liabilities |
|
|
3,527 |
|
|
|
|
|
|
|
|
|
|
|
3,512 |
|
|
|
|
|
|
|
|
|
|
|
6,967 |
|
|
|
|
|
|
|
|
|
| Insurance liabilities |
|
|
52,682 |
|
|
|
|
|
|
|
|
|
|
|
53,847 |
|
|
|
|
|
|
|
|
|
|
|
54,567 |
|
|
|
|
|
|
|
|
|
| Other non-interest-bearing liabilities |
|
|
52,225 |
|
|
|
|
|
|
|
|
|
|
|
53,245 |
|
|
|
|
|
|
|
|
|
|
|
53,511 |
|
|
|
|
|
|
|
|
|
|
|
|
|
|
|
|
|
|
|
|
|
|
|
|
|
|
|
|
|
|
|
|
|
|
|
|
|
|
|
|
|
|
|
|
|
|
| Total non-interest-bearing liabilities |
|
W |
112,342 |
|
|
|
|
|
|
|
|
|
|
W |
115,422 |
|
|
|
|
|
|
|
|
|
|
W |
120,435 |
|
|
|
|
|
|
|
|
|
|
|
|
|
|
|
|
|
|
|
|
|
|
|
|
|
|
|
|
|
|
|
|
|
|
|
|
|
|
|
|
|
|
|
|
|
|
| Total liabilities |
|
W |
534,527 |
|
|
W |
4,891 |
|
|
|
|
|
|
W |
577,264 |
|
|
W |
3,955 |
|
|
|
|
|
|
W |
625,894 |
|
|
W |
7,645 |
|
|
|
|
|
|
|
|
|
|
|
|
|
|
|
|
|
|
|
|
|
|
|
|
|
|
|
|
|
|
|
|
|
|
|
|
|
|
|
|
|
|
| Total equity attributable to equity holder of the Group |
|
|
41,914 |
|
|
|
|
|
|
|
|
|
|
|
46,040 |
|
|
|
|
|
|
|
|
|
|
|
48,127 |
|
|
|
|
|
|
|
|
|
| Non-controlling interests |
|
|
2,073 |
|
|
|
|
|
|
|
|
|
|
|
2,252 |
|
|
|
|
|
|
|
|
|
|
|
2,359 |
|
|
|
|
|
|
|
|
|
|
|
|
|
|
|
|
|
|
|
|
|
|
|
|
|
|
|
|
|
|
|
|
|
|
|
|
|
|
|
|
|
|
|
|
|
|
| Total liabilities and equity |
|
W |
578,514 |
|
|
W |
4,891 |
|
|
|
|
|
|
W |
625,556 |
|
|
W |
3,955 |
|
|
|
|
|
|
W |
676,380 |
|
|
W |
7,645 |
|
|
|
|
|
|
|
|
|
|
|
|
|
|
|
|
|
|
|
|
|
|
|
|
|
|
|
|
|
|
|
|
|
|
|
|
|
|
|
|
|
|
| Net interest spread(5) |
|
|
|
|
|
|
|
|
|
|
1.71 |
% |
|
|
|
|
|
|
|
|
|
|
1.79 |
% |
|
|
|
|
|
|
|
|
|
|
1.85 |
% |
| Net interest margin(6) |
|
|
|
|
|
|
|
|
|
|
1.92 |
% |
|
|
|
|
|
|
|
|
|
|
1.94 |
% |
|
|
|
|
|
|
|
|
|
|
2.08 |
% |
| Average asset liability ratio(7) |
|
|
|
|
|
|
|
|
|
|
121.86 |
% |
|
|
|
|
|
|
|
|
|
|
120.17 |
% |
|
|
|
|
|
|
|
|
|
|
118.29 |
% |
Notes:
| (1) |
Average balances are based on (a) daily balances for Shinhan Bank and (b) quarterly balances for other subsidiaries. |
| (2) |
Due from banks as of December 31, 2020, 2021 and 2022, consists of due from banks at amortized cost and due from banks at fair value through profit or loss. |
| (3) |
Non-accruing loans are included in the respective average loan balances. Income on such non-accruing loans is no longer recognized from the date the loan is placed on nonaccrual status. We reclassify loans as accruing when interest (including default interest) and principal payments are current. Loans as of December 31, 2020, 2021 and 2022, consist of loans at amortized cost and loans at fair value through profit or loss. |
| (4) |
Average balance and yield on securities are based on book value. Securities as of December 31, 2020, 2021 and 2022, consist of securities at fair value through profit or loss, securities at fair value through other comprehensive income and securities at amortized cost. |
| (5) |
Represents the difference between the average rate of interest earned on interest-earning assets and the average rate of interest paid on interest-bearing liabilities. |
| (6) |
Represents the ratio of net interest income to average interest-earning assets. |
| (7) |
Represents the ratio of average interest-earning assets to average interest-bearing liabilities. |
203
Analysis of Changes in Net Interest Income — Volume and Rate Analysis
The following table provides an analysis of changes in interest income, interest expense and net interest income between changes in volume and changes in rates for (i) 2022 compared to 2021 and (ii) 2021 compared to 2020. Volume and rate variances have been calculated on the movement in average balances and the change in the interest rates on average interest-earning assets and average interest-bearing liabilities in proportion to absolute volume and rate change. The variance caused by the change in both volume and rate has been allocated in proportion to the absolute volume and rate change.
|
|
|
|
|
|
|
|
|
|
|
|
|
| |
|
From 2021 to 2022
Interest Increase (Decrease) Due to Change in |
|
| |
|
Volume |
|
|
Rate |
|
|
Change |
|
| |
|
|
|
|
|
|
|
|
|
| |
|
(In billions of Won) |
|
| Increase (decrease) in interest income |
|
|
|
|
|
|
|
|
|
|
|
|
| Due from banks |
|
W |
24 |
|
|
W |
163 |
|
|
W |
187 |
|
| Loans: |
|
|
|
|
|
|
|
|
|
|
|
|
| Retail loans |
|
|
188 |
|
|
|
1,382 |
|
|
|
1,570 |
|
| Corporate loans |
|
|
704 |
|
|
|
1,954 |
|
|
|
2,658 |
|
| Public and other loans |
|
|
— |
|
|
|
36 |
|
|
|
36 |
|
| Loans to banks |
|
|
1 |
|
|
|
108 |
|
|
|
109 |
|
| Credit card loans |
|
|
201 |
|
|
|
(113 |
) |
|
|
88 |
|
|
|
|
|
|
|
|
|
|
|
|
|
|
| Total loans |
|
|
1,094 |
|
|
|
3,367 |
|
|
|
4,461 |
|
|
|
|
|
|
|
|
|
|
|
|
|
|
| Securities |
|
|
138 |
|
|
|
569 |
|
|
|
707 |
|
| Other interest-earning assets |
|
|
— |
|
|
|
30 |
|
|
|
30 |
|
|
|
|
|
|
|
|
|
|
|
|
|
|
| Total interest income |
|
W |
1,256 |
|
|
W |
4,129 |
|
|
W |
5,385 |
|
|
|
|
|
|
|
|
|
|
|
|
|
|
| Increase (decrease) in interest expense |
|
|
|
|
|
|
|
|
|
|
|
|
| Deposits: |
|
|
|
|
|
|
|
|
|
|
|
|
| Demand deposits |
|
W |
9 |
|
|
W |
104 |
|
|
W |
113 |
|
| Savings deposits |
|
|
5 |
|
|
|
183 |
|
|
|
188 |
|
| Time deposits |
|
|
239 |
|
|
|
1,692 |
|
|
|
1,931 |
|
| Other deposits |
|
|
74 |
|
|
|
163 |
|
|
|
237 |
|
|
|
|
|
|
|
|
|
|
|
|
|
|
| Total interest-bearing deposits |
|
|
327 |
|
|
|
2,142 |
|
|
|
2,469 |
|
|
|
|
|
|
|
|
|
|
|
|
|
|
| Financial liabilities designated at FVTPL |
|
|
1 |
|
|
|
— |
|
|
|
1 |
|
| Borrowings |
|
|
76 |
|
|
|
532 |
|
|
|
608 |
|
| Debt securities issued |
|
|
66 |
|
|
|
445 |
|
|
|
511 |
|
| Other interest-bearing liabilities |
|
|
6 |
|
|
|
95 |
|
|
|
101 |
|
|
|
|
|
|
|
|
|
|
|
|
|
|
| Total interest expense |
|
|
476 |
|
|
|
3,214 |
|
|
|
3,690 |
|
|
|
|
|
|
|
|
|
|
|
|
|
|
| Net increase (decrease) in net interest income |
|
W |
780 |
|
|
W |
915 |
|
|
W |
1,695 |
|
|
|
|
|
|
|
|
|
|
|
|
|
|
204
|
|
|
|
|
|
|
|
|
|
|
|
|
| |
|
From 2020 to 2021
Interest Increase (Decrease) Due to Change in |
|
| |
|
Volume |
|
|
Rate |
|
|
Change |
|
| |
|
|
|
|
|
|
|
|
|
| |
|
(In billions of Won) |
|
| Increase (decrease) in interest income |
|
|
|
|
|
|
|
|
|
|
|
|
| Due from banks |
|
W |
(17 |
) |
|
W |
(38 |
) |
|
W |
(55 |
) |
| Loans: |
|
|
|
|
|
|
|
|
|
|
|
|
| Retail loans |
|
|
383 |
|
|
|
(269 |
) |
|
|
114 |
|
| Corporate loans |
|
|
512 |
|
|
|
(453 |
) |
|
|
59 |
|
| Public and other loans |
|
|
1 |
|
|
|
(7 |
) |
|
|
(6 |
) |
| Loans to banks |
|
|
5 |
|
|
|
(35 |
) |
|
|
(30 |
) |
| Credit card loans |
|
|
105 |
|
|
|
(89 |
) |
|
|
16 |
|
|
|
|
|
|
|
|
|
|
|
|
|
|
| Total loans |
|
|
1,006 |
|
|
|
(853 |
) |
|
|
153 |
|
|
|
|
|
|
|
|
|
|
|
|
|
|
| Securities |
|
|
173 |
|
|
|
(303 |
) |
|
|
(130 |
) |
| Other interest-earning assets |
|
|
— |
|
|
|
(18 |
) |
|
|
(18 |
) |
|
|
|
|
|
|
|
|
|
|
|
|
|
| Total interest income |
|
W |
1,162 |
|
|
W |
(1,212 |
) |
|
W |
(50 |
) |
|
|
|
|
|
|
|
|
|
|
|
|
|
| Increase (decrease) in interest expense |
|
|
|
|
|
|
|
|
|
|
|
|
| Deposits: |
|
|
|
|
|
|
|
|
|
|
|
|
| Demand deposits |
|
W |
48 |
|
|
W |
(6 |
) |
|
W |
42 |
|
| Savings deposits |
|
|
42 |
|
|
|
(92 |
) |
|
|
(50 |
) |
| Time deposits |
|
|
(12 |
) |
|
|
(630 |
) |
|
|
(642 |
) |
| Other deposits |
|
|
32 |
|
|
|
(51 |
) |
|
|
(19 |
) |
|
|
|
|
|
|
|
|
|
|
|
|
|
| Total interest-bearing deposits |
|
|
110 |
|
|
|
(779 |
) |
|
|
(669 |
) |
|
|
|
|
|
|
|
|
|
|
|
|
|
| Borrowings |
|
|
37 |
|
|
|
(133 |
) |
|
|
(96 |
) |
| Debt securities issued |
|
|
55 |
|
|
|
(219 |
) |
|
|
(164 |
) |
| Other interest-bearing liabilities |
|
|
9 |
|
|
|
(16 |
) |
|
|
(7 |
) |
|
|
|
|
|
|
|
|
|
|
|
|
|
| Total interest expense |
|
W |
211 |
|
|
W |
(1,147 |
) |
|
W |
(936 |
) |
|
|
|
|
|
|
|
|
|
|
|
|
|
| Net increase (decrease) in net interest income |
|
W |
951 |
|
|
W |
(65 |
) |
|
W |
886 |
|
|
|
|
|
|
|
|
|
|
|
|
|
|
Profitability Ratios and Other Data
|
|
|
|
|
|
|
|
|
|
|
|
|
| |
|
Year Ended December 31, |
|
| |
|
2020 |
|
|
2021 |
|
|
2022 |
|
| |
|
|
|
|
|
|
|
|
|
| |
|
(Percentages) |
|
| Net income attributable to the Group as a percentage of: |
|
|
|
|
|
|
|
|
|
|
|
|
| Average total assets(1) |
|
|
0.60 |
% |
|
|
0.66 |
% |
|
|
0.70 |
% |
| Average total Group stockholders’ equity(1) |
|
|
7.95 |
|
|
|
8.52 |
|
|
|
9.83 |
|
| Dividend payout ratio(2) |
|
|
25.42 |
|
|
|
28.28 |
|
|
|
26.4 |
|
| Net interest spread(3) |
|
|
1.71 |
|
|
|
1.80 |
|
|
|
1.85 |
|
| Net interest margin(4) |
|
|
1.92 |
|
|
|
1.94 |
|
|
|
2.08 |
|
| Efficiency ratio(5) |
|
|
89.33 |
|
|
|
86.77 |
|
|
|
88.49 |
|
| Cost-to-income ratio(6) |
|
|
45.20 |
|
|
|
45.25 |
|
|
|
45.53 |
|
| Cost-to-average assets ratio(1)(7) |
|
|
6.88 |
|
|
|
5.85 |
|
|
|
7.22 |
|
| Equity to average asset ratio(1)(8) |
|
|
7.60 |
|
|
|
7.72 |
|
|
|
7.12 |
|
Notes:
| (1) |
Average total assets (including average interest-earning assets), liabilities (including average interest-bearing liabilities) and stockholder’s equity are based on (a) daily balances for Shinhan Bank and (b) quarterly balances for other subsidiaries. |
205
| (2) |
Represents the ratio of total dividends declared on common and preferred stock and hybrid bonds as a percentage of net income attributable to the Group. |
| (3) |
Represents the difference between the yield on average interest-earning assets and the cost of average interest-bearing liabilities. |
| (4) |
Represents the ratio of net interest income to average interest-earning assets. |
| (5) |
Represents the ratio of non-interest expense to the sum of net interest income and non-interest income. Efficiency ratio is used as a measure of efficiency for banks and financial institutions. Efficiency ratio may be reconciled to comparable line items in our income statements for the periods indicated as follows: |
|
|
|
|
|
|
|
|
|
|
|
|
|
| |
|
Year Ended December 31, |
|
| |
|
2020 |
|
|
2021 |
|
|
2022 |
|
| |
|
|
|
|
|
|
|
|
|
| |
|
(In billions of Won, except percentages) |
|
| Non-interest expense (A) |
|
W |
39,788 |
|
|
W |
36,606 |
|
|
W |
48,805 |
|
|
|
|
|
| Divided by |
|
|
|
|
|
|
|
|
|
|
|
|
| The sum of net interest income and non-interest income (B) |
|
|
44,542 |
|
|
|
42,189 |
|
|
|
55,155 |
|
| Net interest income |
|
|
9,883 |
|
|
|
10,769 |
|
|
|
12,464 |
|
| Non-interest income |
|
|
34,659 |
|
|
|
31,420 |
|
|
|
42,691 |
|
| Efficiency ratio ((A) as a percentage of (B)) |
|
|
89.33 |
% |
|
|
86.77 |
% |
|
|
88.49 |
% |
| (6) |
Represents the ratio of general and administrative expenses to the operating income before general and administrative expenses and provision for credit loss allowance. |
| (7) |
Represents the ratio of non-interest expense to average total assets. |
| (8) |
Represents the ratio of average stockholders’ equity to average total assets. |
Results of Operations
2022 Compared to 2021
The following table sets forth, for the periods indicated, the principal components of our operating income.
|
|
|
|
|
|
|
|
|
|
|
|
|
| |
|
Year Ended December 31, |
|
| |
|
2021 |
|
|
2022 |
|
|
% Change |
|
| |
|
|
|
|
|
|
|
|
|
| |
|
(In billions of Won, except percentages) |
|
| Net interest income |
|
W |
10,769 |
|
|
W |
12,464 |
|
|
|
15.7 |
% |
| Net fees and commission income |
|
|
2,675 |
|
|
|
2,526 |
|
|
|
(5.6 |
) |
| Net other operating income (expense) |
|
|
(7,492 |
) |
|
|
(9,102 |
) |
|
|
21.5 |
|
|
|
|
|
|
|
|
|
|
|
|
|
|
| Operating income |
|
W |
5,952 |
|
|
W |
5,888 |
|
|
|
(1.1 |
)% |
|
|
|
|
|
|
|
|
|
|
|
|
|
206
Net Interest Income
The following table shows, for the periods indicated, the principal components of our net interest income.
|
|
|
|
|
|
|
|
|
|
|
|
|
| |
|
Year Ended December 31, |
|
| |
|
2021 |
|
|
2022 |
|
|
% Change |
|
| |
|
|
|
|
|
|
|
|
|
| |
|
(In billions of Won, except percentages) |
|
| Interest income: |
|
|
|
|
|
|
|
|
|
|
|
|
| Cash and deposits at amortized cost |
|
W |
86 |
|
|
W |
273 |
|
|
|
217.4 |
% |
| Deposits at fair value through profit or loss |
|
|
1 |
|
|
|
1 |
|
|
|
— |
|
| Securities at fair value through profit or loss |
|
|
660 |
|
|
|
871 |
|
|
|
32.0 |
|
| Securities at fair value through other comprehensive income |
|
|
896 |
|
|
|
1,209 |
|
|
|
34.9 |
|
| Securities at amortized cost |
|
|
1,092 |
|
|
|
1,275 |
|
|
|
16.8 |
|
| Loans at amortized cost |
|
|
11,890 |
|
|
|
16,317 |
|
|
|
37.2 |
|
| Loans at fair value through profit or loss |
|
|
35 |
|
|
|
69 |
|
|
|
97.1 |
|
| Others |
|
|
64 |
|
|
|
94 |
|
|
|
46.9 |
|
|
|
|
|
|
|
|
|
|
|
|
|
|
| Total interest income |
|
W |
14,724 |
|
|
W |
20,109 |
|
|
|
36.6 |
% |
|
|
|
|
|
|
|
|
|
|
|
|
|
| Interest expense: |
|
|
|
|
|
|
|
|
|
|
|
|
| Deposits |
|
W |
2,174 |
|
|
W |
4,643 |
|
|
|
113.6 |
% |
| Financial liabilities designated at FVTPL |
|
|
— |
|
|
|
1 |
|
|
|
N/M |
|
| Borrowings |
|
|
331 |
|
|
|
939 |
|
|
|
183.7 |
|
| Debt securities issued |
|
|
1,390 |
|
|
|
1,901 |
|
|
|
36.8 |
|
| Others |
|
|
60 |
|
|
|
161 |
|
|
|
168.3 |
|
|
|
|
|
|
|
|
|
|
|
|
|
|
| Total interest expense |
|
W |
3,955 |
|
|
W |
7,645 |
|
|
|
93.3 |
% |
|
|
|
|
|
|
|
|
|
|
|
|
|
| Net interest income |
|
W |
10,769 |
|
|
W |
12,464 |
|
|
|
15.7 |
% |
|
|
|
|
|
|
|
|
|
|
|
|
|
| Net interest margin(1) |
|
|
1.94 |
% |
|
|
2.08 |
% |
|
|
|
|
Note:
| (1) |
Represents the ratio of net interest income to average interest-earning assets. See “— Average Balance Sheet and Volume and Rate Analysis — Average Balances and Related Interest.” |
Interest income. Interest income increased by 36.6% to W20,109 billion in 2022 from W14,724 billion in 2021, due primarily to a 37.2% increase in interest income on loans at amortized cost to W16,317 billion in 2022 from W11,890 billion in 2021, largely as a result of an increase in the weighted average base interest rate to 2.03% in 2022 from 0.61% in 2021 resulting from increases in the base interest rate set by the Bank of Korea, as well as an increase in the average balance of loans. The average lending rate on loans increased to 3.99% in 2022 from 3.15% in 2021, principally due to an increase in average lending rates for retail loans resulting from the higher average market interest rate for 2022 compared to 2021 as discussed above. The average balance of loans at amortized cost increased by 8.5% to W410,772 billion in 2022 from W378,565 billion in 2021, principally due to increases in the average balances of retail loans and corporate loans as further described below.
More specifically, the increase in interest income was due to the following:
| |
• |
|
a 34.4% increase in interest on retail loans to W6,130 billion in 2022 from W4,560 billion in 2021, primarily due to an increase in the average lending rate for retail loans to 3.89% in 2022 from 3.01% in 2021 as well as a 4.0% increase in the average balance of retail loans to W157,570 billion in 2022 from W151,535 billion in 2021. The average lending rate for retail loans increased primarily as a result of the general increase in market interest rates largely driven by increases in the base interest rate set by the Bank of Korea in 2022 as discussed above. The base interest rate set by the Bank of Korea affects the market interest rate for certificates of deposit, which in turn largely determines our lending rates for |
207
| |
a substantial majority of the our retail loans. The average balance of retail loans increased primarily as a result of new loans placed during 2022 despite the growth rates of new loans declining in the second half of the year as compared to the same period of the previous year. |
| |
• |
|
a 49.9% increase in interest on corporate loans to W7,989 billion in 2022 from W5,331 billion in 2021, primarily due to an increase in the average lending rate for corporate loans to 3.70% in 2022 from 2.77% in 2021, as well as a 12.1% increase to the average balance of corporate loans to W216,119 billion in 2022 from W192,743 billion in 2021. The average lending rate for corporate loans increased primarily as a result of the general increase in market interest rates largely driven by the increases in the base interest rate set by the Bank of Korea in 2022 as discussed above. The average balance of corporate loans increased principally due to the policies to support small- and medium-sized enterprises amidst the prolonged COVID-19 pandemic and their efforts to secure funds. |
Interest expense. Interest expense increased by 93.3% from W3,955 billion in 2021 to W7,645 billion in 2022, due primarily to a 113.6% increase in interest expense on deposits from W2,174 billion in 2021 to W4,643 billion in 2022, as well as a 183.7% increase in interest expense on borrowings from W331 billion in 2021 to W939 billion in 2022.
The increase in interest expense on deposits was due to an increase in the average interest rate of total interest-bearing deposits from 0.65% in 2021 to 1.26% in 2022, and a 9.3% increase in the average balance of deposits from W336,977 billion in 2021 to W368,273 billion in 2022. The increase in the average rate of interest paid on deposits was mainly due to an increase in the average rate of interest paid on time deposits from 1.05% in 2021 to 2.04% in 2022 as well as an increase in the average rate of interest paid on savings deposits from 0.23% in 2021 to 0.40% in 2022. The average rate of interest paid on time deposits and savings deposits increased largely as a result of increase in the weighted average base interest rate from 0.61% in 2021 to 2.03% in 2022 resulting from increases in the base interest rate set by the Bank of Korea. The increase in the average balance of deposits was primarily due to a 13.2% increase in the average balance of time deposits, which was largely a result of an increase in benchmark interest rates during 2022 that results in an increase in deposit interest rates and, in turn, deposit amounts.
The increase in interest expense on borrowings was due primarily to an increase in the average interest rate of borrowing from 0.79% in 2021 to 1.87% in 2022, and a 19.6% increase in the average balance of borrowings from W41,923 billion in 2021 to W50,146 billion in 2022. The average interest rate of borrowings increased principally as a result of higher average market interest rates for 2022 compared to 2021 as described above.
Net interest margin. Net interest margin represents the ratio of net interest income to the average balance of interest-earning assets. Our overall net interest margin increased by 14 basis points from 1.94% in 2021 to 2.08% in 2022, largely due an increase in net interest income based on increase in the weighted average base interest rate from to 2.03% in 2022 from 0.61% in 2021 resulting from increases in the base interest rate set by the Bank of Korea, which outpaced an increase in the average volume of interest-earning assets.
Net interest spread, which represents the difference between the average rate of interest earned on interest-earning assets and the average rate of interest paid on interest-bearing liabilities, increased by 6 basis points from 1.79% in 2021 to 1.85% in 2022 due to a 65 basis point increase in the average rate of interest on interest-bearing liabilities from 0.86% in 2021 to 1.51% in 2022 and a 71 basis point increase in the average rate of interest on interest-earning assets from 2.65% in 2021 to 3.36% in 2022. The average rate of interest on interest-bearing liabilities increased primarily due to a 61 basis point increase in the average interest rate on deposits. The average rate of interest on interest-earning assets increased primarily due to an 84 basis point increase in the average interest rates on loans, which was mainly due to the increased average interest rate on corporate loans. The average rate of corporate loans increased largely as a result of the increases in the base interest rate as discussed above.
208
Fees and Commission Income (Expense), Net
The following table shows, for the periods indicated, the principal components of our net fees and commission income.
|
|
|
|
|
|
|
|
|
|
|
|
|
| |
|
Year Ended December 31, |
|
| |
|
2021 |
|
|
2022 |
|
|
% Change |
|
| |
|
|
|
|
|
|
|
|
|
| |
|
(In billions of Won, except percentages) |
|
| Fees and commission income: |
|
|
|
|
|
|
|
|
|
|
|
|
| Credit placement fees |
|
W |
71 |
|
|
W |
68 |
|
|
|
(4.2 |
)% |
| Commission received as electronic charge receipt |
|
|
149 |
|
|
|
148 |
|
|
|
(0.7 |
) |
| Brokerage fees |
|
|
577 |
|
|
|
342 |
|
|
|
(40.7 |
) |
| Commission received as agency |
|
|
147 |
|
|
|
136 |
|
|
|
(7.5 |
) |
| Investment banking fees |
|
|
189 |
|
|
|
233 |
|
|
|
23.3 |
|
| Commission received in foreign exchange activities |
|
|
272 |
|
|
|
295 |
|
|
|
8.5 |
|
| Asset management fees |
|
|
310 |
|
|
|
308 |
|
|
|
(0.6 |
) |
| Credit card fees |
|
|
1,175 |
|
|
|
1,202 |
|
|
|
2.3 |
|
| Operating lease fees |
|
|
365 |
|
|
|
478 |
|
|
|
31.0 |
|
| Others |
|
|
885 |
|
|
|
901 |
|
|
|
1.8 |
|
|
|
|
|
|
|
|
|
|
|
|
|
|
| Total fees and commission income |
|
W |
4,140 |
|
|
W |
4,111 |
|
|
|
(0.7 |
)% |
|
|
|
|
|
|
|
|
|
|
|
|
|
| Fees and commission expense: |
|
|
|
|
|
|
|
|
|
|
|
|
| Credit-related fees |
|
W |
39 |
|
|
W |
37 |
|
|
|
(5.1 |
)% |
| Credit card fees |
|
|
837 |
|
|
|
896 |
|
|
|
7.0 |
|
| Others |
|
|
589 |
|
|
|
652 |
|
|
|
10.7 |
|
|
|
|
|
|
|
|
|
|
|
|
|
|
| Total fees and commission expense |
|
W |
1,465 |
|
|
W |
1,585 |
|
|
|
8.2 |
% |
|
|
|
|
|
|
|
|
|
|
|
|
|
| Net fees and commission income |
|
W |
2,675 |
|
|
W |
2,526 |
|
|
|
(5.6 |
)% |
|
|
|
|
|
|
|
|
|
|
|
|
|
Net fees and commission income decreased by 5.6% from W2,675 billion in 2021 to W2,526 billion in 2022 primarily due to decreases in brokerage fees and an increase in credit card fee expenses, which was partially offset by an increase in operating lease fees.
Brokerage fees decreased by 40.7% from W577 billion in 2021 to W342 billion in 2022 as a result of a decrease in daily average stock trading volume resulting from the stock market slump in Korea during the current period. Fee expense on credit card increased principally due to the expansion of overseas credit card business of Shinhan Card. The decrease in net fees and commission income was partially offset by an increase in operating lease fees income resulting from an increase in the average balance of operating leased assets of Shinhan Card due to the expansion of operating leases.
209
Other Operating Income (Expense), Net
The following table shows, for the periods indicated, the principal components of our net operating expense.
|
|
|
|
|
|
|
|
|
|
|
|
|
| |
|
Year Ended December 31, |
|
| |
|
2021 |
|
|
2022 |
|
|
% Change |
|
| |
|
|
|
|
|
|
|
|
|
| |
|
(In billions of Won, except percentages) |
|
| Net insurance expenses |
|
W |
(775 |
) |
|
W |
(827 |
) |
|
|
6.7 |
% |
| Dividend income |
|
|
125 |
|
|
|
143 |
|
|
|
14.4 |
|
| Net gain (loss) on financial instruments at fair value through profit or loss |
|
|
1,104 |
|
|
|
(304 |
) |
|
|
N/M |
|
| Net gain on financial instruments at fair value through profit or loss (overlay approach) |
|
|
43 |
|
|
|
313 |
|
|
|
627.9 |
|
| Net gain (loss) on financial instruments designated at fair value through profit or loss |
|
|
(88 |
) |
|
|
577 |
|
|
|
N/M |
|
| Net foreign currency transaction gain |
|
|
223 |
|
|
|
180 |
|
|
|
(19.3 |
) |
| Net gain on disposal of financial asset at fair value through other comprehensive income |
|
|
86 |
|
|
|
(127 |
) |
|
|
N/M |
|
| Provision for credit loss allowance |
|
|
(975 |
) |
|
|
(1,292 |
) |
|
|
32.5 |
|
| General and administrative expenses |
|
|
(5,744 |
) |
|
|
(6,014 |
) |
|
|
4.7 |
|
| Other operating expenses, net |
|
|
(1,491 |
) |
|
|
(1,751 |
) |
|
|
17.4 |
|
|
|
|
|
|
|
|
|
|
|
|
|
|
| Net other operating expenses |
|
W |
(7,492 |
) |
|
W |
(9,102 |
) |
|
|
21.5 |
% |
|
|
|
|
|
|
|
|
|
|
|
|
|
N/M = not meaningful
Net other operating expenses increased by 21.5% from W7,492 billion in 2021 to W9,102 billion in 2022, primarily as a result of recognizing net loss on financial instruments at fair value through profit or loss of W304 billion in 2022 compared to net gain on financial instruments at fair value through profit or loss of W1,104 billion in 2021 and an increase in general and administrative expense by 4.7% from W5,744 billion in 2021 to W6,014 billion in 2022. Net loss on financial instruments at fair value through profit or loss was recognized primarily due to an increase in losses on sales and valuation of debt securities because of the rise in the benchmark interest rates. General and administrative expense increased primarily due to increases in salary, recruitment of new employees, management performance bonus payments and an increase in advertising expenses.
Provision for Credit Loss Allowance on Financial Assets
The following table sets forth for the periods indicated the provisions for credit loss allowance by type of financial asset.
|
|
|
|
|
|
|
|
|
|
|
|
|
| |
|
Year Ended December 31, |
|
| |
|
2021 |
|
|
2022 |
|
|
% Change |
|
| |
|
|
|
|
|
|
|
|
|
| |
|
(In billions of Won, except percentages) |
|
| Loans: |
|
|
|
|
|
|
|
|
|
|
|
|
| Retail |
|
W |
164 |
|
|
W |
425 |
|
|
|
159.1 |
% |
| Corporate |
|
|
330 |
|
|
|
248 |
|
|
|
(24.8 |
) |
| Credit card |
|
|
415 |
|
|
|
565 |
|
|
|
36.1 |
|
| Others |
|
|
(2 |
) |
|
|
6 |
|
|
|
N/M |
|
|
|
|
|
|
|
|
|
|
|
|
|
|
| Subtotal |
|
|
907 |
|
|
|
1,244 |
|
|
|
37.2 |
|
| Securities(1) |
|
|
26 |
|
|
|
(4 |
) |
|
|
N/M |
|
| Others |
|
|
42 |
|
|
|
52 |
|
|
|
23.8 |
|
|
|
|
|
|
|
|
|
|
|
|
|
|
| Total provision for credit loss allowance on financial assets |
|
W |
975 |
|
|
W |
1,292 |
|
|
|
32.5 |
% |
|
|
|
|
|
|
|
|
|
|
|
|
|
210
N/M = not meaningful
Note:
| (1) |
Consist of securities at amortized cost and securities at fair value through other comprehensive income. |
Provision for credit loss allowance increased by 32.5% from W975 billion in 2021 to W1,292 billion in 2022 principally due to a 37.2% increase in credit loss allowance on loans from W907 billion in 2021 to W1,244 billion in 2022. Our credit loss allowance for loans increased primarily due to an increase in allowance for credit losses on retail loans. Provision for credit loss allowance for retail loans increased in 2022 primarily due to a revised method in evaluating forward-looking information to estimate provision for credit loss allowance for prolonged COVID-19 and economic uncertainties (such as adding “Worst” scenario in addition to “Upside”, “Central” and “Downside” scenarios).
Income Tax Expense
Income tax expense increased by 9.9% from W1,471 billion in 2021 to W1,617 billion in 2022 primarily as a result of an increase in profit before income taxes by 13.7% to W6,349 billion in 2022 from W5,584 billion in 2021. Our effective rate of income tax decreased to 25.5% in 2022 from 26.4% in 2021.
Net Income for the Period
As a result of the foregoing, our net income for the period increased by 15.0% from W4,113 billion in 2021 to W4,732 billion in 2022.
Other Comprehensive Income (loss) for the Period
|
|
|
|
|
|
|
|
|
|
|
|
|
| |
|
Year Ended December 31, |
|
| |
|
2021 |
|
|
2022 |
|
|
% Change |
|
| |
|
|
|
|
|
|
|
|
|
| |
|
(In billions of Won, except percentages) |
|
| Items that are or may be reclassified to profit or loss: |
|
|
|
|
|
|
|
|
|
|
|
|
| Net loss on financial assets at fair value through other comprehensive income |
|
W |
(880 |
) |
|
W |
(2,448 |
) |
|
|
178.2 |
% |
| Net loss on financial instruments at fair value through profit or loss (overlay approach) |
|
|
(20 |
) |
|
|
(220 |
) |
|
|
1,000.0 |
|
| Equity in other comprehensive income (loss) of associates |
|
|
3 |
|
|
|
(16 |
) |
|
|
N/M |
|
| Foreign currency translation adjustments for foreign operations |
|
|
252 |
|
|
|
14 |
|
|
|
(94.4 |
) |
| Net change in unrealized fair value of cash flow hedges |
|
|
22 |
|
|
|
(70 |
) |
|
|
N/M |
|
| Other comprehensive loss of separate account |
|
|
(41 |
) |
|
|
(113 |
) |
|
|
175.6 |
|
|
|
|
|
|
|
|
|
|
|
|
|
|
|
|
|
(664 |
) |
|
|
(2,853 |
) |
|
|
329.7 |
|
| Items that will not be reclassified to profit or loss: |
|
|
|
|
|
|
|
|
|
|
|
|
| Remeasurements of the defined benefit liability |
|
|
43 |
|
|
|
252 |
|
|
|
486.0 |
|
| Valuation gain on financial assets at fair value through other comprehensive income |
|
|
35 |
|
|
|
5 |
|
|
|
(85.7 |
) |
| Loss on disposal of financial assets at fair value through other comprehensive income |
|
|
(29 |
) |
|
|
2 |
|
|
|
N/M |
|
| Changes in own credit risk on financial liabilities designated at fair value through profit of loss |
|
|
(3 |
) |
|
|
(4 |
) |
|
|
33.3 |
|
|
|
|
|
|
|
|
|
|
|
|
|
|
|
|
|
46 |
|
|
|
255 |
|
|
|
454.3 |
|
|
|
|
|
|
|
|
|
|
|
|
|
|
| Total other comprehensive loss, net of income tax |
|
W |
(618 |
) |
|
W |
(2,598 |
) |
|
|
320.4 |
% |
|
|
|
|
|
|
|
|
|
|
|
|
|
211
N/M = not meaningful
Other comprehensive loss increased by 320.4% from W618 billion in 2021 to W2,598 billion in 2022, primarily due to an increase in net loss on financial asset at fair value through other comprehensive income by 178.2% from W880 billion in 2021 to W2,448 billion in 2022, which was partially offset by an increase in remeasurements of defined benefit liabilities. Net loss on financial assets at fair value through other comprehensive income increased, primarily due to fluctuations in interest rates and stock prices. Remeasurements of defined benefit liabilities increased by 486.0% from W43 billion in 2021 to W252 billion in 2022, primarily due to an increase in actuarial gain resulting from changes in financial assumptions.
2021 Compared to 2020
The following table sets forth, for the periods indicated, the principal components of our operating income.
|
|
|
|
|
|
|
|
|
|
|
|
|
| |
|
Year Ended December 31, |
|
| |
|
2020 |
|
|
2021 |
|
|
% Change |
|
| |
|
|
|
|
|
|
|
|
|
| |
|
(In billions of Won, except percentages) |
|
| Net interest income |
|
W |
9,883 |
|
|
W |
10,769 |
|
|
|
9.0 |
% |
| Net fees and commission income |
|
|
2,383 |
|
|
|
2,675 |
|
|
|
12.3 |
|
| Net other operating income (expense) |
|
|
(7,336 |
) |
|
|
(7,492 |
) |
|
|
2.1 |
|
|
|
|
|
|
|
|
|
|
|
|
|
|
| Operating income |
|
W |
4,930 |
|
|
W |
5,952 |
|
|
|
20.7 |
% |
|
|
|
|
|
|
|
|
|
|
|
|
|
Net Interest Income
The following table shows, for the periods indicated, the principal components of our net interest income.
|
|
|
|
|
|
|
|
|
|
|
|
|
| |
|
Year Ended December 31, |
|
| |
|
2020 |
|
|
2021 |
|
|
% Change |
|
| |
|
|
|
|
|
|
|
|
|
| |
|
(In billions of Won, except percentages) |
|
| Interest income: |
|
|
|
|
|
|
|
|
|
|
|
|
| Cash and deposits at amortized cost |
|
W |
128 |
|
|
W |
86 |
|
|
|
(32.8 |
)% |
| Deposits at fair value through profit or loss |
|
|
14 |
|
|
|
1 |
|
|
|
(92.9 |
) |
| Securities at fair value through profit or loss |
|
|
743 |
|
|
|
660 |
|
|
|
(11.2 |
) |
| Securities at fair value through other comprehensive income |
|
|
958 |
|
|
|
896 |
|
|
|
(6.5 |
) |
| Securities at amortized cost |
|
|
1,077 |
|
|
|
1,092 |
|
|
|
1.4 |
|
| Loans at amortized cost |
|
|
11,698 |
|
|
|
11,890 |
|
|
|
1.6 |
|
| Loans at fair value through profit or loss |
|
|
74 |
|
|
|
35 |
|
|
|
(52.7 |
) |
| Others |
|
|
82 |
|
|
|
64 |
|
|
|
(22.0 |
) |
|
|
|
|
|
|
|
|
|
|
|
|
|
| Total interest income |
|
W |
14,774 |
|
|
W |
14,724 |
|
|
|
(0.3 |
)% |
|
|
|
|
|
|
|
|
|
|
|
|
|
| Interest expense: |
|
|
|
|
|
|
|
|
|
|
|
|
| Deposits |
|
W |
2,843 |
|
|
W |
2,174 |
|
|
|
(23.5 |
)% |
| Borrowings |
|
|
427 |
|
|
|
331 |
|
|
|
(22.5 |
) |
| Debt securities issued |
|
|
1,554 |
|
|
|
1,390 |
|
|
|
(10.6 |
) |
| Others |
|
|
67 |
|
|
|
60 |
|
|
|
(10.4 |
) |
|
|
|
|
|
|
|
|
|
|
|
|
|
| Total interest expense |
|
W |
4,891 |
|
|
W |
3,955 |
|
|
|
(19.1 |
)% |
|
|
|
|
|
|
|
|
|
|
|
|
|
| Net interest income |
|
W |
9,883 |
|
|
W |
10,769 |
|
|
|
9.0 |
% |
|
|
|
|
|
|
|
|
|
|
|
|
|
| Net interest margin(1) |
|
|
1.92 |
% |
|
|
1.94 |
% |
|
|
|
|
212
Note:
| (1) |
Represents the ratio of net interest income to average interest-earning assets. See “— Average Balance Sheet and Volume and Rate Analysis — Average Balances and Related Interest.” |
Interest income. Interest income decreased by 0.3% from W14,774 billion in 2020 to W14,724 billion in 2021 primarily due to a decrease in interest on securities and, to a lesser extent, a decrease in interest due from banks. Interest on securities decreased by 4.7% from W2,778 billion in 2020 to W2,648 billion in 2021 primarily as a result of decreases in the weighted average base interest rate from 0.71% in 2020 to 0.61% in 2021 resulting from decreases in the base interest rate set by the Bank of Korea, despite an increase in the average balances of securities. The average lending rate on the securities decreased to 1.60% in 2021 from 1.78% in 2020, principally due to a decrease in average lending rates for securities resulting from the lower average market interest rate for 2021 compared to 2020 as discussed above. The average balance of the securities increased by 6.5% to W165,970 billion in 2021 from W155,860 billion in 2020, principally due to increases in the average balances of government bonds. Interest due from banks decreased by 38.7% from W142 billion in 2020 to W87 billion in 2021 primarily due to a decrease in the average lending rates of due from bank.
More specifically, the decrease in interest income was due to the following:
| |
• |
|
Interest income on securities at fair value through profit or loss decreased by 11.2% from W743 billion in 2020 to W660 billion in 2021, primarily due to a decrease in the average lending rate for securities at fair value through profit or loss from 1.40% in 2020 to 1.14% in 2021, despite a 8.9% increase in the average balance of securities at fair value through profit or loss from W53,122 billion in 2020 to W57,859 billion in 2021. The average lending rate for securities at fair value through profit or loss decreased primarily as a result of decreases in the weighted average base interest rate resulting from decreases in the base interest rate set by the Bank of Korea, despite increases in the base interest rate by the Bank of Korea in August and November. The base interest rate set by the Bank of Korea greatly influences the market interest rates of financial instruments, and which determines the interest rate of our securities at fair value through profit or loss. The average balance of securities at fair value through profit or loss increased primarily as a result of an increase in the average balance of CMA assets. |
| |
• |
|
Interest income on securities at fair value through other comprehensive income decreased by 6.5% from W958 billion in 2020 to W896 billion in 2021, primarily due to a decrease in the average lending rate for securities at fair value through other comprehensive income from 1.70% in 2020 to 1.51% in 2021, despite a 5.6% increase in the average balance of securities at fair value through other comprehensive income from W56,243 billion in 2020 to W59,386 billion in 2021. The average lending rate for securities at fair value through other comprehensive income decreased primarily as a result of decreases in the weighted average base interest rate resulting from decreases in the base interest rate set by the Bank of Korea, despite increases in the base interest rate by the Bank of Korea in August and November. The average balance of securities at fair value through other comprehensive income increased principally as a result of increases in the average balances of government bonds. |
Interest expense. Interest expense decreased by 19.1% from W4,891 billion in 2020 to W3,955 billion in 2021, due primarily to a 23.5% decrease in interest expense on deposits from W2,843 billion in 2020 to W2,174 billion in 2021, as well as a 10.6% decrease in interest expense on debt securities issued from W1,554 billion in 2020 to W1,390 billion in 2021.
The decrease in interest expense on deposits was due to a decrease in the average interest rate of total interest-bearing deposits from 0.93% in 2020 to 0.65% in 2021, despite a 10.4% increase in the average balance of deposits from W305,223 billion in 2020 to W336,977 billion in 2021. The decrease in the average rate of interest paid on deposits was mainly due to a decrease in the average rate of interest paid on time deposits from 1.46% in 2020 to 1.05% in 2021 as well as a decrease in the average rate of interest paid on savings deposits from 0.32% in 2020 to 0.23% in 2021. The average rate of interest paid on time deposits and savings deposits
213
decreased largely as a result of decrease in the weighted average base interest rate from 0.71% in 2020 to 0.61% in 2021 resulting from decreases in the base interest rate set by the Bank of Korea. The increase in the average balance of deposits was primarily due to a 16.1% increase in the average balance of savings deposits, which was largely a result of policies to increase liquidity including funding supports of government and local government due to prolonged COVID-19.
The decrease in interest expense on debt securities issued was due primarily to a decrease in the average interest rate of debt securities issued from 2.09% in 2020 to 1.80% in 2021, which was partially offset by a 3.6% increase in the average balance of debt securities issued from W74,435 billion in 2020 to W77,137 billion in 2021. The average interest rate of debt securities issued decreased principally as a result of decrease in the weighted average base interest rate from 0.71% in 2020 to 0.61% in 2021 resulting from decreases in the base interest rate set by the Bank of Korea.
Net interest margin. Net interest margin represents the ratio of net interest income to the average balance of interest-earning assets. Our overall net interest margin increased by 2 basis points from 1.92% in 2020 to 1.94% in 2021, largely due to increases in the average volume of interest-earning assets, despite a decrease in the weighted average base interest rate from 0.71% in 2020 to 0.61% in 2021 resulting from decreases in the base interest rate set by the Bank of Korea.
Net interest spread, which represents the difference between the average rate of interest earned on interest-earning assets and the average rate of interest paid on interest-bearing liabilities, increased by 8 basis points from 1.71% in 2020 to 1.79% in 2021 due to a 30 basis point decrease in the average rate of interest on interest-bearing liabilities from 1.16% in 2020 to 0.86% in 2021 and a 22 basis point decrease in the average rate of interest on interest-earning assets from 2.87% in 2020 to 2.65% in 2021. The average rate of interest on interest-bearing liabilities decreased primarily due to a 28 basis point decrease in the average interest rate on deposits. The average rate of interest on interest-earning assets decreased primarily due to a 25 basis point decrease in the average interest rates on loans, which was mainly due to the reduced average interest rate on corporate loans. The average volume of interest-earning assets increased by 7.9% from W514,495 billion in 2020 to W555,011 billion in 2021 largely as a result of an increase in the volume of retail and corporate loans. The average volume of interest-bearing liabilities increased by 9.2% from W422,185 billion in 2020 to W461,842 billion in 2021 largely due to policies to increase liquidity including funding supports of government and local government due to prolonged COVID-19.
214
Fees and Commission Income (Expense), Net
The following table shows, for the periods indicated, the principal components of our net fees and commission income.
|
|
|
|
|
|
|
|
|
|
|
|
|
| |
|
Year Ended December 31, |
|
| |
|
2020 |
|
|
2021 |
|
|
% Change |
|
| |
|
|
|
|
|
|
|
|
|
| |
|
(In billions of Won, except percentages) |
|
| Fees and commission income: |
|
|
|
|
|
|
|
|
|
|
|
|
| Credit placement fees |
|
W |
95 |
|
|
W |
71 |
|
|
|
(25.3 |
)% |
| Commission received as electronic charge receipt |
|
|
143 |
|
|
|
149 |
|
|
|
4.2 |
|
| Brokerage fees |
|
|
546 |
|
|
|
577 |
|
|
|
5.7 |
|
| Commission received as agency |
|
|
145 |
|
|
|
147 |
|
|
|
1.4 |
|
| Investment banking fees |
|
|
161 |
|
|
|
189 |
|
|
|
17.4 |
|
| Commission received in foreign exchange activities |
|
|
239 |
|
|
|
272 |
|
|
|
13.8 |
|
| Asset management fees |
|
|
255 |
|
|
|
310 |
|
|
|
21.6 |
|
| Credit card fees |
|
|
1,170 |
|
|
|
1,175 |
|
|
|
0.4 |
|
| Operating lease fees |
|
|
245 |
|
|
|
365 |
|
|
|
49.0 |
|
| Others |
|
|
815 |
|
|
|
885 |
|
|
|
8.6 |
|
|
|
|
|
|
|
|
|
|
|
|
|
|
| Total fees and commission income |
|
W |
3,814 |
|
|
W |
4,140 |
|
|
|
8.5 |
% |
|
|
|
|
|
|
|
|
|
|
|
|
|
| Fees and commission expense: |
|
|
|
|
|
|
|
|
|
|
|
|
| Credit-related fees |
|
W |
46 |
|
|
W |
39 |
|
|
|
(15.2 |
)% |
| Credit card fees |
|
|
849 |
|
|
|
837 |
|
|
|
(1.4 |
) |
| Others |
|
|
536 |
|
|
|
589 |
|
|
|
9.9 |
|
|
|
|
|
|
|
|
|
|
|
|
|
|
| Total fees and commission expense |
|
W |
1,431 |
|
|
W |
1,465 |
|
|
|
2.4 |
% |
|
|
|
|
|
|
|
|
|
|
|
|
|
| Net fees and commission income |
|
W |
2,383 |
|
|
W |
2,675 |
|
|
|
12.3 |
% |
|
|
|
|
|
|
|
|
|
|
|
|
|
Net fees and commission income increased by 12.3% from W2,383 billion in 2020 to W2,675 billion in 2021 primarily due to increases in operating lease fees income, asset management fees income, commission received in foreign exchange activities, brokerage fees income, which was partially offset by a decrease in credit placement fees income.
Operating lease fees income increased by 49.0% from W245 billion in 2020 to W365 billion in 2021 primarily due to the expansion of operations, such as purchasing operating assets including leases classified as operating leases. Asset management fees income increased by 21.6% from W255 billion in 2020 to W310 billion in 2021, primarily due to an increases in management fees received from real estate related trust accounts of Asia Trust Co., Ltd. and an increase in both money market trust and pension trust of Shinhan Bank. Commission received in foreign exchange activities increased by 13.8% from W239 billion in 2020 to W272 billion in 2021, largely due to an increase in fees and commission income of Shinhan Securities resulting from an increase in overseas stock transactions due to the increase in interest in overseas stocks. Brokerage fees income increased by 5.7% from W546 billion in 2020 to W577 billion in 2021 primarily due to an increase in daily average stock trading volume resulting from the booming stock market in Korea during the current period.
215
Other Operating Income (Expense), Net
The following table shows, for the periods indicated, the principal components of our net operating expense.
|
|
|
|
|
|
|
|
|
|
|
|
|
| |
|
Year Ended December 31, |
|
| |
|
2020 |
|
|
2021 |
|
|
% Change |
|
| |
|
|
|
|
|
|
|
|
|
| |
|
(In billions of Won, except percentages) |
|
| Net insurance expenses |
|
W |
(604 |
) |
|
W |
(775 |
) |
|
|
28.3 |
% |
| Dividend income |
|
|
98 |
|
|
|
125 |
|
|
|
27.6 |
|
| Net gain on financial instruments at fair value through profit or loss |
|
|
273 |
|
|
|
1,104 |
|
|
|
304.4 |
|
| Net gain (loss) on financial instruments at fair value through profit or loss (overlay approach) |
|
|
(136 |
) |
|
|
43 |
|
|
|
N/M |
|
| Net gain (loss) on financial instruments designated at fair value through profit or loss |
|
|
198 |
|
|
|
(88 |
) |
|
|
N/M |
|
| Net foreign currency transaction gain |
|
|
527 |
|
|
|
223 |
|
|
|
(57.7 |
) |
| Net gain on disposal of financial asset at fair value through other comprehensive income |
|
|
274 |
|
|
|
86 |
|
|
|
(68.6 |
) |
| Provision for credit loss allowance |
|
|
(1,382 |
) |
|
|
(975 |
) |
|
|
(29.5 |
) |
| General and administrative expenses |
|
|
(5,213 |
) |
|
|
(5,744 |
) |
|
|
10.2 |
|
| Other operating expenses, net |
|
|
(1,371 |
) |
|
|
(1,491 |
) |
|
|
8.8 |
|
|
|
|
|
|
|
|
|
|
|
|
|
|
| Net other operating expenses |
|
W |
(7,336 |
) |
|
W |
(7,492 |
) |
|
|
2.1 |
% |
|
|
|
|
|
|
|
|
|
|
|
|
|
N/M = not meaningful
Net other operating expenses increased by 2.1% from W7,336 billion in 2020 to W7,492 billion in 2021, primarily due to an increase in general and administrative expense by 10.2% from W5,213 billion in 2020 to W5,744 billion in 2021 and a decrease in net foreign currency transaction gain by 57.7% from W527 billion in 2020 to W223 billion in 2021. Also, we recognized net loss on financial instruments designated at fair value through profit or loss of W88 billion in 2021 compared to net gain on financial instruments designated at fair value through profit or loss of W198 billion in 2020. The increase in net other operating expenses was partially offset by a 304.4% increase in net gain on financial instruments at fair value through profit or loss of from W273 billion in 2020 to W1,104 billion in 2021.
Provision for Credit Loss Allowance on Financial Assets
The following table sets forth for the periods indicated the provisions for credit loss allowance by type of financial asset.
|
|
|
|
|
|
|
|
|
|
|
|
|
| |
|
Year Ended December 31, |
|
| |
|
2020 |
|
|
2021 |
|
|
% Change |
|
| |
|
|
|
|
|
|
|
|
|
| |
|
(In billions of Won, except percentages) |
|
| Loans: |
|
|
|
|
|
|
|
|
|
|
|
|
| Retail |
|
W |
200 |
|
|
W |
164 |
|
|
|
(18.0 |
)% |
| Corporate |
|
|
626 |
|
|
|
330 |
|
|
|
(47.3 |
) |
| Credit card |
|
|
452 |
|
|
|
415 |
|
|
|
(8.2 |
) |
| Others |
|
|
13 |
|
|
|
(2 |
) |
|
|
N/M |
|
|
|
|
|
|
|
|
|
|
|
|
|
|
| Subtotal |
|
|
1,291 |
|
|
|
907 |
|
|
|
(29.7 |
) |
| Securities(1) |
|
|
5 |
|
|
|
26 |
|
|
|
420.0 |
|
| Others |
|
|
86 |
|
|
|
42 |
|
|
|
(51.2 |
) |
|
|
|
|
|
|
|
|
|
|
|
|
|
| Total provision for credit loss allowance on financial assets |
|
W |
1,382 |
|
|
W |
975 |
|
|
|
(29.5 |
)% |
|
|
|
|
|
|
|
|
|
|
|
|
|
N/M = not meaningful
216
Note:
| (1) |
Consist of securities at amortized cost and securities at fair value through other comprehensive income. |
Provision for credit loss allowance decreased by 29.5% from W1,382 billion in 2020 to W975 billion in 2021 principally due to a 29.7% decrease in credit loss allowance on loans from W1,291 billion in 2020 to W907 billion in 2021. Our credit loss allowance for loans decreased primarily due to a decrease in allowance for credit losses on corporate loans. Provision for credit loss allowance for corporate loans remained relatively low in 2021 primarily due to a significant increase in provision for credit loss allowance in 2020 mainly as the Group re-estimated the probability of default reflecting forward-looking information and increased the number of borrowers subject to individual assessment of probability of default as part of the Group’s proactive measures in responding to changes in the financial environment, such as the spread of COVID-19, as well as a decrease in the proportion of unsecured corporate loans which are generally subject to higher loss given default rates compared to secured corporate loans. Provision for credit loss allowance for others decreased mainly due to a decrease in the aggregate amount of lines of unutilized credit resulting from a decrease in the volume of retail loans.
Income Tax Expense
Income tax expense increased by 17.1% from W1,256 billion in 2020 to W1,471 billion in 2021 primarily as a result of an increase in profit before income taxes by 17.5% to W5,584 billion in 2021 from W4,754 billion in 2020. There was no change in our effective rate of income tax of 26.4% in 2021 compared to 2020.
Net Income for the Period
As a result of the foregoing, our net income for the period increased by 17.6% from W3,498 billion in 2020 to W4,113 billion in 2021.
Other Comprehensive Income (loss) for the Period
|
|
|
|
|
|
|
|
|
|
|
|
|
| |
|
Year Ended December 31, |
|
| |
|
2020 |
|
|
2021 |
|
|
% Change |
|
| |
|
|
|
|
|
|
|
|
|
| |
|
(In billions of Won, except percentages) |
|
| Items that are or may be reclassified to profit or loss: |
|
|
|
|
|
|
|
|
|
|
|
|
| Net loss on financial assets at fair value through other comprehensive income |
|
W |
(87 |
) |
|
W |
(880 |
) |
|
|
911.5 |
% |
| Net gain (loss) on financial instruments at fair value through profit or loss (overlay approach) |
|
|
90 |
|
|
|
(20 |
) |
|
|
N/M |
|
| Equity in other comprehensive income (loss) of associates |
|
|
(3 |
) |
|
|
3 |
|
|
|
N/M |
|
| Foreign currency translation adjustments for foreign operations |
|
|
(162 |
) |
|
|
252 |
|
|
|
N/M |
|
| Net change in unrealized fair value of cash flow hedges |
|
|
(14 |
) |
|
|
22 |
|
|
|
N/M |
|
| Other comprehensive income (loss) of separate account |
|
|
4 |
|
|
|
(41 |
) |
|
|
N/M |
|
|
|
|
|
|
|
|
|
|
|
|
|
|
|
|
|
(172 |
) |
|
|
(664 |
) |
|
|
286.0 |
|
| Items that will not be reclassified to profit or loss: |
|
|
|
|
|
|
|
|
|
|
|
|
| Remeasurements of the defined benefit liability |
|
|
16 |
|
|
|
43 |
|
|
|
168.8 |
|
| Valuation gain on financial assets at fair value through other comprehensive income |
|
|
7 |
|
|
|
35 |
|
|
|
400.0 |
|
| Loss on disposal of financial assets at fair value through other comprehensive income |
|
|
(28 |
) |
|
|
(29 |
) |
|
|
3.6 |
|
| Changes in own credit risk on financial liabilities designated at fair value through profit of loss |
|
|
3 |
|
|
|
(3 |
) |
|
|
N/M |
|
|
|
|
|
|
|
|
|
|
|
|
|
|
|
|
|
(2 |
) |
|
|
46 |
|
|
|
N/M |
|
|
|
|
|
|
|
|
|
|
|
|
|
|
| Total other comprehensive loss, net of income tax |
|
W |
(174 |
) |
|
W |
(618 |
) |
|
|
255.2 |
% |
|
|
|
|
|
|
|
|
|
|
|
|
|
N/M = not meaningful
217
Other comprehensive loss increased by 255.2% from W174 billion in 2020 to W618 billion in 2021, primarily due to an increase in net loss on financial asset at fair value through other comprehensive income by 911.5% from W87 billion in 2020 to W880 billion in 2021, which was partially offset as we recognized gain on foreign currency translation adjustments for foreign operations of W 252 billion in 2021 compared to loss on foreign currency translation adjustments for foreign operations of W162 billion in 2020. Net loss on financial assets at fair value through other comprehensive income increased, primarily due to fluctuations in interest rates and stock prices. We recognized gain on foreign currency translation adjustments for foreign operations of W252 billion in 2021 compared to loss on foreign currency translation adjustments for foreign operations of W162 billion in 2020, primarily due to an increase in foreign currency exchange rates amid weaker valuation of the Won.
Results by Principal Business Segment
As of December 31, 2022, we were organized into six major business segments as follows:
| |
• |
|
commercial banking services, which are principally provided by Shinhan Bank: |
| |
• |
|
credit card services, which are principally provided by Shinhan Card; |
| |
• |
|
securities brokerage services, which are provided by Shinhan Securities; |
| |
• |
|
life insurance services, which are provided by Shinhan Life Insurance; |
| |
• |
|
specialized credit services, which are provided by Shinhan Capital; and |
| |
• |
|
other services that do not belong to above business segments. |
We report our segment information in accordance with the provisions of IFRS 8 (Operating Segments). We categorize our operating segments according to a business based approach. See Note 7 of the notes to our consolidated financial statements included in this annual report.
Operating Income by Principal Business Segment
The table below provides the income statement data for our principal business segments for the periods indicated.
|
|
|
|
|
|
|
|
|
|
|
|
|
|
|
|
|
|
|
|
|
| |
|
Year Ended December 31, |
|
|
% Change |
|
| |
|
2020 |
|
|
2021 |
|
|
2022 |
|
|
2020/2021 |
|
|
2021/2022 |
|
| |
|
|
|
|
|
|
|
|
|
|
|
|
|
|
|
| |
|
(In billions of Won, except percentages) |
|
| Banking |
|
W |
2,802 |
|
|
W |
3,478 |
|
|
W |
4,060 |
|
|
|
24.1 |
% |
|
|
16.7 |
% |
| Credit card |
|
|
887 |
|
|
|
1,021 |
|
|
|
880 |
|
|
|
15.1 |
|
|
|
(13.8 |
) |
| Securities |
|
|
373 |
|
|
|
577 |
|
|
|
121 |
|
|
|
54.7 |
|
|
|
(79.0 |
) |
| Life insurance |
|
|
568 |
|
|
|
552 |
|
|
|
614 |
|
|
|
(2.8 |
) |
|
|
11.2 |
|
| Specialized credit |
|
|
179 |
|
|
|
341 |
|
|
|
349 |
|
|
|
90.5 |
|
|
|
2.3 |
|
| Others |
|
|
158 |
|
|
|
260 |
|
|
|
163 |
|
|
|
64.6 |
|
|
|
(37.3 |
) |
| Consolidation adjustment(1) |
|
|
(37 |
) |
|
|
(277 |
) |
|
|
(299 |
) |
|
|
648.6 |
|
|
|
7.9 |
|
|
|
|
|
|
|
|
|
|
|
|
|
|
|
|
|
|
|
|
|
|
| Total operating income |
|
W |
4,930 |
|
|
W |
5,952 |
|
|
W |
5,888 |
|
|
|
20.7 |
% |
|
|
(1.1 |
)% |
|
|
|
|
|
|
|
|
|
|
|
|
|
|
|
|
|
|
|
|
|
N/M = not meaningful
Note:
| (1) |
Consolidation adjustment consists of adjustments for inter-segment transactions. |
218
Banking Services
The banking services segment offers commercial banking and related services and includes: (i) retail banking, which consists of banking and other services provided primarily through the retail branches of Shinhan Bank and Jeju Bank to individuals and households; (ii) corporate banking, which consists of corporate banking products and services provided through Shinhan Bank’s corporate banking branches to its corporate customers, most of which are small- and medium-sized enterprises and large corporations, including members of the chaebol groups; (iii) international banking, which primarily consists of the operations of Shinhan Bank’s overseas subsidiaries and branches; and (iv) other banking, which primarily consists of treasury business for our banking business (including internal asset and liability management and other non-deposit funding activities), securities investing and trading and derivatives trading, as well as administration of our overall banking operations.
The table below provides the income statement data for our banking services segment for the periods indicated.
|
|
|
|
|
|
|
|
|
|
|
|
|
|
|
|
|
|
|
|
|
| |
|
Year Ended December 31, |
|
|
% Change |
|
| |
|
2020 |
|
|
2021 |
|
|
2022 |
|
|
2020/2021 |
|
|
2021/2022 |
|
| |
|
|
|
|
|
|
|
|
|
|
|
|
|
|
|
| |
|
(In billions of Won, except percentages) |
|
| Income statement data |
|
|
|
|
| Net interest income (expense) |
|
W |
6,038 |
|
|
W |
6,738 |
|
|
W |
8,359 |
|
|
|
11.6 |
% |
|
|
24.1 |
% |
| Net fees and commission income (expense) |
|
|
822 |
|
|
|
818 |
|
|
|
801 |
|
|
|
(0.5 |
) |
|
|
(2.1 |
) |
| Net other income (expense) |
|
|
(4,058 |
) |
|
|
(4,078 |
) |
|
|
(5,100 |
) |
|
|
0.5 |
|
|
|
25.1 |
|
|
|
|
|
|
|
|
|
|
|
|
|
|
|
|
|
|
|
|
|
|
| Operating income (expense) |
|
W |
2,802 |
|
|
W |
3,478 |
|
|
W |
4,060 |
|
|
|
24.1 |
% |
|
|
16.7 |
% |
|
|
|
|
|
|
|
|
|
|
|
|
|
|
|
|
|
|
|
|
|
Comparison of 2022 to 2021
Operating income for banking services increased by 16.7% from W3,478 billion in 2021 to W4,060 billion in 2022.
Net interest income increased by 24.1% from W6,738 billion in 2021 to W8,359 billion in 2022 primarily due to increases in net interest income for retail banking and corporate banking services. More specifically:
| |
• |
|
Net interest income for retail banking increased by 68.9% from W2,799 billion in 2021 to W4,727 billion in 2022 primarily due to an increase in the average volume of retail loans to W157,570 billion in 2022 from W151,535 billion in 2021 as well as an increase in net interest margin. The average volume of retail loans increased largely due to an increase in home mortgage loans. The increase in our net interest margin was largely due to an increase in the weighted average base interest rate to 2.03% in 2022 from 0.61% in 2021 resulting from increases in the base interest rate set by the Bank of Korea. |
| |
• |
|
Net interest income for corporate banking increased by 36.0% from W2,515 billion in 2021 to W3,421 billion in 2022 primarily due to a 12.4% increase in the average balance of corporate loans to W187,318 billion in 2022 from W166,696 billion in 2021, as well as an increase in the average lending rate for corporate loans to 3.50% in 2022 from 2.55% in 2021. The average volume of corporate loans increased largely as a result of the policies to support small- and medium-sized enterprises amidst the prolonged COVID-19 pandemic as discussed above. The average lending rate for corporate loans increased primarily as a result of the general increase in market interest rates largely driven by the increases in the base interest rate by the Bank of Korea in 2022 as discussed above. |
| |
• |
|
Net interest income for international banking increased by 22.9% from W865 billion in 2021 to W1,063 billion in 2022 primarily due to an increase in the average balance of loans extended by our overseas subsidiaries, especially in Japan and Vietnam and the strengthening of the Vietnamese Dong against the Korean Won. |
219
| |
• |
|
For other banking, net interest expense was W852 billion in 2022 compared to net interest income of W559 billion in 2021, primarily due to an increase in interest expenses related to the borrowings and the debt securities issued. |
Net fees and commission income decreased by 2.1% from W818 billion in 2021 to W801 billion in 2022 primarily due to an increase in net fees and commissions for retail banking services, which was offset in part by an increase in net fees and commissions for other banking services. Net fees and commissions for retail banking services decreased despite an increase in the overall volume of transactions, primarily due to an increase in the proportion of online banking transactions, for which the Bank generally charges lower fees and commissions. Net fees and commission income for other banking increased primarily due to an increase in commission received as electronic charge receipt regarding the retirement pensions.
Net other expense increased by 25.1% from W4,078 billion in 2021 to W5,100 billion in 2022 primarily due to an increase in net other expense for other banking and retail banking services. Net other expense for other banking services increased mainly due to an increase in advertising expenses from a new platform business, a delivery app. The increase in net other expense for retail banking services was principally due to a decrease in net income related to specified money trust of individual customers.
Comparison of 2021 to 2020
Operating income for banking services increased by 24.1% from W2,802 billion in 2020 to W3,478 billion in 2021.
Net interest income increased by 11.6% from W6,038 billion in 2020 to W6,738 billion in 2021 primarily due to increases in net interest income for retail banking and corporate banking services. More specifically:
| |
• |
|
Net interest income for retail banking increased by 15.2% from W2,429 billion in 2020 to W2,799 billion in 2021 primarily due to an increase in Shinhan Bank’s net interest margin. The increase in our net interest margin was largely due to an increase in the average volume of retail loans as well as an increase in our net interest margin. The average volume of retail loans increased largely due to an increase in home mortgage loans. The increase in the Shinhan Bank’s net interest margin was largely due to the increase in average volume of interest-earning assets as described above outpacing the decrease in yield rate of interest-earning assets. |
| |
• |
|
Net interest income for corporate banking increased by 9.6% from W2,295 billion in 2020 to W2,515 billion in 2021 primarily due to increase in the average balance of corporate loans, notwithstanding a decrease in the average lending rate for corporate loans as discussed above. The average volume of corporate loans increased largely as a result of policies to support small and medium sized enterprises amidst the prolonged COVID-19 pandemic as discussed above. |
| |
• |
|
Net interest income for international banking increased by 11.9% from W773 billion in 2020 to W865 billion in 2021 primarily due to an increase in the average balance of loans extended by the Shinhan Bank’s overseas subsidiaries, especially in China and Vietnam. |
| |
• |
|
Net interest income for other banking services increased by 3.3% from W541 billion in 2020 to W559 billion in 2021, primarily due to an increase in interest income on securities by the Securities Management department of Shinhan Bank. |
Net fees and commission income decreased by 0.5% from W822 billion in 2020 to W818 billion in 2021 primarily due to a decrease in net fees and commissions for retail banking services, which was offset in part by an increase in net fees and commissions for corporate banking services. Net fees and commissions for retail banking services decreased principally as the Shinhan Bank generally charges lower fees and commissions, despite an increase in the proportion of online banking transactions. The increase in net fees and commissions for corporate banking services was mainly due to an increase in brokerage fees.
220
Net other expense increased by 0.5% from W4,058 billion in 2020 to W4,078 billion in 2021 primarily due to an increase in net other expense for others banking services, which was partially offset by a decrease in net other expense for corporate banking services. Net other expense for other banking services increased mainly due to a decrease in net foreign currency transaction gain. The decrease in net other expense for corporate banking services was principally due to an increase in gains on sale and valuation of equity securities at fair value through profit or loss.
Credit Card Services
The credit card services segment consists of the credit card business of Shinhan Card, including its installment finance and automobile leasing businesses.
|
|
|
|
|
|
|
|
|
|
|
|
|
|
|
|
|
|
|
|
|
| |
|
Year Ended December 31, |
|
|
% Change |
|
| |
|
2020 |
|
|
2021 |
|
|
2022 |
|
|
2020/2021 |
|
|
2021/2022 |
|
| |
|
|
|
|
|
|
|
|
|
|
|
|
|
|
|
| |
|
(In billions of Won, except percentages) |
|
| Income statement data |
|
|
|
|
|
|
|
|
|
|
|
|
|
|
|
|
|
|
|
|
| Net interest income (expense) |
|
W |
1,755 |
|
|
W |
1,799 |
|
|
W |
1,798 |
|
|
|
2.5 |
% |
|
|
(0.1 |
)% |
| Net fees and commission income (expense) |
|
|
483 |
|
|
|
635 |
|
|
|
702 |
|
|
|
31.5 |
|
|
|
10.6 |
|
| Net other income (expense) |
|
|
(1,351 |
) |
|
|
(1,413 |
) |
|
|
(1,620 |
) |
|
|
4.6 |
|
|
|
14.6 |
|
|
|
|
|
|
|
|
|
|
|
|
|
|
|
|
|
|
|
|
|
|
| Operating income (expense) |
|
W |
887 |
|
|
W |
1,021 |
|
|
W |
880 |
|
|
|
15.1 |
% |
|
|
(13.8 |
)% |
|
|
|
|
|
|
|
|
|
|
|
|
|
|
|
|
|
|
|
|
|
Comparison of 2022 to 2021
Operating income for the credit card business decreased by 13.8% from W1,021 billion in 2021 to W880 billion in 2022.
Net interest income decreased by 0.1% from W1,799 billion in 2021 to W1,798 billion in 2022 primarily due to an increase in interest expenses on debt securities issued and borrowings. The increase in interest expenses on debt securities issued was mainly attributable to the rising interest rates as compared to the prior year, and interest expense on borrowings increased primarily due to an increase in issuances of money-market securities, particularly commercial paper. The decrease in net interest income was partially offset by an increase in interest income on loans at amortized cost including credit card loans, resulting from the increase in loans due to the business expansion and a decrease in early prepayment of credit card loans.
Net fees and commission income increased by 10.6% from W635 billion in 2021 to W702 billion in 2022 primarily as a result of an increase in fees and commission income from lease operations and, to a lesser extent, an increase in fees income on credit cards. Fees and commission income from lease operations were primarily due an increase in the average balance of operating leased assets resulting from the expansion of operating assets. The increase in fees income on credit cards was mainly due to increases in credit card usage resulting from an increase in the number of credit card members. The increase in net fees and commission income was partially offset by an increase in fee expense on credit cards. Fee expense on credit cards increased principally due to the expansion of overseas credit card business.
Net other expense increased by 14.6% from W1,413 billion in 2021 to W1,620 billion in 2022, primarily due to an increase in bad debt expenses resulting from high delinquency roll rate and, to a lesser extent, an increase in other operating losses resulting from increases in loss on hedging items and depreciation expenses on lease assets. Such increases in net other expense were offset by an increase in gains on valuation and sale of financial instruments at fair value through profit or loss, and a decrease in termination benefits.
221
Comparison of 2021 to 2020
Operating income for the credit card business increased by 15.1% from W887 billion in 2020 to W1,021 billion in 2021.
Net interest income increased by 2.5% from W1,755 billion in 2020 to W1,799 billion in 2021 primarily due to an increase in interest income on loans measured at amortized cost and a decrease in interest expense on debt securities issued. Interest income on loans at amortized cost increased principally due to an increase in interest income on loans resulting from our acquisition of assets of Shinhan Capital and, to a lesser extent, an increase in interest income on credit card loans. The decrease in interest expense on debt securities issued was mainly attributable to a decreased interest expense resulting from amortization of discount on asset-backed securities. The increase in net interest income was partially offset by an increase in interest expense on borrowings. Interest expense on borrowings increased primarily due to an increase in issuances of money-market securities, particularly commercial paper.
Net fees and commission income increased by 31.5% from W483 billion in 2020 to W635 billion in 2021 primarily as a result of an increase in fees and commission income from lease operations and, to a lesser extent, an increase in fees income on credit cards and a decrease in fees expense on credit cards. Fees and commission income from lease operations were primarily due an increase in the average balance of operating leased assets resulting from an expansion of operating assets. The increase in fees income on credit cards was mainly due to an overall increase in assets associated with credit cards. Fees expense on credit cards decreased principally due to lower fees expense on credit card recruitments resulting from the recruitment channels diversified, focusing on online recruitment.
Net other expense increased by 4.6% from W1,351 billion in 2020 to W1,413 billion in 2021, primarily due to net loss on foreign currency transaction came to W188 billion in 2021 resulting from an increase in foreign currency exchange rates amid weaker valuation of the Won, compared to net gain on foreign currency transaction of W159 billion in 2020. Such change was offset by an increase in gains on hedging items as well as a decrease in losses on hedging items resulting from the change in foreign currency exchange rates. The increase in net other operating expense was enhanced by an increase in general and administrative expenses increased mainly as a result of the voluntary retirement implemented during 2021, and an increase in advertising expenses resulting from the launch of new product services.
Securities Brokerage Services
Securities brokerage services segment primarily reflects securities brokerage and dealing services on behalf of customers, which is conducted by Shinhan Securities, our principal securities brokerage subsidiary.
|
|
|
|
|
|
|
|
|
|
|
|
|
|
|
|
|
|
|
|
|
| |
|
Year Ended December 31, |
|
|
% Change |
|
| |
|
2020 |
|
|
2021 |
|
|
2022 |
|
|
2020/2021 |
|
|
2021/2022 |
|
| |
|
|
|
|
|
|
|
|
|
|
|
|
|
|
|
| |
|
(In billions of Won, except percentages) |
|
| Income statement data |
|
|
|
|
|
|
|
|
|
|
|
|
|
|
|
|
|
|
|
|
| Net interest income (expense) |
|
W |
517 |
|
|
W |
517 |
|
|
W |
428 |
|
|
|
— |
|
|
|
(17.2 |
)% |
| Net fees and commission income (expense) |
|
|
544 |
|
|
|
602 |
|
|
|
485 |
|
|
|
10.7 |
% |
|
|
(19.4 |
) |
| Net other income (expense) |
|
|
(688 |
) |
|
|
(542 |
) |
|
|
(792 |
) |
|
|
(21.2 |
) |
|
|
46.1 |
|
|
|
|
|
|
|
|
|
|
|
|
|
|
|
|
|
|
|
|
|
|
| Operating income (expense) |
|
W |
373 |
|
|
W |
577 |
|
|
W |
121 |
|
|
|
54.7 |
% |
|
|
(79.0 |
)% |
|
|
|
|
|
|
|
|
|
|
|
|
|
|
|
|
|
|
|
|
|
Comparison of 2022 to 2021
Operating income for securities brokerage services decreased by 79.0% from W577 billion in 2021 to W121 billion in 2022.
222
Net interest income decreased by 17.2% from W517 billion in 2021 to W428 billion in 2022, due to increases in interest expenses on borrowings and debt securities issued resulting from the increase in interest rates as compared to the prior year and increases in average balances of debt securities issued and asset-backed bonds. Such increases in interest expenses were partially offset by increase in interest income recognized primarily on loans at amortized cost, cash and due from banks at amortized cost, and securities at fair value through profit or loss. Interest income on loans at amortized cost increased due to an increase in the average balance of foreign currency facility loans, attributable to relatively weakening of the Korean Won and new loans outpacing repayments and sales of loans. Interest income on cash and due from banks at amortized cost increased due to an increase in performance guarantee deposits and the increase in interest rates. Interest income on securities at fair value through profit or loss increased primarily due to an increase in the proportion of government bonds and financial institution bonds whose value are less sensitive to interest rates as compared to corporate bonds in a rising interest rate environment.
Net fees and commission income decreased by 19.4% from W602 billion in 2021 to W485 billion in 2022 primarily due to a decrease in fees and commission income on brokerage as a result of a decrease in daily average stock trading volume resulting from the stock market slump in Korea during the current period. The decrease in net fees and commission income was partially offset by a decrease in the corresponding trading commission expenses as fees and commission income on brokerage decreased. Also, to a lesser extent, fees and commission expenses on legal and advisory services decreased year-over-year given high legal fees recognized in relation to certain financial products such as Lime funds during 2021.
Net other expense increased by 46.1% from W542 billion in 2021 to W792 billion in 2022 due primarily as a result of recognizing net loss on financial instruments at fair value through profit or loss of W551 billion in 2022 compared to net gain on financial instruments at fair value through profit or loss of W369 billion in 2021. In addition, net other expense further increased due to an increase in net loss on foreign currency translation resulting from the strengthening of the U.S. dollar and the weakening of the Japanese yen, Euro, and Chinese yuan, against the Korean won as well as an increase in loss on foreign currency transaction of spot exchange. The increase in net other expense was partially offset by a decrease in bad debt expenses due to a decrease in allowance for credit losses on loans at amortized cost.
Comparison of 2021 to 2020
Operating income for securities brokerage services increased by 54.7% from W373 billion in 2020 to W577 billion in 2021.
There is no change in net interest income of W517 billion, as a decrease in interest income was offset by an increase in interest expense. More specifically, there was a decrease in interest income on securities measured at fair value through profit or loss and, to a lesser extent, a decrease in interest income on loans measured at fair value through profit or loss, which was partially offset by a decrease in interest expense on borrowings as well as a decrease in interest expense on bonds. The decrease in interest income on securities measured at fair value through profit or loss was primarily due to a decrease in interest income from special purpose bonds as a result of a decrease in the average balance of special purpose bonds and a decrease in interest rate. The interest income on loans measured at fair value through profit or loss decreased mainly due to a decrease in both the average balance of domestic currency facility loan and foreign currency facility loan, attributed to the increase in sell-down speed in the market, which is common for sell-down to be within six months. The interest expense decreased primarily due to the decrease in interest expense on borrowings was primarily due to a decrease in the average balance of other borrowings, resulting from the repayment of short-term borrowings lent in 2020 due to the liquidity crisis caused by COVID-19, and, to a lesser extent, the decrease in interest expense on bonds resulting from a decrease in short-term bond interest rate.
Net fees and commission income increased by 10.7% from W544 billion in 2020 to W602 billion in 2021 primarily due to an increase in fees and commission income on brokerage as a result of an increase in daily
223
average stock trading volume resulting from the booming stock market in Korea during the current period, and, to a lesser extent, an increase in fees and commission income on underwriting and mergers and acquisitions advisory services resulting from the increased number of cases of underwriting and mergers and acquisitions advisory. Fees and commission income also increased due to the significant increase in overseas stock transactions due to the increase in interest in overseas stocks. The increase in net fees and commission income was partially offset by an increase in the corresponding trading commissions as fees and commission income on brokerage increased. Also, to a lesser extent, fees and commission expenses on legal and advisory services increased due to the expansion of input personnel.
Net other expense decreased by 21.2% from W688 billion in 2020 to W542 billion in 2021 due primarily to net gain on financial instruments at fair value through profit or loss of W369 billion in 2021 compared to net loss on financial instruments at fair value through profit or loss of W383 billion in 2020. The decrease in net other operating expense was partially offset as we recognized net loss on financial instruments designated at fair value through profit or loss of W88 billion in 2021 compared to net gain on financial instruments designated at fair value through profit or loss of W198 billion in 2020. Also, the decrease in net other operating expense was offset in part as we recognized net loss on foreign currency transaction of W108 billion in 2021 attributed to an increase in losses on foreign currency transaction of customer deposits in foreign currency resulting from an increase in foreign currency exchange rates amid weaker valuation of the Won, compared to net gain on foreign currency transaction of W115 billion in 2020.
Life Insurance Services
Life insurance services segment consists of life insurance services provided by Shinhan Life Insurance.
|
|
|
|
|
|
|
|
|
|
|
|
|
|
|
|
|
|
|
|
|
| |
|
Year Ended December 31, |
|
|
% Change |
|
| |
|
2020 |
|
|
2021 |
|
|
2022 |
|
|
2020/2021 |
|
|
2021/2022 |
|
| |
|
|
|
|
|
|
|
|
|
|
|
|
|
|
|
| |
|
(In billions of Won, except percentages) |
|
| Income statement data |
|
|
|
|
|
|
|
|
|
|
|
|
|
|
|
|
|
|
|
|
| Net interest income (expense) |
|
W |
1,609 |
|
|
W |
1,620 |
|
|
W |
1,648 |
|
|
|
0.7 |
% |
|
|
1.7 |
% |
| Net fees and commission income (expense) |
|
|
162 |
|
|
|
171 |
|
|
|
107 |
|
|
|
5.6 |
|
|
|
(37.4 |
) |
| Net other income (expense) |
|
|
(1,203 |
) |
|
|
(1,239 |
) |
|
|
(1,141 |
) |
|
|
3.0 |
|
|
|
(7.9 |
) |
|
|
|
|
|
|
|
|
|
|
|
|
|
|
|
|
|
|
|
|
|
| Operating income (expense) |
|
W |
568 |
|
|
W |
552 |
|
|
W |
614 |
|
|
|
(2.8 |
)% |
|
|
11.2 |
% |
|
|
|
|
|
|
|
|
|
|
|
|
|
|
|
|
|
|
|
|
|
Comparison of 2022 to 2021
Operating income for life insurance services increased by 11.2% from W552 billion in 2021 to W614 billion in 2022.
Net interest income increased by 1.7% from W1,620 billion in 2021 to W1,648 billion in 2022 due primarily to an increase in interest income on securities at amortized cost, partially offset by a decrease in interest income on securities at fair value through other comprehensive income. Interest income on securities at amortized cost increased primarily due to an increase in the average balance of government bonds and asset-backed bonds and the increases in interest rate in 2022. Interest income on securities at fair value through other comprehensive income decreased due to a decrease in the average balance of government bonds measured at fair value through other comprehensive income as they were replaced by government bonds measured at amortized cost.
Net fees and commission income decreased by 37.4% from W171 billion in 2021 to W107 billion in 2022 due to an increase in fees and commission expense and a decrease in fees and commission income. The increase in fees and commission expense was mainly due to an increase in separate account fees, which resulted from loss on disposal of bonds, which were disposed in order to obtain liquidity for retirement pension, being compensated in general accounts in fees. To a lesser extent, fees and commission income decreased due to a decrease in the number of annuity payments for variable insurance and the fees resulting therefrom.
224
Net other expense decreased by 7.9% from W1,239 billion in 2021 to W1,141 billion in 2022 primarily due to a decrease in general and administrative expense in 2022 compared to 2021. There was a temporary increase of termination benefits in the previous year due to the voluntary retirement implemented in December, 2021 which normalized during 2022 and resulted in the decrease in general and administrative expense in 2022 compared to 2021.
Comparison of 2021 to 2020
Operating income for life insurance services decreased by 2.8% from W568 billion in 2020 to W552 billion in 2021.
Net interest income increased by 0.7% from W1,609 billion in 2020 to W1,620 billion in 2021 due primarily to an increase in interest income on securities at amortized cost, which was offset in part by a decrease in interest income on deposits at fair value through profit or loss and a decrease in interest income on securities at fair value through profit or loss. Interest income on securities at amortized cost increased primarily due to an increase in the average balance of securities at amortized cost as a result of an increase in the proportion of long-term government bonds with high interest rate sensitivity into securities at amortized cost resulting from an increase in the interest rate in 2021. The decrease in interest income on deposits at fair value through profit or loss was principally due to a decrease in the average balance of deposits at fair value through profit or loss as a result of most structured deposits repaid in 2021 resulting from the exercise of call options by the issuer of structured deposits. Interest income on securities at fair value through profit or loss decreased mainly due to a decrease in the average balance of securities at fair value through profit or loss attributable to a decrease in financial institution bonds repaid as the issuer of financial institution bonds exercised call options.
Net fees and commission income increased by 5.6% from W162 billion in 2020 to W171 billion in 2021 due primarily to a decrease in fees and commission expense, which was partially offset by a decrease in fees and commission income. Fees and commission expense increased principally due to a decrease in separate account fees due to economic fluctuations. To a lesser extent, the decrease in fees and commission expense was due to a decrease in fees on trust accounts. The account of fees on trust accounts was no longer used since a merger of our two life insurance companies, Shinhan Life Insurance and Orange Life Insurance. The decrease in fees and commission income was mainly due to a decrease in fees on separate accounts resulting from a decrease in payment cases related to separate accounts due to the merger.
Net other expense increased by 3.0% from W1,203 billion in 2020 to W1,239 billion in 2021 primarily due to a decrease in gains on hedging items as well as an increase in losses on hedging items. The decrease in gains on hedging items and the increase in losses on hedging items were primarily due to an increase in foreign currency exchange rates amid weaker valuation of the Won. The increase of net other operating expense was enhanced by an increase in general and administrative expenses increased mainly as a result of the voluntary retirement implemented in December 2021. The increase of net other operating expense was partially offset as we recognized net gain on foreign currency transaction of W239 billion in 2021 compared to net loss on foreign currency transaction of W79 billion in 2020, as a result of an increase in foreign currency exchange rates amid weaker valuation of the Won.
225
Specialized Credit Services
The specialized credit services segment consists of the specialized credit business of Shinhan Capital, including facilities leasing, installment finance, new technology finance businesses.
|
|
|
|
|
|
|
|
|
|
|
|
|
|
|
|
|
|
|
|
|
| |
|
Year Ended December 31, |
|
|
% Change |
|
| |
|
2020 |
|
|
2021 |
|
|
2022 |
|
|
2020/2021 |
|
|
2021/2022 |
|
| |
|
(In billions of Won, except percentages) |
|
| Income statement data |
|
|
|
|
|
|
|
|
|
|
|
|
|
|
|
|
|
|
|
|
| Net interest income (expense) |
|
W |
159 |
|
|
W |
232 |
|
|
W |
260 |
|
|
|
45.9 |
% |
|
|
12.1 |
% |
| Net fees and commission income (expense) |
|
|
21 |
|
|
|
29 |
|
|
|
31 |
|
|
|
38.1 |
|
|
|
6.9 |
|
| Net other income (expense) |
|
|
(1 |
) |
|
|
80 |
|
|
|
58 |
|
|
|
N/M |
|
|
|
(27.5 |
) |
|
|
|
|
|
|
|
|
|
|
|
|
|
|
|
|
|
|
|
|
|
| Operating income (expense) |
|
W |
179 |
|
|
W |
341 |
|
|
W |
349 |
|
|
|
90.5 |
% |
|
|
2.3 |
% |
|
|
|
|
|
|
|
|
|
|
|
|
|
|
|
|
|
|
|
|
|
N/M = not meaningful
Comparison of 2022 to 2021
Operating income for the specialized credit business increased by 2.3% from W341 billion in 2021 to W349 billion in 2022.
Net interest income increased by 12.1% from W232 billion in 2021 to W260 billion in 2022 primarily reflecting the changes in loans measured at amortized cost. Interest income on loans denominated in Korean won increased resulting from an increase in the average balance of loans for working capital as a result of an increase in interest-earning financial assets related to corporate finance. Interest-earning financial assets related to corporate finance increased as the Shinhan Capital’s identity as a specialized credit company composed of investment banking and corporate finance, has been solidified since 2020. The increase in interest income was partially offset by an increase in interest expense on long-term borrowings and debt securities issued resulting from increases in their average balances. Due to its nature as a capital company that does not provide deposit services, Shinhan Capital raises its capital through debt or equity financing when assets increase. However, net interest income increased year over year due to an increase in interest margin and continued asset growth.
Net fees and commission income increased by 6.9% from W29 billion in 2021 to W31 billion in 2022 primarily as a result of an increase in commission received as agency and an increase in investment banking fees. The increase in commission received as agency was principally due to an increase in management fees and performance fees earned by us acting as the general partner, primarily driven by the growth trend centered on corporate finance and investment banking. Investment banking fees increased mainly as a result of an increase in underwriting fees reflecting the expansion of business operations centered on corporate finance and investment banking.
Net other income decreased by 27.5% from W80 billion in 2021 to W58 billion in 2022, primarily due to a decrease in net gain on financial instruments at fair value through profit or loss and, to a lesser extent, an increase in net loss on foreign currency translation, which was offset in part by a decrease in provision for credit loss allowance. Net gain on financial instruments at fair value through profit or loss decreased mainly due to a decrease in gain on valuation of puttable financial instruments. Net loss on foreign currency translation increased as a result of weaker valuation of the Korean won. Provision for credit loss allowance decreased despite an additional provision for credit loss allowance reflecting the adverse impact of prolonged COVID-19 and economic uncertainty on our asset portfolio in 2022, principally due to an increase in reversal of provision for credit loss allowance resulting from the redemption of large loans, including loans for aircrafts, in 2022.
226
Comparison of 2021 to 2020
Operating income for the specialized credit business increased by 90.5% from W179 billion in 2020 to W341 billion in 2021.
Net interest income increased by 45.9% from W159 billion in 2020 to W232 billion in 2021 primarily reflecting the changes in loans measured at amortized cost. Interest income on loans denominated in Korean won increased resulting from an increase in the average balance of loans for working capital as a result of an increase in interest-earning financial assets related to corporate finance. Interest-earning financial assets related to corporate finance increased as the Shinhan Capital’s identity as a specialized credit company composed of investment banking and corporate finance, has been solidified since 2020. The increase in interest income on loans measured at amortized cost was partially offset by a decrease in interest income on loans for installment credit principally resulting from a decrease in the average balance of loans for auto and retail installment credit as a result of no additional new loans for installment credit in Shinhan Capital since transferring such assets to Shinhan Card in October, 2020.
Net fees and commission income increased by 38.1% from W21 billion in 2020 to W29 billion in 2021 primarily as a result of an increase in commission received as agency and an increase in investment banking fees. The increase in commission received as agency was principally due to an increase in management fees and performance fees earned by us as acting the general partner based on the growth trend centered on corporate finance and investment banking. Investment banking fees increased mainly as a result of an increase in underwriting fees reflecting the expansion of business operations centered on corporate finance and investment banking.
Net other income was W80 billion in 2021 compared to net other expense of W1 billion in 2020, primarily due to an increase in net gain on financial instruments at fair value through profit or loss and, to a lesser extent, a decrease in provision for credit loss allowance, which was offset in part by an increase in general and administrative expenses. Net gain on financial instruments at fair value through profit or loss increased mainly due to an increase in gain on valuation of puttable financial instruments. Despite an additional provision for credit loss allowance reflecting the adverse impact of COVID-19 on our asset portfolio in 2021, provision for credit loss allowance decreased principally due to an increase in reversal of provision for credit loss allowance resulting from the redemption of large loans, including loans for aircrafts, in 2021. General and administrative expenses increased mainly as a result of the expansion of experienced employees hiring and new hiring, salaries increase, the voluntary retirement first implemented, and in-house welfare fund contribution increase.
Others
Other segment primarily reflects all other activities of Shinhan Financial Group, as the holding company, and our other subsidiaries, including the results of operations of Shinhan Credit Information, Shinhan Asset Management, Shinhan Savings Bank, Shinhan Asset Trust Co., Ltd. Shinhan REITs Management and back-office functions maintained at the holding company.
|
|
|
|
|
|
|
|
|
|
|
|
|
|
|
|
|
|
|
|
|
| |
|
Year Ended December 31, |
|
|
% Change |
|
| |
|
2020 |
|
|
2021 |
|
|
2022 |
|
|
2020/2021 |
|
|
2021/2022 |
|
| |
|
|
|
|
|
|
|
|
|
|
|
|
|
|
|
| |
|
(In billions of Won, except percentages) |
|
| Income statement data |
|
|
|
|
| Net interest income (expense) |
|
W |
8 |
|
|
W |
69 |
|
|
W |
155 |
|
|
|
762.5 |
% |
|
|
124.6 |
% |
| Net fees and commission income (expense) |
|
|
347 |
|
|
|
415 |
|
|
|
394 |
|
|
|
19.6 |
|
|
|
(5.1 |
) |
| Net other income (expense) |
|
|
(197 |
) |
|
|
(224 |
) |
|
|
(386 |
) |
|
|
13.7 |
|
|
|
72.3 |
|
|
|
|
|
|
|
|
|
|
|
|
|
|
|
|
|
|
|
|
|
|
| Operating income (expense) |
|
W |
158 |
|
|
W |
260 |
|
|
W |
163 |
|
|
|
64.6 |
% |
|
|
(37.3 |
)% |
|
|
|
|
|
|
|
|
|
|
|
|
|
|
|
|
|
|
|
|
|
N/M = not meaningful
227
Comparison of 2022 to 2021
Operating income for others decreased by 37.3% from W260 billion in 2021 to W163 billion in 2022.
Net interest income increased by 124.6% from W69 billion in 2021 to W155 billion in 2022 primarily due to an increase in net interest income of Shinhan Savings Bank and, to a lesser extent, an increase in net interest income of consolidated structured entities. Net interest income of Shinhan Savings Bank increased mainly due to an increase in interest income on loans at amortized cost as a result of an increase in the average balance of retail loans. The increase in net interest income of consolidated structured entities was principally due to an increase in interest income on loans measured at amortized cost.
Net fees and commission income decreased by 5.1% from W415 billion in 2021 to W394 billion in 2022 primarily due to Shinhan Credit Information whose net fee and commission income since the second half of the current year was included in the operating result of the credit card segment as it became a wholly-owned subsidiary of Shinhan Card in July 2022. To a lesser extent, net fee and commission income decreased due to the acquisition of Shinhan EZ General Insurance. Shinhan EZ General Insurance does not provide any services where fees or commissions are charged, thus only fees and commission expense were incurred, resulting in a decrease in net fees and commission income.
Net other expense increased by 72.3% from W224 billion in 2021 to W386 billion in 2022, primarily due to an increase in net other operating expense of our holding company and, to a lesser extent, a decrease in net other operating income of consolidated structured entities. The increase in net other operating expense of our holding company was mainly due to an increase in net loss on valuation of financial instruments at fair value through profit or loss, resulting from inflation and rising interest rates. Net other operating income of consolidated structured entities decreased due to a decrease in net gain on foreign currency translation as a result of the weakening of the Korean won.
Comparison of 2021 to 2020
Operating income for others increased by 64.6% from W158 billion in 2020 to W260 billion in 2021.
Net interest income was increased by 762.5% from W8 billion in 2020 to W69 billion in 2021 primarily due to an increase in net interest income of Shinhan Financial Group and, to a lesser extent, an increase in net interest income of consolidated structured entities. Net interest income of Shinhan Financial Group increased mainly reflecting a decrease in interest expense as a result of a decrease in interest rate, despite an increase in the average balance of debt securities issued. The increase in net interest income of consolidated structured entities was principally due to an increase in interest income on loans measured at amortized cost.
Net fees and commission income increased by 19.6% from W347 billion in 2020 to W415 billion in 2021 primarily due to an increase in income of Asia Trust Co., Ltd. resulting from the Group’s strengthening the non-banking portfolio through real estate business line. The increased income from Asia Trust Co., Ltd. was mainly due to the increased number of land trusts managed by Asia Trust Co., Ltd.
Net other expense increased by 13.7% from W197 billion in 2020 to W224 billion in 2021, primarily due to an increase in net other operating expense of our holding company, which was partially offset by an increase in net other operating income of consolidated structured entities. The increase in net other operating expense of our holding company was mainly due to a decrease in net gain on financial instruments at fair value through profit or loss. Net other operating income of consolidated structured entities increased as we recognized net gain on foreign currency transaction of W34 billion in 2021 compared to net loss on foreign currency transaction of W12 billion in 2020.
228
Financial Condition
Assets
The following table sets forth, as of the dates indicated, the principal components of our assets.
|
|
|
|
|
|
|
|
|
|
|
|
|
|
|
|
|
|
|
|
|
| |
|
As of December 31, |
|
|
% Change |
|
| |
|
2020 |
|
|
2021 |
|
|
2022 |
|
|
2020/2021 |
|
|
2021/2022 |
|
| |
|
|
|
|
|
|
|
|
|
|
|
|
|
|
|
| |
|
(In billions of Won, except percentages) |
|
| Cash and due from banks at amortized cost |
|
W |
33,411 |
|
|
W |
28,453 |
|
|
W |
29,532 |
|
|
|
(14.8 |
)% |
|
|
3.8 |
% |
| Financial assets at fair value through profit or loss |
|
|
59,091 |
|
|
|
62,404 |
|
|
|
56,644 |
|
|
|
5.6 |
|
|
|
(9.2 |
) |
| Derivative assets |
|
|
5,634 |
|
|
|
3,799 |
|
|
|
6,462 |
|
|
|
(32.6 |
) |
|
|
70.1 |
|
| Securities at fair value through other comprehensive income |
|
|
58,316 |
|
|
|
64,838 |
|
|
|
63,662 |
|
|
|
11.2 |
|
|
|
(1.8 |
) |
| Securities at amortized cost |
|
|
47,283 |
|
|
|
49,930 |
|
|
|
57,971 |
|
|
|
5.6 |
|
|
|
16.1 |
|
| Loans at amortized cost |
|
|
356,222 |
|
|
|
389,137 |
|
|
|
412,292 |
|
|
|
9.2 |
|
|
|
6.0 |
|
| Property and equipment, net |
|
|
3,990 |
|
|
|
4,046 |
|
|
|
4,011 |
|
|
|
1.4 |
|
|
|
(0.9 |
) |
| Intangible assets |
|
|
5,481 |
|
|
|
5,645 |
|
|
|
5,808 |
|
|
|
3.0 |
|
|
|
2.9 |
|
| Investments in associates |
|
|
2,658 |
|
|
|
2,914 |
|
|
|
2,904 |
|
|
|
9.6 |
|
|
|
(0.3 |
) |
| Current tax receivables |
|
|
52 |
|
|
|
15 |
|
|
|
26 |
|
|
|
(71.2 |
) |
|
|
73.3 |
|
| Deferred tax assets |
|
|
215 |
|
|
|
135 |
|
|
|
1,052 |
|
|
|
(37.2 |
) |
|
|
679.3 |
|
| Investment property |
|
|
615 |
|
|
|
675 |
|
|
|
363 |
|
|
|
9.8 |
|
|
|
(46.2 |
) |
| Net defined benefit assets |
|
|
18 |
|
|
|
142 |
|
|
|
620 |
|
|
|
688.9 |
|
|
|
336.6 |
|
| Other assets |
|
|
32,194 |
|
|
|
35,975 |
|
|
|
34,508 |
|
|
|
11.7 |
|
|
|
(4.1 |
) |
| Assets held for sale |
|
|
54 |
|
|
|
44 |
|
|
|
29 |
|
|
|
(18.5 |
) |
|
|
(34.1 |
) |
|
|
|
|
|
|
|
|
|
|
|
|
|
|
|
|
|
|
|
|
|
| Total assets |
|
W |
605,234 |
|
|
W |
648,152 |
|
|
W |
675,884 |
|
|
|
7.1 |
% |
|
|
4.3 |
% |
|
|
|
|
|
|
|
|
|
|
|
|
|
|
|
|
|
|
|
|
|
2022 Compared to 2021
Our assets increased by 4.3% from W648,152 billion as of December 31, 2021 to W675,884 billion as of December 31, 2022, principally due to increases in loans at amortized cost, securities at amortized cost, derivative assets, and cash and due from banks at amortized cost.
Our loans at amortized cost increased by 6.0% to W412,292 billion as of December 31, 2022 from W389,137 billion as of December 31, 2021, due primarily to an increase in corporate loans and, to a lesser extent an increase in retail loans.
Our securities at amortized cost increased by 16.1% to W57,971 billion as of December 31, 2022 from W49,930 billion as of December 31, 2021, due primarily to an increase in the balance of debt securities measured amortized cost, such as government bonds, financial institutions bond and corporate bonds.
Our derivative assets increased by 70.1% to W6,462 billion as of December 31, 2022 from W3,799 billion as of December 31, 2021, due primarily to an increase in foreign currency derivatives assets.
Our cash and due from banks at amortized cost increased by 3.8% to W29,532 billion as of December 31, 2022 from W28,453 billion as of December 31, 2021, due primarily to an increase in the balance of deposits denominated in foreign currency.
229
2021 Compared to 2020
Our assets increased by 7.1% from W605,234 billion as of December 31, 2020 to W648,152 billion as of December 31, 2022, principally due to increases in loans at amortized cost, securities at fair value through other comprehensive income, other assets and financial assets at fair value through profit or loss.
Our loans at amortized cost increased by 9.2% to W389,137 billion as of December 31, 2021 from W356,222 billion as of December 31, 2020, due primarily to an increase in corporate loans and, to a lesser extent an increase in retail loans.
Our securities at fair value through other comprehensive income increased by 11.2% to W64,838 billion as of December 31, 2021 from W58,316 billion as of December 31, 2020, due primarily to an increase in the balance of debt securities measured at fair value through other comprehensive income, such as government bonds, public bonds and corporate bonds.
Our Other assets increased by 11.7% to W35,975 billion as of December 31, 2021 from W32,194 billion as of December 31, 2020, due primarily to an increase in domestic exchange settlements debits.
Our Financial assets at fair value through profit or loss increased by 5.6% to W62,404 billion as of December 31, 2021 from W59,091 billion as of December 31, 2020, due primarily to an increase in the balance of debt securities measured at fair value through profit or loss, such as beneficiary certificates, equity investment with put option, CMA and corporate bonds.
Liabilities and Equity
The following table sets forth, as of the dates indicated, the principal components of our liabilities.
|
|
|
|
|
|
|
|
|
|
|
|
|
|
|
|
|
|
|
|
|
| |
|
As of December 31, |
|
|
% Change |
|
| |
|
2020 |
|
|
2021 |
|
|
2022 |
|
|
2020/2021 |
|
|
2021/2022 |
|
| |
|
|
|
|
|
|
|
|
|
|
|
|
|
|
|
| |
|
(In billions of Won, except percentages) |
|
| Deposits |
|
W |
326,417 |
|
|
W |
364,897 |
|
|
W |
383,011 |
|
|
|
11.8 |
% |
|
|
5.0 |
% |
| Financial liabilities at fair value through profit or loss |
|
|
1,437 |
|
|
|
1,369 |
|
|
|
1,146 |
|
|
|
(4.7 |
) |
|
|
(16.3 |
) |
| Financial liabilities designated at fair value through profit or loss |
|
|
8,456 |
|
|
|
8,024 |
|
|
|
8,367 |
|
|
|
(5.1 |
) |
|
|
4.3 |
|
| Derivative liabilities |
|
|
5,017 |
|
|
|
3,587 |
|
|
|
7,705 |
|
|
|
(28.5 |
) |
|
|
114.8 |
|
| Borrowings |
|
|
41,594 |
|
|
|
43,167 |
|
|
|
49,279 |
|
|
|
3.8 |
|
|
|
14.2 |
|
| Debt securities issued |
|
|
75,134 |
|
|
|
80,149 |
|
|
|
77,289 |
|
|
|
6.7 |
|
|
|
(3.6 |
) |
| Net defined benefit liabilities |
|
|
63 |
|
|
|
51 |
|
|
|
15 |
|
|
|
(19.0 |
) |
|
|
(70.6 |
) |
| Provisions |
|
|
805 |
|
|
|
1,167 |
|
|
|
1,266 |
|
|
|
45.0 |
|
|
|
8.5 |
|
| Current tax payable |
|
|
390 |
|
|
|
703 |
|
|
|
702 |
|
|
|
80.3 |
|
|
|
(0.1 |
) |
| Deferred tax liabilities |
|
|
580 |
|
|
|
176 |
|
|
|
170 |
|
|
|
(69.7 |
) |
|
|
(3.4 |
) |
| Liabilities under insurance contracts |
|
|
53,459 |
|
|
|
54,333 |
|
|
|
54,315 |
|
|
|
1.6 |
|
|
|
— |
|
| Other liabilities |
|
|
45,525 |
|
|
|
40,991 |
|
|
|
41,489 |
|
|
|
(10.0 |
) |
|
|
1.2 |
|
|
|
|
|
|
|
|
|
|
|
|
|
|
|
|
|
|
|
|
|
|
| Total liabilities |
|
|
558,877 |
|
|
|
598,614 |
|
|
|
624,754 |
|
|
|
7.1 |
|
|
|
4.4 |
|
|
|
|
|
|
|
|
|
|
|
|
|
|
|
|
|
|
|
|
|
|
| Total equity attributable to equity holders of the Group |
|
|
44,070 |
|
|
|
47,291 |
|
|
|
48,439 |
|
|
|
7.3 |
|
|
|
2.4 |
|
| Non-controlling interests |
|
|
2,287 |
|
|
|
2,247 |
|
|
|
2,691 |
|
|
|
(1.8 |
) |
|
|
19.8 |
|
|
|
|
|
|
|
|
|
|
|
|
|
|
|
|
|
|
|
|
|
|
| Total equity |
|
|
46,357 |
|
|
|
49,538 |
|
|
|
51,130 |
|
|
|
6.9 |
|
|
|
3.2 |
|
|
|
|
|
|
|
|
|
|
|
|
|
|
|
|
|
|
|
|
|
|
| Total liabilities and equity |
|
W |
605,234 |
|
|
W |
648,152 |
|
|
W |
675,884 |
|
|
|
7.1 |
% |
|
|
4.3 |
% |
|
|
|
|
|
|
|
|
|
|
|
|
|
|
|
|
|
|
|
|
|
230
2022 Compared to 2021
Our total liabilities increased by 4.4% from W598,614 billion as of December 31, 2021 to W624,754 billion as of December 31, 2022, primarily due to an increase in deposits (which principally consist of customer deposits) and an increase in borrowings and, to a lesser extent, an increase in derivative liabilities.
Our deposits increased by 5.0% from W364,897 billion as of December 31, 2021 to W383,011 billion as of December 31, 2022, primarily due to an increase in time and savings deposits and demand deposits.
Our borrowings increased by 14.2% from W43,167 billion as of December 31, 2021 to W49,279 billion as of December 31, 2022 primarily as a result of an increase in borrowings denominated in Korean Won including borrowings from the Bank of Korea.
Our derivative liabilities increased by 114.8% from W3,587 billion as of December 31, 2021 to W7,705 billion as of December 31, 2022, primarily due to an increase in foreign currency derivative liabilities.
Total equity increased by 3.2% from W49,538 billion as of December 31, 2021 to W51,130 billion as of December 31, 2022, largely due to an increase in retained earnings and an increase resulting from additional hybrid bonds issued by the Group.
2021 Compared to 2020
Our total liabilities increased by 7.1% from W558,877 billion as of December 31, 2020 to W598,614 billion As of December 31, 2022, primarily due to an increase in deposits (which principally consist of customer deposits) and an increase in debt securities issued and, to a lesser extent, an increase in borrowings.
Our deposits increased by 11.8% from W326,417 billion as of December 31, 2020 to W364,897 billion As of December 31, 2022, primarily due to an increase in time and savings deposits largely resulting from policies to increase liquidity including funding supports of government and local government due to prolonged COVID-19.
Our debt securities issued increased by 6.7% from W75,134 billion as of December 31, 2020 to W80,149 billion As of December 31, 2022, primarily due to an increase in debt securities issued denominated in Korean won.
Our borrowings increased by 3.8% from W41,594 billion as of December 31, 2020 to W43,167 billion as of December 31, 2021 primarily as a result of an increase in borrowings denominated in Korean won including borrowings from the Bank of Korea and other borrowings.
Total equity increased by 6.9% from W46,357 billion as of December 31, 2020 to W49,538 billion As of December 31, 2022, largely due to an increase in retained earnings and an increase resulting from additional hybrid bonds issued by the Group.
| ITEM 5.B. |
Liquidity and Capital Resources |
We are exposed to liquidity risk arising from the funding of our lending, trading and investment activities and in the management of trading positions. The goal of liquidity management is for us to be able, even under adverse conditions, to meet all of our liability repayments on time and fund all investment opportunities. For an explanation of how we manage our liquidity risk, see “Item 4.B. Business Overview — Risk Management — Market Risk Management — Market Risk Management for Non-trading Activities — Liquidity Risk Management.” In our opinion, the working capital is sufficient for our present requirements.
231
The following table sets forth our capital resources as of December 31, 2022.
|
|
|
|
|
| |
|
As of December 31, 2022 |
|
| |
|
(In billions of Won) |
|
| Deposits |
|
W |
383,011 |
|
| Long-term debt |
|
|
77,369 |
|
| Call money |
|
|
1,276 |
|
| Borrowings from the Bank of Korea |
|
|
5,100 |
|
| Other short-term borrowings |
|
|
34,002 |
|
| Asset securitizations |
|
|
9,545 |
|
| Stockholders’ equity(1) |
|
|
18,519 |
|
|
|
|
|
|
| Total |
|
W |
528,822 |
|
|
|
|
|
|
Note:
| (1) |
Includes capital stock, share premium, and hybrid bonds issued. |
We obtain funding from a variety of sources, both domestic and foreign. Our principal source of funding is customer deposits obtained from our banking operations, and we from time to time issue equity and debt securities. In addition, our subsidiaries acquire funding through call money, borrowings from the Bank of Korea, other short-term borrowings, corporate debentures, other long-term debt and asset-backed securitizations.
Our primary funding strategy has been to achieve low-cost funding by increasing the average balances of low-cost retail customer deposits. Customer deposits accounted 70.9% of our total funding as of December 31, 2020, 72.0% of our total funding as of December 31, 2021 and 72.4% of our total funding as of December 31, 2022. Historically, except in limited circumstances, largely due to the lack of alternative investment opportunities for individuals and households in Korea, especially in light of a low interest rate environment and volatile stock market conditions, a substantial portion of such customer deposits were rolled over upon maturity and accordingly provided a stable source of funding for our banking subsidiaries. However, in the face of attractive alternative investment opportunities such as during a bullish run of the stock market, customers may transfer a significant amount of bank deposits to alternative investment products in search of higher returns, which may result in temporary difficulties in finding sufficient funding on commercial terms favorable to us. In addition, in recent years, we have faced increasing pricing competition from our competitors with respect to our deposit products. If we do not continue to offer competitive interest rates to our deposit customers, we may lose their business, which has traditionally provided a stable and low-cost source of funding. Even if we are able to match our competitors’ pricing, doing so may result in an increase in our funding costs, which may have an adverse impact on our results of operations.
While our banking subsidiaries generally have not faced, and currently are not facing, liquidity difficulties in any material respect, if we or our banking subsidiaries are unable to obtain the funding we need on terms commercially acceptable to us for an extended period of time for reasons of Won devaluation or otherwise, we may not be able to ensure our financial viability, meet regulatory requirements, implement our strategies or compete effectively. See “Item 3.D. Risk Factors — Risks Related to Our Overall Business — Changes in interest rates, foreign exchange rates, bond and equity prices, and other market factors have affected and will continue to affect our business, results of operations and financial condition.”
As of December 31, 2020, 2021 and 2022, W6,816 billion, W7,610 billion and W7,308 billion, or 2.1%, 2.1% and 2.0%, respectively, of Shinhan Bank’s total deposits were deposits made by litigants in connection with legal proceedings in Korean courts. Court deposits carry interest rates which are generally lower than market rates.
232
In addition, we obtain funding through borrowings and the issuances of debt and equity securities, primarily through Shinhan Bank. Our borrowings consist mainly of borrowings from financial institutions, the Government and Government-affiliated funds. Call money, which is available in both Won and foreign currencies, is obtained from the domestic call loan market, a short-term loan market for loans with maturities of less than one month. As for our long-term debt, it is principally in the form of corporate debt securities issued by Shinhan Bank. Since 1999, Shinhan Bank has actively issued and continues to issue long-term debt securities with maturities of over one year in the Korean fixed-income market. Shinhan Bank and we have maintained one of the highest credit ratings in the domestic fixed-income market since their inception in 1999 and 2001, respectively. As Shinhan Bank maintains one of the highest debt ratings in the fixed-income market in Korea, we believe that Shinhan Bank will be able to obtain replacement funding through the issuance of long-term debt securities. Shinhan Bank’s interest rates on long-term debt securities are in general 20 to 30 basis points higher than the interest rates offered on their deposits. However, since long-term debt is not subject to premiums paid for deposit insurance and the Bank of Korea reserves, we estimate that our funding costs on long-term debt securities are generally on par with our funding costs on deposits. In addition, our company, as well as Shinhan Bank may also issue long-term debt securities denominated in foreign currencies in overseas markets. Our company and Shinhan Bank each have a global medium term notes program under which foreign currency-denominated notes may be issued with an aggregate program limit of US$5 billion and US$8 billion, respectively. As of December 31, 2020, 2021 and 2022, our long-term debt amounted to W75,089 billion, W78,023 billion and W77,369 billion, respectively.
We also have funding requirements for our credit card activities. We obtain funding for our credit card activities from a variety of sources, primarily in Korea. The principal sources of funding for Shinhan Card are debentures, commercial papers (including call money), borrowings from the holding company and third-parties, which amounted to W21,503 billion, W5,680 billion, W2,225 billion and W1,232 billion, or 70.2%, 18.5%, 7.3%, and 4.0%, respectively, of the funding for our credit card activities, as of December 31, 2022. Unlike other credit card companies, Shinhan Card has the benefit of obtaining funding at favorable rates through loans from Shinhan Financial Group, which currently maintains the highest credit rating assigned by local rating agencies. Shinhan Card aims to further diversify its funding sources and more actively tap the domestic and international capital markets to ensure access to liquidity as needed.
Credit ratings affect the cost and other terms upon which we and our subsidiaries are able to obtain funding. Domestic and international rating agencies regularly evaluate us, and our subsidiaries and their ratings of our and our subsidiaries’ long-term debt are based on a number of factors, including our financial strength as well as conditions affecting the financial services industry generally.
There can be no assurance that we or our subsidiaries will maintain our current credit ratings if, among other reasons, the global or Korean economy were to face another downturn, there are any changes in our corporate governance or our businesses significantly deteriorate. Our failure to maintain current credit ratings and outlooks could increase the cost of our funding, limit our access to capital markets and other borrowings, and require us to post additional collateral in financial transactions, any of which could adversely affect our liquidity, net interest margins and profitability.
Secondary funding sources also include call money, borrowings from the Bank of Korea and other short-term borrowings which amounted to W31,471 billion, W35,372 billion and W40,378 billion, as of December 31, 2020, 2021 and 2022, respectively, each representing 6.8%, 7.0% and 7.6% respectively, of our total funding as of such dates.
We may also from time to time obtain funding through issuance of equity securities. For example, On September 29, 2020, partly in response to the prolonged COVID-19 pandemic and to increase our loss absorption capacity, we issued 39,130,000 common shares to two private equity funds, thereby increasing our paid-in capital by W195.7 billion. As a result of such offering, which was substantially fully subscribed and resulted in a capital increase of approximately 7.5%, we raised approximately W1,158 billion (before underwriting commissions and other offering expenses).
233
In addition, we obtain funding through issuance of hybrid bonds. The total of our hybrid bonds issued were W4,197 billion. In 2022, the additional hybrid bonds of W997 billion were newly issued to improve the capital adequacy ratio by expanding the capital.
In limited situations, we may also issue convertible and/or preferred shares. For example, in August 2003, in order to partly fund our acquisition of Chohung Bank, we raised a total of W2,552 billion through domestic private placements of redeemable preferred shares and redeemable convertible preferred shares to domestic financial institutions and governmental entities in Korea, all of which shares have since been redeemed or converted. In addition, in January 2007, partly to fund the acquisition of LG Card, we raised a total of W3,750 billion through domestic private placements of redeemable preferred shares and redeemable convertible preferred shares, all of which have been redeemed as of the date hereof. In April 2011, we issued redeemable preferred shares to fund redemption of such securities, and in April 2016, we redeemed the redeemable preferred shares issued in April 2011. In February 2019, we raised a total of W750 billion through domestic private placements of convertible preferred shares. For further details of our preferred shares, see “Item 10.B. Memorandum and Articles of Incorporation — Description of Preferred Stock.”
Pursuant to laws and regulations in Korea, we may redeem our preferred stock to the extent of our retained earnings of the previous fiscal year, net of certain reserves. At this time, we expect that cash from our future operations would be adequate to provide us with sufficient capital resources to enable us to redeem our preferred stock on or prior to their scheduled maturities. In the event there is a short-term shortage of liquidity to make the required cash payments for redemption as a result of, among other things, failure to receive dividend payments from our operating subsidiaries on time or as a result of significant expenditures resulting from future acquisitions, we plan to raise cash liquidity through the issuance of long-term debt in the Korean fixed-income market in advance of the scheduled maturity on our preferred stock. To the extent we need to obtain additional liquidity, we plan to do so through the issuance of long-term corporate debentures or further preferred stock and/or the use of our other secondary funding sources.
We generally may not acquire our own shares except in certain limited circumstances such as a capital reduction. However, pursuant to the Financial Investment Services and Capital Markets Act and regulations under the Financial Holding Companies Act, we may purchase our own shares on the KRX KOSPI Market of the Korea Exchange or through a tender offer, or retrieve our own shares from a trust company upon termination of a trust agreement subject to the restrictions that (1) the aggregate purchase price of such shares may not exceed the total amount available for distribution of dividends at the end of the preceding fiscal year less the amounts of dividends and reserves for such fiscal year, subtracted by the sum of (a) the purchase price of treasury stock acquired if any treasury stock has been purchased after the end of the preceding fiscal year pursuant to the Commercial Act or the Financial Investment Services and Capital Markets Act, (b) the amount subject to a trust contract, and (c) the amount of dividends approved at the ordinary general shareholders’ meeting after the end of the preceding fiscal year and the amount of retained earnings reserve required under the Commercial Act; plus if any treasury stock has been disposed of after the end of the preceding fiscal year, the acquisition cost of such treasury stock, and (2) the purchase of such shares shall meet the requisite ratio under the Financial Holding Companies Act and regulations thereunder. In addition, pursuant to the Financial Investment Services and Capital Markets Act, in certain limited circumstances, dissenting holders of shares have the right to require us to purchase their shares.
Contractual Obligations, Commitments and Guarantees
In the ordinary course of our business, we have certain contractual cash obligations and commitments which extend for several years. As we are able to obtain liquidity and funding through various sources as described in “— Liquidity and Capital Resources” above, we do not believe that these contractual cash obligations and commitments will have a material effect on our liquidity or capital resources.
234
Contractual Cash Obligations
The following table sets forth our contractual cash obligations as of December 31, 2022.
|
|
|
|
|
|
|
|
|
|
|
|
|
|
|
|
|
|
|
|
|
|
|
|
|
|
|
|
|
| |
|
As of December 31, 2022
Payments Due by Period(1) |
|
| |
|
Less than
1 Month |
|
|
1-3 Months |
|
|
3-6 Months |
|
|
6-12 Months |
|
|
1-5 Years |
|
|
More than
5 Years |
|
|
Total |
|
| |
|
|
|
|
|
|
|
|
|
|
|
|
|
|
|
|
|
|
|
|
|
| |
|
(In billions of Won) |
|
| Deposits |
|
W |
210,900 |
|
|
W |
42,662 |
|
|
W |
41,865 |
|
|
W |
71,259 |
|
|
W |
21,142 |
|
|
W |
2,627 |
|
|
W |
390,455 |
|
| Borrowings |
|
|
11,960 |
|
|
|
4,760 |
|
|
|
4,798 |
|
|
|
7,251 |
|
|
|
12,298 |
|
|
|
9,024 |
|
|
|
50,091 |
|
| Debt securities issued |
|
|
4,564 |
|
|
|
8,369 |
|
|
|
9,646 |
|
|
|
16,486 |
|
|
|
37,535 |
|
|
|
5,157 |
|
|
|
81,757 |
|
| Lease liability |
|
|
32 |
|
|
|
37 |
|
|
|
52 |
|
|
|
91 |
|
|
|
336 |
|
|
|
75 |
|
|
|
623 |
|
|
|
|
|
|
|
|
|
|
|
|
|
|
|
|
|
|
|
|
|
|
|
|
|
|
|
|
|
|
| Total |
|
W |
227,456 |
|
|
W |
55,828 |
|
|
W |
56,361 |
|
|
W |
95,087 |
|
|
W |
71,311 |
|
|
W |
16,883 |
|
|
W |
522,926 |
|
|
|
|
|
|
|
|
|
|
|
|
|
|
|
|
|
|
|
|
|
|
|
|
|
|
|
|
|
|
Note:
| (1) |
Reflects all estimated contractual interest payments due on our interest-bearing deposits, borrowings, debt securities issued and lease liability, and the estimated contractual interest payments on borrowings and debt securities that are on a floating rate basis as of December 31, 2022 were computed as if the interest rate used on the last applicable date (for example, the interest payment date for such floating rate loans immediately preceding the determination date) were the interest rate applicable throughout the remainder of the term. |
Commitments and Guarantees
In the normal course of business, we and our subsidiaries make various commitments and guarantees to meet the financing needs of our customers. Commitments and guarantees are usually in the form of, among others, commitments to extend credit, commercial letters of credit, standby letter of credit and performance guarantees. The contractual amount of these financial instruments represents the maximum possible loss amount if the counterparty draws down the commitment or we should fulfill our obligation under the guarantee and the counterparty fails to perform under the contract. See “Item 4.B. Business Overview — Description of Assets and Liabilities — Credit-Related Commitments and Guarantees.”
The following table sets forth our commitments and guarantees as of December 31, 2022. These commitments, apart from certain guarantees and acceptances, are not included within our consolidated statements of financial position.
|
|
|
|
|
|
|
|
|
|
|
|
|
|
|
|
|
| |
|
As of December 31, 2022
Commitment Expiration by Period |
|
| |
|
Less than
1 Year |
|
|
1-5 Years |
|
|
More than
5 Years |
|
|
Total |
|
| |
|
|
|
|
|
|
|
|
|
|
|
|
| |
|
(In billions of Won) |
|
| Commitments to extend credit(1) |
|
W |
76,350 |
|
|
W |
15,414 |
|
|
W |
16,084 |
|
|
W |
107,848 |
|
| Commercial letters of credit(2) |
|
|
3,033 |
|
|
|
105 |
|
|
|
— |
|
|
|
3,138 |
|
| Financial guarantees(3) |
|
|
2,963 |
|
|
|
1,214 |
|
|
|
6 |
|
|
|
4,183 |
|
| Performance guarantees(4) |
|
|
5,409 |
|
|
|
3,272 |
|
|
|
41 |
|
|
|
8,722 |
|
| Liquidity facilities to SPEs(5) |
|
|
1,102 |
|
|
|
677 |
|
|
|
154 |
|
|
|
1,933 |
|
| Acceptances(6) |
|
|
654 |
|
|
|
5 |
|
|
|
— |
|
|
|
659 |
|
| Endorsed bills(7) |
|
|
7,057 |
|
|
|
1 |
|
|
|
— |
|
|
|
7,058 |
|
| Unused credit limits on credit cards |
|
|
90,533 |
|
|
|
— |
|
|
|
— |
|
|
|
90,533 |
|
| Other |
|
|
2,030 |
|
|
|
1,378 |
|
|
|
3,047 |
|
|
|
6,455 |
|
|
|
|
|
|
|
|
|
|
|
|
|
|
|
|
|
|
| Total |
|
W |
189,131 |
|
|
W |
22,066 |
|
|
W |
19,332 |
|
|
W |
230,529 |
|
|
|
|
|
|
|
|
|
|
|
|
|
|
|
|
|
|
235
Notes:
| (1) |
Commitments to extend credit represent unfunded portions of authorizations to extend credit in the form of loans. The commitments expire on fixed dates and a customer is required to comply with predetermined conditions to draw funds under the commitments. Commitments to extend credit, including credit lines, are in general subject to provisions that allow us to withdraw such commitments in the event there are material adverse changes affecting an obligor. |
| (2) |
Commercial letters of credit are undertakings on behalf of customers authorizing third parties to draw drafts on us up to a stipulated amount under specific terms and conditions. These are generally short-term and collateralized by the underlying shipments of goods to which they relate. |
| (3) |
Financial guarantees are contracts that require us to make specified payments to reimburse the holder for a loss it incurs because a specified debtor fails to make payment when due in accordance with the terms of a debt instrument. Financial guarantee liabilities are recognized initially at their fair value, and the initial fair value is amortized over the life of the financial guarantee. The financial guarantee liability is subsequently carried at the higher of this amortized amount and the present value of any expected payment when a payment under the guarantee has become probable. Financial guarantees are included within other liabilities. |
| (4) |
Performance guarantees are issued to guarantee customers’ tender bids on construction or similar projects or to guarantee completion of such projects in accordance with contractual terms. They are also issued to support a customer’s obligation to supply products, commodities, maintenance or other services to third parties. |
| (5) |
Liquidity facilities to SPEs represent irrevocable commitments to provide contingent credit lines including commercial paper purchase agreements to special purpose entities for which we serve as the administrator. |
| (6) |
Acceptances represent guarantees by us to pay a bill of exchange drawn on a customer. We expect most acceptances to be presented, but reimbursement by the customer is normally immediate. |
| (7) |
Endorsed bills represent notes transferred to third parties by us. We are obligated to fulfill the duty of payment if the person primarily liable does not honor the bill on the due date. |
See also Note 43 of the notes to our consolidated financial statements included in this annual report.
236
Capital Adequacy
The Financial Services Commission regulations require that capital ratios be computed based on our consolidated financial statements under IFRS and regulatory guidelines. The following table sets forth a summary of our capital and capital adequacy ratios as of December 31, 2020, 2021 and 2022 based on Basel III.
|
|
|
|
|
|
|
|
|
|
|
|
|
| |
|
As of December 31, |
|
| |
|
2020 |
|
|
2021 |
|
|
2022 |
|
| |
|
|
|
|
|
|
|
|
|
| |
|
(In millions of Won, except percentages) |
|
| Tier I Capital: |
|
|
|
|
|
|
|
|
|
|
|
|
| Tier I CE Capital |
|
W |
32,461,864 |
|
|
W |
35,469,554 |
|
|
W |
37,287,768 |
|
| Paid-in capital |
|
|
2,882,231 |
|
|
|
2,882,231 |
|
|
|
2,882,231 |
|
| Capital reserve |
|
|
10,692,543 |
|
|
|
10,692,438 |
|
|
|
10,692,438 |
|
| Retained earnings |
|
|
27,777,169 |
|
|
|
30,541,300 |
|
|
|
33,342,633 |
|
| Non-controlling interests in consolidated subsidiaries |
|
|
66,966 |
|
|
|
50,475 |
|
|
|
52,851 |
|
| Others |
|
|
(8,957,045 |
) |
|
|
(8,696,890 |
) |
|
|
(9,682,385 |
) |
| Additional Tier I Capital |
|
|
3,805,372 |
|
|
|
4,965,931 |
|
|
|
6,018,792 |
|
|
|
|
|
|
|
|
|
|
|
|
|
|
| Total Tier I Capital |
|
W |
36,267,236 |
|
|
W |
40,435,485 |
|
|
W |
43,306,561 |
|
|
|
|
|
|
|
|
|
|
|
|
|
|
| Tier II Capital: |
|
|
|
|
|
|
|
|
|
|
|
|
| Allowances for credit losses |
|
|
700,892 |
|
|
|
743,451 |
|
|
|
962,384 |
|
| Subordinated debt |
|
|
70,000 |
|
|
|
— |
|
|
|
— |
|
| Others |
|
|
2,670,949 |
|
|
|
2,684,500 |
|
|
|
2,752,016 |
|
|
|
|
|
|
|
|
|
|
|
|
|
|
| Total Tier II capital |
|
W |
3,441,841 |
|
|
W |
3,427,951 |
|
|
W |
3,714,400 |
|
|
|
|
|
|
|
|
|
|
|
|
|
|
| Total Capital |
|
W |
39,709,077 |
|
|
W |
43,863,436 |
|
|
W |
47,020,961 |
|
|
|
|
|
|
|
|
|
|
|
|
|
|
| Risk-weighted assets |
|
|
|
|
|
|
|
|
|
|
|
|
| Credit risk |
|
W |
220,626,623 |
|
|
W |
235,174,053 |
|
|
W |
254,233,024 |
|
| Market risk |
|
|
11,768,520 |
|
|
|
14,042,483 |
|
|
|
13,927,045 |
|
| Operational risk |
|
|
19,926,283 |
|
|
|
21,475,647 |
|
|
|
23,382,529 |
|
|
|
|
|
|
|
|
|
|
|
|
|
|
| Total risk-weighted assets |
|
W |
252,321,426 |
|
|
W |
270,692,183 |
|
|
W |
291,542,598 |
|
|
|
|
|
|
|
|
|
|
|
|
|
|
| Capital adequacy ratio |
|
|
15.74 |
% |
|
|
16.20 |
% |
|
|
16.13 |
% |
| Tier I capital adequacy ratio |
|
|
14.37 |
% |
|
|
14.94 |
% |
|
|
14.85 |
% |
| Common equity capital adequacy ratio |
|
|
12.87 |
% |
|
|
13.10 |
% |
|
|
12.79 |
% |
|
|
| |
|
As of December 31, |
|
| |
|
2020 |
|
|
2021 |
|
|
2022 |
|
| |
|
(Percentages) |
|
| Group BIS ratio(1) |
|
|
15.74 |
% |
|
|
16.20 |
% |
|
|
16.13 |
% |
| Total capital adequacy ratio of Shinhan Bank |
|
|
18.47 |
|
|
|
18.18 |
|
|
|
17.77 |
|
| Adjusted equity capital ratio of Shinhan Card(2) |
|
|
19.91 |
|
|
|
18.85 |
|
|
|
18.61 |
|
| Solvency ratio for Shinhan Life Insurance(3) |
|
|
249.5 |
|
|
|
284.6 |
|
|
|
266.0 |
|
Notes:
| (1) |
Under the guidelines of the Financial Services Commission applicable to financial holding companies, the minimum requisite capital ratio applicable to us is the Bank for International Settlement (“BIS”) ratio of 8%. This computation is based on our consolidated financial statements in accordance with IFRS. See “Item 4.B. Business Overview — Supervision and Regulation — Principal Regulations Applicable to Financial Holding Companies — Capital Adequacy.” |
| (2) |
Represents the ratio of total adjusted shareholders’ equity to total adjusted assets and is computed in accordance with the guidelines issued by the Financial Services Commission for credit card companies. |
237
| |
Under these guidelines, a credit card company is required to maintain a minimum adjusted equity capital ratio of 8%. This computation is based on the consolidated financial statements of the credit card company prepared in accordance with IFRS. See “Item 4.B. Business Overview — Supervision and Regulation — Principal Regulations Applicable to Credit Card Companies — Capital Adequacy.” |
| (3) |
Solvency ratio is the ratio of the solvency margin to the standard amount of solvency margin as defined and computed in accordance with the guidelines issued by the Financial Services Commission for life insurance companies. Under these guidelines, Shinhan Life Insurance is required to maintain a minimum solvency ratio of 100%. See “Item 4.B. Business Overview — Supervision and Regulation — Principal Regulations Applicable to Insurance Companies — Capital Adequacy.” |
| ITEM 5.C. |
Research and Development, Patents and Licenses, etc. |
Not applicable.
| ITEM 5.D. |
Trend Information |
These matters are discussed under Items 4.B., 5.A. and 5.B. above where relevant.
| ITEM 5.E. |
Critical Accounting Estimates |
Not applicable.
| ITEM 6. |
DIRECTORS, SENIOR MANAGEMENT AND EMPLOYEES |
| ITEM 6.A. |
Directors and Senior Management |
Executive Directors
Our executive director is as follows:
|
|
|
|
|
|
|
|
|
|
|
|
|
|
|
| Name |
|
Date of Birth |
|
|
Position |
|
Executive
Director Since |
|
|
Date Term
Ends(1) |
|
| Jin Okdong |
|
|
Feb. 21, 1961 |
|
|
Chief Executive Officer |
|
|
March 23, 2023 |
|
|
|
March 2026 |
|
Note:
| (1) |
The date on which the term will end will be the date of the general shareholders’ meeting in the relevant year. |
Jin Okdong is our Chief Executive Officer. Prior to being elected to his current position on March 23, 2023, Mr. Jin served as the chief executive officer of Shinhan Bank from 2019 to 2023. Mr. Jin served as the deputy president of Shinhan Financial Group from 2017 to 2018, the deputy president of Shinhan Bank in 2017 and the chief executive officer of Shinhan Bank Japan from 2015 to 2016. Mr. Jin received a master’s degree in business administration from Chung Ang University.
Non-Executive and Outside Directors
Non-executive directors are directors who are not our employees and do not hold executive officer positions with us. Outside directors are non-executive directors who also satisfy the requirements set forth under the Financial Investment Services and Capital Markets Act to be independent of our major shareholders, affiliates and management. Our non-executive directors are selected based on the candidates’ talents and skills in diverse areas, such as law, finance, economics, management and accounting. Currently, 10 non-executive directors are in office, all of whom were nominated by our board of directors and approved at a general meeting of shareholders.
238
Our non-executive and outside directors are as follows:
|
|
|
|
|
|
|
|
|
| Name |
|
Date of Birth |
|
Position |
|
Director Since |
|
Date Term
Ends(1) |
| Bae Hoon |
|
Mar. 30, 1953 |
|
Outside Director |
|
March 25, 2021 |
|
March 2024 |
| Sung Jae-ho |
|
Mar. 18, 1960 |
|
Outside Director |
|
March 27, 2019 |
|
March 2024 |
| Lee Yong Guk |
|
May 11, 1964 |
|
Outside Director |
|
March 25, 2021 |
|
March 2024 |
| Lee Yoon-jae |
|
Nov. 3, 1950 |
|
Outside Director |
|
March 27, 2019 |
|
March 2024 |
| Kim Jo Seol |
|
Dec. 5, 1957 |
|
Outside Director |
|
March 24, 2022 |
|
March 2024 |
| Choi Jae Boong |
|
Feb. 18, 1965 |
|
Outside Director |
|
March 25, 2021 |
|
March 2024 |
| Kwak Su Keun |
|
Aug. 16, 1953 |
|
Outside Director |
|
March 25, 2021 |
|
March 2024 |
| Yoon Jaewon |
|
Aug. 29, 1970 |
|
Outside Director |
|
March 26, 2020 |
|
March 2024 |
| Jin Hyun-duk |
|
Sep. 10, 1955 |
|
Outside Director |
|
March 26, 2020 |
|
March 2024 |
Note:
| (1) |
The date on which each term will end will be the date of the general shareholders’ meeting in the relevant year. |
Bae Hoon has been our outside director since March 25, 2021. Mr. Bae is a Korean lawyer and Certified Public Accountant in Japan and currently serves as a representative attorney at Orbis Legal Profession Corporation. Mr. Bae received a master’s degree in business administration from Kobe University.
Sung Jae-ho has been our outside director since March 27, 2019. Mr. Sung is currently a professor at Sung Kyun Kwan University School of Law. Mr. Sung previously served as a policy advisor of the Ministry of Unification in 2009 and the Ministry of Foreign Affairs and Trade in 2002. Mr. Sung also served as an outside director of NICE Holdings from 2018 to 2019 and Shinhan Card from 2015 to 2019, and chairman of Korea Council of International Law. Mr. Sung received a Ph.D. in law from Sung Kyun Kwan University.
Lee Yong Guk has been our outside director since March 25, 2021. Mr. Lee is a clinical professor at Seoul National University, School of Law. Mr. Lee was previously an attorney at Cleary Gottlieb Steen & Hamilton LLP for 27 years. Mr. Lee received a J.D. from Harvard University Law School.
Lee Yoon-jae has been our outside director since March 27, 2019. Mr. Lee served as an outside director for various Korean companies, such as LG, KT&G and S-Oil from 2006 to 2015. In addition, he held the chief executive officer position at KorEI from 2001 to 2010. Mr. Lee received a master’s degree in business administration from Stanford Graduate School of Business.
Kim Jo Seol has been newly appointed as our outside director since March 24, 2022. Ms. Kim is a Korean-Japanese professor who teaches economics at Osaka University of Commerce and economist with a high awareness of Northeast Asian economics. Ms Kim received a Ph.D. in economics from Osaka City University.
Choi Jae Boong has been our outside director since March 25, 2021. Mr. Choi currently serves as a professor of mechanical engineering at Sung Kyun Kwan University, College of Engineering and director of Human-centered Convergence Design BK(Brain Korea)21+ Project, which is a human resource development program initiated by the Government. Mr. Choi received a Ph.D. in mechanical engineering from University of Waterloo.
Kwak Su Keun has been our outside director since March 25, 2021. Mr. Kwak currently serves as an honorary professor of accounting at Seoul National University, Business School and chair of Corporate Governance Advisory Board at Korea Listed Companies Association. Mr. Kwak received a Ph.D in business administration from University of North Carolina Chapel Hill.
239
Yoon Jaewon has been our outside director since March 26, 2020. Ms. Yoon is currently a professor at Hongik University College of Business Administration and member of the committee for National Tax Service as well as the committee on national accounting policy of the Ministry of Economy and Finance and Korea Custom Service. Ms. Yoon previously served as a non-executive judge at the Tax Tribunal from 2013 to 2019. Ms. Yoon received a Ph.D in accounting from Korea University.
Jin Hyun-duk has been our outside director since March 26, 2020. Mr. Jin currently serves as the chief executive officer of Phoedra Co., Ltd. since 1988 and councilor of the Korea Educational Foundation. Mr. Jin was previously a professor at Sakushin-gakuin University and Utsunomiya University. Mr. Jin received a master’s degree in business administration from Keio Business School.
Any director wishing to enter into a transaction with Shinhan Financial Group or any of its subsidiaries in his or her personal capacity is required to obtain the prior approval of our board of directors. The director having an interest in the transaction may not vote at the meeting of our board of directors at which the relevant transaction is subject to vote for approval.
Executive Officers
In addition to the executive directors who are also our executive officers, we currently have the following executive officers.
|
|
|
|
|
|
|
| Name |
|
Date of Birth |
|
Position |
|
In Charge of |
| Jang Dong-ki |
|
Jan. 2, 1964 |
|
Deputy President |
|
Global Markets & Securities Business Group |
| Wang Ho-min |
|
Mar. 4, 1964 |
|
Deputy President and Chief Compliance Officer |
|
Compliance Team |
| Lee Een-kyoon |
|
Apr. 1, 1967 |
|
Deputy President and Chief Operation Officer |
|
Shinhan Leadership Center Management Support Team ICT Planning Team |
| Ahn Jun Sik |
|
May 1, 1965 |
|
Deputy President and Chief Public Relations Officer |
|
Brand PR Division |
| Kim Soung Jo |
|
Jan. 18, 1967 |
|
Deputy President |
|
Group Audit |
| Bang Dong-kwon |
|
Feb. 10, 1966 |
|
Deputy President and Chief Risk Officer |
|
Risk Management Team Risk Model Validation Team Credit Review Team |
| Lee Taekyung |
|
May. 30, 1966 |
|
Deputy President and Chief Financial Officer |
|
Finance Management Team Investor Relations Team Accounting Division |
| Kim Myoung Hee |
|
Jan. 16, 1968 |
|
Deputy President and Chief Digital Officer |
|
Digital Planning Team |
| Koh Seogheon |
|
Sept. 27, 1968 |
|
Deputy President and Chief Strategy & Sustainability Officer |
|
Strategic Planning Team ESG Planning Team |
| Kim Tae Youn |
|
Jul. 7, 1968 |
|
Executive Director and Head of Global and New Business Division |
|
Global and New Business Division |
None of the executive officers have any significant activities outside Shinhan Financial Group.
Jang Dong-ki has been our deputy president since January 1, 2018. Mr. Jang previously served as Chief Financial Officer of Shinhan Financial Group, the head of finance management team, managing director and the head of the capital market and trading division of Shinhan Bank. Mr. Jang received a bachelor’s degree in economics from Seoul National University.
240
Wang Ho-min has been our deputy president and chief compliance officer since January 1, 2019. Mr. Wang previously served as the branch manager of Southern Jam-sil branch, Seoul Southern District Court branch and the head of corporate culture development team. Mr. Wang received a bachelor’s degree in law from Hankuk University of Foreign Studies.
Lee Een-kyoon has been our deputy president and chief operation officer since January 1, 2019. Mr. Lee previously served as the head of management support team and the head of secretary’s office of Shinhan Bank. Mr. Lee received a bachelor’s degree in English literature from Hanyang University.
Ahn Jun Sik has been our deputy president and chief public relations officer since January 1, 2021. Mr. Ahn previously served as the head of Seocho Division at Shinhan Bank. Mr. Ahn received a bachelor’s degree in economics from Pusan National University.
Kim Soung Jo has been our deputy president since January 1, 2021. Mr. Kim previously served as the head of audit team at Shinhan Financial Group. Mr. Kim received a bachelor’s degree in economics from Seoul National University.
Bang Dong-kwon has been our chief risk officer since January 1, 2020. Mr. Bang previously served as the head of risk management department of Shinhan Bank. Mr. Bang received a bachelor’s degree in English language and literature from Sung Kyun Kwan University.
Lee Taekyung has been our deputy president and chief financial officer since January 1, 2022. Mr. Lee previously served as the CEO of Shinhan Bank Vietnam and the CEO of Shinhan Bank Cambodia. Mr. Lee received a bachelor’s degree in economics from Seoul National University.
Kim Myoung Hee has been our deputy president and chief digital officer since January 1, 2022. Before joining Shinhan Financial Group, Ms. Kim was the CEO, Hancom MDS Inc. Ms. Kim received a Ph.D. in Knowledge Consulting from Dankook University and master’s degree in Management Information System from Sogang University.
Koh Seogheon has been our executive director and chief strategy & sustainability officer since January 1, 2022. Mr. Koh previously served as the head of business management division and strategic planning team of Shinhan Financial Group. Mr. Koh received a bachelor’s degree in economics from Seoul National University.
Kim TaeYoun has been our executive director and head of accounting division since January 1, 2022. Mr. Kim previously served as the managing director of finance management team of Shinhan Financial Group. Mr. Kim received a bachelor’s degree in economics from Yonsei University.
There are no family relationships among our directors and/or executive officers.
The aggregate remuneration and benefits-in-kind paid by us to our chairman, our executive directors, our non-executive directors and our executive officers for the year ended December 31, 2022 was W6.3 billion, consisting of W4.5 billion in salaries and wages and W1.8 billion in bonus payments.
We do not offer any service contracts to outside directors upon their retirement, but we may offer such service contracts to certain members of our senior management upon termination of their employment with us. We do not pay any severance payment to outside directors upon their retirement, but we pay fixed sums of severance payment to members of our senior management pursuant to our internal guidelines on severance payments. In 2022, we accrued W0.2 billion for retirement bonus.
241
Prior to April 1, 2010, we granted stock options to our chairman, our president and chief executive officer and other directors and executive officers. Effective April 1, 2010, we ceased granting stock options. On March 18, 2015, the exercise period for all outstanding stock options expired, except for a limited number of stock options for which exercise of such stock options (and hence the expiration of the exercise period as well) were suspended by a resolution of the board of directors in December 2010. In May 2017 and September 2017, by a resolution of the board of directors, we lifted such suspension for a portion of the stock options. As of December 31, 2022, we have no stock options that remain unexercisable. We did not record any accrued expense for stock options in 2022.
During the period from March 20, 2007 to December 31, 2013, we granted “performance units” to certain high-ranking officers of select group companies. These performance units are performance-based cash compensation, the per-unit value of which is initially determined at the time of grant subject to adjustment after a fixed number of years based on the operating and financial performance of the relevant group company over the same or another fixed term, at the end of which a cash amount equal to the adjusted number of the performance units is paid out. For performance units granted prior to April 1, 2010, the performance review period was three years, and the payout was made at the end of the three-year term. For performance units granted on or after April 1, 2010 until December 31, 2013, the applicable performance review period is generally four years (and to a limited extent, five years), and the payment is made at the end of such four- or five-year term. We ceased granting performance units since January 1, 2014.
Since April 1, 2010, we have also granted “performance shares” to certain high-ranking officers of select group companies. The performance shares are conceptually similar to the performance units granted since April 1, 2010, in that the number of performance shares is based on the operating and financial performance of the relevant group company, except that the number of performance shares granted is adjusted on the basis of movements in the market price of our shares. The aggregate amount of performance shares granted to a given grantee is generally equal to the expected incentive compensation payable to such grantee for three years (in the case of performance shares granted prior to January 1, 2014) and one year (in the case of performance shares granted since January 1, 2014) of service starting from the grant date, which initial amount is computed based on the expected performance of the grantee’s company and the expected price movements of our shares over the applicable adjustment period, which is generally four years (and to a limited extent, five years). The performance shares are paid out in cash at the end of the applicable adjustment period (even if employment is terminated prior to such date), and the grantee is contractually and in accordance with our internal regulations required to use the payout solely to purchase our shares in the market at the then-prevailing market price (in the case of performance shares granted prior to January 1, 2014).
Neither performance units nor performance shares have been granted to outside directors. In 2022, we recognized no accrued expenses for performance units and W12.7 billion as accrued expenses for performance shares.
Under the Financial Supervisory Service’s standards for preparing corporate disclosure forms, which standards were amended in December 2016, we are required to disclose in our Korean annual report the individual annual compensation (including stock options) paid by us to our directors and statutory auditors if the individual annual compensation for such persons is W500 million or greater.
In 2022, Cho Yong-byoung, our former Chief Executive Officer, received W851 million, consisting of salaries and wages. In addition, in 2022, Mr. Cho was granted 26,747 performance shares. The exercisability of these performance shares will be determined based on a review of our business performance and share price movements during four years, beginning with the fiscal year in which such shares were granted.
The Group determines annual incentive compensation by conducting performance evaluations. Performance measures include quantitative measures, such as total shareholder return, profitability, risk-adjusted return, nonperforming loan ratios before sales and write-offs and efficiency ratios, as well as qualitative measures such
242
as the achievement of pre-established strategic initiatives. The Group determines long-term incentive compensation by conducting performance evaluations over a four-year period. Performance measures include quantitative measures, such as the relative stock price performance, net profit, adjusted ROE and non-performing loans ratio. The maximum number of performance shares that may be granted to directors of the board of the Group in respect of the fiscal year 2023 has been set at 30,000 shares in the aggregate.
| ITEM 6.C. |
Board Practices |
Board of Directors
Our board of directors, which currently consists of one executive director, one non-executive director and 9 outside directors, has the ultimate responsibility for the management of our affairs.
Our Articles of Incorporation provide for no less than three but no more than fifteen directors, the number of outside directors must be more than 50% of the total number of directors, and we must maintain at least three outside directors. All directors are elected for a term not exceeding three years as determined by the shareholders’ meeting, except that outside directors are elected for a term not exceeding two years, provided that the term of re-election shall not exceed one year and the term cannot be extended in excess of six years. The aggregate term served as an outside director of us or any of our subsidiaries shall not exceed nine years.
Terms are renewable and are subject to the Korean Commercial Code, the Financial Holding Companies Act, the Act on Corporate Governance of Financial Companies and related regulations. See “Item 6.A. Directors and Senior Management” above for information concerning the terms of office of our directors and executive officers.
Our board of directors meets on a regular basis to discuss and resolve material corporate matters. Additional extraordinary meetings may also be convened at the request of the chairman and chief executive officer or a director designated by the board.
Currently, there are no outstanding service contracts between any of our directors or executive officers and us or any of our subsidiaries providing for benefits upon termination of employment by such director or executive officer.
Committees of the Board of Directors
We currently have seven management committees that serve under the board:
| |
• |
|
the Risk Management Committee; |
| |
• |
|
the Remuneration Committee; |
| |
• |
|
the Committee for Recommending Candidates for Independent Directors and Members of Audit Committee; |
| |
• |
|
the Committee for Recommending Candidates for CEO; |
| |
• |
|
the Environment, Social and Governance (ESG) Strategy Committee; and |
| |
• |
|
the Subsidiary’s CEO Recommendation Committee. |
Each committee member is appointed by the board of directors, except for members of the Audit Committee, who are elected at the general meeting of shareholders.
243
Risk Management Committee
The Risk Management Committee currently consists of three outside directors, namely Lee Yong Guk (Chair), Sung Jae-ho and Choi Jae Boong. The committee oversees and makes determinations on all issues relating to our comprehensive risk management function. In order to ensure our stable financial condition and to maximize our profits, the committee monitors our overall risk exposure and reviews our compliance with risk policies and risk limits. In addition, the committee reviews risk and control strategies and policies, evaluates whether each risk is at an adequate level, establishes or abolishes risk management divisions, reviews risk-based capital allocations, and reviews the plans and evaluation of internal control. The committee holds regular meetings every quarter.
Audit Committee
The Audit Committee currently consists of three outside directors, namely Yoon Jaewon (Chair), Kwak Su Keun, Bae Hoon. The committee oversees our financial reporting and approves the appointment of and interaction with our independent auditors and our internal audit-related officers. The committee also reviews our financial information, audit examinations, key financial statement issues and the administration of our financial affairs by the board of directors. In connection with the general meetings of stockholders, the committee examines the agenda for, and financial statements and other reports to be submitted by, the board of directors for each general meeting of shareholders. The committee holds regular meetings every quarter.
Remuneration Committee
The Remuneration Committee currently consists of four outside directors, namely Sung Jae-ho (Chair), Kwak Su Keun, Kim Jo Seol, Lee Yoon-jae. At least one-half of the members of this committee must be outside directors and currently all members of Remuneration Committee are outside directors. This committee is responsible for reviewing and approving the management’s evaluation and compensation programs. The committee meetings are called by the chairman of this committee, who must be an outside director.
Committee for Recommending Candidates for Independent Directors and Members of Audit Committee
The Committee for recommending candidates for independent directors and members of audit committee currently consists of five outside directors, namely Choi Jae Boong (Chair), Kim Jo Seol, Yoon Jaewon, Jin Hyun-duk and Lee Yong Guk. Members of this committee will be appointed by our board of directors only to the extent necessary to recommend and nominate candidates for our outside director positions, audit committee members and related matters. However, when the procedure for final recommendation of outside director and audit committee member candidates commences, all outside directors are called to participate in the committee and in this case, all outside directors are deemed as enrolled. The committee meetings are called by the chairman of this committee, who must be an outside director. This committee is responsible and authorized for: (i) establishment, review and reinforcement of policies for outside director and audit committee member selection, (ii) recommendation of outside director and audit committee member candidates for approval at the general shareholders’ meeting and (iii) continual recruitment and screening of potential outside director candidates.
Committee for Recommending Candidates for CEO
The Committee for recommending candidates for Chief Executive Officer (CEO) was established in March 2012 and currently consists of six directors, namely Sung Jae-ho (Chair), Jin Hyun-duk, Lee Yoon-jae, Bae Hoon, Lee Yong Guk and Choi Jae Boong. However, when the meeting for final selection of candidates for Chief Executive Officer, all outside directors are called to participate in the committee and in this case, all outside directors are deemed as enrolled. This committee is responsible for matters concerning the recommendation of candidates for the CEO including establishing and reviewing our management succession plan and its operation,
244
setting and evaluating the qualifications and criteria for the CEO and CEO candidate pool and other matters necessary for improving our overall corporate governance structure. The chair of the committee must be an outside director, and the incumbent CEO may be restricted from participating and voting on matters related to the CEO selection.
Environmental, Social and Governance (ESG) Strategy Committee
The ESG Strategy Committee was established in March 2015 and currently consists of five directors, namely Kwak Su Keun (Chair), Kim Jo Seol, Yoon Jaewon, Lee Yong Guk and Jin Okdong. This committee is responsible for setting the corporate policy for sustainable management, corporate disclosure of sustainability report and discussing specific business agenda in relation to socially responsible management and other matters such as corporate strategy toward climate change.
Subsidiary’s CEO Recommendation Committee
The Subsidiary’s CEO Recommendation Committee was established in March 2021 and currently consists of five directors, namely Jin Okdong (Chair), Kwak Su Keun, Lee Yoon-jae, Bae Hoon, Sung Jae-ho. This committee is responsible for matters concerning the evaluation of subsidiary management leadership, establishment of subsidiary CEO qualifications, verification and recommendation of subsidiary CEO candidates and other matters deemed necessary by the committee.
At the holding company level, we had 152, 165 and 171 regular employees as of December 31, 2020, 2021 and 2022, respectively, almost all of whom are employed within Korea. Our subsidiaries had 21,500, 21,365 and 22,700 regular employees as of December 31, 2020, 2021 and 2022, respectively, almost all of whom are employed within Korea. In addition, we had seven, three and five non-regular employees at the holding company level as of December 31, 2020, 2021 and 2022, respectively, and 1,436, 1,942 and 2,041 non-regular employees at the subsidiary level as of December 31, 2020, 2021 and 2022, respectively. Of the total number of regular and non-regular employees at both the holding company and subsidiaries, approximately 1.07% were managerial or executive employees.
8,799 employees of Shinhan Bank and 311 employees of Jeju Bank were members of the Korean Financial Industry Union as of December 31, 2022. 2,107 employees of Shinhan Card were members of the Korean Federation of Clerical and Financial Labor Union as of December 31, 2022. 2,687 employees of Shinhan Securities, 1,221 employees of Shinhan Life Insurance and 210 employees of Shinhan AITAS were members of the Korea Finance & Service Workers’ Union as of December 31, 2022.
Under Korean law, we may not terminate full time employees except under limited circumstances.
Since our acquisition of Chohung Bank in 2003, we have not experienced any general employee work stoppages and consider our employee relations to be good.
Under the Korean National Pension Law, we annually contribute an amount equal to 4.5% of employee wages, and each employee contributes 4.5% of his or her wages, to the National Pension Management Corporation. In addition, pursuant to the Employee Retirement Security Act, we operate a retirement pension system under which we make annual contributions to pension funds managed by financial institutions (which replaced our former retirement pension system under which we managed the pension fund in-house) that provide employees both regular pension payments and a lump sum payment upon termination of employment. We believe that our retirement pension system confers the following benefits: (1) insulation of employees from the risk of default on their pension payments as the pension funds are deposited with large financial institutions; (2) offer of varied forms of payment, i.e., regular pension payments and a lump sum payment, upon termination
245
of employment; (3) offer to employees the option to make investment decisions for his or her individual pension account and (4) elimination of the ability of employees to cash in his or her retirement fund prematurely, thereby guaranteeing such employee a lump sum payment upon termination of employment. Under this retirement pension system, we and our subsidiaries can opt for either a defined benefit plan or a defined contribution plan, or a combination of both. Under the defined benefit plan, the amount of pension payable upon an employee’s retirement is fixed in advance, and the employer is responsible for making the requisite payments to the pension fund and making investment decisions in relation to the fund assets. Under the defined contribution plan, the employee sets aside a fixed percentage or amount of his salaries to the pension fund and exercises investment decisions for his or her individual pension account. As of December 31, 2020, 2021 and 2022, we recognized liabilities (asset) for defined benefit obligations of W44 billion, W(91) billion and W(605) billion, respectively. See Note 25 of the notes to our consolidated financial statements included in this annual report.
| ITEM 6.E. |
Share Ownership |
As of March 15, 2023, the persons who are currently our directors or executive officers, as a group, beneficially held an aggregate of 84,784 shares of our common stock, representing approximately 0.02% of our outstanding common stock as of such date. None of these persons individually held more than 1% of our outstanding common stock as of such date.
Members of the employee stock ownership association have certain pre-emptive rights in relation to our shares that are publicly offered under the Financial Investment Services and Capital Markets Act. As of December 31, 2022, the employee stock ownership association owned 26,121,183 shares of our common stock.
Prior to April 1, 2010, we granted stock options to our chairman, our president and chief executive officer and other directors and executive officers. Effective April 1, 2010, we ceased granting stock options. On March 18, 2015, the exercise period for all outstanding stock options expired, except for a limited number of stock options for which exercise of such stock options (and hence the expiration of the exercise period as well) were suspended by a resolution of the board of directors in December 2010. In May 2017 and September 2017, by a resolution of the board of directors, we lifted such suspension for a portion of the stock options. As of December 31, 2022, there were no unexercisable stock options.
On February 1, 2019, we acquired a 59.15% interest in Orange Life Insurance. On January 28, 2020, we acquired the remaining interests in Orange Life Insurance by effecting a comprehensive stock exchange under Articles 360-2 of the Korean Commercial Code. As part of the comprehensive stock exchange, we transferred 980,780 shares of our common stock to Orange Life Insurance in exchange for 1,485,697 treasury shares of Orange Life Insurance held by Orange Life Insurance in accordance with the exchange ratio for the comprehensive stock exchange. Pursuant to paragraph (2) of Article 342-2 of the Korean Commercial Code, Orange Life Insurance was required to dispose of these shares of our common stock within six months from the acquisition date. In addition, we also transferred 5,514,807 shares of our common stock to Orange Life Insurance in exchange for 8,353,891 shares of Orange Life Insurance which were purchased by Orange Life Insurance as a result of the exercise of appraisal rights by dissenting shareholders of Orange Life Insurance. Pursuant to paragraph (1) of Article 62-2 of the Financial Holding Company Act, Orange Life Insurance was required to dispose of these shares of our common stock within three years from the acquisition date. The acquisition date of these shares of common stock was December 30, 2020. Orange Life Insurance disposed all of such shares as of January 28, 2021. Orange Life Insurance was subsequently merged with and into Shinhan Life Insurance in July 2021.
On September 29, 2020, we acquired a 96.8% interest in Neoplux, a venture capital company formerly under the Doosan Group. On December 30, 2020, we acquired the remaining interest in Neoplux by effecting a small-scale stock exchange under Article 360-10 of the Korean Commercial Code. As part of the small-scale stock exchange, we transferred 7,153 shares of our common stock to Neoplux in exchange for 80,090 treasury shares of Neoplux held by Neoplux in accordance with the exchange ratio for the small-scale stock exchange.
246
Pursuant to paragraph (2) of Article 342-2 of the Korean Commercial Code, Neoplux was required to dispose of these shares of our common stock within six months from the acquisition date. In addition, we also transferred 1,755 shares of our common stock to Neoplux in exchange for 19,653 shares of Neoplux which were purchased by Neoplux as a result of the exercise of appraisal rights by dissenting shareholders of Neoplux. Pursuant to paragraph (1) of Article 62-2 of the Financial Holding Company Act, Neoplux was required to dispose of these shares of our common stock within three years from the acquisition date. The acquisition date of these shares of common stock was December 30, 2020. Neoplux subsequently changed its name to Shinhan Venture Investment on January 11, 2021 and disposed all of such shares as of March 8, 2021.
On September 29, 2020, partly in response to the prolonged COVID-19 pandemic and to increase our loss absorption capacity, we issued 39,130,000 common shares to two private equity funds, thereby increasing our paid-in capital by W195.7 billion.
| ITEM 6.F. |
Disclosure of a Registrant’s Action to Recover Erroneously Awarded Compensation |
Not Applicable.
| ITEM 7. |
MAJOR SHAREHOLDERS AND RELATED PARTY TRANSACTIONS |
| ITEM 7.A. |
Major Shareholders |
The following table sets forth certain information relating to the beneficial ownership of our common shares as of December 31, 2022.
|
|
|
|
|
|
|
|
|
| Name of Shareholder |
|
Number of Common
Shares Beneficially Owned |
|
|
Beneficial
Ownership (%) |
|
| National Pension Service |
|
|
40,476,692 |
|
|
|
7.96 |
% |
| BlackRock Fund Advisors(1) |
|
|
30,250,549 |
|
|
|
5.95 |
% |
| Shinhan Financial Group Employee Stock Ownership Association |
|
|
26,121,183 |
|
|
|
5.13 |
% |
| Centennial Investment Limited |
|
|
20,239,539 |
|
|
|
3.98 |
% |
| BNP Paribas SA |
|
|
18,690,310 |
|
|
|
3.67 |
% |
| Supreme, L.P. |
|
|
18,690,000 |
|
|
|
3.67 |
% |
| Citibank, N.A. (ADR Department) |
|
|
15,254,583 |
|
|
|
3.00 |
% |
| The Government of Singapore |
|
|
13,078,530 |
|
|
|
2.57 |
% |
| KT |
|
|
10,877,651 |
|
|
|
2.14 |
% |
| Vanguard Total International Stock Index |
|
|
6,602,322 |
|
|
|
1.30 |
% |
| Norges Bank |
|
|
5,168,159 |
|
|
|
1.02 |
% |
| Others |
|
|
303,335,351 |
|
|
|
59.62 |
% |
|
|
|
|
|
|
|
|
|
| Total |
|
|
508,784,869 |
|
|
|
100.00 |
% |
|
|
|
|
|
|
|
|
|
Note:
| (1) |
Based on Form SC 13G filed by BlackRock, Inc. on February 13, 2023. |
As of December 31, 2022, the number of treasury shares held by us is 6,352 common shares, which do not have voting rights. Other than those listed above, no other person or entity known by us, jointly or severally, directly or indirectly own more than 1% of our issued and outstanding voting securities or otherwise exercise control or could exercise control over us. None of our shareholders have different voting rights.
As of the date hereof, our total authorized share capital is 1,000,000,000 shares, par value W5,000 per share.
As of December 31, 2022, the latest date on which we closed our shareholders’ registry, 606 shareholders of record were notated as U.S. persons, holding in the aggregate 23.89% of our then total outstanding shares
247
(including Citibank, N.A., as the depositary for our American depositary shares, each representing one share of our common stock effective October 15, 2012, prior to which each American depositary share represented two common shares).
| ITEM 7.B. |
Related Party Transactions |
Since the beginning of the preceding three financial years, none of our directors or officers has or had any transactions with us that are or were unusual in their nature or conditions or significant to our business, other than as set forth below and also described in Note 45 of the notes to our consolidated financial statements included in this annual report.
In December 2001, BNP Paribas acquired 4.00% of our common stock in return for an investment of approximately W155 billion in cash pursuant to an alliance agreement. Under the terms of the alliance agreement, for so long as BNP Paribas does not sell or otherwise transfer (except to any of its wholly-owned subsidiaries) any portion of its ownership interest in our common stock and maintains, after any issuances of new shares by us from time to time, its shareholding percentage of not less than 3.5% of our issued common stock, we are required to call a meeting of our shareholders to recommend that one nominee of BNP Paribas be elected to our board of directors. In addition, under the alliance agreement, BNP Paribas has the right to subscribe for new issuances of our common shares in the event that such new issuances would result in the dilution of the shareholding percentage of BNP Paribas below 3.5%. As of December 31, 2022, BNP Paribas held 18,690,310 shares, or 3.67% of our total common stock.
As of December 31, 2020, 2021 and 2022, we had principal loans outstanding to our directors, executive officers and their affiliates in the principal amount of W5.1 billion, W6.1 billion and W6.6 billion, which were made in the ordinary course of business on substantially the same terms, including interest rate and collateral, as those prevailing at the time for comparable transactions with other persons, and did not involve more than the normal risk of collectability or present other unfavorable features.
| ITEM 7.C. |
Interests of Experts and Counsel |
Not applicable.
| ITEM 8. |
FINANCIAL INFORMATION |
| ITEM 8.A. |
Consolidated Statements and Other Financial Information |
See “Item 18. Financial Statements” and our consolidated financial statements included in this annual report.
Legal Proceedings
We and our subsidiaries are involved in various legal actions and regulatory proceedings arising from the normal course of business. As of December 31, 2022, we and our subsidiaries were defendants in pending lawsuits (including regulatory proceedings) in the aggregate claim amount of W531 billion, for which we recorded a provision of W29 billion. We also recorded additional W4 billion for insurance contract liabilities (reserve for claims) for litigations, etc.
In October 2018, the Financial Supervisory Service requested Shinhan Bank to submit supporting documents in connection with allegations of inadequate compliance controls. In November 2018, the Financial Supervisory Service notified Shinhan Bank of an institutional caution for alleged deficiencies in its customer due diligence and imposed an administrative fine of W100 million citing negligence in carrying out its customer verification obligations. In December 2019, the Financial Supervisory Service notified Shinhan Bank of an institutional caution and imposed an administrative fine of W3 billion for alleged prohibited activities, including
248
promotional activities for specified money trusts, investment solicitation for derivatives and management of trust properties. In 2021, the Korea Exchange imposed a total of three penalties on Shinhan Securities for regulatory violations, totaling W2.7 million in fines. In 2021, the Financial Supervisory Service imposed a total of eight penalties against Shinhan Securities for regulatory violations, totaling W4,092 million in fines, which include a fine of W1,800 million for certain employees’ violation of conflict of interest obligations in connection with the Lime Asset incident and a fine of W1,160 million for violation of rules against advertising certain money trust products. In 2022, the Korea Exchange imposed a total of four penalties on Shinhan Securities for regulatory violations, totaling W2.0 million in fines. In 2022, the Financial Supervisory Service imposed a total of four penalties against Shinhan Securities for regulatory violations, totaling W600.9 million in fines. In January 2020, the Financial Supervisory Service notified Shinhan Life Insurance of an institutional caution and imposed an administrative fine of W266 million for allegedly omitting certain information regarding the level of expenses deducted from premiums paid when selling savings insurance products over the telephone. In February 2021, the Financial Supervisory Service notified Shinhan Bank of an institutional warning and imposed an administrative fine of W2.1 billion for reasons including alleged violation of internal regulations and reporting procedures in connection with Shinhan Bank’s designation as the primary bank for Seoul Metropolitan Government in 2018. In March 2021, the Financial Supervisory Service notified Shinhan Bank of an institutional caution and imposed an administrative fine of W31.2 million for alleged violation of the safety standard in operating its information system in respect of the electronic financial transaction and alleged negligence in notifying its customers of the errors occurred to the electronic financial transaction and measures taken to correct the errors. In January 2021, the Financial Services Commission imposed a fine of W28.8 million on Shinhan Card citing failure to discard personal information after transaction.
On September 17, 2018, the Prosecutors’ Office indicted our former Chief Executive Officer, who previously served as Shinhan Bank’s president, chief executive officer and executive director from March 2015 through March 2017, for allegedly influencing the hiring process of new employees in an illegal manner while he occupied such position at Shinhan Bank. On June 30, 2022, he was acquitted by the Supreme Court of such allegations. We believe that we have robust and fair internal procedures for hiring new employees. As part of Shinhan Bank’s efforts to enhance fairness and transparency of its hiring practices, Shinhan Bank has adopted the model hiring procedures promulgated by the Korea Federation of Banks, and beginning in 2018 has established a hiring committee consisting of third-party human resources experts and internal compliance officers.
In August 2019, the Financial Supervisory Service launched an investigation into Lime Asset, Korea’s largest hedge fund managing approximately W4.1 trillion in assets as of December 31, 2020, including with regards to allegations that Lime Asset had concealed the fact that it had changed the multi-manager trade finance fund’s investment method and concealed losses in their trade finance funds. Beginning in October 2019, Lime Asset suspended withdrawals from certain of its funds, freezing approximately W1.7 trillion in total as of the end of 2019, according to the Financial Supervisory Service. According to Financial Supervisory Service investigations, Lime Asset’s W211 billion trade finance fund was found to have been associated with a debacle involving the IIG, a New York-based investment adviser charged with securities fraud and running a Ponzi scheme. On November 26, 2019, the SEC revoked the registration of IIG for allegedly overvaluing defaulted loans in the fund’s portfolio to conceal losses in its flagship hedge fund and selling at least $60 million in fake loan assets to clients. According to the Financial Supervisory Service, Lime Asset signed a contract with a Singaporean commodity trader, which took over Lime Asset’s ownership stake in an IIG fund in June 2019, with the Singaporean entity issuing promissory notes to Lime Asset, and Lime Asset did not properly disclose to its investors such change in the fund’s investment target from the IIG fund to promissory notes.
Certain investors in funds of Lime Asset have filed dispute mediation claims to the Financial Supervisory Service and criminal and civil claims against Lime Asset, as well as against financial institutions that have sold such products, claiming they learned of the change in the trade finance fund’s investment method and losses only in October 2019 and that they were also misguided and not fully informed of the risks associated with these funds when investing in such products. The Financial Supervisory Service conducted a comprehensive audit in November and December 2019. In February 2020, the Prosecutors’ Office of Korea announced that they had
249
launched an investigation into Lime Asset as well as Shinhan Securities and also searched Shinhan Bank’s headquarters on July 1, 2020 in connection with this matter. In November 2020, the Financial Supervisory Service imposed a partial business suspension on Shinhan Securities and suspension from duties and a cautionary warning to its two former CEOs. On December 5, 2021, the Supreme Court concluded that a former employee of Shinhan Securities was partially guilty on charges of conspiring to conceal from investors Lime Asset’s losses and change in investment target and imposed a sentence of eight years’ imprisonment and a W300 million fine. On December 10, 2021, the Financial Supervisory Service imposed a partial business suspension and a fine of W4 billion on Shinhan Securities, and a cautionary warning on two former employees of Shinhan Securities in connection with alleged violations of the Capital Markets Act and the Act on Real Name Financial Transactions and Confidentiality. On February 14, 2023, a fine of W1.8 billion on Shinhan Securities was confirmed. On March 15, 2023, Seoul Southern District Court imposed a fine of W50 million on Shinhan Securities for violation of the Financial Investment Services and Capital Markets Act of Korea in failing to properly monitor its employees involved in the sale of Lime Asset products. On April 22, 2021, the sanctions committee of the Financial Supervisory Service recommended a partial business suspension and fine of W8.7 billion on Shinhan Bank, a cautionary warning to the CEO of Shinhan Bank, an institutional caution and fine of W50 million on Shinhan Financial Group and a caution to the CEO of Shinhan Financial Group in connection with Shinhan Bank’s alleged improper solicitation of troubled Lime Asset funds and management’s oversight in risk management. On July 11, 2022, the partial business suspension and the fine of W5.7 billion on Shinhan Bank and a cautionary warning to the CEO of Shinhan Bank were confirmed. The fine on Shinhan Financial Group recommended by the sanctions committee will be deliberated at the Securities and Futures Commission of the Financial Services Commission and will be confirmed if approved at a regular meeting of the Financial Services Commission.
In May 2020, Shinhan Securities announced that its board of directors has resolved to compensate certain investors for amounts ranging between 30% to 70% (in the case of retail investors) and 20% to 50% (in the case of institutional investors) of the amount of such investor’s investment in Lime Asset products. In June 2020, Shinhan Bank announced that its board of directors has resolved to make prepayments to investors in certain Lime Asset funds that have reached maturity in an amount equal to 50% of such investor’s investment in the relevant product. On June 30, 2020, the Financial Dispute Mediation Committee of the Financial Supervisory Service recommended through a non-binding ruling for brokerages, including Shinhan Securities, to return 100% of the amount of investors’ investment in certain of Lime Asset products sold after November 2018 in the aggregate of approximately W161 billion. In August 2020, the board of directors of Shinhan Securities resolved to accept the non-binding ruling for certain Lime Asset’s trade finance funds sold around November 2018. With these resolutions by the board of directors of Shinhan Securities, the total amount of compensation to investors of Lime Asset funds that Shinhan Securities has agreed to pay has reached W42.46 billion. On April 19, 2021, the Financial Dispute Mediation Committee of the Financial Supervisory Service recommended through a non-binding ruling that Shinhan Bank compensate investors in such Lime Asset funds in amounts ranging from 40% to 80% of the losses incurred by the investors by way of making prepayments, with adjustments to be made depending on particular facts, such as the nature of the investor (e.g., whether retail or institutional investor, the age and experience level of the investor, etc.) and adequacy of documentation. In 2022, in accordance with such compensation guideline recommended by the Financial Dispute Mediation Committee, Shinhan Bank completed its voluntary settlement process with substantially all of such investors in Lime Asset funds.
In June 2020, the Financial Supervisory Service launched an investigation into Discovery Asset Management Co., Ltd. (“Discovery Asset”), which operated funds that invested in certain funds in the U.S. managed by Direct Lending Investment, LLC (“DLI”). In April 2019, the U.S. Securities and Exchange Commission obtained a preliminary injunction and order appointing a receiver to freeze DLI’s funds based on the complaint that DLI fabricated values of its assets under management and reported returns. In response, Discovery Asset suspended withdrawals from funds under its management, thereby freezing approximately W256 billion in total of its investors’ funds as of April 2019. While neither Shinhan Bank nor Shinhan Securities was involved in sale of such DLI-related funds structured by Discovery Asset, Shinhan Bank and Shinhan Securities did sell other Discovery Asset funds (affected by such suspension of withdrawal) to investors in Korea. Between 2017 and 2019, Shinhan
250
Bank and Shinhan Securities sold approximately W93.6 billion and W50.8 billion, respectively, of such Discovery Asset products (unrelated to DLI funds), of which only Shinhan Bank has recovered approximately W45.1 billion from Discovery Asset. In 2022, Shinhan Bank completed its voluntary settlement process with substantially all of such investors in Discovery Asset funds, and Shinhan Securities is in discussion with the investors to settle these amounts based on mutually agreeable terms.
From May 2017 to December 2018, Shinhan Securities sold approximately W390.7 billion of certain German Heritage DLS Products. As of December 31, 2022, the principal amount of German Heritage DLS Products that have become eligible for payment but for which payment has been delayed is W379.9 billion. The German Heritage DLS Products are derivative-linked trust products where performance is based on underlying Singapore funds that invest in Germany’s monument status building development projects. Since July 2019, maturity payments have been delayed on the German Heritage DLS Products as recovery on the underlying funds has been delayed. In March 2020, Shinhan Securities announced that its board of directors has resolved to make prepayments to investors who have consented to the extension of maturity in an amount equal to 50% of the amount of such investor’s investments in the German Heritage DLS Products. As of December 31, 2022, Shinhan Securities recognized W343.8 billion in non-operating expenses as provisions for potential future compensation in connection with the sale of German Heritage DLS Products.
The prepayments made or to be made by Shinhan Bank and Shinhan Securities to investors of Lime Asset funds, Discovery Asset funds and German Heritage DLS Products, respectively, as explained above, have been or will be, as the case may be, settled at the time of recovery of the underlying funds. If the amount recovered on the underlying fund is less than the amount prepaid to investors, Shinhan Bank and Shinhan Securities may not be able to recover from investors the amount of the prepaid amount that is in excess of the recovered amount and accordingly suffer losses. Depending on the performance of such underlying funds, we may record provisions for credit loss allowance to account for expected future losses.
During the fiscal year 2022, Shinhan Bank and Shinhan Securities recorded W54.6 billion and W116.2 billion, respectively, for credit loss allowance to account for expected future losses associated with financial products, including Lime Asset, Discovery Asset and German Heritage DLS Products. Depending on a variety of factors, including those outside the control of Shinhan Bank or Shinhan Securities, such as the performance of the underlying funds and progression of discussions with investors, Shinhan Bank or Shinhan Securities may record additional provisions for credit loss allowance to account for expected future losses from these or other financial products, and there is no guarantee that such amounts, if any, will not be significant. In response to increased incidents involving alleged improper sales of financial products such as those involving Lime Asset products, Discovery Asset products and German Heritage DLS Products, we have taken additional measures to improve our risk management systems and internal controls to prevent similar incidents. Shinhan Bank and Shinhan Securities have each updated their internal controls and performance evaluation systems and have made improvements to various stages of the sales cycle for financial products. For example, Shinhan Bank and Shinhan Securities have both upgraded their product review departments (which were initially under the investment products and services divisions) to independent divisions, thereby facilitating independent review and thorough assessment of the merits of financial products prior to such products being sold through sales channels. In addition, we have modified the composition of key performance indicators used as a basis for personnel evaluations and promotions to move away from simply increasing the volume of sales, thereby further incentivizing employees to adhere to prudent sales practices and avoid speculative or high risk sales.
In June 2022, Shinhan Bank voluntarily reported to the Financial Supervisory Service certain overseas wire transfers made in 2020 and 2021 which Shinhan Bank had detected as unusual based on its internal monitoring system. After similar activities were also reported by another major Korean bank, the Financial Supervisory Service launched an investigation in August 2022 into wire transfers made under similar circumstances across all major banks in Korea, including Shinhan Bank. In an interim report released in September 2022, the Financial Supervisory Service reported that approximately more than US$7.2 billion of suspicious overseas wire transfers were made through 12 banks, of which approximately US$2.36 billion had been wired through Shinhan Bank and
251
that at least some of these transfers were allegedly related to cryptocurrency arbitrage transactions. The Financial Supervisory Service and the Seoul Central District Prosecutor’s Office are currently investigating these wire transfers and the parties involved, including in relation to any violation of certain monitoring and reporting obligations under the Foreign Exchange Transactions Act of Korea and the Act on Reporting and Use of Certain Financial Transaction Information of Korea. In December 2022, the Financial Supervisory Service made a recommendation to improve Shinhan Bank’s fraud detection system, including allocating sufficient staff and establishing a computer system dedicated to identifying digital asset-related transactions and assessing risks related to digital asset management. Such investigations are ongoing, and it is difficult to predict the results of these proceedings and the potential impact they may have on us.
As of the date hereof, our management believes that these proceedings will not have a material adverse effect on our financial condition, equity or results of operations. However, although we plan to rigorously defend our positions in the lawsuits or other regulatory proceedings against us, it is difficult to predict the final outcome of these proceedings and the potential impact these proceedings and related events may have on our financial condition, equity or results of operations. The total amount in dispute may increase during the course of litigation, and other lawsuits may be brought against us based on similar allegations. Accordingly, we cannot assure you that these proceedings and related events will not have an adverse effect on our business, financial condition and results of operations. For further details of these and other litigations, see Note 43 of the notes to our consolidated financial statements.
Dividend Policy
For a detailed description on the dividend policy, please see “Item 10.B. Memorandum and Articles of Incorporation — Description of Share Capital — Dividends.”
| ITEM 8.B. |
Significant Changes |
Except as disclosed elsewhere in this annual report, we have not experienced any significant changes since the date of our audited consolidated financial statements included in this annual report.
| ITEM 9. |
THE OFFER AND LISTING |
| ITEM 9.A. |
Offer and Listing Details |
Market Prices of Common Stock and American Depositary Shares
The principal trading market for our common shares is the KRX KOSPI Market Division of the Korea Exchange, where our common shares were listed on September 10, 2001. Our American depositary shares have been listed on the New York Stock Exchange since September 16, 2003 and are identified by the symbol “SHG.”
252
The table below sets forth, for the periods indicated, the high and low closing prices and the average daily volume of trading activity on the Korea Exchange for our common stock since 2017, and their high and low closing prices and the average daily volume of trading activity on the New York Stock Exchange for our American depositary shares since 2017.
|
|
|
|
|
|
|
|
|
|
|
|
|
|
|
|
|
|
|
|
|
|
|
|
|
| |
|
Korea Exchange |
|
|
New York Stock Exchange |
|
| |
|
Closing Price per
Common Stock |
|
|
Average
Daily
Trading
Volume |
|
|
Closing Price per ADS |
|
|
Average
Daily
Trading
Volume |
|
| |
|
High |
|
|
Low |
|
|
(Shares) |
|
|
High |
|
|
Low |
|
|
(ADSs) |
|
| 2018 |
|
|
53,400 |
|
|
|
39,050 |
|
|
|
1,024,181 |
|
|
|
50.35 |
|
|
|
34.78 |
|
|
|
101,168 |
|
| 2019 |
|
|
48,000 |
|
|
|
38,350 |
|
|
|
987,989 |
|
|
|
40.54 |
|
|
|
32.23 |
|
|
|
85,258 |
|
| 2020 |
|
|
42,750 |
|
|
|
22,200 |
|
|
|
2,366,124 |
|
|
|
37.45 |
|
|
|
17.37 |
|
|
|
144,214 |
|
| 2021 |
|
|
43,000 |
|
|
|
30,650 |
|
|
|
1,784,390 |
|
|
|
39.07 |
|
|
|
27.67 |
|
|
|
112,478 |
|
| First Quarter |
|
|
37,450 |
|
|
|
30,650 |
|
|
|
2,987,958 |
|
|
|
33.54 |
|
|
|
27.67 |
|
|
|
126,331 |
|
| Second Quarter |
|
|
43,000 |
|
|
|
36,350 |
|
|
|
1,570,402 |
|
|
|
39.07 |
|
|
|
32.94 |
|
|
|
124,956 |
|
| Third Quarter |
|
|
40,400 |
|
|
|
37,100 |
|
|
|
1,339,266 |
|
|
|
35.67 |
|
|
|
31.66 |
|
|
|
97,602 |
|
| Fourth Quarter |
|
|
40,700 |
|
|
|
34,650 |
|
|
|
1,290,183 |
|
|
|
34.67 |
|
|
|
29.14 |
|
|
|
101,702 |
|
| 2022 |
|
|
43,200 |
|
|
|
33,400 |
|
|
|
1,303,530 |
|
|
|
34.60 |
|
|
|
23.00 |
|
|
|
154,790 |
|
| First Quarter |
|
|
41,500 |
|
|
|
36,400 |
|
|
|
1,531,090 |
|
|
|
34.32 |
|
|
|
29.41 |
|
|
|
162,315 |
|
| Second Quarter |
|
|
43,200 |
|
|
|
37,050 |
|
|
|
1,287,123 |
|
|
|
34.60 |
|
|
|
28.56 |
|
|
|
123,982 |
|
| Third Quarter |
|
|
37,900 |
|
|
|
33,400 |
|
|
|
1,259,431 |
|
|
|
28.92 |
|
|
|
23.00 |
|
|
|
178,305 |
|
| Fourth Quarter |
|
|
38,500 |
|
|
|
34,500 |
|
|
|
1,148,202 |
|
|
|
29.67 |
|
|
|
23.59 |
|
|
|
153,817 |
|
| October |
|
|
37,050 |
|
|
|
34,500 |
|
|
|
1,262,222 |
|
|
|
25.79 |
|
|
|
23.59 |
|
|
|
206,267 |
|
| November |
|
|
38,100 |
|
|
|
35,550 |
|
|
|
1,117,029 |
|
|
|
29.02 |
|
|
|
24.79 |
|
|
|
153,786 |
|
| December |
|
|
38,500 |
|
|
|
35,200 |
|
|
|
1,077,698 |
|
|
|
29.67 |
|
|
|
27.93 |
|
|
|
101,400 |
|
| 2023 (through April 17) |
|
|
44,900 |
|
|
|
34,300 |
|
|
|
1,607,873 |
|
|
|
36.62 |
|
|
|
25.59 |
|
|
|
153,715 |
|
| January |
|
|
44,900 |
|
|
|
34,300 |
|
|
|
1,915,676 |
|
|
|
36.62 |
|
|
|
27.48 |
|
|
|
117,425 |
|
| February |
|
|
42,450 |
|
|
|
37,900 |
|
|
|
1,546,140 |
|
|
|
35.09 |
|
|
|
29.23 |
|
|
|
132,916 |
|
| March |
|
|
37,700 |
|
|
|
34,450 |
|
|
|
1,670,581 |
|
|
|
29.74 |
|
|
|
25.59 |
|
|
|
197,504 |
|
| April (through April 17) |
|
|
35,500 |
|
|
|
34,300 |
|
|
|
1,082,793 |
|
|
|
27.11 |
|
|
|
26.14 |
|
|
|
165,100 |
|
Source: Korea Exchange; New York Stock Exchange.
| ITEM 9.B. |
Plan of Distribution |
Not applicable.
The Korea Exchange
Pursuant to the Korea Stock and Futures Exchange Act, as of January 27, 2005, the Korea Stock Exchange, which began its operations in 1956, the KRX KOSDAQ, which began its operation on July 1, 1996, and the Korea Futures Exchange (as an exchange operating futures market and options market), which began its operation on February 1, 1999, were unified to form the Korea Exchange.
The Korea Exchange was established in a form of a limited liability stock company in accordance with the Korean Commercial Code with the minimum paid-in capital of W100 billion in accordance with the Financial Investment Services and Capital Markets Act. Historically, the Korea Exchange was the only exchange authorized under the Financial Investment Services and Capital Markets Act. On May 28, 2013, however, the Financial Investment Services and Capital Markets Act was amended to implement a license system under which a license may be granted to an exchange upon satisfaction of certain requirements. In addition, the Financial
253
Services Commission has authorized the establishment of alternative trading systems that engage in the trading of listed beneficial certificates, among other things, for a multiple number of parties through electronic means. Notwithstanding the foregoing regulatory developments, the Korea Exchange is presently the only duly licensed exchange in Korea and there have been no definitive developments regarding newly licensed exchanges or alternative trading systems in Korea. The Korea Exchange operates and supervises four market divisions, the KRX KOSPI Market Division, the KRX KOSDAQ Market Division, the KRX Futures Market Division and the KRX KONEX Market Division. It has its principal office in Busan.
As of December 29, 2022, the aggregate market value of equity securities listed on the KOSPI was approximately W1,767 trillion. The average daily trading volume of equity securities for 2022 was approximately 595 million shares with an average transaction value of W9,008 billion.
Even though the Financial Investment Services and Capital Markets Act prescribed that the Korea Exchange be established in a form of a limited liability stock company, the Korea Exchange is expected to play a public role as a public organization. In order to safeguard against a possible conflict, the Financial Investment Services and Capital Markets Act has placed restrictions on the ownership and operation of the Korea Exchange and any newly established exchanges approved by the Financial Services Commission as follows:
| |
• |
|
Any person’s ownership of shares in the Korea Exchange is limited to 5% or less except for an investment trust company or investment company established under the Financial Investment Services and Capital Markets Act, or the Government. However, more than 5% ownership in Korea Exchange is permitted if necessary for forming a strategic alliance with a foreign stock or futures exchange and such amount of ownership is approved by the Financial Services Commission on grounds that such ownership may contribute to the efficiency and soundness of capital markets and the distribution of shares held by shareholders; |
| |
• |
|
The number of outside directors on the board of directors of the Korea Exchange shall be more than half of the total number of directors; |
| |
• |
|
Any amendment to the Articles of Incorporation, transfer or consolidation of business, spin off, stock swap in its entirety or transfer of shares in its entirety of the Korea Exchange will receive prior approval from the Financial Services Commission; and |
| |
• |
|
In the event the Financial Services Commission determines that the chief executive officer of the Korea Exchange is not appropriate for the position, the Financial Services Commission can request the Korea Exchange upon reasonable cause, within one month from the chief executive officer’s election, to dismiss the chief executive officer. Subsequently, the chief executive officer will be suspended from performing his duties and the Korea Exchange will elect a new chief executive officer within two months from the request. |
The Korea Exchange has the power in some circumstances to suspend trading in the shares of a given company or to de-list a security. The Korea Exchange also restricts share price movements. All listed companies are required to file accounting reports annually, semiannually and quarterly and to release immediately all information that may affect trading in a security.
The Government has in the past exerted, and continues to exert, substantial influence over many aspects of the private sector of the Korean economy and its actions may depress or boost the stock market. In the past, the Government has informally both encouraged and restricted the declaration and payment of dividends, induced mergers to reduce what it considers excess capacity in a particular industry and induced private companies to offer publicly their securities.
254
The Korea Exchange publishes the Korea Composite Stock Price Index (“KOSPI”) every ten seconds, which is an index of all equity securities listed on the Korea Exchange. Historical movements in KOSPI are set out in the following.
|
|
|
|
|
|
|
|
|
|
|
|
|
|
|
|
|
| |
|
Opening(1) |
|
|
High |
|
|
Low |
|
|
Closing |
|
| 2001 |
|
|
503.31 |
|
|
|
715.93 |
|
|
|
463.54 |
|
|
|
693.70 |
|
| 2002 |
|
|
698.00 |
|
|
|
943.54 |
|
|
|
576.49 |
|
|
|
627.55 |
|
| 2003 |
|
|
633.03 |
|
|
|
824.26 |
|
|
|
512.30 |
|
|
|
810.71 |
|
| 2004 |
|
|
821.26 |
|
|
|
939.52 |
|
|
|
713.99 |
|
|
|
895.92 |
|
| 2005 |
|
|
893.71 |
|
|
|
1,383.14 |
|
|
|
866.17 |
|
|
|
1,379.37 |
|
| 2006 |
|
|
1,389.27 |
|
|
|
1,464.70 |
|
|
|
1,192.09 |
|
|
|
1,434.46 |
|
| 2007 |
|
|
1,435.26 |
|
|
|
2,085.45 |
|
|
|
1,345.08 |
|
|
|
1,897.13 |
|
| 2008 |
|
|
1,853.45 |
|
|
|
1,901.13 |
|
|
|
892.16 |
|
|
|
1,124.47 |
|
| 2009 |
|
|
1,157.40 |
|
|
|
1,723.17 |
|
|
|
992.69 |
|
|
|
1,682.77 |
|
| 2010 |
|
|
1,696.14 |
|
|
|
2,051.00 |
|
|
|
1,552.79 |
|
|
|
2,051.00 |
|
| 2011 |
|
|
2,070.08 |
|
|
|
2,228.96 |
|
|
|
1,652.71 |
|
|
|
1,825.74 |
|
| 2012 |
|
|
1,826.37 |
|
|
|
2,049.28 |
|
|
|
1,769.31 |
|
|
|
1,997.05 |
|
| 2013 |
|
|
2,031.10 |
|
|
|
2,059.58 |
|
|
|
1,780.63 |
|
|
|
2,011.34 |
|
| 2014 |
|
|
1,967.19 |
|
|
|
2,082.61 |
|
|
|
1,886.85 |
|
|
|
1,915.59 |
|
| 2015 |
|
|
1,926.44 |
|
|
|
2,173.41 |
|
|
|
1,829.81 |
|
|
|
1,961.31 |
|
| 2016 |
|
|
1,918.76 |
|
|
|
2,068.72 |
|
|
|
1,835.28 |
|
|
|
2,026.46 |
|
| 2017 |
|
|
2,026.16 |
|
|
|
2,557.97 |
|
|
|
2,026.16 |
|
|
|
2,467.49 |
|
| 2018 |
|
|
2,479.65 |
|
|
|
2,598.19 |
|
|
|
1,996.05 |
|
|
|
2,041.04 |
|
| 2019 |
|
|
2,010.00 |
|
|
|
2,248.63 |
|
|
|
1,909.71 |
|
|
|
2,197.67 |
|
| 2020 |
|
|
2,175.17 |
|
|
|
2,873.47 |
|
|
|
1,457.64 |
|
|
|
2,873.47 |
|
| 2021 |
|
|
2,944.45 |
|
|
|
3,305.21 |
|
|
|
2,839.01 |
|
|
|
2,977.65 |
|
| 2022 |
|
|
2,988.77 |
|
|
|
2,989.24 |
|
|
|
2,155.49 |
|
|
|
2,236.40 |
|
| 2023 (through April 18) |
|
|
2,225.67 |
|
|
|
2,575.91 |
|
|
|
2,218.68 |
|
|
|
2,567.34 |
|
Source: Korea Exchange
Note:
| (1) |
The figures represent the daily closing price of the first trading day of the respective year. |
Shares are quoted “ex-dividend” on the first trading day of the relevant company’s accounting period. “Ex-dividend” refers to a share no longer carrying the right to receive the following dividend payment because the settlement date occurs after the record date for determining which shareholders are entitled to receive dividends. “Ex-rights” refers to shares no longer carrying the right to participate in the following rights offering or bonus issuance because the settlement date occurs after the record date for determining which shareholders are entitled to new shares. The calendar year is the accounting period for the majority of listed companies, this may account for the drop in KOSPI between its closing level at the end of one calendar year and its opening level at the beginning of the following calendar year.
With certain exceptions, principally to take account of a share being quoted “ex-dividend” and “ex-rights,” permitted upward and downward movements in share prices of any category of shares on any day are limited under the rules of the Korea Exchange to 30% of the previous day’s closing price of the shares, rounded down as set out below:
|
|
|
|
|
| Previous Day’s Closing Price |
|
Rounded Down to Won |
|
| Less than 2,000 |
|
|
1 |
|
| 2,000 to less than 5,000 |
|
|
5 |
|
| 5,000 to less than 20,000 |
|
|
10 |
|
| 20,000 to less than 50,000 |
|
|
50 |
|
| 50,000 to less than 200,000 |
|
|
100 |
|
| 200,000 to less than 500,000 |
|
|
500 |
|
| 500,000 or more |
|
|
1,000 |
|
255
As a consequence, if a particular closing price is the same as the price set by the fluctuation limit, the closing price may not reflect the price at which persons would have been prepared, or would be prepared to continue, if so permitted, to buy and sell shares. Orders are executed on an auction system with priority rules to deal with competing bids and offers.
Due to deregulation of restrictions on brokerage commission rates, the brokerage commission rate on equity securities transactions may be determined by the parties, subject to commission schedules being filed with the Korea Exchange by the financial investment companies with brokerage licenses.
The number of companies listed on the KRX KOSPI Market, the corresponding total market capitalization at the end of the periods indicated and the average daily trading volume for those periods are set forth in the following table.
|
|
|
|
|
|
|
|
|
|
|
|
|
|
|
|
|
|
|
|
|
|
|
|
|
| |
|
|
|
|
Total Market Capitalization |
|
|
Average Daily Trading Volume, Value |
|
| Year |
|
Number of
Listed
Companies |
|
|
(Millions of
Won) |
|
|
(Thousands of
Dollars)(1) |
|
|
Thousands of
Shares |
|
|
(Millions of
Won) |
|
|
(Thousands of
Dollars)(1) |
|
| 2000 |
|
|
704 |
|
|
W |
188,041,490 |
|
|
$ |
148,414,751 |
|
|
|
306,163 |
|
|
W |
2,602,211 |
|
|
$ |
2,053,837 |
|
| 2001 |
|
|
689 |
|
|
|
255,850,070 |
|
|
|
194,784,979 |
|
|
|
473,241 |
|
|
|
1,997,420 |
|
|
|
1,520,685 |
|
| 2002 |
|
|
683 |
|
|
|
258,680,756 |
|
|
|
218,056,778 |
|
|
|
857,245 |
|
|
|
3,041,598 |
|
|
|
2,563,937 |
|
| 2003 |
|
|
684 |
|
|
|
355,362,626 |
|
|
|
298,123,008 |
|
|
|
542,010 |
|
|
|
2,216,636 |
|
|
|
1,859,594 |
|
| 2004 |
|
|
683 |
|
|
|
412,588,139 |
|
|
|
398,597,371 |
|
|
|
372,895 |
|
|
|
2,232,109 |
|
|
|
2,156,419 |
|
| 2005 |
|
|
702 |
|
|
|
655,074,595 |
|
|
|
648,588,708 |
|
|
|
467,629 |
|
|
|
3,157,662 |
|
|
|
3,126,398 |
|
| 2006 |
|
|
731 |
|
|
|
704,587,508 |
|
|
|
757,620,976 |
|
|
|
279,096 |
|
|
|
3,435,180 |
|
|
|
3,693,742 |
|
| 2007 |
|
|
746 |
|
|
|
951,917,907 |
|
|
|
1,017,223,666 |
|
|
|
363,846 |
|
|
|
5,540,151 |
|
|
|
5,920,229 |
|
| 2008 |
|
|
765 |
|
|
|
576,927,703 |
|
|
|
457,153,489 |
|
|
|
355,440 |
|
|
|
5,190,180 |
|
|
|
4,112,663 |
|
| 2009 |
|
|
770 |
|
|
|
887,935,183 |
|
|
|
763,060,356 |
|
|
|
485,657 |
|
|
|
5,795,552 |
|
|
|
4,980,495 |
|
| 2010 |
|
|
777 |
|
|
|
1,141,885,458 |
|
|
|
1,009,981,831 |
|
|
|
380,859 |
|
|
|
5,619,768 |
|
|
|
4,970,607 |
|
| 2011 |
|
|
791 |
|
|
|
1,041,999,162 |
|
|
|
899,438,206 |
|
|
|
353,760 |
|
|
|
6,863,146 |
|
|
|
5,924,166 |
|
| 2012 |
|
|
784 |
|
|
|
1,154,294,167 |
|
|
|
1,085,638,395 |
|
|
|
486,480 |
|
|
|
4,823,643 |
|
|
|
4,536,739 |
|
| 2013 |
|
|
777 |
|
|
|
1,185,973,724 |
|
|
|
1,123,826,139 |
|
|
|
328,325 |
|
|
|
3,993,422 |
|
|
|
3,784,158 |
|
| 2014 |
|
|
773 |
|
|
|
1,192,252,867 |
|
|
|
1,092,907,569 |
|
|
|
278,082 |
|
|
|
3,983,580 |
|
|
|
3,651,646 |
|
| 2015 |
|
|
770 |
|
|
|
1,242,832,089 |
|
|
|
1,062,885,563 |
|
|
|
455,256 |
|
|
|
5,351,734 |
|
|
|
4,576,870 |
|
| 2016 |
|
|
779 |
|
|
|
1,308,440,374 |
|
|
|
1,087,015,348 |
|
|
|
376,773 |
|
|
|
4,523,044 |
|
|
|
3,757,617 |
|
| 2017 |
|
|
774 |
|
|
|
1,605,820,912 |
|
|
|
1,504,422,814 |
|
|
|
340,457 |
|
|
|
5,325,760 |
|
|
|
4,989,470 |
|
| 2018 |
|
|
788 |
|
|
|
1,343,971,858 |
|
|
|
1,207,630,387 |
|
|
|
397,972 |
|
|
|
6,548,622 |
|
|
|
5,884,286 |
|
| 2019 |
|
|
799 |
|
|
|
1,475,909,366 |
|
|
|
1,277,290,667 |
|
|
|
470,723 |
|
|
|
4,989,807 |
|
|
|
4,318,309 |
|
| 2020 |
|
|
795 |
|
|
|
1,980,543,162 |
|
|
|
1,823,536,656 |
|
|
|
895,256 |
|
|
|
12,200,417 |
|
|
|
11,233,235 |
|
| 2021 |
|
|
818 |
|
|
|
2,203,366,546 |
|
|
|
1,853,749,408 |
|
|
|
1,039,479 |
|
|
|
15,424,224 |
|
|
|
12,976,800 |
|
| 2022 |
|
|
820 |
|
|
|
1,767,235,221 |
|
|
|
1,402,345,041 |
|
|
|
595,197 |
|
|
|
9,008,398 |
|
|
|
7,148,387 |
|
| 2023 (through April 18) |
|
|
824 |
|
|
|
2,029,777,854 |
|
|
|
1,610,679,141 |
|
|
|
577,293 |
|
|
|
8,935,088 |
|
|
|
7,090,214 |
|
Source: Korea Exchange
Note:
| (1) |
Converted at the Noon Buying Rate at the end of the periods indicated. |
The Korean securities markets are principally regulated by the Financial Services Commission and the Financial Investment Services and Capital Markets Act. The law imposes restrictions on insider trading and price manipulation, requires specified information to be made available by listed companies to investors and establishes rules regarding margin trading, proxy solicitation, takeover bids, acquisition of treasury shares and reporting requirements for shareholders holding substantial interests.
256
Protection of Customer’s Interest in Case of Insolvency of Financial Investment Companies
Under Korean law, the relationship between a customer and a financial investment company in connection with a securities sell or buy order is deemed to be consignment and the securities acquired by a consignment agent (i.e., the securities company) through such sell or buy order are regarded as belonging to the customer in so far as the customer and the consignment agent’s creditors are concerned. Therefore, in the event of a bankruptcy or reorganization procedure involving a financial investment company, the customer of the financial investment company is entitled to the proceeds of the securities sold by the financial investment company. In addition, the Financial Investment Services and Capital Markets Act recognizes the ownership of a customer in securities held by a financial investment company in such customer’s account.
When a customer places a sell order with a financial investment company which is not a member of the Korea Exchange and this financial investment company places a sell order with another financial investment company which is a member of the Korea Exchange, the customer is still entitled to the proceeds of the securities sold received by the non-member company from the member company regardless of the bankruptcy or reorganization of the non-member company. Likewise, when a customer places a buy order with a non-member company and the non-member company places a buy order with a member company, the customer has the legal right to the securities received by the non-member company from the member company because the purchased securities are regarded as belonging to the customer in so far as the customer and the non-member company’s creditors are concerned.
In addition, under the Financial Investment Services and Capital Markets Act, the Korea Exchange is obliged to indemnify any loss or damage incurred by a counterparty as a result of a breach by its members. If a financial investment company which is a member of the Korea Exchange breaches its obligation in connection with a buy order, the Korea Exchange is obliged to pay the purchase price on behalf of the breaching member. Therefore, the customer can acquire the securities that have been ordered to be purchased by the breaching member.
As the cash deposited with a financial investment company is regarded as belonging to the financial investment company, which is liable to return the same at the request of its customer, the customer cannot take back deposited cash from the financial investment company if a bankruptcy or reorganization procedure is instituted against the financial investment company and, therefore, can suffer from loss or damage as a result. However, the Depositor Protection Act provides that the Korea Deposit Insurance Corporation will, upon the request of the investors, pay each investor up to W50 million per financial institution in case of the financial investment company’s bankruptcy, liquidation, cancellation of securities business license or other insolvency events. The premiums related to this insurance are paid by financial investment companies. Pursuant to the Financial Investment Services and Capital Markets Act, a financial investment company with a dealing or brokerage license is required to deposit the cash received from its customers with the Korea Securities Finance Corporation, a special entity established pursuant to the Financial Investment Services and Capital Markets Act. Set-off or attachment of cash deposits by securities companies with the Korea Securities Finance Corporation is prohibited. In addition, in the event of bankruptcy or dissolution of the financial investment company, the cash so deposited shall be withdrawn and paid to the customer prior to payment to other creditors of the financial investment company.
Restrictions Applicable to ADSs
No Korean governmental approval is necessary for the sale and purchase of our ADSs in the secondary market outside Korea or for the withdrawal of shares of our common stock underlying the ADSs and the delivery inside Korea of shares in connection with the withdrawal, provided that a foreigner who intends to acquire the shares must obtain an investment registration card from the Financial Supervisory Service as described below. The acquisition of the shares by a foreigner must be immediately reported to the governor of the Financial Services Commission, either by the foreigner or by his standing proxy in Korea.
257
Persons who have acquired shares of our common stock as a result of the withdrawal of shares underlying our ADSs may exercise their preemptive rights for new shares, participate in free distributions and receive dividends on shares without any further Korean governmental approval.
Under current Korean laws and regulations, the depositary is required to obtain our prior consent for the number of shares of our common stock to be deposited in any given proposed deposit that exceeds the difference between:
| |
(1) |
the aggregate number of shares of our common stock deposited by us for the issuance of our ADSs (including deposits in connection with the initial issuance and all subsequent offerings of our ADSs and stock dividends or other distributions related to these ADSs); and |
| |
(2) |
the number of shares of our common stock on deposit with the depositary at the time of such proposed deposit. We have agreed to grant such consent to the extent that the total number of shares on deposit with the depositary would not exceed 40,432,628 at any time. |
Reporting Requirements for Holders of Substantial Interests
Under the Financial Investment Services and Capital Markets Act, any person whose direct or beneficial ownership of our common stock with voting rights, whether in the form of shares of common stock or ADSs, certificates representing the rights to subscribe for shares and equity-related debt securities including convertible bonds and bonds with warrants (which we refer to collectively as “Equity Securities”), together with the Equity Securities beneficially owned by certain related persons or by any person acting in concert with the person, accounts for 5% or more of the total outstanding shares (including Equity Securities of us held by such persons) is required to report the status of the holdings and the purpose of the holdings (for example, whether intending to seek management control) to the Financial Services Commission and the Korea Exchange within five business days after reaching the 5% ownership level. In addition, any change in the ownership interest subsequent to the report that equals or exceeds 1% of the total outstanding Equity Securities or change in the purpose of the holdings is required to be reported to the Financial Services Commission and the Korea Exchange within five business days from the date of the change, provided that (i) if the investment is for passive investment purposes the change must be reported by the 10th day of the month following an amendment event and (ii) if the investment is for general investment purposes (i.e., an investment that is not intended for active management participation, but with a intention to actively exercise its rights as a shareholder with respect to the matters such as a distribution policies of the issuer) the change must be reported within 10 business days following an amendment event. For institutional investors as prescribed by the Financial Services Commission, (i) if the investment is for portfolio investment purposes, the change must be reported by the 10th day of the following quarter in which the change occurred and (ii) if the investment is for general investment purposes, the change must be reported by the 10th day of the month following an amendment event).
Violation of these reporting requirements may subject a person to criminal sanctions such as administrative sanctions, fines, imprisonment and/or a loss of voting rights with respect to the portion of ownership of Equity Securities exceeding 5% of the total outstanding shares. In addition, the Financial Services Commission may order the disposal of the unreported Equity Securities. Any persons who reports management control as the purpose for its holdings is prohibited from acquiring additional shares or from exercising voting rights during the following five days following the reporting date.
In addition to the reporting requirements described above, any person whose direct or beneficial ownership of our stock accounts for 10% or more of the total issued and outstanding shares (which we refer to as a “major stockholder”) must report the status of his/her shareholding to the Korea Securities Futures Commission and the Korea Exchange within five days after he/she becomes a major stockholder. In addition, any change in the ownership interest subsequent to the report must be reported to the Korea Securities Futures Commission and the Korea Exchange within five days after the change occurred, provided that the obligation to report such change shall be exempt if the number shares that changed in ownership is less than 1,000 shares and the aggregate
258
amount of such shares that changed in ownership is less than W10 million. Violation of these reporting requirements may subject a person to criminal sanctions such as fines or imprisonment. Any single stockholder or persons who have a special relationship with such stockholder that jointly acquire more than 10% (4% in case of non-financial business group companies) of the voting stock of a Korean financial holding company who controls national banks will be subject to reporting or approval requirements pursuant to the Financial Holding Company Act. See “Item 4.B. Business Overview — Supervision and Regulation — Principal Regulations Applicable to Financial Holding Companies — Restrictions on Financial Holding Company Ownership.”
Restrictions Applicable to Shares
Under the Foreign Exchange Transaction Laws and Financial Services Commission regulations, as amended (collectively, the “Investment Rules”), foreigners may invest, with limited exceptions and subject to procedural requirements, in all shares of Korean companies, whether listed on the Stock Market Division of the Korea Exchange or on the KOSDAQ Market Division of the Korea Exchange, unless prohibited by specific laws. Foreign investors may trade shares listed on the Stock Market Division of the Korea Exchange or on the KOSDAQ Market Division of the Korea Exchange only through the Stock Market Division of the Korea Exchange or the KOSDAQ Market Division of the Korea Exchange, except in limited circumstances, including:
| |
• |
|
odd-lot trading of shares; |
| |
• |
|
acquisition of shares (which we refer to as “Converted Shares”) by exercise of warrants, conversion rights or exchange rights under bonds with warrants, convertible bonds or exchangeable bonds or withdrawal rights under depositary receipts issued outside of Korea by a Korean company; |
| |
• |
|
acquisition of shares as a result of inheritance, donation, bequest or exercise of stockholders’ rights, including preemptive rights or rights to participate in free distributions and receive dividends; |
| |
• |
|
over-the-counter transactions between foreigners of a class of shares for which the ceiling on aggregate acquisition by foreigners, as explained below, has been reached or exceeded subject to certain exceptions; and |
| |
• |
|
sale and purchase of shares at fair value between foreigners who are part of an investor group comprised of foreign companies investing under the control of a common investment manager pursuant to applicable laws or contract. |
For over-the-counter transactions of shares between foreigners outside the Stock Market Division of the Korea Exchange or the KOSDAQ Market Division of the Korea Exchange for shares with respect to which the limit on aggregate foreign ownership has been reached or exceeded, a securities company licensed in Korea must act as an intermediary. Odd-lot trading of shares outside the Stock Market Division of the Korea Exchange or the KOSDAQ Market Division of the Korea Exchange must involve a licensed securities company in Korea as the other party. Foreign investors are prohibited from engaging in margin transactions with respect to shares that are subject to a foreign ownership limit.
The Investment Rules require a foreign investor who wishes to invest in shares on the Stock Market Division of the Korea Exchange or the KOSDAQ Market Division of the Korea Exchange (including Converted Shares and shares being issued for initial listing on the Stock Market Division of the Korea Exchange or on KOSDAQ Market Division of the Korea Exchange) to register its identity with the Financial Supervisory Service prior to making any such investment. The registration requirement does not, however, apply to foreign investors who acquire Converted Shares with the intention of selling such Converted Shares within three months from the date of acquisition. Upon registration, the Financial Supervisory Service will issue to the foreign investor an investment registration card, which must be presented each time the foreign investor opens a brokerage account with a securities company. Foreigners eligible to obtain an investment registration card include foreign nationals who have not been residing in Korea for a consecutive period of six months or more, foreign governments, foreign municipal authorities, foreign public institutions, international financial institutions or similar
259
international organizations, corporations incorporated under foreign laws and any person in any additional category designated by decree of the Ministry of Strategy and Finance under the Korean Securities and Exchange Act. All Korean offices of a foreign corporation as a group are treated as a separate foreigner from the offices of the corporation outside Korea for the purpose of investment registration. However, a foreign corporation or depositary issuing depositary receipts may obtain one or more investment registration cards in its name in certain circumstances as described in the relevant regulations.
Upon a foreign investor’s purchase of shares through the Stock Market Division of the Korea Exchange or the KOSDAQ Market Division of the Korea Exchange, no separate report by the investor is required because the investment registration card system is designed to control and oversee foreign investment through a computer system. However, a foreign investor’s acquisition or sale of shares outside the Stock Market Division of the Korea Exchange or the KOSDAQ Market Division of the Korea Exchange (as discussed above) must be reported by the foreign investor or his standing proxy to the governor of the Financial Supervisory Service at the time of each such acquisition or sale. A foreign investor must ensure that any acquisition or sale by it of shares outside the Stock Market Division of the Korea Exchange or the KOSDAQ Market Division of the Korea Exchange in the case of trades in connection with a tender offer, odd-lot trading of shares, trades of a class of shares for which the aggregate foreign ownership limit has been reached or exceeded, is reported to the governor of the Financial Supervisory Service by himself or his standing proxy, or, in the case of sale and purchase of shares at fair value between foreigners, who are part of an investor group comprised of foreign companies investing under the control of a common investment manager pursuant to applicable laws or contract. A foreign investor may appoint a standing proxy from among the Korea Securities Depository, foreign exchange banks (including domestic branches of foreign banks), securities companies (including domestic branches of foreign securities companies), asset management companies, futures trading companies and internationally recognized custodians which will act as a standing proxy to exercise stockholders’ rights or perform any matters related to the foregoing activities if the foreign investor does not perform these activities himself. Generally, a foreign investor may not permit any person, other than its standing proxy, to exercise rights relating to his shares or perform any tasks related thereto on his behalf. However, a foreign investor may be exempted from complying with these standing proxy rules with the approval of the governor of the Financial Supervisory Service in cases deemed inevitable by reason of conflict between laws of Korea and the home country of the foreign investor.
Certificates evidencing shares of Korean companies must be kept in custody with an eligible custodian in Korea. Only foreign exchange banks (including domestic branches of foreign banks), securities companies (including domestic branches of foreign securities companies), the Korea Securities Depository, asset management companies, futures trading companies and internationally recognized custodians are eligible to act as a custodian of shares for a non-resident or foreign investor. A foreign investor must ensure that his custodian deposits his shares with the Korea Securities Depository. However, a foreign investor may be exempted from complying with this deposit requirement with the approval of the governor of the Financial Supervisory Service in circumstances where compliance with that requirement is made impracticable, including cases where compliance would contravene the laws of the home country of such foreign investor.
Under the Investment Rules, with certain exceptions, foreign investors may acquire shares of a Korean company without being subject to any foreign investment ceiling. As one such exception, designated public corporations are subject to a 40% ceiling on the acquisition of shares by foreigners in the aggregate. Designated public corporations may set a ceiling on the acquisition of shares by a single person in their articles of incorporation. Furthermore, an investment by a foreign investor in 10% or more of the issued and outstanding shares with voting rights of a Korean company is defined as a foreign direct investment under the Foreign Investment Promotion Act of Korea. Generally, a foreign direct investment must be reported to the Ministry of Commerce, Industry and Energy of Korea. The acquisition of shares of a Korean company by a foreign investor may also be subject to certain foreign or other shareholding restrictions in the event that the restrictions are prescribed in a specific law that regulates the business of the Korean company. For a description of such restrictions applicable to Korean banks, see “Item 4.B. Business Overview — Supervision and Regulation — Principal Regulations Applicable to Banks — Restrictions on Bank Ownership.”
260
| ITEM 9.D. |
Selling Shareholders |
Not applicable.
Not applicable.
| ITEM 9.F. |
Expenses of the Issue |
Not applicable.
| ITEM 10. |
ADDITIONAL INFORMATION |
Not applicable.
| ITEM 10.B. |
Memorandum and Articles of Incorporation |
We are a financial holding company established under the Financial Holding Company Act. As set forth in our Articles of Incorporation, our objects and purposes as a financial holding company are, among others, to operate and manage financial companies or companies engaged in similar lines of business, to provide financial support to, or investments in, our subsidiaries and to develop and jointly sell products with our subsidiaries. We are registered with the commercial registry office of Seoul Central District Court.
Our articles of incorporation, which was last amended on March 23, 2023, is annexed to this annual report as Exhibit 1.1.
Description of Share Capital
This section provides information relating to our capital stock, including brief summaries of material provisions of our Articles of Incorporation, the Korean Commercial Code, the Financial Investment Services and Capital Markets Act, the Financial Holding Companies Act and certain related laws of Korea, all as currently in effect. The following summaries are intended to provide only summaries and are subject to the full text of the Articles of Incorporation and the applicable provisions of the Financial Investment Services and Capital Markets Act, the Korean Commercial Code, and certain other related laws of Korea.
General
As of December 31, 2022 and as of the date hereof, our authorized share capital is 1,000,000,000 shares. Our Articles of Incorporation provide that we are authorized to issue shares of preferred stock up to one-half of all of the issued and outstanding shares. Furthermore, through an amendment of the Articles of Incorporation, we have created new classes of shares in addition to the common shares and the preferred shares. As of December 31, 2022, the number of our issued and outstanding common shares was 508,784,869.
On January 25, 2007, we issued 28,990,000 Series 10 redeemable preferred shares and 14,721,000 Series 11 redeemable convertible preferred shares as part of our funding for the acquisition of LG Card, all of which were redeemed on January 25, 2012. On April 21, 2011, as part of funding for partial redemption of the Series 10 redeemable preferred stock and the Series 11 redeemable convertible preferred stock, we issued 11,100,000 shares of the Series 12 non-voting redeemable preferred stock, all of which were redeemed on April 21, 2016. On May 1, 2019, as part of funding for the acquisition of Orange Life Insurance, we issued 17,482,000 shares of non-voting convertible preferred stock through third-party allotment at a price of W42,900. In addition, we issued 8,232,906 shares of common stock in relation to a comprehensive stock exchange between Shinhan Financial Group and Orange Life Insurance on January 28, 2020. See “— Description of Preferred Stock.”
261
From April 29, 2020 to May 28, 2020, we acquired 5,035,658 treasury shares which we retired entirely on June 1, 2020. On September 29, 2020, partly in response to the prolonged COVID-19 pandemic and to increase our loss absorption capacity, we issued 39,130,000 common shares to two private equity funds, thereby increasing our paid-in capital by W195.7 billion. On December 30, 2020, as part of the small-scale stock exchange for the acquisition of the remaining interest in Neoplux, we issued 72,719 shares of common stocks.
All of the issued and outstanding shares are fully-paid and non-assessable, and are in registered form. As of December 31, 2022, our authorized but unissued share capital was 473,733,131 shares. We may issue the unissued shares without further shareholder approval but subject to a board resolution as provided in the Articles of Incorporation. See “— Distribution of Free Shares.” Share certificates are issued in denominations of one, five, ten, 50, 100, 500, 1,000 and 10,000 shares. The par value of our common shares per share is W5,000.
Dividends
Dividends are distributed to shareholders in proportion to the number of shares of the relevant class of capital stock owned by each shareholder following approval by the shareholders at an annual general meeting of shareholders. We pay full annual dividends on newly issued shares (such as the common shares representing the American depositary shares (“ADSs”)) for the year in which the new shares are issued. We declare our dividend annually at the annual general meeting of shareholders which is held within three months after the end of the fiscal year. Once declared, the annual dividend must be paid to the stockholders of record as of the end of the preceding fiscal year within one month after the annual general meeting unless otherwise resolved thereby. Annual dividends may be distributed either in (i) cash or (ii) shares provided that shares must be distributed at par value and, if the market price of the shares is less than their par value, dividends in shares may not exceed one-half of the total annual dividends (including dividends in shares). In addition to the annual dividend, we may also distribute cash dividends to the stockholders of record as of the end of March, June and September of each year upon a resolution by the board of directors. Under the Korean Commercial Code we do not have an obligation to pay any annual dividend unclaimed for five years from the scheduled payment date.
In addition, under the Financial Investment Services and Capital Markets Act and our Articles of Incorporation, we may pay quarterly dividends to our shareholders of record as of the end of March, June and September of each year upon the resolution of the board of directors. The quarterly dividend, if any, will be paid to the shareholders in cash. Our Articles of Incorporation stipulates that any quarterly dividends shall not exceed the net assets as of the end of the immediately preceding fiscal year, after deducting (i) the paid-in capital as of the end of the immediately preceding fiscal year, (ii) the aggregate amount of the capital reserves and earned surplus reserves, accumulated up to the end of the immediately preceding fiscal year, (iii) unrealized profits as prescribed under the Enforcement Decree of the Commercial Code, (iv) the amount resolved to be distributed as dividends at the Ordinary General Meeting of Shareholders held in respect of the immediately preceding fiscal year, (v) voluntary reserves accumulated for specific purposes in accordance with the relevant provisions of these Articles of Incorporation or by the resolution of the General Meetings of Shareholders as of the end of the immediately preceding fiscal year, (vi) earned surplus reserves that account for at least 10% of the net profits of the relevant fiscal year until such reserves equal the aggregate amount of its stated capital and (vii) the aggregate amount of quarterly dividends paid during the current fiscal year, if any.
The table below sets forth the cash dividend per share of common stock and the cash dividend per share of preferred stock declared by us in respect of the years ended December 31, 2020, 2021 and 2022.
262
Dividends
|
|
|
|
|
|
|
|
|
|
|
|
|
| |
|
Year Ended December 31, |
|
| |
|
2020 |
|
|
2021 |
|
|
2022 |
|
| |
|
|
|
|
|
|
|
|
|
| |
|
(In Won and US$) |
|
| Cash dividends per share of common stock: |
|
|
|
|
|
|
|
|
|
|
|
|
| In Korean Won |
|
W |
1,500 |
|
|
W |
1,960 |
|
|
W |
2,065 |
|
| In U.S. Dollars(1) |
|
$ |
1.38 |
|
|
$ |
1.65 |
|
|
$ |
1.64 |
|
| Cash dividends per share of preferred stock: |
|
|
|
|
|
|
|
|
|
|
|
|
| In Korean Won |
|
W |
1,716 |
|
|
W |
1,960 |
|
|
W |
2,065 |
|
| In U.S. Dollars(1) |
|
$ |
1.58 |
|
|
$ |
1.65 |
|
|
$ |
1.64 |
|
N/A = not available
Note:
| (1) |
Won amounts for 2020, 2021 and 2022 are expressed in U.S. Dollar at the rate of W1,086.1, W1,188.6 and W1,260.2, respectively, to US$1.00, the Noon Buying Rate in effect on December 31, 2020, 2021 and 2022, respectively, for the convenience of readers. No representation is made that the Won or U.S. Dollar amounts referred to above could have been or could be converted into U.S. Dollars or Won, as the case may be, at any particular rate or at all. |
Under the Financial Holding Companies Act and the regulations thereunder, a financial holding company may not pay an annual dividend unless it has set aside as its legal reserve an amount equal to at least one-tenth of its net income after tax and shall set aside such amount as its legal reserve until its legal reserve reaches at least the aggregate amount of its stated capital.
Other than as set forth above and the dividend rights granted to preferred shareholders as further described in “— Description of Preferred Stock,” our articles of incorporation do not provide special rights to our common or preferred shareholders to share in our profits. For information regarding Korean taxes on dividends, see “Item 10.E. Taxation — Korean Taxation.”
Distribution of Free Shares
In addition to permitting dividends in the form of shares to be paid out of retained or current earnings, the Korean Commercial Code permits a company to distribute to its shareholders, in the form of free shares, an amount transferred from the capital surplus or legal reserve to stated capital. These free shares must be distributed to all of the shareholders pro rata. Our Articles of Incorporation require the same types of preferred shares to be distributed to the holders of preferred shares in case of distribution of free shares. For information regarding the treatment under Korean tax laws of free share distributions, see “Item 10.E. Taxation — Korean Taxation — Taxation of Dividends on Shares of Common Stock or American Depositary Shares.”
Preemptive Rights and Issuance of Additional Shares
Unless otherwise provided in the Korean Commercial Code, a company may issue authorized but unissued shares at such times and upon such terms as the board of directors of the company may determine. The company must offer the new shares on uniform terms to all shareholders who have preemptive rights and who are listed on the shareholders’ register as of the record date. Our shareholders are entitled to subscribe for any newly issued shares in proportion to their existing shareholdings. However, as provided in the Articles of Incorporation, we may issue new shares by resolution of board of directors to persons other than existing shareholders if those shares are (1) publicly offered (where the number of such shares so offered may not exceed 50% of our total number of issued and outstanding shares); (2) preferentially allocated to the members of the ESOA pursuant to relevant provisions of the Financial Investment Services and Capital Markets Act; (3) issued for the purpose of issuing depositary receipts pursuant to relevant provisions of the Financial Investment Services and Capital
263
Markets Act (where the number of such shares so issued may not exceed 50% of our total number of issued and outstanding shares); (4) issued to directors or employees as a result of exercise of stock options we granted to them pursuant to the Korean Commercial Code; (5) issued to a financial investment company, a private equity fund or a special purpose company under the Financial Investment Services and Capital Markets Act; or (6) issued to any specified foreign investors, foreign or domestic financial institutions or alliance companies for operational needs such as introduction of advanced financial technology, improvement of its or subsidiaries’ financial structure and funding or strategic alliance (where such number of shares so issued may not exceed 50% of our total number of issued and outstanding shares). Under the Korean Commercial Code, a company may vary, without stockholders’ approval, the terms of such preemptive rights for different classes of shares. Public notice of the preemptive rights to new shares and the transferability thereof must be given not less than two weeks (excluding the period during which the shareholders’ register is closed) prior to the record date. We will notify the shareholders who are entitled to subscribe for newly issued shares of the deadline for subscription at least two weeks prior to the deadline. If a shareholder fails to subscribe on or before such deadline, the shareholder’s preemptive rights will lapse. Our board of directors may determine how to distribute shares in respect of which preemptive rights have not been exercised or where fractions of shares occur. Under the Financial Investment Services and Capital Markets Act, if a listed company intends to issue new shares by way of allotment to shareholders, it must issue a certificate of preemptive right to the newly issued shares. Furthermore, the company must list the newly issued shares on the Korea Exchange for a certain period of time or designate a securities company to broker and/or deal in such newly issued shares in order to ensure that they are properly distributed. In the event certain shareholder forfeit their right to subscribe to newly issued shares, the company may allot the forfeited shares to a third party under certain conditions, including in relation to the purchase price of such shares, although in principle, the company must withdraw the forfeited shares. Under the Korean Commercial Code, when a company issues new shares by way of allotment to a third party, such company must notify its stockholders or make public notice of the conditions and other details of such new shares not less than two weeks prior to the relevant subscription payment date. Under the Financial Investment Services and Capital Markets Act, however, a listed company may substitute such notification or public notice by disclosing the material fact in a report publicly filed with the listing authorities.
Under the Financial Investment Services and Capital Markets Act, members of a company’s employee stock ownership association, whether or not they are shareholders, have a preemptive right, subject to certain exceptions, to subscribe for up to 20% of the shares publicly offered pursuant to the Financial Investment Services and Capital Markets Act. However, this right is exercisable only to the extent that the total number of shares so acquired and held by such members does not exceed 20% of the total number of shares to be newly issued and shares then outstanding. As of December 31, 2022, the employee stock ownership association owned 26,121,183 shares, or 5.13%, of our common stock.
General Meeting of Shareholders
There are two types of general meetings of shareholders: annual general meetings and extraordinary general meetings. We are required to convene our annual general meeting within three months after the end of each fiscal year. Subject to a board resolution or court approval, an extraordinary general meeting of shareholders may be held when necessary or at the request of our Audit Committee. In addition, under the Korean Commercial Code, an extraordinary general meeting of shareholders may be held at the request of the shareholders holding shares for at least six months of an aggregate of 1.5% or more of the outstanding shares with voting rights of the listed company, subject to a board resolution or court approval. Furthermore, under the Act on the Corporate Governance of Financial Companies of Korea and its sub-regulations, an extraordinary general meeting of shareholders may be held at the request of the shareholders holding shares for at least six months of an aggregate of 1.5% (0.75% in the case of a financial holding company (i) whose total assets at the end of the latest fiscal year is W5 trillion or more and (ii) who is in control of two or more subsidiaries, each with total assets of W2 trillion or more) or more of the outstanding shares of the company, subject to a board resolution or court approval. Meeting agendas are determined by the board of directors or proposed by holders of an aggregate of 3% or more of the outstanding shares with voting rights by way of a written proposal to the board of directors at
264
least six weeks prior to the meeting. In addition, under the Korean Commercial Code, the meeting agenda may be proposed by the shareholders holding shares for at least six months of an aggregate of 1% (0.5% in the case of a listed company whose capital at the end of the latest operating year is W100 billion or more) or more of the outstanding shares of the listed company. Furthermore, under the Act on the Corporate Governance of Financial Companies and its sub-regulations, the meeting agenda may be proposed by the shareholders holding shares for at least six months of an aggregate of 0.1%. Written notices stating the date, place and agenda of the meeting must be given to the shareholders at least two weeks prior to the date of the general meeting of shareholders; provided, that, notice may be given to holders of 1% or less of the total number of issued and outstanding shares which are entitled to vote, by placing at least two public notices at least two weeks in advance of the meeting in at least two daily newspapers or by using an electronic method defined under the Korean Commercial Code and related regulations at least two weeks in advance of the meeting. Currently, we use The Korea Economic Daily and Maeil Business Newspaper for the publication of such notices. Shareholders who are not on the shareholders’ register as of the record date are not entitled to receive notice of the general meeting of shareholders, and they are not entitled to attend or vote at such meeting.
The general meeting of shareholders is held at our executive office (which is our registered executive office) or, if necessary, may be held anywhere in the vicinity of our executive office.
Voting Rights
Holders of common shares are entitled to one vote for each share. However, voting rights with respect to common shares that we hold and common shares that are held by a corporate shareholder, more than one-tenth of the outstanding capital stock of which is directly or indirectly owned by such shareholder, may not be exercised. Unless stated otherwise in a company’s Articles of Incorporation, the Korean Commercial Code permits holders of an aggregate of 3% (1%, in case of a company whose total assets as at the end of the latest fiscal year is W2 trillion or more) or more of the outstanding shares with voting rights to request cumulative voting when electing two or more directors. Our Articles of Incorporation currently do not prohibit cumulative voting. If a listed company’s total assets amounted to W 2 trillion or more as of the end of the latest fiscal year, the company is required to establish and maintain an audit committee, whose members must be composed of directors of such company as appointed at a shareholders meeting. At least one member of the audit committee must be an outside director of such company. For a large listed company with total assets of W2 trillion or more as of the end of the latest fiscal year and a listed company with total assets of W100 billion or more as of the end of the latest fiscal year that has established an audit committee instead of a full-time auditor, the company is required that at least one director (or more than two directors, if specified in the articles of incorporation) who will serve as an audit committee member must be appointed separately from the other directors at the general meeting of shareholders. If the aggregate number of voting shares held by any shareholder exceeds 3% of the total number of issued and outstanding voting shares, then the shareholder may not exercise its voting rights with respect to the shares it holds in excess of such 3% threshold to elect or remove a member of the audit committee. In case the shareholder is the company’s largest shareholder, the shareholder and its specially related persons (as defined under the relevant laws) may not exercise their voting rights with respect to the shares they collectively hold in excess of the 3% threshold to elect or remove the audit committee member who is not an outside director of the company. If the listed company’s total assets amounted to W100 billion or above but below W2 trillion as of the end of the latest fiscal year, the company is required to appoint at least one standing director or one director to its audit committee through a shareholders’ meeting. If the aggregate number of voting shares held by any shareholder of such company exceeds 3% of the total number of issued and outstanding voting shares, then the shareholder may not exercise its voting rights with respect to the shares it holds in excess of the 3% threshold to elect or remove the company’s statutory auditor.
The Korean Commercial Code and our Articles of Incorporation provide that an ordinary resolution may be adopted if approval is obtained from the holders of at least a majority of those common shares present or represented at such meeting and such majority also represents at least one-fourth of the total of our issued and outstanding common shares. Holders of non-voting shares (other than enfranchised non-voting shares) are not
265
entitled to vote on any resolution or to receive notice of any general meeting of shareholders unless the agenda of the meeting includes consideration of a resolution on which such holders are entitled to vote. The Korean Commercial Code provides that a company’s articles of incorporation may prescribe conditions for enfranchisement of non-voting shares. For example, if our general shareholders’ meeting resolves not to pay to holders of preferred shares the annual dividend as determined by the board of directors at the time of issuance of such shares, the holders of preferred shares will be entitled to exercise voting rights from the general shareholders’ meeting immediately following the meeting adopting such resolution until the end of the meeting to declare to pay such dividend with respect to the preferred shares. Holders of such enfranchised preferred shares have the same rights as holders of common shares to request, receive notice of, attend and vote at a general meeting of shareholders.
The Korean Commercial Code provides that to amend the Articles of Incorporation (which is also required for any change to the authorized share capital of the company) and in certain other instances, including removal of a director of a company, dissolution, merger or consolidation of a company, transfer of the whole or a significant part of the business of a company, acquisition of all of the business of any other company or issuance of new shares at a price lower than their par value, a special resolution must be adopted by the approval of the holders of at least two-thirds of those shares present or represented at such meeting and such special majority must also represent at least one-third of the total issued and outstanding shares with voting rights of the company.
In addition, in the case of amendments to the Articles of Incorporation or any merger or consolidation of a company or in certain other cases which affect the rights or interest of the shareholders of the preferred shares, a resolution must be adopted by a separate meeting of shareholders of the preferred shares. Such a resolution may be adopted if the approval is obtained from shareholders of at least two-thirds of the preferred shares present or represented at such meeting and such preferred shares also represent at least one-third of the total issued and outstanding preferred shares of the company.
A shareholder may exercise his voting rights by proxy given to another shareholder. If a particular shareholder intends to obtain proxy from another shareholder, a reference document specified by the Financial Supervisory Service must be sent to the shareholder giving proxy, with a copy furnished to the company’s executive office or the branch office, transfer agent and the Financial Services Commission. The proxy must present the power of attorney prior to the start of the general meeting of shareholders.
Rights of Dissenting Shareholders
Pursuant to the Financial Investment Services and Capital Markets Act, in certain limited circumstances (including, without limitation, if we transfer all or any significant part of our business or if we merge or consolidate with another company), dissenting holders of shares have the right to require us to purchase their shares. Pursuant to the Financial Holding Companies Act, the Financial Investment Services and Capital Markets Act and the Korean Commercial Code, if a financial holding company acquires a new direct or indirect subsidiary through the exchange or transfer of shares except in limited circumstances, the dissenting holders of such shares have the right to require us to purchase their shares. To exercise such a right, shareholders must submit to us a written notice of their intention to dissent prior to the general meeting of shareholders. Within 20 days (or 10 days under certain circumstances according to the Financial Holding Companies Act) after the date on which the relevant resolution is passed at such meeting, such dissenting shareholders must request in writing that we purchase their shares. We are obligated to purchase the shares of dissenting shareholders within one month after the end of such request period at a price to be determined by negotiation between the shareholder and us. If we cannot agree on a price with the shareholder through such negotiations, the purchase price will be the arithmetic mean of (1) the weighted average of the daily closing share prices on the KRX KOSPI Market of the Korea Exchange for two months prior to the date of the adoption of the relevant board of directors’ resolution, (2) the weighted average of the daily closing share prices on the KRX KOSPI Market of the Korea Exchange for one month prior to the date of the adoption of the relevant board of directors’ resolution and (3) the weighted average of the daily closing share prices on the KRX KOSPI Market of the Korea Exchange for one week prior to
266
the date of the adoption of the relevant board of directors’ resolution. If we or the dissenting shareholder who requested purchase of their shares do not accept such purchase price, we or the shareholder may request to the court to adjust such purchase price.
Register of Shareholders and Record Dates
We maintain the register of our shareholders at our transfer agent’s office in Seoul, Korea. The Korea Securities Depository as our transfer agent, registers transfers of shares on the register of shareholders upon presentation of the share certificates.
The record date for annual dividends is December 31. For the purpose of determining the holders of shares entitled to annual dividends, the register of shareholders may be closed for the period from January 1 of each year up to January 15 of such year. Further, the Korean Commercial Code and the Articles of Incorporation permit us upon at least two weeks’ public notice to set a record date and/or close the register of shareholders for not more than three months for the purpose of determining the shareholders entitled to certain rights pertaining to the shares. The trading of shares and the delivery of certificates in respect thereof may continue while the register of shareholders is closed.
Other Shareholder Rights
Our articles of incorporation do not have sinking fund provisions or provisions creating liability to further capital calls. Other than to amend our articles of incorporation in accordance with the Korean Commercial Code, no particular action is necessary to change the rights of holders of our capital stock. In addition, our articles of incorporation do not have specific provisions for governing changes in capital or which would have an effect of delaying, deferring or preventing a change in control of us and that would operate only with respect to a merger, acquisition or corporate restructuring involving us or any of our subsidiaries.
Directors
Under the Korean Commercial Code and our articles of incorporation, any director wishing to enter into a transaction with us or our subsidiaries in his or her personal capacity is required to obtain the prior approval of the board of directors, and any director having an interest in the transaction may not vote at the meeting of the board of directors to approve the transaction.
Neither our articles of incorporation nor applicable Korean laws have provisions relating to (i) the directors’ power, in the absence of an independent quorum, to vote compensation to themselves or any members of their body (ii) borrowing powers exercisable by the directors and how such borrowing powers can be varied; (iii) retirement or non-retirement of directors under an age limit requirement; or (iv) the number of shares required for a director’s qualification.
Description of Preferred Stock
On January 25, 2007, as part of funding our acquisition of LG Card, we issued 28,990,000 Series 10 non-voting redeemable preferred shares. On January 25, 2012, we redeemed all of the Series 10 preferred shares.
On January 25, 2007, as part of funding our acquisition of LG Card, we issued 14,721,000 Series 11 non-voting redeemable convertible preferred shares. On January 25, 2012, we redeemed all of the Series 11 preferred shares.
On April 21, 2011, as part of funding for preferred stocks due to be redeemed in January 2012, we issued 11,100,000 Series 12 non-voting redeemable preferred shares for the subscription price of W100,000 per share, or W1,110 billion in the aggregate. On April 21, 2016, we redeemed all of the Series 12 redeemable preferred shares.
267
On May 1, 2019, as part of funding for the acquisition of Orange Life Insurance, we issued 17,482,000 shares of non-voting convertible preferred stock through third-party allotment at a price of W42,900.
Annual Report
Under the Financial Investment Services and Capital Markets Act, we must file with the Financial Services Commission and the Korea Exchange an annual business report (containing audit report and audited annual nonconsolidated and consolidated financial statements) within 90 days after the end of our fiscal year as well as a semiannual business report within 45 days after the end of the first six months of our fiscal year and quarterly business reports within 45 days after the end of the first three months and nine months of our fiscal year, respectively (in each case, containing review report and reviewed interim nonconsolidated and consolidated financial statements). Copies of such reports are available for public inspection at the websites of the Financial Services Commission and the Korea Exchange.
Transfer of Shares
Under the Korean Commercial Code, the transfer of shares is effected by the delivery of share certificates. In order to exercise shareholders’ rights, the transferee must have his name and address registered on the registry of shareholders. For this purpose, shareholders are required to file with us their name, address and seal. Nonresident shareholders must notify us of the name of their proxy in Korea to which our notice can be sent. Under the Financial Services Commission regulations, nonresident shareholders may appoint a standing proxy and may not allow any person other than the standing proxy to exercise rights regarding the acquired share or perform any task related thereto on his behalf, subject to certain exceptions. Under current Korean regulations, the Korea Securities Depository, foreign exchange banks (including domestic branches of foreign banks), financial investment companies with a dealing, brokerage or collective investment license and internationally recognized custodians are authorized to act as standing proxy and provide related services. Certain foreign exchange controls and securities regulations apply to the transfer of shares by nonresidents or non-Koreans. See “Item 10.D. Exchange Controls.” As to the ceiling on the aggregate shareholdings of a single shareholder and persons who have a special relationship with such shareholder, please see “Item 4.B. Business Overview — Supervision and Regulation — Principal Regulations Applicable to Financial Holding Companies — Restrictions on Financial Holding Company Ownership.”
Acquisition of Treasury Shares
Under the Korean Commercial Code, we may acquire our own shares upon resolution of the general meeting of the shareholders or resolution of the board of directors pursuant to Article 165-3 of the Financial Investment Services and Capital Markets Act by either (i) purchasing them on a stock exchange or (ii) purchasing a number of shares, other than the redeemable shares as set forth in Article 345, Paragraph (1) of the Korean Commercial Code, from each shareholder in proportion to its existing shareholding ratio through the methods set forth in the Presidential Decree, provided that the total purchase price does not exceed the amount of our profit that may be distributed as dividends in respect of the immediately preceding fiscal year. In addition, pursuant to the Financial Investment Services and Capital Markets Act and regulations under the Financial Holding Companies Act, we may purchase our own shares on the KRX KOSPI Market of the Korea Exchange, through a tender offer, or through a trust agreement with a trust company, or retrieve our own shares from a trust company upon termination of a trust agreement, subject to the restrictions that (1) the aggregate purchase price of such shares may not exceed the total amount available for distribution of dividends at the end of the preceding fiscal year less the amounts of dividends and reserves for such fiscal year, subtracted by the sum of (a) the purchase price of treasury stock acquired if any treasury stock has been purchased after the end of the preceding fiscal year pursuant to the Commercial Act or the Financial Investment Services and Capital Markets Act, (b) the amount subject to trust agreements, and (c) the amount of dividends approved at the ordinary general shareholders’ meeting after the end of the preceding fiscal year and the amount of retained earnings reserve required under the Commercial Act; plus if any treasury stock has been disposed of after the end of the preceding
268
fiscal year, the acquisition cost of such treasury stock and (2) the purchase of such shares shall meet the requisite capital ratio under the Financial Holding Companies Act and the guidelines issued by the Financial Services Commission. In general, under the Financial Holding Companies Act, our subsidiaries are not permitted to acquire our shares.
Liquidation Rights
In the event we are liquidated, the assets remaining after the payment of all debts, liquidation expenses and taxes will be distributed to shareholders in proportion to the number of shares held by such shareholders. Holders of preferred shares may have preferences over holders of common shares in liquidation.
| ITEM 10.C. |
Material Contracts |
None.
| ITEM 10.D. |
Exchange Controls |
General
The Foreign Exchange Transaction Act of Korea the related Presidential Decree and the regulations under such Act and Decree (collectively the “Foreign Exchange Transaction Laws”) herein, regulate investment in Korean securities by nonresidents and issuance of securities by Korean companies outside Korea. Under the Foreign Exchange Transaction Laws, nonresidents may invest in Korean securities only to the extent specifically allowed by these laws or otherwise permitted by the Ministry of Strategy and Finance of Korea. The Financial Services Commission has also adopted, pursuant to its authority under the Financial Investment Services and Capital Markets Act, regulations that restrict investment by foreigners in Korean securities and regulate issuance of securities by Korean companies outside Korea.
Under the Foreign Exchange Transaction Laws, (1) if the Government determines that it is inevitable due to the outbreak of natural calamities, wars, conflict of arms or grave and sudden changes in domestic or foreign economic circumstances or other situations equivalent thereto, the Ministry of Strategy and Finance may temporarily suspend payment, receipt or the whole or part of transactions to which the Foreign Exchange Transaction Laws apply, or impose an obligation to safe keep, deposit or sell means of payment in or to certain Korean governmental agencies or financial institutions; and (2) if the Government determines that international balance of payments and international finance face or are likely to face serious difficulty or the movement of capital between Korea and abroad will cause or is likely to cause serious obstacles in carrying out its currency policies, exchange rate policies and other macroeconomic policies, the Ministry of Strategy and Finance may take measures to require any person who intends to perform capital transactions to obtain permission or to require any person who performs capital transactions to deposit part of the payments received in such transactions at certain Korean governmental agencies or financial institutions, in each case subject to certain limitations.
Restrictions Applicable to Shares
Under the Foreign Exchange Transaction Laws, a foreign investor who intends to acquire shares must designate a foreign exchange bank at which he must open a foreign currency account and a Won account exclusively for stock investments. No approval is required for remittance into Korea and deposit of foreign currency funds in the foreign currency account. Foreign currency funds may be transferred from the foreign currency account at the time required to make a deposit for, or settle the purchase price of, a stock purchase transaction to a Won account opened at a financial investment company with a securities dealing or brokerage license. Funds in the foreign currency account may be remitted abroad without any Korean governmental approval.
269
Dividends on shares of Korean companies are paid in Won. No Korean governmental approval is required for foreign investors to receive dividends on, or the Won proceeds of the sale of, any shares to be paid, received and retained in Korea. Dividends paid on, and the Won proceeds of the sale of, any shares held by a nonresident of Korea must be deposited either in a Won account with the investor’s financial investment company with a securities dealing or brokerage license or in his Won account. Funds in the investor’s Won account may be transferred to his foreign currency account or withdrawn for local living expenses, provided that any withdrawal of local living expenses by any one person exceeding US$10,000 per day needs to be reported to the governor of the Financial Supervisory Service by the foreign exchange bank at which the Won account is maintained. Funds in the Won account may also be used for future investment in shares or for payment of the subscription price of new shares obtained through the exercise of preemptive rights.
Financial investment companies with a securities dealing, brokerage or collective investment license are allowed to open foreign currency accounts with foreign exchange banks exclusively for accommodating foreign investors’ stock investments in Korea. Through these accounts, financial companies with a securities dealing, brokerage or collective investment license may enter into foreign exchange transactions on a limited basis, such as conversion of foreign currency funds and Won funds, either as a counterparty to or on behalf of foreign investors, without the investors having to open their own accounts with foreign exchange banks.
The following summary is based upon tax laws, regulations, rulings, decrees, income tax conventions (treaties), administrative practice and judicial decisions of Korea and the United States as of the date of this annual report, and is subject to any change in Korean or United States law that may come into effect after such date. Investors in shares of common stock or American depositary shares are advised to consult their own tax advisers as to the Korean, United States or other tax consequences of the purchase, ownership and disposition of such securities, including the effect of any national, state or local tax laws.
Korean Taxation
The following summary of Korean tax considerations applies to you so long as you are not:
| |
• |
|
a corporation having its head office, principal place of business, or place of effective management in Korea (a Korean corporation); or |
| |
• |
|
engaged in a trade or business in Korea through a permanent establishment or a fixed base to which the relevant income is attributable or with which the relevant income is effectively connected. |
Taxation of Dividends on Shares of Common Stock or American Depositary Shares
We will deduct Korean withholding tax from dividends (whether in cash or in shares) paid to you at a rate of 22% (including local income surtax). If you are a qualified resident and a beneficial owner of the dividends in a country that has entered into a tax treaty with Korea, you may qualify for a reduced rate of Korean withholding tax. See “— Tax Treaties” below for a discussion of treaty benefits. If we distribute to you free shares representing a transfer of certain capital reserves or asset revaluation reserves into paid-in capital, such distribution may be subject to a Korean withholding tax.
Taxation of Capital Gains from Transfer of Common Shares or American Depositary Shares
As a general rule, capital gains earned by non-residents upon transfer of our common shares or American depositary shares (“ADSs”) are subject to a Korean withholding tax at the lower of (1) 11% (including local income surtax) of the gross proceeds realized or (2) 22% (including local income surtax) of the net realized gain,
270
subject to the production of satisfactory evidence of acquisition costs and certain direct transaction costs associated with common shares or ADSs, unless exempt from Korean income taxation under an applicable tax treaty between Korea and the country of your tax residence. See “— Tax Treaties” below for a discussion on treaty benefits. Even if you do not qualify for the exemption under a tax treaty, you will not be subject to the foregoing withholding tax on capital gains if you meet certain requirements for the exemption under Korean domestic tax laws discussed in the following paragraphs.
You will not be subject to the Korean income taxation on capital gains realized upon a transfer of our common shares through the Korea Exchange if you (1) have no permanent establishment in Korea and (2) do not own and have never owned (together with any shares owned by any entity with which you have a special relationship and possibly including the shares represented by the ADSs) 25% or more of our total issued and outstanding shares at any time during the calendar year in which the sale occurs and during the five consecutive calendar years prior to the calendar year in which the sale occurs.
Under Korean tax law, ADSs are viewed as shares of stock for capital gains tax purposes. Accordingly, capital gains from sale or disposition of ADSs are taxed (if taxable) as if such gains are from sale or disposition of shares of our common stock. It should be noted that (i) capital gains earned by you (regardless of whether you have a permanent establishment in Korea) from a transfer of ADSs outside Korea will generally be exempt from Korean income taxation by virtue of the Special Tax Treatment Control Law of Korea, or the STTCL, provided that the issuance of ADSs is deemed to be an overseas issuance under the STTCL, but (ii) in the case where an owner of the underlying shares of stock transfers ADSs after conversion of the underlying shares into ADSs, the exemption under the STTCL described in (i) will not apply. In the case where an owner of the underlying shares of stock transfers the ADSs after conversion of the underlying shares of stock into ADSs, such person is obligated to file corporate income tax returns and pay tax unless a purchaser or a financial investment company with a brokerage license, as applicable, withholds and pays the tax on capital gains derived from transfer of ADSs, as discussed below.
If you are subject to tax on capital gains with respect to a sale of common shares or ADSs, the purchaser or, in the case of a sale of common shares on the Korea Exchange or through a financial investment company with a brokerage license in Korea, the financial investment company is required to withhold Korean tax from the sales proceeds in an amount equal to 11% (including local income surtax) of the gross realization proceeds and to remit the withheld tax to the Korean tax authority, unless you establish your entitlement to an exemption under an applicable tax treaty or domestic tax law or produce satisfactory evidence of your acquisition costs and certain direct transaction costs associated with common shares or ADSs. See the discussion under “— Tax Treaties” below for an explanation of claiming treaty benefits.
Tax Treaties
Korea has entered into a number of income tax treaties with other countries, including the United States, which reduce or exempt Korean withholding tax on the income derived by residents of such treaty countries. For example, under the Korea-U.S. income tax treaty, reduced rates of Korean withholding tax on dividends of 16.5% or 11.0%, respectively (including local income surtax), depending on your shareholding ratio, and an exemption from Korean withholding tax on capital gains are generally available to residents of the United States that are beneficial owners of the relevant dividend income or capital gains. However, under Article 17 (Investment or Holding Companies) of the Korea-U.S. income tax treaty, such reduced rates and exemption do not apply if (1) you are a United States corporation, (2) by reason of any special measures the tax imposed on you by the United States with respect to such dividends or capital gains is substantially less than the tax generally imposed by the United States on corporate profits, and (3) 25% or more of your capital is held of record or is otherwise determined, after consultation between competent authorities of the United States and Korea, to be owned directly or indirectly by one or more persons who are not individual residents of the United States. Also, under Article 16 (Capital Gains) of the Korea-U.S. income tax treaty, the exemption on capital gains does not apply if (a) you have a permanent establishment in Korea and any shares of common stock in which you hold an
271
interest and which gives rise to capital gains are effectively connected with such permanent establishment, (b) you are an individual and you maintain a fixed base in Korea for a period or periods aggregating 183 days or more during the taxable year and your common shares or ADSs giving rise to capital gains are effectively connected with such fixed base or (c) you are an individual and you are present in Korea for a period or periods of 183 days or more during the taxable year.
You should inquire for yourself whether you are entitled to the benefit of an income tax treaty with Korea. It is the responsibility of the party claiming the benefits of an income tax treaty in respect of dividend payments or capital gains to submit to us, the purchaser, the financial investment company, or other withholding agent, as the case may be, a certificate as to his tax residence. In the absence of sufficient proof, we, the purchaser, the financial investment company, or other withholding agent, as the case may be, must withhold tax at the normal rates. Furthermore, in order for you to claim the benefit of a tax rate reduction or tax exemption on certain Korean source income (e.g., dividends or capital gains) under an applicable tax treaty as the beneficial owner of such Korean source income, Korean tax law requires you (or your agent) to submit an application (in the case for reduced withholding tax rate, an “application for entitlement to reduced tax rate,” and in the case for exemption from withholding tax, an “application for tax exemption”) with a certificate of your tax residency issued by the competent authority of your country of tax residence, subject to certain exceptions (together, the “BO application”). For example, a U.S. resident would be required to provide a Form 6166 as a certificate of tax residency with the application for entitlement to reduced tax rate or the application for tax exemption, as the case may be. Subject to certain exceptions, where the relevant income is paid to an overseas investment vehicle (an “OIV”) that is not the beneficial owner of such income, a beneficial owner claiming the benefit of an applicable tax treaty with respect to such income must submit its BO application to such OIV, which in turn must submit an OIV report and a schedule of beneficial owners (and the BO applications collected from each beneficial owner, if such beneficial owner is applying for tax exemption) to the withholding agent prior to the payment date of such income. Effective as of January 1, 2022, an OIV shall be deemed to be a beneficial owner of the Korean source income if (i) under the applicable tax treaty, the OIV bears tax liabilities in the country in which it is established and (ii) the Korean source income is eligible for the treaty benefits under the tax treaty. The benefits under a tax treaty between Korea and the country of such OIV’s residence will apply with respect to the relevant income paid to such OIV, subject to certain application requirements as prescribed by the Corporate Income Tax or Individual Income Tax Law. In the case of a tax exemption application, the withholding agent is required to submit such application (together with the applicable OIV report in the event the income will be paid to an OIV) to the relevant district tax office by the ninth day of the month following the date of the payment of such income.
Inheritance Tax and Gift Tax
If you die while holding an ADS or donate an ADS, it is unclear whether, for Korean inheritance and gift tax purposes, you would be treated as the owner of the shares of common stock underlying the ADSs. If the tax authority interprets depositary receipts as the underlying share certificates, you may be treated as the owner of the shares of common stock and your heir or the donee (or in certain circumstances, you as the donor) will be subject to Korean inheritance or gift tax, which ranges from 10% to 50% recently, assessable based on the value of the ADSs or shares of common stock and the identity of the individual against whom the tax is assessed.
If you die while holding a common share or donate a subscription right or a common share, your heir or donee (or in certain circumstances, you as the donor) will be subject to Korean inheritance or gift tax at the same rate as indicated above.
At present, Korea has not entered into any tax treaty relating to inheritance or gift taxes.
Securities Transaction Tax
If you transfer common shares through the Korea Exchange in 2023, you will be subject to a securities transaction tax at the rate of 0.05% (with such rate to be reduced to 0.03% if the transfer is made in 2024 and no
272
such securities transaction tax to be imposed on transfers starting January 1, 2025) and an agriculture and fishery special surtax at the rate of 0.15% of the sales price of common shares. If your transfer of common shares is not made through the Korea Exchange, subject to certain exceptions, you will be subject to a securities transaction tax at the rate 0.35% but will not be subject to an agriculture and fishery special surtax.
Depositary receipts, which the ADSs constitute, are included in the scope of securities transfer subject to securities transaction tax. Nonetheless, transfer of depositary receipts listed on a foreign securities exchange similar to the Korea Exchange (e.g., the New York Stock Exchange, the NASDAQ National Market) will not be subject to the securities transaction tax.
In principle, the securities transaction tax, if applicable, must be paid by a transferor of common shares. When a transfer is effected through a securities settlement company in Korea, such settlement company is generally required to withhold and remit the tax to the tax authorities. When such transfer is made through a financial investment company only, such financial investment company is required to withhold and remit the tax. Where a transfer is affected by a non-resident who has no permanent establishment in Korea by a method other than through a securities settlement company or a financial investment company, the transferee is required to withhold the securities transaction tax.
Non-reporting or underreporting of securities transaction tax will generally result in the imposition of penalties equal to 20% to 60% of the non-reported or 10% to 60% of underreported tax amount and a failure to timely pay securities transaction tax due will result in penalties of 8.03% per annum of the due but unpaid tax. The penalty is imposed on the party responsible for paying the securities transaction tax or, if the securities transaction tax is to be withheld, on the party that has the withholding obligation.
Certain United States Federal Income Tax Consequences
The following summary describes certain U.S. federal income tax considerations for beneficial owners of our common shares or ADSs that hold the common shares or ADSs as capital assets and are “U.S. holders.” You are a “U.S. holder” if you are for U.S. federal income tax purposes:
| |
(i) |
an individual citizen or resident of the United States; |
| |
(ii) |
a corporation, or other entity treated as a corporation for U.S. federal income tax purposes, created or organized in or under the laws of the United States, any state thereof or District of Columbia; |
| |
(iii) |
an estate the income of which is subject to U.S. federal income taxation regardless of its source; |
| |
(iv) |
a trust that is subject to the primary supervision of a court within the United States and has one or more U.S. persons with authority to control all substantial decisions of the trust; or |
| |
(v) |
a trust that has a valid election in effect under applicable U.S. Treasury regulations to be treated as a U.S. person. |
In addition, this summary only applies to you if you are a U.S. holder that is a resident of the United States for purposes of the current income tax treaty between the United States and Korea (the “Treaty”), your common shares or ADSs are not, for purposes of the Treaty, effectively connected with a permanent establishment in Korea and you otherwise qualify for the full benefits of the Treaty.
This summary is based upon the provisions of the Internal Revenue Code of 1986, as amended (the “Code”), and regulations (including proposed regulations), rulings and judicial decisions thereunder as of the date hereof, as well as the Treaty, all of which are subject to change, perhaps retroactively. It is for general purposes only and you should not consider it to be tax advice. In addition, it assumes that each obligation under the deposit agreement will be performed in accordance with its terms. This summary does not represent a detailed description of all the U.S. federal income tax consequences to you in light of your particular circumstances, and
273
does not address the Medicare tax on net investment income, U.S. federal estate and gift taxes or the effects of any state, local or non-U.S. tax laws. In addition, it does not represent a detailed description of the U.S. federal income tax consequences applicable to you if you are subject to special treatment under the U.S. federal income tax laws, including if you are:
| |
• |
|
a bank or one of certain other financial institutions; |
| |
• |
|
a dealer in securities or currencies; |
| |
• |
|
a regulated investment company; |
| |
• |
|
a real estate investment trust; |
| |
• |
|
a trader in securities that has elected to use a mark-to-market method of accounting for your securities holdings; |
| |
• |
|
a person holding common shares or ADSs as part of a hedging, conversion, constructive sale or integrated transaction or a straddle; |
| |
• |
|
a person liable for the alternative minimum tax; |
| |
• |
|
a partnership or other pass-through entity for U.S. federal income tax purposes; |
| |
• |
|
a person who owns or is deemed to own 10% or more of our stock (by vote or value); |
| |
• |
|
a person required to accelerate the recognition of any item of gross income with respect to our common shares or ADSs as a result of such income being recognized on an applicable financial statement; or |
| |
• |
|
a person whose functional currency is not the U.S. Dollar. |
If a partnership (or other entity or arrangement treated as a partnership for U.S. federal income tax purposes) holds our common shares or ADSs, the tax treatment of a partner will generally depend upon the status of the partner and the activities of the partnership. If you are a partner of a partnership holding our common shares or ADSs, you are urged to consult your tax advisor.
You should consult your own tax advisor concerning the particular U.S. federal tax consequences to you of the ownership and disposition of common shares or ADSs, as well as any consequences arising under the laws of any other taxing jurisdiction.
American Depositary Shares
If you hold ADSs, for U.S. federal income tax purposes, you generally will be treated as the owner of the underlying common shares that are represented by such ADSs. Accordingly, deposits or withdrawals of common shares for ADSs will not be subject to U.S. federal income tax.
Distributions on Common Shares or American Depositary Shares
Subject to the discussion below under “Passive Foreign Investment Company Rules,” the gross amount of distributions on our common shares or ADSs (including amounts withheld to reflect Korean withholding tax) will be taxable as dividends to the extent paid out of our current or accumulated earnings and profits (as determined under U.S. federal income tax principles). Such income (including withheld taxes) will be includable in your gross income as ordinary income on the day you actually or constructively receive it, in the case of our common shares, or the day actually or constructively received by the ADS depositary, in the case of ADSs. Such dividends will not be eligible for the dividends-received deduction generally allowed to corporations under the Code.
274
Subject to applicable limitations (including a minimum holding period requirement), dividends received by non-corporate U.S. investors from a qualified foreign corporation may be treated as “qualified dividend income” that is subject to reduced rates of taxation. A qualified foreign corporation includes a foreign corporation that is eligible for the benefits of a comprehensive income tax treaty with the United States which the U.S. Treasury Department determines to be satisfactory for these purposes and which includes an exchange of information provision. The U.S. Treasury Department has determined that the Treaty meets these requirements, and we believe we are eligible for the benefits of the Treaty. A foreign corporation is also treated as a qualified foreign corporation with respect to dividends paid by that corporation on shares (or ADSs backed by such shares) that are readily tradable on an established securities market in the United States. U.S. Treasury Department guidance indicates that our ADSs, which are listed on the New York Stock Exchange, are readily tradable on an established securities market in the United States for these purposes. However, our common shares that are not represented by ADSs will generally not be considered readily tradable on an established securities market in the United States for these purposes. There also can be no assurance that our ADSs will be considered readily tradable on an established securities market in the United States in later years. Furthermore, non-corporate U.S. holders will not be eligible for the rate reduction on any dividends that we pay if we are a passive foreign investment company (as discussed below under “Passive Foreign Investment Company Rules”) in the taxable year in which such dividends are paid or were a passive foreign investment company in the preceding taxable year. If you are a non-corporate U.S. holder, you should consult your own tax advisor regarding the application of these rules given your particular circumstances.
The amount of any dividend paid in Korean Won will equal the U.S. Dollar value of the Korean Won received calculated by reference to the exchange rate in effect on the date you receive the dividend, in the case of our common shares, or the date received by the ADS depositary, in the case of ADSs, regardless of whether the Korean Won are converted into U.S. Dollars. If the Korean Won received as a dividend are converted into U.S. Dollars on the date they are received, you generally will not be required to recognize foreign currency gain or loss in respect of the dividend income. If the Korean Won received are not converted into U.S. Dollars on the day of receipt, you will have a basis in the Korean Won equal to their U.S. Dollar value on the date of receipt. Any gain or loss realized on a subsequent conversion or other disposition of the Korean Won will be treated as United States source ordinary income or loss.
Subject to certain significant conditions and limitations, Korean taxes withheld from dividends (at a rate not exceeding the rate provided in the Treaty) may be treated as foreign income taxes eligible for credit against your U.S. federal income tax liability. See “— Korean Taxation — Tax Treaties” for a discussion of the Treaty rate. Korean taxes withheld in excess of the rate provided in the Treaty will not be eligible for credit against your U.S. federal income tax until you exhaust all effective and practical remedies to recover such excess withholding, including the seeking of competent authority assistance from the Internal Revenue Service (the “IRS”). For purposes of the foreign tax credit, dividends paid on our common shares or ADSs will be treated as income from sources outside the United States and will generally constitute passive category income. The rules governing the foreign tax credit are complex. For example, recently issued U.S. Treasury regulations impose additional requirements for foreign taxes to be eligible for a foreign tax credit, and there can be no assurance that those requirements will be satisfied if you do not elect to apply the benefits of the Treaty. Instead of claiming a foreign tax credit, you may be able to deduct Korean withholding taxes on dividends in computing your taxable income, subject to generally applicable limitations under U.S. federal income tax law (including that a U.S. holder is not eligible for a deduction for creditable foreign income taxes paid or accrued in a taxable year if such U.S. holder claims a foreign tax credit for any foreign income taxes paid or accrued in the same taxable year). You are urged to consult your tax advisors regarding the availability of the foreign tax credit or a deduction under your particular circumstances.
To the extent that the amount of any distribution exceeds our current and accumulated earnings and profits for a taxable year, as determined under U.S. federal income tax principles, the distribution will first be treated as a tax-free return of capital, causing a reduction of your adjusted basis in our common shares or ADSs (thereby increasing the amount of gain, or decreasing the amount of loss, to be recognized by you on a subsequent
275
disposition of our common shares or ADSs), and the balance in excess of adjusted basis will be taxed as capital gain recognized on a sale or exchange. However, we do not expect to determine earnings and profits in accordance with U.S. federal income tax principles. Therefore, you should expect that a distribution will generally be reported and treated as a dividend (as discussed above).
Distributions of our common shares or ADSs or rights to subscribe for our common shares or ADSs that are received as part of a pro rata distribution to all of our shareholders (including holders of ADSs) generally will not be subject to U.S. federal income tax to recipient common shareholders (including holders of ADSs). Consequently, such distributions will not give rise to foreign source income and you will not be able to use a foreign tax credit for any Korean withholding tax imposed on such distributions unless such credit can be applied (subject to applicable limitations) against U.S. tax due on other income derived from foreign sources.
Disposition of Common Shares or American Depositary Shares
For U.S. federal income tax purposes, you will recognize gain or loss upon the sale, exchange or other disposition of our common shares or ADSs in an amount equal to the difference between the amount realized upon the sale, exchange or other disposition and your adjusted tax basis in our common shares or ADSs, as the case may be, both as determined in U.S. Dollars. Subject to the discussion below under “— Passive Foreign Investment Company Rules,” such gain or loss will generally be capital gain or loss and will generally be long-term capital gain or loss if at the time of sale, exchange or other disposition, our common shares or ADSs have been held for more than one year. Long-term capital gains of non-corporate U.S. holders (including individuals) are eligible for reduced rates of taxation. The deductibility of capital losses is subject to limitations.
Any gain or loss you recognize on the sale, exchange or other disposition of our common shares or ADSs will generally be treated as United States source gain or loss. Consequently, you may not be able to claim a foreign tax credit for any Korean tax imposed on the disposition of our common shares or ADSs unless such credit can be applied (subject to applicable limitations) against tax due on other income treated as derived from foreign sources. However, pursuant to recently issued U.S. Treasury regulations, any such Korean tax would generally not be a foreign income tax eligible for a foreign tax credit (regardless of any other income that you may have that is derived from foreign sources). In such case, however, the non-creditable Korean tax may reduce the amount realized on the sale, exchange or other disposition of our common shares or ADSs. You are urged to consult your tax advisors regarding the availability of the foreign tax credit under your particular circumstances.
You should note that any Korean securities transaction tax imposed upon a disposition of our common shares or ADSs generally will not be treated as a creditable foreign tax for U.S. federal income tax purposes.
Passive Foreign Investment Company Rules
Based upon the past and projected composition of our income and assets and valuation of our assets, we do not believe that we were a PFIC for 2022, and we do not expect to be a PFIC in 2023 or to become one in the foreseeable future, although there can be no assurance in this regard. PFIC status is a factual determination that is made annually. Accordingly, it is possible that we may become a PFIC in the current or any future taxable year due to changes in composition of our income or assets or valuation of our assets.
In general, we will be considered a PFIC for any taxable year in which:
| |
• |
|
at least 75% of our gross income is passive income; or |
| |
• |
|
at least 50% of the value (generally determined based on a quarterly average) of our assets is attributable to assets that produce or are held for the production of passive income. |
For this purpose, passive income generally includes dividends, interest, certain royalties and rents and gains from financial investments (other than certain income derived in the active conduct of a banking business as
276
discussed below). In addition, cash and other assets readily convertible into cash are generally considered passive assets. If we own at least 25% by value of another corporation’s stock, we will be treated, for purposes of the PFIC rules, as owning our proportionate share of the assets and receiving our proportionate share of the income of that corporation.
Our determination with respect to our PFIC status is based in part upon certain proposed U.S. Treasury regulations and other administrative pronouncements from the IRS which provide special rules for determining the character of income derived in the active conduct of a banking business for purposes of the PFIC rules. Specifically, these rules treat certain income earned by a non-U.S. corporation engaged in the active conduct of a banking business as non-passive income. Although we believe we have adopted a reasonable interpretation of the proposed U.S. Treasury regulations and administrative pronouncements, there can be no assurance that the IRS will follow the same interpretation. You should consult your own tax advisor regarding the application of these rules.
If we are a PFIC for any taxable year during which you hold our common shares or ADSs (and you do not make a timely mark-to-market election, as described below), you will be subject to special tax rules with respect to any “excess distribution” that you receive and any gain you realize from the sale or other disposition (including a pledge) of our common shares or ADSs. These special tax rules generally will apply even if we cease to be a PFIC in future years. Distributions you receive in a taxable year that are greater than 125% of the average annual distributions you received during the shorter of the three preceding taxable years or your holding period for our common shares or ADSs will be treated as excess distributions. Under these special tax rules:
| |
• |
|
the excess distribution or gain will be allocated ratably over your holding period for our common shares or ADSs; |
| |
• |
|
the amount allocated to the current taxable year, and any taxable year prior to the first taxable year in which we are a PFIC, will be treated as ordinary income; and |
| |
• |
|
the amount allocated to each other year will be subject to tax at the highest tax rate in effect for that year for individuals or corporations, as applicable, and the interest charge generally applicable to underpayments of tax will be imposed on the resulting tax attributable to each such year. |
In certain circumstances, you could make a mark-to-market election (under which in lieu of being subject to the special rules discussed above, you will include gain on our common shares or ADSs on a mark-to-market basis as ordinary income), provided that our common shares or ADSs are regularly traded on a qualified exchange or other market. Our common shares are listed on the Korea Exchange, which must meet certain trading, listing, financial disclosure and other requirements to be treated as a qualified exchange under applicable U.S. Treasury regulations for purposes of the mark-to-market election, and no assurance can be given that the common shares are or will continue to be “regularly traded” for purposes of the mark-to-market election. Our ADSs are currently listed on the New York Stock Exchange, which constitutes a qualified exchange, although there can be no assurance that the ADSs are or will continue to be “regularly traded.” If you make a valid mark-to-market election, for each year that we are a PFIC you will include as ordinary income the excess of the fair market value of your common shares or ADSs at the end of the year over your adjusted tax basis in the common shares or ADSs. You will be entitled to deduct as an ordinary loss in each such year the excess of your adjusted tax basis in the common shares or ADSs over their fair market value at the end of the year, but only to the extent of the net amount previously included in income as a result of the mark-to-market election. If you make an effective mark-to-market election, in each year that we are a PFIC any gain you recognize upon the sale or other disposition of your common shares or ADSs will be treated as ordinary income, and any loss will be treated as ordinary loss, but such loss will be ordinary only to the extent of the net amount previously included in income as a result of the mark-to-market election.
A U.S. holder’s adjusted tax basis in common shares or ADSs will be increased by the amount of any income inclusion and decreased by the amount of any deductions under the mark-to-market rules. If a U.S. holder
277
makes a mark-to-market election, it will be effective for the taxable year for which the election is made and all subsequent taxable years unless the common shares or ADSs are no longer regularly traded on a qualified exchange or other market or the IRS consents to the revocation of the election. You should consult your tax advisor about the availability of the mark-to-market election, and whether making the election would be advisable with respect to your particular circumstances.
In addition, a holder of common shares or ADSs in a PFIC can sometimes avoid the rules described above by electing to treat the company as a “qualified electing fund” under Section 1295 of the Code. This option is not available to you because we do not intend to comply with the requirements necessary to permit holders to make this election.
If we are a PFIC for any taxable year during which you hold our common shares or ADSs and any of our non-U.S. subsidiaries is also a PFIC, you will be treated as owning a proportionate amount (by value) of the shares of the lower-tier PFIC for purposes of the application of the PFIC rules. You will not be able to make the mark-to-market election described above in respect of any lower-tier PFIC. You are urged to consult your tax advisors about the application of the PFIC rules to any of our subsidiaries.
If you hold our common shares or ADSs in any year in which we are classified as a PFIC, you will generally be required to file IRS Form 8621.
Non-corporate U.S. holders will not be eligible for reduced rates of taxation on any dividends received from us if we are a PFIC in the taxable year in which such dividends are paid or were a PFIC in the preceding taxable year. You should consult your tax advisor concerning the determination of our PFIC status and the U.S. federal income tax consequences of holding our common shares or ADSs if we are considered a PFIC in any taxable year.
Information Reporting and Backup Withholding
In general, information reporting will apply to dividends in respect of our common shares or ADSs and the proceeds from the sale, exchange or other disposition of our common shares or ADSs that are paid to you within the United States (and in certain cases, outside the United States), unless you establish that you are an exempt recipient. A backup withholding tax may apply to such payments if you fail to provide a taxpayer identification number and a certification that you are not subject to backup withholding or if you fail to report in full dividend and interest income.
Backup withholding is not an additional tax. Any amounts withheld under the backup withholding rules will be allowed as a refund or a credit against your U.S. federal income tax liability provided the required information is timely furnished to the IRS.
FATCA
Under Sections 1471 through 1474 of the Code (such Sections commonly referred to as “FATCA”), certain entities in a broadly defined class of foreign financial institutions (“FFIs”) may be subject to a 30% U.S. federal withholding tax on certain United States source payments made to the FFI, unless the FFI is a “participating FFI,” which is generally defined as an FFI that (i) enters into an agreement with the IRS pursuant to which it agrees to comply with a complicated and expansive reporting regime or (ii) complies with the requirements of an intergovernmental agreement entered into by the United States and another jurisdiction regarding the implementation of FATCA (an “IGA”), or the FFI is otherwise deemed compliant with or exempt from FATCA.
The FATCA legislation also contains complex provisions requiring certain participating FFIs to withhold on certain “foreign passthru payments” made to FFIs that are not participating FFIs or otherwise exempt from FATCA withholding and to holders that fail to provide the information required by FATCA. Although the
278
definition of a “foreign passthru payment” is still reserved under current regulations, the term generally refers to payments that are from non-United States sources but that are “attributable to” certain United States payments described above. Pursuant to proposed U.S. Treasury regulations (upon which taxpayers may rely until final regulations are issued), withholding on foreign passthru payments, if applicable, would not be required with respect to payments made before the date that is two years after the date of publication of final regulations defining the term foreign passthru payment. It is unclear whether or to what extent payments on our common shares or ADSs would be considered foreign passthru payments that are subject to withholding under FATCA.
On June 10, 2015, the United States and Korea entered into an IGA to implement the foregoing requirements. The IGA is intended to result in the automatic exchange of tax information through reporting by FFIs to the IRS. Prospective investors should consult their tax advisors regarding the application of the FATCA rules to an investment in our common shares or ADSs.
| ITEM 10.F. |
Dividends and Paying Agents |
Not applicable.
| ITEM 10.G. |
Statements by Experts |
Not applicable.
| ITEM 10.H. |
Documents on Display |
We are subject to the information requirements of the U.S. Securities Exchange Act of 1934, as amended, and, in accordance therewith, are required to file reports, including annual reports on Form 20-F, and other information with the U.S. Securities and Exchange Commission. You may inspect and copy these materials, including this annual report and the exhibits thereto, at SEC’s Public Reference Room 100 Fifth Street, N.E., Washington, D.C. 20549. Please call the Commission at 1-800-SEC-0330 for further information on the public reference rooms. As a foreign private issuer, we are also required to make filings with the Commission by electronic means. Any filings we make electronically will be available to the public over the Internet at the Commission’s web site at http://www.sec.gov.
| ITEM 10.I. |
Subsidiary Information |
Not applicable.
| ITEM 10.J. |
Annual Report to Security Holders |
Not applicable.
| ITEM 11. |
QUANTITATIVE AND QUALITATIVE DISCLOSURES ABOUT MARKET RISK |
See “Item 4.B. Business Overview — Risk Management” for quantitative and qualitative disclosures about market risk.
| ITEM 12. |
DESCRIPTION OF SECURITIES OTHER THAN EQUITY SECURITIES |
| ITEM 12.A. |
Debt Securities |
Not applicable.
| ITEM 12.B. |
Warrants and Rights |
Not applicable.
279
| ITEM 12.C. |
Other Securities |
Not applicable.
| ITEM 12.D. |
American Depositary Shares |
Depositary Fees and Charges
Under the terms of the Deposit Agreement in respect of our American depositary shares (“ADSs”), the holder of ADSs may be required to pay the following fees and charges to Citibank, N.A., acting as depositary for our ADSs:
|
|
|
|
|
|
|
| Item |
|
Services |
|
Fees |
|
Paid by |
| 1 |
|
Issuance of ADSs upon deposit of common shares (excluding issuances contemplated by items 3(b) and 5 below |
|
Up to US$5.00 per 100 ADSs (or fraction thereof) issued |
|
Person depositing common shares or person receiving ADSs |
|
|
|
|
| 2 |
|
Delivery of deposited securities against surrender of ADSs |
|
Up to US$5.00 per 100 ADSs (or fraction thereof) surrendered |
|
Person surrendering ADSs for purpose of withdrawal of deposited securities or person to whom deposited securities are delivered |
|
|
|
|
| 3 |
|
Distribution of (a) cash dividends or (b) ADSs pursuant to stock dividends |
|
No fee, to the extent prohibited by the exchange on which the ADSs are listed. If the charging of such fee is not prohibited, the fees specified in item 4 below shall be payable |
|
Person to whom distribution is made |
|
|
|
|
| 4 |
|
Distribution of (a) cash proceeds (i.e., upon sale of rights and other entitlements) or (b) free shares in the form of ADSs (not constituting a stock dividend) |
|
Up to US$2.00 per 100 ADSs (or fraction thereof) held |
|
Person to whom distribution is made |
|
|
|
|
| 5 |
|
Distribution of securities other than ADSs or rights to purchase additional ADSs (i.e., spinoff shares) |
|
Up to US$5.00 per 100 ADSs (or fraction thereof) distributed |
|
Person to whom distribution is made |
|
|
|
|
| 6 |
|
Depositary Services |
|
Unless prohibited by the exchange on which the ADSs are listed, up to US$2.00 per 100 ADSs (or fraction thereof) held as of the last day of each calendar year, except to the extent of any cash dividend fee(s) charged under paragraph (3)(a) above during the applicable calendar year |
|
Person holding ADSs on last day of calendar year |
|
|
|
|
| 7 |
|
Distribution of ADSs pursuant to exercise of rights to purchase additional ADSs |
|
Up to US$2.00 per 100 ADSs (or fraction thereof) held |
|
Person who exercises such rights |
280
Holders and beneficial owners of ADSs, persons depositing common shares for deposit and persons surrendering ADSs for cancellation and for the purpose of withdrawing deposited securities shall be responsible for the following charges:
| |
(i) |
taxes (including applicable interest and penalties) and other governmental charges; |
| |
(ii) |
such registration fees as may from time to time be in effect for the registration of common shares or other deposited securities on the share register and applicable to transfers of common shares or other deposited securities to or from the name of the custodian, the depositary or any nominees upon the making of deposits and withdrawals, respectively; |
| |
(iii) |
such cable, telex and facsimile transmission and delivery expenses as are expressly provided in the Deposit Agreement to be at the expense of the person depositing or withdrawing common shares or holders and beneficial owners of ADSs; |
| |
(iv) |
the expenses and charges incurred by the depositary in the conversion of foreign currency; |
| |
(v) |
such fees and expenses as are incurred by the depositary in connection with compliance with exchange control regulations and other regulatory requirements applicable to common shares, deposited securities, ADSs and ADRs; and |
| |
(vi) |
the fees and expenses incurred by the depositary, the custodian or any nominee in connection with the servicing or delivery of deposited securities. |
Depositary fees payable upon the issuance and cancellation of ADSs are typically paid to the depositary by the brokers (on behalf of their clients) receiving the newly-issued ADSs from the depositary and by the brokers (on behalf of their clients) delivering the ADSs to the depositary for cancellation. The brokers in turn charge these transaction fees to their clients.
Depositary fees payable in connection with distributions of cash or securities to ADS holders and the depositary services fee are charged by the depositary to the holders of record of ADSs as of the applicable ADS record date. The depositary fees payable for cash distributions are generally deducted from the cash being distributed. In the case of distributions other than cash (i.e., stock dividends, rights offerings), the depositary charges the applicable fee to the ADS record date holders concurrent with the distribution. In the case of ADSs registered in the name of the investor (whether certificated or un-certificated in direct registration), the depositary sends invoices to the applicable record date ADS holders. In the case of ADSs held in brokerage and custodian accounts via the central clearing and settlement system, The Depository Trust Company (DTC), the depositary generally collects its fees through the systems provided by DTC (whose nominee is the registered holder of the ADSs held in DTC) from the brokers and custodians holding ADSs in their DTC accounts. The brokers and custodians who hold their clients’ ADSs in DTC accounts in turn charge their clients’ accounts the amount of the fees paid to the depositary banks.
In the event of refusal to pay the depositary fees, the depositary may, under the terms of the Deposit Agreement, refuse the requested service until payment is received or may set- off the amount of the depositary fees from any distribution to be made to the ADS holder.
The fees and charges the ADS holders may be required to pay may vary over time and may be changed by us and by the depositary. The ADS holders will receive prior notice of such changes.
281
Depositary Payments for the Fiscal Year 2022
In 2022, we received the following payments from Citibank, N.A., acting as depositary for our ADSs:
|
|
|
|
|
| Reimbursement of settlement infrastructure fees (including DTC fees) |
|
US$ |
— |
|
| Reimbursement of proxy process expenses (printing, postage and distribution) |
|
US$ |
74,079.90 |
|
| Legal expenses |
|
US$ |
239,912.39 |
|
| Contributions towards our investor relations efforts (i.e., non-deal roadshows, investor conferences and IR agency fees) and legal expenses incurred in connection to the preparation of our Form 20-F for the fiscal year 2022 |
|
US$ |
91,526.89 |
|
|
|
|
|
|
| Total: |
|
US$ |
405,519.18 |
|
Note: The amounts provided above are after deduction of applicable of U.S. taxes.
| ITEM 13. |
DEFAULTS, DIVIDEND ARREARAGES AND DELINQUENCIES |
Not applicable.
| ITEM 14. |
MATERIAL MODIFICATIONS TO THE RIGHTS OF SECURITY HOLDERS AND USE OF PROCEEDS |
Not applicable.
| ITEM 15. |
CONTROLS AND PROCEDURES |
Disclosure Control
Under the supervision and with the participation of our management, including our chief executive officer and chief financial officer, we have evaluated the effectiveness of the design and operation of our disclosure controls and procedures (as defined in Rule 13a-15(e) under the Securities Exchange Act of 1934, as amended, or the Exchange Act) as of December 31, 2022. There are inherent limitations to the effectiveness of any system of disclosure controls and procedures, including the possibility of human error and the circumvention or overriding of the controls and procedures. Accordingly, even effective disclosure controls and procedures can provide only reasonable assurance of achieving their control objectives. Based upon our evaluation, our chief executive officer and chief financial officer concluded that the design and operation of our disclosure controls and procedures as of December 31, 2022 were effective to provide reasonable assurance that information required to be disclosed by us in the reports we file and submit under the Exchange Act is recorded, processed, summarized and reported, within the time periods specified in the applicable rules and forms, and that it is accumulated and communicated to our management, including our chief executive officer and chief financial officer, as appropriate to allow timely decision regarding required disclosure.
Management’s Annual Report on Internal Control Over Financial Reporting
Our management is responsible for establishing and maintaining adequate internal control over financial reporting, as such term is defined in Rules 13a-15(f) and 15d-15(f) under the Exchange Act, for our company. Under the supervision and with the participation of our management, including our chief executive officer and chief financial officer, we have evaluated the effectiveness of our internal control over financial reporting as of December 31, 2022 based on the framework established in Internal Control-Integrated Framework (2013) issued by the Committee of Sponsoring Organizations of the Treadway Commission (“COSO”). Internal Control-Integrated Framework (2013) suspended the original framework issued by COSO in 1992 on December 15, 2014. We adopted the 2013 Framework on December 15, 2014. Further details of the changes made are set out below. Our internal control over financial reporting is a process designed to provide reasonable assurance regarding the reliability of financial reporting and the preparation of consolidated financial statements in accordance with
282
generally accepted accounting principles and includes those policies and procedures that (1) pertain to the maintenance of records that, in reasonable detail, accurately and fairly reflect the transactions and dispositions of a company’s assets, (2) provide reasonable assurance that transactions are recorded as necessary to permit preparation of consolidated financial statements in accordance with generally accepted accounting principles, and that a company’s receipts and expenditures are being made only in accordance with authorizations of a company’s management and directors, and (3) provide reasonable assurance regarding prevention or timely detection of unauthorized acquisition, use, or disposition of a company’s assets that could have a material effect on the consolidated financial statements.
Because of its inherent limitations, a system of internal control over financial reporting can provide only reasonable assurance with respect to consolidated financial statement preparation and presentation and may not prevent or detect misstatements. Also, projections of any evaluation of effectiveness to future periods are subject to the risk that controls may become inadequate because of changes in conditions, or that the degree of compliance with the policies or procedures may deteriorate. Based on this evaluation, our management concluded that our internal control over financial reporting was effective as of December 31, 2022.
The effectiveness of our internal control over financial reporting has been audited by Samil PricewaterhouseCoopers, an independent registered public accounting firm, who has also audited our consolidated financial statements for the year ended December 31, 2022. Samil PricewaterhouseCoopers has issued an attestation report on the effectiveness of our internal control over financial reporting an independent registered public accounting firm, as stated in its report included herein, which expressed an unqualified opinion on the effectiveness of our internal control over financial reporting as of December 31, 2022.
Attestation Report of the Independent Registered Public Accounting Firm
Samil PricewaterhouseCoopers’s attestation report on the effectiveness of internal control over financial reporting can be found on page F-2 of this annual report.
| ITEM 16A. |
AUDIT COMMITTEE FINANCIAL EXPERT |
Our Audit Committee currently consists of three outside directors, namely Yoon Jaewon (Chair), Kwak Su Keun and Bae Hoon. Our board of directors has determined that Yoon Jaewon, the chair of our Audit Committee is an “audit committee financial expert,” as such term is defined by the regulations of the Securities and Exchange Commission issued pursuant to Section 407 of the Sarbanes-Oxley Act of 2002. Yoon Jaewon, Kwak Su Keun and Bae Hoon are independent as such term is defined in Section 303A.02 of the NYSE Listed Company Manual, Rule 10A-3 under the Exchange Act and the Korea Stock Exchange listing standards.
We have adopted a code of ethics for our principal executive officer, principal financial officer, principal accounting officer or controller, or persons performing similar functions as required under Section 406 of the Sarbanes-Oxley Act of 2002, together with an insider reporting system in compliance with Section 301 of the Sarbanes-Oxley Act. We have not granted any waiver, including an implicit waiver, from a provision of the code of ethics to any of the above-mentioned officers during our most recently completed fiscal year. As a further detailed guideline to the code of ethics, we have also adopted a code of ethics applicable to all the officers and employees of our holding company and our subsidiaries and established a supplemental code of behavior for all officers and employees of our holding company and our subsidiaries in order to provide additional guideline for the performance of their work-related duties as well as their daily behavior. Our code of ethics is available on our website www.shinhangroup.com.
283
| ITEM 16C. |
PRINCIPAL ACCOUNTANT FEES AND SERVICES |
The following table sets forth the aggregate fees billed for professional services rendered by our principal auditors for the years ended December 31, 2020, 2021 and 2022, for various types of services and a brief description of the nature of such services. Samil PricewaterhouseCoopers, a Korean independent registered public accounting firm, was our principal auditors for the years ended December 31, 2020, 2021 and 2022.
|
|
|
|
|
|
|
|
|
|
|
|
|
|
|
| Type of Services |
|
Aggregate Fees Billed During the
Year Ended December 31, |
|
|
Nature of Services |
| |
2020 |
|
|
2021 |
|
|
2022 |
|
| |
|
(In millions of Won) |
|
|
|
|
|
|
|
|
|
| |
|
(In millions of Won) |
|
|
|
| Audit fees |
|
W |
11,751 |
|
|
W |
12,533 |
|
|
W |
12,807 |
|
|
Audit service for Shinhan Financial Group and its subsidiaries. |
| Audit related fees |
|
|
244 |
|
|
|
434 |
|
|
|
373 |
|
|
Assurance services rendered in the ordinary course of our business |
| Tax fees |
|
|
152 |
|
|
|
— |
|
|
|
— |
|
|
Tax return and consulting advisory service. |
| All other fees |
|
|
— |
|
|
|
— |
|
|
|
— |
|
|
All other services which do not meet the three categories above. |
|
|
|
|
|
|
|
|
|
|
|
|
|
|
|
| Total |
|
W |
12,147 |
|
|
W |
12,967 |
|
|
W |
13,180 |
|
|
|
|
|
|
|
|
|
|
|
|
|
|
|
|
|
|
Our Audit Committee generally pre-approves all engagements of our principal accountants pursuant to policies and procedures adopted by it. Our Audit Committee has adopted the following policies and procedures for consideration and approval of requests to engage our principal accountants to perform audit and non-audit services. Engagement requests for audit and non-audit services for us or our subsidiaries must, in the first instance, be submitted to our Audit Team. If the request relates to services that would impair the independence of our principal accountants, the request must be rejected. If the engagement request relates to audit and permitted non-audit services, it must be forwarded to the Audit Committee for consideration. To facilitate the consideration of engagement requests between its meetings, the Audit Committee has delegated approval authority of the following: (i) permitted non-audit services to our holding company, (ii) audit services to our subsidiaries and (iii) permitted non-audit services to our subsidiaries, to one of its members who is “independent” as defined by the Securities and Exchange Commission and the New York Stock Exchange. Such member in our case is Yoon Jaewon, the chair of our Audit Committee, and she is required to report any approvals made by her to the Audit Committee at its next meeting. Our Audit Committee meets regularly once every quarter.
Any other audit or permitted non-audit service must be pre-approved by the Audit Committee on a case-by-case basis. Our Audit Committee did not pre-approve any non-audit services under the de minimis exception of Rule 2.01(c)(7)(i)(C) of Regulation S-X as promulgated by the Securities and Exchange Commission.
| ITEM 16D. |
EXEMPTIONS FROM THE LISTING STANDARDS FOR AUDIT COMMITTEES |
Not applicable.
284
| ITEM 16E. |
PURCHASES OF EQUITY SECURITIES BY THE ISSUER AND AFFILIATED PURCHASERS |
The following table sets forth information regarding purchases by us of our common shares during the period covered by this annual report.
|
|
|
|
|
|
|
|
|
|
|
|
|
|
|
|
|
| Period |
|
Total
Number
of Shares
Purchased(1) |
|
|
Average
Price Paid
per Share |
|
|
Total
Number of
Shares
Purchased
as Part of
Publicly
Announced
Plans or
Programs |
|
|
Approximate
Dollar Value of
Shares that
May Yet Be
Purchased
Under the
Plans or
Programs (as of
end of period) |
|
| January 1 to March 31, 2022 |
|
|
— |
|
|
|
— |
|
|
|
— |
|
|
$ |
— |
|
| April 1 to June 30, 2022 |
|
|
3,665,423 |
|
|
W |
40,923 |
|
|
|
3,665,423 |
|
|
|
— |
|
| July 1 to September 30, 2022 |
|
|
— |
|
|
|
— |
|
|
|
— |
|
|
|
— |
|
| October 1 to December 31, 2022 |
|
|
4,149,262 |
|
|
W |
36,151 |
|
|
|
4,149,262 |
|
|
|
— |
|
|
|
|
|
|
|
|
|
|
|
|
|
|
|
|
|
|
| Total |
|
|
7,814,685 |
|
|
W |
38,389 |
|
|
|
7,814,685 |
|
|
$ |
— |
|
|
|
|
|
|
|
|
|
|
|
|
|
|
|
|
|
|
Other than as described above, neither we nor any “affiliated purchaser,” as defined in Rule 10b-18(a)(3) of the Exchange Act, purchased any of our equity securities during the period covered by this annual report.
| ITEM 16F. |
CHANGE IN REGISTRANT’S CERTIFYING ACCOUNTANT |
Our independent accountant has recently changed from Samil PricewaterhouseCoopers (“PwC”) to KPMG Samjong Accounting Corp. (“KPMG Samjong”). Our Audit Committee evaluated the suitability and independence of KPMG Samjong, concluding to appoint KPMG Samjong as our independent auditor for the audit of our financial statements in Korea prepared in conformity with IFRS as adopted by Korea for the fiscal years ended December 31, 2023, 2024 and 2025. Our Audit Committee also approved the appointment of KPMG Samjong as our independent registered public accounting firm for the audit of our financial statements in conformity with IFRS as issued by the IASB for the fiscal year ended December 31, 2023. KPMG Samjong’s appointment is effective from February 23, 2023. PwC’s engagement as our independent auditor and independent registered public accounting firm expired upon the completion of the audit of our consolidated financial statements as of and for the year ended December 31, 2022, and no separate dismissal process was required for PwC. However, resolutions by the audit committee are required for each of our subsidiaries, which our subsidiaries have obtained as necessary.
PwC’s reports on our consolidated financial statements for each of the fiscal years ended December 31, 2022 and 2021 did not contain an adverse opinion or a disclaimer of opinion, and were not qualified or modified as to uncertainty, audit scope or accounting principles. During the two most recent fiscal years ended December 31, 2022 and 2021 and in the subsequent interim period preceding PwC’s dismissal, or the Pre-Engagement Period, there were: (i) no disagreements between us and PwC on any matter of accounting principles or practices, financial statement disclosure or auditing scope or procedure, which disagreements, if not resolved to the satisfaction of PwC, would have caused PwC to make reference to the subject matter of the disagreements in its reports on the consolidated financial statements of Shinhan Financial Group; and (ii) no “reportable events” as defined in Item 16F(a)(1)(v) of Form 20-F.
During the Pre-Engagement Period, neither we nor anyone acting on our behalf consulted with KPMG Samjong regarding any matter that was either the subject of a disagreement, as that term is defined in Item 16F(a)(1)(iv) of Form 20-F (and the related instructions thereto), or a reportable event as described in Item 16F(a)(1)(v) of Form 20-F.
285
We provided a copy of the disclosure in this Item to KPMG Samjong and provided KPMG Samjong the opportunity to furnish us with a letter addressed to the Commission containing any new information, clarification of our expression of its views, or the respects in which it does not agree. KPMG Samjong has not furnished us with such letter. We also provided a copy of the disclosure in this Item to PwC and requested that PwC furnish us with a letter addressed to the Commission stating whether it agrees with such disclosure, and if it does not agree, stating the respects in which it does not agree. A copy of PwC’s letter dated April 20, 2023 is filed as Exhibit 15.1 to this Form 20-F.
| ITEM 16G. |
CORPORATE GOVERNANCE |
We are committed to high standards of corporate governance. We are in compliance with the corporate governance provisions of the Korean Commercial Code, the Financial Holding Companies Act of Korea, the Act on Corporate Governance of Financial Companies, the Financial Investment Services and Capital Markets Act and the Listing Rules of the Korea Exchange. We, like all other companies in Korea, must comply with the corporate governance provisions of the Korean Commercial Code. In addition, as a financial holding company, we are also subject to the Financial Holding Companies Act and the Act on Corporate Governance of Financial Companies. Also, our subsidiaries that are financial institutions must comply with the respective corporate governance provisions under the Act on Corporate Governance of Financial Companies and relevant laws under which they were established.
The Act on Corporate Governance of Financial Companies came into effect as of August 1, 2016. The Act was enacted to address calls for strengthened regulations on corporate governance of financial companies and to serve as a uniform regulation on corporate governance matters applicable to all financial companies in place of the separate regulations for each sector that existed. The Act contains several key measures, including, but not limited, to (i) condition of eligibility of officers of financial companies and standards for determining whether financial companies’ officers may hold concurrent positions in other companies, (ii) standards for composition and operation of board of directors, (iii) standards for establishment, composition and operation of committees of the board of directors, (iv) internal control and risk management, (v) requirements and procedures for the approval of a change of major shareholders and (vi) special regulations for rights of minority shareholders of financial companies.
We are a “foreign private issuer” (as such term is defined in Rule 3b-4 under the Exchange Act), and our ADSs are listed on the New York Stock Exchange, or NYSE. Under Section 303A of the NYSE Listed Company Manual, NYSE-listed companies that are foreign private issuers are permitted to follow home country practice in lieu of the corporate governance provisions specified by the NYSE with limited exceptions. Under the NYSE Listed Company Manual, we as a foreign private issuer are required to disclose significant differences between NYSE’s corporate governance standards and those we follow under Korean law. The following summarizes some significant ways in which our corporate governance practices differ from those followed by U.S. companies listed on the NYSE under the listing rules of the NYSE:
Majority of Independent Directors on the Board
Under the NYSE listing rules, U.S. companies listed on the NYSE must have a board the majority of which is comprised of independent directors satisfying the requirements of “independence” as set forth in Rule 10A-3 under the Exchange Act. While as a foreign private issuer, we are exempt from this requirement, but our board of directors is in compliance with this requirement as it currently consists of 14 directors, of which 12 directors satisfy the requirements of “independence” as set forth in Rule 10A-3 under the Exchange Act. 12 of our directors are also “outside directors” as defined in the Financial Holding Companies Act of Korea. An “outside director” for purposes of the Act on Corporate Governance of Financial Companies and the Korean Commercial Code means a director who does not engage in the regular affairs of the financial holding company, and who is elected at a shareholders’ meeting, after having been nominated by the outside director nominating committee, and none of the largest shareholder, those persons “specially related” to the largest shareholder of such company,
286
persons who during the past two years have served as an officer or employee of such company, the spouses and immediate family members of an officer of such company, and certain other persons specified by law may qualify as an outside director of such company. Under the Korea Exchange listing rules and the Korean Commercial Code, at least one-fourth of a listed company’s directors must be outside directors. In the case of “large listed companies” as defined under the Korean Commercial Code or “large financial companies” as defined under the Act on Corporate Governance of Financial Companies, like us, a majority of the directors must be outside directors provided that there must be at least three outside directors.
Executive Session
Under the NYSE listing rules, non-management directors of U.S. companies listed on the NYSE are required to meet on a regular basis without management present and independent directors must meet separately at least once per year. There is no such requirement under Korean law or listing standards or our internal regulations.
Audit Committee
Under the NYSE listing rules, listed companies must have an audit committee that has a minimum of three members, and all audit committee members must satisfy the requirements of independence set forth in Section 303A.02 of the NYSE Listed Company Manual and Rule 10A-3 under the Exchange Act. We are in compliance with this requirement as our Audit Committee is comprised of four outside directors meeting the requirements of independence set forth in Section 303A.02 of the NYSE Listed Company Manual and Rule 10A-3 under the Exchange Act. A large listed company under the Korea Exchange listing rules and the Korean Commercial Code or a large financial company under the Act on Corporate Governance of Financial Companies must also establish an audit committee of which at least two-thirds of its members must be outside directors and whose chair must be an outside director. In addition, under the Act on Corporate Governance of Financial Companies, at least one member of the audit committee who is an outside director must also be an accounting or financial expert. We are also in compliance with the foregoing requirements.
Nomination/Corporate Governance Committee
Under the NYSE listing rules, U.S. companies listed on the NYSE must have a nomination/corporate governance committee composed entirely of independent directors. In addition to identifying individuals qualified to become board members, this committee must develop and recommend to the board a set of corporate governance principles. Under the Korean Commercial Code and other applicable laws, large listed companies, financial holding companies, commercial banks, and certain other financial institutions are required to have an outside director nominating committee of which at least one-half of its members are required to be outside directors. However, there is no requirement to establish a corporate governance committee under applicable Korean law. Our outside director nominating committee is formed on an ad hoc basis prior to a general shareholders’ meeting if the agenda for such meeting includes appointment of an outside director. The composition of the committee is in compliance with the relevant provisions under the Korean Commercial Code and the Act on Corporate Governance of Financial Companies, and the chair of the committee must be an outside director pursuant to the Act on Corporate Governance of Financial Companies.
We currently have a committee for recommending candidates for CEO, which is responsible for general corporate governance, reviewing and recommending nominees for the president and/or CEO of our group and the development, operation and review of our management succession plan, including setting the qualifications for he CEO, evaluating the CEO candidate pool and recommending CEO candidates. The chair of the committee must be an outside director, and the incumbent CEO may be restricted from participating and voting on matters related to CEO selection. We also have a committee for recommending candidates for independent directors and members of the audit committee, which is responsible for matters related to the recommendation and nomination of outside directors including audit committee members. In addition, in light of the recent emphasis on corporate
287
governance, in March 2021, we transferred certain functions, such as those relating to code of ethics and other code of behavior, determination of the size of the board of directors and other matters necessary for improving our overall corporate governance structure, from the corporate governance committee to the board of directors.
Compensation Committee
Under the NYSE listing rules, U.S. companies listed on the NYSE are required to have a compensation committee which is composed entirely of independent directors. In January 2013, the SEC approved amendments to the listing rules of NYSE and NASDAQ regarding the independence of compensation committee members and the appointment, payment and oversight of compensation consultants. The listing rules were adopted as required by Section 952 of the Dodd-Frank Act and rule 10C-1 of the Securities Exchange Act of 1934, as amended, which direct the national securities exchanges to prohibit the listing of any equity security of a company that is not in compliance with the rule’s compensation committee director and advisor independence requirements. Certain elements of the listing rules became effective on July 1, 2013 and companies listed on the NYSE must comply with such listing rules by the earlier of the company’s first annual meeting after January 15, 2014, or October 31, 2014.
Under the Act on Corporate Governance of Financial Companies, financial institutions including financial holding companies must establish a compensation committee of which at least one-half of its members must be outside directors and whose chairman must be an outside director.
We currently have a remuneration committee, which is responsible for reviewing and approving the management’s evaluation and compensation programs. The committee consists of four members, all of whom are outside directors and satisfy the independent director requirements as set forth in Rule 10A-3 under the Exchange Act.
Corporate Governance Guidelines and Code of Business Conduct and Ethics
Under the NYSE listing rules, U.S. companies listed on the NYSE are required to establish corporate governance guidelines and to adopt a code of business conduct and ethics for directors, officers and employees, and promptly disclose any waivers of the code for directors or executive officers. As a foreign private issuer, we are exempt from this requirement. In Korea, the Financial Services Commission implemented the Standard Corporate Governance Guidelines for Financial Service Companies in December 2014, and accordingly, we have adopted in February 2015 and are currently complying with international regulators on corporate governance modeled after the standard guidelines implemented by the Financial Services Commission,
Pursuant to the requirements of the Sarbanes-Oxley Act, we have adopted a code of ethics applicable to all the officers and employees of our holding company and our subsidiaries, including all financial, accounting and other officers and employees that are involved in the preparation and disclosure of Shinhan Financial Group’s consolidated financial statements and internal control of financial reporting. As a further detailed guideline to the code of ethics, we have also established a supplemental code of behavior for all officers and employees of our holding company and our subsidiaries in order to provide additional guideline for the performance of their work-related duties as well as their daily behavior. We have also adopted an insider reporting system in compliance with Section 301 of the Sarbanes-Oxley Act. The above-mentioned code of ethics and the code of behavior are available on our website www.shinhangroup.com.
On May 25, 2011, the SEC adopted final rules to implement whistleblower provisions of the Dodd-Frank Act, which are applicable to foreign private issuers with securities registered under the U.S. securities laws. The final rules provide that any eligible whistleblower who voluntarily provides the SEC with original information that leads to the successful enforcement of an action brought by the SEC under U.S. securities laws must receive an award of between 10 and 30 percent of the total monetary sanctions collected if the sanctions exceed US$1,000,000. An eligible whistleblower is defined as someone who provides information about a possible
288
violation of the securities laws that he or she reasonably believes has occurred, is ongoing, or is about to occur. The possible violation does not need to be material, probably or even likely, but the information must have a “facially plausible relationship to some securities law violation”; frivolous submissions would not qualify. The final rules also prohibit retaliation against the whistleblower. While the final rules do not require employees to first report allegations of wrongdoing through a company’s corporate compliance system, they do seek to incentivize whistleblowers to utilize internal corporate compliance first by, among other things, (i) giving employees who first report information internally the benefit of the internal reporting date for purposes of the SEC program so long as the whistleblower submits the same information to the SEC within 120 days of the initial disclosure; (ii) clarifying that the SEC will consider, as part of the criteria for determining the amount of a whistleblower’s award, whether the whistleblower effectively utilized the company’s corporate compliance program or hindered the function of the program; and (iii) crediting a whistleblower who reports internally first and whose company passes the information along to the SEC, which would mean the whistleblower could receive a potentially higher award for information gathered in an internal investigation initiated as a result of the whistleblower’s internal report.
In addition, the final rules address concerns that the whistleblower rules incentivize officers, directors and those with legal, audit, compliance or similar responsibilities to abuse these positions by making whistleblower complaints to the SEC with respect to information they obtained in these roles by generally providing that information obtained through a communication subject to attorney-client privilege or as a result of legal representation would not be eligible for a whistleblower award unless disclosure would be permitted by attorney conduct rules. Accordingly, officers and directors, auditors and compliance personnel and other persons in similar roles would not be eligible to receive awards for information received in these positions unless (x) they have a reasonable basis to believe that (1) disclosure of the information is necessary to prevent the entity from engaging in conduct that is likely to cause substantial injury to the financial interests of the entity or investors; or (2) the entity is engaging in conduct that will impede an investigation of the misconduct, for example, destroying documents or improperly influencing witnesses; or (y) 120 days have passed since the whistleblower provided the information to senior responsible persons at the entity or 120 days have passed since the whistleblower received the information at a time when these people were already aware of the information.
In Korea, the Act on the Protection of Public Interest Whistleblowers (the “Act on Whistleblowers”) was enacted in March 29, 2011 and became effective on September 30, 2011. Under the Act on Whistleblowers, a “conduct detrimental to the public interest” means any conduct falling under the penalty provisions of certain acts or any conduct subject to administrative measures such as cancellation or suspension of an approval or a permit. As the Financial Holding Companies Act is included in the “certain acts” above, any conduct falling under the penalty provisions or subject to administrative measures for a violation of the Financial Holding Companies Act constitutes a “conduct detrimental to the public interest.” Any person deeming that a conduct detrimental to the public interest has been, or is likely to be, committed may make a public interest report to a representative of the organization involved or a relevant investigative agency. The personal information of a public interest whistleblower shall be kept in confidence, and the measures necessary for personal protection of a public interest whistleblower shall be taken. In addition, any disadvantageous measures against a public interest whistleblower, including discriminatory treatment and delayed payment of wage, are prohibited, and where a public interest report leads to a recovery of, or increase in, revenues of the Government, the public interest whistleblower may be entitled to compensation by the Anti-Corruption and Civil Rights Commission of Korea.
We established a group-wide whistleblower policy in July 2005 and maintain related policies and programs for most of our subsidiaries. For example, Shinhan Bank maintains a whistleblower program named “Shinhan Jikimi,” through which any employee, vendor or customer can raise concerns and report suspicious circumstances in confidence using a variety of channels including the Internet, email, postal mail, facsimile and mobile phones. In addition, Shinhan Bank distributes to its employees a quarterly email notice intended to raise awareness of the whistleblower program and posts relevant informative materials on the company bulletin board. At Shinhan Card and Shinhan Securities, we strive to maintain transparency in every aspect of business activities and provide secure and accessible channels for all related parties to raise concerns and report violations.
289
Shareholder Approval of Equity Compensation Plans
Under the NYSE listing rules, shareholders of U.S. companies listed on the NYSE are required to approve all equity compensation plans.
Under Korean law, board of directors of a listed company with capital of W300 billion or more may grant stock options to officers and employees other than directors exercisable for up to 1% of the company’s issued and outstanding shares by board’s resolution, provided that such grant is permitted by such company’s articles of incorporation and is approved by a resolution of the subsequent general meeting of stockholders. Under our articles of incorporation, we may also grant stock options, but since April 1, 2010, we have not granted any stock options.
We currently have two equity compensation plans, consisting of a performance share plan for directors and key employees and an employee stock ownership plan for all employees under the Framework Act on Labor Welfare.
In accordance with our internal regulations, performance shares granted to directors are granted pursuant to a resolution by the board of director, subject to the limit amount set by a resolution at the shareholders’ meeting while performance shares granted to key employees are granted pursuant to a resolution by the board of director, without any requirement that the limit amount be approved at the shareholders’ meeting. There are no requirements relating to the granting of performance shares under applicable Korean laws and our articles of incorporation.
Under the Framework Act on Labor Welfare, a Korean company may issue stock options up to 20% of its issued and outstanding shares by a resolution at the shareholders’ meeting, if permitted by the articles of incorporation. Our articles of incorporation does not contain such provision. The equity compensation scheme for the employee stock ownership association is governed by its internal regulations, over which we have no control under Korean law.
Annual Certification of Compliance
Under the NYSE listing rules, a chief executive officer of a U.S. company listed on the NYSE must annually certify that he or she is not aware of any violation by the company of NYSE corporate governance standards. As a foreign private issuer, we are not subject to this requirement. However, in accordance with rules applicable to both U.S. companies and foreign private issuers, we are required to promptly notify the NYSE in writing if any executive officer becomes aware of any material noncompliance with the NYSE corporate governance standards applicable to us. In addition, foreign private issuers, including us, are required to submit to the NYSE an annual written affirmation relating to compliance with Sections 303A.06 and 303A.11 of the NYSE listed company manual, which are the NYSE corporate governance standards applicable to foreign private issuers. All written affirmations must be executed in the form provided by the NYSE, without modification. An annual written affirmation is required to be submitted to the NYSE within 30 days of filing with the SEC our annual report on Form 20-F. We have been in compliance with this requirement in all material respects and plan to submit such affirmation within the prescribed timeline.
| ITEM 16H. |
MINE SAFETY DISCLOSURE |
Not applicable.
| ITEM 16I. |
DISCLOSURE REGARDING FOREIGN JURISDICTIONS THAT PREVENT INSPECTIONS. |
Not applicable.
290
| ITEM 17. |
FINANCIAL STATEMENTS |
We have responded to Item 18 in lieu of responding to this item.
| ITEM 18. |
FINANCIAL STATEMENTS |
Reference is made to Item 19(a) for a list of all financial statements filed as part of this annual report.
| (a) |
Exhibits filed as part of this Annual Report: |
See Exhibit Index beginning on page 296 of this annual report.
| (b) |
Financial Statements filed as part of this Annual Report: |
See Index to Financial Statements on page F-1 of this annual report.
291
INDEX OF EXHIBITS
|
|
|
| 1.1 |
|
Articles of Incorporation, last amended as of March 23, 2023 (in English)† |
|
|
| 2.1 |
|
Form of Common Stock Certificate (in English) †* |
|
|
| 2.2 |
|
Form of Deposit Agreement to be entered into among Shinhan Financial Group, Citibank, N.A., as depositary, and all owners and holders from time to time of American depositary shares issued thereunder, including the form of American depositary receipt* |
|
|
| 2.3 |
|
Long-term debt instruments of Shinhan Financial Group, Shinhan Bank and other consolidated subsidiaries for which financial statements are required to be filed are omitted pursuant to Item 601(b)(4)(iii) of Regulation S-K. Shinhan Financial Group agrees to furnish the Commission on request a copy of any instrument defining the rights of holders of its long-term debt and that of any subsidiary for which consolidated or unconsolidated financial statements are required to be filed.* |
|
|
| 4.1 |
|
Stock Purchase Agreement by and between Korea Deposit Insurance Corporation and Shinhan Financial Group dated July 9, 2003** |
|
|
| 4.2 |
|
Investment Agreement by and between Shinhan Financial Group and Korea Deposit Insurance Corporation dated July 9, 2003* |
|
|
| 4.3 |
|
Agreed Terms, dated June 22, 2003, by and among the President of Korea Deposit Insurance Corporation, CEO of Shinhan Financial Group, CEO of Chohung Bank, Chairman of the National Financial Industry Labor Union of Korea and the Head of the Chohung Bank Chapter of the National Financial Industry Labor Union* |
|
|
| 4.4 |
|
Merger Agreement between Shinhan Bank and Chohung Bank (in English) † *** |
|
|
| 4.5 |
|
Split-Merger Agreement between Shinhan Card and Chohung Bank (in English) † *** |
|
|
| 4.6 |
|
Form of Share Purchase Agreement, dated January 17, 2007, by and between Shinhan Financial Group and the holders of the redeemable preferred shares and the redeemable convertible shares issued by Shinhan Financial Group as part of the funding for the acquisition of LG Card Co., Ltd. (in English) †**** |
|
|
| 4.7 |
|
LG Card Acquisition Agreement, dated 2006, between Korea Development Bank and 13 other financial institutions, on the one hand, and Shinhan Financial Group†***** |
|
|
| 8.1 |
|
List of all subsidiaries of Shinhan Financial Group |
|
|
| 12.1 |
|
Certifications of our Chief Executive Officer required by Rule 13a-14(a) of the Exchange Act |
|
|
| 12.2 |
|
Certifications of our Chief Financial Officer required by Rule 13a-14(a) of the Exchange Act |
|
|
| 13.1 |
|
Certifications of our Chief Executive Officer required by Rule 13a-14(b) and Section 1350 of Chapter 63 of the United States Code (18 U.S.C. 1350) |
|
|
| 13.2 |
|
Certifications of our Chief Financial Officer required by Rule 13a-14(b) and Section 1350 of Chapter 63 of the United States Code (18 U.S.C. 1350) |
|
|
| 15.1 |
|
Letter of Samil PricewaterhouseCoopers dated April 20, 2023 |
|
|
| 101.INS |
|
Inline XBRL Instance Document (the instance document does not appear in the Interactive Data File because its XBRL tags are embedded within the Inline XBRL document) |
|
|
| 101.SCH |
|
Inline XBRL Taxonomy Extension Schema Document |
|
|
| 101.CAL |
|
Inline XBRL Taxonomy Extension Calculation Linkbase Document |
|
|
| 101.DEF |
|
Inline XBRL Taxonomy Extension Definition Linkbase Document |
|
|
| 101.LAB |
|
Inline XBRL Taxonomy Extension Label Linkbase Document |
|
|
| 101.PRE |
|
Inline XBRL Taxonomy Extension Presentation Linkbase Document |
|
|
| 104 |
|
Cover Page Interactive Data File (formatted as Inline XBRL and contained in Exhibits 101) |
| † |
A fair and accurate translation from Korean into English. |
292
| * |
Incorporated by reference to the registrant’s previous filing on Form 20-F (No. 001-31798), filed on September 15, 2003. |
| ** |
Incorporated by reference to the registrant’s previous filing on Form 20-F (No. 001-31798), filed on September 15, 2003. Confidential treatment has been requested for certain portions of the Stock Purchase Agreement. |
| *** |
Incorporated by reference to the registrant’s previous filing on Form 20-F (No. 001-31798), filed on June 30, 2006. |
| **** |
Incorporated by reference to the registrant’s previous filing on Form 20-F (No. 001-31798), filed on June 29, 2007. |
| ***** |
Incorporated by reference to registrant’s previous filing on Form 20-F (No. 001-31798), filed on June 30, 2008. |
293
SIGNATURES
The registrant hereby certifies that it meets all of the requirements for filing on Form 20-F and that it has duly caused and authorized the undersigned to sign this annual report on its behalf.
Date: April 20, 2023
|
|
|
| Shinhan Financial Group Co., Ltd. |
|
|
| By: |
|
/s/ Jin Okdong |
|
|
Name: Jin Okdong |
|
|
Title: Chief Executive Officer |
294
interest rate, DCFDCF, NAV, Option model(*1), Comparable company analysisOption model, Implied forward interest rate, DCFThe volatility of the underlying asset, Regression coefficient and CorrelationsThe volatility of the underlying asset, Correlations and Hazard Rate2022-06-302022-03-312022-09-3050% plus 1 share
INDEX TO CONSOLIDATED FINANCIAL STATEMENTS
|
|
|
|
|
| |
|
Samil PricewaterhouseCoopers |
|
17th Flr, 100, hangang-daero, |
REPORT OF INDEPENDENT REGISTERED PUBLIC ACCOUNTING FIRM
To the Board of Directors and Shareholders of Shinhan Financial Group Co., Ltd.:
Opinions on the Financial Statements and Internal Control over Financial Reporting
We have audited the accompanying consolidated statements of financial position of Shinhan Financial Group Co., Ltd. and its subsidiaries (the “Company”) as of December 31, 2022 and 2021, and the related consolidated statements of comprehensive income, changes in equity and cash flows for each of the three years in the period ended December 31, 2022, including the related notes (collectively referred to as the “consolidated financial statements”). We also have audited the Company’s internal control over financial reporting as of December 31, 2022, based on criteria established in
Internal Control — Integrated Framework
(2013) issued by the Committee of Sponsoring Organizations of the Treadway Commission (COSO).
In our opinion, the consolidated financial statements referred to above present fairly, in all material respects, the financial position of the Company as of December 31, 2022 and 2021, and the results of its operations and its cash flows for each of the three years in the period ended December 31, 2022 in conformity with International Financial Reporting Standards as issued by the International Accounting Standards Board. Also in our opinion, the Company maintained, in all material respects, effective internal control over financial reporting as of December 31, 2022, based on criteria established in
Internal Control — Integrated Framework
(2013) issued by the COSO.
The Company’s management is responsible for these consolidated financial statements, for maintaining effective internal control over financial reporting, and for its assessment of the effectiveness of internal control over financial reporting, included in the accompanying Management’s Annual Report on Internal Control over Financial Reporting appearing under Item 15. Our responsibility is to express opinions on the Company’s consolidated financial statements and on the Company’s internal control over financial reporting based on our audits. We are a public accounting firm registered with the Public Company Accounting Oversight Board (United States) (PCAOB) and are required to be independent with respect to the Company in accordance with the U.S. federal securities laws and the applicable rules and regulations of the Securities and Exchange Commission and the PCAOB.
We conducted our audits in accordance with the standards of the PCAOB. Those standards require that we plan and perform the audits to obtain reasonable assurance about whether the consolidated financial statements are free of material misstatement, whether due to error or fraud, and whether effective internal control over financial reporting was maintained in all material respects.
Our audits of the consolidated financial statements included performing procedures to assess the risks of material misstatement of the consolidated financial statements, whether due to error or fraud, and performing procedures that respond to those risks. Such procedures included examining, on a test basis, evidence regarding the amounts and disclosures in the consolidated financial statements. Our audits also included evaluating the accounting principles used and significant estimates made by management, as well as evaluating the overall presentation of the consolidated financial statements. Our audit of internal control over financial reporting included obtaining an understanding of internal control over financial reporting, assessing the risk that a material weakness exists, and testing and evaluating the design and operating effectiveness of internal control based on the assessed risk. Our audits also included performing such other procedures as we considered necessary in the circumstances. We believe that our audits provide a reasonable basis for our opinions.
Definition and Limitations of Internal Control over Financial Reporting
A company’s internal control over financial reporting is a process designed to provide reasonable assurance regarding the reliability of financial reporting and the preparation of financial statements for external purposes in
accordance with generally accepted accounting principles. A company’s internal control over financial reporting includes those policies and procedures that (i) pertain to the maintenance of records that, in reasonable detail, accurately and fairly reflect the transactions and dispositions of the assets of the company; (ii) provide reasonable assurance that transactions are recorded as necessary to permit preparation of financial statements in accordance with generally accepted accounting principles, and that receipts and expenditures of the company are being made only in accordance with authorizations of management and directors of the company; and (iii) provide reasonable assurance regarding prevention or timely detection of unauthorized acquisition, use, or disposition of the company’s assets that could have a material effect on the financial statements.
Because of its inherent limitations, internal control over financial reporting may not prevent or detect misstatements. Also, projections of any evaluation of effectiveness to future periods are subject to the risk that controls may become inadequate because of changes in conditions, or that the degree of compliance with the policies or procedures may deteriorate.
The critical audit matters communicated below are matters arising from the current period audit of the consolidated financial statements that were communicated or required to be communicated to the audit committee and that (i) relate to accounts or disclosures that are material to the consolidated financial statements and (ii) involved our especially challenging, subjective, or complex judgments. The communication of critical audit matters does not alter in any way our opinion on the consolidated financial statements, taken as a whole, and we are not, by communicating the critical audit matters below, providing separate opinions on the critical audit matters or on the accounts or disclosures to which they relate.
Allowance for Credit Losses of Loans Measured at Amortized Cost
As described in Notes 4, 5, and 12 to the consolidated financial statements, as of 31 December 2022, the allowance for credit losses was
W
3,650,863 million on total loans at amortized cost retained of
W
415,942,374 million. The Company recognizes allowance for expected credit losses of loans measured at amortized cost under both individual and collective assessment. For collectively assessed loans, the calculation of the allowance for credit losses required management to make a number of judgments, assumptions and estimates. The most significant included probability of default, the accuracy of borrower credit risk ratings, and forward-looking information. Allowance for credit losses for individually assessed loans are determined by the estimation of the expected cash flows.
The principal considerations for our determination that performing procedures relating to the allowance for credit losses of loans measured at amortized cost is a critical audit matter are: (i) there was significant judgment by management in determining the allowance, which in turn led to a high degree of auditor subjectivity in performing procedures related to the impairment models, key assumptions, such as probability of default, credit risk ratings, determination of the forward-looking information and the expected future cash flows related to individual exposures; (ii) there was significant judgment and effort in evaluating audit evidence related to these models, judgments and assumptions used to determine the allowance; and (iii) the audit effort involved the use of professionals with specialized skill and knowledge.
Addressing the matter involved performing procedures and evaluating audit evidence in connection with forming our overall opinion on the consolidated financial statements. These procedures included testing the effectiveness of controls relating to the estimation process, which included controls over the data, models and assumptions used in determining the allowance for credit losses. These procedures also included, among others, the involvement of professionals with specialized skill and knowledge to assist in testing management’s process to estimate the allowance for credit losses including evaluating the appropriateness of methodology and models, and evaluating the reasonableness of significant assumptions used in the impairment models, such as probability of default and credit risk ratings. It also included evaluating the reasonableness of key assumptions in the forward-looking information. Evaluating the forward-looking information assumptions involved assessing their
reasonableness against external data and economic events that have occurred. We also assessed the reasonableness of the accuracy of borrower credit risk ratings and expected future cash flows related to individually assessed exposures.
Valuation of Level 3
Derivatives measure fair value using the internal valuation model
As described in Note 4.(e) to the consolidated financial statements,
derivatives classified as level 3 of Shinhan Securities Corp. subject to fair value measurement using internal valuation model were
W
9,001,730 million as of December 31, 2022. Valuation of such derivatives requires broad judgement on internal valuation models and the type of unobservable inputs used. When adopting or modifying models or unobservable inputs used for valuation of such derivatives, the most significant includes the appropriateness of internal valuation models or unobservable inputs used.
The principal considerations for our determination that performing procedures relating to valuation of level 3
derivatives is a critical audit matter are: (i) there was significant judgment by management in determining the internal valuation model, which in turn led to a high degree of auditor subjectivity in performing procedures related to the valuation of derivatives using internal valuation models; (ii) there was significant judgment and effort in evaluating audit evidence related to these internal valuation models and unobservable inputs used to determine the valuation of level 3
derivatives; and (iii) the audit effort involved the use of professionals with specialized skill and knowledge.
Addressing the matter involved performing procedures and evaluating audit evidence in connection with forming our overall opinion on the consolidated financial statements. These procedures included testing the effectiveness of controls relating to the valuation process, which included controls over the review on development and validation on change of the internal valuation models and unobservable inputs used in valuation of level 3 derivatives. These procedures also included, among others, the involvement of professionals with specialized skill and knowledge to assist in developing an independent estimate of fair value using independently assessed internal valuation models and unobservable inputs for the evaluation of the management’s valuation.
/s/Samil PricewaterhouseCoopers
Seoul, the Republic of Korea
We have served as the Company’s auditor since 2020.
SHINHAN FINANCIAL GROUP CO., LTD. AND SUBSIDIARIES
Consolidated Statements of Financial Position
As of December 31, 2021 and 2022
|
|
|
|
|
|
|
|
|
|
|
|
|
|
|
|
|
|
|
|
|
|
|
| |
|
|
|
|
|
|
|
|
|
| |
|
|
|
|
|
|
|
|
|
|
|
|
| Cash and due from banks at amortized cost |
|
|
4, 8, 12, 19 |
|
|
W |
28,453,404 |
|
|
|
29,532,235 |
|
| Financial assets at fair value through profit or loss |
|
|
4, 9, 19 |
|
|
|
62,403,759 |
|
|
|
56,643,670 |
|
| Derivative assets |
|
|
4, 10 |
|
|
|
3,799,189 |
|
|
|
6,461,796 |
|
| Securities at fair value through other comprehensive income |
|
|
4, 11, 19 |
|
|
|
64,838,323 |
|
|
|
63,661,719 |
|
| Securities at amortized cost |
|
|
4, 11, 19 |
|
|
|
49,930,076 |
|
|
|
57,971,493 |
|
| Loans at amortized cost |
|
|
4, 12 |
|
|
|
389,137,156 |
|
|
|
412,291,511 |
|
| Property and equipment, net |
|
|
13, 18, 19 |
|
|
|
4,046,164 |
|
|
|
4,011,097 |
|
| Intangible assets |
|
|
14 |
|
|
|
5,644,782 |
|
|
|
5,807,836 |
|
| Investments in associates |
|
|
15 |
|
|
|
2,913,745 |
|
|
|
2,904,474 |
|
| Current tax receivable |
|
|
|
|
|
|
15,159 |
|
|
|
26,307 |
|
| Deferred tax assets |
|
|
41 |
|
|
|
134,854 |
|
|
|
1,052,333 |
|
| Investment property |
|
|
16 |
|
|
|
675,391 |
|
|
|
363,108 |
|
| Net defined benefit assets |
|
|
25 |
|
|
|
142,020 |
|
|
|
619,653 |
|
| Other assets |
|
|
4, 12, 17, 19 |
|
|
|
35,973,754 |
|
|
|
34,507,838 |
|
| Assets held for sale |
|
|
|
|
|
|
44,409 |
|
|
|
29,211 |
|
| |
|
|
|
|
|
|
|
|
|
|
|
|
| |
|
|
|
|
|
W |
648,152,185 |
|
|
|
675,884,281 |
|
| |
|
|
|
|
|
|
|
|
|
|
|
|
| |
|
|
|
|
|
|
|
|
|
|
|
|
| Deposits |
|
|
4, 20 |
|
|
W |
364,896,675 |
|
|
|
383,010,745 |
|
| Financial liabilities at fair value through profit or loss |
|
|
4, 21 |
|
|
|
1,369,225 |
|
|
|
1,146,110 |
|
| Financial liabilities designated at fair value through profit or loss |
|
|
4, 22 |
|
|
|
8,023,870 |
|
|
|
8,367,368 |
|
| Derivative liabilities |
|
|
4, 10 |
|
|
|
3,586,564 |
|
|
|
7,704,705 |
|
| Borrowings |
|
|
4, 23 |
|
|
|
43,167,065 |
|
|
|
49,279,175 |
|
| Debt securities issued |
|
|
4, 24 |
|
|
|
80,149,363 |
|
|
|
77,288,783 |
|
| Net defined benefit liabilities |
|
|
25 |
|
|
|
51,204 |
|
|
|
14,664 |
|
| Provisions |
|
|
26 |
|
|
|
1,166,856 |
|
|
|
1,266,314 |
|
| Current tax payable |
|
|
|
|
|
|
702,660 |
|
|
|
702,143 |
|
| Deferred tax liabilities |
|
|
41 |
|
|
|
175,947 |
|
|
|
169,956 |
|
| Liabilities under insurance contracts |
|
|
27 |
|
|
|
54,333,498 |
|
|
|
54,315,124 |
|
| Other liabilities |
|
|
4, 28 |
|
|
|
40,990,836 |
|
|
|
41,488,772 |
|
| |
|
|
|
|
|
|
|
|
|
|
|
|
| |
|
|
|
|
|
|
598,613,763 |
|
|
|
624,753,859 |
|
| |
|
|
|
|
|
|
|
|
|
|
|
|
| |
|
|
29 |
|
|
|
|
|
|
|
|
|
| Capital stock |
|
|
|
|
|
|
2,969,641 |
|
|
|
2,969,641 |
|
| Hybrid bonds |
|
|
|
|
|
|
3,334,531 |
|
|
|
4,196,968 |
|
| Capital surplus |
|
|
|
|
|
|
12,095,043 |
|
|
|
12,095,043 |
|
| Capital adjustments |
|
|
|
|
|
|
(664,429 |
) |
|
|
(582,859 |
) |
| Accumulated other comprehensive loss |
|
|
|
|
|
|
(984,936 |
) |
|
|
(3,582,720 |
) |
| Retained earnings |
|
|
|
|
|
|
30,541,300 |
|
|
|
33,342,633 |
|
| |
|
|
|
|
|
|
|
|
|
|
|
|
| Total equity attributable to equity holders of Shinhan Financial Group Co., Ltd. |
|
|
|
|
|
|
47,291,150 |
|
|
|
48,438,706 |
|
Non-controlling interests |
|
|
|
|
|
|
2,247,272 |
|
|
|
2,691,716 |
|
| |
|
|
|
|
|
|
|
|
|
|
|
|
| |
|
|
|
|
|
|
49,538,422 |
|
|
|
51,130,422 |
|
| |
|
|
|
|
|
|
|
|
|
|
|
|
Total liabilities and equity |
|
|
|
|
|
W |
648,152,185 |
|
|
|
675,884,281 |
|
| |
|
|
|
|
|
|
|
|
|
|
|
|
See accompanying notes to the consolidated financial statements.
SHINHAN FINANCIAL GROUP CO., LTD. AND SUBSIDIARIES
Consolidated Statements of Comprehensive Income
For the years ended December 31, 2020, 2021 and 2022
|
|
|
|
|
|
|
|
|
|
|
|
|
|
|
|
|
|
|
|
|
|
|
|
|
|
|
|
|
|
| Interest income |
|
|
|
|
|
|
|
|
|
|
|
|
|
|
|
|
| Financial assets at fair value through other comprehensive income and at amortized cost |
|
|
|
|
|
W |
13,943,159 |
|
|
|
14,027,418 |
|
|
|
19,167,750 |
|
| Financial assets at fair value through profit or loss |
|
|
|
|
|
|
830,837 |
|
|
|
696,812 |
|
|
|
940,916 |
|
| |
|
|
|
|
|
|
|
|
|
|
|
|
|
|
|
|
| |
|
|
|
|
|
|
14,773,996 |
|
|
|
14,724,230 |
|
|
|
20,108,666 |
|
| Interest expense |
|
|
|
|
|
|
(4,891,296 |
) |
|
|
(3,954,905 |
) |
|
|
(7,644,985 |
) |
| |
|
|
|
|
|
|
|
|
|
|
|
|
|
|
|
|
| |
|
|
31 |
|
|
|
9,882,700 |
|
|
|
10,769,325 |
|
|
|
12,463,681 |
|
| Fees and commission income |
|
|
|
|
|
|
3,814,474 |
|
|
|
4,139,885 |
|
|
|
4,110,576 |
|
| Fees and commission expense |
|
|
|
|
|
|
(1,431,541 |
) |
|
|
(1,464,888 |
) |
|
|
(1,585,010 |
) |
| |
|
|
|
|
|
|
|
|
|
|
|
|
|
|
|
|
Net fees and commission income |
|
|
32 |
|
|
|
2,382,933 |
|
|
|
2,674,997 |
|
|
|
2,525,566 |
|
| Insurance income |
|
|
|
|
|
|
7,247,753 |
|
|
|
6,484,523 |
|
|
|
6,890,905 |
|
| Insurance expenses |
|
|
|
|
|
|
(7,851,685 |
) |
|
|
(7,259,909 |
) |
|
|
(7,718,138 |
) |
| |
|
|
|
|
|
|
|
|
|
|
|
|
|
|
|
|
| |
|
|
27 |
|
|
|
(603,932 |
) |
|
|
(775,386 |
) |
|
|
(827,233 |
) |
| Dividend income |
|
|
33 |
|
|
|
97,956 |
|
|
|
124,531 |
|
|
|
142,529 |
|
| Net gain (loss) on financial instruments at fair value through profit or loss |
|
|
34 |
|
|
|
272,830 |
|
|
|
1,103,631 |
|
|
|
(304,113 |
) |
| Net gain (loss) on financial instruments at fair value through profit or loss (overlay approach) |
|
|
9 |
|
|
|
(136,255 |
) |
|
|
43,003 |
|
|
|
313,211 |
|
| Net gain (loss) on financial instruments designated at fair value through profit or loss |
|
|
35 |
|
|
|
198,239 |
|
|
|
(88,301 |
) |
|
|
576,942 |
|
| Net gain on foreign currency transaction |
|
|
|
|
|
|
526,615 |
|
|
|
222,819 |
|
|
|
180,304 |
|
| Net gain (loss) on disposal of securities at fair value through other comprehensive income |
|
|
11 |
|
|
|
273,793 |
|
|
|
85,596 |
|
|
|
(127,393 |
) |
| Net loss on disposal of securities at amortized cost |
|
|
11 |
|
|
|
(25 |
) |
|
|
(319 |
) |
|
|
(101 |
) |
| Provision for allowance for credit loss |
|
|
36 |
|
|
|
(1,382,179 |
) |
|
|
(974,685 |
) |
|
|
(1,292,296 |
) |
| General and administrative expenses |
|
|
37 |
|
|
|
(5,212,473 |
) |
|
|
(5,743,088 |
) |
|
|
(6,013,514 |
) |
| Other operating expenses, net |
|
|
39 |
|
|
|
(1,370,466 |
) |
|
|
(1,490,027 |
) |
|
|
(1,749,504 |
) |
| |
|
|
|
|
|
|
|
|
|
|
|
|
|
|
|
|
| |
|
|
|
|
|
|
4,929,736 |
|
|
|
5,952,096 |
|
|
|
5,888,079 |
|
| |
|
|
|
|
| Equity method income |
|
|
15 |
|
|
|
159,533 |
|
|
|
158,600 |
|
|
|
121,697 |
|
Other non-operating income (expense), net |
|
|
40 |
|
|
|
(335,398 |
) |
|
|
(527,032 |
) |
|
|
339,475 |
|
| |
|
|
|
|
|
|
|
|
|
|
|
|
|
|
|
|
Profit before income taxes |
|
|
|
|
|
|
4,753,871 |
|
|
|
5,583,664 |
|
|
|
6,349,251 |
|
| |
|
|
|
|
|
|
|
|
|
|
|
|
|
|
|
|
| Income tax expense |
|
|
41 |
|
|
|
1,255,795 |
|
|
|
1,471,036 |
|
|
|
1,617,088 |
|
| |
|
|
|
|
|
|
|
|
|
|
|
|
|
|
|
|
| |
|
|
|
|
|
W |
3,498,076 |
|
|
|
4,112,628 |
|
|
|
4,732,163 |
|
| |
|
|
|
|
|
|
|
|
|
|
|
|
|
|
|
|
SHINHAN FINANCIAL GROUP CO., LTD. AND SUBSIDIARIES
Consolidated Statements of Comprehensive Income (Continued)
For the years ended December 31, 2020, 2021 and 2022
|
|
|
|
|
|
|
|
|
|
|
|
|
|
|
|
|
(In millions of won, except earnings per share data) |
|
|
|
|
|
|
|
|
|
|
|
|
Other comprehensive income for the year, net of income tax |
|
|
29 |
|
|
|
|
|
|
|
|
|
|
|
|
|
| Items that are or may be reclassified to profit or loss: |
|
|
|
|
|
|
|
|
|
|
|
|
|
|
|
|
| Loss on securities at fair value through other comprehensive income |
|
|
|
|
|
W |
(86,784 |
) |
|
|
(879,671 |
) |
|
|
(2,447,712 |
) |
| Gain (loss) on financial instruments at fair value through profit or loss (overlay approach) |
|
|
9 |
|
|
|
90,298 |
|
|
|
(20,098 |
) |
|
|
(220,097 |
) |
| Equity in other comprehensive income (loss) of associates |
|
|
|
|
|
|
(3,318 |
) |
|
|
2,748 |
|
|
|
(15,758 |
) |
| Foreign currency translation adjustments for foreign operations |
|
|
|
|
|
|
(161,365 |
) |
|
|
252,308 |
|
|
|
14,732 |
|
| Net change in unrealized fair value of cash flow hedges |
|
|
|
|
|
|
(14,460 |
) |
|
|
21,700 |
|
|
|
(70,494 |
) |
| Other comprehensive income (loss) of separate account |
|
|
|
|
|
|
3,884 |
|
|
|
(41,273 |
) |
|
|
(113,207 |
) |
| |
|
|
|
|
|
|
|
|
|
|
|
|
|
|
|
|
| |
|
|
|
|
|
|
(171,745 |
) |
|
|
(664,286 |
) |
|
|
(2,852,536 |
) |
| Items that will never be reclassified to profit or loss: |
|
|
|
|
|
|
|
|
|
|
|
|
|
|
|
|
| Remeasurements of the defined benefit liability |
|
|
|
|
|
|
15,812 |
|
|
|
43,277 |
|
|
|
251,991 |
|
| Equity in other comprehensive loss of associates |
|
|
|
|
|
|
(10 |
) |
|
|
(2 |
) |
|
|
(5 |
) |
| Valuation gain on securities at fair value through other comprehensive income |
|
|
|
|
|
|
6,841 |
|
|
|
35,441 |
|
|
|
5,133 |
|
| Gain(loss)on disposal of securities at fair value through other comprehensive income |
|
|
|
|
|
|
(27,826 |
) |
|
|
(29,421 |
) |
|
|
2,134 |
|
| Changes in own credit risk on financial liabilities designated at fair value through profit of loss |
|
|
|
|
|
|
3,084 |
|
|
|
(2,798 |
) |
|
|
(4,749 |
) |
| |
|
|
|
|
|
|
|
|
|
|
|
|
|
|
|
|
| |
|
|
|
|
|
|
(2,099 |
) |
|
|
46,497 |
|
|
|
254,504 |
|
| |
|
|
|
|
|
|
|
|
|
|
|
|
|
|
|
|
| Total other comprehensive income, net of income tax |
|
|
|
|
|
|
(173,844 |
) |
|
|
(617,789 |
) |
|
|
(2,598,032 |
) |
| |
|
|
|
|
|
|
|
|
|
|
|
|
|
|
|
|
Total comprehensive income for the year |
|
|
|
|
|
W |
3,324,232 |
|
|
|
3,494,839 |
|
|
|
2,134,131 |
|
| |
|
|
|
|
|
|
|
|
|
|
|
|
|
|
|
|
| |
|
|
|
|
|
|
|
|
|
|
|
|
|
|
|
|
| Equity holders of Shinhan Financial Group Co., Ltd. |
|
|
29, 42 |
|
|
W |
3,414,595 |
|
|
|
4,019,254 |
|
|
|
4,642,292 |
|
Non-controlling interests |
|
|
|
|
|
|
83,481 |
|
|
|
93,374 |
|
|
|
89,871 |
|
| |
|
|
|
|
|
|
|
|
|
|
|
|
|
|
|
|
| |
|
|
|
|
|
W |
3,498,076 |
|
|
|
4,112,628 |
|
|
|
4,732,163 |
|
| |
|
|
|
|
|
|
|
|
|
|
|
|
|
|
|
|
Total comprehensive income attributable to: |
|
|
|
|
|
|
|
|
|
|
|
|
|
|
|
|
| Equity holders of Shinhan Financial Group Co., Ltd. |
|
|
|
|
|
W |
3,242,745 |
|
|
|
3,402,925 |
|
|
|
2,045,190 |
|
Non-controlling interests |
|
|
|
|
|
|
81,487 |
|
|
|
91,914 |
|
|
|
88,941 |
|
| |
|
|
|
|
|
|
|
|
|
|
|
|
|
|
|
|
| |
|
|
|
|
|
W |
3,324,232 |
|
|
|
3,494,839 |
|
|
|
2,134,131 |
|
| |
|
|
|
|
|
|
|
|
|
|
|
|
|
|
|
|
| |
|
|
29, 42 |
|
|
|
|
|
|
|
|
|
|
|
|
|
| Basic and diluted earnings per share in won |
|
|
|
|
|
W |
6,654 |
|
|
|
7,308 |
|
|
|
8,454 |
|
| |
|
|
|
|
|
|
|
|
|
|
|
|
|
|
|
|
See accompanying notes to the consolidated financial statements.
SHINHAN FINANCIAL GROUP CO., LTD. AND SUBSIDIARIES
Consolidated Statements of Changes in Equity
For the year ended December 31, 2020
|
|
|
|
|
|
|
|
|
|
|
|
|
|
|
|
|
|
|
|
|
|
|
|
|
|
|
|
|
|
|
|
|
|
|
|
|
|
|
Equity attributable to equity holders of Shinhan Financial Group Co., Ltd. |
|
|
|
|
|
|
|
| |
|
|
|
|
|
|
|
|
|
|
|
|
|
other compre-
hensive
income (loss) |
|
|
|
|
|
|
|
|
|
|
|
|
|
Balance at January 1, 2020 |
|
W |
2,732,463 |
|
|
|
1,731,235 |
|
|
|
10,565,353 |
|
|
|
(1,116,770 |
) |
|
|
(260,156 |
) |
|
|
25,525,821 |
|
|
|
39,177,946 |
|
|
|
2,752,435 |
|
|
|
41,930,381 |
|
Total comprehensive income for the year |
|
|
|
|
|
|
|
|
|
|
|
|
|
|
|
|
|
|
|
|
|
|
|
|
|
|
|
|
|
|
|
|
|
|
|
|
| Profit for the year |
|
|
— |
|
|
|
— |
|
|
|
— |
|
|
|
— |
|
|
|
— |
|
|
|
3,414,595 |
|
|
|
3,414,595 |
|
|
|
83,481 |
|
|
|
3,498,076 |
|
Other comprehensive income (loss), net of income tax: |
|
|
|
|
|
|
|
|
|
|
|
|
|
|
|
|
|
|
|
|
|
|
|
|
|
|
|
|
|
|
|
|
|
|
|
|
| Loss on valuation and disposal of securities at fair value through other comprehensive income |
|
|
— |
|
|
|
— |
|
|
|
— |
|
|
|
— |
|
|
|
(107,484 |
) |
|
|
— |
|
|
|
(107,484 |
) |
|
|
(285 |
) |
|
|
(107,769 |
) |
| Gain on financial instruments at fair value through profit or loss (overlay approach) |
|
|
— |
|
|
|
— |
|
|
|
— |
|
|
|
— |
|
|
|
90,298 |
|
|
|
— |
|
|
|
90,298 |
|
|
|
— |
|
|
|
90,298 |
|
| Equity in other comprehensive loss of associates |
|
|
— |
|
|
|
— |
|
|
|
— |
|
|
|
— |
|
|
|
(3,328 |
) |
|
|
— |
|
|
|
(3,328 |
) |
|
|
— |
|
|
|
(3,328 |
) |
| Foreign currency translation adjustments for foreign operations |
|
|
— |
|
|
|
— |
|
|
|
— |
|
|
|
— |
|
|
|
(159,596 |
) |
|
|
— |
|
|
|
(159,596 |
) |
|
|
(1,769 |
) |
|
|
(161,365 |
) |
| Net change in unrealized fair value of cash flow hedges |
|
|
— |
|
|
|
— |
|
|
|
— |
|
|
|
— |
|
|
|
(14,460 |
) |
|
|
— |
|
|
|
(14,460 |
) |
|
|
— |
|
|
|
(14,460 |
) |
| Other comprehensive income of separate account |
|
|
— |
|
|
|
— |
|
|
|
— |
|
|
|
— |
|
|
|
3,884 |
|
|
|
— |
|
|
|
3,884 |
|
|
|
— |
|
|
|
3,884 |
|
| Remeasurements of defined benefit plans |
|
|
— |
|
|
|
— |
|
|
|
— |
|
|
|
— |
|
|
|
15,752 |
|
|
|
— |
|
|
|
15,752 |
|
|
|
60 |
|
|
|
15,812 |
|
| Changes in own credit risk on financial liabilities designated at fair value through profit or loss |
|
|
— |
|
|
|
— |
|
|
|
— |
|
|
|
— |
|
|
|
3,084 |
|
|
|
— |
|
|
|
3,084 |
|
|
|
— |
|
|
|
3,084 |
|
| |
|
|
|
|
|
|
|
|
|
|
|
|
|
|
|
|
|
|
|
|
|
|
|
|
|
|
|
|
|
|
|
|
|
|
|
|
| Total other comprehensive loss |
|
|
— |
|
|
|
— |
|
|
|
— |
|
|
|
— |
|
|
|
(171,850 |
) |
|
|
— |
|
|
|
(171,850 |
) |
|
|
(1,994 |
) |
|
|
(173,844 |
) |
| |
|
|
|
|
|
|
|
|
|
|
|
|
|
|
|
|
|
|
|
|
|
|
|
|
|
|
|
|
|
|
|
|
|
|
|
|
Total comprehensive income(loss) |
|
|
— |
|
|
|
— |
|
|
|
— |
|
|
|
— |
|
|
|
(171,850 |
) |
|
|
3,414,595 |
|
|
|
3,242,745 |
|
|
|
81,487 |
|
|
|
3,324,232 |
|
| |
|
|
|
|
|
|
|
|
|
|
|
|
|
|
|
|
|
|
|
|
|
|
|
|
|
|
|
|
|
|
|
|
|
|
|
|
| |
|
|
|
|
|
|
|
|
|
|
|
|
|
|
|
|
|
|
|
|
|
|
|
|
|
|
|
|
|
|
|
|
|
|
|
|
| Dividends |
|
|
— |
|
|
|
— |
|
|
|
— |
|
|
|
— |
|
|
|
— |
|
|
|
(883,929 |
) |
|
|
(883,929 |
) |
|
|
— |
|
|
|
(883,929 |
) |
| Dividends to hybrid bonds |
|
|
— |
|
|
|
— |
|
|
|
— |
|
|
|
— |
|
|
|
— |
|
|
|
(85,327 |
) |
|
|
(85,327 |
) |
|
|
— |
|
|
|
(85,327 |
) |
| Issuance of hybrid bonds |
|
|
— |
|
|
|
448,699 |
|
|
|
— |
|
|
|
— |
|
|
|
— |
|
|
|
— |
|
|
|
448,699 |
|
|
|
— |
|
|
|
448,699 |
|
| |
|
|
237,178 |
|
|
|
— |
|
|
|
1,197,774 |
|
|
|
— |
|
|
|
— |
|
|
|
— |
|
|
|
1,434,952 |
|
|
|
— |
|
|
|
1,434,952 |
|
| Acquisition of treasury stock(Note 29) |
|
|
— |
|
|
|
— |
|
|
|
— |
|
|
|
(150,467 |
) |
|
|
— |
|
|
|
— |
|
|
|
(150,467 |
) |
|
|
— |
|
|
|
(150,467 |
) |
| Disposal of treasury stock(Note 29) |
|
|
— |
|
|
|
— |
|
|
|
— |
|
|
|
451,809 |
|
|
|
— |
|
|
|
— |
|
|
|
451,809 |
|
|
|
— |
|
|
|
451,809 |
|
| Retirement of treasury stock(Note 29) |
|
|
— |
|
|
|
— |
|
|
|
— |
|
|
|
150,000 |
|
|
|
— |
|
|
|
(150,025 |
) |
|
|
(25 |
) |
|
|
— |
|
|
|
(25 |
) |
| Change in other capital adjustments |
|
|
— |
|
|
|
— |
|
|
|
471,812 |
|
|
|
(22,507 |
) |
|
|
— |
|
|
|
(16,141 |
) |
|
|
433,164 |
|
|
|
— |
|
|
|
433,164 |
|
Change in other non-controlling interests |
|
|
— |
|
|
|
— |
|
|
|
— |
|
|
|
— |
|
|
|
— |
|
|
|
— |
|
|
|
— |
|
|
|
(546,631 |
) |
|
|
(546,631 |
) |
| |
|
|
|
|
|
|
|
|
|
|
|
|
|
|
|
|
|
|
|
|
|
|
|
|
|
|
|
|
|
|
|
|
|
|
|
|
| |
|
|
237,178 |
|
|
|
448,699 |
|
|
|
1,669,586 |
|
|
|
428,835 |
|
|
|
— |
|
|
|
(1,135,422 |
) |
|
|
1,648,876 |
|
|
|
(546,631 |
) |
|
|
1,102,245 |
|
| |
|
|
|
|
|
|
|
|
|
|
|
|
|
|
|
|
|
|
|
|
|
|
|
|
|
|
|
|
|
|
|
|
|
|
|
|
Reclassification of OCI retained earnings |
|
|
— |
|
|
|
— |
|
|
|
— |
|
|
|
— |
|
|
|
27,825 |
|
|
|
(27,825 |
) |
|
|
— |
|
|
|
— |
|
|
|
— |
|
| |
|
|
|
|
|
|
|
|
|
|
|
|
|
|
|
|
|
|
|
|
|
|
|
|
|
|
|
|
|
|
|
|
|
|
|
|
Balance at December 31, 2020 |
|
W |
2,969,641 |
|
|
|
2,179,934 |
|
|
|
12,234,939 |
|
|
|
(687,935 |
) |
|
|
(404,181 |
) |
|
|
27,777,169 |
|
|
|
44,069,567 |
|
|
|
2,287,291 |
|
|
|
46,356,858 |
|
| |
|
|
|
|
|
|
|
|
|
|
|
|
|
|
|
|
|
|
|
|
|
|
|
|
|
|
|
|
|
|
|
|
|
|
|
|
SHINHAN FINANCIAL GROUP CO., LTD. AND SUBSIDIARIES
Consolidated Statements of Changes in Equity (Continued)
For the year ended December 31, 2021
|
|
|
|
|
|
|
|
|
|
|
|
|
|
|
|
|
|
|
|
|
|
|
|
|
|
|
|
|
|
|
|
|
|
|
|
|
|
|
Equity attributable to equity holders of Shinhan Financial Group Co., Ltd. |
|
|
|
|
|
|
|
| |
|
|
|
|
|
|
|
|
|
|
|
|
|
other compre-
hensive
income (loss) |
|
|
|
|
|
|
|
|
|
|
|
|
|
Balance at January 1, 2021 |
|
W |
2,969,641 |
|
|
|
2,179,934 |
|
|
|
12,234,939 |
|
|
|
(687,935 |
) |
|
|
(404,181 |
) |
|
|
27,777,169 |
|
|
|
44,069,567 |
|
|
|
2,287,291 |
|
|
|
46,356,858 |
|
Total comprehensive income for the year |
|
|
|
|
|
|
|
|
|
|
|
|
|
|
|
|
|
|
|
|
|
|
|
|
|
|
|
|
|
|
|
|
|
|
|
|
| Profit for the year |
|
|
— |
|
|
|
— |
|
|
|
— |
|
|
|
— |
|
|
|
— |
|
|
|
4,019,254 |
|
|
|
4,019,254 |
|
|
|
93,374 |
|
|
|
4,112,628 |
|
Other comprehensive income (loss), net of income tax: |
|
|
|
|
|
|
|
|
|
|
|
|
|
|
|
|
|
|
|
|
|
|
|
|
|
|
|
|
|
|
|
|
|
|
|
|
| Loss on valuation and disposal of securities at fair value through other comprehensive income |
|
|
— |
|
|
|
— |
|
|
|
— |
|
|
|
— |
|
|
|
(871,104 |
) |
|
|
— |
|
|
|
(871,104 |
) |
|
|
(2,547 |
) |
|
|
(873,651 |
) |
| Loss on financial instruments at fair value through profit or loss (overlay approach) |
|
|
— |
|
|
|
— |
|
|
|
— |
|
|
|
— |
|
|
|
(20,098 |
) |
|
|
— |
|
|
|
(20,098 |
) |
|
|
— |
|
|
|
(20,098 |
) |
| Equity in other comprehensive income of associates |
|
|
— |
|
|
|
— |
|
|
|
— |
|
|
|
— |
|
|
|
2,746 |
|
|
|
— |
|
|
|
2,746 |
|
|
|
— |
|
|
|
2,746 |
|
| Foreign currency translation adjustments for foreign operations |
|
|
— |
|
|
|
— |
|
|
|
— |
|
|
|
— |
|
|
|
251,842 |
|
|
|
— |
|
|
|
251,842 |
|
|
|
466 |
|
|
|
252,308 |
|
| Net change in unrealized fair value of cash flow hedges |
|
|
— |
|
|
|
— |
|
|
|
— |
|
|
|
— |
|
|
|
21,700 |
|
|
|
— |
|
|
|
21,700 |
|
|
|
— |
|
|
|
21,700 |
|
| Other comprehensive income of separate account |
|
|
— |
|
|
|
— |
|
|
|
— |
|
|
|
— |
|
|
|
(41,273 |
) |
|
|
— |
|
|
|
(41,273 |
) |
|
|
— |
|
|
|
(41,273 |
) |
| Remeasurements of defined benefit plans |
|
|
— |
|
|
|
— |
|
|
|
— |
|
|
|
— |
|
|
|
42,656 |
|
|
|
— |
|
|
|
42,656 |
|
|
|
621 |
|
|
|
43,277 |
|
| Changes in own credit risk on financial liabilities designated at fair value through profit or loss |
|
|
— |
|
|
|
— |
|
|
|
— |
|
|
|
— |
|
|
|
(2,798 |
) |
|
|
— |
|
|
|
(2,798 |
) |
|
|
— |
|
|
|
(2,798 |
) |
| |
|
|
|
|
|
|
|
|
|
|
|
|
|
|
|
|
|
|
|
|
|
|
|
|
|
|
|
|
|
|
|
|
|
|
|
|
| Total other comprehensive loss |
|
|
— |
|
|
|
— |
|
|
|
— |
|
|
|
— |
|
|
|
(616,329 |
) |
|
|
— |
|
|
|
(616,329 |
) |
|
|
(1,460 |
) |
|
|
(617,789 |
) |
| |
|
|
|
|
|
|
|
|
|
|
|
|
|
|
|
|
|
|
|
|
|
|
|
|
|
|
|
|
|
|
|
|
|
|
|
|
Total comprehensive income(loss) |
|
|
— |
|
|
|
— |
|
|
|
— |
|
|
|
— |
|
|
|
(616,329 |
) |
|
|
4,019,254 |
|
|
|
3,402,925 |
|
|
|
91,914 |
|
|
|
3,494,839 |
|
| |
|
|
|
|
|
|
|
|
|
|
|
|
|
|
|
|
|
|
|
|
|
|
|
|
|
|
|
|
|
|
|
|
|
|
|
|
| |
|
|
|
|
|
|
|
|
|
|
|
|
|
|
|
|
|
|
|
|
|
|
|
|
|
|
|
|
|
|
|
|
|
|
|
|
| Dividends |
|
|
— |
|
|
|
— |
|
|
|
— |
|
|
|
— |
|
|
|
— |
|
|
|
(803,838 |
) |
|
|
(803,838 |
) |
|
|
— |
|
|
|
(803,838 |
) |
| Interim dividends |
|
|
— |
|
|
|
— |
|
|
|
— |
|
|
|
— |
|
|
|
— |
|
|
|
(299,082 |
) |
|
|
(299,082 |
) |
|
|
— |
|
|
|
(299,082 |
) |
| Dividends to hybrid bonds |
|
|
— |
|
|
|
— |
|
|
|
— |
|
|
|
— |
|
|
|
— |
|
|
|
(116,388 |
) |
|
|
(116,388 |
) |
|
|
— |
|
|
|
(116,388 |
) |
| Issuance of hybrid bonds |
|
|
— |
|
|
|
1,154,597 |
|
|
|
— |
|
|
|
— |
|
|
|
— |
|
|
|
— |
|
|
|
1,154,597 |
|
|
|
— |
|
|
|
1,154,597 |
|
| Acquisition of treasury stock (Note 29) |
|
|
— |
|
|
|
— |
|
|
|
— |
|
|
|
(79 |
) |
|
|
— |
|
|
|
— |
|
|
|
(79 |
) |
|
|
— |
|
|
|
(79 |
) |
| Disposal of treasury stock (Note 29) |
|
|
— |
|
|
|
— |
|
|
|
— |
|
|
|
23,589 |
|
|
|
— |
|
|
|
— |
|
|
|
23,589 |
|
|
|
— |
|
|
|
23,589 |
|
| Change in other capital adjustments |
|
|
— |
|
|
|
— |
|
|
|
(105 |
) |
|
|
(4 |
) |
|
|
— |
|
|
|
(241 |
) |
|
|
(350 |
) |
|
|
— |
|
|
|
(350 |
) |
Change in other non-controlling interests |
|
|
— |
|
|
|
— |
|
|
|
(139,791 |
) |
|
|
— |
|
|
|
— |
|
|
|
— |
|
|
|
(139,791 |
) |
|
|
(131,933 |
) |
|
|
(271,724 |
) |
| |
|
|
|
|
|
|
|
|
|
|
|
|
|
|
|
|
|
|
|
|
|
|
|
|
|
|
|
|
|
|
|
|
|
|
|
|
| |
|
|
— |
|
|
|
1,154,597 |
|
|
|
(139,896 |
) |
|
|
23,506 |
|
|
|
— |
|
|
|
(1,219,549 |
) |
|
|
(181,342 |
) |
|
|
(131,933 |
) |
|
|
(313,275 |
) |
| |
|
|
|
|
|
|
|
|
|
|
|
|
|
|
|
|
|
|
|
|
|
|
|
|
|
|
|
|
|
|
|
|
|
|
|
|
Reclassification of OCI retained earnings |
|
|
— |
|
|
|
— |
|
|
|
— |
|
|
|
— |
|
|
|
35,574 |
|
|
|
(35,574 |
) |
|
|
— |
|
|
|
— |
|
|
|
— |
|
| |
|
|
|
|
|
|
|
|
|
|
|
|
|
|
|
|
|
|
|
|
|
|
|
|
|
|
|
|
|
|
|
|
|
|
|
|
Balance at December 31, 2021 |
|
W |
2,969,641 |
|
|
|
3,334,531 |
|
|
|
12,095,043 |
|
|
|
(664,429 |
) |
|
|
(984,936 |
) |
|
|
30,541,300 |
|
|
|
47,291,150 |
|
|
|
2,247,272 |
|
|
|
49,538,422 |
|
| |
|
|
|
|
|
|
|
|
|
|
|
|
|
|
|
|
|
|
|
|
|
|
|
|
|
|
|
|
|
|
|
|
|
|
|
|
SHINHAN FINANCIAL GROUP CO., LTD. AND SUBSIDIARIES
Consolidated Statements of Changes in Equity (Continued)
For the year ended December 31, 2022
|
|
|
|
|
|
|
|
|
|
|
|
|
|
|
|
|
|
|
|
|
|
|
|
|
|
|
|
|
|
|
|
|
|
|
|
|
|
|
Equity attributable to equity holders of Shinhan Financial Group Co., Ltd. |
|
|
|
|
|
|
|
| |
|
|
|
|
|
|
|
|
|
|
|
|
|
other compre-
hensive
income (loss) |
|
|
|
|
|
|
|
|
|
|
|
|
|
Balance at January 1, 2022 |
|
W |
2,969,641 |
|
|
|
3,334,531 |
|
|
|
12,095,043 |
|
|
|
(664,429 |
) |
|
|
(984,936 |
) |
|
|
30,541,300 |
|
|
|
47,291,150 |
|
|
|
2,247,272 |
|
|
|
49,538,422 |
|
Total comprehensive income for the year |
|
|
|
|
|
|
|
|
|
|
|
|
|
|
|
|
|
|
|
|
|
|
|
|
|
|
|
|
|
|
|
|
|
|
|
|
| Profit for the year |
|
|
— |
|
|
|
— |
|
|
|
— |
|
|
|
— |
|
|
|
— |
|
|
|
4,642,292 |
|
|
|
4,642,292 |
|
|
|
89,871 |
|
|
|
4,732,163 |
|
Other comprehensive income (loss), net of income tax: |
|
|
|
|
|
|
|
|
|
|
|
|
|
|
|
|
|
|
|
|
|
|
|
|
|
|
|
|
|
|
|
|
|
|
|
|
| Loss on valuation and disposal of securities at fair value through other comprehensive income |
|
|
— |
|
|
|
— |
|
|
|
— |
|
|
|
— |
|
|
|
(2,436,859 |
) |
|
|
— |
|
|
|
(2,436,859 |
) |
|
|
(3,586 |
) |
|
|
(2,440,445 |
) |
| Loss on financial instruments at fair value through profit or loss (overlay approach) |
|
|
— |
|
|
|
— |
|
|
|
— |
|
|
|
— |
|
|
|
(220,097 |
) |
|
|
— |
|
|
|
(220,097 |
) |
|
|
— |
|
|
|
(220,097 |
) |
| Equity in other comprehensive loss of associates |
|
|
— |
|
|
|
— |
|
|
|
— |
|
|
|
— |
|
|
|
(15,763 |
) |
|
|
— |
|
|
|
(15,763 |
) |
|
|
— |
|
|
|
(15,763 |
) |
| Foreign currency translation adjustments for foreign operations |
|
|
— |
|
|
|
— |
|
|
|
— |
|
|
|
— |
|
|
|
12,936 |
|
|
|
— |
|
|
|
12,936 |
|
|
|
1,796 |
|
|
|
14,732 |
|
| Net change in unrealized fair value of cash flow hedges |
|
|
— |
|
|
|
— |
|
|
|
— |
|
|
|
— |
|
|
|
(70,494 |
) |
|
|
— |
|
|
|
(70,494 |
) |
|
|
— |
|
|
|
(70,494 |
) |
| Other comprehensive loss of separate account |
|
|
— |
|
|
|
— |
|
|
|
— |
|
|
|
— |
|
|
|
(113,207 |
) |
|
|
— |
|
|
|
(113,207 |
) |
|
|
— |
|
|
|
(113,207 |
) |
| Remeasurements of the net defined benefit liabilites(assets) |
|
|
— |
|
|
|
— |
|
|
|
— |
|
|
|
— |
|
|
|
251,131 |
|
|
|
— |
|
|
|
251,131 |
|
|
|
860 |
|
|
|
251,991 |
|
| Changes in own credit risk on financial liabilities designated at fair value through profit or loss |
|
|
— |
|
|
|
— |
|
|
|
— |
|
|
|
— |
|
|
|
(4,749 |
) |
|
|
— |
|
|
|
(4,749 |
) |
|
|
— |
|
|
|
(4,749 |
) |
| |
|
|
|
|
|
|
|
|
|
|
|
|
|
|
|
|
|
|
|
|
|
|
|
|
|
|
|
|
|
|
|
|
|
|
|
|
| Total other comprehensive loss |
|
|
— |
|
|
|
— |
|
|
|
— |
|
|
|
— |
|
|
|
(2,597,102 |
) |
|
|
— |
|
|
|
(2,597,102 |
) |
|
|
(930 |
) |
|
|
(2,598,032 |
) |
| |
|
|
|
|
|
|
|
|
|
|
|
|
|
|
|
|
|
|
|
|
|
|
|
|
|
|
|
|
|
|
|
|
|
|
|
|
Total comprehensive income(loss) |
|
|
— |
|
|
|
— |
|
|
|
— |
|
|
|
— |
|
|
|
(2,597,102 |
) |
|
|
4,642,292 |
|
|
|
2,045,190 |
|
|
|
88,941 |
|
|
|
2,134,131 |
|
| |
|
|
|
|
|
|
|
|
|
|
|
|
|
|
|
|
|
|
|
|
|
|
|
|
|
|
|
|
|
|
|
|
|
|
|
|
| |
|
|
|
|
|
|
|
|
|
|
|
|
|
|
|
|
|
|
|
|
|
|
|
|
|
|
|
|
|
|
|
|
|
|
|
|
| Dividends |
|
|
— |
|
|
|
— |
|
|
|
— |
|
|
|
— |
|
|
|
— |
|
|
|
(747,705 |
) |
|
|
(747,705 |
) |
|
|
— |
|
|
|
(747,705 |
) |
| Interim dividends |
|
|
— |
|
|
|
— |
|
|
|
— |
|
|
|
— |
|
|
|
— |
|
|
|
(637,598 |
) |
|
|
(637,598 |
) |
|
|
— |
|
|
|
(637,598 |
) |
| Dividends to hybrid bonds |
|
|
— |
|
|
|
— |
|
|
|
— |
|
|
|
— |
|
|
|
— |
|
|
|
(156,277 |
) |
|
|
(156,277 |
) |
|
|
— |
|
|
|
(156,277 |
) |
| Issuance of hybrid bonds |
|
|
— |
|
|
|
997,120 |
|
|
|
— |
|
|
|
— |
|
|
|
— |
|
|
|
— |
|
|
|
997,120 |
|
|
|
— |
|
|
|
997,120 |
|
| Repayments of hybrid bonds |
|
|
— |
|
|
|
(134,683 |
) |
|
|
— |
|
|
|
(317 |
) |
|
|
— |
|
|
|
— |
|
|
|
(135,000 |
) |
|
|
— |
|
|
|
(135,000 |
) |
| Acquisition of treasury stock (Note 29) |
|
|
— |
|
|
|
— |
|
|
|
— |
|
|
|
(300,000 |
) |
|
|
— |
|
|
|
— |
|
|
|
(300,000 |
) |
|
|
— |
|
|
|
(300,000 |
) |
| Retirement of treasury stock (Note 29) |
|
|
— |
|
|
|
— |
|
|
|
— |
|
|
|
300,000 |
|
|
|
— |
|
|
|
(300,061 |
) |
|
|
(61 |
) |
|
|
— |
|
|
|
(61 |
) |
| Change in other capital adjustments |
|
|
— |
|
|
|
— |
|
|
|
— |
|
|
|
(3,904 |
) |
|
|
— |
|
|
|
— |
|
|
|
(3,904 |
) |
|
|
— |
|
|
|
(3,904 |
) |
Change in other non-controlling interests |
|
|
— |
|
|
|
— |
|
|
|
— |
|
|
|
85,791 |
|
|
|
— |
|
|
|
— |
|
|
|
85,791 |
|
|
|
355,503 |
|
|
|
441,294 |
|
| |
|
|
|
|
|
|
|
|
|
|
|
|
|
|
|
|
|
|
|
|
|
|
|
|
|
|
|
|
|
|
|
|
|
|
|
|
| |
|
|
— |
|
|
|
862,437 |
|
|
|
— |
|
|
|
81,570 |
|
|
|
— |
|
|
|
(1,841,641 |
) |
|
|
(897,634 |
) |
|
|
355,503 |
|
|
|
(542,131 |
) |
| |
|
|
|
|
|
|
|
|
|
|
|
|
|
|
|
|
|
|
|
|
|
|
|
|
|
|
|
|
|
|
|
|
|
|
|
|
Reclassification of OCI retained earnings |
|
|
— |
|
|
|
— |
|
|
|
— |
|
|
|
— |
|
|
|
(682 |
) |
|
|
682 |
|
|
|
— |
|
|
|
— |
|
|
|
— |
|
| |
|
|
|
|
|
|
|
|
|
|
|
|
|
|
|
|
|
|
|
|
|
|
|
|
|
|
|
|
|
|
|
|
|
|
|
|
Balance at December 31, 2022 |
|
W |
2,969,641 |
|
|
|
4,196,968 |
|
|
|
12,095,043 |
|
|
|
(582,859 |
) |
|
|
(3,582,720 |
) |
|
|
33,342,633 |
|
|
|
48,438,706 |
|
|
|
2,691,716 |
|
|
|
51,130,422 |
|
| |
|
|
|
|
|
|
|
|
|
|
|
|
|
|
|
|
|
|
|
|
|
|
|
|
|
|
|
|
|
|
|
|
|
|
|
|
| |
|
|
|
|
|
|
|
|
|
|
|
|
|
|
|
|
|
|
|
|
|
|
|
|
|
|
|
|
|
|
|
|
|
|
|
|
See accompanying notes to the consolidated financial statements.
SHINHAN FINANCIAL GROUP CO., LTD. AND SUBSIDIARIES
Consolidated Statements of Cash Flows
For the years ended December 31, 2020, 2021 and 2022
|
|
|
|
|
|
|
|
|
|
|
|
|
|
|
|
|
|
|
|
|
|
|
|
|
|
|
|
|
|
Cash flows from operating activities |
|
|
|
|
|
|
|
|
|
|
|
|
|
|
|
|
| Profit before income taxes |
|
|
|
|
|
W |
4,753,871 |
|
|
|
5,583,664 |
|
|
|
6,349,251 |
|
| Adjustments for: |
|
|
|
|
|
|
|
|
|
|
|
|
|
|
|
|
| Interest income |
|
|
31 |
|
|
|
(14,773,996 |
) |
|
|
(14,724,230 |
) |
|
|
(20,108,666 |
) |
| Interest expense |
|
|
31 |
|
|
|
4,891,296 |
|
|
|
3,954,905 |
|
|
|
7,644,985 |
|
| Dividend income |
|
|
33 |
|
|
|
(97,956 |
) |
|
|
(124,531 |
) |
|
|
(142,529 |
) |
| Net fees and commission expense |
|
|
32 |
|
|
|
187,304 |
|
|
|
124,486 |
|
|
|
126,665 |
|
| Net insurance loss |
|
|
27 |
|
|
|
1,726,150 |
|
|
|
1,356,064 |
|
|
|
404,300 |
|
| Net loss (gain) on financial instruments at fair value through profit or loss |
|
|
34 |
|
|
|
136,191 |
|
|
|
(174,279 |
) |
|
|
541,832 |
|
| Net loss (gain) on derivatives |
|
|
10 |
|
|
|
(245,681 |
) |
|
|
64,128 |
|
|
|
719,766 |
|
| Net loss (gain) on financial instruments at fair value through profit or loss (overlay approach) |
|
|
9 |
|
|
|
136,255 |
|
|
|
(43,003 |
) |
|
|
(313,211 |
) |
| Net loss (gain) on foreign currency translation |
|
|
|
|
|
|
(232,723 |
) |
|
|
(21,130 |
) |
|
|
68,860 |
|
| Net gain on financial instruments designated at fair value through profit or loss |
|
|
35 |
|
|
|
(241,066 |
) |
|
|
(423,914 |
) |
|
|
(806,741 |
) |
| Net loss (gain) on disposal of securities at fair value through other comprehensive income |
|
|
11 |
|
|
|
(273,793 |
) |
|
|
(85,596 |
) |
|
|
127,393 |
|
| Net loss on disposal of securities at amortized cost |
|
|
11 |
|
|
|
25 |
|
|
|
319 |
|
|
|
101 |
|
| Provision for allowance for credit loss |
|
|
36 |
|
|
|
1,382,179 |
|
|
|
974,685 |
|
|
|
1,292,296 |
|
| Employee benefit |
|
|
25 |
|
|
|
175,539 |
|
|
|
221,259 |
|
|
|
194,952 |
|
| Depreciation and other amortization |
|
|
37 |
|
|
|
768,488 |
|
|
|
902,692 |
|
|
|
1,053,820 |
|
| Other operating expense |
|
|
39 |
|
|
|
202,178 |
|
|
|
457,359 |
|
|
|
427,362 |
|
| Equity method income, net |
|
|
15 |
|
|
|
(159,533 |
) |
|
|
(158,600 |
) |
|
|
(121,697 |
) |
Other non-operating expense (income) |
|
|
40 |
|
|
|
153,360 |
|
|
|
447,138 |
|
|
|
(437,203 |
) |
| |
|
|
|
|
|
|
|
|
|
|
|
|
|
|
|
|
| |
|
|
|
|
|
|
(6,265,783 |
) |
|
|
(7,252,248 |
) |
|
|
(9,327,715 |
) |
| |
|
|
|
|
|
|
|
|
|
|
|
|
|
|
|
|
| Changes in assets and liabilities: |
|
|
|
|
|
|
|
|
|
|
|
|
|
|
|
|
| Due from banks at amortized cost |
|
|
|
|
|
|
(1,541,911 |
) |
|
|
2,690,535 |
|
|
|
(1,059,733 |
) |
| Securities at fair value through profit or loss |
|
|
|
|
|
|
(7,088,599 |
) |
|
|
(2,934,113 |
) |
|
|
5,535,664 |
|
| Due from banks at fair value through profit or loss |
|
|
|
|
|
|
862,047 |
|
|
|
92,944 |
|
|
|
— |
|
| Loans at fair value through profit or loss |
|
|
|
|
|
|
132,172 |
|
|
|
341,140 |
|
|
|
(721,736 |
) |
| Financial instruments designated at fair value through profit or loss |
|
|
|
|
|
|
(708,627 |
) |
|
|
(9,466 |
) |
|
|
1,100,240 |
|
| Derivative instruments |
|
|
|
|
|
|
(65,288 |
) |
|
|
14,548 |
|
|
|
726,249 |
|
| Loans at amortized cost |
|
|
|
|
|
|
(32,897,127 |
) |
|
|
(28,740,535 |
) |
|
|
(24,109,475 |
) |
| Other assets |
|
|
|
|
|
|
(7,866,826 |
) |
|
|
(6,920,943 |
) |
|
|
152,673 |
|
| Deposits |
|
|
|
|
|
|
33,139,123 |
|
|
|
36,948,828 |
|
|
|
18,309,172 |
|
| Liabilities for defined benefit obligations |
|
|
|
|
|
|
(243,428 |
) |
|
|
(261,750 |
) |
|
|
(341,740 |
) |
| Provisions |
|
|
|
|
|
|
51,567 |
|
|
|
(25,526 |
) |
|
|
(59,400 |
) |
| Other liabilities |
|
|
|
|
|
|
8,503,803 |
|
|
|
(4,489,460 |
) |
|
|
211,712 |
|
| |
|
|
|
|
|
|
|
|
|
|
|
|
|
|
|
|
| |
|
|
|
|
|
|
(7,723,094 |
) |
|
|
(3,293,798 |
) |
|
|
(256,374 |
) |
| |
|
|
|
|
|
|
|
|
|
|
|
|
|
|
|
|
| Income taxes paid |
|
|
|
|
|
|
(1,184,910 |
) |
|
|
(1,149,965 |
) |
|
|
(1,693,408 |
) |
| Interest received |
|
|
|
|
|
|
14,570,884 |
|
|
|
14,325,392 |
|
|
|
19,205,026 |
|
| Interest paid |
|
|
|
|
|
|
(5,267,781 |
) |
|
|
(4,114,027 |
) |
|
|
(6,773,240 |
) |
| Dividends received |
|
|
|
|
|
|
80,728 |
|
|
|
100,936 |
|
|
|
89,020 |
|
| |
|
|
|
|
|
|
|
|
|
|
|
|
|
|
|
|
Net cash inflow (outflow) from operating activities |
|
|
|
|
|
W |
(1,036,085 |
) |
|
|
4,199,954 |
|
|
|
7,592,560 |
|
| |
|
|
|
|
|
|
|
|
|
|
|
|
|
|
|
|
SHINHAN FINANCIAL GROUP CO., LTD. AND SUBSIDIARIES
Consolidated Statements of Cash Flows (Continued)
For the years ended December 31, 2020, 2021 and 2022
|
|
|
|
|
|
|
|
|
|
|
|
|
|
|
|
|
|
|
|
|
|
|
|
|
|
|
|
|
|
Cash flows from investing activities |
|
|
|
|
|
|
|
|
|
|
|
|
|
|
|
|
| Decrease in financial instruments at fair value through profit or loss |
|
|
|
|
|
W |
4,537,421 |
|
|
|
4,362,417 |
|
|
|
5,175,744 |
|
| Increase in financial instruments at fair value through profit or loss |
|
|
|
|
|
|
(4,982,663 |
) |
|
|
(5,409,361 |
) |
|
|
(5,976,774 |
) |
| Proceeds from disposal of securities at fair value through other comprehensive income |
|
|
|
|
|
|
53,048,284 |
|
|
|
29,991,033 |
|
|
|
21,493,133 |
|
| Acquisition of securities at fair value through other comprehensive income |
|
|
|
|
|
|
(52,657,353 |
) |
|
|
(37,575,878 |
) |
|
|
(23,515,761 |
) |
| Proceeds from disposal of securities at amortized cost |
|
|
|
|
|
|
5,923,611 |
|
|
|
5,203,156 |
|
|
|
5,397,628 |
|
| Acquisition of securities at amortized cost |
|
|
|
|
|
|
(7,645,000 |
) |
|
|
(7,343,501 |
) |
|
|
(13,125,363 |
) |
| Proceeds from disposal of property and equipment |
|
|
13, 40 |
|
|
|
248,037 |
|
|
|
20,068 |
|
|
|
93,511 |
|
| Acquisition of property and equipment |
|
|
13 |
|
|
|
(279,654 |
) |
|
|
(334,874 |
) |
|
|
(326,546 |
) |
| Proceeds from disposal of intangible assets |
|
|
14, 40 |
|
|
|
5,298 |
|
|
|
15,867 |
|
|
|
23,040 |
|
| Acquisition of intangible assets |
|
|
14 |
|
|
|
(362,415 |
) |
|
|
(555,340 |
) |
|
|
(616,581 |
) |
| Proceeds from disposal of investments in associates |
|
|
15 |
|
|
|
266,322 |
|
|
|
357,401 |
|
|
|
516,735 |
|
| Acquisition of investments in associates |
|
|
15 |
|
|
|
(776,799 |
) |
|
|
(588,827 |
) |
|
|
(657,836 |
) |
| Proceeds from disposal of investment property |
|
|
16, 40 |
|
|
|
113,038 |
|
|
|
276 |
|
|
|
259,453 |
|
| Acquisition of investment property |
|
|
16 |
|
|
|
(243,806 |
) |
|
|
(8,292 |
) |
|
|
(6,883 |
) |
| Proceeds from disposal of assets held for sale |
|
|
|
|
|
|
2,048 |
|
|
|
47,792 |
|
|
|
624,837 |
|
| Change in other assets |
|
|
|
|
|
|
11,233 |
|
|
|
(220,636 |
) |
|
|
(238,869 |
) |
| Proceeds from settlement of hedging derivative financial instruments |
|
|
|
|
|
|
25,722 |
|
|
|
61,502 |
|
|
|
12,585 |
|
| Payment of settlement of hedging derivative financial instruments |
|
|
|
|
|
|
(186,169 |
) |
|
|
(53,313 |
) |
|
|
(135,669 |
) |
| Net cash flow from business combination |
|
|
47 |
|
|
|
(73,081 |
) |
|
|
— |
|
|
|
(27,840 |
) |
| |
|
|
|
|
|
|
|
|
|
|
|
|
|
|
|
|
Net cash outflow from investing activities |
|
|
|
|
|
W |
(3,025,926 |
) |
|
|
(12,030,510 |
) |
|
|
(11,031,456 |
) |
| |
|
|
|
|
|
|
|
|
|
|
|
|
|
|
|
|
SHINHAN FINANCIAL GROUP CO., LTD. AND SUBSIDIARIES
Consolidated Statements of Cash Flows (Continued)
For the years ended December 31, 2020, 2021 and 2022
|
|
|
|
|
|
|
|
|
|
|
|
|
|
|
|
|
|
|
|
|
|
|
|
|
|
|
|
|
|
Cash flows from financing activities |
|
|
|
|
|
|
|
|
|
|
|
|
|
|
|
|
| Issuance of hybrid bonds |
|
|
|
|
|
W |
448,698 |
|
|
|
1,154,597 |
|
|
|
997,120 |
|
| Repayments of hybrid bonds |
|
|
|
|
|
|
— |
|
|
|
— |
|
|
|
(135,000 |
) |
| Net increase in borrowings |
|
|
|
|
|
|
7,465,106 |
|
|
|
849,212 |
|
|
|
6,145,271 |
|
| Proceeds from debt securities issued |
|
|
|
|
|
|
21,480,455 |
|
|
|
28,561,082 |
|
|
|
39,521,966 |
|
| Repayments of debt securities issued |
|
|
|
|
|
|
(21,508,827 |
) |
|
|
(24,143,252 |
) |
|
|
(41,777,940 |
) |
| Increase in financial liabilities designated at fair value through profit or loss |
|
|
|
|
|
|
— |
|
|
|
— |
|
|
|
49,993 |
|
| Change in other liabilities |
|
|
|
|
|
|
(30,526 |
) |
|
|
83,067 |
|
|
|
239,591 |
|
| Dividends paid |
|
|
|
|
|
|
(968,847 |
) |
|
|
(1,218,761 |
) |
|
|
(1,540,871 |
) |
| Proceeds from settlement of hedging derivative financial instruments |
|
|
|
|
|
|
851,381 |
|
|
|
1,223,033 |
|
|
|
2,391,556 |
|
| Payment of settlement of hedging derivative financial instruments |
|
|
|
|
|
|
(807,705 |
) |
|
|
(1,210,366 |
) |
|
|
(2,319,927 |
) |
| Acquisition of treasury stock |
|
|
|
|
|
|
(150,182 |
) |
|
|
(79 |
) |
|
|
(300,000 |
) |
| Disposition and redemption of treasury stock |
|
|
|
|
|
|
161,863 |
|
|
|
23,588 |
|
|
|
(60 |
) |
Increase(decrease) in non-controlling interests |
|
|
|
|
|
|
566,673 |
|
|
|
(84,998 |
) |
|
|
382,929 |
|
| Redemption of lease liabilities |
|
|
|
|
|
|
(781,867 |
) |
|
|
(275,273 |
) |
|
|
(259,913 |
) |
| |
|
|
|
|
|
|
1,154,347 |
|
|
|
— |
|
|
|
— |
|
| Issuance of convertible preferred shares |
|
|
|
|
|
|
— |
|
|
|
— |
|
|
|
— |
|
| Payment of stock issuance costs |
|
|
|
|
|
|
— |
|
|
|
(105 |
) |
|
|
— |
|
| |
|
|
|
|
|
|
|
|
|
|
|
|
|
|
|
|
Net cash inflow from financing activities |
|
|
|
|
|
|
7,880,569 |
|
|
|
4,961,745 |
|
|
|
3,394,715 |
|
| |
|
|
|
|
|
|
|
|
|
|
|
|
|
|
|
|
Effect of exchange rate changes on cash and cash equivalents held |
|
|
|
|
|
|
(51,385 |
) |
|
|
112,854 |
|
|
|
(57,837 |
) |
| |
|
|
|
|
|
|
|
|
|
|
|
|
|
|
|
|
Increase (decrease) in cash and cash equivalents |
|
|
|
|
|
|
3,767,173 |
|
|
|
(2,755,957 |
) |
|
|
(102,018 |
) |
Cash and cash equivalents at beginning of year |
|
|
44 |
|
|
|
23,092,227 |
|
|
|
26,859,400 |
|
|
|
24,103,443 |
|
| |
|
|
|
|
|
|
|
|
|
|
|
|
|
|
|
|
Cash and cash equivalents at end of year |
|
|
44 |
|
|
W |
26,859,400 |
|
|
|
24,103,443 |
|
|
|
24,001,425 |
|
| |
|
|
|
|
|
|
|
|
|
|
|
|
|
|
|
|
See accompanying notes to the consolidated financial statements.
SHINHAN FINANCIAL GROUP CO., LTD. AND SUBSIDIARIES
Notes to the Consolidated Financial Statements
Shinhan Financial Group Co., Ltd., the controlling company, and its subsidiaries included in consolidation (collectively the “Group”) are summarized as follows:
Shinhan Financial Group Co., Ltd. (the “Shinhan Financial Group” or the “Company”), the controlling company, is incorporated on September 1, 2001 for the main purposes of controlling, managing and funding Shinhan Bank, Shinhan Securities Co., Ltd., Shinhan Capital Co., Ltd. and Shinhan BNP Asset Management Co., Ltd. by way of share transfers. The total capital stock amounted to
W
1,461,721 million. Also, Shinhan Financial Group’s shares have been listed on the Korea Exchange since September 10, 2001 and Shinhan Financial Group’s American Depositary Shares have been registered with the Securities and Exchange Commission (SEC) and listed on the New York Stock Exchange since September 16, 2003.
| |
(b) |
Ownership of Shinhan Financial Group and its major consolidated subsidiaries as of December 31, 2021 and 2022 are as follows: |
|
|
|
|
|
|
|
|
|
|
|
|
|
|
|
| |
|
|
|
|
|
Date of financial
information |
|
|
|
| |
|
|
|
|
|
|
|
|
|
|
| Shinhan Financial Group Co., Ltd. |
|
Shinhan Bank |
|
Korea |
|
December 31 |
|
|
100.0 |
|
|
|
100.0 |
|
| ” |
|
Shinhan Card Co., Ltd. |
|
” |
|
” |
|
|
100.0 |
|
|
|
100.0 |
|
| ” |
|
Shinhan Securities Co., Ltd. (*2) |
|
” |
|
” |
|
|
100.0 |
|
|
|
100.0 |
|
| ” |
|
Shinhan Life Insurance Co., Ltd. |
|
” |
|
” |
|
|
100.0 |
|
|
|
100.0 |
|
| ” |
|
Shinhan Capital Co., Ltd. |
|
” |
|
” |
|
|
100.0 |
|
|
|
100.0 |
|
| ” |
|
Jeju Bank |
|
” |
|
” |
|
|
75.3 |
|
|
|
75.3 |
|
| ” |
|
Shinhan Credit Information Co., Ltd. (*3) |
|
” |
|
” |
|
|
100.0 |
|
|
|
— |
|
| ” |
|
Shinhan Alternative Investment Management Inc. (*4) |
|
” |
|
” |
|
|
100.0 |
|
|
|
— |
|
| ” |
|
Shinhan Asset Management Co., Ltd. (*4) |
|
” |
|
” |
|
|
100.0 |
|
|
|
100.0 |
|
| ” |
|
SHC Management Co., Ltd. |
|
” |
|
” |
|
|
100.0 |
|
|
|
100.0 |
|
| ” |
|
Shinhan DS |
|
” |
|
” |
|
|
100.0 |
|
|
|
100.0 |
|
| ” |
|
Shinhan Savings Bank |
|
” |
|
” |
|
|
100.0 |
|
|
|
100.0 |
|
| ” |
|
Shinhan Asset Trust Co., Ltd. (*5) |
|
” |
|
” |
|
|
60.0 |
|
|
|
100.0 |
|
| ” |
|
Shinhan AITAS Co., Ltd. |
|
” |
|
” |
|
|
99.8 |
|
|
|
99.8 |
|
| ” |
|
Shinhan REITs Management Co., Ltd. |
|
” |
|
” |
|
|
100.0 |
|
|
|
100.0 |
|
| ” |
|
Shinhan AI Co., Ltd. |
|
” |
|
” |
|
|
100.0 |
|
|
|
100.0 |
|
| ” |
|
Shinhan Venture Investment Co., Ltd. |
|
” |
|
” |
|
|
100.0 |
|
|
|
100.0 |
|
| ” |
|
Shinhan EZ General Insurance, Ltd. (*6) |
|
” |
|
” |
|
|
— |
|
|
|
85.1 |
|
SHINHAN FINANCIAL GROUP CO., LTD. AND SUBSIDIARIES
Notes to the Consolidated Financial Statements
(In millions of won)
|
Reporting entity (continued) |
|
|
|
|
|
|
|
|
|
|
|
|
|
|
|
| |
|
|
|
|
|
Date of financial
information |
|
|
|
| |
|
|
|
|
|
|
|
|
|
|
| Shinhan Bank |
|
Shinhan Bank America |
|
USA |
|
” |
|
|
100.0 |
|
|
|
100.0 |
|
| ” |
|
Shinhan Bank Europe GmbH |
|
Germany |
|
” |
|
|
100.0 |
|
|
|
100.0 |
|
| ” |
|
Shinhan Bank Cambodia |
|
Cambodia |
|
” |
|
|
97.5 |
|
|
|
97.5 |
|
| ” |
|
Shinhan Bank Kazakhstan Limited |
|
Kazakhstan |
|
” |
|
|
100.0 |
|
|
|
100.0 |
|
| ” |
|
Shinhan Bank Canada |
|
Canada |
|
” |
|
|
100.0 |
|
|
|
100.0 |
|
| ” |
|
Shinhan Bank (China) Limited |
|
China |
|
” |
|
|
100.0 |
|
|
|
100.0 |
|
| ” |
|
Shinhan Bank Japan |
|
Japan |
|
” |
|
|
100.0 |
|
|
|
100.0 |
|
| ” |
|
Shinhan Bank Vietnam Ltd. |
|
Vietnam |
|
” |
|
|
100.0 |
|
|
|
100.0 |
|
| ” |
|
Banco Shinhan de Mexico |
|
Mexico |
|
” |
|
|
99.9 |
|
|
|
99.9 |
|
| ” |
|
PT Bank Shinhan Indonesia |
|
Indonesia |
|
” |
|
|
99.0 |
|
|
|
99.0 |
|
| Shinhan Bank Japan |
|
SBJDNX |
|
Japan |
|
” |
|
|
100.0 |
|
|
|
100.0 |
|
| Shinhan Card Co., Ltd. |
|
Shinhan Credit Information Co., Ltd. (*3) |
|
Korea |
|
December 31 |
|
|
— |
|
|
|
100.0 |
|
| ” |
|
LLP MFO Shinhan Finance |
|
Kazakhstan |
|
” |
|
|
100.0 |
|
|
|
100.0 |
|
| ” |
|
PT. Shinhan Indo Finance (*7) |
|
Indonesia |
|
” |
|
|
50.0+1
share |
|
|
|
76.3 |
|
| ” |
|
Shinhan Microfinance Co., Ltd. |
|
Myanmar |
|
” |
|
|
100.0 |
|
|
|
100.0 |
|
| ” |
|
Shinhan Vietnam Finance Co., Ltd. |
|
Vietnam |
|
” |
|
|
100.0 |
|
|
|
100.0 |
|
| Shinhan Securities Co., Ltd. |
|
Shinhan Securities America Inc. (*8) |
|
USA |
|
” |
|
|
100.0 |
|
|
|
100.0 |
|
| ” |
|
Shinhan Securities Asia Ltd. (*9) |
|
Hong Kong |
|
” |
|
|
100.0 |
|
|
|
100.0 |
|
| ” |
|
SHINHAN SECURITIES VIETNAM CO., LTD. |
|
Vietnam |
|
” |
|
|
100.0 |
|
|
|
100.0 |
|
| ” |
|
PT. Shinhan Sekuritas Indonesia |
|
Indonesia |
|
” |
|
|
99.0 |
|
|
|
99.0 |
|
| PT Shinhan Sekuritas Indonesia |
|
PT. Shinhan Asset Management Indonesia |
|
” |
|
” |
|
|
75.0 |
|
|
|
75.0 |
|
| Shinhan Life Insurance Co., Ltd. |
|
Shinhan Financial Plus |
|
Korea |
|
” |
|
|
100.0 |
|
|
|
100.0 |
|
| ” |
|
Shinhan CubeOn Co., Ltd. |
|
Korea |
|
” |
|
|
100.0 |
|
|
|
100.0 |
|
| ” |
|
Shinhan Life Insurance Vietnam Co., Ltd. |
|
Vietnam |
|
” |
|
|
100.0 |
|
|
|
100.0 |
|
| Shinhan Asset Management Co., Ltd. |
|
SHINHAN ASSET MGT HK, LIMITED |
|
Hong Kong |
|
” |
|
|
100.0 |
|
|
|
100.0 |
|
| Shinhan DS |
|
SHINHAN DS VIETNAM CO., LTD. |
|
Vietnam |
|
” |
|
|
100.0 |
|
|
|
100.0 |
|
| |
(*1) |
Subsidiaries such as trust, beneficiary certificate, corporate restructuring fund and private equity fund which are not actually operating their own business are excluded. |
SHINHAN FINANCIAL GROUP CO., LTD. AND SUBSIDIARIES
Notes to the Consolidated Financial Statements
(In millions of won)
|
Reporting entity (continued) |
| |
(*2) |
Shinhan Investment Co., Ltd. has changed its name to Shinhan Securities Co., Ltd. on October 1, 2022. |
| |
(*3) |
On July 28, 2022, the Company disposed 100% of shares to Shinhan Card. |
| |
(*4) |
Shinhan Asset Management Co., Ltd. and Shinhan Alternative Investment Management Inc. have merged on January 5, 2022 to form a company named Shinhan Asset Management Co., Ltd. |
| |
(*5) |
The Group has acquired remaining shares of Asia Trust Co., Ltd. during the period, and Asia Trust Co., Ltd. became the Group’s wholly-owned subsidiary. Asia Trust Co., Ltd. has changed its name to Shinhan Asset Trust Co., Ltd. |
| |
(*6) |
The Group has acquired additional 94.54 % of shares of BNP Paribas Cardif General Insurance, Ltd. ( 5.46 % of shares of Shinhan Life Insurance Co., Ltd.) during the period, and BNP Paribas Cardif General Insurance, Ltd. became the Group’s wholly-owned subsidiary. BNP Paribas Cardif General insurance, Ltd. has changed its name to Shinhan EZ General Insurance, Ltd. The controlling company participated in a paid-in capital increase of W 80 billion conducted by Shinhan EZ General Insurance, Ltd. and the Group’s share ratio decreased from 100% to 85.1%. |
| |
(*7) |
The paid-in capital increase was completed during the period, and the Group’s share ratio has increased from 50 % + 1 share to 76.3 %. |
| |
(*8) |
Shinhan Investment America Inc. has changed its name to Shinhan Securities America Inc. during the period. |
| |
(*9) |
Shinhan Investment Asia Ltd. has changed its name to Shinhan Securities Asia Ltd. during the period. |
| |
(c) |
Consolidated structured entities |
Consolidated structured entities are as follows:
|
|
|
|
|
| |
|
Consolidated structured entities |
|
|
| |
|
|
| Trust |
|
Shinhan Bank (including development trust) and 17 others |
|
A trust is consolidated when the Group as a trustee is exposed to variable returns, if principle or interest amounts of the entrusted properties falls below guaranteed amount, the Group should compensate it, and the Group has the ability to affect those returns. |
| |
|
|
| Asset-Backed Securitization |
|
MPC Yulchon Green I and 226 others |
|
An entity for asset backed securitization is consolidated when the Group has sole decision-making authority to dispose assets or change the conditions of the assets, and the Group is exposed to, or has rights to related variable returns by providing credit enhancement and purchases of subordinated securities. |
SHINHAN FINANCIAL GROUP CO., LTD. AND SUBSIDIARIES
Notes to the Consolidated Financial Statements
(In millions of won)
|
Reporting entity (continued) |
|
|
|
|
|
| |
|
Consolidated structured entities |
|
|
| |
|
|
| Structured Financing |
|
SHPE Holdings One Co., Ltd. |
|
An entity established for structured financing relating to real estate, shipping, or mergers and acquisitions is consolidated, when the Group has the greatest credit to the entity, has sole decision-making authority of these Entities due to the entities default, and is exposed to, or has rights to related variable returns. |
| |
|
|
| Investment Fund |
|
KoFC Shinhan Frontier Champ 2010-4 PEF and 149 others |
|
An investment fund is consolidated, when the Group manages or invests assets of the investment funds on behalf of other investors as a collective investor or a business executive, or has the ability to dismiss the manager of the investment funds, and is exposed to, or has rights to, the variable returns. |
| |
(*) |
The Group provides credit contribution (ABCP purchase agreements) of W 6,940,100 million for the purpose of credit enhancement of structured companies. |
The consolidated financial statements have been prepared in accordance with International Financial Reporting Standards (“IFRS”). IFRS are the standards and related interpretations issued by the International Accounting Standards Board (“IASB”).
The consolidated financial statements of the Group were authorized for issue by the Board of Directors on February 8, 2023. and the consolidated financial statements
were
submitted for approval to the stockholder’s meeting held on March 23, 2023.
The consolidated financial statements have been prepared on the historical cost basis, except for the following material items in the statement of financial position:
| |
• |
|
derivative financial instruments measured at fair value |
| |
• |
|
financial instruments at fair value through profit or loss measured at fair value |
| |
• |
|
financial instruments at fair value through other comprehensive income measured at fair value |
| |
• |
|
liabilities for cash-settled share-based payment arrangements measured at fair value |
| |
• |
|
financial assets and liabilities designated as hedged items in a fair value hedge accounting of which changes in fair value attributable to the hedged risk recognized in profit or loss |
| |
• |
|
liabilities for defined benefit plans recognized at the net of the total present value of defined benefit obligations less the fair value of plan assets |
SHINHAN FINANCIAL GROUP CO., LTD. AND SUBSIDIARIES
Notes to the Consolidated Financial Statements
(In millions of won)
|
Basis of preparation (continued) |
| |
|
Functional and presentation currency |
The respective financial statements of the Group entities are prepared in the functional currency of the respective economic environment in which the group entities operate. These consolidated financial statements are presented and reported in Korean won, which is the Controlling Company’s functional currency and the currency of the primary economic environment in which the Group operates.
| |
|
Use of estimates and judgments |
The preparation of the consolidated financial statements in conformity with IFRS requires management to
make judgments, estimates and assumptions that affect the application of accounting policies and the reported amounts of assets, liabilities, income and expenses. If the estimates and assumptions based on management’s best judgment as of December 31, 2022 are different from the actual environment, these estimates and actual results may be different.
Estimates and underlying assumptions are reviewed on an ongoing basis. Revisions to accounting estimates are recognized in the period in which the estimates are revised and in any future periods affected.
Information about critical judgments in applying accounting policies that have a significant effect on the amounts recognized in the consolidated financial statements and information about assumptions and estimation uncertainties that have a significant risk of resulting in a material adjustment within the next financial year are described in Note 5.
In preparing these consolidated financial statements, the significant judgments made by management in applying the Group’s accounting policies and the key sources of estimation uncertainty are the same as those that applied to the consolidated financial statements as of and for the year ended December 31, 2021.
| |
|
Standards and amendments adopted by the Group |
The Group has newly applied the following accounting policies upon preparation of the annual consolidated financial statements for the year ended December 31, 2022.
i) IFRS 3 ‘Business combination’ amended – Reference to the Conceptual Framework
The amendments update a reference of definition of assets and liabilities to be recognized in a business combination in revised Conceptual Framework for Financial Reporting. However, the amendments add an exception for the recognition of liabilities and contingent liabilities within the scope of IAS 37 ‘
Provisions, Contingent Liabilities and Contingent Assets’
, and IFRIC 21 ‘
. The amendments also clarify that contingent assets should not be recognized at the acquisition date. The amendments do not have a significant impact on the consolidated financial statements.
ii) IAS 16 ‘Property, Plant and Equipment ‘ amended – Proceeds before the intended use
The amendments require the entity to recognize the proceeds from selling such items, and the costs of producing those items, in profit or loss, and prohibit an entity from deducting from the cost of an item of property, plant and equipment any proceeds from selling items produced while the entity is preparing the asset for its intended use. The amendments do not have a significant impact on the consolidated financial statements.
SHINHAN FINANCIAL GROUP CO., LTD. AND SUBSIDIARIES
Notes to the Consolidated Financial Statements
(In millions of won)
|
Basis of preparation (continued) |
iii) IAS 37, ‘Provisions, Contingent Liabilities and Contingent Assets’ amended—Onerous Contracts: Cost of Fulfilling a Contract
The amendments clarify that the direct costs of fulfilling a contract include both the incremental costs of fulfilling the contract and an allocation of other costs directly related to fulfilling contracts when assessing whether the contract is onerous. The amendments do not have a significant impact on the consolidated financial statements.
iv) Annual Improvements to IFRSs 2018-2020 Cycle
For Annual Improvements to IFRSs 2018-2020 Cycle, the amendments will take effect for annual periods beginning after January 1, 2022 and are permitted for early application. The amendments do not have a significant impact on the consolidated financial statements.
| |
• |
|
IFRS 1, ‘First-time Adoption of IFRS’- First-time adopter subsidiaries |
| |
• |
|
IFRS 9 , ‘Financial Instruments’ - 10% test-related fee for financial liabilities removal |
| |
• |
|
IAS 41 – Fair value measurement |
v) IAS 7, ‘Statements of Cash flows’ – Cash and cash equivalents
The Group did not classify deposits with restrictions under relevant regulations, such as reserve deposits, as cash and cash equivalents. However, in accordance with the IFRS Interpretation Committee’s agenda decision in April 2022 ‘Demand Deposits with Restrictions on Use arising from a Contract with a Third Party’ and the response to IFRS inquiry stating ‘whether the reserve deposit should be classified as cash and cash equivalents’, it was changed to classify reserve deposits corresponding to demand deposits as cash and cash equivalents retroactively. The impact of this change in accounting policy is as follows:
| |
① |
Impact on consolidated statements of cash flows |
|
|
|
|
|
|
|
|
|
|
|
|
|
|
|
|
|
|
|
|
|
|
|
| Decrease in cash flows from operating activities |
|
|
3,373,232 |
|
|
|
(6,880,161 |
) |
|
|
(877,724 |
) |
| Effect of exchange rate changes on cash and cash equivalents denominated in foreign currencies |
|
|
10,133 |
|
|
|
3,301 |
|
|
|
(1,575 |
) |
| Increase in cash and cash equivalents at the beginning of the period |
|
|
14,513,053 |
|
|
|
17,896,418 |
|
|
|
11,019,558 |
|
| Increase in cash and cash equivalents at the end of the period |
|
|
17,896,418 |
|
|
|
11,019,558 |
|
|
|
10,140,259 |
|
| |
② |
Impact on notes to the consolidated statements of cash flows |
|
|
|
|
|
|
|
|
|
|
|
|
|
|
|
|
|
|
|
|
|
|
|
| Decrease in restricted deposits – excluded cash and cash equivalents |
|
W |
17,896,418 |
|
|
|
11,019,558 |
|
|
|
10,140,259 |
|
|
Significant accounting policies |
Significant accounting policies applied by the Group upon the preparation of consolidated financial statements under IFRS are described below, and consolidated financial statements for the year ended
SHINHAN FINANCIAL GROUP CO., LTD. AND SUBSIDIARIES
Notes to the Consolidated Financial Statements
(In millions of won)
|
Significant accounting policies (continued) |
December 31, 2022 and comparative periods were prepared using the same accounting policy, except for changes in accounting policy described in the Note 2.
The Group has divided the segments based on internal reports reviewed periodically by the top sales decision maker to make decisions about the resources allocated to the segments and evaluate their performance. There are six reporting segments as described in Note 7. The reporting segments are operated separately according to the nature of the goods and services provided and the organizational structure of the Group.
The segment reported to the Chief Executive Officer (“CEO”) includes items directly attributable to a segment as well as those that can be allocated on a reasonable basis.
It is the CEO’s responsibility to evaluate the resources to be distributed to the business and the performance of the business, and to make strategic decisions.
Subsidiaries are investees controlled by the Group. The Group controls an investee when it is exposed to, or has rights to, variable returns from its involvement with the investee and has the ability to affect those returns through its power over the investee. The financial statements of subsidiaries are included in the consolidated financial statements from the date that control commences until the date that control ceases.
If a member of the Group uses accounting policies other than those adopted in the consolidated financial statements for the same transactions and events in similar circumstances, appropriate adjustments are made to its financial statements in preparing the consolidated financial statements.
The Group establishes or invests in various structured entities. It does not own shares directly or indirectly for these companies. Considering the terms and conditions of the arrangement in which the structured entity was established, the Group gains and losses from the operations of the structured entity. It is included in the consolidated entities if it is determined that it has the ability to direct the activities of a consolidated structured entity that can most significantly affect these gains and losses. The Group does not recognize any
non-controlling
interests as equity in relation to structured entities in the consolidated statements of financial position since the
non-controlling
interests in these entities are recognized as liabilities of the Group.
iii) Intra-group transactions eliminated on consolidation
Intra-group balances, transactions, and any unrealized income and expenses arising from intra-group transactions are eliminated in preparing the consolidated financial statements. Unrealized intra-group losses are recognized as expense if intra-group losses indicate an impairment that requires recognition in the consolidated financial statements.
SHINHAN FINANCIAL GROUP CO., LTD. AND SUBSIDIARIES
Notes to the Consolidated Financial Statements
(In millions of won)
|
Significant accounting policies (continued) |
iv)
Non-controlling
interests
Non-controlling
interests in a subsidiary are accounted for separately from the parent’s ownership interests in a subsidiary. Each component of net profit or loss and other comprehensive income is attributed to the owners of the parent and
non-controlling
interest holders, even when the
non-controlling
interests balance is reduced to below zero.
A business combination is accounted for by applying the acquisition method, unless it is a combination involving entities or businesses under common control.
Each identifiable asset or liability is measured at its acquisition-date fair value except for below:
| |
• |
|
Leases are required to be classified based on the contractual terms and other factors |
| |
• |
|
Only those contingent liabilities assumed in a business combination that are a present obligation and can be measured reliably are recognized |
| |
• |
|
Deferred tax assets or liabilities are recognized and measured in accordance with IAS 12, |
| |
• |
|
Employee benefit arrangements are recognized and measured in accordance with IAS 19, |
| |
• |
|
Compensation assets are recognized and measured on the same basis as the items subject to compensation. |
| |
• |
|
Reacquired rights are measured in accordance with special provisions |
| |
• |
|
Liabilities or equity instruments related to share-based payment transactions are measured in accordance with the method in IFRS 2, |
| |
• |
|
Non-current assets held for sale are measured at fair value less costs to sell in accordance with IFRS 5, ‘Non-current Assets Held for Sale and Discontinued Operations’ |
As of the acquisition date,
non-controlling
interests in the acquired are measured as the
non-controlling
interests’ proportionate share of the acquirer’s identifiable net assets.
The transfer consideration in a business combination is measured at fair value, which is calculated as the sum of the acquisition-date fair values of the assets transferred by the acquirer, the liabilities incurred by the acquirer to former owners of the acquired and the equity interests issued by the acquirer. However, any portion of the acquirer’s share-based payment awards exchanged for awards held by the acquired employee that is included in transfer consideration in the business combination shall be measured in accordance with the method described above rather than at fair value.
Acquisition-related costs are costs the acquirer incurs to effect a business combination. Those costs include broker’s fees; advisory, legal, accounting, valuation and other professional or consulting fees; general administrative costs, including the costs of maintaining an internal acquisitions department; and costs of registering and issuing debt and equity securities. Acquisition-related costs, other than those associated with the issue of debt or equity securities, which are recognized in accordance with IAS 32 and IFRS 9, are expensed in the periods in which the costs are incurred and the services are received.
SHINHAN FINANCIAL GROUP CO., LTD. AND SUBSIDIARIES
Notes to the Consolidated Financial Statements
(In millions of won)
|
Significant accounting policies (continued) |
| |
|
Investments in associates and joint ventures |
An associate is an entity in which the Group has significant influence, but not control, over the entity’s financial and operating policies. Significant influence is presumed to exist when the Group holds between 20 and 50 percent of the voting power of another entity.
A joint venture is a joint arrangement whereby the parties that have joint control of the arrangement have rights to the net assets of the arrangement. Joint control is the contractually agreed sharing of control of an arrangement, which exists only when decisions about the relevant activities require the unanimous consent of the parties sharing control.
The investment in an associate and a joint venture is initially recognized at cost, and the carrying value is increased or decreased to recognize the Group’s share of the profit or loss and changes in equity of the associate and the joint venture after the date of acquisition. Intra-group balances and transactions, and any unrealized income and expenses arising from intra-group transactions, are eliminated the Group’s stake in preparing the consolidated financial statements. Unrealized losses are also being derecognized unless the transaction provides evidence of an impairment of the transferred assets.
If an associate or a joint venture uses accounting policies different from those of the Group for transactions and events in similar circumstances, appropriate adjustments are made to its financial statements in applying the equity method.
When the carrying value of that interest, including any long-term investments, is reduced to nil, the recognition of further losses is discontinued except to the extent that the Group has an obligation or has to make payments on behalf of the investee for further losses.
| |
|
Cash and cash equivalents |
The Group classifies cash balances, call deposits and highly liquid investment assets with original maturities of three months or less from the acquisition date that are easily converted into a fixed amount of cash, and are subject to an insignificant risk of changes in their fair value as cash and cash equivalents. Equity instruments are excluded from cash equivalents unless they are, in substance, cash equivalents, like in the case of preferred shares acquired within a short period of their maturity and with a specified redemption date.
| |
|
Non-derivative financial assets |
Financial assets are recognized in the consolidated statement of financial position when the Group becomes a party to the contract. In addition, a standardized purchase or sale (a purchase or sale of a financial asset under a contract whose terms require delivery of the asset within the time frame established generally by regulation or convention in the market concerned) is recognized on the trade date.
A financial asset is measured initially at its fair value plus, for an item not at Fair Value Through Profit or Loss (“FVTPL”), transaction costs that are directly attributable to its acquisition of the financial asset. Transaction costs on the financial assets at FVTPL that are directly attributable to the acquisition are recognized in profit or loss as incurred.
SHINHAN FINANCIAL GROUP CO., LTD. AND SUBSIDIARIES
Notes to the Consolidated Financial Statements
(In millions of won)
|
Significant accounting policies (continued) |
i) Financial assets designated at FVTPL
Financial assets can be irrevocably designated as measured at FVTPL despite of classification standards stated below, if doing so eliminates or significantly reduces an accounting mismatch that would otherwise arise from measuring assets or liabilities or recognizing the gains or losses on them on different bases.
For the equity instruments that are not held for short-term trading, at initial recognition, the Group may make an irrevocable election to present subsequent changes in fair value in other comprehensive income. Equity instruments that are not classified as financial assets at Fair Value through Other Comprehensive Income (“FVOCI”) are classified as financial assets at FVTPL.
The Group subsequently measures all equity investments at fair value. Valuation gains or losses of the equity instruments that are classified as financial assets at FVOCI previously recognized as other comprehensive income is not reclassified as profit or loss on recognition. The Group recognizes dividends in profit or loss when the Group’s right to receive payments of the dividend is established.
Valuation gains or losses due to changes in fair value of the financial assets at FVTPL are recognized in the consolidated statement of comprehensive income gains or losses on financial assets at FVTPL. Impairment loss (reversal) on equity instruments at FVOCI is not recognized separately.
Subsequent measurement of debt instruments depends on the Group’s business model in which the asset is managed and the contractual cash flow characteristics of the asset. Debt instruments are classified as financial assets at amortized cost, at FVOCI, or at FVTPL. Debt instruments are reclassified only when the Group’s business model changes.
| |
① |
Financial assets at amortized cost |
Assets that are held within a business model whose objective is to hold assets to collect contractual cash flows where those cash flows represent solely payments of principal and interest are measured at amortized cost. A gain or loss on a financial asset measured at amortized cost that is not subject to a hedging relationship is recognized in profit or loss when the financial asset is derecognized or impaired. Interest income on the effective interest method is included in the ‘Interest income’ in the consolidated statement of comprehensive income.
| |
② |
Financial assets at FVOCI |
Assets that are held within a business model whose objective is achieved by both collecting contractual cash flows and selling financial assets and, where the assets’ cash flows represent solely payments of principal and interest, are measured at FVOCI. Other than (reversal of) impairment losses, interest income, foreign exchange differences, gains or losses of the financial assets at FVOCI are recognized as other comprehensive income in equity. On removal, gains or losses accumulated in other comprehensive income are reclassified to profit or loss. The interest income on the effective interest method is included in the ‘Interest income’ in the consolidated statement of comprehensive income. Foreign exchange differences and impairment losses are included in the ‘Net foreign currency transaction gain’ and ‘Provision for credit losses allowance’ in the consolidated statement of comprehensive income, respectively.
SHINHAN FINANCIAL GROUP CO., LTD. AND SUBSIDIARIES
Notes to the Consolidated Financial Statements
(In millions of won)
|
Significant accounting policies (continued) |
| |
③ |
Financial assets at FVTPL |
Debt securities other than financial assets at amortized costs or FVOCI are classified at FVTPL. Unless hedge accounting is applied, gains or losses from financial assets at FVTPL are recognized as profit or loss and are included in ‘Net gain(loss) on financial assets at fair value through profit or loss’ in the consolidated statement of comprehensive income.
Financial assets with embedded derivatives are classified regarding the entire hybrid contract, and the embedded derivatives are not separately recognized. The entire hybrid contract is considered when it is determined whether the contractual cash flows represent solely payments of principal and interest.
v) Derecognition of financial assets
The Group derecognizes a financial asset when the contractual rights to the cash flows from the asset expire, or it transfers the rights to receive the contractual cash flows on the financial asset in a transaction in which substantially all the risks and rewards of ownership of the financial asset are transferred. If the Group does not have or transfer most of the risks and rewards of ownership of the financial asset, the entity shall remove the financial asset if it does not control the financial asset. If the Group continues to control the financial asset, it continues to recognize the transferred asset to the extent that it is continuously involved and recognizes the related liability together.
If the Group transfers the right to cash flows of a financial asset but holds most of the risks and rewards of ownership of the financial asset, the entity shall continue to recognize the asset. Also, the amount of disposal received is recognized as a liability.
Financial assets and financial liabilities are offset and the net amount is presented in the consolidated statement of financial position only when the Group currently has a legally enforceable right to set off the recognized amounts, and intends either to settle on a net basis or to realize the asset and settle the liability
simultaneously.
| |
|
Derivative financial instruments |
Derivatives are initially recognized at fair value. Subsequent to initial recognition, derivatives are measured at fair value, and changes therein are accounted for as described below.
The Group holds forward exchange contracts, interest rate swaps, currency swaps and other derivative contracts to manage interest rate risk and foreign exchange risk. The Group designated derivatives as hedging instruments to hedge the risk of changes in the fair value of assets, liabilities or firm commitments (a fair value hedge) and foreign currency risk of highly probable forecasted transactions or firm commitments (a cash flow hedge).
On initial designation of the hedge, the Group formally documents the relationship between the hedging instrument(s) and hedged item(s), including the risk management objectives and strategy in undertaking the
hedge transaction. In addition, this document describes the hedging instrument, hedged item, and the method
SHINHAN FINANCIAL GROUP CO., LTD. AND SUBSIDIARIES
Notes to the Consolidated Financial Statements
(In millions of won)
|
Significant accounting policies (continued) |
of evaluating the effect of the hedging instrument offsetting changes in the fair value or cash flow of the hedged item due to the hedged risk at the initiation of the hedging relationship and in subsequent periods.
Changes in the fair value of a derivative hedging instrument designated
as
a fair value hedge are recognized in profit or loss. The gain or loss from remeasuring the hedging instrument at fair value for a derivative hedging instrument and the gain or loss on the hedged item attributable to the hedged risk are recognized in profit or loss in the same line item of the separate statement of comprehensive income.
The Group discontinues fair value hedge accounting if the hedging instrument expires or is sold, terminated or exercised, or if the hedge no longer meets the criteria. Any adjustment arising from G/L on the hedged item attributable to the hedged risk is amortized to profit or loss from the date the hedge accounting is discontinued.
When a derivative is designated to hedge the variability in cash flows attributable to a particular risk associated with a recognized asset or liability or a highly probable forecasted transaction that could affect profit or loss, the effective portion of changes in the fair value of the derivative is recognized in other comprehensive income, net of tax, and presented in the hedging reserve in equity. Any ineffective portion of changes in the fair value of the derivative is recognized immediately in profit or loss.
If the hedging instrument no longer meets the criteria for hedge accounting, expires or is sold, terminated, exercised, or the designation is revoked, then hedge accounting is discontinued prospectively. The cumulative gain or loss on the hedging instrument that has been recognized in other comprehensive income is reclassified to profit or loss in the periods during which the forecasted transaction occurs. If the forecasted transaction is no longer expected to occur, then the balance in other comprehensive income is recognized immediately in profit or loss.
The portion of the change in fair value of a financial instrument designated as a hedging instrument that meets the requirements for hedge accounting for a net investment in a foreign operation is recognized in other comprehensive income and the ineffective portion of the hedge is recognized in profit or loss. The portion recognized as other comprehensive income that is effective as a hedge is recognized in the statement of comprehensive income as a result of reclassification adjustments in accordance with IAS 21, “Effect of Changes in Foreign Exchange Rates” at the time of disposing of its overseas operations or disposing of a portion of its overseas operations to profit or loss.
ii) Other derivative financial instruments
All derivatives except those designated as hedging instruments and are effective in hedging are measured at fair value. Changes in the fair value of other derivative financial instrument not designated as a hedging instrument are recognized immediately in profit or loss.
iii) Gains and losses on initial recognition
Any difference between the fair value of over the counter derivatives at initial recognition and the amount that would be determined at that date using a valuation technique in a situation in which the valuation is dependent on unobservable parameters is not recognized in profit or loss but is deferred, and the deferred gains and losses
SHINHAN FINANCIAL GROUP CO., LTD. AND SUBSIDIARIES
Notes to the Consolidated Financial Statements
(In millions of won)
|
Significant accounting policies (continued) |
on initial transaction are depreciated on a straight-line basis over the life of the instrument or the remainder is recognized in profit or loss immediately when the fair value becomes observable.
| |
|
Expected credit losses of Financial assets |
The Group recognizes allowance for credit loss(“ACL”) for debt instruments measured at amortized cost and fair value through other comprehensive income, and lease receivable, loan commitments and financial guarantee contracts using the expected credit loss impairment model. Financial assets migrate through the following three stages based on the change in credit risk since initial recognition and allowance for credit loss for the financial assets are measured at the
12-month
expected credit losses (“ECL”) or the lifetime ECL, depending on the stage.
|
|
|
|
|
|
|
Allowance for credit loss |
| STAGE 1 |
|
When credit risk has not increased significantly since the initial recognition |
|
12-months ECL: the ECL associated with the probability of default events occurring within the next 12 months |
| STAGE 2 |
|
When credit risk has increased significantly since the initial recognition |
|
Lifetime ECL: a lifetime ECL associated with the probability of default events occurring over the remaining lifetime |
| STAGE 3 |
|
When assets are impaired |
|
Same as above |
The Group, meanwhile, only recognizes the cumulative changes in lifetime expected credit losses since the initial recognition as an allowance for credit loss for purchased or originated credit-impaired financial assets.
The total period refers to the expected life span of the financial instrument up to the contract expiration date.
i) Reflection of forward-looking information
The Group reflects forward-looking information presented by internal experts based on a variety of information when measuring expected credit losses. Assuming that the measurement factor of expected credit losses has a certain correlation with economic fluctuations, the expected credit losses are calculated by reflecting forward-looking information through modeling between macroeconomic variables and measurement factors.
ii) Measurement of expected credit loss of financial assets at amortization cost
The expected credit loss of an amortized financial asset is measured as the difference between the present value of the cash flows expected to be received and the cash flow expected to be received. For this purpose, we calculate expected cash flows for individually significant financial assets. For
non-individual
significant financial assets, the financial assets collectively include expected credit losses as part of a set of financial assets with similar credit risk characteristics.
Expected credit losses are deducted using the allowance for credit loss account and are written off if the financial assets are not recoverable. The allowance for credit loss is increased when the
written-off
loan receivables are subsequently collected and changes in the allowance for credit loss are recognized in profit or loss.
iii) Measurement of estimated credit loss of financial assets at FVOCI
The calculation of expected credit losses is the same as for financial assets measured at amortized cost, but changes in allowance for credit loss are recognized in other comprehensive income. In the case of disposal
SHINHAN FINANCIAL GROUP CO., LTD. AND SUBSIDIARIES
Notes to the Consolidated Financial Statements
(In millions of won)
|
Significant accounting policies (continued) |
| |
|
Expected credit losses of Financial assets (continued) |
and redemption of other comprehensive income – fair value, the allowance for credit loss is reclassified from other comprehensive income to profit or loss and recognized in profit or loss.
Property and equipment are initially measured at cost and after initial recognition. The cost of property and equipment includes expenditures arising directly from the construction or acquisition of the asset, any costs directly attributable to bringing the asset to the location and condition necessary for it to be capable of operating in the manner intended by management and the initial estimate of the costs of dismantling and removing the item and restoring the site on which it is located. Certain land and buildings are measured at fair value at the date of transition to IFRS, which is deemed cost, in accordance with IFRS 1,
‘First-time Adoption of IFRS’
. Subsequent to initial recognition, the asset is measured at cost less accumulated depreciation and accumulated impairment losses, if any.
The Group recognizes in the carrying value of an item of property and equipment the cost of replacing part of property and equipment when that cost is incurred if it is probable that future economic benefits associated with the item will flow to the Group and the cost of the item can be measured reliably. The carrying value of those parts that are replaced is derecognized. The costs of the
servicing of property and equipment are recognized in profit or loss as incurred.
Land is not depreciated. Other property and equipment are depreciated on a straight-line basis over the estimated useful lives, which most closely reflect the expected pattern of consumption of the future economic benefits embodied in the asset. The estimated useful lives for the current and comparative periods are as follows:
|
|
|
| |
|
|
| Buildings |
|
40~50 years |
| Other properties |
|
4~5 years |
Depreciation methods, useful lives and residual values are reassessed at each fiscal
year-end
and in case adjustments are needed, it is accounted for as a change in accounting estimate.
Intangible assets are measured initially at cost and, subsequently, are carried at cost less accumulated amortization and accumulated impairment losses.
Amortization of intangible assets except for goodwill is calculated on a straight-line basis over the estimated useful lives of intangible assets as shown below, from the date that they are available for use. The residual value of intangible assets is zero. However, if there are no foreseeable limits to the periods over which certain intangible assets are expected to be available for use, they are determined to have indefinite useful lives and are not amortized.
|
|
|
| |
|
|
| Software |
|
5 years |
| Capitalized development cost |
|
5 years |
| Other intangible assets |
|
5 years or contract periods |
SHINHAN FINANCIAL GROUP CO., LTD. AND SUBSIDIARIES
Notes to the Consolidated Financial Statements
(In millions of won)
|
Significant accounting policies (continued) |
Amortization periods and the amortization methods for intangible assets with finite useful lives are reviewed at the end of each reporting period. The useful lives of intangible assets that are not being amortized are reviewed at the end of each reporting period to determine whether events and circumstances continue to support indefinite useful life assessments for those assets. Changes are accounted for as changes in accounting estimates.
Expenditures on research activities, undertaken with the prospect of gaining new technical knowledge and understanding, are recognized in profit or loss as incurred. Development expenditures are capitalized only if development costs can be measured reliably, the product or process is technically and commercially feasible, future economic benefits are probable, and the Group intends to and has sufficient resources to complete development and to use or sell the asset. Other development expenditures are recognized in profit or loss as incurred.
Investment property is property held either to earn rental income or for capital appreciation or both. An investment property is initially recognized at cost including any directly attributable expenditure. Subsequent to initial recognition, the asset is measured at cost less accumulated depreciation and accumulated impairment losses, if any.
The depreciation method and the estimated useful lives for the current and comparative periods are as follows:
|
|
|
|
|
| |
|
|
|
|
| Buildings |
|
40 years |
|
Straight-line |
i) Accounting treatment as the lessee
The Group leases various tangible assets, such as real estate and vehicles, and each of the lease contract is negotiated individually and includes a variety of terms and conditions. There are no other restrictions imposed by the lease contracts, but the lease assets cannot be provided as collaterals for borrowings.
At the commencement date of the lease, the Group recognizes the
assets and the lease liabilities. Each lease payment is allocated to payment for the principal portion of the lease liability and financial costs. The Group recognizes in profit or loss the amount calculated to produce a constant periodic rate of interest on the lease liability balance for each period as financial costs.
assets are depreciated using a straight-line method from the commencement date over the lease term.
Lease liabilities are measured at the present value of the lease payments that are not paid at the commencement date of the lease, and the lease payments included in the measurement of the liabilities consist of the following payments:
| |
• |
|
Fixed payments (including in-substance fixed payments, less any lease incentives receivable) |
| |
• |
|
Variable lease payments depending on the index or rate (interest rate) |
| |
• |
|
Amounts expected to be paid by the lessee under the residual value guarantee |
| |
• |
|
The exercise price of a purchase option if the lessee is reasonably certain to exercise that option |
SHINHAN FINANCIAL GROUP CO., LTD. AND SUBSIDIARIES
Notes to the Consolidated Financial Statements
(In millions of won)
|
Significant accounting policies (continued) |
| |
• |
|
Payments of penalties for terminating the lease, if the lease term reflects the lessee exercising an option to terminate the lease |
If the interest rate implicit in the lease is readily determined, the lease payments are discounted by the rate; if the rate is not readily determined, the lessee’s incremental borrowing rate is used.
The cost of the
assets comprise:
| |
• |
|
The amount of the initial measurement of the lease liability |
| |
• |
|
Any lease payments made at or before the commencement date (less any lease incentives received) |
| |
• |
|
Any initial direct costs incurred by the lessee |
| |
• |
|
An estimate of costs to be incurred by the lessee in dismantling and removing the underlying asset, restoring the site on which it is located or restoring the underlying asset to the condition required by the terms and conditions of the lease |
Lease payments related to short-term leases or
low-value
assets are recognized as current expenses over the lease term using the straight-line method. A short-term lease is a lease that has a lease term of 12 months or less, and the
low-value
assets lease is a lease of which the underlying asset value is not more than
W
6 million.
Additional considerations for the Group when accounting for lessees include:
Extension and termination options are included in a number of real estate lease contracts of the Group. In determining the lease term, management considers all relevant facts and circumstances that create an economic incentive not to exercise the options. The periods covered by, a) an option to extend the lease if the lessee is reasonably certain to exercise that option, or b) an option to terminate the lease if the lessee is reasonably certain not to exercise that option, is included when determining the lease term. The Group reassesses whether the Group is reasonably certain to exercise the extension option, or not to exercise a termination option, upon the occurrence of either a significant event or a significant change in circumstances that is within the control of the lessee, and affects whether the lessee is reasonably certain to exercise an option not previously included in its determination of the lease term, or not to exercise an option previously included in its determination of the lease term.
ii) Accounting treatment as the lessor
The Group leases out to lessee various tangible assets, including vehicles under operating and finance lease contracts, and each of the lease contract is negotiated individually and includes a variety of terms and conditions. The risk management method for all rights held by the Group in the underlying assets includes repurchase agreements, residual value guarantees, etc.
The Group recognizes them as a receivable at an amount equal to the net investment in the lease, and the difference from the carrying value of the leasing asset as of the commencement date is recognized as profit or loss from disposal of the lease asset. In addition, interest income is recognized by applying the effective interest method for the amount of the Group’s net investment in finance leases. Lease-related direct costs are included in the initial recognition of financial lease receivables and are accounted for in a way that reduces the revenue for the lease term.
SHINHAN FINANCIAL GROUP CO., LTD. AND SUBSIDIARIES
Notes to the Consolidated Financial Statements
(In millions of won)
|
Significant accounting policies (continued) |
The Group recognizes the lease payments as income on straight-line basis, and adds the lease initial direct costs incurred during negotiation and contract phase of the operating lease to the carrying value of the underlying asset. In addition, the depreciation policy of operating lease assets is consistent with the Group’s depreciation policy of other similar assets.
Non-current
assets, or disposal groups comprising assets and liabilities, that are expected to be recovered primarily through sale rather than through continuing use, are classified as held for sale. In order to be classified as held for sale, the asset (or disposal group) must be available for immediate sale in its present condition and its sale must be highly probable. The assets or disposal group that are classified as
non-current
assets held for sale are measured at the lower of their carrying value and fair value less cost to sell.
The Group recognizes an impairment loss for any initial or subsequent write-down of an asset (or disposal group) to fair value less costs to sell, and a gain for any subsequent increase in fair value less costs to sell, up to the cumulative impairment loss previously recognized.
An asset that is classified as held for sale or part of a disposal group classified as held for sale is not depreciated (or amortized).
| |
|
Impairment of non-financial assets |
The carrying values of the Group’s
non-financial
assets, other than assets arising from employee benefits, deferred tax assets and
non-current
assets held for sale, are reviewed at the end of the reporting period to determine whether there is any indication of impairment. If any such indication exists, then the asset’s recoverable amount is estimated.
Goodwill and intangible assets that have indefinite useful lives or that are not yet available for use, irrespective of whether there is any indication of impairment, are tested for impairment annually by comparing their recoverable amount to their carrying value.
The Group estimates the recoverable amount of an individual asset, and if it is impossible to measure the individual recoverable amount of an asset, then the Group estimates the recoverable amount of cash-generating unit (“CGU”). The recoverable amount of an asset or a CGU is the greater of its value in use and its fair value less costs to sell. The value in use is estimated by applying a
pre-tax
discount rate that reflects current market assessments of the time value of money and the risks specific to the asset or the CGU for which estimated future cash flows have not been adjusted, to the estimated future cash flows expected to be generated by the asset or the CGU.
An impairment loss is recognized if the carrying value of an asset or a CGU exceeds its recoverable amount. Impairment losses are recognized in profit or loss.
Goodwill acquired in a business combination is allocated to each CGU that is expected to benefit from the synergies arising from the goodwill acquired. Any impairment identified at the CGU level will first reduce the carrying value of goodwill and then be used to reduce the carrying value of the other assets in the CGU on a pro rata basis. Impairment losses of goodwill cannot be reversed in the subsequent period. At the end of each reporting period, the Group reviews whether there are any signs of impairment loss that has been recognized in the prior period no longer exists or has decreased, and reversal occurs only if there is a change in the estimate used to determine the recoverable amount after the recognition of the impairment loss. The
SHINHAN FINANCIAL GROUP CO., LTD. AND SUBSIDIARIES
Notes to the Consolidated Financial Statements
(In millions of won)
|
Significant accounting policies (continued) |
asset’s carrying value does not exceed the carrying value that would have been determined, net of depreciation or amortization, if no impairment loss had been recognized.
| |
|
Non-derivative financial liabilities |
The Group recognizes financial liabilities in the consolidated statement of financial position when the Group becomes a party to the contractual provisions of the financial liability in accordance with the substance of the contractual arrangement and the definitions of financial liabilities.
Transaction costs on the financial liabilities at FVTPL are recognized in profit or loss as incurred.
i) Financial liabilities designated at FVTPL
Financial liabilities can be irrevocably designated as measured at FVTPL if doing so eliminates or significantly reduces an accounting mismatch that would otherwise arise from measuring assets or liabilities or recognizing the gains and losses on them on different bases, or a group of financial instruments is managed and its performance is evaluated on a fair value basis, in accordance with a documented risk management or investment strategy. The amount of change in the fair value of the financial liabilities designated at FVTPL that is attributable to changes in the credit risk of that liabilities shall be presented in other comprehensive income.
ii) Financial liabilities at FVTPL
Since initial recognition, financial liabilities at FVTPL is measured at fair value, and changes in the fair value are recognized as profit or loss.
iii) Other financial liabilities
Non-derivative
financial liabilities other than financial liabilities at fair value through profit or loss are classified as other financial liabilities, and other financial liabilities include deposits, borrowings, debt securities and etc. At the date of initial recognition, other financial liabilities are measured at fair value minus transaction costs that are directly attributable to the acquisition. Subsequent to initial recognition, other financial liabilities are measured at amortized cost using the effective interest method.
The Group derecognizes a financial liability from the consolidated statement of financial position when it is extinguished (i.e. when the obligation specified in the contract is discharged, canceled or expires).
i) Foreign currency transactions
Transactions in foreign currencies are translated to the respective functional currencies of the Group at exchange rates at the dates of the transactions. Monetary assets and liabilities denominated in foreign currencies at the end of the reporting period are retranslated to the functional currency using the exchange rate at the end of the reporting period.
Non-monetary
foreign currency items measured at fair value are converted to the exchange rate on the date the fair value is determined, and
non-monetary
items measured at historical cost are converted to the exchange rate on the trading day.
All foreign currency differences arising from the conversion of monetary items are recognized in profit or loss. However, the Group excludes currency differences at the time of settlement of monetary items,
SHINHAN FINANCIAL GROUP CO., LTD. AND SUBSIDIARIES
Notes to the Consolidated Financial Statements
(In millions of won)
|
Significant accounting policies (continued) |
conversion differences in net investments in foreign operations and conversion differences for financial liabilities designated cash flow hedges. If gains or losses arising from
non-monetary
items are recognized in other comprehensive income, the effect of exchange rate changes included in those gains or losses is also recognized in other comprehensive income. In addition, if recognized in profit or loss, the effect of exchange rate changes is also recognized in profit or loss.
If the presentation currency of the Group is different from a foreign operation’s functional currency, the financial statements of the foreign operation are translated into the presentation currency using the following methods:
The assets and liabilities of foreign operations, whose functional currency is not the currency of a hyperinflationary economy, are translated to presentation currency at exchange rates at the reporting date. The income and expenses of foreign operations are translated to functional currency at exchange rates at the dates of the transactions. Foreign currency differences are recognized in other comprehensive income.
Any goodwill arising on the acquisition of a foreign operation and any fair value adjustments to the carrying values of assets and liabilities arising on the acquisition of that foreign operation are treated as assets and liabilities of the foreign operation and are translated using the exchange rate at the reporting date.
Upon disposal of foreign operations, the cumulative amount of the exchange differences recognized as a separate line item within the equity and other comprehensive income is reclassified from other comprehensive income to profit and loss at the time of recognition. When disposing subsidiaries, including foreign operations, proportional shares of exchange differences recognized in other comprehensive income are reverted to
non-controlling
shares of foreign operations, and in other cases, disposing some of the portions of foreign operations, only the proportional shares of the accumulated exchange differences recognized in other comprehensive income are classified as profit and loss.
iii) Net investment in a foreign operation
If the settlement of a monetary item receivable from or payable to a foreign operation is neither planned nor likely in the foreseeable future, then foreign currency differences arising on the item form part of the net investment in the foreign operation and are recognized in other comprehensive income and reclassified from equity to profit or loss on disposal of the net investment.
Capital stock is classified as equity. Incremental costs directly attributable to the transaction of stock are deducted from equity, net of any tax effects.
Preferred stocks are classified as equity if they do not need to be repaid or are repaid only at the option of the Group and if payment is determined by the Group’s discretion, and dividends are recognized when the shareholders’ meeting approves the dividends. Preferred stocks that are eligible for reimbursement of a defined or determinable amount on or after a certain date are classified as liabilities. The related dividend is recognized in profit or loss at the time of occurrence as interest expense.
SHINHAN FINANCIAL GROUP CO., LTD. AND SUBSIDIARIES
Notes to the Consolidated Financial Statements
(In millions of won)
|
Significant accounting policies (continued) |
The Group classifies an issued financial instrument, or its component parts, as a financial liability or an equity instrument depending on the substance of the contractual arrangement of such financial instrument. Hybrid bonds where the Group has an unconditional right to avoid delivering cash or another financial asset to settle a contractual obligation are classified as an equity instrument and presented in equity. Hybrid bonds issued by subsidiaries of the group are classified as
non-controlling
interests according to this classification criteria. In addition, distributions paid are treated as net income attributable to
non-controlling
interests in the consolidated statement of comprehensive income.
The effect of changes in ownership interests in subsidiaries that do not lose control over the equity attributable to owners of the parent is included in capital adjustments.
i) Short-term employee benefits
Short-term employee benefits are employee benefits that are due to be settled within 12 months after the end of the period in which the employees render the related service. When an employee has rendered service to the Group during an accounting period, the Group recognizes the undiscounted amount of short-term employee benefits expected to be paid in exchange for that service.
ii) Other long-term employee benefits
The Group’s net obligation in respect of other long-term employee benefits that are not expected to be settled wholly before 12 months after the end of the annual reporting period in which the employees render the related service, is the amount of future benefit that employees have earned in return for their service in the current and prior periods. That benefit is discounted to determine its present value. Remeasurements are recognized in profit or loss in the period in which they arise.
iii) Retirement benefits: defined contribution plans
The Group recognizes the contribution expense as an account of severance payments in profit or loss in the period according to the defined contribution plans, when an employee provides work services for a certain period of time, except for the case when it is included in the cost of the asset. Contributions payable are recognized as liabilities (unpaid expenses) after deducting the contributions already paid. In addition, if the contribution already paid exceeds the contribution due for services provided before the end of the reporting period, the future contribution is reduced or cash refunded due to the excess is recognized as an asset (prepaid expense).
iv) Retirement benefits: defined benefit plans
For the year ended December 31, 2022, defined benefit liabilities related to the defined benefit plan are recognized by deducting the fair value of external reserve from the present value of the defined benefit plan debt.
Defined benefit liabilities are calculated annually by independent actuaries using the predicted unit credit method. If the net present value of the defined benefit obligation less the fair value of the plan assets is an
SHINHAN FINANCIAL GROUP CO., LTD. AND SUBSIDIARIES
Notes to the Consolidated Financial Statements
(In millions of won)
|
Significant accounting policies (continued) |
asset then the present value of the economic benefits available to the entity in the form of a refund from the plan or a reduction in future contributions to the plan.
The remeasurement component of net defined benefit liability is the change in the effect on asset ceiling except for the amount included in the net interest income of plan assets and net revenues of plan assets excluding actuarial gains and losses to the net of defined benefit liabilities. It is immediately recognized in other comprehensive income. The Group determines the net interest on the net defined benefit obligation (asset) by multiplying the net defined benefit obligation (asset) by the discount rate determined at the beginning of the annual reporting period and is the net present value of the net defined benefit obligation. It is determined by taking into consideration the fluctuations. Net interest expense and other expenses related to defined benefit plans are recognized in profit or loss.
When an amendment or reduction of the system occurs, the gain or loss resulting from the change or decrease in the benefits to the past service is immediately recognized in profit or loss. The Group recognizes gains or losses on settlement when the defined benefit plan is settled.
Termination benefits are recognized as an expense when the Group is committed demonstrably, without realistic possibility of withdrawal, to a formal detailed plan to either terminate employment before the normal retirement date, or to provide termination benefits as a result of an offer made to encourage voluntary redundancy. Termination benefits for voluntary redundancies are recognized as an expense if the Group has made an offer of voluntary redundancy, it is probable that the offer will be accepted, and the number of acceptances can be estimated reliably. If benefits are payable more than 12 months after the reporting period, then they are discounted to their present value.
| |
|
Share-based payment transactions |
In regards to the share-based payment transactions which grants an employee a stock or stock option in exchange for the goods or services provided, if the fair value of the goods or services provided or the fair value of the goods or services provided cannot be reliably measured, the Group indirectly measures the fair value of the goods or services based on the fair value of the given equity, and the amount is recognized as employee benefit expenses and capital during the vesting period. For share-based payment awards with
non-vesting
conditions, the grant date fair value of the share-based payment is measured to reflect such conditions and there is no
true-up
for differences between expected and actual outcomes.
The fair value of the amount payable to employees in respect of share appreciation rights, which are settled in cash, is recognized as an expense with a corresponding increase in liabilities, over the period that the employees unconditionally become entitled to payment. The liability is remeasured at each reporting date and at settlement date. Any changes in the fair value of the liability are recognized as personnel expense in profit or loss.
Provisions are recognized when the Group has a present legal or constructive obligation as a result of a past event, it is probable that an outflow of resources embodying economic benefits will be required to settle the obligation and a reliable estimate can be made of the amount of the obligation.
SHINHAN FINANCIAL GROUP CO., LTD. AND SUBSIDIARIES
Notes to the Consolidated Financial Statements
(In millions of won)
|
Significant accounting policies (continued) |
The risks and uncertainties that inevitably surround many events and circumstances are taken into account in reaching the best estimate of a provision. Where the effect of the time value of money is material, provisions are determined at the present value of the expected future cash flows.
Provisions are reviewed at the end of each reporting period and adjusted to reflect the current best estimate. If it is no longer probable that an outflow of resources embodying economic benefits will be required to settle the obligation, the provision is reversed.
Provisions shall be used only for expenditures for which the provisions are originally recognized.
| |
|
Financial guarantee contract |
A financial guarantee contract is a contract that requires the Group to make specified payments to reimburse the holder for a loss it incurs because a specified debtor fails to make payment when due in accordance with the original or modified terms of a debt instrument.
Financial guarantee contracts are recognized initially at their fair value, and the initial fair value is amortized over the life of the financial guarantee contract.
After initial recognition, financial guarantee contracts are measured at the higher of:
| |
• |
|
Loss allowance in accordance with IFRS 9 ‘ ’ |
| |
• |
|
The amount initially recognized less, when appropriate, the cumulative amount of income recognized in accordance with the principles of IFRS 15, ‘ Revenue from Contracts with Customers ’ |
i) Investment contract liabilities, including insurance contract liabilities and discretionary dividend factors
The group establishes liability reserves in accordance with the Insurance Business Law and the related regulations. The reserves are calculated according to the insurance policy, insurance premiums and liability reserve calculation method. The main contents are as follows.
This is the amount to be accumulated for insurance claim payable for the existing contracts as of the end of the reporting period, the reserves are calculated by deducting the present value of net premiums to be earned after the end of the reporting period from the present value of claims to be paid to the policyholder after the date of the statement of financial position.
i-2)
Unearned premium reserves
Among premiums that are due for payment before the end of the reporting period, the prepaid premium reserves for the next period are calculated through a premium and liability reserves calculation method.
The total amount of reserve for variable minimum guarantee (①) and reserve for general account guarantee (②) is provided as guarantee reserve.
SHINHAN FINANCIAL GROUP CO., LTD. AND SUBSIDIARIES
Notes to the Consolidated Financial Statements
(In millions of won)
|
Significant accounting policies (continued) |
① Variable minimum guarantee reserve
This reserve is the amount that must be accumulated to guarantee insurance premiums above a certain level for contracts maintained as of the end of the reporting period, and is measured at the higher of:
| |
i) |
the average amount of the top 30% of net loss expected in the future |
| |
ii) |
the minimum required amount by insurance types, minimum guarantees, level of guarantees and limits of stock investment portion |
② General account guarantee reserve
As of the end of the reporting period, the amount of reserve for insurance contracts that are insured under general account is required to be paid to guarantee the level of refunds, and select the largest of the following:
| |
i) |
Average of the amount deducted from the appropriateness of the liability reserve calculated by excluding the guarantee option from the appropriateness evaluation of the liability reserve calculated by including the guarantee option for each interest rate scenario |
| |
ii) |
The amount of compensation (including annulment contract) against the guarantee received from the policy holder by the rate applied at the premium calculation in the insurance premium and liability reserve calculation method |
i-4)
Reserve for outstanding claims
As of the end of the reporting period, the Group has accrued the amount for which the reason for the payment of insurance claims, etc. has been incurred and the amount of the claim payment has not been paid yet due to the dispute or lawsuit related to the insurance settlement (pending in the Financial Dispute Mediation Committee). In addition, the Group recognizes unrecognized losses based on historical experience.
i-5)
Reserves for participating policyholders’ dividends
The reserve is provided for the purpose of contributing to the policyholder dividend according to the laws and regulations and the reserve for dividend reserve for the policyholder and the dividend reserve for the subsequent business year.
The policyholder dividend reserve is the amount that is not paid as of the end of the reporting period for the settlement amount and the reserve for dividend policy for the next fiscal year is based on the policyholder dividend calculated on the insurance contract effective as of the end of the reporting period.
① Excess crediting rate reserve
In the case of a dividend insurance contract which has been maintained for more than one year as of the end of the reporting period among contracts signed before October 1, 1997, the difference between the planned interest rate and the
one-year
maturity deposit rate shall be preserved.
② Mortality dividend reserve
Dividends arising from contracts that are maintained for more than one year at the end of the reporting period are used to offset the expected mortality and actual mortality rates applied to premiums.
F-36
SHINHAN FINANCIAL GROUP CO., LTD. AND SUBSIDIARIES
Notes to the Consolidated Financial Statements
(In millions of won)
|
Significant accounting policies (continued) |
③ Interest dividend reserve
For the contracts that have been maintained for more than one year as of the end of the reporting period, the amount calculated by applying the interest dividend reserve rate to the net written premium reserve less the unearned acquisition costs. However, the insurance sold before October 1, 1997 is applied to the amount deducted from the net premium in the event that the planned interest rate by the insurance product is less than the dividend standard.
④ Reserves for long-term special dividends
For the effective dividend policy agreement that has been maintained for 6 years or more, the amount calculated by applying the long-term special dividend rate to the amount deducted from the net premiums for the end of the year.
However, insurance sold before October 1, 1997 is applied to the deduction of unearned premiums at the end of the year when the expected interest rate by the insurance product is less than the dividend standard rate.
i-6)
Reserve for interest dividends
In order to cover the policyholder dividend in the future, the total amount is set aside according to business performance according to the law or insurance contracts.
i-7)
Reserve for dividend insurance loss reserve
In accordance with the regulations set by the supervisory authority, dividend insurance profit is accumulated within 30/100 of the contractor’s stake. The reserve for the compensation of dividend insurance losses shall compensate for the loss of dividend insurance contracts in accordance with the provisions of the fiscal year within five years from the end of the accumulated reporting period and shall be used as the policyholder dividend source for the individual contractor.
ii) Contractor’s equity adjustment
In accordance with IAS 39, the Group classifies the gains and losses of available for sale financial assets as policyholder’s equity and shareholders’ equity based on the reserve ratio for dividend paying and
non-dividend
paying insurance for the year ended December 31, 2022, and the portion of policyholder’s equity is accounted as policyholder’s equity adjustment.
iii) Evaluation of debt appropriateness
At the end of each reporting period, the group assesses whether the recognized insurance liability is appropriate using the current estimates of future cash flows of the policy, and if the carrying value of the insurance liability is deemed to be inappropriate in terms of the estimated future cash flows. The reserve for premiums is added to the profit or loss by the amount corresponding to the deficiency.
The group presents the recoverable amount of reinsurance assets. The group assesses at the end of each reporting period whether there is objective evidence that a reinsurance asset is impaired. If there is objective
F-37
SHINHAN FINANCIAL GROUP CO., LTD. AND SUBSIDIARIES
Notes to the Consolidated Financial Statements
(In millions of won)
|
Significant accounting policies (continued) |
evidence that the entity will not be able to collect all amounts under the terms of the agreement as a result of an event that occurred after the initial recognition and if the event has a reliable and measurable impact on the amount to be received. If reinsurance assets are determined to be impaired, impairment loss is recognized in the profit and loss for the current period.
v) Deferred acquisition cost
The group recognizes unrealized gains and losses arising from long-term insurance contracts as assets and amortizes the premiums over the life of the insurance contracts equally. If the contribution period exceeds 7 years, the amortization period is 7 years if there is an unrecognized balance at the date of the cancelation, the entire amount of the cancelation is amortized in the fiscal year to which the cancelation date belongs. But, if the ratio of additional premiums is higher at the early stage of the insurance period for the purpose of recovering the excess of the unearned premiums and the early settlement costs, the new settlement expenses are treated as the period expense.
| |
|
Recognition of revenues and expenses |
The Group’s revenues are recognized using five-step revenue recognition model as follows: ① ‘Identifying the contract’
g
② ‘Identifying performance obligations’
g
③ ‘Determining the transaction price’
g
④ ‘Allocating the transaction price to performance obligations’
g
⑤ ‘Recognizing the revenue by satisfying performance obligations’.
i) Interest income and expense
Interest income and expense are recognized in profit or loss using the effective interest method. The effective interest rate is the rate that exactly discounts the estimated future cash payments and receipts through the expected life of the financial asset or liability or, where appropriate, a shorter period to the net carrying value of the financial asset or liability.
When calculating the effective interest rate, the Group estimates cash flows considering all contractual terms of the financial instrument, but does not consider future credit losses. The calculation includes all fees and points paid or received between parties to the contract that are an integral part of the effective interest rate, and all other premiums or discounts. When it is not possible to estimate reliably the cash flows or the expected life of a financial instrument, the Group uses the contractual cash flows over the full contractual term of the financial instrument.
Once a financial asset or a group of similar financial assets has been written down as a result of an impairment loss, interest income is thereafter recognized using the rate of interest used to discount the future cash flows for the purpose of measuring the impairment loss.
The recognition of revenue for financial service fees depends on the purposes for which the fees are assessed and the basis of accounting for any associated financial instrument.
| |
① |
Fees that are an integral part of the effective interest rate of a financial instrument |
Such fees are generally treated as an adjustment to the effective interest rate. Such fees may include compensation for activities such as evaluating the borrower’s financial condition, evaluating and recording
SHINHAN FINANCIAL GROUP CO., LTD. AND SUBSIDIARIES
Notes to the Consolidated Financial Statements
(In millions of won)
|
Significant accounting policies (continued) |
guarantees, collateral and other security arrangements, preparing and processing documents, closing the transaction and the origination fees received on issuing financial liabilities. However, when the financial instrument is measured at fair value with the change in fair value recognized in profit or loss, the fees are recognized as revenue when the instrument is initially recognized.
| |
② |
Fees earned as services are provided |
Fees and commission income, including investment management fees, sales commission, and account servicing fees, are recognized as the related services are provided.
| |
③ |
Fees that are earned on the execution of a significant act |
The fees that are earned on the execution of a significant act including commission on the allotment of shares or other securities to a client, placement fee for arranging a loan between a borrower and an investor and sales commission, are recognized as revenue when the significant act has been completed.
The Group recognizes insurance income for the insurance premium paid of which the payment date arrived by the premium payment methods of the insurance contract; and recognizes advance receipts for the insurance premium paid of which the payment date has not arrived at the end of the reporting period.
Dividend income is recognized when the shareholder’s right to receive payment is established. Usually this is the
ex-dividend
date for equity securities. The Group provides compensation in various forms such as payment discounts and gifts.
| |
|
Revenue from Contracts with Customers |
The fair value of the consideration received or receivable in exchange for the initial transaction is allocated to the reward points (“points”) and the remainder of the fee income. The Group provides compensation in various forms such as payment discounts and free gifts. The consideration to be allocated to the points is estimated based on the fair value of the monetary benefits to be provided in consideration of the expected recovery rate of points awarded in accordance with the customer loyalty program and the expected time of recovery. Points for distribution through the cost paid by the customer is recognized by deducting from the revenue from fees.
Income tax expense comprises current and deferred tax. Current tax and deferred tax are recognized in profit or loss except to the extent that it relates to a business combination, or items recognized directly in equity or in other comprehensive income.
Current tax is the expected tax payable or receivable on the taxable profit or loss for the year, using tax rates enacted or substantively enacted at the end of the reporting period and any adjustment to tax payable in respect of previous years. The taxable profit is different from the accounting profit for the period since the
SHINHAN FINANCIAL GROUP CO., LTD. AND SUBSIDIARIES
Notes to the Consolidated Financial Statements
(In millions of won)
|
Significant accounting policies (continued) |
taxable profit is calculated excluding the temporary differences, which will be taxable or deductible in determining taxable profit (tax loss) of future periods, and
non-taxable
or
non-deductible
items from the accounting profit. The unpaid taxes related to the Group’s current tax are calculated using the enacted or substantially established tax rate.
Deferred tax is recognized, using the asset-liability method, in respect of temporary differences between the carrying values of assets and liabilities for financial reporting purposes and the amounts used for taxation purposes. A deferred tax liability is recognized for all taxable temporary differences. A deferred tax asset is recognized for all deductible temporary differences to the extent that it is probable that taxable profit will be available against which they can be utilized. However, deferred tax is not recognized for the following temporary differences: taxable temporary differences arising on the initial recognition of goodwill, or the initial recognition of assets or liabilities in a transaction that is not a business combination and that affects neither accounting profit or loss nor taxable income.
The Group applies a consolidated tax method based on a consolidated tax base and a domestic corporation (hereinafter referred to as the “Consolidated Entity Corporation “) that is fully controlled by the consolidated parent company and the consolidated tax base.
The Group evaluates the feasibility of temporary differences, taking into account the future taxable income of individual companies and consolidated groups, respectively. The change in deferred tax assets (liabilities) was recognized as expense (income), except for the amount associated with items directly added to the equity account.
For additional temporary differences in subsidiaries, associates, and joint venture investment interests, the Group may control the timing of the disappearance of temporary differences. All deferred tax liabilities are recognised except in cases where temporary differences are unlikely to dissipate in the foreseeable future. Deferred tax assets arising from deductible temporary differences are likely to be extinguished in the foreseeable future. In addition, it is recognised when taxable income is likely to be used for temporary differences.
The carrying value of deferred tax assets is reviewed at the end of each reporting period. The carrying value of deferred tax assets is reduced when it is no longer likely that sufficient taxable income will be generated to use benefits from deferred tax assets.
Deferred tax assets and liabilities are measured at the tax rates that are expected to apply to the period when the asset is realized or the liability is settled, based on tax rates (and tax laws) that have been enacted or substantively enacted by the end of the reporting period. The measurement of deferred tax liabilities and deferred tax assets reflects the tax consequences that would follow from the manner in which the Group expects, at the end of the reporting period to recover or settle the carrying value of its assets and liabilities.
Deferred tax assets and liabilities are corporate taxes imposed by the same taxation authority. Deferred tax assets and liabilities are offset only if there is a legally enforceable right to offset the related current tax liabilities and assets.
Because of the tax polices taken by the Group, tax uncertainties arise from the complexity of transactions and differences in tax law analysis. Also, it arises from a tax refund suit, tax investigation, or a refund suit against the tax authorities’ tax amount. The Group paid the tax amount by the tax authorities in accordance with IFRIC 23. However, it will be recognized as the corporate tax assets if there is a high possibility of a refund in the future. In addition, the amount expected to be paid as a result of the tax investigation is recognized as the tax liability.
SHINHAN FINANCIAL GROUP CO., LTD. AND SUBSIDIARIES
Notes to the Consolidated Financial Statements
(In millions of won)
|
Significant accounting policies (continued) |
| |
|
Accounting for trust accounts |
The Group accounts for trust accounts separately from its bank accounts under the Financial Investment Services and Capital Markets Act No. 114 and thus the trust accounts are not included in the accompanying consolidated financial statements. In this regard, the funds lent to the trust account are counted as trust account loans and loans borrowed from the trust account as other accounting accounts
(non-payment
of the trust account). In accordance with the Financial Investment Business Regulations, trust remuneration is acquired in connection with the operation, management, and disposal of trust property, and it is counted as the operating profit of trust business.
The Group presents basic and diluted earnings per share (EPS) data for its ordinary shares. Basic EPS is calculated by dividing the profit or loss attributable to the ordinary shareholder of the Group by the weighted average number of common shares outstanding during the period, adjusted for own shares held. Diluted EPS is determined by adjusting the profit or loss attributable to ordinary shareholders and the weighted average number of ordinary shares outstanding, adjusted for own shares held, for the effects of all dilutive potential ordinary shares, which comprise share options granted to employees.
| |
|
New standards and amendments not yet adopted by the Group |
The following new accounting standards and amendments have been published that are not mandatory for annual periods beginning after January 1, 2022, and have not been early adopted by the Group. The Group did not early apply the following new standards and amendments when preparing consolidated financial statements
i) IAS 1 ‘Presentation of Financial Statements’ amended – Classification of Liabilities as Current or
Non-current
The amendments clarify that liabilities are classified as either current or
non-current,
depending on the substantive rights that exist at the end of the reporting period. Classification is unaffected by the likelihood that an entity will exercise right to defer settlement of the liability or the expectations of management. Also, the settlement of liability includes the transfer of the entity’s own equity instruments, however, it would be excluded if an option to settle them by the entity’s own equity instruments if compound financial instruments is met the definition of equity instruments and recognized separately from the liability. The amendments should be applied for annual periods beginning on or after January 1, 2024, and earlier application is permitted. The Group expects that the amendments will not have a significant impact on the consolidated financial statements.
ii) IAS 1 ‘Presentation of Financial Statements’ amended—Disclosure of Accounting Policies
The amendments require an entity to define and to disclose its material information about accounting policies. The amendments should be applied for annual periods beginning on or after January 1, 2023, and earlier application is permitted. The Group expects that the amendments will not have a significant impact on the consolidated financial statements.
SHINHAN FINANCIAL GROUP CO., LTD. AND SUBSIDIARIES
Notes to the Consolidated Financial Statements
(In millions of won)
|
Significant accounting policies (continued) |
iii) IAS 8 ‘Accounting Policies, Changes in Accounting Estimates and Errors’ amended – Definition of Accounting Estimates
The amendments clarify the definition of accounting estimates and how distinguish it from a change in accounting policies. The amendments should be applied for annual periods beginning on or after January 1, 2023, and earlier application is permitted. The Group expects that the amendments will not have a significant impact on the consolidated financial statements.
iv) IAS 12 ‘Income Taxes’ – Deferred Tax Related to Assets and Liabilities Arising from a Single Transaction
Under the amendments, an entity does not apply the initial recognition exemption for transactions which involve the recognition of both an asset and liability – which in turn leads to equal taxable and deductible temporary differences. The amendments should be applied for annual periods beginning on or after January 1, 2023, and earlier application is permitted. The Group expects that the amendments will not have a significant impact on the consolidated financial statements.
v) IFRS 17 ‘Insurance Contracts’
| |
① |
Key amendments to accounting policies |
IFRS 17
issued in May 2017 will be applied for annual periods beginning on or after January 1, 2023. The standard will replace IFRS 4
which is the current standard.
The main features of IFRS 17 include measurement of the current value of insurance liabilities, recognition of insurance revenue on an accrual basis, and separate presentation of investment income from insurance performance. Under IFRS 4, insurance liability was measured using historical information (e.g., interest
rates at sale, etc.). In addition, when the entity receives the premium, it recognizes the premium received as an insurance revenue on a cash basis and there is no obligation to present insurance and investment income or expense separately. On the contrary, IFRS 17 measures insurance liability at its present value (i.e. at the reporting date) by using updated discount rates which reflect current market-based information such as assumptions and risks. An insurance revenue is recognized on an accrual basis, reflecting the services provided to the policyholder by the insurance company for each accounting periods. Moreover, insurance finance income or expenses and the investment income or expenses will be presented separately.
If the Group applies IFRS 17 in preparation of the financial statements, significant differences with current financial statements may arise due to the following reasons. These differences do not include all of the future differences and they may be changed depending on further analysis.
| |
② |
Evaluation of insurance liabilities |
Under IFRS 17, the Group estimates all cash flows under the insurance contract, then measures insurance liability by using discount rates that reflect assumptions and risks at the reporting date.
Specifically, the Group identifies a portfolio of insurance contracts which comprises contracts subject to similar risks and managed together and disaggregates the groups of insurance contracts with similar profitability within the portfolio. Then, the Group measures the groups of insurance contracts at the total of estimates of future cash flows (reflecting cash flows related to insurance contracts and the time value of money), risk adjustment and contractual service margin. Upon the application of IFRS 17, contractual service margin account has been newly introduced. The contractual service margin presents the unrealized profit that the Group will recognize as it provides services in the future.
SHINHAN FINANCIAL GROUP CO., LTD. AND SUBSIDIARIES
Notes to the Consolidated Financial Statements
|
Significant accounting policies (continued) |
Reinsurance contract is an insurance contract issued by one entity (the reinsurer) to compensate another entity for claims arising from one or more insurance contracts issued by that another entity (underlying insurance contracts). When estimating present value of future cash flows arising from reinsurance contracts, the Group would use assumptions consistent with those it uses for the underlying contracts.
The Group calculates the discount rate for measuring the current value of an insurance liability using the
bottom-up
approach, such as, by adding a liquidity premium to the risk-free rate of return (risk-free interest rate term structure) and the confidence level to calculate risk adjustment which reflects measurement of an uncertainty regarding the amount and timing of cash flows in a
non-financial
risk (insurance risk, cancellation risk, cost risk, etc.).
For insurance liability measurement models, the General Model (GM) is applied for underlying contracts, etc., but the Variable Fee Approach (VFA) is applied for insurance contracts that have direct participation features that meet certain requirements. However, Premium Allocation Approach (PAA) is applied for contracts with of one year or less coverage period.
| |
③ |
Recognition and measurement of financial performance |
According to IFRS 17, insurance revenue is recognized on an accrual basis including services (insurance coverage) provided to the policyholder for each accounting period. Investment components (such as cancellation or maturity refunds) being repaid to the policyholder even if an insured event does not occur, are excluded from insurance revenue. Insurance finance income or expenses and investment income or expenses are presented separately to enable information users to understand the sources of profits or losses.
The Group includes time value of money and financial risk, and the effect of changes in the time value of money and financial risk related to the groups of insurance contracts in the insurance finance income or expenses. This requires the Group to make an accounting policy choice as to whether to disaggregate insurance finance income or expenses for the period between profit or loss and other comprehensive income.
The Group disaggregates the amounts recognized in the statements of profit or loss and other comprehensive income by portfolios. In case of applying the ‘General Model (GM)’, insurance finance income or expenses are recognized in other comprehensive income.
| |
④ |
Accounting policies related to transition |
According to the transition of IFRS 17, the Group shall adjust the groups of insurance contracts issued before the transition date, that is measured at cost to be measured at its current value by applying a full retrospective approach, modified retrospective approach or fair value approach (January 1, 2022, the beginning of the annual reporting period immediately preceding the date of initial application).
In principle, the Group shall identify, recognize, and measure (full retrospective approach) each group of insurance contracts as if IFRS 17 had been applied even before the transition date. However, if this approach is impracticable, the Group may choose to apply either the modified retrospective approach or fair value approach. On the other hand, for groups of insurance contracts with direct participation features which meet certain criteria, a fair value approach may be applied even if the full retrospective approach is applicable.
The objective of the modified retrospective approach is to achieve the closest outcome to full retrospective application possible using reasonable and supportable information available without undue cost
or
effort.
SHINHAN FINANCIAL GROUP CO., LTD. AND SUBSIDIARIES
Notes to the Consolidated Financial Statements
|
Significant accounting policies (continued) |
The fair value approach is an approach of assessing a group of insurance contracts using fair value assessments, etc. in accordance with IFRS 13 ‘Fair Value Measurement’. To apply the fair value approach, the Group shall determine the contractual service margin or loss component of the liability for remaining coverage at the transition date as
the
difference between the fair value of a group of insurance contracts and the fulfilment cash flows measured at that date.
The Group applies modified retrospective approach only for underlying contracts issued within three years before the transition date, and fair value approach for other underlying contracts and reinsurance contracts held, to measure insurance liability at transition date.
|
⑤ |
Preparation for application |
The Group has completed setting up actuarial assumptions and models and insurance liability settlement system. Before 2023, when the standard is first applied, the Group is planning to continue fostering and reinforcing additional professionals and will constantly promote advancement, including improvements on system stability and verification of the consistency of data output. Also, the Group is being overhauled and established an Internal Control of Financial Reporting that goes along with the dynamic accounting environment in order to prepare and disclose reliable accounting information.
The application of IFRS 17 will not only result to a change in accounting standards, but will also affect insurance product development, sales strategies, and long-term management strategies. Therefore, with the aim of
re-establishment
of the overall business management system, the Group will continue to provide training to the employees and report to the management the status and implementation plan of IFRS 17.
| |
⑥ |
Financial effects analysis |
As the implementation of IFRS 17 results to changes in the measurement of liabilities, revenue recognition, etc., the Group expects that it will lead to a volatility in financial figures of financial statements prepared for the year ended 2023.
The Group’s assessment of financial impact of the initial application of IFRS 17 using the current financial reporting system established as of December 31, 2022, for the financial statements prepared for the year ended 2022 are as follows. However, at this point, it is difficult in practice to provide reasonable estimates of the impact on future financial statements, as sufficient review and analysis of accounting policies and actuarial assumptions and methodology for the application of IFRS 17 is still in progress. Therefore, the results on analysis are subject to change depending on additional information and economic conditions available in the future.
(i) Impact on the statement of financial position and the statement of comprehensive income
The Group classifies financial assets according to its business model by introducing
, but it will change its classification and measurement for capital volatility management through market valuation of insurance liabilities as it allows revaluation of the business model when introducing
IFRS 17 ‘Insurance Contracts’
in 2023.
Accordingly, the group assessed the preliminary financial impact by applying the classification adjustments in IFRS 17 to financial assets removed between the transition date and the initial application date to present comparative information for financial assets whose classification and measurement requirements in IFRS 9 have been changed through business model revaluation. [Shinhan Life Insurance Co., Ltd.]
SHINHAN FINANCIAL GROUP CO., LTD. AND SUBSIDIARIES
Notes to the Consolidated Financial Statements
|
Significant accounting policies (continued) |
<Statement of Financial Position>
The statement of financial position prepared in accordance with IFRS 4 and IFRS 17 as at December 31, 2022 are as follows:
|
|
|
|
|
|
|
|
|
|
|
|
|
|
|
| |
|
|
|
|
|
|
|
|
|
|
|
| |
|
|
66,753,920 |
|
|
|
|
|
56,501,131 |
|
|
|
(10,252,789 |
) |
| Cash and due from banks at amortized cost |
|
|
1,112,577 |
|
|
Cash and due from banks at amortized cost |
|
|
1,653,704 |
|
|
|
|
|
| Financial assets at fair value through profit or loss |
|
|
6,662,617 |
|
|
Financial assets at fair value through profit or loss |
|
|
11,527,229 |
|
|
|
|
|
| Securities at fair value through other comprehensive income |
|
|
10,946,361 |
|
|
Securities at fair value through other comprehensive income |
|
|
32,753,803 |
|
|
|
|
|
| Securities at amortized cost |
|
|
27,744,212 |
|
|
Securities at amortized cost |
|
|
4,338,766 |
|
|
|
|
|
| Loans at amortized cost |
|
|
8,612,410 |
|
|
Loans at amortized cost |
|
|
4,219,870 |
|
|
|
|
|
| Reinsurance contract assets |
|
|
295,621 |
|
|
Reinsurance contract assets |
|
|
59,017 |
|
|
|
|
|
| Other assets |
|
|
11,380,122 |
|
|
Other assets |
|
|
1,948,742 |
|
|
|
|
|
| |
|
|
63,271,167 |
|
|
|
|
|
48,414,409 |
|
|
|
(14,856,758 |
) |
| Insurance contract liabilities |
|
|
53,369,918 |
|
|
Insurance contract liabilities |
|
|
42,928,691 |
|
|
|
|
|
| |
|
|
|
|
|
Reinsurance contract liabilities |
|
|
62,770 |
|
|
|
|
|
| |
|
|
|
|
|
Investment contract liabilities |
|
|
2,296,401 |
|
|
|
|
|
| Other liabilities |
|
|
9,901,249 |
|
|
Other liabilities |
|
|
3,126,547 |
|
|
|
|
|
| |
|
|
3,482,753 |
|
|
|
|
|
8,086,722 |
|
|
|
4,603,969 |
|
| |
(*1) |
The amounts applied under IFRS 9 ‘Financial Instruments’ and IFRS 4 ‘Insurance Contracts’ (Application of the overlay approach under to financial assets related to insurance contracts). |
| |
(*2) |
The amounts applied under IFRS 9 ‘Financial Instruments’ and IFRS 17 ‘Insurance Contracts’ . |
SHINHAN FINANCIAL GROUP CO., LTD. AND SUBSIDIARIES
Notes to the Consolidated Financial Statements
(In millions of won)
|
Significant accounting policies (continued) |
<Statement of Comprehensive Income>
The statement of comprehensive income prepared in accordance with IFRS 4 and IFRS 17 for the year ended December 31, 2022 are as follows:
|
|
|
|
|
|
|
|
|
|
|
|
|
|
|
| |
|
|
|
|
|
|
|
|
|
|
|
| Operating income |
|
|
9,412,664 |
|
|
Insurance service result |
|
|
733,320 |
|
|
|
|
|
|
|
|
|
|
|
Insurance service revenue |
|
|
760,665 |
|
|
|
|
|
|
|
|
|
|
|
Net reinsurance service expenses |
|
|
(27,345 |
) |
|
|
|
|
| Operating expenses |
|
|
(8,796,865 |
) |
|
Net financial result |
|
|
(182,741 |
) |
|
|
|
|
|
|
|
|
|
|
Investment income |
|
|
588,729 |
|
|
|
|
|
|
|
|
|
|
|
Insurance finance expenses |
|
|
(771,470 |
) |
|
|
|
|
| Operating profit |
|
|
615,799 |
|
|
Operating profit |
|
|
550,579 |
|
|
|
(65,220 |
) |
Non-operating income or expenses |
|
|
(17,562 |
) |
|
Non-operating income |
|
|
(17,673 |
) |
|
|
|
|
| Profit before income taxes |
|
|
598,237 |
|
|
Profit before income taxes |
|
|
532,906 |
|
|
|
(65,331 |
) |
| Income tax expense |
|
|
(134,644 |
) |
|
Income tax expense |
|
|
(117,331 |
) |
|
|
|
|
| Profit for the year |
|
|
463,593 |
|
|
Profit for the year |
|
|
415,575 |
|
|
|
(48,018 |
) |
| Other comprehensive loss for the year |
|
|
(2,122,609 |
) |
|
Other comprehensive loss for the year |
|
|
(592,441 |
) |
|
|
|
|
| Total comprehensive loss for the year |
|
|
(1,659,016 |
) |
|
Total comprehensive loss for the year |
|
|
(176,866 |
) |
|
|
1,482,150 |
|
| |
(*1) |
The amounts applied under IFRS 9 ‘Financial Instruments’ and IFRS 4 ‘Insurance Contracts’ (Application of the overlay approach under to financial assets related to insurance contracts). |
| |
(*2) |
The amounts applied under IFRS 9 ‘Financial Instruments’ and IFRS 17 ‘Insurance Contracts’ . |
<Statement of Cash Flows>
The statement of cash flows prepared in accordance with IFRS 4 and IFRS 17 for the year ended December 31, 2022 are as follows:
|
|
|
|
|
|
|
|
|
|
|
|
|
| |
|
|
|
|
|
|
|
|
|
| Cash flows from operating activities |
|
|
(931,218 |
) |
|
|
(1,337,223 |
) |
|
|
(406,005 |
) |
| Cash flows from investing activities |
|
|
288,321 |
|
|
|
623,849 |
|
|
|
335,528 |
|
| Cash flows from financing activities |
|
|
(42,340 |
) |
|
|
(42,340 |
) |
|
|
— |
|
| |
(*1) |
The amounts applied under IFRS 9 ‘Financial Instruments’ and IFRS 4 ‘Insurance Contracts’ (Application of the overlay approach under IFRS 4 to financial assets related to insurance contracts). |
| |
(*2) |
The amounts applied under IFRS 9 ‘Financial Instruments’ and IFRS 17 ‘Insurance Contracts’ . |
SHINHAN FINANCIAL GROUP CO., LTD. AND SUBSIDIARIES
Notes to the Consolidated Financial Statements
(In millions of won)
|
Significant accounting policies (continued) |
[Shinhan EZ General Insurance, Ltd.]
<Statement of Financial Position>
The statement of financial position prepared in accordance with IFRS 4 and IFRS 17 as at December 31, 2022 are as follows:
|
|
|
|
|
|
|
|
|
|
|
|
|
|
|
| |
|
|
|
|
|
|
|
|
|
|
|
| |
|
|
241,096 |
|
|
|
|
|
222,971 |
|
|
|
(18,125 |
) |
| Cash and due from banks at
amortized cost |
|
|
133,996 |
|
|
Cash and due from banks at amortized cost |
|
|
133,996 |
|
|
|
|
|
| Securities at fair value through other comprehensive income |
|
|
9,876 |
|
|
Securities at fair value through other comprehensive income |
|
|
9,876 |
|
|
|
|
|
| Securities at amortized cost |
|
|
40,016 |
|
|
Securities at amortized cost |
|
|
40,016 |
|
|
|
|
|
| Reinsurance contract assets |
|
|
35,748 |
|
|
Reinsurance contract assets |
|
|
24,713 |
|
|
|
|
|
| Other assets |
|
|
21,460 |
|
|
Other assets |
|
|
14,370 |
|
|
|
|
|
| |
|
|
115,448 |
|
|
|
|
|
85,520 |
|
|
|
(29,928 |
) |
| Insurance contract liabilities |
|
|
93,885 |
|
|
Insurance contract liabilities |
|
|
75,318 |
|
|
|
|
|
|
|
|
|
|
|
Reinsurance contract liabilities |
|
|
— |
|
|
|
|
|
|
|
|
|
|
|
Investment contract liabilities |
|
|
— |
|
|
|
|
|
| Other liabilities |
|
|
21,563 |
|
|
Other liabilities |
|
|
10,202 |
|
|
|
|
|
| |
|
|
125,648 |
|
|
|
|
|
137,451 |
|
|
|
11,803 |
|
| |
(*1) |
The amounts applied under IFRS 9 ‘Financial Instruments’ and IFRS 4 ‘Insurance Contracts’ . |
| |
(*2) |
The amounts applied under IFRS 9 ‘Financial Instruments’ and IFRS 17 ‘Insurance Contracts’ . |
SHINHAN FINANCIAL GROUP CO., LTD. AND SUBSIDIARIES
Notes to the Consolidated Financial Statements
(In millions of won)
|
Significant accounting policies (continued) |
(i) Impact on the statement of financial position and the statement of comprehensive income
<Statement of Comprehensive Income>
The statement of comprehensive income prepared in accordance with IFRS 4 and IFRS 17 for the year ended December 31, 2022 are as follows:
|
|
|
|
|
|
|
|
|
|
|
|
|
|
|
| |
|
|
|
|
|
|
|
|
|
|
|
| Operating income |
|
|
71,210 |
|
|
Insurance service result |
|
|
(11,060 |
) |
|
|
|
|
|
|
|
|
|
|
Insurance service revenue |
|
|
(7,977 |
) |
|
|
|
|
|
|
|
|
|
|
Net reinsurance service expenses |
|
|
(3,083 |
) |
|
|
|
|
| Operating expenses |
|
|
(86,452 |
) |
|
Net financial result |
|
|
1,490 |
|
|
|
|
|
|
|
|
|
|
|
Investment income |
|
|
2,181 |
|
|
|
|
|
|
|
|
|
|
|
Insurance finance expenses |
|
|
(691 |
) |
|
|
|
|
| Operating profit |
|
|
(15,242 |
) |
|
Operating profit |
|
|
(9,570 |
) |
|
|
5,672 |
|
| |
|
|
212 |
|
|
Non-operating income |
|
|
212 |
|
|
|
|
|
| Profit before income taxes |
|
|
(15,030 |
) |
|
Profit before income taxes |
|
|
(9,358 |
) |
|
|
5,672 |
|
| Income tax expense |
|
|
— |
|
|
Income tax expense |
|
|
— |
|
|
|
|
|
| Profit for the year |
|
|
(15,030 |
) |
|
Profit for the year |
|
|
(9,358 |
) |
|
|
5,672 |
|
| Other comprehensive income for the year |
|
|
208 |
|
|
Other comprehensive income for the year |
|
|
225 |
|
|
|
|
|
| Total comprehensive loss for the year |
|
|
(14,822 |
) |
|
Total comprehensive loss for the year |
|
|
(9,133 |
) |
|
|
5,689 |
|
| |
(*1) |
The amounts applied under IFRS 9 ‘Financial Instruments’ and IFRS 4 ‘Insurance Contracts’ . |
| |
(*2) |
The amounts applied under IFRS 9 ‘Financial Instruments’ and IFRS 17 ‘Insurance Contracts’ . |
<Statement of Cash Flows>
The statement of cash flows prepared in accordance with IFRS 4 and IFRS 17 for the year ended December 31, 2022 are as follows:
|
|
|
|
|
|
|
|
|
|
|
|
|
| |
|
|
|
|
|
|
|
|
|
| Cash flows from operating activities |
|
|
9,331 |
|
|
|
9,331 |
|
|
|
— |
|
| Cash flows from investing activities |
|
|
(59,056 |
) |
|
|
(59,056 |
) |
|
|
— |
|
| Cash flows from financing activities |
|
|
(79,183 |
) |
|
|
(79,183 |
) |
|
|
— |
|
| |
(*1) |
The amounts applied under IFRS 9 ‘Financial Instruments’ and IFRS 4 ‘Insurance Contracts’ . |
| |
(*2) |
The amounts applied under IFRS 9 ‘Financial Instruments’ and IFRS 17 ‘Insurance Contracts’ |
SHINHAN FINANCIAL GROUP CO., LTD. AND SUBSIDIARIES
Notes to the Consolidated Financial Statements
(In millions of won)
|
Significant accounting policies (continued) |
(ii) Financial impact of transition to IFRS 17
As of the transition date (January 1, 2022), the measurement of liability for underlying contracts held, using different transition approaches is as follows:
[Shinhan Life Insurance Co., Ltd.]
|
|
|
|
|
|
|
|
|
|
|
|
|
| |
|
Date issued - insurance contract |
|
|
|
|
|
|
|
| Modified retrospective approach |
|
|
2019 – 2021 |
|
|
|
1,437,967 |
|
|
|
2,734,701 |
|
| Fair value approach |
|
|
Before 2018 |
|
|
|
49,184,220 |
|
|
|
3,753,602 |
|
|
|
|
|
|
|
|
|
|
|
|
|
|
|
|
|
|
|
|
|
50,622,187 |
|
|
|
6,488,303 |
|
|
|
|
|
|
|
|
|
|
|
|
|
|
As of the transition date (January 1, 2022), the amount of reinsurance contracts held calculated by applying the fair value approach is
W
281,763 million of reinsurance contract liabilities.
[Shinhan EZ General Insurance, Ltd.]
|
|
|
|
|
|
|
|
|
|
|
| |
|
Date issued - insurance contract |
|
|
|
|
|
|
| Modified retrospective approach |
|
2019 – 2021 |
|
|
47,331 |
|
|
|
100 |
|
As of the transition date (January 1, 2022), the amount of reinsurance contracts held calculated by applying the fair value approach is
W
13,025 million of reinsurance contract liabilities.
(iii) Financial impact on insurance assets and liabilities
As of December 31, 2022, the amount of insurance contract liabilities applying IFRS 17 is as follows:
[Shinhan Life Insurance Co., Ltd.]
|
|
|
|
|
|
|
|
|
|
|
|
|
|
|
|
|
| |
|
|
|
|
|
|
|
|
|
|
|
|
| Underlying contracts |
|
|
42,928,691 |
|
|
|
6,924,913 |
|
|
|
— |
|
|
|
— |
|
| Reinsurance contracts |
|
|
62,770 |
|
|
|
(83,185 |
) |
|
|
59,017 |
|
|
|
94,861 |
|
|
|
|
|
|
|
|
|
|
|
|
|
|
|
|
|
|
|
|
|
42,991,461 |
|
|
|
6,841,728 |
|
|
|
59,017 |
|
|
|
94,861 |
|
|
|
|
|
|
|
|
|
|
|
|
|
|
|
|
|
|
[Shinhan EZ General Insurance, Ltd.]
|
|
|
|
|
|
|
|
|
|
|
|
|
|
|
|
|
| |
|
|
|
|
|
|
|
|
|
|
|
|
| Underlying contracts |
|
|
75,318 |
|
|
|
— |
|
|
|
519 |
|
|
|
(94 |
) |
| Reinsurance contracts |
|
|
— |
|
|
|
— |
|
|
|
24,713 |
|
|
|
— |
|
|
|
|
|
|
|
|
|
|
|
|
|
|
|
|
|
|
|
|
|
75,318 |
|
|
|
— |
|
|
|
25,232 |
|
|
|
(94 |
) |
|
|
|
|
|
|
|
|
|
|
|
|
|
|
|
|
|
SHINHAN FINANCIAL GROUP CO., LTD. AND SUBSIDIARIES
Notes to the Consolidated Financial Statements
(In millions of won)
|
Financial risk management |
(a) Overview
Shinhan Financial Group Co., Ltd. (collectively the “Group”) manages various risks that may be arisen by each business sector and the major risks to which the Group is exposed include credit risk, market risk, interest rate risk, and liquidity risk. These risks are recognized, measured, controlled and reported in accordance with risk management guidelines established at the controlling company level and at the subsidiary level.
i) Risk management principles
The risk management principles of the Group are as follows:
| |
• |
|
All business activities take into account the balance of risks and profits within a predetermined risk trend. |
| |
• |
|
The controlling company shall present the Group Risk Management Model Standards and supervise their compliance, and have responsibility and authority for group-level monitoring. |
| |
• |
|
Operate a risk-related decision-making system that enhances management’s involvement. |
| |
• |
|
Organize and operate risk management organizations independent of the business sector. |
| |
• |
|
Operate a performance management system that clearly considers risks when making business decisions. |
| |
• |
|
Aim for preemptive and practical risk management functions. |
| |
• |
|
Share a cautious view to prepare for possible deterioration of the situation. |
ii) Risk management organization
The basic policies and strategies for risk management of the Group are established by the Risk Management Committee (collectively the “Group Risk Management Committee”) within the controlling company’s Board of Directors. The Group’s Chief Risk Management Officer (CRO) assists the Group Risk Management Committee and consults the risk policies and strategies of the group and each subsidiary through the Group Risk Council, which includes the
of each subsidiary. The subsidiary implements the risk policies and strategies of the Group through each company’s risk management committee, risk-related committee, and risk management organization, and consistently establishes and implements the detailed risk policies and strategies of the subsidiary. The risk management team of the controlling company assists the Group’s chief risk management officer for risk management and supervision.
Shinhan Financial Group has a hierarchical limit system to manage the risks of the Group to an appropriate level. The Group Risk Management Committee sets the risk limits that can be assumed by the Group and its subsidiaries, while the Risk Management Committee and the Committee of each subsidiary set and manage detailed risk limits by risk, department, desk and product types.
| |
① |
Group Risk Management Committee |
The Group established the risk management system for the Group and each of its subsidiaries, and comprehensively manages group risk-related matters such as establishing risk policies, limits, and approvals. The Committee consists of directors of the Group.
SHINHAN FINANCIAL GROUP CO., LTD. AND SUBSIDIARIES
Notes to the Consolidated Financial Statements
(In millions of won)
|
Financial risk management (continued) |
The resolution of the Committee is as follows:
| |
• |
|
Establish risk management basic policy in line with management strategy |
| |
• |
|
Determine the level of risk that can be assumed by the Group and each subsidiary |
| |
• |
|
Approve appropriate investment limit or loss allowance limit |
| |
• |
|
Enact and amend the Group Risk Management Regulations and the Group Risk Council Regulations |
| |
• |
|
Matters concerning risk management organization structure and division of duties |
| |
• |
|
Matters concerning the operation of the risk management system |
| |
• |
|
Matters concerning the establishment of various limits and approval of limits |
| |
• |
|
Make decisions on approval of the FSS’s internal rating law for non-retail and retail credit rating systems |
| |
• |
|
Matters concerning risk disclosure policy |
| |
• |
|
Analysis of crisis situation, related capital management plan and financing plan |
| |
• |
|
Matters deemed necessary by the board of directors |
| |
• |
|
Materials required by external regulations such as the Financial Services Commission and other regulations and guidelines |
| |
• |
|
Matters deemed necessary by the Chairman |
The resolution of the Group Risk Management Committee is reported to the Board of Directors.
| |
② |
Group Risk Management Council |
In order to maintain the Group’s risk policy and strategy consistently, the Group decides what is necessary to discuss the risks of the Group and to carry out the policies set by the Group Risk Management Committee. The members are chaired by the group’s risk management officer and consist of the risk management officers of major subsidiaries.
iii) Group Risk Management System
| |
① |
Management of the risk capital |
Risk capital refers to the capital required to compensate for the potential loss (risk) if it is actually realized. Risk capital management refers to the management of the risk assets considering its risk appetite, which is a datum point on the level of risk burden compared to available capital, so as to maintain the risk capital at an appropriate level. The Group and subsidiaries establish and operate a risk planning process to reflect the risk plan in advance when establishing financial and business plans for risk capital management, and establish a risk limit management system to control risk to an appropriate level.
In order to proactively manage risks by periodically identifying risk factors that can affect the group’s business environment, the Group has established a multi-dimensional risk monitoring system. Each
SHINHAN FINANCIAL GROUP CO., LTD. AND SUBSIDIARIES
Notes to the Consolidated Financial Statements
(In millions of won)
|
Financial risk management (continued) |
subsidiary is required to report to the Group on key issues that affect risk management at the group level. The Group prepares weekly, monthly and occasional monitoring reports to report to Group management including the CRO.
In addition, the Risk Dash Board is operated to derive abnormal symptoms through three-dimensional monitoring of major portfolios, increased risks, and external environmental changes of assets for each subsidiary. If necessary, the Group takes preemptive risk management to establish and implement countermeasures.
When conducting new product new business and major policy changes, risk factors are reviewed by using a
pre-defined
checklist to prevent indiscriminate promotion of business that is not easy to judge risk and to support rational decision making. The subsidiary’s risk management department conducts a preliminary review and post-monitoring process on products, services, and projects to be pursued in the business division. In case of matters that are linked or jointly promoted with other subsidiaries, the risk reviews are carried out after prior-consultation with the risk management department of the Group.
The Group maintains a group wide risk management system to detect the signals of any risk crisis preemptively and, in the event of a crisis actually happening, to respond on a timely, efficient and flexible basis so as to ensure the Group’s survival as a going concern. Each subsidiary maintains crisis planning for three levels of contingencies, namely, ‘alert’, ‘imminent crisis’ and ‘crisis’ determination of which is made based on quantitative and qualitative monitoring and consequence analysis, and upon the happening of any such contingency, is required to respond according to a prescribed contingency plan. At the controlling company level, the Group maintains and installs crisis detection and response system which is applied consistently group-wide, and upon the happening of any contingency at two or more subsidiary level, the Group directly takes charge of the situation so that the Group manages it on a concerted group wide basis.
Credit risk is the risk of potential economic loss that may be caused if a customer or counterparty to a financial instrument fails to meet its contractual obligations, and is the largest risk which the Group is facing. The Group’s credit risk management encompasses all areas of credit that may result in potential economic loss, including not just transactions that are recorded on balance sheets, but also
off-balance-sheet
transactions such as guarantees, loan commitments and derivative transactions.
Shinhan Bank’s basic policy on credit risk management is determined by the Risk Policy Committee. The Risk Policy Committee consists of the chairman of the CRO, the Chief Credit Officer (CCO), the head of the business group, and the head of the risk management department, and decides the credit risk management plan and the direction of the loan policy for the entire bank. Apart from the Risk Policy Committee, the Credit Review Committee is established to separate credit monitoring, such as large loans and limit approval, and is composed of chairman, the CCO, CRO and the head of the group in charge of the credit-related business group, the head of the credit planning department, and the senior examination team to enhance the credit quality of the loan and profitability of operation.
Shinhan Bank’s credit risk management includes processes such as credit evaluation, credit monitoring, and credit supervision, and credit risk measurement of counterparties and limit management processes and credit
F-52
SHINHAN FINANCIAL GROUP CO., LTD. AND SUBSIDIARIES
Notes to the Consolidated Financial Statements
(In millions of won)
|
Financial risk management (continued) |
risk measurements for portfolios. All loan customers of Shinhan Bank are evaluated and managed with credit ratings. Retail customers are evaluated by summing up the information of personal information the bank’s internal information and external credit information, and the corporate customers are evaluated by considering financial and
non-financial
items such as industrial risk, operating risk, and management risk. The evaluated credit rating is used for credit approval, limit management, pricing, credit loss provisioning, etc., and is the basis for credit risk management. The credit evaluation system is divided into an evaluation system for retail customers, a SOHO evaluation system, and an evaluation system for corporate customers. It is subdivided and refined by each model to reflect the Basel III requirements. The corporate credit decision is based on a collective decision-making system, making objective and prudent decisions. In the case of a general credit of loans, the credit is approved based on the consultation between branch’s RM (Relationship Manager) and loan officers of each business division’s headquarters. In the case of a large or important credit, the credit is approved by the review council. In particular, the Credit Deliberation Committee, the highest decision-making body of the loan, reviews for important loans such as large loans. Credits for retail customers are monitored by an automated credit scoring systems (CSS) based on objective statistical methods and bank credit policies.
The Bank operates a regular monitoring system for the regular management of individual loans. The loan officers and RM evaluate the adequacy of the result of the loan review by automatically searching for anticipated insolvent companies among business loan partners, and if necessary, the credit rating of the corporate is requested of an adjustment. In accordance with these procedures, the corporate customers are classified as an early warning company, an observation company, and a normal company, and then are managed differently according to the management guidelines for each risk stage, thereby preventing the insolvency of the loan at an early stage. The financial analysis support system affiliated with a professional credit rating agency supports credit screening and management, and the credit planning department calculates and manages industrial grades, and analyzes and provides industry trends and company information. In order to control the credit risk for the credit portfolio to an appropriate level, credit VaR limits are set and managed for each business and business sector, and to prepare for the credit risk caused by biased exposure to specific sectors, the Group sets and manages exposure limits for each sector by the party, industry, country, etc.
Shinhan Card’s basic policy on credit risk is determined by the Risk Management Committee. The Risk Management Committee consists of the Risk Management Officer (CRO) as the chairperson, and is composed of the heads of each business division and supporting division, and the heads of related departments. Apart from the RMC, a credit committee in charge of monitoring corporate credits and other important credits over a certain amount has been established to separate credit policy decisions from credit monitoring.
Shinhan Card’s credit rating system is divided into ASS(Application Scoring System) and BSS(Behavior Scoring System). Unless a customer fall under “rejections due to policy” (such circumstances include delinquency of other credit card companies) and his/her credit rating is above a certain rate, an application of AS is approved. There is a separate screening criterion for credit card customers, who has maintained its relationship with Shinhan Financial Group for a long-term and has a good credit history. In addition, the elements of credit ratings are used as the basis for setting limits when issuing cards. The BSS, which is recalculated monthly, predicts the delinquency probability of cardholders, and utilizes it to monitor members and monitor portfolio risk.
F-53
SHINHAN FINANCIAL GROUP CO., LTD. AND SUBSIDIARIES
Notes to the Consolidated Financial Statements
(In millions of won)
|
Financial risk management (continued) |
i) Techniques, assumptions and input variables used to measure impairment
i-1)
Determining significant increases in credit risk since initial recognition
At the end of each reporting period, the Group assesses whether the credit risk on a financial instrument has increased significantly since initial recognition. When making the assessment, the Group uses the change in the risk of a default occurring over the expected life of the financial instrument instead of the change in the amount of expected credit losses.
To make the assessment, the Group compares the risk of a default occurring on the financial instrument as at the reporting date with the risk of a default occurring on the financial instrument as at the date of initial recognition and considers reasonable and supportable information, that is available without undue cost or effort, and is indicative of significant increases in credit risk since initial recognition. Information includes the default experience data held by the Group and analysis by an internal credit rating expert.
Measuring the risk of default
The Group assigns an internal credit risk rating to each individual exposure based on observable data and historical experiences that have been found to have a reasonable correlation with the risk of default. The internal credit risk rating is determined by considering both qualitative and quantitative factors that indicate the risk of default, which may vary depending on the nature of the exposure and the type of borrower.
Measuring term structure of probability of default
Internal credit risk rating is the main variable inputs to determine the duration structure for the risk of default. The Group accumulates information after analyzing the information regarding exposure to credit risk and default information by the type of product and borrower and results of internal credit risk assessment. For some portfolios, the Group uses information obtained from external credit rating agencies when performing these analyses.
The Group applies statistical techniques to estimate the probability of default for the remaining life of the exposure from the accumulated data and to estimate changes in the estimated probability of default over time.
F-54
SHINHAN FINANCIAL GROUP CO., LTD. AND SUBSIDIARIES
Notes to the Consolidated Financial Statements
(In millions of won)
|
Financial risk management (continued) |
Significant increases in credit risk
The Group uses the indicators defined as per portfolio to determine the significant increase in credit risk and such indicators generally consist of changes in the risk of default estimated from changes in the internal credit risk rating, qualitative factors, days of delinquency, and others. The method used to determine whether credit risk of financial instruments has significantly increased after the initial recognitions is summarized as follows:
|
|
|
|
|
|
|
|
|
|
| Significant change in credit ratings |
|
Significant change in credit ratings |
|
Significant change in credit ratings |
| |
|
|
| Continued past due more than 30 days |
|
Continued past due more than 30 days |
|
Continued past due more than 7 days(personal card) |
| |
|
|
| Loan classification of precautionary or below |
|
Loan classification of precautionary or below |
|
Loan classification of precautionary or below |
| |
|
|
| Borrower with early warning signals |
|
Borrower with early warning signals |
|
Specific delinquent pool segment |
| |
|
|
| Negative net assets |
|
Specific pool segment |
|
|
| |
|
|
| Adverse audit opinion or disclaimer of opinion |
|
Collective loans for housing for which the constructors are insolvent |
|
|
| |
|
|
| Interest coverage ratio below 1 for a consecutive period of three years or negative cash flows from operating activities for a consecutive period of two years |
|
Loans with identified indicators for significant increases in other credit risk |
|
|
| |
|
|
| Loans with identified indicators for significant increases in other credit risk |
|
|
|
|
The Group assumes that the credit risk of the financial instrument has been increased significantly since initial recognition if a specific exposure is past due more than 30 days (except, for a specific portfolio if it is past due more than 7 days). The Group counts the number of days past due from the earliest date on which the Group fails to fully receive the contractual payments from the borrower, and does not take into account the grace period granted to the borrower.
The Group regularly reviews the criteria for determining if there have been significant increases in credit risk from the following perspective:
| |
• |
|
A significant increase in credit risk shall be identified prior to the occurrence of default. |
| |
• |
|
The criteria established to judge the significant increase in credit risk shall have a more predictive power than the criteria for days of delinquency. |
i-2)
Modified financial assets
If the contractual cash flows on a financial asset have been modified through renegotiation and the financial asset is not derecognized, the Group assesses whether there has been a significant increase in the credit risk
F-55
SHINHAN FINANCIAL GROUP CO., LTD. AND SUBSIDIARIES
Notes to the Consolidated Financial Statements
(In millions of won)
|
Financial risk management (continued) |
of the financial instrument by comparing the risk of a default occurring at initial recognition based on the original, unmodified contractual terms and the risk of a default occurring at the reporting date based on the modified contractual terms.
The Group may adjust the contractual cash flows of loans to customers who are in financial difficulties in order to manage the risk of default and enhance the collectability (hereinafter referred to as ‘debt restructuring’). These adjustments generally involve extension of maturity, changes in interest payment schedule, and changes in other contractual terms.
Debt restructuring is a qualitative indicator of a significant increase in credit risk and the Group recognizes lifetime expected credit losses for the exposure expected to be the subject of such adjustments. If a borrower faithfully makes payments of contractual cash flows that are modified in accordance with the debt restructuring or if the borrower’s internal credit rating has recovered to the level prior to the recognition of the lifetime expected credit losses, the Group recognizes the
12-month
expected credit losses for that exposure again.
The Group considers a financial asset to be in default if it meets one or more of the following conditions:
| |
• |
|
If a borrower is overdue 90 days or more from the contractual payment date, |
| |
• |
|
If the Group judges that it is not possible to recover principal and interest without enforcing the collateral on a financial asset |
The Group uses the following indicators when determining whether a borrower is in default:
| |
• |
|
Qualitative factors (e.g. breach of contractual terms), |
| |
• |
|
Quantitative factors (e.g. if the same borrower does not perform more than one payment obligations to the Group, the number of days past due per payment obligation. However, in the case of a specific portfolio, the Group uses the number of days past due for each financial instrument), |
| |
• |
|
Internal observation data and external data |
The definition of default applied by the Group generally conforms to the definition of default defined for regulatory capital management purposes; however, depending on the situations, the information used to determine whether a default has occurred and the extent thereof may vary.
i-4)
Reflection of forward-looking information
The Group reflects future forward-looking information presented by a group of internal experts based on various information when measuring expected credit losses. The Group utilizes economic forecasts disclosed by domestic and foreign research institutes, governments, and public institutions to predict forward-looking information.
The Group reflects future macroeconomic conditions anticipated from a neutral standpoint that is free from bias in measuring expected credit losses. Expected credit losses in this respect reflect conditions that are most likely to occur and are based on the same assumptions that the Group used in its business plan and management strategy.
The Group analyzed the data experienced in the past, derived correlations between major macroeconomic variables and credit risks required for predicting credit risk and credit loss for each portfolio, and then
SHINHAN FINANCIAL GROUP CO., LTD. AND SUBSIDIARIES
Notes to the Consolidated Financial Statements
(In millions of won)
|
Financial risk management (continued) |
reflected future forecast information through regression estimation. To reflect the
COVID-1
9
economic situation, the Group has reviewed the 3 scenarios of upside, central and downside to reflect the final forward-looking information. For the years ended December 31, 2021 and 2022, macroeconomic variables used by the Group are as follows for each scenario.
<December, 31, 2021>
① Upside scenario
|
|
|
|
|
|
|
|
|
|
|
|
|
|
|
|
|
|
|
|
|
|
|
|
|
| |
|
Correlation
between
credit risks |
|
|
|
|
|
|
|
|
|
|
|
|
|
|
|
|
|
|
|
|
|
|
|
|
|
|
|
|
|
|
|
|
|
|
|
|
|
|
|
|
|
|
|
|
| GDP growth rate(YoY %) |
|
|
(-) |
|
|
|
4.1 |
|
|
|
3.0 |
|
|
|
3.1 |
|
|
|
3.8 |
|
|
|
3.7 |
|
| Private consumption index(YoY %) |
|
|
(-) |
|
|
|
6.3 |
|
|
|
5.1 |
|
|
|
2.5 |
|
|
|
3.7 |
|
|
|
3.8 |
|
| Facility investment growth rate(YoY %) |
|
|
(-) |
|
|
|
4.1 |
|
|
|
0.5 |
|
|
|
1.2 |
|
|
|
5.0 |
|
|
|
5.1 |
|
| Consumer price index growth rate(%) |
|
|
(-) |
|
|
|
3.6 |
|
|
|
2.6 |
|
|
|
2.4 |
|
|
|
2.0 |
|
|
|
2.0 |
|
Balance on current account( million dollars) |
|
|
(-) |
|
|
|
202.0 |
|
|
|
230.0 |
|
|
|
200.0 |
|
|
|
220.0 |
|
|
|
230.0 |
|
| Government bond 3y yields(%) |
|
|
— |
|
|
|
1.87 |
|
|
|
1.90 |
|
|
|
1.90 |
|
|
|
2.00 |
|
|
|
2.00 |
|
| ② Central scenario |
|
|
|
|
|
|
|
|
|
|
|
|
|
|
|
|
|
|
|
|
|
|
|
|
| |
|
Correlation
between
credit risks |
|
|
|
|
|
|
|
| |
|
|
|
|
|
|
|
|
|
|
|
| GDP growth rate(YoY %) |
|
|
(-) |
|
|
|
4.1 |
|
|
|
2.3 |
|
|
|
2.4 |
|
|
|
3.0 |
|
|
|
3.4 |
|
| Private consumption index(YoY %) |
|
|
(-) |
|
|
|
6.3 |
|
|
|
4.4 |
|
|
|
1.8 |
|
|
|
2.9 |
|
|
|
3.5 |
|
| Facility investment growth rate(YoY %) |
|
|
(-) |
|
|
|
4.1 |
|
|
|
0.2 |
|
|
|
0.8 |
|
|
|
4.5 |
|
|
|
4.9 |
|
| Consumer price index growth rate(%) |
|
|
(-) |
|
|
|
3.6 |
|
|
|
2.7 |
|
|
|
2.5 |
|
|
|
2.2 |
|
|
|
2.0 |
|
Balance on current account( million dollars) |
|
|
(-) |
|
|
|
202.0 |
|
|
|
220.0 |
|
|
|
180.0 |
|
|
|
200.0 |
|
|
|
220.0 |
|
| Government bond 3y yields(%) |
|
|
— |
|
|
|
1.87 |
|
|
|
1.80 |
|
|
|
1.80 |
|
|
|
1.90 |
|
|
|
1.90 |
|
| ③ Downside scenario |
|
|
|
|
|
|
|
|
|
|
|
|
|
|
|
|
|
|
|
|
|
|
|
|
| |
|
|
|
|
|
|
|
|
|
| |
|
|
|
|
|
|
|
|
|
|
|
| GDP growth rate(YoY %) |
|
|
(-) |
|
|
|
4.1 |
|
|
|
1.3 |
|
|
|
1.3 |
|
|
|
1.8 |
|
|
|
3.1 |
|
| Private consumption index(YoY %) |
|
|
(-) |
|
|
|
6.3 |
|
|
|
3.4 |
|
|
|
0.7 |
|
|
|
1.8 |
|
|
|
3.1 |
|
| Facility investment growth rate(YoY %) |
|
|
(-) |
|
|
|
4.1 |
|
|
|
(0.5 |
) |
|
|
0.3 |
|
|
|
4.3 |
|
|
|
4.5 |
|
| Consumer price index growth rate(%) |
|
|
(-) |
|
|
|
3.6 |
|
|
|
3.2 |
|
|
|
3.0 |
|
|
|
3.0 |
|
|
|
2.8 |
|
Balance on current account( million dollars) |
|
|
(-) |
|
|
|
202.0 |
|
|
|
200.0 |
|
|
|
170.0 |
|
|
|
180.0 |
|
|
|
200.0 |
|
| Government bond 3y yields(%) |
|
|
— |
|
|
|
1.87 |
|
|
|
2.00 |
|
|
|
2.00 |
|
|
|
2.20 |
|
|
|
2.40 |
|
| |
(*1) |
Shinhan Bank applied the GDP growth rate and private consumption index as the major variables. In addition, Shinhan Card applied the GDP growth rate, facility investment growth rate, consumer price index growth rate, and balance on current account as the major variables. In addition to the table above, the Group has selected additional forecasts for the KOSPI. |
SHINHAN FINANCIAL GROUP CO., LTD. AND SUBSIDIARIES
Notes to the Consolidated Financial Statements
(In millions of won)
|
Financial risk management (continued) |
| |
(*2) |
Considering the default forecast period, the Group reflected the future economic outlook. |
| |
(*3) |
The macroeconomic outlook figures are estimated by the Group for the purpose of calculating expected credit losses based on information from domestic and foreign research institutes. Therefore, it could be different from other institutions’ estimates. |
<December, 31, 2022>
① Upside scenario
|
|
|
|
|
|
|
|
|
|
|
|
|
|
|
|
|
|
|
|
|
|
|
|
|
| |
|
|
|
|
|
|
|
|
|
| |
|
|
|
|
|
|
|
|
|
|
|
| GDP growth rate(YoY %) |
|
|
(-) |
|
|
|
1.4 |
|
|
|
1.6 |
|
|
|
1.7 |
|
|
|
2.5 |
|
|
|
3.9 |
|
| Private consumption index(YoY %) |
|
|
(-) |
|
|
|
3.6 |
|
|
|
4.9 |
|
|
|
2.8 |
|
|
|
2.1 |
|
|
|
3.6 |
|
| Facility investment growth rate(YoY %) |
|
|
(-) |
|
|
|
6.6 |
|
|
|
1.5 |
|
|
|
2.0 |
|
|
|
(4.2 |
) |
|
|
5.3 |
|
| Consumer price index growth rate(%) |
|
|
(+) |
|
|
|
5.3 |
|
|
|
5.0 |
|
|
|
4.0 |
|
|
|
3.4 |
|
|
|
3.0 |
|
| Balance on current account(100 million dollars) |
|
|
(-) |
|
|
|
15.0 |
|
|
|
30.0 |
|
|
|
40.0 |
|
|
|
80.0 |
|
|
|
100.0 |
|
| Government bond 3y yields(%) |
|
|
— |
|
|
|
3.9 |
|
|
|
3.7 |
|
|
|
4.0 |
|
|
|
4.0 |
|
|
|
4.0 |
|
| ② Central scenario |
|
|
|
|
|
|
|
|
|
|
|
|
|
|
|
|
|
|
|
|
|
|
|
|
| |
|
Correlation
between
credit risks |
|
|
|
|
|
|
|
| |
|
|
|
|
|
|
|
|
|
|
|
| GDP growth rate(YoY %) |
|
|
(-) |
|
|
|
1.4 |
|
|
|
0.4 |
|
|
|
0.5 |
|
|
|
1.2 |
|
|
|
3.7 |
|
| Private consumption index(YoY %) |
|
|
(-) |
|
|
|
3.6 |
|
|
|
3.8 |
|
|
|
1.5 |
|
|
|
0.6 |
|
|
|
2.8 |
|
| Facility investment growth rate(YoY %) |
|
|
(-) |
|
|
|
6.6 |
|
|
|
0.8 |
|
|
|
1.0 |
|
|
|
(5.3 |
) |
|
|
4.6 |
|
| Consumer price index growth rate(%) |
|
|
(+) |
|
|
|
5.3 |
|
|
|
5.3 |
|
|
|
4.4 |
|
|
|
3.8 |
|
|
|
3.4 |
|
| Balance on current account(100 million dollars) |
|
|
(-) |
|
|
|
15.0 |
|
|
|
20.0 |
|
|
|
30.0 |
|
|
|
60.0 |
|
|
|
80.0 |
|
| Government bond 3y yields(%) |
|
|
— |
|
|
|
3.9 |
|
|
|
4.0 |
|
|
|
4.2 |
|
|
|
4.2 |
|
|
|
4.2 |
|
| ③ Downside scenario |
|
|
|
|
|
|
|
|
|
|
|
|
|
|
|
|
|
|
|
|
|
|
|
|
| |
|
Correlation
between
credit risks |
|
|
|
|
|
|
|
| |
|
|
|
|
|
|
|
|
|
|
|
| GDP growth rate(YoY %) |
|
|
(-) |
|
|
|
1.4 |
|
|
|
(0.4 |
) |
|
|
(0.5 |
) |
|
|
(0.1 |
) |
|
|
2.9 |
|
| Private consumption index(YoY %) |
|
|
(-) |
|
|
|
3.6 |
|
|
|
2.9 |
|
|
|
0.3 |
|
|
|
(0.8 |
) |
|
|
1.9 |
|
| Facility investment growth rate(YoY %) |
|
|
(-) |
|
|
|
6.6 |
|
|
|
0.2 |
|
|
|
0.3 |
|
|
|
(6.4 |
) |
|
|
3.4 |
|
| Consumer price index growth rate(%) |
|
|
(+) |
|
|
|
5.3 |
|
|
|
5.7 |
|
|
|
4.8 |
|
|
|
4.4 |
|
|
|
3.8 |
|
| Balance on current account(100 million dollars) |
|
|
(-) |
|
|
|
15.0 |
|
|
|
10.0 |
|
|
|
20.0 |
|
|
|
40.0 |
|
|
|
60.0 |
|
| Government bond 3y yields(%) |
|
|
— |
|
|
|
3.9 |
|
|
|
4.3 |
|
|
|
4.6 |
|
|
|
4.6 |
|
|
|
4.6 |
|
SHINHAN FINANCIAL GROUP CO., LTD. AND SUBSIDIARIES
Notes to the Consolidated Financial Statements
(In millions of won)
|
Financial risk management (continued) |
④ Worst scenario
|
|
|
|
|
|
|
| |
|
|
|
Economic Crisis for 1 year(*4) |
|
| |
|
|
|
|
|
|
|
|
|
|
|
|
|
|
|
|
|
|
|
|
|
| GDP growth rate(YoY %) |
|
(-) |
|
|
(5.1 |
) |
| Private consumption index(YoY %) |
|
(-) |
|
|
(11.9 |
) |
| Facility investment growth rate(YoY %) |
|
(-) |
|
|
(38.6 |
) |
| Consumer price index growth rate(%) |
|
(+) |
|
|
7.5 |
|
| Balance on current account(100 million dollars) |
|
(-) |
|
|
401.1 |
|
| Government bond 3y yields(%) |
|
— |
|
|
4.4 |
|
| |
(*1) |
As a result of examining the correlation between each variable, Shinhan Bank applied the GDP growth rate and private consumption index increase rate, etc. as the major variables to reflect the final forward-looking information, while, Shinhan Card applied the GDP growth rate, facility investment change rate, and current account balance, etc. as the major variables. In addition to the table above, the Group has selected unemployment rate and KOSPI forecasts. |
| |
(*2) |
Considering the default forecast period, the Group reflected the future economic outlook. |
| |
(*3) |
The macroeconomic outlook figures are estimated by the Group for the purpose of calculating expected credit losses based on information from domestic and foreign research institutes. Therefore, it could be different from other institutions’ estimates. |
| |
(*4) |
Shinhan Bank and Jeju Bank reviewed and reflected the Worst scenario (during the foreign exchange crisis) in addition to the three scenarios of Upside, Central and Downside. |
The predicted correlations between the macroeconomic variables and the risk of default, used by the Group, are derived based on long-term data over the past ten years.
The recent historical default rate is an important reference when estimating the default rate in consideration of the future economic outlook. Economic indicators have worsened since 2020 due to the economic contraction caused by the
COVID-19.
However, the historical default rate of the Group’s has remained stable because of various government support in response to the
COVID-19.
The Group manages the credit risk through classifying borrowers in moratorium of interest payments and moratorium of repayment that is one of the financial relief programs into Stage2 to reflect the impact of potential insolvency.
The Group has considered multiple economic scenarios in applying forward-looking information to measure the expected credit losses. Assuming a 100% weighting of Upside, Central, and Downside scenarios, the sensitivity to the Group’s provision for expected credit loss is not significant.
i-5)
Measurement of expected credit losses
Key variables used in measuring expected credit losses are as follows:
| |
• |
|
Probability of default (“PD”) |
| |
• |
|
Loss given default (“LGD”) |
| |
• |
|
Exposure at default (“EAD”) |
These variables have been estimated from historical experience data by using the statistical techniques developed internally by the Group and have been adjusted to reflect forward-looking information.
SHINHAN FINANCIAL GROUP CO., LTD. AND SUBSIDIARIES
Notes to the Consolidated Financial Statements
(In millions of won)
|
Financial risk management (continued) |
Estimates of PD over a specified period are estimated by reflecting characteristics of counterparties and their exposure, based on a statistical model at a specific point of time. The Group uses its own information to develop a statistical credit assessment model used for the estimation, and additional information observed in the market is considered for some portfolios such as a group of large corporates. When a counterparty or exposure is concentrated in specific grades, the method of measuring PD for those grades would be adjusted, and the PD by grade is estimated by considering contract expiration of the exposure.
LGD refers to the expected loss if a borrower defaults. The Group calculates LGD based on the experience recovery rate measured from past default exposures. The model for measuring LGD is developed to reflect type of collateral, seniority of collateral, type of borrower, and cost of recovery. In particular, LGD for retail loan products uses loan to value (LTV) as a key variable. The recovery rate reflected in the LGD calculation is based on the present value of recovery amount, discounted at the effective interest rate.
EAD refers to the expected exposure at the time of default. The Group derives EAD reflecting a rate at which the current exposure is expected to be used additionally up to the point of default within the contractual limit. EAD of financial assets is equal to the total carrying value of the asset, and EAD of loan commitments or financial guarantee contracts is calculated as the sum of the amount expected to be used in the future.
In measuring expected credit losses on financial assets, the Group uses the contractual maturity as the period subject to expected credit loss measurement. The contractual maturity is computed taking into account the extension right held by the borrower.
Risk factors of PD, LGD and EAD are collectively estimated according to the following criteria:
| |
• |
|
Internal credit risk rating |
| |
• |
|
Industry that the borrower belongs to |
| |
• |
|
Location of the borrower or collateral |
The criteria classifying groups is periodically reviewed to maintain homogeneity of the group and adjusted if necessary. The Group uses external benchmark information to supplement internal information for a particular portfolio that did not have sufficient internal data accumulated from the past experience.
i-6)
Write-off
of financial assets
The Group writes off a portion of or entire loan or debt security that is not expected to receive its principal and interest. In general, the Group conducts
write-off
when it is deemed that the borrower has no sufficient resources or income to repay the principal and interest. Such determination on
write-off
is carried out in accordance with the internal rules of the Group and is carried out with the approval of an external institution, if necessary. Apart from
write-off,
the Group may continue to exercise its right of collection under its own recovery policy even after the
write-off
of financial assets.
ii) Maximum exposure to credit risk
Exposure to credit risk is the exposure related to due from banks, loans, investments in debt securities, derivative transactions,
off-balance
sheet accounts such as loan commitment. The exposures of due from
SHINHAN FINANCIAL GROUP CO., LTD. AND SUBSIDIARIES
Notes to the Consolidated Financial Statements
(In millions of won)
|
Financial risk management (continued) |
banks and loans are classified into government, bank, corporation or retail based on the exposure classification criteria of BASEL III credit risk weights, and the net carrying value, excluding provisions, is presented as the maximum amount that can be exposed by credit risk.
The Group’s maximum exposure to credit risk without taking into account of any collateral held or other credit enhancements as of December 31, 2021 and 2022 is as follows:
|
|
|
|
|
|
|
|
|
| |
|
|
|
|
|
|
| Due from banks and loans at amortized cost (*1),(*3): |
|
|
|
|
|
|
|
|
| Banks |
|
W |
14,166,508 |
|
|
|
20,137,657 |
|
| Retail |
|
|
186,358,002 |
|
|
|
183,539,365 |
|
| Government/Public sector/Central bank |
|
|
15,251,465 |
|
|
|
15,481,390 |
|
| Corporations |
|
|
172,527,573 |
|
|
|
192,985,692 |
|
| Card receivable |
|
|
25,065,621 |
|
|
|
27,375,162 |
|
| |
|
|
|
|
|
|
|
|
| |
|
|
413,369,169 |
|
|
|
439,519,266 |
|
| |
|
|
|
|
|
|
|
|
| Due from banks and loans at fair value through profit or loss(*3): |
|
|
|
|
|
|
|
|
| Banks |
|
|
34,262 |
|
|
|
135,214 |
|
| Corporations |
|
|
1,683,344 |
|
|
|
2,280,081 |
|
| |
|
|
|
|
|
|
|
|
| |
|
|
1,717,606 |
|
|
|
2,415,295 |
|
| |
|
|
|
|
|
|
|
|
| Securities at fair value through profit or loss |
|
|
58,310,838 |
|
|
|
51,604,186 |
|
| Securities at fair value through other comprehensive income |
|
|
63,806,919 |
|
|
|
62,093,908 |
|
| Securities at amortized cost(*1) |
|
|
49,930,076 |
|
|
|
57,971,493 |
|
| Derivative assets |
|
|
3,799,189 |
|
|
|
6,461,796 |
|
| Other financial assets(*1),(*2) |
|
|
23,238,932 |
|
|
|
21,896,490 |
|
| Guarantee contracts |
|
|
16,745,707 |
|
|
|
18,226,546 |
|
| Loan commitments and other credit liabilities |
|
|
193,853,866 |
|
|
|
205,255,277 |
|
| |
|
|
|
|
|
|
|
|
| |
|
W |
824,772,302 |
|
|
|
865,444,257 |
|
| |
|
|
|
|
|
|
|
|
| |
(*1) |
The maximum exposure amounts for due from banks, loans, securities at amortized cost and other financial assets at amortized cost are recorded as net of allowances. |
| |
(*2) |
Other financial assets mainly comprise of accounts receivable, accrued income, deposits, domestic exchange settlement debit and suspense payments. |
| |
(*3) |
Classified as similar credit risk group based on calculation of the BIS ratio under new Basel Capital Accord (Basel III). |
SHINHAN FINANCIAL GROUP CO., LTD. AND SUBSIDIARIES
Notes to the Consolidated Financial Statements
(In millions of won)
|
Financial risk management (continued) |
iii) The maximum amount of exposure to credit risk by type of collateral as of December, 31, 2021 and 2022 is as follows:
|
|
|
|
|
|
|
|
|
|
|
|
|
|
|
|
|
|
|
|
|
| |
|
12 months
Expected credit loss |
|
|
Life time expected credit loss |
|
|
Total |
|
|
Not impaired |
|
|
Impaired |
|
|
|
|
|
|
|
|
|
|
|
|
|
|
|
|
|
|
| Guarantee |
|
W |
61,890,908 |
|
|
|
8,354,723 |
|
|
|
214,589 |
|
|
|
70,460,220 |
|
| Deposits and Savings |
|
|
2,166,075 |
|
|
|
285,965 |
|
|
|
2,446 |
|
|
|
2,454,486 |
|
| Property and equipment |
|
|
1,560,567 |
|
|
|
416,545 |
|
|
|
20,162 |
|
|
|
1,997,274 |
|
| Real estate |
|
|
127,505,563 |
|
|
|
14,318,098 |
|
|
|
256,972 |
|
|
|
142,080,633 |
|
| Securities |
|
|
1,906,005 |
|
|
|
128,293 |
|
|
|
7 |
|
|
|
2,034,305 |
|
| Others |
|
|
5,035,546 |
|
|
|
— |
|
|
|
5,495 |
|
|
|
5,041,041 |
|
| |
|
|
|
|
|
|
|
|
|
|
|
|
|
|
|
|
| Total |
|
W |
200,064,664 |
|
|
|
23,503,624 |
|
|
|
499,671 |
|
|
|
224,067,959 |
|
| |
|
|
|
|
|
|
|
|
|
|
|
|
|
|
|
|
|
|
|
|
|
|
|
|
|
|
|
|
|
|
|
|
|
|
|
|
|
| |
|
12 months
Expected credit loss |
|
|
Life time expected credit loss |
|
|
Total |
|
|
Not impaired |
|
|
Impaired |
|
| Guarantee |
|
W |
61,643,599 |
|
|
|
8,583,456 |
|
|
|
275,460 |
|
|
|
70,502,515 |
|
| Deposits and Savings |
|
|
2,814,723 |
|
|
|
287,890 |
|
|
|
4,348 |
|
|
|
3,106,961 |
|
| Property and equipment |
|
|
1,546,908 |
|
|
|
404,440 |
|
|
|
11,523 |
|
|
|
1,962,871 |
|
| Real estate |
|
|
136,154,296 |
|
|
|
17,439,371 |
|
|
|
317,213 |
|
|
|
153,910,880 |
|
| Securities |
|
|
2,325,294 |
|
|
|
243,734 |
|
|
|
159,040 |
|
|
|
2,728,068 |
|
| Others |
|
|
5,104,440 |
|
|
|
— |
|
|
|
4,564 |
|
|
|
5,109,004 |
|
| |
|
|
|
|
|
|
|
|
|
|
|
|
|
|
|
|
| Total |
|
W |
209,589,260 |
|
|
|
26,958,891 |
|
|
|
772,148 |
|
|
|
237,320,299 |
|
| |
|
|
|
|
|
|
|
|
|
|
|
|
|
|
|
|
SHINHAN FINANCIAL GROUP CO., LTD. AND SUBSIDIARIES
Notes to the Consolidated Financial Statements
(In millions of won)
|
Financial risk management (continued) |
iv) Impairment information by credit risk of financial assets
Details of impaired financial assets due to credit risk as of December 31, 2021 and 2022 are as follows:
|
|
|
|
|
|
|
|
|
|
|
|
|
|
|
|
|
|
|
|
|
|
|
|
|
|
|
|
|
|
|
|
|
|
|
|
|
| |
|
|
|
| |
|
12-month expected credit loss |
|
|
Life time expected credit loss |
|
|
|
|
|
|
|
|
|
|
|
Mitigation of
credit risk
|
|
| |
|
|
|
|
|
|
|
|
|
|
|
|
|
|
|
| Due from banks and loans at amortized cost: |
|
|
|
|
|
|
|
|
|
|
|
|
|
|
|
|
|
|
|
|
|
|
|
|
|
|
|
|
|
|
|
|
|
|
|
|
| Banks |
|
W |
10,793,973 |
|
|
|
3,278,144 |
|
|
|
112,254 |
|
|
|
434 |
|
|
|
— |
|
|
|
14,184,805 |
|
|
|
(18,297 |
) |
|
|
14,166,508 |
|
|
|
133,618 |
|
| Retail |
|
|
169,313,467 |
|
|
|
7,015,361 |
|
|
|
7,900,192 |
|
|
|
2,127,173 |
|
|
|
581,534 |
|
|
|
186,937,727 |
|
|
|
(579,725 |
) |
|
|
186,358,002 |
|
|
|
126,988,030 |
|
| Government/Public sector/ Central bank |
|
|
14,531,532 |
|
|
|
710,527 |
|
|
|
17,433 |
|
|
|
257 |
|
|
|
— |
|
|
|
15,259,749 |
|
|
|
(8,284 |
) |
|
|
15,251,465 |
|
|
|
9,000 |
|
| Corporations |
|
|
101,866,101 |
|
|
|
44,060,819 |
|
|
|
10,743,965 |
|
|
|
16,702,928 |
|
|
|
853,977 |
|
|
|
174,227,790 |
|
|
|
(1,700,217 |
) |
|
|
172,527,573 |
|
|
|
93,682,859 |
|
| Card receivable |
|
|
18,793,517 |
|
|
|
2,541,833 |
|
|
|
1,829,837 |
|
|
|
2,350,634 |
|
|
|
428,068 |
|
|
|
25,943,889 |
|
|
|
(878,268 |
) |
|
|
25,065,621 |
|
|
|
8,774 |
|
| |
|
|
|
|
|
|
|
|
|
|
|
|
|
|
|
|
|
|
|
|
|
|
|
|
|
|
|
|
|
|
|
|
|
|
|
|
| |
|
|
315,298,590 |
|
|
|
57,606,684 |
|
|
|
20,603,681 |
|
|
|
21,181,426 |
|
|
|
1,863,579 |
|
|
|
416,553,960 |
|
|
|
(3,184,791 |
) |
|
|
413,369,169 |
|
|
|
220,822,281 |
|
| |
|
|
|
|
|
|
|
|
|
|
|
|
|
|
|
|
|
|
|
|
|
|
|
|
|
|
|
|
|
|
|
|
|
|
|
|
| Securities at fair value through other comprehensive income (*) |
|
|
56,176,008 |
|
|
|
7,478,125 |
|
|
|
— |
|
|
|
152,786 |
|
|
|
— |
|
|
|
63,806,919 |
|
|
|
— |
|
|
|
63,806,919 |
|
|
|
— |
|
| Securities at amortized cost |
|
|
48,305,398 |
|
|
|
1,605,335 |
|
|
|
— |
|
|
|
36,290 |
|
|
|
— |
|
|
|
49,947,023 |
|
|
|
(16,947 |
) |
|
|
49,930,076 |
|
|
|
— |
|
| |
|
|
|
|
|
|
|
|
|
|
|
|
|
|
|
|
|
|
|
|
|
|
|
|
|
|
|
|
|
|
|
|
|
|
|
|
| |
|
W |
419,779,996 |
|
|
|
66,690,144 |
|
|
|
20,603,681 |
|
|
|
21,370,502 |
|
|
|
1,863,579 |
|
|
|
530,307,902 |
|
|
|
(3,201,738 |
) |
|
|
527,106,164 |
|
|
|
220,822,281 |
|
| |
|
|
|
|
|
|
|
|
|
|
|
|
|
|
|
|
|
|
|
|
|
|
|
|
|
|
|
|
|
|
|
|
|
|
|
|
| |
(*) |
Credit loss allowance recognized as other comprehensive income of securities at fair value through other comprehensive income amounted to 37,486 million as of December 31, 2021. |
SHINHAN FINANCIAL GROUP CO., LTD. AND SUBSIDIARIES
Notes to the Consolidated Financial Statements
(In millions of won)
|
Financial risk management (continued) |
|
|
|
|
|
|
|
|
|
|
|
|
|
|
|
|
|
|
|
|
|
|
|
|
|
|
|
|
|
|
|
|
|
|
|
|
|
| |
|
|
|
| |
|
12-month expected credit loss |
|
|
Life time expected credit loss |
|
|
|
|
|
|
|
|
|
|
|
Mitigation of
credit risk
|
|
| |
|
|
|
|
|
|
|
|
|
|
|
|
|
|
|
| Due from banks and loans at amortized cost: |
|
|
|
|
|
|
|
|
|
|
|
|
|
|
|
|
|
|
|
|
|
|
|
|
|
|
|
|
|
|
|
|
|
|
|
|
| Banks |
|
W |
15,883,274 |
|
|
|
4,166,423 |
|
|
|
111,593 |
|
|
|
177 |
|
|
|
— |
|
|
|
20,161,467 |
|
|
|
(23,810 |
) |
|
|
20,137,657 |
|
|
|
42,418 |
|
| Retail |
|
|
165,886,703 |
|
|
|
6,846,625 |
|
|
|
8,544,051 |
|
|
|
2,340,393 |
|
|
|
709,935 |
|
|
|
184,327,707 |
|
|
|
(788,342 |
) |
|
|
183,539,365 |
|
|
|
129,278,429 |
|
| Government/Public sector/ Central bank |
|
|
14,401,434 |
|
|
|
1,071,236 |
|
|
|
15,755 |
|
|
|
557 |
|
|
|
— |
|
|
|
15,488,982 |
|
|
|
(7,592 |
) |
|
|
15,481,390 |
|
|
|
9,000 |
|
| Corporations |
|
|
116,264,866 |
|
|
|
47,287,903 |
|
|
|
12,582,994 |
|
|
|
17,780,729 |
|
|
|
880,857 |
|
|
|
194,797,349 |
|
|
|
(1,811,657 |
) |
|
|
192,985,692 |
|
|
|
104,854,134 |
|
| Card receivable |
|
|
20,858,888 |
|
|
|
2,727,744 |
|
|
|
1,671,259 |
|
|
|
2,662,353 |
|
|
|
493,480 |
|
|
|
28,413,724 |
|
|
|
(1,038,562 |
) |
|
|
27,375,162 |
|
|
|
12,589 |
|
| |
|
|
|
|
|
|
|
|
|
|
|
|
|
|
|
|
|
|
|
|
|
|
|
|
|
|
|
|
|
|
|
|
|
|
|
|
| |
|
|
333,295,165 |
|
|
|
62,099,931 |
|
|
|
22,925,652 |
|
|
|
22,784,209 |
|
|
|
2,084,272 |
|
|
|
443,189,229 |
|
|
|
(3,669,963 |
) |
|
|
439,519,266 |
|
|
|
234,196,570 |
|
| |
|
|
|
|
|
|
|
|
|
|
|
|
|
|
|
|
|
|
|
|
|
|
|
|
|
|
|
|
|
|
|
|
|
|
|
|
| Securities at fair value through other comprehensive income(*) |
|
|
52,920,399 |
|
|
|
9,106,311 |
|
|
|
— |
|
|
|
67,198 |
|
|
|
— |
|
|
|
62,093,908 |
|
|
|
— |
|
|
|
62,093,908 |
|
|
|
— |
|
| Securities at amortized cost |
|
|
56,333,659 |
|
|
|
1,643,689 |
|
|
|
— |
|
|
|
10,516 |
|
|
|
— |
|
|
|
57,987,864 |
|
|
|
(16,371 |
) |
|
|
57,971,493 |
|
|
|
— |
|
| |
|
|
|
|
|
|
|
|
|
|
|
|
|
|
|
|
|
|
|
|
|
|
|
|
|
|
|
|
|
|
|
|
|
|
|
|
| |
|
W |
442,549,223 |
|
|
|
72,849,931 |
|
|
|
22,925,652 |
|
|
|
22,861,923 |
|
|
|
2,084,272 |
|
|
|
563,271,001 |
|
|
|
(3,686,334 |
) |
|
|
559,584,667 |
|
|
|
234,196,570 |
|
| |
|
|
|
|
|
|
|
|
|
|
|
|
|
|
|
|
|
|
|
|
|
|
|
|
|
|
|
|
|
|
|
|
|
|
|
|
| |
(*) |
Credit loss allowance recognized as other comprehensive income of securities at fair value through other comprehensive income amounted to 33,108 million as of December 31, 2022. |
SHINHAN FINANCIAL GROUP CO., LTD. AND SUBSIDIARIES
Notes to the Consolidated Financial Statements
(In millions of won)
|
Financial risk management (continued) |
v) Credit risk exposures per credit grade of
off-balance
items
Credit risk exposures per credit grade of
off-balance
items as of December 31, 2021 and 2022 are as follows:
|
|
|
|
|
|
|
|
|
|
|
|
|
|
|
|
|
| |
|
|
|
| |
|
Grade 1 |
|
|
Grade 2 |
|
|
Impaired |
|
|
Total |
|
| Guarantee contracts: |
|
|
|
|
|
|
|
|
|
|
|
|
|
|
|
|
12-month expected credit loss |
|
W |
12,671,376 |
|
|
|
3,434,615 |
|
|
|
— |
|
|
|
16,105,991 |
|
| Life time expected credit loss |
|
|
342,224 |
|
|
|
205,179 |
|
|
|
— |
|
|
|
547,403 |
|
| Impaired |
|
|
— |
|
|
|
— |
|
|
|
92,313 |
|
|
|
92,313 |
|
| |
|
|
|
|
|
|
|
|
|
|
|
|
|
|
|
|
| |
|
|
13,013,600 |
|
|
|
3,639,794 |
|
|
|
92,313 |
|
|
|
16,745,707 |
|
| |
|
|
|
|
|
|
|
|
|
|
|
|
|
|
|
|
| Loan commitment and other credit line |
|
|
|
|
|
|
|
|
|
|
|
|
|
|
|
|
12-month expected credit loss |
|
|
160,307,100 |
|
|
|
23,370,613 |
|
|
|
— |
|
|
|
183,677,713 |
|
| Life time expected credit loss |
|
|
7,406,324 |
|
|
|
2,759,057 |
|
|
|
— |
|
|
|
10,165,381 |
|
| Impaired |
|
|
— |
|
|
|
— |
|
|
|
10,772 |
|
|
|
10,772 |
|
| |
|
|
|
|
|
|
|
|
|
|
|
|
|
|
|
|
| |
|
|
167,713,424 |
|
|
|
26,129,670 |
|
|
|
10,772 |
|
|
|
193,853,866 |
|
| |
|
|
|
|
|
|
|
|
|
|
|
|
|
|
|
|
| |
|
W |
180,727,024 |
|
|
|
29,769,464 |
|
|
|
103,085 |
|
|
|
210,599,573 |
|
| |
|
|
|
|
|
|
|
|
|
|
|
|
|
|
|
|
|
|
|
|
|
|
|
|
|
|
|
|
|
|
|
|
|
| |
|
|
|
| |
|
Grade 1 |
|
|
Grade 2 |
|
|
Impaired |
|
|
Total |
|
| Guarantee contracts: |
|
|
|
|
|
|
|
|
|
|
|
|
|
|
|
|
12-month expected credit loss |
|
W |
14,262,990 |
|
|
|
3,314,584 |
|
|
|
— |
|
|
|
17,577,574 |
|
| Life time expected credit loss |
|
|
386,159 |
|
|
|
164,400 |
|
|
|
— |
|
|
|
550,559 |
|
| Impaired |
|
|
— |
|
|
|
— |
|
|
|
98,413 |
|
|
|
98,413 |
|
| |
|
|
|
|
|
|
|
|
|
|
|
|
|
|
|
|
| |
|
|
14,649,149 |
|
|
|
3,478,984 |
|
|
|
98,413 |
|
|
|
18,226,546 |
|
| |
|
|
|
|
|
|
|
|
|
|
|
|
|
|
|
|
| Loan commitment and other credit line |
|
|
|
|
|
|
|
|
|
|
|
|
|
|
|
|
12-month expected credit loss |
|
|
178,532,138 |
|
|
|
17,418,916 |
|
|
|
— |
|
|
|
195,951,054 |
|
| Life time expected credit loss |
|
|
6,287,658 |
|
|
|
3,011,715 |
|
|
|
— |
|
|
|
9,299,373 |
|
| Impaired |
|
|
— |
|
|
|
— |
|
|
|
4,850 |
|
|
|
4,850 |
|
| |
|
|
|
|
|
|
|
|
|
|
|
|
|
|
|
|
| |
|
|
184,819,796 |
|
|
|
20,430,631 |
|
|
|
4,850 |
|
|
|
205,255,277 |
|
| |
|
|
|
|
|
|
|
|
|
|
|
|
|
|
|
|
| |
|
W |
199,468,945 |
|
|
|
23,909,615 |
|
|
|
103,263 |
|
|
|
223,481,823 |
|
| |
|
|
|
|
|
|
|
|
|
|
|
|
|
|
|
|
vi) Credit qualities are classified based on the internal credit rating as follows:
|
|
|
|
|
| |
|
|
|
|
| Individuals |
|
Probability of default below 2.25% for each pool |
|
Probability of default 2.25% or above for each pool |
| Government/Public agency/Central bank |
|
OECD sovereign credit rating of 6 or above |
|
OECD sovereign credit rating of below 6 |
| Banks and Corporations (Including credit card bond) |
|
Internal credit rating of BBB+ or above |
|
Internal credit rating of below BBB+ |
| Card receivables (Individuals) |
|
Behavior scoring system of 7 grade or above |
|
Behavior scoring system of below 7 grade |
SHINHAN FINANCIAL GROUP CO., LTD. AND SUBSIDIARIES
Notes to the Consolidated Financial Statements
(In millions of won)
|
Financial risk management (continued) |
vii) Credit risk exposures per credit quality of derivative assets
Credit quality of derivative assets as of December 31, 2021 and 2022 are as follows:
|
|
|
|
|
|
|
|
|
| |
|
|
|
|
|
|
| Grade 1 |
|
W |
3,201,912 |
|
|
|
5,942,661 |
|
| Grade 2 |
|
|
597,277 |
|
|
|
519,135 |
|
| |
|
|
|
|
|
|
|
|
| |
|
W |
3,799,189 |
|
|
|
6,461,796 |
|
| |
|
|
|
|
|
|
|
|
| (*) |
Credit quality of derivative assets is classified based on the internal credit ratings. |
SHINHAN FINANCIAL GROUP CO., LTD. AND SUBSIDIARIES
Notes to the Consolidated Financial Statements
(In millions of won)
|
Financial risk management (continued) |
viii) Concentration by geographic location
An analysis of concentration by geographic location for financial instrument, net of allowance, as of December 31, 2021 and 2022 are as follows:
|
|
|
|
|
|
|
|
|
|
|
|
|
|
|
|
|
|
|
|
|
|
|
|
|
|
|
|
|
|
|
|
|
|
|
|
|
| |
|
|
|
| Classification (*) |
|
Korea |
|
|
USA |
|
|
UK |
|
|
Japan |
|
|
Germany |
|
|
Vietnam |
|
|
China |
|
|
Other |
|
|
Total |
|
| Due from banks and loans at amortized cost |
|
|
|
|
|
|
|
|
|
|
|
|
|
|
|
|
|
|
|
|
|
|
|
|
|
|
|
|
|
|
|
|
|
|
|
|
| Banks |
|
W |
4,310,888 |
|
|
|
1,525,158 |
|
|
|
235,591 |
|
|
|
450,689 |
|
|
|
530,688 |
|
|
|
1,676,080 |
|
|
|
2,677,445 |
|
|
|
2,759,969 |
|
|
|
14,166,508 |
|
| Retail |
|
|
175,777,754 |
|
|
|
392,882 |
|
|
|
7,683 |
|
|
|
4,338,281 |
|
|
|
3,111 |
|
|
|
2,412,670 |
|
|
|
1,944,105 |
|
|
|
1,481,516 |
|
|
|
186,358,002 |
|
| Government/Public sector/Central bank |
|
|
11,807,591 |
|
|
|
796,405 |
|
|
|
— |
|
|
|
1,279,012 |
|
|
|
217,773 |
|
|
|
248,301 |
|
|
|
462,308 |
|
|
|
440,075 |
|
|
|
15,251,465 |
|
| Corporations |
|
|
151,625,249 |
|
|
|
3,684,068 |
|
|
|
254,051 |
|
|
|
4,375,807 |
|
|
|
94,186 |
|
|
|
3,012,133 |
|
|
|
2,947,746 |
|
|
|
6,534,333 |
|
|
|
172,527,573 |
|
| Card receivable |
|
|
24,832,367 |
|
|
|
10,435 |
|
|
|
462 |
|
|
|
2,033 |
|
|
|
233 |
|
|
|
170,929 |
|
|
|
32,281 |
|
|
|
16,881 |
|
|
|
25,065,621 |
|
| |
|
|
|
|
|
|
|
|
|
|
|
|
|
|
|
|
|
|
|
|
|
|
|
|
|
|
|
|
|
|
|
|
|
|
|
|
| |
|
|
368,353,849 |
|
|
|
6,408,948 |
|
|
|
497,787 |
|
|
|
10,445,822 |
|
|
|
845,991 |
|
|
|
7,520,113 |
|
|
|
8,063,885 |
|
|
|
11,232,774 |
|
|
|
413,369,169 |
|
| |
|
|
|
|
|
|
|
|
|
|
|
|
|
|
|
|
|
|
|
|
|
|
|
|
|
|
|
|
|
|
|
|
|
|
|
|
| Deposits and loans at FVTPL |
|
|
|
|
|
|
|
|
|
|
|
|
|
|
|
|
|
|
|
|
|
|
|
|
|
|
|
|
|
|
|
|
|
|
|
|
| Banks |
|
|
— |
|
|
|
34,262 |
|
|
|
— |
|
|
|
— |
|
|
|
— |
|
|
|
— |
|
|
|
— |
|
|
|
— |
|
|
|
34,262 |
|
| Corporations |
|
|
1,113,229 |
|
|
|
282,513 |
|
|
|
— |
|
|
|
19,274 |
|
|
|
— |
|
|
|
— |
|
|
|
— |
|
|
|
268,328 |
|
|
|
1,683,344 |
|
| |
|
|
|
|
|
|
|
|
|
|
|
|
|
|
|
|
|
|
|
|
|
|
|
|
|
|
|
|
|
|
|
|
|
|
|
|
| |
|
|
1,113,229 |
|
|
|
316,775 |
|
|
|
— |
|
|
|
19,274 |
|
|
|
— |
|
|
|
— |
|
|
|
— |
|
|
|
268,328 |
|
|
|
1,717,606 |
|
| |
|
|
|
|
|
|
|
|
|
|
|
|
|
|
|
|
|
|
|
|
|
|
|
|
|
|
|
|
|
|
|
|
|
|
|
|
| Securities measured at FVTPL |
|
|
53,942,627 |
|
|
|
2,359,478 |
|
|
|
255,023 |
|
|
|
91,766 |
|
|
|
19,048 |
|
|
|
27,613 |
|
|
|
76,107 |
|
|
|
1,539,176 |
|
|
|
58,310,838 |
|
| Securities at FVOCI |
|
|
59,353,250 |
|
|
|
1,871,526 |
|
|
|
164,340 |
|
|
|
250,768 |
|
|
|
52,199 |
|
|
|
120,884 |
|
|
|
679,527 |
|
|
|
1,314,425 |
|
|
|
63,806,919 |
|
| Securities at amortized cost |
|
|
46,896,258 |
|
|
|
777,546 |
|
|
|
— |
|
|
|
244,149 |
|
|
|
— |
|
|
|
902,377 |
|
|
|
80,041 |
|
|
|
1,029,705 |
|
|
|
49,930,076 |
|
| |
|
|
|
|
|
|
|
|
|
|
|
|
|
|
|
|
|
|
|
|
|
|
|
|
|
|
|
|
|
|
|
|
|
|
|
|
| |
|
W |
529,659,213 |
|
|
|
11,734,273 |
|
|
|
917,150 |
|
|
|
11,051,779 |
|
|
|
917,238 |
|
|
|
8,570,987 |
|
|
|
8,899,560 |
|
|
|
15,384,408 |
|
|
|
587,134,608 |
|
| |
|
|
|
|
|
|
|
|
|
|
|
|
|
|
|
|
|
|
|
|
|
|
|
|
|
|
|
|
|
|
|
|
|
|
|
|
| |
|
|
|
|
|
|
|
|
|
|
|
|
|
|
|
|
|
|
|
|
|
|
|
|
|
|
|
|
|
|
|
|
|
|
|
|
| Guarantees |
|
W |
15,451,432 |
|
|
|
156,225 |
|
|
|
4,690 |
|
|
|
28,725 |
|
|
|
13,374 |
|
|
|
382,307 |
|
|
|
617,574 |
|
|
|
91,380 |
|
|
|
16,745,707 |
|
| Loan commitments and other liabilities related to credit |
|
|
182,701,367 |
|
|
|
686,381 |
|
|
|
260,036 |
|
|
|
771,183 |
|
|
|
87,080 |
|
|
|
2,772,750 |
|
|
|
2,157,388 |
|
|
|
4,417,681 |
|
|
|
193,853,866 |
|
| |
|
|
|
|
|
|
|
|
|
|
|
|
|
|
|
|
|
|
|
|
|
|
|
|
|
|
|
|
|
|
|
|
|
|
|
|
| |
|
W |
198,152,799 |
|
|
|
842,606 |
|
|
|
264,726 |
|
|
|
799,908 |
|
|
|
100,454 |
|
|
|
3,155,057 |
|
|
|
2,774,962 |
|
|
|
4,509,061 |
|
|
|
210,599,573 |
|
| |
|
|
|
|
|
|
|
|
|
|
|
|
|
|
|
|
|
|
|
|
|
|
|
|
|
|
|
|
|
|
|
|
|
|
|
|
| (*) |
The following accounts are the net carrying value less provision for doubtful accounts. |
SHINHAN FINANCIAL GROUP CO., LTD. AND SUBSIDIARIES
Notes to the Consolidated Financial Statements
(In millions of won)
|
Financial risk management (continued) |
|
|
|
|
|
|
|
|
|
|
|
|
|
|
|
|
|
|
|
|
|
|
|
|
|
|
|
|
|
|
|
|
|
|
|
|
|
| |
|
|
|
| Classification(*) |
|
Korea |
|
|
USA |
|
|
UK |
|
|
Japan |
|
|
Germany |
|
|
Vietnam |
|
|
China |
|
|
Other |
|
|
Total |
|
| Due from banks and loans at amortized cost |
|
|
|
|
|
|
|
|
|
|
|
|
|
|
|
|
|
|
|
|
|
|
|
|
|
|
|
|
|
|
|
|
|
|
|
|
| Banks |
|
W |
5,956,111 |
|
|
|
2,259,951 |
|
|
|
765,128 |
|
|
|
879,022 |
|
|
|
675,370 |
|
|
|
1,793,330 |
|
|
|
3,861,678 |
|
|
|
3,947,067 |
|
|
|
20,137,657 |
|
| Retail |
|
|
171,780,848 |
|
|
|
403,445 |
|
|
|
8,199 |
|
|
|
4,357,325 |
|
|
|
3,716 |
|
|
|
3,183,424 |
|
|
|
2,030,305 |
|
|
|
1,772,103 |
|
|
|
183,539,365 |
|
| Government/Public sector/Central bank |
|
|
11,251,561 |
|
|
|
915,306 |
|
|
|
— |
|
|
|
1,404,163 |
|
|
|
426,747 |
|
|
|
345,843 |
|
|
|
441,551 |
|
|
|
696,219 |
|
|
|
15,481,390 |
|
| Corporations |
|
|
170,961,934 |
|
|
|
3,687,701 |
|
|
|
451,254 |
|
|
|
5,152,628 |
|
|
|
105,205 |
|
|
|
3,228,817 |
|
|
|
2,694,661 |
|
|
|
6,703,492 |
|
|
|
192,985,692 |
|
| Card receivable |
|
|
27,065,988 |
|
|
|
11,017 |
|
|
|
428 |
|
|
|
2,291 |
|
|
|
286 |
|
|
|
236,095 |
|
|
|
38,416 |
|
|
|
20,641 |
|
|
|
27,375,162 |
|
| |
|
|
|
|
|
|
|
|
|
|
|
|
|
|
|
|
|
|
|
|
|
|
|
|
|
|
|
|
|
|
|
|
|
|
|
|
| |
|
|
387,016,442 |
|
|
|
7,277,420 |
|
|
|
1,225,009 |
|
|
|
11,795,429 |
|
|
|
1,211,324 |
|
|
|
8,787,509 |
|
|
|
9,066,611 |
|
|
|
13,139,522 |
|
|
|
439,519,266 |
|
| |
|
|
|
|
|
|
|
|
|
|
|
|
|
|
|
|
|
|
|
|
|
|
|
|
|
|
|
|
|
|
|
|
|
|
|
|
| Deposits and loans at FVTPL |
|
|
|
|
|
|
|
|
|
|
|
|
|
|
|
|
|
|
|
|
|
|
|
|
|
|
|
|
|
|
|
|
|
|
|
|
| Banks |
|
|
109,098 |
|
|
|
26,116 |
|
|
|
— |
|
|
|
— |
|
|
|
— |
|
|
|
— |
|
|
|
— |
|
|
|
— |
|
|
|
135,214 |
|
| Corporations |
|
|
1,510,976 |
|
|
|
285,107 |
|
|
|
82,172 |
|
|
|
17,829 |
|
|
|
— |
|
|
|
— |
|
|
|
— |
|
|
|
383,997 |
|
|
|
2,280,081 |
|
| |
|
|
|
|
|
|
|
|
|
|
|
|
|
|
|
|
|
|
|
|
|
|
|
|
|
|
|
|
|
|
|
|
|
|
|
|
| |
|
|
1,620,074 |
|
|
|
311,223 |
|
|
|
82,172 |
|
|
|
17,829 |
|
|
|
— |
|
|
|
— |
|
|
|
— |
|
|
|
383,997 |
|
|
|
2,415,295 |
|
| |
|
|
|
|
|
|
|
|
|
|
|
|
|
|
|
|
|
|
|
|
|
|
|
|
|
|
|
|
|
|
|
|
|
|
|
|
| Securities measured at FVTPL |
|
|
48,322,318 |
|
|
|
1,602,598 |
|
|
|
252,390 |
|
|
|
58,255 |
|
|
|
23,610 |
|
|
|
31,952 |
|
|
|
16,469 |
|
|
|
1,296,594 |
|
|
|
51,604,186 |
|
| Securities at FVOCI |
|
|
55,849,223 |
|
|
|
3,104,384 |
|
|
|
193,598 |
|
|
|
348,240 |
|
|
|
34,065 |
|
|
|
92,940 |
|
|
|
688,085 |
|
|
|
1,783,373 |
|
|
|
62,093,908 |
|
| Securities at amortized cost |
|
|
54,843,005 |
|
|
|
1,020,227 |
|
|
|
— |
|
|
|
214,653 |
|
|
|
— |
|
|
|
726,476 |
|
|
|
110,884 |
|
|
|
1,056,248 |
|
|
|
57,971,493 |
|
| |
|
|
|
|
|
|
|
|
|
|
|
|
|
|
|
|
|
|
|
|
|
|
|
|
|
|
|
|
|
|
|
|
|
|
|
|
| |
|
|
547,651,062 |
|
|
|
13,315,852 |
|
|
|
1,753,169 |
|
|
|
12,434,406 |
|
|
|
1,268,999 |
|
|
|
9,638,877 |
|
|
|
9,882,049 |
|
|
|
17,659,734 |
|
|
|
613,604,148 |
|
| |
|
|
|
|
|
|
|
|
|
|
|
|
|
|
|
|
|
|
|
|
|
|
|
|
|
|
|
|
|
|
|
|
|
|
|
|
| |
|
|
|
|
|
|
|
|
|
|
|
|
|
|
|
|
|
|
|
|
|
|
|
|
|
|
|
|
|
|
|
|
|
|
|
|
| Guarantees |
|
|
16,426,498 |
|
|
|
118,951 |
|
|
|
23,481 |
|
|
|
47,805 |
|
|
|
44,203 |
|
|
|
329,904 |
|
|
|
1,015,543 |
|
|
|
220,161 |
|
|
|
18,226,546 |
|
| Loan commitments and other liabilities related to credit |
|
|
194,236,727 |
|
|
|
1,312,830 |
|
|
|
317,335 |
|
|
|
550,116 |
|
|
|
42,230 |
|
|
|
1,816,773 |
|
|
|
2,548,483 |
|
|
|
4,430,783 |
|
|
|
205,255,277 |
|
| |
|
|
|
|
|
|
|
|
|
|
|
|
|
|
|
|
|
|
|
|
|
|
|
|
|
|
|
|
|
|
|
|
|
|
|
|
| |
|
W |
210,663,225 |
|
|
|
1,431,781 |
|
|
|
340,816 |
|
|
|
597,921 |
|
|
|
86,433 |
|
|
|
2,146,677 |
|
|
|
3,564,026 |
|
|
|
4,650,944 |
|
|
|
223,481,823 |
|
| |
|
|
|
|
|
|
|
|
|
|
|
|
|
|
|
|
|
|
|
|
|
|
|
|
|
|
|
|
|
|
|
|
|
|
|
|
| (*) |
The following accounts are the net carrying value less provision for doubtful accounts. |
SHINHAN FINANCIAL GROUP CO., LTD. AND SUBSIDIARIES
Notes to the Consolidated Financial Statements
(In millions of won)
|
Financial risk management (continued) |
ix) Concentration by industry sector
An analysis of concentration by industry sector of financial instrument, net of allowance, as of and December 31, 2021 and 2022 is as
|
|
|
|
|
|
|
|
|
|
|
|
|
|
|
|
|
|
|
|
|
|
|
|
|
|
|
|
|
|
|
|
|
|
|
|
|
|
|
|
|
| |
|
Finance and
insurance |
|
|
Manufacturing |
|
|
Retail and
wholesale |
|
|
Real estate
and
business |
|
|
Construction
service |
|
|
Lodging and
Restaurant |
|
|
Other |
|
|
Retail
customers |
|
|
Total |
|
| Due from banks and loans at amortized cost: |
|
|
|
|
|
|
|
|
|
|
|
|
|
|
|
|
|
|
|
|
|
|
|
|
|
|
|
|
|
|
|
|
|
|
|
|
| Banks |
|
W |
13,447,829 |
|
|
|
— |
|
|
|
— |
|
|
|
— |
|
|
|
— |
|
|
|
— |
|
|
|
718,679 |
|
|
|
— |
|
|
|
14,166,508 |
|
| Retail |
|
|
— |
|
|
|
— |
|
|
|
— |
|
|
|
— |
|
|
|
— |
|
|
|
— |
|
|
|
— |
|
|
|
186,358,002 |
|
|
|
186,358,002 |
|
| Government/Public sector/Central bank |
|
|
15,216,403 |
|
|
|
— |
|
|
|
— |
|
|
|
1,797 |
|
|
|
— |
|
|
|
— |
|
|
|
33,265 |
|
|
|
— |
|
|
|
15,251,465 |
|
| Corporations |
|
|
13,384,083 |
|
|
|
53,134,572 |
|
|
|
21,167,564 |
|
|
|
41,106,836 |
|
|
|
3,727,338 |
|
|
|
6,544,166 |
|
|
|
33,463,014 |
|
|
|
— |
|
|
|
172,527,573 |
|
| Card receivable |
|
|
51,123 |
|
|
|
252,973 |
|
|
|
228,900 |
|
|
|
46,896 |
|
|
|
45,568 |
|
|
|
29,713 |
|
|
|
1,899,301 |
|
|
|
22,511,147 |
|
|
|
25,065,621 |
|
| |
|
|
|
|
|
|
|
|
|
|
|
|
|
|
|
|
|
|
|
|
|
|
|
|
|
|
|
|
|
|
|
|
|
|
|
|
| |
|
|
42,099,438 |
|
|
|
53,387,545 |
|
|
|
21,396,464 |
|
|
|
41,155,529 |
|
|
|
3,772,906 |
|
|
|
6,573,879 |
|
|
|
36,114,259 |
|
|
|
208,869,149 |
|
|
|
413,369,169 |
|
| |
|
|
|
|
|
|
|
|
|
|
|
|
|
|
|
|
|
|
|
|
|
|
|
|
|
|
|
|
|
|
|
|
|
|
|
|
| Due from banks and loans at FVTPL |
|
|
|
|
|
|
|
|
|
|
|
|
|
|
|
|
|
|
|
|
|
|
|
|
|
|
|
|
|
|
|
|
|
|
|
|
| Banks |
|
|
34,262 |
|
|
|
— |
|
|
|
— |
|
|
|
— |
|
|
|
— |
|
|
|
— |
|
|
|
— |
|
|
|
— |
|
|
|
34,262 |
|
| Corporations |
|
|
986,736 |
|
|
|
492,598 |
|
|
|
15,107 |
|
|
|
78,753 |
|
|
|
22,537 |
|
|
|
2,637 |
|
|
|
84,976 |
|
|
|
— |
|
|
|
1,683,344 |
|
| |
|
|
|
|
|
|
|
|
|
|
|
|
|
|
|
|
|
|
|
|
|
|
|
|
|
|
|
|
|
|
|
|
|
|
|
|
| |
|
|
1,020,998 |
|
|
|
492,598 |
|
|
|
15,107 |
|
|
|
78,753 |
|
|
|
22,537 |
|
|
|
2,637 |
|
|
|
84,976 |
|
|
|
— |
|
|
|
1,717,606 |
|
| |
|
|
|
|
|
|
|
|
|
|
|
|
|
|
|
|
|
|
|
|
|
|
|
|
|
|
|
|
|
|
|
|
|
|
|
|
| Securities measured at FVTPL |
|
|
33,769,892 |
|
|
|
3,248,846 |
|
|
|
1,169,038 |
|
|
|
773,687 |
|
|
|
299,972 |
|
|
|
152,341 |
|
|
|
18,897,062 |
|
|
|
— |
|
|
|
58,310,838 |
|
| Securities at FVOCI |
|
|
27,034,695 |
|
|
|
3,529,756 |
|
|
|
523,631 |
|
|
|
775,967 |
|
|
|
1,144,998 |
|
|
|
30,928 |
|
|
|
30,766,944 |
|
|
|
— |
|
|
|
63,806,919 |
|
| Securities at amortized cost |
|
|
10,309,318 |
|
|
|
— |
|
|
|
— |
|
|
|
1,074,393 |
|
|
|
1,249,070 |
|
|
|
— |
|
|
|
37,297,295 |
|
|
|
— |
|
|
|
49,930,076 |
|
| |
|
|
|
|
|
|
|
|
|
|
|
|
|
|
|
|
|
|
|
|
|
|
|
|
|
|
|
|
|
|
|
|
|
|
|
|
| |
|
|
114,234,341 |
|
|
|
60,658,745 |
|
|
|
23,104,240 |
|
|
|
43,858,329 |
|
|
|
6,489,483 |
|
|
|
6,759,785 |
|
|
|
123,160,536 |
|
|
|
208,869,149 |
|
|
|
587,134,608 |
|
| |
|
|
|
|
|
|
|
|
|
|
|
|
|
|
|
|
|
|
|
|
|
|
|
|
|
|
|
|
|
|
|
|
|
|
|
|
| |
|
|
|
|
|
|
|
|
|
|
|
|
|
|
|
|
|
|
|
|
|
|
|
|
|
|
|
|
|
|
|
|
|
|
|
|
| Guarantees |
|
|
2,308,627 |
|
|
|
8,124,340 |
|
|
|
3,469,001 |
|
|
|
350,591 |
|
|
|
207,691 |
|
|
|
151,653 |
|
|
|
2,132,267 |
|
|
|
1,537 |
|
|
|
16,745,707 |
|
| Loan commitments and other liabilities related to credit |
|
|
15,445,541 |
|
|
|
25,389,003 |
|
|
|
8,908,201 |
|
|
|
3,676,457 |
|
|
|
2,213,871 |
|
|
|
499,633 |
|
|
|
20,404,848 |
|
|
|
117,316,312 |
|
|
|
193,853,866 |
|
| |
|
|
|
|
|
|
|
|
|
|
|
|
|
|
|
|
|
|
|
|
|
|
|
|
|
|
|
|
|
|
|
|
|
|
|
|
| |
|
W |
17,754,168 |
|
|
|
33,513,343 |
|
|
|
12,377,202 |
|
|
|
4,027,048 |
|
|
|
2,421,562 |
|
|
|
651,286 |
|
|
|
22,537,115 |
|
|
|
117,317,849 |
|
|
|
210,599,573 |
|
| |
|
|
|
|
|
|
|
|
|
|
|
|
|
|
|
|
|
|
|
|
|
|
|
|
|
|
|
|
|
|
|
|
|
|
|
|
| (*) |
The composition details by industry are net book value less allowances. |
SHINHAN FINANCIAL GROUP CO., LTD. AND SUBSIDIARIES
Notes to the Consolidated Financial Statements
(In millions of won)
|
Financial risk management (continued) |
|
|
|
|
|
|
|
|
|
|
|
|
|
|
|
|
|
|
|
|
|
|
|
|
|
|
|
|
|
|
|
|
|
|
|
|
|
|
|
|
|
| |
|
Finance and
insurance |
|
|
Manufacturing |
|
|
Retail and
wholesale |
|
|
Real estate
and
business |
|
|
Construction
service |
|
|
Lodging and
Restaurant |
|
|
Other |
|
|
Retail
customers |
|
|
Total |
|
| Due from banks and loans at amortized cost: |
|
|
|
|
|
|
|
|
|
|
|
|
|
|
|
|
|
|
|
|
|
|
|
|
|
|
|
|
|
|
|
|
|
|
|
|
| Banks |
|
W |
19,486,003 |
|
|
|
— |
|
|
|
— |
|
|
|
— |
|
|
|
29,979 |
|
|
|
— |
|
|
|
621,675 |
|
|
|
— |
|
|
|
20,137,657 |
|
| Retail |
|
|
— |
|
|
|
— |
|
|
|
— |
|
|
|
— |
|
|
|
— |
|
|
|
— |
|
|
|
— |
|
|
|
183,539,365 |
|
|
|
183,539,365 |
|
| Government/Public sector/Central bank |
|
|
15,422,776 |
|
|
|
— |
|
|
|
— |
|
|
|
1,296 |
|
|
|
— |
|
|
|
— |
|
|
|
57,318 |
|
|
|
— |
|
|
|
15,481,390 |
|
| Corporations |
|
|
16,579,826 |
|
|
|
57,861,407 |
|
|
|
22,984,739 |
|
|
|
45,088,702 |
|
|
|
4,470,587 |
|
|
|
6,619,476 |
|
|
|
39,380,955 |
|
|
|
— |
|
|
|
192,985,692 |
|
| Card receivable |
|
|
47,835 |
|
|
|
276,473 |
|
|
|
266,220 |
|
|
|
49,060 |
|
|
|
51,113 |
|
|
|
31,333 |
|
|
|
1,084,143 |
|
|
|
25,568,985 |
|
|
|
27,375,162 |
|
| |
|
|
|
|
|
|
|
|
|
|
|
|
|
|
|
|
|
|
|
|
|
|
|
|
|
|
|
|
|
|
|
|
|
|
|
|
| |
|
|
51,536,440 |
|
|
|
58,137,880 |
|
|
|
23,250,959 |
|
|
|
45,139,058 |
|
|
|
4,551,679 |
|
|
|
6,650,809 |
|
|
|
41,144,091 |
|
|
|
209,108,350 |
|
|
|
439,519,266 |
|
| |
|
|
|
|
|
|
|
|
|
|
|
|
|
|
|
|
|
|
|
|
|
|
|
|
|
|
|
|
|
|
|
|
|
|
|
|
| Due from banks and loans at FVTPL |
|
|
|
|
|
|
|
|
|
|
|
|
|
|
|
|
|
|
|
|
|
|
|
|
|
|
|
|
|
|
|
|
|
|
|
|
| Banks |
|
|
26,115 |
|
|
|
— |
|
|
|
— |
|
|
|
69,533 |
|
|
|
— |
|
|
|
— |
|
|
|
39,566 |
|
|
|
— |
|
|
|
135,214 |
|
| Corporations |
|
|
1,287,647 |
|
|
|
615,693 |
|
|
|
94,393 |
|
|
|
154,329 |
|
|
|
68,460 |
|
|
|
— |
|
|
|
59,559 |
|
|
|
— |
|
|
|
2,280,081 |
|
| |
|
|
|
|
|
|
|
|
|
|
|
|
|
|
|
|
|
|
|
|
|
|
|
|
|
|
|
|
|
|
|
|
|
|
|
|
| |
|
|
1,313,762 |
|
|
|
615,693 |
|
|
|
94,393 |
|
|
|
223,862 |
|
|
|
68,460 |
|
|
|
— |
|
|
|
99,125 |
|
|
|
— |
|
|
|
2,415,295 |
|
| |
|
|
|
|
|
|
|
|
|
|
|
|
|
|
|
|
|
|
|
|
|
|
|
|
|
|
|
|
|
|
|
|
|
|
|
|
| Securities measured at FVTPL |
|
|
29,194,048 |
|
|
|
1,962,916 |
|
|
|
1,018,407 |
|
|
|
1,039,955 |
|
|
|
247,657 |
|
|
|
89,394 |
|
|
|
18,051,809 |
|
|
|
— |
|
|
|
51,604,186 |
|
| Securities at FVOCI |
|
|
25,383,957 |
|
|
|
2,917,059 |
|
|
|
602,196 |
|
|
|
780,751 |
|
|
|
883,115 |
|
|
|
38,704 |
|
|
|
31,488,126 |
|
|
|
— |
|
|
|
62,093,908 |
|
| Securities at amortized cost |
|
|
14,169,681 |
|
|
|
9,931 |
|
|
|
— |
|
|
|
1,090,606 |
|
|
|
1,357,949 |
|
|
|
— |
|
|
|
41,343,326 |
|
|
|
— |
|
|
|
57,971,493 |
|
| |
|
|
|
|
|
|
|
|
|
|
|
|
|
|
|
|
|
|
|
|
|
|
|
|
|
|
|
|
|
|
|
|
|
|
|
|
| |
|
|
121,597,888 |
|
|
|
63,643,479 |
|
|
|
24,965,955 |
|
|
|
48,274,232 |
|
|
|
7,108,860 |
|
|
|
6,778,907 |
|
|
|
132,126,477 |
|
|
|
209,108,350 |
|
|
|
613,604,148 |
|
| |
|
|
|
|
|
|
|
|
|
|
|
|
|
|
|
|
|
|
|
|
|
|
|
|
|
|
|
|
|
|
|
|
|
|
|
|
| |
|
|
|
|
|
|
|
|
|
|
|
|
|
|
|
|
|
|
|
|
|
|
|
|
|
|
|
|
|
|
|
|
|
|
|
|
| Guarantees |
|
|
2,444,168 |
|
|
|
8,998,689 |
|
|
|
3,403,653 |
|
|
|
115,912 |
|
|
|
224,439 |
|
|
|
112,755 |
|
|
|
2,576,924 |
|
|
|
350,006 |
|
|
|
18,226,546 |
|
| Loan commitments and other liabilities related to credit |
|
|
17,871,585 |
|
|
|
28,414,045 |
|
|
|
10,535,492 |
|
|
|
3,918,854 |
|
|
|
2,242,493 |
|
|
|
462,976 |
|
|
|
15,669,405 |
|
|
|
126,140,427 |
|
|
|
205,255,277 |
|
| |
|
|
|
|
|
|
|
|
|
|
|
|
|
|
|
|
|
|
|
|
|
|
|
|
|
|
|
|
|
|
|
|
|
|
|
|
| |
|
W |
20,315,753 |
|
|
|
37,412,734 |
|
|
|
13,939,145 |
|
|
|
4,034,766 |
|
|
|
2,466,932 |
|
|
|
575,731 |
|
|
|
18,246,329 |
|
|
|
126,490,433 |
|
|
|
223,481,823 |
|
| |
|
|
|
|
|
|
|
|
|
|
|
|
|
|
|
|
|
|
|
|
|
|
|
|
|
|
|
|
|
|
|
|
|
|
|
|
(*) The composition details by industry are net book value less allowances.
SHINHAN FINANCIAL GROUP CO., LTD. AND SUBSIDIARIES
Notes to the Consolidated Financial Statements
(In millions of won)
|
Financial risk management (continued) |
i) Market risk management from trading positions
i-1)
Concept of Market risk
Market risk is defined as the risk of loss of trading account position of financial institutions due to changes on market price, such as interest rates, exchange rates and stock prices, etc. and is divided into general market risks and individual risks. A general market risk refers to a loss from price variability caused by events affecting the market as a whole, such as interest rates, exchange rates and stock prices; and an individual risk refers to a loss from price variability related to individual events of securities issuer, such as bonds and stocks.
i-2)
Market Risk Management Method
The basic principle of market risk management in the trading sector is to maintain the maximum possible loss due to market risk within a certain level. To this end, the Group sets and operates VaR limits, investment limits, position limits, sensitivity limits, and loss limits from the portfolio to individual desks. These limits are managed daily by the department in charge of risk management, independent from the operating department.
Trading positions refer to securities, foreign exchange positions, and derivative financial instruments held for the purpose of obtaining short-term trading gains. As a method of measuring market risk, VaR (Value at Risk) is typical, and it is a statistical measurement of the potential maximum loss that can occur due to changes in market conditions. VaR calculates the standard method market risk using the Group Market Risk Measurement System (TRMS), and Shinhan Bank and Shinhan Financial Investment use their own internal model market risk calculation system.
Stress tests are conducted to supplement risk measurement by statistical methods and to manage losses that may arise from rapid changes in the economic environment.
Shinhan Bank measures the market risk of linear products, such as stocks and bonds, as well as
non-linear
products, such as options by applying historical simulation method of 99% confidence level-based VaR. Trading position data is automatically interfaced into management system, and the system conducts VaR measurement and manages the limit. In addition, the Bank sets loss limit, sensitivity limit, investment limit, stress limit, etc. for Trading Department and desks, and monitors daily.
Shinhan Securities measures daily market risk by applying historical simulation VaR method of 99.9% confidence level-based VaR. Historical simulation VaR method does not require assumption on a particular distribution since the method derives scenarios directly from historical market data, and measures
non-linear
products, such as options, in details. In addition to the VaR limit, the Shinhan Securities sets and manages issuance and transaction limit, and stop-loss limit for each department.
SHINHAN FINANCIAL GROUP CO., LTD. AND SUBSIDIARIES
Notes to the Consolidated Financial Statements
(In millions of won)
|
Financial risk management (continued) |
An analysis of the Group’s requisite capital in light of the market risk for trading positions as of and for the years ended December 31, 2021 and 2022 based on the standard guidelines for risk management promulgated by the Financial Supervisory Service, is as follows:
|
|
|
|
|
|
|
|
|
|
|
|
|
|
|
|
|
| |
|
|
|
| |
|
|
|
|
|
|
|
|
|
|
|
|
| Interest rate risk |
|
W |
587,482 |
|
|
|
625,298 |
|
|
|
557,622 |
|
|
|
576,515 |
|
| Stock price risk |
|
|
209,101 |
|
|
|
231,137 |
|
|
|
179,415 |
|
|
|
219,900 |
|
| Foreign exchange risk |
|
|
274,140 |
|
|
|
301,271 |
|
|
|
245,232 |
|
|
|
299,909 |
|
| Commodity risk |
|
|
8,544 |
|
|
|
9,571 |
|
|
|
8,043 |
|
|
|
8,043 |
|
| Option volatility risk |
|
|
16,404 |
|
|
|
30,244 |
|
|
|
1,269 |
|
|
|
19,032 |
|
| |
|
|
|
|
|
|
|
|
|
|
|
|
|
|
|
|
| |
|
W |
1,095,671 |
|
|
|
1,197,521 |
|
|
|
991,581 |
|
|
|
1,123,399 |
|
| |
|
|
|
|
|
|
|
|
|
|
|
|
|
|
|
|
| |
|
| |
|
|
|
| |
|
|
|
|
|
|
|
|
|
|
|
|
| Interest rate risk |
|
W |
485,531 |
|
|
|
526,936 |
|
|
|
447,425 |
|
|
|
447,425 |
|
| Stock price risk |
|
|
217,845 |
|
|
|
242,341 |
|
|
|
196,879 |
|
|
|
242,341 |
|
| Foreign exchange risk |
|
|
334,543 |
|
|
|
374,984 |
|
|
|
293,437 |
|
|
|
344,415 |
|
| Commodity risk |
|
|
11,624 |
|
|
|
14,309 |
|
|
|
9,213 |
|
|
|
9,213 |
|
| Option volatility risk |
|
|
64,208 |
|
|
|
71,811 |
|
|
|
43,374 |
|
|
|
70,770 |
|
| |
|
|
|
|
|
|
|
|
|
|
|
|
|
|
|
|
| |
|
W |
1,113,751 |
|
|
|
1,230,381 |
|
|
|
990,328 |
|
|
|
1,114,164 |
|
| |
|
|
|
|
|
|
|
|
|
|
|
|
|
|
|
|
The analyses of the
ten-day
99% confidence level-based VaR for managing market risk for trading positions of Shinhan Bank as of and for the years ended December 31, 2021 and 2022 are as follows:
|
|
|
|
|
|
|
|
|
|
|
|
|
|
|
|
|
| |
|
|
|
| |
|
|
|
|
|
|
|
|
|
|
|
|
| Interest rate risk |
|
W |
28,749 |
|
|
|
55,773 |
|
|
|
17,537 |
|
|
|
28,030 |
|
| Stock price risk |
|
|
11,583 |
|
|
|
21,340 |
|
|
|
3,850 |
|
|
|
19,618 |
|
| Foreign exchange risk (*) |
|
|
159,165 |
|
|
|
185,514 |
|
|
|
136,936 |
|
|
|
161,978 |
|
| Option volatility risk |
|
|
162 |
|
|
|
368 |
|
|
|
29 |
|
|
|
60 |
|
| Commodity risk |
|
|
11 |
|
|
|
151 |
|
|
|
— |
|
|
|
8 |
|
| Portfolio diversification effect |
|
|
(25,023 |
) |
|
|
(52,611 |
) |
|
|
(13,207 |
) |
|
|
(17,470 |
) |
| |
|
|
|
|
|
|
|
|
|
|
|
|
|
|
|
|
| |
|
W |
174,647 |
|
|
|
210,535 |
|
|
|
145,145 |
|
|
|
192,224 |
|
| |
|
|
|
|
|
|
|
|
|
|
|
|
|
|
|
|
SHINHAN FINANCIAL GROUP CO., LTD. AND SUBSIDIARIES
Notes to the Consolidated Financial Statements
(In millions of won)
|
Financial risk management (continued) |
|
|
|
|
|
|
|
|
|
|
|
|
|
|
|
|
|
| |
|
|
|
| |
|
|
|
|
|
|
|
|
|
|
|
|
| Interest rate risk |
|
W |
44,719 |
|
|
|
64,628 |
|
|
|
24,322 |
|
|
|
53,777 |
|
| Stock price risk |
|
|
20,303 |
|
|
|
24,879 |
|
|
|
13,443 |
|
|
|
21,659 |
|
| Foreign exchange risk (*) |
|
|
191,013 |
|
|
|
262,319 |
|
|
|
161,760 |
|
|
|
252,453 |
|
| Option volatility risk |
|
|
84 |
|
|
|
211 |
|
|
|
25 |
|
|
|
110 |
|
| Commodity risk |
|
|
13 |
|
|
|
193 |
|
|
|
— |
|
|
|
27 |
|
| Portfolio diversification effect |
|
|
(33,760 |
) |
|
|
(77,335 |
) |
|
|
(10,872 |
) |
|
|
(62,957 |
) |
| |
|
|
|
|
|
|
|
|
|
|
|
|
|
|
|
|
| |
|
W |
222,372 |
|
|
|
274,895 |
|
|
|
188,678 |
|
|
|
265,069 |
|
| |
|
|
|
|
|
|
|
|
|
|
|
|
|
|
|
|
| |
(*) |
Both trading and non-trading accounts are included. |
The analyses of Shinhan Card’s requisite capital in light of the market risk for trading positions as of and for the years ended December 31 2021 and 2022, based on the standard guidelines for risk management promulgated by the Financial Supervisory Service, are as follows:
|
|
|
|
|
|
|
|
|
|
|
|
|
|
|
|
|
| |
|
|
|
| |
|
|
|
|
|
|
|
|
|
|
|
|
| Interest rate risk(*) |
|
W |
1,996 |
|
|
|
2,350 |
|
|
|
1,700 |
|
|
|
1,700 |
|
|
|
|
|
|
|
|
|
|
|
|
|
|
|
|
|
|
| |
|
|
|
| |
|
|
|
|
|
|
|
|
|
|
|
|
| Interest rate risk(*) |
|
W |
1,784 |
|
|
|
2,401 |
|
|
|
1,650 |
|
|
|
1,801 |
|
| |
(*) |
Foreign subsidiaries are excluded from the calculation. |
The analyses of the
ten-day
99.9
% confidence level-based VaR for managing market risk for trading positions of Shinhan Securities as of and for the years ended December 31, 2021 and 2022 are as follows:
|
|
|
|
|
|
|
|
|
|
|
|
|
|
|
|
|
| |
|
|
|
| |
|
|
|
|
|
|
|
|
|
|
|
|
| Interest rate risk |
|
W |
21,079 |
|
|
|
35,503 |
|
|
|
7,724 |
|
|
|
27,207 |
|
| Stock price risk |
|
|
31,668 |
|
|
|
62,315 |
|
|
|
15,856 |
|
|
|
33,295 |
|
| Foreign exchange risk |
|
|
24,354 |
|
|
|
43,826 |
|
|
|
2,548 |
|
|
|
28,594 |
|
| Option volatility risk |
|
|
49,345 |
|
|
|
96,355 |
|
|
|
31,155 |
|
|
|
79,589 |
|
| Portfolio diversification effect |
|
|
(47,759 |
) |
|
|
(104,149 |
) |
|
|
(7,380 |
) |
|
|
(58,241 |
) |
| |
|
|
|
|
|
|
|
|
|
|
|
|
|
|
|
|
| |
|
W |
78,687 |
|
|
|
133,850 |
|
|
|
49,903 |
|
|
|
110,444 |
|
| |
|
|
|
|
|
|
|
|
|
|
|
|
|
|
|
|
SHINHAN FINANCIAL GROUP CO., LTD. AND SUBSIDIARIES
Notes to the Consolidated Financial Statements
(In millions of won)
|
Financial risk management (continued) |
|
|
|
|
|
|
|
|
|
|
|
|
|
|
|
|
|
| |
|
|
|
| |
|
|
|
|
|
|
|
|
|
|
|
|
| Interest rate risk |
|
W |
30,003 |
|
|
|
44,131 |
|
|
|
17,123 |
|
|
|
39,578 |
|
| Stock price risk |
|
|
36,100 |
|
|
|
63,956 |
|
|
|
14,507 |
|
|
|
25,762 |
|
| Foreign exchange risk |
|
|
31,709 |
|
|
|
63,480 |
|
|
|
13,452 |
|
|
|
63,480 |
|
| Option volatility risk |
|
|
70,021 |
|
|
|
103,928 |
|
|
|
40,806 |
|
|
|
43,102 |
|
| Portfolio diversification effect |
|
|
(64,641 |
) |
|
|
(147,826 |
) |
|
|
(9,066 |
) |
|
|
(74,885 |
) |
| |
|
|
|
|
|
|
|
|
|
|
|
|
|
|
|
|
| |
|
W |
103,192 |
|
|
|
127,669 |
|
|
|
76,822 |
|
|
|
97,037 |
|
| |
|
|
|
|
|
|
|
|
|
|
|
|
|
|
|
|
i-6)
Shinhan Life Insurance
The analyses of the
ten-day
99.9% confidence level-based VaR for managing market risk for trading positions of Shinhan Life Insurance as of and for the years ended December 31, 2021 and 2022 are as follows:
|
|
|
|
|
|
|
|
|
|
|
|
|
|
|
|
|
| |
|
|
|
| |
|
|
|
|
|
|
|
|
|
|
|
|
| Interest rate risk |
|
W |
4,161 |
|
|
|
9,262 |
|
|
|
457 |
|
|
|
1,259 |
|
| Stock price risk |
|
|
8,938 |
|
|
|
15,009 |
|
|
|
1,909 |
|
|
|
6,303 |
|
| Foreign exchange risk |
|
|
7,680 |
|
|
|
13,746 |
|
|
|
481 |
|
|
|
11,404 |
|
| Option volatility risk |
|
|
1,252 |
|
|
|
2,828 |
|
|
|
26 |
|
|
|
47 |
|
| |
|
|
|
|
|
|
|
|
|
|
|
|
|
|
|
|
| |
|
W |
22,031 |
|
|
|
40,845 |
|
|
|
2,873 |
|
|
|
19,013 |
|
| |
|
|
|
|
|
|
|
|
|
|
|
|
|
|
|
|
|
|
|
|
|
|
|
|
|
|
|
|
|
|
|
|
|
| |
|
|
|
| |
|
|
|
|
|
|
|
|
|
|
|
|
| Interest rate risk |
|
W |
3,412 |
|
|
|
6,756 |
|
|
|
1,253 |
|
|
|
3,415 |
|
| Stock price risk |
|
|
9,441 |
|
|
|
11,034 |
|
|
|
6,206 |
|
|
|
9,505 |
|
| Foreign exchange risk |
|
|
13,403 |
|
|
|
30,111 |
|
|
|
818 |
|
|
|
23,286 |
|
| Option volatility risk |
|
|
179 |
|
|
|
493 |
|
|
|
11 |
|
|
|
494 |
|
| |
|
|
|
|
|
|
|
|
|
|
|
|
|
|
|
|
| |
|
W |
26,435 |
|
|
|
48,394 |
|
|
|
8,288 |
|
|
|
36,700 |
|
| |
|
|
|
|
|
|
|
|
|
|
|
|
|
|
|
|
ii) Interest rate risk management from
non-trading
positions
Interest rate risk refers to the possibility of a decrease in net interest income or in net asset value that occurs when interest rates fluctuate unfavorably from the Group’s financial position. The Group manages changes in net interest income or net asset value that occur due to changes in interest rates by early predicting the factors of interest rate risk fluctuation related to the Group’s net interest income and net asset value through the interest rate risk management.
Shinhan Financial Group’s major financial subsidiaries manage interest rate risks independently by the risk management organization and the treasury department, and have internal regulations on interest rate risk management strategies, procedures, organization, measurement, and major assumptions.
SHINHAN FINANCIAL GROUP CO., LTD. AND SUBSIDIARIES
Notes to the Consolidated Financial Statements
(In millions of won)
|
Financial risk management (continued) |
One of the key indicators of managing interest rate risk is the Earnings at Risk (EaR) from an earning perspective and the Value at Risk (VaR) from an economic value perspective. Interest rate VaR represents the maximum anticipated loss in a net present value calculation, whereas interest rate EaR represents the maximum anticipated loss in a net interest income calculation for the immediately following
one-year
period, in each case, as a result of negative movements in interest rates.
The precision of risk management system differs by each subsidiary. Interest rate VaR and interest rate EaR are measured by internal method or IRRBB (Interest Rate Risk In The Banking Book), and interest rate risk limits are set and monitored based on the interest rate VaR. In accordance with the amendments in Regulations for Supervision of Financial Holding Companies, the Group measures the interest rate risk using the Basel III based IRRBB, which measures the interest rate risk more precisely than the existing BIS standard framework by segmenting maturities of interest rates, reflecting customer behavior models and diversifying interest rate shocks. The interest rate VaR scenario based IRRBB measures ① parallel up shock ② parallel down shock ③ steepener shock ④ flattener shock ⑤ short rate up shock ⑥ short rate down shock. By the parallel up shock and parallel down shock, the interest rate EaR scenario measures the scenario value with the largest loss as interest rate risk. Under the existing BIS standard framework, ± 200bp parallel shock scenario is applied to all currency. However, as the shock width is set differently by currency and period, interest rate risk is measured significantly by the IRRBB (e.g. (KRW) Parallel ± 300bp, Short Term ± 400bp, Long Term ± 200bp, (USD) Parallel ± 200bp, Short Term ± 300bp, Long Term ± 150bp). In the IRRBB method, the existing interest rate VaR and the interest rate EaR are expressed as Δ EVE (Economic Value of Equity) and Δ NII (Net Interest Income), respectively.
Since impacts of each subsidiary on changes of interest rates are differentiated by portfolios, the Group is preparing to respond proactively while monitoring the financial market and regulatory environment, and making efforts to hedge or reduce interest rate risk. In addition, the subsidiaries conduct the crisis analysis on changes in market interest rates and report it to management and the Group.
In particular, through its ALM (Asset and Liability Management) system, Shinhan Bank measures and manages its interest rate risk based on various analytical measures such as interest rate gap, duration gap and NPV (Net Present Value) and NII (Net Interest Income) simulations, and monitors on a monthly basis its interest rate VaR limits, interest rate EaR (Earnings at Risk) limits and interest rate gap ratio limits.
The details of interest rate VaR and EaR for major subsidiaries for as of December 31, 2021 and 2022 are as follows:
|
|
|
|
|
|
|
|
|
| |
|
|
|
|
|
|
| ΔEVE (*1) |
|
W |
774,352 |
|
|
|
1,046,136 |
|
| ΔNII (*2) |
|
|
96,145 |
|
|
|
599,941 |
|
|
|
|
|
|
|
|
|
|
| |
|
|
|
|
|
|
| ΔEVE (*1) |
|
W |
831,361 |
|
|
|
1,249,597 |
|
| ΔNII (*2) |
|
|
672,303 |
|
|
|
693,911 |
|
SHINHAN FINANCIAL GROUP CO., LTD. AND SUBSIDIARIES
Notes to the Consolidated Financial Statements
(In millions of won)
|
Financial risk management (continued) |
|
|
|
|
|
|
|
|
|
| |
|
|
|
|
|
|
| ΔEVE (*1) |
|
W |
186,587 |
|
|
|
212,135 |
|
| ΔNII (*2) |
|
|
187,548 |
|
|
|
95,076 |
|
ii-6)
Shinhan Life Insurance
|
|
|
|
|
|
|
|
|
| |
|
|
|
|
|
|
| ΔEVE (*1) |
|
W |
2,751,977 |
|
|
|
2,353,230 |
|
| ΔNII (*2) |
|
|
84,812 |
|
|
|
62,923 |
|
| |
(*1) |
ΔEVE is the change in economic value of equity capital that can arise from changes in interest rates that affect the present value of assets, liabilities and off-balance sheet items by using the Basel III standard based IRRBB method. |
| |
(*2) |
ΔNII is the change in net interest income that can occur over the next year due to changes in interest rates by using the Basel III standard based IRRBB method. |
iii) Foreign exchange risk
Exposure to foreign exchange risk can be defined as the difference (net position) between assets and liabilities presented in foreign currency, including derivative financial instruments linked to foreign exchange rate. Foreign exchange risk is a factor that causes market risk of the trading position and is managed by the Group under the market risk management system.
The management of Shinhan Bank’s foreign exchange position is centralized at the S&T Center. Dealers in the S&T Center manage Shinhan Bank’s overall position within the set limits through spot trading, forward contracts, currency options, futures and swaps and foreign exchange swaps. Shinhan Bank sets a limit for net open positions by currency and the limits for currencies other than the U.S. dollars (USD), Japanese yen (JPY), Euros (EUR) and Chinese yuan (CNY) are set in order to minimize exposures from the other foreign exchange trading.
SHINHAN FINANCIAL GROUP CO., LTD. AND SUBSIDIARIES
Notes to the Consolidated Financial Statements
(In millions of won)
|
Financial risk management (continued) |
Foreign currency denominated assets and liabilities as of December 31, 2021 and 2022 are as follows:
|
|
|
|
|
|
|
|
|
|
|
|
|
|
|
|
|
|
|
|
|
|
|
|
|
| |
|
|
|
| |
|
|
|
|
|
|
|
|
|
|
|
|
|
|
|
|
|
|
| |
|
|
|
|
|
|
|
|
|
|
|
|
|
|
|
|
|
|
|
|
|
|
|
|
| Cash and due from banks at amortized cost |
|
W |
4,958,621 |
|
|
|
1,878,286 |
|
|
|
479,644 |
|
|
|
700,378 |
|
|
|
3,630,253 |
|
|
|
11,647,182 |
|
| Due from banks at FVTPL |
|
|
34,262 |
|
|
|
— |
|
|
|
— |
|
|
|
— |
|
|
|
— |
|
|
|
34,262 |
|
| Loans at FVTPL |
|
|
534,098 |
|
|
|
— |
|
|
|
— |
|
|
|
— |
|
|
|
— |
|
|
|
534,098 |
|
| Loan at amortized cost |
|
|
24,443,325 |
|
|
|
9,901,710 |
|
|
|
975,680 |
|
|
|
5,090,928 |
|
|
|
10,093,297 |
|
|
|
50,504,940 |
|
| Securities at FVTPL |
|
|
5,417,837 |
|
|
|
15,557 |
|
|
|
577,157 |
|
|
|
233 |
|
|
|
553,519 |
|
|
|
6,564,303 |
|
| Derivative assets |
|
|
863,223 |
|
|
|
526 |
|
|
|
10,440 |
|
|
|
1,429 |
|
|
|
33,576 |
|
|
|
909,194 |
|
| Securities at FVOCI |
|
|
4,264,191 |
|
|
|
162,023 |
|
|
|
240,705 |
|
|
|
397,010 |
|
|
|
998,246 |
|
|
|
6,062,175 |
|
| Securities at amortized cost |
|
|
1,306,357 |
|
|
|
241,232 |
|
|
|
69,282 |
|
|
|
80,133 |
|
|
|
1,812,470 |
|
|
|
3,509,474 |
|
| Other financial assets |
|
|
4,347,761 |
|
|
|
242,919 |
|
|
|
324,886 |
|
|
|
173,906 |
|
|
|
927,110 |
|
|
|
6,016,582 |
|
| |
|
|
|
|
|
|
|
|
|
|
|
|
|
|
|
|
|
|
|
|
|
|
|
|
| |
|
W |
46,169,675 |
|
|
|
12,442,253 |
|
|
|
2,677,794 |
|
|
|
6,444,017 |
|
|
|
18,048,471 |
|
|
|
85,782,210 |
|
| |
|
|
|
|
|
|
|
|
|
|
|
|
|
|
|
|
|
|
|
|
|
|
|
|
| |
|
|
|
|
|
|
|
|
|
|
|
|
|
|
|
|
|
|
|
|
|
|
|
|
| Deposits |
|
W |
20,060,092 |
|
|
|
10,642,720 |
|
|
|
1,376,168 |
|
|
|
4,820,793 |
|
|
|
9,766,248 |
|
|
|
46,666,021 |
|
| Financial liabilities at FVTPL |
|
|
7,114 |
|
|
|
— |
|
|
|
— |
|
|
|
— |
|
|
|
581,458 |
|
|
|
588,572 |
|
| Derivative liabilities |
|
|
496,616 |
|
|
|
418 |
|
|
|
12,042 |
|
|
|
1,712 |
|
|
|
13,642 |
|
|
|
524,430 |
|
| Borrowings |
|
|
7,518,545 |
|
|
|
940,877 |
|
|
|
181,027 |
|
|
|
463,098 |
|
|
|
931,802 |
|
|
|
10,035,349 |
|
| Debt securities issued |
|
|
8,887,807 |
|
|
|
137,022 |
|
|
|
892,220 |
|
|
|
— |
|
|
|
982,736 |
|
|
|
10,899,785 |
|
| Financial liabilities designated at FVTPL |
|
|
1,553,683 |
|
|
|
— |
|
|
|
— |
|
|
|
— |
|
|
|
— |
|
|
|
1,553,683 |
|
| Other financial liabilities |
|
|
3,806,778 |
|
|
|
116,544 |
|
|
|
195,387 |
|
|
|
551,976 |
|
|
|
1,112,455 |
|
|
|
5,783,140 |
|
| |
|
|
|
|
|
|
|
|
|
|
|
|
|
|
|
|
|
|
|
|
|
|
|
|
| |
|
W |
42,330,635 |
|
|
|
11,837,581 |
|
|
|
2,656,844 |
|
|
|
5,837,579 |
|
|
|
13,388,341 |
|
|
|
76,050,980 |
|
| |
|
|
|
|
|
|
|
|
|
|
|
|
|
|
|
|
|
|
|
|
|
|
|
|
| Net domestic and foreign currency exposure |
|
W |
3,839,040 |
|
|
|
604,672 |
|
|
|
20,950 |
|
|
|
606,438 |
|
|
|
4,660,130 |
|
|
|
9,731,230 |
|
Off-balance derivative exposure |
|
|
(419,387 |
) |
|
|
(62,614 |
) |
|
|
325,000 |
|
|
|
(95,526 |
) |
|
|
(2,113,543 |
) |
|
|
(2,366,070 |
) |
| |
|
|
|
|
|
|
|
|
|
|
|
|
|
|
|
|
|
|
|
|
|
|
|
|
| Net foreign currency exposure |
|
W |
3,419,653 |
|
|
|
542,058 |
|
|
|
345,950 |
|
|
|
510,912 |
|
|
|
2,546,587 |
|
|
|
7,365,160 |
|
| |
|
|
|
|
|
|
|
|
|
|
|
|
|
|
|
|
|
|
|
|
|
|
|
|
SHINHAN FINANCIAL GROUP CO., LTD. AND SUBSIDIARIES
Notes to the Consolidated Financial Statements
(In millions of won)
|
Financial risk management (continued) |
|
|
|
|
|
|
|
|
|
|
|
|
|
|
|
|
|
|
|
|
|
|
|
|
|
| |
|
|
|
| |
|
|
|
|
|
|
|
|
|
|
|
|
|
|
|
|
|
|
| |
|
|
|
|
|
|
|
|
|
|
|
|
|
|
|
|
|
|
|
|
|
|
|
|
| Cash and due from banks at amortized cost |
|
W |
6,905,793 |
|
|
|
2,071,000 |
|
|
|
263,746 |
|
|
|
715,471 |
|
|
|
4,848,097 |
|
|
|
14,804,107 |
|
| Due from banks at FVTPL |
|
|
26,116 |
|
|
|
— |
|
|
|
— |
|
|
|
— |
|
|
|
— |
|
|
|
26,116 |
|
| Loans at FVTPL |
|
|
291,678 |
|
|
|
— |
|
|
|
239,520 |
|
|
|
— |
|
|
|
— |
|
|
|
531,198 |
|
| Loan at amortized cost |
|
|
29,077,790 |
|
|
|
10,608,558 |
|
|
|
1,735,218 |
|
|
|
5,021,722 |
|
|
|
10,639,672 |
|
|
|
57,082,960 |
|
| Securities at FVTPL |
|
|
4,569,547 |
|
|
|
4,894 |
|
|
|
718,381 |
|
|
|
425 |
|
|
|
362,497 |
|
|
|
5,655,744 |
|
| Derivative assets |
|
|
1,476,251 |
|
|
|
2,585 |
|
|
|
33,613 |
|
|
|
4,598 |
|
|
|
33,866 |
|
|
|
1,550,913 |
|
| Securities at FVOCI |
|
|
5,911,909 |
|
|
|
180,352 |
|
|
|
287,774 |
|
|
|
498,367 |
|
|
|
1,191,984 |
|
|
|
8,070,386 |
|
| Securities at amortized cost |
|
|
1,442,437 |
|
|
|
203,102 |
|
|
|
96,701 |
|
|
|
110,997 |
|
|
|
1,705,337 |
|
|
|
3,558,574 |
|
| Other financial assets |
|
|
3,471,591 |
|
|
|
597,067 |
|
|
|
563,242 |
|
|
|
344,126 |
|
|
|
1,555,264 |
|
|
|
6,531,290 |
|
| |
|
|
|
|
|
|
|
|
|
|
|
|
|
|
|
|
|
|
|
|
|
|
|
|
| |
|
W |
53,173,112 |
|
|
|
13,667,558 |
|
|
|
3,938,195 |
|
|
|
6,695,706 |
|
|
|
20,336,717 |
|
|
|
97,811,288 |
|
| |
|
|
|
|
|
|
|
|
|
|
|
|
|
|
|
|
|
|
|
|
|
|
|
|
| |
|
|
|
|
|
|
|
|
|
|
|
|
|
|
|
|
|
|
|
|
|
|
|
|
| Deposits |
|
W |
25,719,297 |
|
|
|
11,812,723 |
|
|
|
1,633,007 |
|
|
|
5,035,481 |
|
|
|
11,769,661 |
|
|
|
55,970,169 |
|
| Financial liabilities at FVTPL |
|
|
10,038 |
|
|
|
— |
|
|
|
— |
|
|
|
— |
|
|
|
422,006 |
|
|
|
432,044 |
|
| Derivative liabilities |
|
|
1,345,476 |
|
|
|
1,899 |
|
|
|
59,206 |
|
|
|
3,074 |
|
|
|
77,662 |
|
|
|
1,487,317 |
|
| Borrowings |
|
|
9,976,462 |
|
|
|
1,349,529 |
|
|
|
182,926 |
|
|
|
85,862 |
|
|
|
1,226,389 |
|
|
|
12,821,168 |
|
| Debt securities issued |
|
|
10,774,062 |
|
|
|
352,677 |
|
|
|
675,600 |
|
|
|
108,864 |
|
|
|
1,495,991 |
|
|
|
13,407,194 |
|
| Financial liabilities designated at FVTPL |
|
|
1,077,789 |
|
|
|
— |
|
|
|
— |
|
|
|
— |
|
|
|
— |
|
|
|
1,077,789 |
|
| Other financial liabilities |
|
|
4,282,674 |
|
|
|
259,683 |
|
|
|
621,770 |
|
|
|
889,138 |
|
|
|
1,520,382 |
|
|
|
7,573,647 |
|
| |
|
|
|
|
|
|
|
|
|
|
|
|
|
|
|
|
|
|
|
|
|
|
|
|
| |
|
W |
53,185,798 |
|
|
|
13,776,511 |
|
|
|
3,172,509 |
|
|
|
6,122,419 |
|
|
|
16,512,091 |
|
|
|
92,769,328 |
|
| |
|
|
|
|
|
|
|
|
|
|
|
|
|
|
|
|
|
|
|
|
|
|
|
|
| Net domestic and foreign currency exposure |
|
W |
(12,686 |
) |
|
|
(108,953 |
) |
|
|
765,686 |
|
|
|
573,287 |
|
|
|
3,824,626 |
|
|
|
5,041,960 |
|
Off-balance derivative exposure |
|
|
3,692,999 |
|
|
|
711,180 |
|
|
|
(466,451 |
) |
|
|
(55,705 |
) |
|
|
(1,836,929 |
) |
|
|
2,045,094 |
|
| |
|
|
|
|
|
|
|
|
|
|
|
|
|
|
|
|
|
|
|
|
|
|
|
|
| Net foreign currency exposure |
|
W |
3,680,313 |
|
|
|
602,227 |
|
|
|
299,235 |
|
|
|
517,582 |
|
|
|
1,987,697 |
|
|
|
7,087,054 |
|
| |
|
|
|
|
|
|
|
|
|
|
|
|
|
|
|
|
|
|
|
|
|
|
|
|
SHINHAN FINANCIAL GROUP CO., LTD. AND SUBSIDIARIES
Notes to the Consolidated Financial Statements
(In millions of won)
|
Financial risk management (continued) |
Liquidity risk refers to the risk of unexpected losses (such as the disposal of assets abnormal pricing, the procurement of high interest rates, etc.) or insolvency due to inconsistency in funding periods between assets and liabilities or a sudden outflow of funds.
Each subsidiary seeks to minimize liquidity risk through early detection of risk factors related to the sourcing and managing of funding that may cause volatility in liquidity and by ensuring that it maintains an appropriate level of liquidity through systematic management. At the Group level, the Group manages liquidity risk by conducting monthly stress tests that compare liquidity requirements under normal situations against those under three types of stress situations, namely, the group-specific internal crisis, crisis in the external market and a combination of internal and external crisis. Therefore, the Group is checking the liquidity side for abnormalities in preparation for the usual crisis.
In addition, in order to
pre-emptively
and comprehensively manage liquidity risk, the Group measures and monitors liquidity risk management using various indices, including the ‘limit management index’, ‘early warning index’ and ‘monitoring index’.
Shinhan Bank applies the following basic principles for liquidity risk management:
| |
• |
|
Raise funding in sufficient amounts, at the optimal time at reasonable costs; |
| |
• |
|
Maintain risk at appropriate levels and preemptively manage them through a prescribed risk limit system and an early warning signal detection system; |
| |
• |
|
Secure stable sources of revenue and minimize actual losses by implementing an effective asset-liability management system based on diversified sources of funding with varying maturities; |
| |
• |
|
Monitor and manage daily and intra-daily liquidity positions and risk exposures for timely payment and settlement of financial obligations due under both normal and crisis situations; |
| |
• |
|
Conduct periodic contingency analysis in anticipation of any potential liquidity crisis and establish and implement emergency plans in case of a crisis actually happening; and |
| |
• |
|
Consider liquidity-related costs, benefits of and risks in determining the pricing of the Group’s products and services, employee performance evaluations and approval of launching of new products and services. |
Shinhan Card sets and operates a level that can withstand a
3-month
credit crunch for
liquidity. The Group defines and manages the level of caution, anxiety and risk for the real-life liquidity gap ratio, liquidity buffer ratio, and ABS weight compared to borrowings which are major indicators related to liquidity risk. A contingency plan has been established to prepare for a crisis.
SHINHAN FINANCIAL GROUP CO., LTD. AND SUBSIDIARIES
Notes to the Consolidated Financial Statements
(In millions of won)
|
Financial risk management (continued) |
The details of the composition of
non-derivative
financial instruments and derivative financial instruments by remaining period are as of December 31, 2021 and 2022 are as follows:
|
|
|
|
|
|
|
|
|
|
|
|
|
|
|
|
|
|
|
|
|
|
|
|
|
|
|
|
|
| |
|
|
|
| |
|
Less than 1
month |
|
|
1~3
months |
|
|
3~6
months |
|
|
6 months
~ 1 year |
|
|
1~5
years |
|
|
More than 5
years |
|
|
Total |
|
Non-derivative financial instruments: |
|
|
|
|
|
|
|
|
|
|
|
|
|
|
|
|
|
|
|
|
|
|
|
|
|
|
|
|
| Assets: |
|
|
|
|
|
|
|
|
|
|
|
|
|
|
|
|
|
|
|
|
|
|
|
|
|
|
|
|
| Cash and due from banks at amortized cost |
|
W |
24,864,116 |
|
|
|
796,046 |
|
|
|
329,809 |
|
|
|
1,151,073 |
|
|
|
108,491 |
|
|
|
1,299,438 |
|
|
|
28,548,973 |
|
| Due from banks at fair value through profit or loss |
|
|
34,263 |
|
|
|
— |
|
|
|
— |
|
|
|
— |
|
|
|
— |
|
|
|
— |
|
|
|
34,263 |
|
| Loans at fair value through profit or loss |
|
|
170,540 |
|
|
|
628,905 |
|
|
|
117,975 |
|
|
|
49,932 |
|
|
|
563,246 |
|
|
|
167,284 |
|
|
|
1,697,882 |
|
| Loans at amortized cost |
|
|
32,258,357 |
|
|
|
45,442,330 |
|
|
|
57,821,874 |
|
|
|
89,630,955 |
|
|
|
129,534,255 |
|
|
|
75,571,202 |
|
|
|
430,258,973 |
|
| Securities at fair value through profit or loss |
|
|
51,899,638 |
|
|
|
106,637 |
|
|
|
385,952 |
|
|
|
608,957 |
|
|
|
2,024,069 |
|
|
|
5,776,840 |
|
|
|
60,802,093 |
|
| Securities at fair value through other comprehensive income |
|
|
60,818,846 |
|
|
|
1,204,770 |
|
|
|
91,704 |
|
|
|
634,600 |
|
|
|
1,249,183 |
|
|
|
897,270 |
|
|
|
64,896,373 |
|
| Securities at amortized cost |
|
|
515,883 |
|
|
|
2,542,470 |
|
|
|
1,992,334 |
|
|
|
4,273,021 |
|
|
|
18,358,433 |
|
|
|
36,658,577 |
|
|
|
64,340,718 |
|
| Other financial assets |
|
|
21,052,012 |
|
|
|
50,602 |
|
|
|
25,096 |
|
|
|
372,536 |
|
|
|
253,373 |
|
|
|
1,800,309 |
|
|
|
23,553,928 |
|
| |
|
|
|
|
|
|
|
|
|
|
|
|
|
|
|
|
|
|
|
|
|
|
|
|
|
|
|
|
| |
|
W |
191,613,655 |
|
|
|
50,771,760 |
|
|
|
60,764,744 |
|
|
|
96,721,074 |
|
|
|
152,091,050 |
|
|
|
122,170,920 |
|
|
|
674,133,203 |
|
| |
|
|
|
|
|
|
|
|
|
|
|
|
|
|
|
|
|
|
|
|
|
|
|
|
|
|
|
|
| Liabilities: |
|
|
|
|
|
|
|
|
|
|
|
|
|
|
|
|
|
|
|
|
|
|
|
|
|
|
|
|
| Deposits(*2) |
|
W |
212,378,477 |
|
|
|
36,147,003 |
|
|
|
40,879,482 |
|
|
|
59,303,450 |
|
|
|
17,046,796 |
|
|
|
2,589,696 |
|
|
|
368,344,904 |
|
| Financial liabilities at fair value through profit or loss |
|
|
1,371,503 |
|
|
|
— |
|
|
|
— |
|
|
|
— |
|
|
|
— |
|
|
|
— |
|
|
|
1,371,503 |
|
| Borrowings |
|
|
13,159,909 |
|
|
|
3,928,317 |
|
|
|
3,643,545 |
|
|
|
5,171,542 |
|
|
|
14,168,441 |
|
|
|
3,649,507 |
|
|
|
43,721,261 |
|
| Debt securities issued |
|
|
4,833,061 |
|
|
|
7,033,973 |
|
|
|
7,257,291 |
|
|
|
17,537,101 |
|
|
|
41,799,782 |
|
|
|
5,334,848 |
|
|
|
83,796,056 |
|
| Financial liabilities designated at fair value through profit or loss |
|
|
332,597 |
|
|
|
294,931 |
|
|
|
586,682 |
|
|
|
1,298,402 |
|
|
|
4,165,201 |
|
|
|
1,346,057 |
|
|
|
8,023,870 |
|
| Other financial liabilities |
|
|
26,754,163 |
|
|
|
175,952 |
|
|
|
136,110 |
|
|
|
568,997 |
|
|
|
579,871 |
|
|
|
159,352 |
|
|
|
28,374,445 |
|
| |
|
|
|
|
|
|
|
|
|
|
|
|
|
|
|
|
|
|
|
|
|
|
|
|
|
|
|
|
| |
|
W |
258,829,710 |
|
|
|
47,580,176 |
|
|
|
52,503,110 |
|
|
|
83,879,492 |
|
|
|
77,760,091 |
|
|
|
13,079,460 |
|
|
|
533,632,039 |
|
| |
|
|
|
|
|
|
|
|
|
|
|
|
|
|
|
|
|
|
|
|
|
|
|
|
|
|
|
|
| Off balance(*3): |
|
|
|
|
|
|
|
|
|
|
|
|
|
|
|
|
|
|
|
|
|
|
|
|
|
|
|
|
| Guarantee contracts |
|
W |
16,745,707 |
|
|
|
— |
|
|
|
— |
|
|
|
— |
|
|
|
— |
|
|
|
— |
|
|
|
16,745,707 |
|
| Other liabilities related to loan commitments |
|
|
193,853,866 |
|
|
|
— |
|
|
|
— |
|
|
|
— |
|
|
|
— |
|
|
|
— |
|
|
|
193,853,866 |
|
| |
|
|
|
|
|
|
|
|
|
|
|
|
|
|
|
|
|
|
|
|
|
|
|
|
|
|
|
|
| |
|
W |
210,599,573 |
|
|
|
— |
|
|
|
— |
|
|
|
— |
|
|
|
— |
|
|
|
— |
|
|
|
210,599,573 |
|
| |
|
|
|
|
|
|
|
|
|
|
|
|
|
|
|
|
|
|
|
|
|
|
|
|
|
|
|
|
| Derivatives |
|
W |
380,609 |
|
|
|
23,508 |
|
|
|
11,867 |
|
|
|
23,099 |
|
|
|
(363,034 |
) |
|
|
47,464 |
|
|
|
123,513 |
|
SHINHAN FINANCIAL GROUP CO., LTD. AND SUBSIDIARIES
Notes to the Consolidated Financial Statements
(In millions of won)
|
Financial risk management (continued) |
|
|
|
|
|
|
|
|
|
|
|
|
|
|
|
|
|
|
|
|
|
|
|
|
|
|
|
|
|
| |
|
|
|
| |
|
Less than
1 month |
|
|
1~3
months |
|
|
3~6
months |
|
|
6 months
~ 1 year |
|
|
1~5
years |
|
|
More than
5 years |
|
|
Total |
|
Non-derivative financial instruments: |
|
|
|
|
|
|
|
|
|
|
|
|
|
|
|
|
|
|
|
|
|
|
|
|
|
|
|
|
| Assets: |
|
|
|
|
|
|
|
|
|
|
|
|
|
|
|
|
|
|
|
|
|
|
|
|
|
|
|
|
| Cash and due from banks at amortized cost |
|
W |
25,149,737 |
|
|
|
974,982 |
|
|
|
529,653 |
|
|
|
1,795,509 |
|
|
|
126,607 |
|
|
|
1,087,249 |
|
|
|
29,663,737 |
|
| Due from banks at fair value through profit or loss |
|
|
26,116 |
|
|
|
— |
|
|
|
— |
|
|
|
— |
|
|
|
— |
|
|
|
— |
|
|
|
26,116 |
|
| Loans at fair value through profit or loss |
|
|
424,585 |
|
|
|
858,019 |
|
|
|
58,705 |
|
|
|
141,706 |
|
|
|
735,426 |
|
|
|
329,636 |
|
|
|
2,548,077 |
|
| Loans at amortized cost |
|
|
40,117,301 |
|
|
|
50,209,078 |
|
|
|
62,027,337 |
|
|
|
95,214,850 |
|
|
|
138,145,726 |
|
|
|
85,266,419 |
|
|
|
470,980,711 |
|
| Securities at fair value through profit or loss |
|
|
42,441,397 |
|
|
|
124,005 |
|
|
|
452,662 |
|
|
|
436,486 |
|
|
|
2,823,913 |
|
|
|
7,941,405 |
|
|
|
54,219,868 |
|
| Securities at fair value through other comprehensive income |
|
|
54,294,050 |
|
|
|
1,664,172 |
|
|
|
506,614 |
|
|
|
955,692 |
|
|
|
5,508,063 |
|
|
|
748,761 |
|
|
|
63,677,352 |
|
| Securities at amortized cost |
|
|
518,445 |
|
|
|
2,048,707 |
|
|
|
1,331,479 |
|
|
|
5,383,089 |
|
|
|
26,724,733 |
|
|
|
36,906,942 |
|
|
|
72,913,395 |
|
| Other financial assets |
|
|
17,681,452 |
|
|
|
88,720 |
|
|
|
53,740 |
|
|
|
539,107 |
|
|
|
341,421 |
|
|
|
1,793,979 |
|
|
|
20,498,419 |
|
| |
|
|
|
|
|
|
|
|
|
|
|
|
|
|
|
|
|
|
|
|
|
|
|
|
|
|
|
|
| |
|
W |
180,653,083 |
|
|
|
55,967,683 |
|
|
|
64,960,190 |
|
|
|
104,466,439 |
|
|
|
174,405,889 |
|
|
|
134,074,391 |
|
|
|
714,527,675 |
|
| |
|
|
|
|
|
|
|
|
|
|
|
|
|
|
|
|
|
|
|
|
|
|
|
|
|
|
|
|
| Liabilities: |
|
|
|
|
|
|
|
|
|
|
|
|
|
|
|
|
|
|
|
|
|
|
|
|
|
|
|
|
| Deposits (*2) |
|
W |
210,900,107 |
|
|
|
42,661,824 |
|
|
|
41,864,404 |
|
|
|
71,259,303 |
|
|
|
21,141,919 |
|
|
|
2,627,394 |
|
|
|
390,454,951 |
|
| Financial liabilities at fair value through profit or loss |
|
|
1,148,899 |
|
|
|
— |
|
|
|
— |
|
|
|
— |
|
|
|
— |
|
|
|
— |
|
|
|
1,148,899 |
|
| Borrowings |
|
|
11,960,133 |
|
|
|
4,760,298 |
|
|
|
4,798,388 |
|
|
|
7,249,539 |
|
|
|
12,298,388 |
|
|
|
9,024,107 |
|
|
|
50,090,853 |
|
| Debt securities issued |
|
|
4,563,916 |
|
|
|
8,368,614 |
|
|
|
9,646,088 |
|
|
|
16,486,221 |
|
|
|
37,534,713 |
|
|
|
5,157,377 |
|
|
|
81,756,929 |
|
| Financial liabilities designated at fair value through profit or loss |
|
|
276,430 |
|
|
|
725,909 |
|
|
|
706,117 |
|
|
|
1,511,517 |
|
|
|
4,063,511 |
|
|
|
1,092,827 |
|
|
|
8,376,311 |
|
| Other financial liabilities |
|
|
27,579,552 |
|
|
|
233,395 |
|
|
|
133,729 |
|
|
|
287,774 |
|
|
|
1,037,741 |
|
|
|
113,667 |
|
|
|
29,385,858 |
|
| |
|
|
|
|
|
|
|
|
|
|
|
|
|
|
|
|
|
|
|
|
|
|
|
|
|
|
|
|
| |
|
W |
256,429,037 |
|
|
|
56,750,040 |
|
|
|
57,148,726 |
|
|
|
96,794,354 |
|
|
|
76,076,272 |
|
|
|
18,015,372 |
|
|
|
561,213,801 |
|
| |
|
|
|
|
|
|
|
|
|
|
|
|
|
|
|
|
|
|
|
|
|
|
|
|
|
|
|
|
| Off balance (*3): |
|
|
|
|
|
|
|
|
|
|
|
|
|
|
|
|
|
|
|
|
|
|
|
|
|
|
|
|
| Guarantee contracts |
|
W |
18,226,546 |
|
|
|
— |
|
|
|
— |
|
|
|
— |
|
|
|
— |
|
|
|
— |
|
|
|
18,226,546 |
|
| Other liabilities related to loan commitments |
|
|
205,255,277 |
|
|
|
— |
|
|
|
— |
|
|
|
— |
|
|
|
— |
|
|
|
— |
|
|
|
205,255,277 |
|
| |
|
|
|
|
|
|
|
|
|
|
|
|
|
|
|
|
|
|
|
|
|
|
|
|
|
|
|
|
| |
|
W |
223,481,823 |
|
|
|
— |
|
|
|
— |
|
|
|
— |
|
|
|
— |
|
|
|
— |
|
|
|
223,481,823 |
|
| |
|
|
|
|
|
|
|
|
|
|
|
|
|
|
|
|
|
|
|
|
|
|
|
|
|
|
|
|
| Derivatives |
|
W |
(384,134) |
|
|
|
8,916 |
|
|
|
(7,058 |
) |
|
|
(220,528 |
) |
|
|
(1,211,454 |
) |
|
|
(24,069 |
) |
|
|
(1,838,327 |
) |
| (*1) |
These amounts include cash flows of principal and interest on financial assets and financial liabilities. |
| (*2) |
Demand deposits amounting to W 172,107,724 million and W 157,446,276 million as of December 31, 2021 and 2022 are included in the ‘Less than 1 month’ category, respectively. |
| (*3) |
Though guarantees, loan agreements, and other credit offerings provided by the Group exist, if the counterparty requests a payment, the Group should fulfill the obligation immediately. |
SHINHAN FINANCIAL GROUP CO., LTD. AND SUBSIDIARIES
Notes to the Consolidated Financial Statements
(In millions of won)
|
Financial risk management (continued) |
| |
|
Measurement of fair value |
The fair values of financial instruments being traded in an active market are determined by the published market prices of each period end. The published market prices of financial instruments being held by the Group are based on the trading agencies’ notifications.
If the market for a financial instrument is not active, such as OTC (Over The Counter market) derivatives, fair value is determined either by using a valuation technique or independent third-party valuation service. The Group uses its judgment to select a variety of methods and make rational assumptions that are mainly based on market conditions existing at the end of each reporting period.
The fair value of financial instruments is determined using valuation techniques; a method of using recent transactions between independent parties with reasonable judgment and willingness to trade, a method of referring to the current fair value of other financial instruments that are substantially identical, discounted cash flow model and option pricing models. For example, the fair value of an interest rate swap is calculated as the present value of the expected future cash flows, and the fair value of foreign exchange forwarding contract is calculated by applying the public forward exchange rate at the end of the reporting period.
The Group classifies and discloses fair value of financial instruments into the following three-level hierarchy:
| |
• |
|
Level 1: Financial instruments measured at quoted prices from active markets are classified as fair value level 1. |
| |
• |
|
Level 2: Financial instruments measured using valuation techniques where all significant inputs are observable market data are classified as level 2. |
| |
• |
|
Level 3: Financial instruments measured using valuation techniques where one or more significant inputs are not based on observable market data are classified as level 3. |
SHINHAN FINANCIAL GROUP CO., LTD. AND SUBSIDIARIES
Notes to the Consolidated Financial Statements
(In millions of won)
|
Financial risk management (continued) |
i) Financial instruments measured at fair value
| |
i-1) |
The fair value hierarchy of financial instruments presented at their fair values in the statements of financial position as of December 31, 2021 and 2022 are as follows: |
|
|
|
|
|
|
|
|
|
|
|
|
|
|
|
|
|
| |
|
|
|
| |
|
|
|
|
|
|
|
|
|
|
|
|
| |
|
|
|
|
|
|
|
|
|
|
|
|
|
|
|
|
| Due from banks measured at FVTPL |
|
W |
— |
|
|
|
— |
|
|
|
34,262 |
|
|
|
34,262 |
|
| Loans at FVTPL (*1) |
|
|
— |
|
|
|
790,510 |
|
|
|
892,834 |
|
|
|
1,683,344 |
|
| Securities at FVTPL: |
|
|
|
|
|
|
|
|
|
|
|
|
|
|
|
|
| Debt securities and other securities (*2) |
|
|
7,250,389 |
|
|
|
40,396,692 |
|
|
|
10,580,066 |
|
|
|
58,227,147 |
|
| Equity securities |
|
|
942,433 |
|
|
|
107,416 |
|
|
|
1,325,466 |
|
|
|
2,375,315 |
|
| Gold/silver deposits |
|
|
83,691 |
|
|
|
— |
|
|
|
— |
|
|
|
83,691 |
|
| |
|
|
|
|
|
|
|
|
|
|
|
|
|
|
|
|
| |
|
|
8,276,513 |
|
|
|
40,504,108 |
|
|
|
11,905,532 |
|
|
|
60,686,153 |
|
| |
|
|
|
|
|
|
|
|
|
|
|
|
|
|
|
|
| Derivative assets: |
|
|
|
|
|
|
|
|
|
|
|
|
|
|
|
|
| Trading |
|
|
11,542 |
|
|
|
3,033,965 |
|
|
|
528,619 |
|
|
|
3,574,126 |
|
| Hedging |
|
|
— |
|
|
|
225,063 |
|
|
|
— |
|
|
|
225,063 |
|
| |
|
|
|
|
|
|
|
|
|
|
|
|
|
|
|
|
| |
|
|
11,542 |
|
|
|
3,259,028 |
|
|
|
528,619 |
|
|
|
3,799,189 |
|
| |
|
|
|
|
|
|
|
|
|
|
|
|
|
|
|
|
| Securities measured at FVOCI: |
|
|
|
|
|
|
|
|
|
|
|
|
|
|
|
|
| Debt securities |
|
|
24,951,761 |
|
|
|
38,855,158 |
|
|
|
— |
|
|
|
63,806,919 |
|
| Equity securities |
|
|
257,947 |
|
|
|
48,225 |
|
|
|
725,232 |
|
|
|
1,031,404 |
|
| |
|
|
|
|
|
|
|
|
|
|
|
|
|
|
|
|
| |
|
|
25,209,708 |
|
|
|
38,903,383 |
|
|
|
725,232 |
|
|
|
64,838,323 |
|
| |
|
|
|
|
|
|
|
|
|
|
|
|
|
|
|
|
| |
|
W |
33,497,763 |
|
|
|
83,457,029 |
|
|
|
14,086,479 |
|
|
|
131,041,271 |
|
| |
|
|
|
|
|
|
|
|
|
|
|
|
|
|
|
|
| |
|
|
|
|
|
|
|
|
|
|
|
|
|
|
|
|
| Financial liabilities measured at FVTPL: |
|
|
|
|
|
|
|
|
|
|
|
|
|
|
|
|
| Securities sold |
|
W |
787,767 |
|
|
|
— |
|
|
|
— |
|
|
|
787,767 |
|
| Gold/silver deposits |
|
|
581,458 |
|
|
|
— |
|
|
|
— |
|
|
|
581,458 |
|
| |
|
|
|
|
|
|
|
|
|
|
|
|
|
|
|
|
| |
|
|
1,369,225 |
|
|
|
— |
|
|
|
— |
|
|
|
1,369,225 |
|
| |
|
|
|
|
|
|
|
|
|
|
|
|
|
|
|
|
| Financial liabilities designated at fair value through profit or loss: |
|
|
|
|
|
|
|
|
|
|
|
|
|
|
|
|
| Derivatives-combined securities (*2) |
|
|
— |
|
|
|
401,345 |
|
|
|
7,622,525 |
|
|
|
8,023,870 |
|
| Derivative liabilities: |
|
|
|
|
|
|
|
|
|
|
|
|
|
|
|
|
| Trading |
|
|
191,061 |
|
|
|
2,862,761 |
|
|
|
153,933 |
|
|
|
3,207,755 |
|
| Hedging |
|
|
— |
|
|
|
196,060 |
|
|
|
182,749 |
|
|
|
378,809 |
|
| |
|
|
|
|
|
|
|
|
|
|
|
|
|
|
|
|
| |
|
|
191,061 |
|
|
|
3,058,821 |
|
|
|
336,682 |
|
|
|
3,586,564 |
|
| |
|
|
|
|
|
|
|
|
|
|
|
|
|
|
|
|
| |
|
W |
1,560,286 |
|
|
|
3,460,166 |
|
|
|
7,959,207 |
|
|
|
12,979,659 |
|
| |
|
|
|
|
|
|
|
|
|
|
|
|
|
|
|
|
| (*1) |
Of the Financial assets at FVTPL invested by the Group, P-note’s valuation of amount related to Lime Asset Management is W 157.9 billion. As of December 31, 2021, in this regard, international disputes are under way, the Group has estimated its fair value based on financial information within the recent audit report of underlying assets since it doesn’t have fair market value observable through active trading markets. |
SHINHAN FINANCIAL GROUP CO., LTD. AND SUBSIDIARIES
Notes to the Consolidated Financial Statements
(In millions of won)
|
Financial risk management (continued) |
| |
Accounting estimates and assumptions used in preparing consolidated financial statements may lead to adjustment in response to changes in uncertainty, such as information and market conditions available in the future. In addition, the ultimate impact on the business, financial condition, performance, and liquidity of the Group is unpredictable. |
| (*2) |
Financial instruments (Beneficiary certificates: W 300.2 billion and derivatives-combined securities: W 300.2 billion) related to GEN2 Partners asset management were delayed in repurchase for the year ended December 31, 2021. The Group estimated fair value using the net asset value based on the most recent data available for the repurchase suspension fund. Since then, it has an uncertainty in measuring fair value due to market conditions. |
| (*3) |
The valuation amount for the derivatives classified as Level 3 by Shinhan Securities Corp. are W 72,980 million in financial assets at FVTPL, W 7,622,526 million in financial liabilities designated at fair value through profit or loss, W 527,726 million in derivative assets, and W 153,084 million in derivative liabilities. The above level 3 derivatives measure fair value using the internal valuation model of Shinhan Securities Co., Ltd. |
SHINHAN FINANCIAL GROUP CO., LTD. AND SUBSIDIARIES
Notes to the Consolidated Financial Statements
(In millions of won)
|
Financial risk management (continued) |
|
|
|
|
|
|
|
|
|
|
|
|
|
|
|
|
|
| |
|
|
|
| |
|
|
|
|
|
|
|
|
|
|
|
|
| |
|
|
|
|
|
|
|
|
|
|
|
|
|
|
|
|
| Due from banks measured at FVTPL |
|
W |
— |
|
|
|
26,116 |
|
|
|
— |
|
|
|
26,116 |
|
| Loans at FVTPL (*1) |
|
|
— |
|
|
|
957,543 |
|
|
|
1,431,637 |
|
|
|
2,389,180 |
|
| Securities at FVTPL: |
|
|
|
|
|
|
|
|
|
|
|
|
|
|
|
|
| Debt securities and other securities (*2) |
|
|
5,757,167 |
|
|
|
34,154,575 |
|
|
|
11,616,475 |
|
|
|
51,528,217 |
|
| Equity securities |
|
|
623,094 |
|
|
|
5,044 |
|
|
|
1,996,050 |
|
|
|
2,624,188 |
|
| Gold/silver deposits |
|
|
75,969 |
|
|
|
— |
|
|
|
— |
|
|
|
75,969 |
|
| |
|
|
|
|
|
|
|
|
|
|
|
|
|
|
|
|
| |
|
|
6,456,230 |
|
|
|
34,159,619 |
|
|
|
13,612,525 |
|
|
|
54,228,374 |
|
| |
|
|
|
|
|
|
|
|
|
|
|
|
|
|
|
|
| Derivative assets: |
|
|
|
|
|
|
|
|
|
|
|
|
|
|
|
|
| Trading |
|
|
47,550 |
|
|
|
5,586,798 |
|
|
|
529,144 |
|
|
|
6,163,492 |
|
| Hedging |
|
|
— |
|
|
|
298,304 |
|
|
|
— |
|
|
|
298,304 |
|
| |
|
|
|
|
|
|
|
|
|
|
|
|
|
|
|
|
| |
|
47,550 |
|
|
5,885,102 |
|
|
529,144 |
|
|
6,461,796 |
|
| |
|
|
|
|
|
|
|
|
|
|
|
|
|
|
|
|
| Securities measured at FVOCI: |
|
|
|
|
|
|
|
|
|
|
|
|
|
|
|
|
| Debt securities |
|
|
24,784,510 |
|
|
|
37,309,398 |
|
|
|
— |
|
|
|
62,093,908 |
|
| Equity securities |
|
|
691,257 |
|
|
|
— |
|
|
|
876,554 |
|
|
|
1,567,811 |
|
| |
|
|
|
|
|
|
|
|
|
|
|
|
|
|
|
|
| |
|
25,475,767 |
|
|
37,309,398 |
|
|
876,554 |
|
|
63,661,719 |
|
| |
|
|
|
|
|
|
|
|
|
|
|
|
|
|
|
|
| |
|
W 31,979,547 |
|
|
78,337,778 |
|
|
16,449,860 |
|
|
126,767,185 |
|
| |
|
|
|
|
|
|
|
|
|
|
|
|
|
|
|
|
| |
|
|
|
|
|
|
|
|
|
|
|
|
|
|
|
|
| Financial liabilities measured at FVTPL: |
|
|
|
|
|
|
|
|
|
|
|
|
|
|
|
|
| Securities sold |
|
W |
724,104 |
|
|
|
— |
|
|
|
— |
|
|
|
724,104 |
|
| Gold/silver deposits |
|
|
422,006 |
|
|
|
— |
|
|
|
— |
|
|
|
422,006 |
|
| |
|
|
|
|
|
|
|
|
|
|
|
|
|
|
|
|
| |
|
1,146,110 |
|
|
— |
|
|
— |
|
|
1,146,110 |
|
| |
|
|
|
|
|
|
|
|
|
|
|
|
|
|
|
|
| Financial liabilities designated at fair value through profit or loss: |
|
|
|
|
|
|
|
|
|
|
|
|
|
|
|
|
| Derivatives-combined securities (*2) |
|
|
— |
|
|
|
389,132 |
|
|
|
7,930,909 |
|
|
|
8,320,041 |
|
| Debt securities issued |
|
|
— |
|
|
|
47,327 |
|
|
|
— |
|
|
|
47,327 |
|
| |
|
— |
|
|
436,459 |
|
|
7,930,909 |
|
|
8,367,368 |
|
| Derivative liabilities: |
|
|
|
|
|
|
|
|
|
|
|
|
|
|
|
|
| Trading |
|
|
248,462 |
|
|
|
5,809,597 |
|
|
|
467,522 |
|
|
|
6,525,581 |
|
| Hedging |
|
|
— |
|
|
|
835,365 |
|
|
|
343,759 |
|
|
|
1,179,124 |
|
| |
|
|
|
|
|
|
|
|
|
|
|
|
|
|
|
|
| |
|
248,462 |
|
|
6,644,962 |
|
|
811,281 |
|
|
7,704,705 |
|
| |
|
|
|
|
|
|
|
|
|
|
|
|
|
|
|
|
| |
|
W 1,394,572 |
|
|
7,081,421 |
|
|
8,742,190 |
|
|
17,218,183 |
|
| |
|
|
|
|
|
|
|
|
|
|
|
|
|
|
|
|
| (*1) |
Of the Financial assets at FVTPL invested by the Group, P-note’s valuation of amount related to Lime Asset Management is W 133.8 billion. As of December 31, 2022, in this regard, international disputes are under way, the Group has estimated its fair value based on financial information within the recent audit report of underlying assets since it doesn’t have fair market value observable through active trading markets. Accounting estimates and assumptions used in preparing consolidated financial statements may lead to adjustment in response to changes in uncertainty, such as information and market conditions available in the future. In addition, the ultimate impact on the business, financial condition, performance, and liquidity of the Group is unpredictable. |
SHINHAN FINANCIAL GROUP CO., LTD. AND SUBSIDIARIES
Notes to the Consolidated Financial Statements
(In millions of won)
|
Financial risk management (continued) |
| (*2) |
Financial instruments (Beneficiary certificates: W 221.7 billion and derivatives-combined securities: 221.7 billion) related to GEN2 Partners asset management were delayed in repurchase for the year ended December 31, 2022. The Group estimated fair value using the net asset value based on the most recent data available for the repurchase suspension fund. Since then, it has an uncertainty in measuring fair value due to market conditions. |
| (*3) |
The valuation amount for the derivatives classified as Level 3 by Shinhan Securities Corp. are W 75,925 million in financial assets at FVTPL, W 7,930,909 million in financial liabilities designated at fair value through profit or loss, 526,868 million in derivative assets, and W 468,028 million in derivative liabilities. The above level 3 derivatives measure fair value using the internal valuation model of Shinhan Securities Co., Ltd. |
i-2)
Classification of financial instruments as fair value level 3
The Group uses the evaluation value from evaluators who are qualified and external independent to determine the fair value for Group’s assets at the end of each reporting period. Changes in carrying values of financial instruments classified as Level 3 for the years ended December 31, 2021 and 2022 are as follows:
|
|
|
|
|
|
|
|
|
|
|
|
|
|
|
|
|
|
|
|
|
| |
|
|
|
| |
|
Financial
asset
at fair value
through profit or loss |
|
|
Securities
at fair value
through other
comprehensive
profit or loss |
|
|
Financial
liabilities
designated at fair
value through
profit or loss |
|
|
Derivative assets and
liabilities, net |
|
| |
|
Held for
trading |
|
|
Held for
hedging |
|
| Beginning balance |
|
W |
10,925,715 |
|
|
|
717,408 |
|
|
|
(8,141,504 |
) |
|
|
321,499 |
|
|
|
(102,024 |
) |
| Recognized in total comprehensive income for the year: |
|
|
|
|
|
|
|
|
|
|
|
|
|
|
|
|
|
|
|
|
| Recognized in profit (loss) for the year (*1) |
|
|
271,065 |
|
|
|
448 |
|
|
|
(273,536 |
) |
|
|
348,046 |
|
|
|
(80,725 |
) |
| Recognized in other comprehensive income (loss) for the year |
|
|
38,566 |
|
|
|
24,672 |
|
|
|
(1,526 |
) |
|
|
— |
|
|
|
— |
|
| |
|
|
|
|
|
|
|
|
|
|
|
|
|
|
|
|
|
|
|
|
| |
|
|
309,631 |
|
|
|
25,120 |
|
|
|
(275,062 |
) |
|
|
348,046 |
|
|
|
(80,725 |
) |
| Purchase |
|
|
4,792,810 |
|
|
|
21,440 |
|
|
|
— |
|
|
|
4,394 |
|
|
|
— |
|
| Issue |
|
|
— |
|
|
|
— |
|
|
|
(8,488,977 |
) |
|
|
— |
|
|
|
— |
|
| Settlement |
|
|
(3,498,968 |
) |
|
|
(38,736 |
) |
|
|
9,283,018 |
|
|
|
(299,633 |
) |
|
|
— |
|
| Reclassification (*3) |
|
|
(9,641 |
) |
|
|
— |
|
|
|
— |
|
|
|
— |
|
|
|
— |
|
| |
|
|
507,984 |
|
|
|
— |
|
|
|
— |
|
|
|
446 |
|
|
|
— |
|
| |
|
|
(194,903 |
) |
|
|
— |
|
|
|
— |
|
|
|
(66 |
) |
|
|
— |
|
| |
|
|
|
|
|
|
|
|
|
|
|
|
|
|
|
|
|
|
|
|
| Ending balance |
|
W |
12,832,628 |
|
|
|
725,232 |
|
|
|
(7,622,525 |
) |
|
|
374,686 |
|
|
|
(182,749 |
) |
| |
|
|
|
|
|
|
|
|
|
|
|
|
|
|
|
|
|
|
|
|
SHINHAN FINANCIAL GROUP CO., LTD. AND SUBSIDIARIES
Notes to the Consolidated Financial Statements
(In millions of won)
|
Financial risk management (continued) |
|
|
|
|
|
|
|
|
|
|
|
|
|
|
|
|
|
|
|
|
|
| |
|
|
|
| |
|
Financial
asset
at fair value
through profit or loss |
|
|
Securities
at fair value
through other
comprehensive
profit or loss |
|
|
Financial
liabilities
designated at fair
value through
profit or loss |
|
|
Derivative assets and
liabilities, net |
|
| |
Held for
trading |
|
|
Held for
hedging |
|
| Beginning balance |
|
W |
12,832,628 |
|
|
|
725,232 |
|
|
|
(7,622,525 |
) |
|
|
374,686 |
|
|
|
(182,749 |
) |
| Recognized in total comprehensive income for the year: |
|
|
|
|
|
|
|
|
|
|
|
|
|
|
|
|
|
|
|
|
| Recognized in profit (loss) for the
year (*1) |
|
|
21,694 |
|
|
|
— |
|
|
|
633,415 |
|
|
|
(484,756 |
) |
|
|
(161,010 |
) |
| Recognized in other comprehensive income (loss) for the year |
|
|
(152,921 |
) |
|
|
(705 |
) |
|
|
(5,919 |
) |
|
|
— |
|
|
|
— |
|
| |
|
|
|
|
|
|
|
|
|
|
|
|
|
|
|
|
|
|
|
|
| |
|
|
(131,227 |
) |
|
|
(705 |
) |
|
|
627,496 |
|
|
|
(484,756 |
) |
|
|
(161,010 |
) |
| Purchase |
|
|
5,878,937 |
|
|
|
162,937 |
|
|
|
— |
|
|
|
190,380 |
|
|
|
— |
|
| Issue |
|
|
— |
|
|
|
— |
|
|
|
(6,030,787 |
) |
|
|
— |
|
|
|
— |
|
| Settlement |
|
|
(3,479,624 |
) |
|
|
(10,910 |
) |
|
|
5,094,907 |
|
|
|
(18,763 |
) |
|
|
— |
|
| |
|
|
173,636 |
|
|
|
— |
|
|
|
— |
|
|
|
— |
|
|
|
— |
|
Transfer from level 3 (*2) |
|
|
(230,188 |
) |
|
|
— |
|
|
|
— |
|
|
|
75 |
|
|
|
— |
|
| |
|
|
|
|
|
|
|
|
|
|
|
|
|
|
|
|
|
|
|
|
| Ending balance |
|
W |
15,044,162 |
|
|
|
876,554 |
|
|
|
(7,930,909 |
) |
|
|
61,622 |
|
|
|
(343,759 |
) |
| |
|
|
|
|
|
|
|
|
|
|
|
|
|
|
|
|
|
|
|
|
| (*1) |
Recognized profit or loss of the changes in carrying value of financial instruments classified as Level 3 for the years ended December 31, 2021 and 2022 are included in the accounts of the statements of comprehensive income, of which the amounts and the related accounts are as follows: |
|
|
|
|
|
|
|
|
|
| |
|
|
|
| |
|
Amounts recognized in
profit or loss |
|
|
Recognized profit or loss from
the financial instruments held
as of December 31 |
|
| Net gain on financial assets at fair value through profit or loss |
|
W |
619,111 |
|
|
|
322,974 |
|
| Net gain (loss) on financial liabilities designated at fair value through profit or loss |
|
|
(273,536 |
) |
|
|
186,003 |
|
| Net gain on securities at fair value through other comprehensive income |
|
|
448 |
|
|
|
— |
|
| Net other operating expense |
|
|
(80,725 |
) |
|
|
(83,669 |
) |
| |
|
|
|
|
|
|
|
|
| |
|
W |
265,298 |
|
|
|
425,308 |
|
| |
|
|
|
|
|
|
|
|
SHINHAN FINANCIAL GROUP CO., LTD. AND SUBSIDIARIES
Notes to the Consolidated Financial Statements
(In millions of won)
|
Financial risk management (continued) |
|
|
|
|
|
|
|
|
|
| |
|
|
|
| |
|
Amounts recognized in
profit or loss |
|
|
Recognized profit or loss from
the financial instruments held
as of December 31 |
|
| Net loss on financial assets at fair value through profit or loss |
|
W |
(463,062) |
|
|
|
(607,708 |
) |
| Net gain on financial liabilities designated at fair value through profit or loss |
|
|
633,415 |
|
|
|
762,342 |
|
| Net gain on securities at fair value through other comprehensive income |
|
|
— |
|
|
|
— |
|
| Net other operating expense |
|
|
(161,010 |
) |
|
|
(161,010 |
) |
| |
|
|
|
|
|
|
|
|
| |
|
W |
9,343 |
|
|
|
(6,376 |
) |
| |
|
|
|
|
|
|
|
|
| (*2) |
The investment securities transferred to Level 3 as the availability of observable market data changed due to reasons such as suspension of trading, and the derivative instruments transferred to Level 3 as the availability of observable market data changed due to reasons such as changes in the valuation. |
| (*3) |
It has been replaced by investment assets in associates. |
| |
i-3) |
Valuation techniques and significant inputs not observable in markets |
| |
|
Valuation techniques and inputs used in measuring the fair value of financial instruments classified as level 2 as of December 31, 2021 and 2022 are as follows: |
|
|
|
|
|
|
|
|
|
|
|
| |
|
|
| Type of financial instrument |
|
Valuation
technique |
|
|
Carrying
value |
|
|
Significant inputs |
| |
|
|
|
|
|
|
|
|
|
|
| Financial asset at fair value through profit or loss |
|
|
|
|
|
|
|
|
|
|
| Debt securities |
|
|
DCF, NAV |
|
|
W |
41,187,202 |
|
|
Discount rate, interest rate, stock price and etc. |
| Equity securities |
|
|
NAV |
|
|
|
107,416 |
|
|
Price of underlying assets such as stocks, bonds, etc. |
| |
|
|
|
|
|
|
|
|
|
|
| |
|
|
|
|
|
|
41,294,618 |
|
|
|
| |
|
|
|
|
|
|
|
|
|
|
| Derivative assets |
|
|
|
|
|
|
|
|
|
|
| Trading |
|
|
Option model,
Implied forward |
|
|
|
3,033,965 |
|
|
Discount rate, foreign exchange rate, volatility, stock price and commodity index, etc. |
| Hedging |
|
|
interest rate, DCF |
|
|
|
225,063 |
|
|
|
| |
|
|
|
|
|
|
|
|
|
|
| |
|
|
|
|
|
|
3,259,028 |
|
|
|
| |
|
|
|
|
|
|
|
|
|
|
| Securities at fair value through other comprehensive income |
|
|
|
|
|
|
|
|
|
|
| Debt securities |
|
|
DCF |
|
|
|
38,855,158 |
|
|
Interest rate, discount rate and price of underlying assets such as stock, bonds, etc. |
| Equity securities |
|
|
NAV |
|
|
|
48,225 |
|
|
|
| |
|
|
|
|
|
|
|
|
|
|
| |
|
|
|
|
|
|
38,903,383 |
|
|
|
| |
|
|
|
|
|
|
|
|
|
|
| |
|
|
|
|
|
W |
83,457,029 |
|
|
|
| |
|
|
|
|
|
|
|
|
|
|
SHINHAN FINANCIAL GROUP CO., LTD. AND SUBSIDIARIES
Notes to the Consolidated Financial Statements
(In millions of won)
|
Financial risk management (continued) |
|
|
|
|
|
|
|
|
|
| |
|
|
| Type of financial instrument |
|
Valuation
technique |
|
Carrying
value |
|
|
Significant inputs |
| |
|
|
|
|
|
|
|
|
| Financial liabilities designated at fair value through profit or loss |
|
|
|
|
|
|
|
|
| Compound financial instruments |
|
Option model |
|
W |
401,345 |
|
|
Discount rate |
| Derivative liabilities |
|
|
|
|
|
|
|
|
| Trading |
|
Option model, |
|
|
2,862,761 |
|
|
Discount rate, foreign exchange rate, volatility, stock price and commodity |
| Hedging |
|
DCF |
|
|
196,060 |
|
|
index, etc. |
| |
|
|
|
|
|
|
|
|
| |
|
|
|
3,058,821 |
|
|
|
| |
|
|
|
|
|
|
|
|
| |
|
|
|
W 3,460,166 |
|
|
|
| |
|
|
|
|
|
|
|
|
|
|
|
|
|
|
|
|
|
|
|
| |
|
|
| Type of financial instrument |
|
Valuation
technique |
|
|
Carrying
value |
|
|
Significant inputs |
| |
|
|
|
|
|
|
|
|
|
|
| Financial asset at fair value through profit or loss |
|
|
|
|
|
|
|
|
|
|
| Debt securities |
|
|
DCF, NAV |
|
|
W |
35,138,234 |
|
|
Discount rate, interest rate, stock price and etc. |
| Equity securities |
|
|
NAV |
|
|
|
5,044 |
|
|
Price of underlying assets such as stocks, bonds, etc. |
| |
|
|
|
|
|
|
|
|
|
|
| |
|
|
|
|
|
|
35,143,278 |
|
|
|
| |
|
|
|
|
|
|
|
|
|
|
| Derivative assets |
|
|
|
|
|
|
|
|
|
|
| Trading |
|
|
Option model,
Implied forward
interest rate, DCF |
|
|
|
5,586,798 |
|
|
Discount rate, foreign exchange rate, volatility, stock price and commodity index, etc. |
| Hedging |
|
|
|
|
|
|
298,304 |
|
|
|
| |
|
|
|
|
|
|
|
|
|
|
| |
|
|
|
|
|
|
5,885,102 |
|
|
|
| |
|
|
|
|
|
|
|
|
|
|
| Securities at fair value through other comprehensive income |
|
|
|
|
|
|
|
|
|
|
| Debt securities |
|
|
DCF |
|
|
|
37,309,398 |
|
|
Interest rate, discount rate and price of underlying assets such as stock, bonds, etc. |
| |
|
|
|
|
|
|
|
|
|
|
| |
|
|
|
|
|
W |
78,337,778 |
|
|
|
| |
|
|
|
|
|
|
|
|
|
|
SHINHAN FINANCIAL GROUP CO., L
T
D. AND SUBSIDIARIES
Notes to the Consolidated Financial Statements
(In millions of won)
|
Financial risk management (continued) |
| |
|
|
Type of financial instrument |
|
|
|
|
|
|
|
|
|
|
|
|
|
|
|
|
|
|
|
|
|
|
|
|
|
|
|
|
|
|
| |
|
|
|
|
|
|
|
|
|
|
| Financial liabilities designated at fair value through profit or loss |
|
|
|
|
|
|
|
|
|
|
| Debt securities issued |
|
|
Option model |
|
|
W |
47,327 |
|
|
Discount rate, volatility |
| Compound financial instruments |
|
|
|
|
|
|
389,132 |
|
|
Discount rate |
| |
|
|
|
|
|
|
|
|
|
|
| |
|
|
|
|
|
|
436,459 |
|
|
|
| |
|
|
|
|
|
|
|
|
|
|
| Derivative liabilities |
|
|
|
|
|
|
|
|
|
|
| Trading |
|
|
Option model, DCF |
|
|
|
5,809,597 |
|
|
Discount rate, foreign exchange rate, volatility, stock price and commodity index, etc. |
| Hedging |
|
|
|
|
|
|
835,365 |
|
|
|
| |
|
|
|
|
|
|
|
|
|
|
| |
|
|
|
|
|
|
6,644,962 |
|
|
|
| |
|
|
|
|
|
|
|
|
|
|
| |
|
|
|
|
|
W |
7,081,421 |
|
|
|
| |
|
|
|
|
|
|
|
|
|
|
| |
|
Valuation techniques and significant inputs, but not observable, used in measuring the fair value of financial instruments classified as level 3 as of December 31, 2021 and 2022 are as follows: |
|
|
|
|
|
|
|
|
|
|
|
|
|
|
|
|
Type of financial instrument |
|
Valuation
technique |
|
|
Carrying
value(*2) |
|
|
Significant unobservable inputs |
|
Range |
| |
|
|
|
|
|
|
|
|
|
|
|
|
| Financial asset at fair value through profit or loss |
|
|
|
|
|
|
|
|
|
|
|
|
| Debt securities |
|
|
DCF, NAV,
Option model(*1) |
|
|
W |
11,507,162 |
|
|
The volatility of the underlying asset, Discount rate, Correlations and Growth rate |
|
19.48%~72.69%
0.07%~27.30%
23.17%~58.47% 0.00%~1.00% |
| Equity securities |
|
|
DCF, NAV,
Option model(*1),
Comparable
company analysis |
|
|
|
1,325,466 |
|
|
The volatility of the underlying asset, Discount rate, Correlations and Growth rate |
|
16.00%~32.00%
5.45%~16.35%
0.00%~54.00%
1.00% |
| |
|
|
|
|
|
|
|
|
|
|
|
|
| |
|
|
|
|
|
|
12,832,628 |
|
|
|
|
|
| |
|
|
|
|
|
|
|
|
|
|
|
|
| Derivative assets |
|
|
|
|
|
|
|
|
|
|
|
|
| Equity and foreign exchange related |
|
|
Option model(*1) |
|
|
|
28,783 |
|
|
The volatility of the underlying asset and Correlations |
|
2.29%~50.00%
-5.00%~91.00% |
| Interest rates related |
|
|
Option model(*1) |
|
|
|
6,029 |
|
|
The volatility of the underlying asset, Correlations and Discount rate |
|
0.70%
80.00%~82.00%
1.11%~1.83% |
| Credit and commodity related |
|
|
Option model(*1) |
|
|
|
493,807 |
|
|
The volatility of the underlying asset and Hazard Rate |
|
0.70%~4.70%
5.17%~93.69% |
| |
|
|
|
|
|
|
|
|
|
|
|
|
| |
|
|
|
|
|
|
528,619 |
|
|
|
|
|
| |
|
|
|
|
|
|
|
|
|
|
|
|
| Securities at fair value through other comprehensive income |
|
|
|
|
|
|
|
|
|
|
|
|
| Equity securities |
|
|
DCF, NAV,
Option model(*1), Comparable
company analysis |
|
|
|
725,232 |
|
|
The volatility of the underlying asset, Discount rate and Growth rate |
|
25.49% 9.80%~22.79% 0.00%~2.00% |
| |
|
|
|
|
|
|
|
|
|
|
|
|
| |
|
|
|
|
|
W |
14,086,479 |
|
|
|
|
|
| |
|
|
|
|
|
|
|
|
|
|
|
|
SHINHAN FINANCIAL GROUP CO., LTD. AND SUBSIDIARIES
Notes to the Consolidated Financial Statements
(In millions of won)
|
Financial risk management (continued) |
|
|
|
|
|
|
|
|
|
|
|
|
|
|
|
|
|
|
|
Type of financial instrument |
|
Valuation
technique |
|
|
Carrying
value(*2) |
|
|
Significant unobservable inputs |
|
Range |
|
| |
|
|
|
|
|
|
|
|
|
|
|
|
|
|
Financial liabilities at fair
value through profit or
loss |
|
|
|
|
|
|
|
|
|
|
|
|
|
|
| Equity related |
|
|
Option model(*1) |
|
|
W |
7,622,525 |
|
|
The volatility of the underlying asset, and Correlations |
|
|
0.50%~94.90% -12.00%~88.00% |
|
| Derivative liabilities |
|
|
|
|
|
|
|
|
|
|
|
|
|
|
| Equity and foreign
exchange related |
|
|
Option model(*1) |
|
|
|
13,214 |
|
|
The volatility of the underlying asset, and Correlations |
|
|
2.29%~42.00%
-5.00%~91.00% |
|
| Interest rates related |
|
|
Option model(*1) |
|
|
|
258,364 |
|
|
The volatility of the underlying asset, Regression coefficient, and Correlations |
|
|
0.46%~0.78%
0.00%~0.54%
0.00%~90.34% |
|
| Credit and commodity
related |
|
|
Option model(*1) |
|
|
|
65,104 |
|
|
The volatility of the underlying asset, and Hazard Rate |
|
|
1.90%~94.90%
5.17%~100.79% |
|
| |
|
|
|
|
|
|
|
|
|
|
|
|
|
|
| |
|
|
|
|
|
|
336,682 |
|
|
|
|
|
|
|
| |
|
|
|
|
|
|
|
|
|
|
|
|
|
|
| |
|
|
|
|
|
W |
7,959,207 |
|
|
|
|
|
|
|
| |
|
|
|
|
|
|
|
|
|
|
|
|
|
|
| (*1) |
Option model that the Group uses in derivative valuation includes Black-Scholes model, Hull-White model, Monte Carlo simulation, etc. |
| (*2) |
There is no disclosure for valuation techniques and input variables related to items where the carrying value is recognized as a reasonable approximation of fair value and the carrying value is disclosed at fair value. |
SHINHAN FINANCIAL GROUP CO., LTD. AND SUBSIDIARIES
Notes to the Consolidated Financial Statements
(In millions of won)
|
Financial risk management (continued) |
|
|
|
|
|
|
|
|
|
|
|
|
|
|
|
|
Type of financial instrument |
|
Valuation
technique |
|
|
Carrying
value(*2) |
|
|
Significant unobservable inputs |
|
Range |
| |
|
|
|
|
|
|
|
|
|
|
|
|
| Financial asset at fair value through profit or loss |
|
|
|
|
|
|
|
|
|
|
|
|
| Debt securities |
|
|
DCF, NAV,
Option
model(*1),
Income approach |
|
|
|
W 13,048,112 |
|
|
The volatility of the underlying asset, Discount rate, Correlations, Growth rate, and Liquidation Value |
|
0.60%~68.10%
2.92%~38.87%
15.94%~90.00% |
| Equity securities |
|
|
DCF, NAV,
Option
model(*1),
Comparable
company
analysis,
Transaction case
price |
|
|
|
1,996,050 |
|
|
The volatility of the underlying asset, Discount rate and Correlations |
|
20.50%~25.30%
5.59%~15.18%
11.90%~66.00% |
| |
|
|
|
|
|
|
|
|
|
|
|
|
| |
|
|
|
|
|
|
15,044,162 |
|
|
|
|
|
| |
|
|
|
|
|
|
|
|
|
|
|
|
| Derivative assets |
|
|
|
|
|
|
|
|
|
|
|
|
| Equity and foreign exchange related |
|
|
Option model(*1) |
|
|
|
54,541 |
|
|
The volatility of the underlying asset and Correlations |
|
4.89%~84.40%
7.30%~72.30% |
| Interest rates related |
|
|
Option model(*1) |
|
|
|
51,025 |
|
|
The volatility of the underlying asset and Correlations |
|
0.60%~1.10%
76.60%~78.90% |
| Credit and commodity related |
|
|
Option model(*1) |
|
|
|
423,578 |
|
|
The volatility of the underlying asset, Correlations and Hazard Rate |
|
42.20%~55.90%
99.9%
1.20%~3.60% |
| |
|
|
|
|
|
|
|
|
|
|
|
|
| |
|
|
|
|
|
|
529,144 |
|
|
|
|
|
| |
|
|
|
|
|
|
|
|
|
|
|
|
| Securities at fair value through other comprehensive income |
|
|
|
|
|
|
|
|
|
|
|
|
| Equity securities |
|
|
DCF, NAV,
Option
model(*1),
Comparable
company analysis |
|
|
|
876,554 |
|
|
The volatility of the underlying asset, Discount rate, Growth rate and Volatility |
|
28.62% 9.08%~19.14% 0.00%~2.00% 0.56%~1.21% |
| |
|
|
|
|
|
|
|
|
|
|
|
|
| |
|
|
|
|
|
|
W 16,449,860 |
|
|
|
|
|
| |
|
|
|
|
|
|
|
|
|
|
|
|
SHINHAN FINANCIAL GROUP CO., LTD. AND SUBSIDIARIES
Notes to the Consolidated Financial Statements
(In millions of won)
|
Financial risk management (continued) |
|
|
|
|
|
|
|
|
|
|
|
|
|
|
|
|
|
Type of financial instrument |
|
|
|
Carrying
value(*2) |
|
|
Significant unobservable inputs |
|
Range |
|
| |
|
|
|
|
|
|
|
|
|
|
|
|
Financial liabilities designated at fair value through profit or loss |
|
|
|
|
|
|
|
|
|
|
|
|
| Equity related |
|
Option model(*1) |
|
W |
7,930,909 |
|
|
The volatility of the underlying asset and Correlations |
|
|
0.20%~84.40% -44.20%~86.30% |
|
| Derivative liabilities |
|
|
|
|
|
|
|
|
|
|
|
|
| Equity and foreign exchange related |
|
Option model(*1) |
|
|
13,841 |
|
|
The volatility of the underlying asset and Correlations |
|
|
4.89%~84.40%
-42.30%~87.60% |
|
| Interest rates related |
|
Option model(*1) |
|
|
642,123 |
|
|
The volatility of the underlying asset, Regression coefficient and Correlations |
|
|
0.20%~1.10%
0.00%~1.46%
23.60%~90.34% |
|
| Credit and commodity related |
|
Option model(*1) |
|
|
155,317 |
|
|
The volatility of the underlying asset,
Correlations
and Hazard Rate |
|
|
0.20%~45.70%
23.60%~78.90%
1.20%~2.90% |
|
| |
|
|
|
|
|
|
|
|
|
|
|
|
| |
|
|
|
|
811,281 |
|
|
|
|
|
|
|
| |
|
|
|
|
|
|
|
|
|
|
|
|
| |
|
|
|
W |
8,742,190 |
|
|
|
|
|
|
|
| |
|
|
|
|
|
|
|
|
|
|
|
|
| (*1) |
Option model that the Group uses in derivative valuation includes Black-Scholes model, Hull-White model, Monte Carlo simulation, etc. |
| (*2) |
There is no disclosure for valuation techniques and input variables related to items where the carrying value is recognized as a reasonable approximation of fair value and the carrying value is disclosed at fair value. |
| |
i-4) |
Sensitivity for changing in unobservable inputs |
For level 3 fair value measurement, changing one or more of the unobservable inputs used to reasonably possible alternative assumptions would have the following effects on profit or loss, or other comprehensive income as of December 31, 2021 and 2022.
|
|
|
|
|
|
|
|
|
|
|
|
|
|
|
Favorable
changes |
|
|
Unfavorable
changes |
|
| |
|
|
|
|
|
|
|
|
| Effects on profit or loss for the period(*1),(*2): |
|
|
|
|
|
|
|
|
| Financial asset at fair value through profit or loss |
|
W |
39,084 |
|
|
|
(43,072 |
) |
| Derivative assets |
|
|
16,893 |
|
|
|
(11,809 |
) |
| |
|
|
|
|
|
|
|
|
| Securities at fair value through other comprehensive income(*2) |
|
|
38,865 |
|
|
|
(38,210 |
) |
| |
|
|
|
|
|
|
|
|
| |
|
W |
94,842 |
|
|
|
(93,091 |
) |
| |
|
|
|
|
|
|
|
|
| |
|
|
|
|
|
|
|
|
| Effects on profit or loss for the period(*1): |
|
|
|
|
|
|
|
|
| Financial liabilities designated at fair value through profit or loss |
|
W |
45,493 |
|
|
|
(50,845 |
) |
| Derivative liabilities |
|
|
25,326 |
|
|
|
(23,486 |
) |
| |
|
|
|
|
|
|
|
|
| |
|
W |
70,819 |
|
|
|
(74,331 |
) |
| |
|
|
|
|
|
|
|
|
SHINHAN FINANCIAL GROUP CO., LTD. AND SUBSIDIARIES
Notes to the Consolidated Financial Statements
(In millions of won)
|
Financial risk management (continued) |
|
|
|
|
|
|
|
|
|
|
|
| |
|
|
|
| |
|
Favorable
changes |
|
|
Unfavorable
changes |
|
| |
|
|
|
|
|
|
|
|
| Effects on profit or loss for the period(*1),(*2): |
|
|
|
|
|
|
|
|
| Financial asset at fair value through profit or loss |
|
W |
62,840 |
|
|
|
(59,865 |
) |
| Derivative assets |
|
|
12,499 |
|
|
|
(11,465 |
) |
| |
|
|
|
|
|
|
|
|
| Securities at fair value through other comprehensive income(*2) |
|
|
44,097 |
|
|
|
(32,469 |
) |
| |
|
|
|
|
|
|
|
|
| |
|
W |
119,436 |
|
|
|
(103,799 |
) |
| |
|
|
|
|
|
|
|
|
| |
|
|
|
|
|
|
|
|
| Effects on profit or loss for the period(*1): |
|
|
|
|
|
|
|
|
| Financial liabilities designated at fair value through profit or loss |
|
W |
57,121 |
|
|
|
(60,525 |
) |
| Derivative liabilities |
|
|
16,388 |
|
|
|
(16,908 |
) |
| |
|
|
|
|
|
|
|
|
| |
|
W |
73,509 |
|
|
|
(77,433 |
) |
| |
|
|
|
|
|
|
|
|
| |
(*1) |
Fair value changes are calculated by increasing or decreasing the volatility of the underlying asset(-10~10%p) or correlations (-10~10%p), a significant unobservable input. |
| |
(*2) |
Fair value changes are calculated by increasing or decreasing the growth rate and discount rate, which are a significant unobservable input, from -1%p to 1%p. |
ii) Financial instruments measured at amortized cost
| |
ii-1) |
The method of measuring the fair value of financial instruments measured at amortized cost is as follows: |
|
|
|
| |
|
Measurement methods of fair value |
| |
|
| Cash and due from banks |
|
The carrying value and the fair value for cash are identical and most of deposits are floating interest rate deposits or next day deposits of a short-term instrument. For this reason, the carrying value approximates fair value. |
| |
|
| Loans |
|
The fair value of the loans is measured by discounting the expected cash flow at the market interest rate and credit risk of the borrower. |
| |
|
| Securities |
|
An external professional evaluation agency is used to calculate the valuation amount using the market information. The agency calculates the fair value based on active market prices, and DCF model is used to calculate the fair value if there is no quoted price. |
| |
|
| Deposits and borrowings |
|
The carrying value and the fair value for demand deposits, cash management account deposits, call money as short-term instrument are identical. The fair value of others is measured by discounting the contractual cash flow at the market interest rate that takes into account the residual risk. |
| |
|
| Debt securities issued |
|
Where available, the fair value of deposits and borrowings is based on the published price quotations in an active market. In case there is no data for an active market price, it is measured by discounting the contractual cash flow at the market interest rate that takes into account the residual risk. |
SHINHAN FINANCIAL GROUP CO., LTD. AND SUBSIDIARIES
Notes to the Consolidated Financial Statements
(In millions of won)
|
Financial risk management (continued) |
|
|
|
| |
|
Measurement methods of fair value |
| |
|
| Other financial assets and other financial liabilities |
|
The carrying value is measured at fair value for short-term and suspense accounts, such as spot exchange, inter-bank fund transfer, and domestic exchange of payments, and for the remaining financial instruments, the present value is calculated by discounting the contractual cash flows at a discount rate which considered residual risk at the market interest rate. |
ii-2)
The carrying value and the fair value of financial instruments measured at amortized cost as of December 31, 2021 and 2022 are as follows:
|
|
|
|
|
|
|
|
|
|
|
|
|
|
|
|
|
| |
|
|
|
|
|
|
| |
|
|
|
|
|
|
|
|
|
|
|
|
| Assets: |
|
|
|
|
|
|
|
|
|
|
|
|
|
|
|
|
| Deposits measured at amortized cost |
|
W |
24,232,013 |
|
|
|
24,216,932 |
|
|
|
27,227,755 |
|
|
|
27,123,736 |
|
| Loans measured at amortized cost |
|
|
389,137,156 |
|
|
|
390,406,822 |
|
|
|
412,291,511 |
|
|
|
409,344,807 |
|
| |
|
|
|
|
|
|
|
|
|
|
|
|
|
|
|
|
| Securities measured at amortized cost |
|
|
|
|
|
|
|
|
|
|
|
|
|
|
|
|
| Government bonds |
|
|
34,679,301 |
|
|
|
34,377,110 |
|
|
|
38,371,463 |
|
|
|
33,820,827 |
|
| Financial institution bonds |
|
|
3,423,536 |
|
|
|
3,477,834 |
|
|
|
6,530,386 |
|
|
|
6,294,481 |
|
| Corporation bonds |
|
|
11,827,239 |
|
|
|
11,750,467 |
|
|
|
13,069,644 |
|
|
|
11,428,463 |
|
| |
|
|
|
|
|
|
|
|
|
|
|
|
|
|
|
|
| |
|
|
49,930,076 |
|
|
|
49,605,411 |
|
|
|
57,971,493 |
|
|
|
51,543,771 |
|
| |
|
|
|
|
|
|
|
|
|
|
|
|
|
|
|
|
| Other financial assets |
|
|
23,238,932 |
|
|
|
23,389,209 |
|
|
|
21,896,490 |
|
|
|
22,129,807 |
|
| |
|
|
|
|
|
|
|
|
|
|
|
|
|
|
|
|
| |
|
W |
486,538,177 |
|
|
|
487,618,374 |
|
|
|
519,387,249 |
|
|
|
510,142,121 |
|
| |
|
|
|
|
|
|
|
|
|
|
|
|
|
|
|
|
| Liabilities: |
|
|
|
|
|
|
|
|
|
|
|
|
|
|
|
|
| Deposit liabilities |
|
|
|
|
|
|
|
|
|
|
|
|
|
|
|
|
| Demand deposits |
|
W |
172,107,724 |
|
|
|
172,107,724 |
|
|
|
157,446,276 |
|
|
|
157,446,276 |
|
| Time deposits |
|
|
161,498,901 |
|
|
|
161,301,409 |
|
|
|
196,265,911 |
|
|
|
195,886,583 |
|
| Certificate of deposit |
|
|
16,576,536 |
|
|
|
16,606,894 |
|
|
|
14,921,375 |
|
|
|
14,748,736 |
|
| Issued bill deposit |
|
|
5,818,001 |
|
|
|
5,817,844 |
|
|
|
6,631,858 |
|
|
|
6,631,276 |
|
| CMA deposits |
|
|
5,246,478 |
|
|
|
5,246,478 |
|
|
|
4,634,010 |
|
|
|
4,634,010 |
|
| Others |
|
|
3,649,035 |
|
|
|
3,648,983 |
|
|
|
3,111,315 |
|
|
|
3,110,993 |
|
| |
|
|
|
|
|
|
|
|
|
|
|
|
|
|
|
|
| |
|
|
364,896,675 |
|
|
|
364,729,332 |
|
|
|
383,010,745 |
|
|
|
382,457,874 |
|
| |
|
|
|
|
|
|
|
|
|
|
|
|
|
|
|
|
| Borrowing debts: |
|
|
|
|
|
|
|
|
|
|
|
|
|
|
|
|
| Call-money |
|
|
1,534,611 |
|
|
|
1,534,611 |
|
|
|
1,276,301 |
|
|
|
1,276,301 |
|
| Bills sold |
|
|
9,032 |
|
|
|
9,019 |
|
|
|
15,057 |
|
|
|
15,006 |
|
| Bonds sold under repurchase agreements |
|
|
10,709,115 |
|
|
|
10,709,115 |
|
|
|
9,544,536 |
|
|
|
9,544,536 |
|
| Borrowings |
|
|
30,914,307 |
|
|
|
30,803,417 |
|
|
|
38,443,281 |
|
|
|
37,602,027 |
|
| |
|
|
|
|
|
|
|
|
|
|
|
|
|
|
|
|
| |
|
|
43,167,065 |
|
|
|
43,056,162 |
|
|
|
49,279,175 |
|
|
|
48,437,870 |
|
| |
|
|
|
|
|
|
|
|
|
|
|
|
|
|
|
|
| Debts: |
|
|
|
|
|
|
|
|
|
|
|
|
|
|
|
|
| Borrowings in Korean won |
|
|
69,288,982 |
|
|
|
69,081,140 |
|
|
|
63,927,063 |
|
|
|
62,059,253 |
|
| Borrowings in foreign currency |
|
|
10,860,381 |
|
|
|
11,076,757 |
|
|
|
13,361,720 |
|
|
|
13,051,576 |
|
| |
|
|
|
|
|
|
|
|
|
|
|
|
|
|
|
|
| |
|
|
80,149,363 |
|
|
|
80,157,897 |
|
|
|
77,288,783 |
|
|
|
75,110,829 |
|
| |
|
|
|
|
|
|
|
|
|
|
|
|
|
|
|
|
| Other financial liabilities |
|
|
29,880,879 |
|
|
|
29,872,186 |
|
|
|
32,099,649 |
|
|
|
31,790,397 |
|
| |
|
|
|
|
|
|
|
|
|
|
|
|
|
|
|
|
| |
|
W |
518,093,982 |
|
|
|
517,815,577 |
|
|
|
541,678,352 |
|
|
|
537,796,970 |
|
| |
|
|
|
|
|
|
|
|
|
|
|
|
|
|
|
|
SHINHAN FINANCIAL GROUP CO., LTD. AND SUBSIDIARIES
Notes to the Consolidated Financial Statements
(In millions of won)
|
Financial risk management (continued) |
| |
ii-3) |
The fair value hierarchy of financial assets and liabilities which are not measured at their fair values in the statements of financial position but with their fair value disclosed as of December 31, 2021 and 2022 are as follows: |
|
|
|
|
|
|
|
|
|
|
|
|
|
|
|
|
|
| |
|
|
|
| |
|
|
|
|
|
|
|
|
|
|
|
|
| Assets: |
|
|
|
|
|
|
|
|
|
|
|
|
|
|
|
|
| Deposits measured at amortized cost |
|
W |
252,474 |
|
|
|
23,964,458 |
|
|
|
— |
|
|
|
24,216,932 |
|
| Loans measured at amortized cost |
|
|
— |
|
|
|
2,387,533 |
|
|
|
388,019,289 |
|
|
|
390,406,822 |
|
| Securities measured at amortized cost: |
|
|
|
|
|
|
|
|
|
|
|
|
|
|
|
|
| Government bonds |
|
|
23,045,322 |
|
|
|
11,331,788 |
|
|
|
— |
|
|
|
34,377,110 |
|
| Financial institution bonds |
|
|
698,105 |
|
|
|
2,779,729 |
|
|
|
— |
|
|
|
3,477,834 |
|
| Corporation bonds |
|
|
— |
|
|
|
11,662,046 |
|
|
|
88,421 |
|
|
|
11,750,467 |
|
| |
|
|
|
|
|
|
|
|
|
|
|
|
|
|
|
|
| |
|
|
23,743,427 |
|
|
|
25,773,563 |
|
|
|
88,421 |
|
|
|
49,605,411 |
|
| |
|
|
|
|
|
|
|
|
|
|
|
|
|
|
|
|
| Other financial assets |
|
|
— |
|
|
|
14,200,356 |
|
|
|
9,188,853 |
|
|
|
23,389,209 |
|
| |
|
|
|
|
|
|
|
|
|
|
|
|
|
|
|
|
| |
|
W |
23,995,901 |
|
|
|
66,325,910 |
|
|
|
397,296,563 |
|
|
|
487,618,374 |
|
| |
|
|
|
|
|
|
|
|
|
|
|
|
|
|
|
|
| Liabilities: |
|
|
|
|
|
|
|
|
|
|
|
|
|
|
|
|
| Deposit liabilities: |
|
|
|
|
|
|
|
|
|
|
|
|
|
|
|
|
| Demand deposits |
|
W |
— |
|
|
|
172,107,724 |
|
|
|
— |
|
|
|
172,107,724 |
|
| Time deposits |
|
|
— |
|
|
|
— |
|
|
|
161,301,409 |
|
|
|
161,301,409 |
|
| Certificate of deposit |
|
|
— |
|
|
|
— |
|
|
|
16,606,894 |
|
|
|
16,606,894 |
|
| Issued bill deposit |
|
|
— |
|
|
|
— |
|
|
|
5,817,844 |
|
|
|
5,817,844 |
|
| CMA deposits |
|
|
— |
|
|
|
5,246,478 |
|
|
|
— |
|
|
|
5,246,478 |
|
| Other |
|
|
— |
|
|
|
3,553,942 |
|
|
|
95,041 |
|
|
|
3,648,983 |
|
| |
|
|
|
|
|
|
|
|
|
|
|
|
|
|
|
|
| |
|
|
— |
|
|
|
180,908,144 |
|
|
|
183,821,188 |
|
|
|
364,729,332 |
|
| |
|
|
|
|
|
|
|
|
|
|
|
|
|
|
|
|
| Borrowing debts: |
|
|
|
|
|
|
|
|
|
|
|
|
|
|
|
|
| Call-money |
|
|
— |
|
|
|
1,534,611 |
|
|
|
— |
|
|
|
1,534,611 |
|
| Bills sold |
|
|
— |
|
|
|
— |
|
|
|
9,019 |
|
|
|
9,019 |
|
| Bonds sold under repurchase agreements |
|
|
— |
|
|
|
— |
|
|
|
10,709,115 |
|
|
|
10,709,115 |
|
| Borrowings |
|
|
— |
|
|
|
— |
|
|
|
30,803,417 |
|
|
|
30,803,417 |
|
| |
|
|
|
|
|
|
|
|
|
|
|
|
|
|
|
|
| |
|
|
— |
|
|
|
1,534,611 |
|
|
|
41,521,551 |
|
|
|
43,056,162 |
|
| |
|
|
|
|
|
|
|
|
|
|
|
|
|
|
|
|
| Debts: |
|
|
|
|
|
|
|
|
|
|
|
|
|
|
|
|
| Borrowings in won |
|
|
— |
|
|
|
38,474,804 |
|
|
|
30,606,336 |
|
|
|
69,081,140 |
|
| Borrowings in foreign currency |
|
|
— |
|
|
|
7,956,414 |
|
|
|
3,120,343 |
|
|
|
11,076,757 |
|
| |
|
|
|
|
|
|
|
|
|
|
|
|
|
|
|
|
| |
|
|
— |
|
|
|
46,431,218 |
|
|
|
33,726,679 |
|
|
|
80,157,897 |
|
| |
|
|
|
|
|
|
|
|
|
|
|
|
|
|
|
|
| Other financial liabilities |
|
|
— |
|
|
|
9,413,875 |
|
|
|
20,458,311 |
|
|
|
29,872,186 |
|
| |
|
|
|
|
|
|
|
|
|
|
|
|
|
|
|
|
| |
|
W |
— |
|
|
|
238,287,848 |
|
|
|
279,527,729 |
|
|
|
517,815,577 |
|
| |
|
|
|
|
|
|
|
|
|
|
|
|
|
|
|
|
SHINHAN FINANCIAL GROUP CO., LTD. AND SUBSIDIARIES
Notes to the Consolidated Financial Statements
(In millions of won)
|
Financial risk management (continued) |
|
|
|
|
|
|
|
|
|
|
|
|
|
|
|
|
|
| |
|
|
|
| |
|
|
|
|
|
|
|
|
|
|
|
|
| Assets: |
|
|
|
|
|
|
|
|
|
|
|
|
|
|
|
|
| Deposits measured at amortized cost |
|
W |
429,794 |
|
|
|
26,693,942 |
|
|
|
— |
|
|
|
27,123,736 |
|
| Loans measured at amortized cost |
|
|
— |
|
|
|
5,832,484 |
|
|
|
403,512,323 |
|
|
|
409,344,807 |
|
| Securities measured at amortized cost: |
|
|
|
|
|
|
|
|
|
|
|
|
|
|
|
|
| Government bonds |
|
|
22,668,684 |
|
|
|
11,152,143 |
|
|
|
— |
|
|
|
33,820,827 |
|
| Financial institution bonds |
|
|
1,898,457 |
|
|
|
4,396,024 |
|
|
|
— |
|
|
|
6,294,481 |
|
| Corporation bonds |
|
|
— |
|
|
|
11,428,463 |
|
|
|
— |
|
|
|
11,428,463 |
|
| |
|
|
|
|
|
|
|
|
|
|
|
|
|
|
|
|
| |
|
|
24,567,141 |
|
|
|
26,976,630 |
|
|
|
— |
|
|
|
51,543,771 |
|
| |
|
|
|
|
|
|
|
|
|
|
|
|
|
|
|
|
| Other financial assets |
|
|
— |
|
|
|
12,598,487 |
|
|
|
9,531,320 |
|
|
|
22,129,807 |
|
| |
|
|
|
|
|
|
|
|
|
|
|
|
|
|
|
|
| |
|
W |
24,996,935 |
|
|
|
72,101,543 |
|
|
|
413,043,643 |
|
|
|
510,142,121 |
|
| |
|
|
|
|
|
|
|
|
|
|
|
|
|
|
|
|
| Liabilities: |
|
|
|
|
|
|
|
|
|
|
|
|
|
|
|
|
| Deposit liabilities: |
|
|
|
|
|
|
|
|
|
|
|
|
|
|
|
|
| Demand deposits |
|
W |
— |
|
|
|
157,446,276 |
|
|
|
— |
|
|
|
157,446,276 |
|
| Time deposits |
|
|
— |
|
|
|
— |
|
|
|
195,886,583 |
|
|
|
195,886,583 |
|
| Certificate of deposit |
|
|
— |
|
|
|
— |
|
|
|
14,748,736 |
|
|
|
14,748,736 |
|
| Issued bill deposit |
|
|
— |
|
|
|
— |
|
|
|
6,631,276 |
|
|
|
6,631,276 |
|
| CMA deposits |
|
|
— |
|
|
|
4,634,010 |
|
|
|
— |
|
|
|
4,634,010 |
|
| Other |
|
|
— |
|
|
|
3,057,789 |
|
|
|
53,204 |
|
|
|
3,110,993 |
|
| |
|
|
|
|
|
|
|
|
|
|
|
|
|
|
|
|
| |
|
|
— |
|
|
|
165,138,075 |
|
|
|
217,319,799 |
|
|
|
382,457,874 |
|
| |
|
|
|
|
|
|
|
|
|
|
|
|
|
|
|
|
| Borrowing debts: |
|
|
|
|
|
|
|
|
|
|
|
|
|
|
|
|
| Call-money |
|
|
— |
|
|
|
1,276,301 |
|
|
|
— |
|
|
|
1,276,301 |
|
| Bills sold |
|
|
— |
|
|
|
— |
|
|
|
15,006 |
|
|
|
15,006 |
|
| Bonds sold under repurchase agreements |
|
|
— |
|
|
|
— |
|
|
|
9,544,536 |
|
|
|
9,544,536 |
|
| Borrowings |
|
|
— |
|
|
|
19,922 |
|
|
|
37,582,105 |
|
|
|
37,602,027 |
|
| |
|
|
|
|
|
|
|
|
|
|
|
|
|
|
|
|
| |
|
|
— |
|
|
|
1,296,223 |
|
|
|
47,141,647 |
|
|
|
48,437,870 |
|
| |
|
|
|
|
|
|
|
|
|
|
|
|
|
|
|
|
| Debts: |
|
|
|
|
|
|
|
|
|
|
|
|
|
|
|
|
| Borrowings in won |
|
|
— |
|
|
|
31,665,994 |
|
|
|
30,393,259 |
|
|
|
62,059,253 |
|
| Borrowings in foreign currency |
|
|
— |
|
|
|
9,625,410 |
|
|
|
3,426,166 |
|
|
|
13,051,576 |
|
| |
|
|
|
|
|
|
|
|
|
|
|
|
|
|
|
|
| |
|
|
— |
|
|
|
41,291,404 |
|
|
|
33,819,425 |
|
|
|
75,110,829 |
|
| |
|
|
|
|
|
|
|
|
|
|
|
|
|
|
|
|
| Other financial liabilities |
|
|
— |
|
|
|
8,921,782 |
|
|
|
22,868,615 |
|
|
|
31,790,397 |
|
| |
|
|
|
|
|
|
|
|
|
|
|
|
|
|
|
|
| |
|
W |
— |
|
|
|
216,647,484 |
|
|
|
321,149,486 |
|
|
|
537,796,970 |
|
| |
|
|
|
|
|
|
|
|
|
|
|
|
|
|
|
|
SHINHAN FINANCIAL GROUP CO., LTD. AND SUBSIDIARIES
Notes to the Consolidated Financial Statements
(In millions of won)
|
Financial risk management (continued) |
| |
ii-4) |
Valuation techniques and inputs used in the fair value measurements categorized within Level 2 and Level 3 for fair value disclosures, which are not recognized at fair value, as at December 31, 2021 and 2022, are as follows: |
|
|
|
|
|
|
|
|
|
|
|
|
|
|
|
|
Fair value(*) |
|
|
Valuation
technique |
|
|
|
|
|
|
|
|
|
|
|
|
|
|
Financial instruments classified as level 2 : |
|
|
|
|
|
|
|
|
|
|
| Assets |
|
|
|
|
|
|
|
|
|
|
| Due from banks measured at amortized cost |
|
W |
23,964,458 |
|
|
|
DCF |
|
|
Discount rate |
| Loans measured at amortized cost |
|
|
2,387,533 |
|
|
|
DCF |
|
|
Discount rate, Credit spread and Prepayment rate |
| Securities measured at amortized cost |
|
|
25,773,563 |
|
|
|
DCF |
|
|
Discount rate |
| Other financial assets |
|
|
14,200,356 |
|
|
|
DCF |
|
|
Discount rate |
Financial instruments classified as level 3 : |
|
|
|
|
|
|
|
|
|
|
| Assets |
|
|
|
|
|
|
|
|
|
|
| Loans measured at amortized cost |
|
|
388,019,289 |
|
|
|
DCF |
|
|
Discount rate, Credit spread and Prepayment rate |
| Securities measured at amortized cost |
|
|
88,421 |
|
|
|
DCF |
|
|
Discount rate |
| Other financial assets |
|
|
9,188,853 |
|
|
|
DCF |
|
|
Discount rate |
| |
|
|
|
|
|
|
|
|
|
|
| |
|
W |
463,622,473 |
|
|
|
|
|
|
|
| |
|
|
|
|
|
|
|
|
|
|
Financial instruments classified as level 2 : |
|
|
|
|
|
|
|
|
|
|
| Liabilities |
|
|
|
|
|
|
|
|
|
|
| Deposits |
|
W |
180,908,144 |
|
|
|
DCF |
|
|
Discount rate |
| Borrowings |
|
|
1,534,611 |
|
|
|
DCF |
|
|
Discount rate |
| Debt securities issued |
|
|
46,431,218 |
|
|
|
DCF |
|
|
Discount rate |
| Other financial liabilities |
|
|
9,413,875 |
|
|
|
DCF |
|
|
Discount rate |
Financial instruments classified as level 3 : |
|
|
|
|
|
|
|
|
|
|
| Liabilities |
|
|
|
|
|
|
|
|
|
|
| Deposits |
|
|
183,821,188 |
|
|
|
DCF |
|
|
Discount rate |
| Borrowings |
|
|
41,521,551 |
|
|
|
DCF |
|
|
Discount rate |
| Debt securities issued |
|
|
33,726,679 |
|
|
|
DCF |
|
|
Discount rate, Regression coefficient and Correlations |
| Other financial liabilities |
|
|
20,458,311 |
|
|
|
DCF |
|
|
Discount rate |
| |
|
|
|
|
|
|
|
|
|
|
| |
|
W |
517,815,577 |
|
|
|
|
|
|
|
| |
|
|
|
|
|
|
|
|
|
|
| (*) |
Valuation techniques and inputs are not disclosed when the carrying value is a reasonable approximation of fair value. |
SHINHAN FINANCIAL GROUP CO., LTD. AND SUBSIDIARIES
Notes to the Consolidated Financial Statements
(In millions of won)
|
Financial risk management (continued) |
| |
|
|
|
| |
|
|
|
|
|
|
|
|
|
| |
|
|
|
|
|
|
|
|
|
|
|
|
|
Financial instruments classified as level 2 : |
|
|
|
|
|
|
|
|
|
|
|
|
| Assets |
|
|
|
|
|
|
|
|
|
|
|
|
| Due from banks measured at amortized cost |
|
W |
26,693,942 |
|
|
|
DCF |
|
|
|
Discount rate |
|
| Loans measured at amortized cost |
|
|
5,832,484 |
|
|
|
DCF |
|
|
|
Discount rate, Credit spread and Prepayment rate |
|
| Securities measured at amortized cost |
|
|
26,976,630 |
|
|
|
DCF |
|
|
|
Discount rate |
|
| Other financial assets |
|
|
12,598,487 |
|
|
|
DCF |
|
|
|
Discount rate |
|
Financial instruments classified as level 3 : |
|
|
|
|
|
|
|
|
|
|
|
|
| Assets |
|
|
|
|
|
|
|
|
|
|
|
|
| Loans measured at amortized cost |
|
|
403,512,323 |
|
|
|
DCF |
|
|
|
Discount rate, Credit spread and Prepayment rate |
|
| Securities measured at amortized cost |
|
|
— |
|
|
|
DCF |
|
|
|
Discount rate |
|
| Other financial assets |
|
|
9,531,320 |
|
|
|
DCF |
|
|
|
Discount rate |
|
| |
|
|
|
|
|
|
|
|
|
|
|
|
| |
|
W |
485,145,186 |
|
|
|
|
|
|
|
|
|
| |
|
|
|
|
|
|
|
|
|
|
|
|
Financial instruments classified as level 2 : |
|
|
|
|
|
|
|
|
|
|
|
|
| Liabilities |
|
|
|
|
|
|
|
|
|
|
|
|
| Deposits |
|
W |
165,138,075 |
|
|
|
DCF |
|
|
|
Discount rate |
|
| Borrowings |
|
|
1,296,223 |
|
|
|
DCF |
|
|
|
Discount rate |
|
| Debt securities issued |
|
|
41,291,404 |
|
|
|
DCF |
|
|
|
Discount rate |
|
| Other financial liabilities |
|
|
8,921,782 |
|
|
|
DCF |
|
|
|
Discount rate |
|
Financial instruments classified as level 3 : |
|
|
|
|
|
|
|
|
|
|
|
|
| Liabilities |
|
|
|
|
|
|
|
|
|
|
|
|
| Deposits |
|
|
217,319,799 |
|
|
|
DCF |
|
|
|
Discount rate |
|
| Borrowings |
|
|
47,141,647 |
|
|
|
DCF |
|
|
|
Discount rate |
|
| Debt securities issued |
|
|
33,819,425 |
|
|
|
DCF |
|
|
|
Discount rate, Regression coefficient and Correlations |
|
| Other financial liabilities |
|
|
22,868,615 |
|
|
|
DCF |
|
|
|
Discount rate |
|
| |
|
|
|
|
|
|
|
|
|
|
|
|
| |
|
W |
537,796,970 |
|
|
|
|
|
|
|
|
|
| |
|
|
|
|
|
|
|
|
|
|
|
|
| (*) |
Valuation techniques and inputs are not disclosed when the carrying value is a reasonable approximation of fair value. |
iii) Changes in gains or losses on valuation at the transaction date for the years ended December 31, 2021 and 2022, are as follows:
|
|
|
|
|
|
|
|
|
|
|
|
|
|
|
|
|
|
|
|
|
|
|
|
|
| Beginning balance |
|
W |
(292,599 |
) |
|
|
(160,525) |
|
| New transactions |
|
|
(206,897 |
) |
|
|
(88,769 |
) |
| Recognized in profit for the year |
|
|
338,971 |
|
|
|
105,335 |
|
| |
|
|
|
|
|
|
|
|
| Ending balance |
|
W |
(160,525 |
) |
|
|
(143,959 |
) |
| |
|
|
|
|
|
|
|
|
SHINHAN FINANCIAL GROUP CO., LTD. AND SUBSIDIARIES
Notes to the Consolidated Financial Statements
(In millions of won)
|
Financial risk management (continued) |
| |
|
Classification by categories of financial instruments |
Financial assets and liabilities are measured at fair value or amortized cost. The financial instruments measured at fair value or amortized costs are measured in accordance with the Group’s valuation methodologies, which are described in Note 4.(e) Measurement of fair value.
The carrying values of each category of financial assets and financial liabilities as of December 31, 2021 and 2022 is as follows:
|
|
|
|
|
|
|
|
|
|
|
|
|
|
|
|
|
|
|
|
|
| |
|
|
|
| |
|
FVTPL |
|
|
FVOCI |
|
|
Amortized cost |
|
|
Derivatives
held for
hedging |
|
|
Total |
|
| Assets: |
|
|
|
|
|
|
|
|
|
|
|
|
|
|
|
|
|
|
|
|
| Cash and due from banks at amortized cost |
|
W |
— |
|
|
|
— |
|
|
|
28,453,404 |
|
|
|
— |
|
|
|
28,453,404 |
|
| Due from banks at fair value through profit or loss |
|
|
34,262 |
|
|
|
— |
|
|
|
— |
|
|
|
— |
|
|
|
34,262 |
|
| Securities at fair value through profit or loss |
|
|
60,686,153 |
|
|
|
— |
|
|
|
— |
|
|
|
— |
|
|
|
60,686,153 |
|
| Derivatives assets |
|
|
3,574,126 |
|
|
|
— |
|
|
|
— |
|
|
|
225,063 |
|
|
|
3,799,189 |
|
| Loans at fair value through profit or loss |
|
|
1,683,344 |
|
|
|
— |
|
|
|
— |
|
|
|
— |
|
|
|
1,683,344 |
|
| Loans at amortized cost |
|
|
— |
|
|
|
— |
|
|
|
389,137,156 |
|
|
|
— |
|
|
|
389,137,156 |
|
| Securities at fair value through other comprehensive income |
|
|
— |
|
|
|
64,838,323 |
|
|
|
— |
|
|
|
— |
|
|
|
64,838,323 |
|
| Securities at amortized cost |
|
|
— |
|
|
|
— |
|
|
|
49,930,076 |
|
|
|
— |
|
|
|
49,930,076 |
|
| Others |
|
|
— |
|
|
|
— |
|
|
|
23,238,932 |
|
|
|
— |
|
|
|
23,238,932 |
|
| |
|
|
|
|
|
|
|
|
|
|
|
|
|
|
|
|
|
|
|
|
| |
|
W |
65,977,885 |
|
|
|
64,838,323 |
|
|
|
490,759,568 |
|
|
|
225,063 |
|
|
|
621,800,839 |
|
| |
|
|
|
|
|
|
|
|
|
|
|
|
|
|
|
|
|
|
|
|
SHINHAN FINANCIAL GROUP CO., LTD. AND SUBSIDIARIES
Notes to the Consolidated Financial Statements
(In millions of won)
|
Financial risk management (continued) |
|
|
|
|
|
|
|
|
|
|
|
|
|
|
|
|
|
|
|
|
|
| |
|
|
|
| |
|
FVTPL |
|
|
FVTPL
liabilities
designated |
|
|
Financial
liabilities
measured at
amortized cost |
|
|
Derivatives
held for
hedging |
|
|
Total |
|
| Liabilities: |
|
|
|
|
|
|
|
|
|
|
|
|
|
|
|
|
|
|
|
|
| Deposits |
|
W |
— |
|
|
|
— |
|
|
|
364,896,675 |
|
|
|
— |
|
|
|
364,896,675 |
|
| Financial liabilities at fair value through profit or loss |
|
|
1,369,225 |
|
|
|
— |
|
|
|
— |
|
|
|
— |
|
|
|
1,369,225 |
|
| Financial liabilities designated at FVTPL |
|
|
— |
|
|
|
8,023,870 |
|
|
|
— |
|
|
|
— |
|
|
|
8,023,870 |
|
| Derivatives liabilities |
|
|
3,207,755 |
|
|
|
— |
|
|
|
— |
|
|
|
378,809 |
|
|
|
3,586,564 |
|
| Borrowings |
|
|
— |
|
|
|
— |
|
|
|
43,167,065 |
|
|
|
— |
|
|
|
43,167,065 |
|
| Debt securities issued |
|
|
— |
|
|
|
— |
|
|
|
80,149,363 |
|
|
|
— |
|
|
|
80,149,363 |
|
| Others |
|
|
— |
|
|
|
— |
|
|
|
29,880,879 |
|
|
|
— |
|
|
|
29,880,879 |
|
| |
|
|
|
|
|
|
|
|
|
|
|
|
|
|
|
|
|
|
|
|
| |
|
W |
4,576,980 |
|
|
|
8,023,870 |
|
|
|
518,093,982 |
|
|
|
378,809 |
|
|
|
531,073,641 |
|
| |
|
|
|
|
|
|
|
|
|
|
|
|
|
|
|
|
|
|
|
|
|
|
|
|
|
|
|
|
|
|
|
|
|
|
|
|
|
|
|
|
|
| |
|
|
|
| |
|
FVTPL |
|
|
FVOCI |
|
|
Amortized cost |
|
|
Derivatives
held for
hedging |
|
|
Total |
|
| Assets: |
|
|
|
|
|
|
|
|
|
|
|
|
|
|
|
|
|
|
|
|
| Cash and due from banks at amortized cost |
|
W |
— |
|
|
|
— |
|
|
|
29,532,235 |
|
|
|
— |
|
|
|
29,532,235 |
|
| Due from banks at fair value through profit or loss |
|
|
26,116 |
|
|
|
— |
|
|
|
— |
|
|
|
— |
|
|
|
26,116 |
|
| Securities at fair value through profit or loss |
|
|
54,228,374 |
|
|
|
— |
|
|
|
— |
|
|
|
— |
|
|
|
54,228,374 |
|
| Derivatives assets |
|
|
6,163,492 |
|
|
|
— |
|
|
|
— |
|
|
|
298,304 |
|
|
|
6,461,796 |
|
| Loans at fair value through profit or loss |
|
|
2,389,180 |
|
|
|
— |
|
|
|
— |
|
|
|
— |
|
|
|
2,389,180 |
|
| Loans at amortized cost |
|
|
— |
|
|
|
— |
|
|
|
412,291,511 |
|
|
|
— |
|
|
|
412,291,511 |
|
| Securities at fair value through other comprehensive income |
|
|
— |
|
|
|
63,661,719 |
|
|
|
— |
|
|
|
— |
|
|
|
63,661,719 |
|
| Securities at amortized cost |
|
|
— |
|
|
|
— |
|
|
|
57,971,493 |
|
|
|
— |
|
|
|
57,971,493 |
|
| Others |
|
|
— |
|
|
|
— |
|
|
|
21,896,490 |
|
|
|
— |
|
|
|
21,896,490 |
|
| |
|
|
|
|
|
|
|
|
|
|
|
|
|
|
|
|
|
|
|
|
| |
|
W |
62,807,162 |
|
|
|
63,661,719 |
|
|
|
521,691,729 |
|
|
|
298,304 |
|
|
|
648,458,914 |
|
| |
|
|
|
|
|
|
|
|
|
|
|
|
|
|
|
|
|
|
|
|
SHINHAN FINANCIAL GROUP CO., LTD. AND SUBSIDIARIES
Notes to the Consolidated Financial Statements
(In millions of won)
|
Financial risk management (continued) |
|
|
|
|
|
|
|
|
|
|
|
|
|
|
|
|
|
|
|
|
|
| |
|
|
|
| |
|
FVTPL |
|
|
FVTPL
liabilities
designated |
|
|
Financial
liabilities
measured at
amortized cost |
|
|
Derivatives
held for
hedging |
|
|
Total |
|
| Liabilities: |
|
|
|
|
|
|
|
|
|
|
|
|
|
|
|
|
|
|
|
|
| Deposits |
|
W |
— |
|
|
|
— |
|
|
|
383,010,745 |
|
|
|
— |
|
|
|
383,010,745 |
|
| Financial liabilities at fair value through profit or loss |
|
|
1,146,110 |
|
|
|
— |
|
|
|
— |
|
|
|
— |
|
|
|
1,146,110 |
|
| Financial liabilities designated at FVTPL |
|
|
— |
|
|
|
8,367,368 |
|
|
|
— |
|
|
|
— |
|
|
|
8,367,368 |
|
| Derivatives liabilities |
|
|
6,525,581 |
|
|
|
— |
|
|
|
— |
|
|
|
1,179,124 |
|
|
|
7,704,705 |
|
| Borrowings |
|
|
— |
|
|
|
— |
|
|
|
49,279,175 |
|
|
|
— |
|
|
|
49,279,175 |
|
| Debt securities issued |
|
|
— |
|
|
|
— |
|
|
|
77,288,783 |
|
|
|
— |
|
|
|
77,288,783 |
|
| Others |
|
|
— |
|
|
|
— |
|
|
|
32,099,649 |
|
|
|
— |
|
|
|
32,099,649 |
|
| |
|
|
|
|
|
|
|
|
|
|
|
|
|
|
|
|
|
|
|
|
| |
|
W |
7,671,691 |
|
|
|
8,367,368 |
|
|
|
541,678,352 |
|
|
|
1,179,124 |
|
|
|
558,896,535 |
|
| |
|
|
|
|
|
|
|
|
|
|
|
|
|
|
|
|
|
|
|
|
| |
|
Transfer of financial instruments |
i) Transfers that do not qualify for derecognition
① Sale of repurchase bonds
Among the Group’s sale of repurchase bonds, followings are the details of financial instruments that do not qualify for derecognition because the Group sold under repurchase agreement at a fixed price as of December 31, 2021 and 2022:
|
|
|
|
|
|
|
|
|
| |
|
|
|
|
|
|
| Transferred asset: |
|
|
|
|
|
|
|
|
| Securities at FVTPL |
|
W |
9,883,335 |
|
|
|
7,461,978 |
|
| Securities at FVOCI |
|
|
647,541 |
|
|
|
1,325,157 |
|
| Securities at amortized cost |
|
|
210,490 |
|
|
|
269,724 |
|
| |
|
|
|
|
|
|
|
|
| |
|
W |
10,741,366 |
|
|
|
9,056,859 |
|
| |
|
|
|
|
|
|
|
|
| Associated liabilities: |
|
|
|
|
|
|
|
|
| Bonds sold under repurchase agreements |
|
W |
10,709,115 |
|
|
|
9,544,536 |
|
② Securities loaned
If the securities owned by the Group are loaned, the ownership of the securities is transferred, but is required to be returned at the end of the loan period. Therefore, the Group continues to recognize the entire securities loaned as it holds most of the risks and compensation of the securities.
SHINHAN FINANCIAL GROUP CO., LTD. AND SUBSIDIARIES
Notes to the Consolidated Financial Statements
(In millions of won)
|
Financial risk management (continued) |
Securities loaned as of December 31, 2021 and 2022 are as follows:
|
|
|
|
|
|
|
|
|
|
|
| |
|
|
|
|
|
|
|
|
| Government bonds |
|
W |
9,044,914 |
|
|
|
13,282,971 |
|
|
Korea Securities Finance Corp., Korea Securities Depository,
etc. |
| Financial institutions bonds |
|
|
209,594 |
|
|
|
425,179 |
|
|
Korea Securities Finance Corp., Korea Securities Depository, etc . |
| Corporation bonds |
|
|
— |
|
|
|
222,857 |
|
|
BNP Paribas Securities Corp. |
| Equity securities |
|
|
8,109 |
|
|
|
44,622 |
|
|
CITIGROUP GLOBAL
MARKETS Ltd., etc. |
| |
|
|
|
|
|
|
|
|
|
|
| |
|
W 9,262,617 |
|
|
13,975,629 |
|
|
|
| |
|
|
|
|
|
|
|
|
|
|
③ Securitization of financial assets
The Group uses the securitization of financial assets as a means of financing and to transfer risk. Generally, these securitization transactions result in the transfer of contractual cash flows to the debt securities holders issued from the financial asset portfolio. The Group recognizes debt securities issued without derecognition of assets under individual agreements, partially recognizes assets to the extent of the Group’s level of involvement in assets, or recognizes rights and obligations arising from the derecognition and transfer of assets as separate assets and liabilities. The Group derecognizes the entire asset only if it transfers contractual rights to the cash flows of financial assets or if it holds contractual rights but bears contractual obligations to pay cash flows to the other party without significant delays or reinvestment and transfers most of the risks and benefits of ownership (e.g., credit risk, interest rate risk, prepayment risk, etc.). For the years ended December 31, 2021 and 2022, the carrying value of financial assets related to securitization transactions that have neither been transferred nor derecognized are
W
11,529,634 million and
W
11,429,250 million, respectively; the carrying values of related liabilities are
W
8,284,109 million and
W
6,366,124 million, respectively.
ii) Financial instruments qualified for derecognition and continued involvement
There are no financial instruments which qualify for derecognition and in which the Group has continuing involvements as of December 31, 2021, and 2022.
SHINHAN FINANCIAL GROUP CO., LTD. AND SUBSIDIARIES
Notes to the Consolidated Financial Statements
(In millions of won)
|
Financial risk management (continued) |
| |
|
Offsetting financial assets and financial liabilities |
Financial assets and liabilities subject to offsetting, enforceable master netting arrangements and similar agreements as of December 31, 2021 and 2022 are as follows:
|
|
|
|
|
|
|
|
|
|
|
|
|
|
|
|
|
|
|
|
|
|
|
|
|
|
|
|
|
|
|
Gross amounts of
recognized financial
assets/ liabilities |
|
|
Gross amounts of
recognized
financial assets/
liabilities set off in
the statement of
financial position |
|
|
Net amounts of
financial assets/
liabilities presented
in the statement of
financial position |
|
|
Related amounts not set off in the
statement of financial position |
|
|
Net amount |
|
|
Financial
instruments |
|
|
Cash collateral
received |
|
| |
|
|
|
|
|
|
|
|
|
|
|
|
|
|
|
|
|
|
|
|
|
|
|
|
| Derivatives (*1) |
|
W |
3,821,253 |
|
|
|
— |
|
|
|
3,821,253 |
|
|
|
9,509,183 |
|
|
|
409,487 |
|
|
|
1,775,888 |
|
| Other financial instruments (*1) |
|
|
7,873,305 |
|
|
|
— |
|
|
|
7,873,305 |
|
| Securities repurchased under repurchase agreements and bonds purchased under repurchase agreements (*2) |
|
|
12,749,800 |
|
|
|
— |
|
|
|
12,749,800 |
|
|
|
12,618,359 |
|
|
|
— |
|
|
|
131,441 |
|
| Securities loaned (*2) |
|
|
2,648,248 |
|
|
|
— |
|
|
|
2,648,248 |
|
|
|
2,648,248 |
|
|
|
— |
|
|
|
— |
|
| Domestic exchange settlement debit (*3) |
|
|
44,872,022 |
|
|
|
38,171,649 |
|
|
|
6,700,373 |
|
|
|
— |
|
|
|
— |
|
|
|
6,700,373 |
|
| Receivables from disposal of securities (*4) |
|
|
7,082,779 |
|
|
|
3,477,874 |
|
|
|
3,604,905 |
|
|
|
2,668,065 |
|
|
|
— |
|
|
|
936,840 |
|
| Insurance receivables |
|
|
70,087 |
|
|
|
— |
|
|
|
70,087 |
|
|
|
45,849 |
|
|
|
— |
|
|
|
24,238 |
|
| |
|
|
|
|
|
|
|
|
|
|
|
|
|
|
|
|
|
|
|
|
|
|
|
|
| |
|
W |
79,117,494 |
|
|
|
41,649,523 |
|
|
|
37,467,971 |
|
|
|
27,489,704 |
|
|
|
409,487 |
|
|
|
9,568,780 |
|
| |
|
|
|
|
|
|
|
|
|
|
|
|
|
|
|
|
|
|
|
|
|
|
|
|
| |
|
|
|
|
|
|
|
|
|
|
|
|
|
|
|
|
|
|
|
|
|
|
|
|
| Derivatives (*1)(*5) |
|
W |
11,434,081 |
|
|
|
— |
|
|
|
11,434,081 |
|
|
|
10,093,812 |
|
|
|
1,000 |
|
|
|
8,120,313 |
|
| Other financial instruments (*1) |
|
|
6,781,044 |
|
|
|
— |
|
|
|
6,781,044 |
|
Bonds sold under repurchase agreements (*2) |
|
|
10,709,115 |
|
|
|
— |
|
|
|
10,709,115 |
|
|
|
10,492,779 |
|
|
|
— |
|
|
|
216,336 |
|
| Securities borrowed (*2) |
|
|
787,767 |
|
|
|
— |
|
|
|
787,767 |
|
|
|
787,767 |
|
|
|
— |
|
|
|
— |
|
| Domestic exchange settlement pending (*3) |
|
|
40,062,057 |
|
|
|
38,171,649 |
|
|
|
1,890,408 |
|
|
|
1,809,727 |
|
|
|
— |
|
|
|
80,681 |
|
| Payable from purchase of securities (*4) |
|
|
7,036,630 |
|
|
|
3,477,874 |
|
|
|
3,558,756 |
|
|
|
2,668,767 |
|
|
|
— |
|
|
|
889,989 |
|
| Insurance payables |
|
|
45,940 |
|
|
|
— |
|
|
|
45,940 |
|
|
|
45,849 |
|
|
|
— |
|
|
|
91 |
|
| |
|
|
|
|
|
|
|
|
|
|
|
|
|
|
|
|
|
|
|
|
|
|
|
|
| |
|
W |
76,856,634 |
|
|
|
41,649,523 |
|
|
|
35,207,111 |
|
|
|
25,898,701 |
|
|
|
1,000 |
|
|
|
9,307,410 |
|
| |
|
|
|
|
|
|
|
|
|
|
|
|
|
|
|
|
|
|
|
|
|
|
|
|
| (*1) |
The Group has certain derivative transactions subject to the ISDA (International Derivatives Swaps and Dealers Association) agreement. According to the ISDA agreement, when credit events (e.g. default) of counterparties occur, all derivative agreements are terminated and set off. At the time of termination, the |
SHINHAN FINANCIAL GROUP CO., LTD. AND SUBSIDIARIES
Notes to the Consolidated Financial Statements
(In millions of won)
|
Financial risk management (continued) |
| |
parties to the transaction will offset the amount of payment or payment to each other, and one party will pay the other party a single amount will be paid to the other party. |
| (*2) |
Resale and repurchase agreement, securities borrowing and lending agreement are also similar to ISDA agreement with respect to enforceable netting agreements. |
| (*3) |
The Group has legally enforceable right to set off and settles financial assets and liabilities on a net basis under normal business terms. Therefore, domestic exchanges settlement receivables (payables) are recorded on a net basis in the consolidated statements of financial position. |
| (*4) |
It is an account that deals with bonds and liabilities based on the settlement of listed stocks traded in the market. The Group currently has a legally enforceable right to set off the recognized amounts and intends to settle on a net basis. Therefore, the net amount is presented in the consolidated statement of financial position. The offset amount of related bonds and liabilities based on the settlement of derivatives in-house payment by Central Clearing System is included. |
| (*5) |
As of December 31, 2021, the total amount of financial liabilities includes W 8,023,870 million of ELS (equity-linked securities) products and of DLS (derivative linked securities) products. In the course of this transaction, the Group has provided collateral for some transactions. The financial instruments provided as collateral of W 717,841 million are included in the related instruments not offset in the statement of financial position. The total amount of financial liabilities recognized as of December 31, 2021 is W 445,128 million for transactions with the other party with collective offset contracts or similar arrangements. |
SHINHAN FINANCIAL GROUP CO., LTD. AND SUBSIDIARIES
Notes to the Consolidated Financial Statements
(In millions of won)
|
Financial risk management (continued) |
|
|
|
|
|
|
|
|
|
|
|
|
|
|
|
|
|
|
|
|
|
|
|
|
|
| |
|
|
|
| |
|
Gross amounts of
recognized financial
assets/ liabilities |
|
|
Gross amounts of
recognized financial
assets/ liabilities set
off in the statement
of financial position |
|
|
Net amounts of
financial assets/
liabilities presented
in the statement of
financial position |
|
|
Related amounts not set off in the
statement of financial position |
|
|
Net amount |
|
| |
Financial
instruments |
|
|
Cash collateral
received |
|
| |
|
|
|
|
|
|
|
|
|
|
|
|
|
|
|
|
|
|
|
|
|
|
|
|
| Derivatives (*1) |
|
W |
6,523,848 |
|
|
|
— |
|
|
|
6,523,848 |
|
|
|
10,950,859 |
|
|
|
473,252 |
|
|
|
2,535,392 |
|
| Other financial instruments (*1) |
|
|
7,435,655 |
|
|
|
— |
|
|
|
7,435,655 |
|
| Securities repurchased under repurchase agreements and bonds purchased under repurchase agreements (*2) |
|
|
12,991,705 |
|
|
|
— |
|
|
|
12,991,705 |
|
|
|
12,839,843 |
|
|
|
— |
|
|
|
151,862 |
|
| Securities loaned (*2) |
|
|
4,673,143 |
|
|
|
— |
|
|
|
4,673,143 |
|
|
|
4,660,603 |
|
|
|
— |
|
|
|
12,540 |
|
| Domestic exchange settlement debit (*3) |
|
|
45,282,683 |
|
|
|
39,247,867 |
|
|
|
6,034,816 |
|
|
|
— |
|
|
|
— |
|
|
|
6,034,816 |
|
| Receivables from disposal of securities (*4) |
|
|
4,933,264 |
|
|
|
2,405,878 |
|
|
|
2,527,386 |
|
|
|
1,767,831 |
|
|
|
— |
|
|
|
759,555 |
|
| Insurance receivables |
|
|
145,747 |
|
|
|
— |
|
|
|
145,747 |
|
|
|
121,315 |
|
|
|
— |
|
|
|
24,432 |
|
| |
|
|
|
|
|
|
|
|
|
|
|
|
|
|
|
|
|
|
|
|
|
|
|
|
| |
|
W |
81,986,045 |
|
|
|
41,653,745 |
|
|
|
40,332,300 |
|
|
|
30,340,451 |
|
|
|
473,252 |
|
|
|
9,518,597 |
|
| |
|
|
|
|
|
|
|
|
|
|
|
|
|
|
|
|
|
|
|
|
|
|
|
|
| |
|
|
|
|
|
|
|
|
|
|
|
|
|
|
|
|
|
|
|
|
|
|
|
|
| Derivatives (*1),(*5) |
|
W |
15,797,823 |
|
|
|
— |
|
|
|
15,797,823 |
|
|
|
11,222,110 |
|
|
|
1,000 |
|
|
|
10,773,043 |
|
| Other financial instruments (*1) |
|
|
6,198,330 |
|
|
|
— |
|
|
|
6,198,330 |
|
| Bonds sold under repurchase agreements (*2) |
|
|
9,544,536 |
|
|
|
— |
|
|
|
9,544,536 |
|
|
|
8,931,247 |
|
|
|
— |
|
|
|
613,289 |
|
| Securities borrowed (*2) |
|
|
724,104 |
|
|
|
— |
|
|
|
724,104 |
|
|
|
724,104 |
|
|
|
— |
|
|
|
— |
|
| Domestic exchange settlement pending (*3) |
|
|
41,556,442 |
|
|
|
39,247,867 |
|
|
|
2,308,575 |
|
|
|
2,231,508 |
|
|
|
— |
|
|
|
77,067 |
|
| Payable from purchase of securities (*4) |
|
|
4,854,358 |
|
|
|
2,405,878 |
|
|
|
2,448,480 |
|
|
|
1,768,821 |
|
|
|
— |
|
|
|
679,659 |
|
| Insurance payables |
|
|
122,083 |
|
|
|
— |
|
|
|
122,083 |
|
|
|
121,315 |
|
|
|
— |
|
|
|
768 |
|
| |
|
|
|
|
|
|
|
|
|
|
|
|
|
|
|
|
|
|
|
|
|
|
|
|
| |
|
W |
78,797,676 |
|
|
|
41,653,745 |
|
|
|
37,143,931 |
|
|
|
24,999,105 |
|
|
|
1,000 |
|
|
|
12,143,826 |
|
| |
|
|
|
|
|
|
|
|
|
|
|
|
|
|
|
|
|
|
|
|
|
|
|
|
| (*1) |
The Group has certain derivative transactions subject to the ISDA (International Derivatives Swaps and Dealers Association) agreement. According to the ISDA agreement, when credit events (e.g. default) of counterparties occur, all derivative agreements are terminated and set off. At the time of termination, the parties to the transaction will offset the amount of payment or payment to each other, and one party will pay the other party a single amount will be paid to the other party. |
| (*2) |
Resale and repurchase agreement, securities borrowing and lending agreement are also similar to ISDA agreement with respect to enforceable netting agreements. |
| (*3) |
The Group has legally enforceable right to set off and settles financial assets and liabilities on a net basis under normal business terms. Therefore, domestic exchanges settlement receivables (payables) are recorded on a net basis in the consolidated statements of financial position. |
SHINHAN FINANCIAL GROUP CO., LTD. AND SUBSIDIARIES
Notes to the Consolidated Financial Statements
(In millions of won)
|
Financial risk management (continued) |
| (*4) |
It is an account that deals with bonds and liabilities based on the settlement of listed stocks traded in the market. The Group currently has a legally enforceable right to set off the recognized amounts and intends to settle on a net basis. Therefore, the net amount is presented in the consolidated statement of financial position. The offset amount of related bonds and liabilities based on the settlement of derivatives in-house payment by Central Clearing System is included. |
| (*5) |
As of December 31, 2022, the total amount of financial liabilities includes W 8,320,041 million of ELS (equity-linked securities) products and of DLS (derivative linked securities) products. In the course of this transaction, the Group has provided collateral for some transactions. The financial instruments provided as collateral of W 432,228 million are included in the related instruments not offset in the statement of financial position. The total amount of financial liabilities recognized as of December 31, 2022 is W 1,934,547 million for transactions with the other party with collective offset contracts or similar arrangements. |
The criteria for capital adequacy to be complied with by the Group are
8.0%. In addition, the minimum regulatory BIS capital ratio, which should be maintained additionally to increase the ability to absorb losses, has been raised to up to
14% as the capital regulation based on the Basel III standard is enforced from 2016. This is based on the addition of capital conservation capital (
2.5%p) and domestic system-critical banks
(D-SIB)
capital (
1.0%p) and economic response capital (
2.5%p) to the existing lowest common equity capital ratio, and economic response capital can be charged up to
2.5%p during credit expansion period. As of December 31, 2022, the minimum regulatory BIS capital ratio to be observed is
11.5%, which is the standard for applying capital conservation capital (
2.5%p),
D-SIB
capital (
1.0%p), and economic response capital (
0%p).
Basel III capital ratio is the concept of ‘International Agreement on the Measurement and Standards of Equity Capital’ of the Basel Bank Supervisory Commission of BIS (International Settlement Bank). It is calculated as ‘(common stock capital (after deduction of deductions) + other basic capital + supplementary capital) ÷ risk weighted assets’.
The capital of common stock can be the first to make up for the loss of the financial holding company. The capital of common stock consists of capital stock, capital reserve, retained earnings and other, which will not be redeemed until the liquidation and will be redeemed at the last during the liquidation. Other basic capital consists of capital securities that meet certain requirements as capital of permanent nature. Complementary capital is capital that can compensate for losses of financial holding companies during liquidation, and consists of capital securities, etc. that meet certain requirements. The deduction items are those held by the Group as assets or capital items, but do not contribute to the ability to absorb losses. Unless otherwise noted, it will be deducted from common stock capital.
SHINHAN FINANCIAL GROUP CO., LTD. AND SUBSIDIARIES
Notes to the Consolidated Financial Statements
(In millions of won)
|
Financial risk management (continued) |
The capital ratio of the Group based on Basel III is as of December 31, 2021 and 2022 are as follows:
|
|
|
|
|
|
|
|
|
| |
|
|
|
|
|
|
| Capital : |
|
|
|
|
|
|
|
|
| Tier I common equity capital |
|
W |
35,469,554 |
|
|
|
37,287,768 |
|
| Additional tier 1 capital |
|
|
4,965,931 |
|
|
|
6,018,792 |
|
| |
|
|
|
|
|
|
|
|
| Tier I capital |
|
|
40,435,485 |
|
|
|
43,306,560 |
|
| Tier II capital |
|
|
3,427,951 |
|
|
|
3,714,400 |
|
| |
|
|
|
|
|
|
|
|
| Total capital (A) |
|
W |
43,863,436 |
|
|
|
47,020,960 |
|
| |
|
|
|
|
|
|
|
|
| Total risk-weighted assets (B) |
|
W |
270,692,183 |
|
|
|
291,542,598 |
|
| Capital adequacy ratio (A/B) |
|
|
16.20 |
% |
|
|
16.13 |
% |
| Tier I capital adequacy ratio |
|
|
14.94 |
% |
|
|
14.85 |
% |
| Common stock ratio |
|
|
13.10 |
% |
|
|
12.79 |
% |
| (*) |
As of December 31, 2022, the Group has maintained an appropriate consolidated equity capital ratio according to the BIS equity capital regulation. |
|
Significant estimates and judgments |
The preparation of financial statements requires the Group to make estimates and assumptions concerning the future. Management also needs to exercise judgment in applying the Group’s accounting policies. Estimates and assumptions are continually evaluated and are based on historical experience and other factors, including expectations of future events that are believed to be reasonable under the circumstances. As the resulting accounting estimates will, by definition, seldom equal the related actual results, it can contain a significant risk of causing a material adjustment. The estimates and assumptions that have a significant risk of causing a material adjustment to the carrying values of assets and liabilities within the next financial year are discussed below.
| |
(a) |
Estimation of impairment of goodwill |
The Group reviews the goodwill annually in accordance with the accounting policy in Note 3. The recoverable amount of the cash-generating unit (group) is determined based on the
calculation. These calculations are based on estimates.
The Group is subject to tax laws from various countries. In the normal course of business, there are various types of transactions and different accounting methods that may add uncertainties to the decision of the final income taxes. The Group has recognized current and deferred taxes that reflect tax consequences based on the best estimates in which the Group expects, at the end of the reporting period, to recover or settle the carrying value of its assets and liabilities. However, actual income taxes in the future may not be identical to the recognized deferred tax assets and liabilities, and this difference can affect current and deferred tax at the period when the final tax effect is determined.
SHINHAN FINANCIAL GROUP CO., LTD. AND SUBSIDIARIES
Notes to the Consolidated Financial Statements
(In millions of won)
|
Significant estimates and judgments (continued) |
| |
(c) |
Fair value of financial instruments |
The fair values of financial instruments (e.g.
derivatives) which are not actively traded in the market are determined by using valuation techniques. The Group determines valuation techniques and assumptions based on significant market conditions at the end of each reporting period. Diverse valuation techniques are used to determine the fair value of financial instruments, from generic valuation techniques to internally developed valuation models that incorporate various types of assumptions and variables.
| |
(d) |
Allowance for credit loss, guarantees and unused loan commitments |
The Group determines and recognizes allowances for losses on debt securities, loans and other receivables measured at amortized cost or FVOCI, and recognizes provisions for guarantees and unused loan commitments through impairment testing. The accuracy of allowances and provisions for credit losses are determined by the estimation of expected cash flows for individually assessed allowances, and methodology and assumptions used for collectively assessed allowances and provisions for groups of loans, guarantees and unused loan commitments.
|
Investment in subsidiaries |
| |
(a) |
The summarized financial information of the controlling company and the Group’s major subsidiaries as of December 31, 2021 and 2022is as follows: |
|
|
|
|
|
|
|
|
|
|
|
|
|
|
|
|
|
|
|
|
|
|
|
|
|
| |
|
|
|
|
|
|
| |
|
|
|
|
|
|
|
|
|
|
|
|
|
|
|
|
|
|
| Shinhan Financial Group(separate) |
|
W |
36,815,893 |
|
|
|
10,410,517 |
|
|
|
26,405,376 |
|
|
|
37,456,314 |
|
|
|
10,779,765 |
|
|
|
26,676,549 |
|
| Shinhan Bank |
|
|
467,435,213 |
|
|
|
438,199,575 |
|
|
|
29,235,638 |
|
|
|
491,981,392 |
|
|
|
460,814,132 |
|
|
|
31,167,260 |
|
| Shinhan Card Co., Ltd. |
|
|
38,472,228 |
|
|
|
31,737,225 |
|
|
|
6,735,003 |
|
|
|
43,050,321 |
|
|
|
35,591,567 |
|
|
|
7,458,754 |
|
| Shinhan Securities Co., Ltd. (*3) |
|
|
44,446,803 |
|
|
|
39,421,314 |
|
|
|
5,025,489 |
|
|
|
43,821,577 |
|
|
|
38,479,027 |
|
|
|
5,342,550 |
|
| Shinhan Life Insurance Co., Ltd. |
|
|
70,535,556 |
|
|
|
65,382,992 |
|
|
|
5,152,564 |
|
|
|
66,753,920 |
|
|
|
63,271,167 |
|
|
|
3,482,753 |
|
| Shinhan Capital Co., Ltd. |
|
|
10,921,698 |
|
|
|
9,189,041 |
|
|
|
1,732,657 |
|
|
|
13,035,892 |
|
|
|
11,048,996 |
|
|
|
1,986,896 |
|
| Jeju Bank |
|
|
6,944,214 |
|
|
|
6,428,269 |
|
|
|
515,945 |
|
|
|
7,320,304 |
|
|
|
6,798,450 |
|
|
|
521,854 |
|
| Shinhan Credit Information Co., Ltd. (*4) |
|
|
31,377 |
|
|
|
12,334 |
|
|
|
19,043 |
|
|
|
— |
|
|
|
— |
|
|
|
— |
|
| Shinhan Alternative Investment Management Inc. (*5) |
|
|
114,973 |
|
|
|
70,449 |
|
|
|
44,524 |
|
|
|
— |
|
|
|
— |
|
|
|
— |
|
| Shinhan Asset Management Co., Ltd. (*5) |
|
|
242,760 |
|
|
|
40,181 |
|
|
|
202,579 |
|
|
|
319,511 |
|
|
|
88,519 |
|
|
|
230,992 |
|
| SHC Management Co., Ltd. |
|
|
9,636 |
|
|
|
— |
|
|
|
9,636 |
|
|
|
9,746 |
|
|
|
— |
|
|
|
9,746 |
|
| Shinhan DS |
|
|
92,591 |
|
|
|
52,804 |
|
|
|
39,787 |
|
|
|
107,366 |
|
|
|
59,833 |
|
|
|
47,533 |
|
| Shinhan Savings Bank |
|
|
2,644,942 |
|
|
|
2,413,176 |
|
|
|
231,766 |
|
|
|
3,043,506 |
|
|
|
2,723,713 |
|
|
|
319,793 |
|
| Shinhan Asset Trust Co., Ltd. (*6) |
|
|
373,488 |
|
|
|
122,890 |
|
|
|
250,598 |
|
|
|
435,815 |
|
|
|
110,981 |
|
|
|
324,834 |
|
| Shinhan AITAS Co., Ltd. |
|
|
90,116 |
|
|
|
9,786 |
|
|
|
80,330 |
|
|
|
94,725 |
|
|
|
10,147 |
|
|
|
84,578 |
|
| Shinhan REITs Management Co., Ltd. |
|
|
63,026 |
|
|
|
10,584 |
|
|
|
52,442 |
|
|
|
58,610 |
|
|
|
5,559 |
|
|
|
53,051 |
|
| Shinhan AI Co., Ltd. |
|
|
44,031 |
|
|
|
2,563 |
|
|
|
41,468 |
|
|
|
41,431 |
|
|
|
2,264 |
|
|
|
39,167 |
|
| Shinhan Venture Investment Co., Ltd. |
|
|
98,914 |
|
|
|
23,331 |
|
|
|
75,583 |
|
|
|
140,310 |
|
|
|
63,309 |
|
|
|
77,001 |
|
| Shinhan EZ General Insurance, Ltd. |
|
|
— |
|
|
|
— |
|
|
|
— |
|
|
|
241,096 |
|
|
|
115,448 |
|
|
|
125,648 |
|
| (*1) |
The consolidated financial statements of the consolidated subsidiaries are based on consolidated financial statements, if applicable. |
SHINHAN FINANCIAL GROUP CO., LTD. AND SUBSIDIARIES
Notes to the Consolidated Financial Statements
(In millions of won)
|
Investment in subsidiaries (continued) |
| (*2) |
Trusts, beneficiary certificates, securitization special limited liability companies, associates and private equity investment specialists that are not actually operating their own business are excluded. |
| (*3) |
Shinhan Investment Co., Ltd. has changed its name to Shinhan Securities Co., Ltd. on October 1, 2022. |
| (*4) |
On July 28, 2022, the Company disposed 100% of shares to Shinhan Card. |
| (*5) |
Shinhan Asset Management Co., Ltd. and Shinhan Alternative Investment Management Inc. have merged on January 5, 2022 to form a holding company named Shinhan Asset Management Co., Ltd. |
| (*6) |
The Group has acquired remaining shares of Asia Trust Co., Ltd. during the period, and Asia Trust Co., Ltd. became the Group’s wholly-owned subsidiary. Asia Trust Co., Ltd. has changed its name to Shinhan Asset Trust Co., Ltd. |
SHINHAN FINANCIAL GROUP CO., LTD. AND SUBSIDIARIES
Notes to the Consolidated Financial Statements
(In millions of won)
|
Investment in subsidiaries (continued) |
| |
(b) |
The summarized income information of the controlling company and the Group’s major subsidiaries for the years ended December 31, 2020, 2021 and 2022 are as follows: |
|
|
|
|
|
|
|
|
|
|
|
|
|
|
|
|
|
|
|
|
|
|
|
|
|
|
|
|
|
|
|
|
|
|
|
|
|
| |
|
|
|
|
|
|
|
|
|
|
|
|
|
|
|
|
|
|
|
|
|
|
|
|
|
|
|
|
|
|
|
|
|
|
|
|
|
Shinhan Financial Group (separate) |
|
W |
1,718,407 |
|
|
|
1,274,443 |
|
|
|
1,274,892 |
|
|
|
1,875,675 |
|
|
|
1,413,956 |
|
|
|
1,413,675 |
|
|
|
1,806,604 |
|
|
|
1,249,251 |
|
|
|
1,251,294 |
|
Shinhan Bank |
|
|
25,049,392 |
|
|
|
2,078,232 |
|
|
|
1,911,575 |
|
|
|
23,540,347 |
|
|
|
2,494,894 |
|
|
|
2,396,829 |
|
|
|
35,514,461 |
|
|
|
3,045,732 |
|
|
|
2,394,238 |
|
Shinhan Card Co., Ltd. |
|
|
4,091,178 |
|
|
|
606,554 |
|
|
|
599,451 |
|
|
|
4,359,627 |
|
|
|
676,297 |
|
|
|
710,090 |
|
|
|
4,761,181 |
|
|
|
644,555 |
|
|
|
671,113 |
|
Shinhan Securities Co., Ltd. (*4) |
|
|
9,290,965 |
|
|
|
154,531 |
|
|
|
147,210 |
|
|
|
7,592,350 |
|
|
|
320,662 |
|
|
|
366,000 |
|
|
|
10,548,842 |
|
|
|
412,339 |
|
|
|
427,451 |
|
Shinhan Life Insurance Co., Ltd. |
|
|
5,405,933 |
|
|
|
177,834 |
|
|
|
227,596 |
|
|
|
7,079,569 |
|
|
|
174,811 |
|
|
|
(162,161 |
) |
|
|
9,412,664 |
|
|
|
463,593 |
|
|
|
(1,659,016 |
) |
Orange Life Insurance Co., Ltd. (*5) |
|
|
4,456,340 |
|
|
|
279,282 |
|
|
|
132,425 |
|
|
|
2,112,353 |
|
|
|
216,826 |
|
|
|
(96,157 |
) |
|
|
— |
|
|
|
— |
|
|
|
— |
|
Shinhan Capital Co., Ltd. |
|
|
626,455 |
|
|
|
160,583 |
|
|
|
162,134 |
|
|
|
783,890 |
|
|
|
274,855 |
|
|
|
275,760 |
|
|
|
922,592 |
|
|
|
303,276 |
|
|
|
307,988 |
|
Jeju Bank |
|
|
214,615 |
|
|
|
17,521 |
|
|
|
16,557 |
|
|
|
204,543 |
|
|
|
18,446 |
|
|
|
11,739 |
|
|
|
275,582 |
|
|
|
22,820 |
|
|
|
11,658 |
|
Shinhan Credit Information Co., Ltd. (*6) |
|
|
42,658 |
|
|
|
1,493 |
|
|
|
1,650 |
|
|
|
42,417 |
|
|
|
1,936 |
|
|
|
2,079 |
|
|
|
20,705 |
|
|
|
1,029 |
|
|
|
1,450 |
|
Shinhan Alternative Investment Management
Inc. (*7) |
|
|
17,219 |
|
|
|
3,433 |
|
|
|
3,433 |
|
|
|
28,010 |
|
|
|
9,163 |
|
|
|
9,163 |
|
|
|
— |
|
|
|
— |
|
|
|
— |
|
Shinhan Asset Management Co., Ltd. (*7) |
|
|
88,870 |
|
|
|
26,663 |
|
|
|
26,663 |
|
|
|
107,598 |
|
|
|
32,152 |
|
|
|
32,066 |
|
|
|
174,242 |
|
|
|
37,064 |
|
|
|
36,892 |
|
SHC Management Co., Ltd. |
|
|
70 |
|
|
|
5 |
|
|
|
5 |
|
|
|
— |
|
|
|
(7 |
) |
|
|
(7 |
) |
|
|
— |
|
|
|
110 |
|
|
|
110 |
|
Shinhan DS |
|
|
164,327 |
|
|
|
1,862 |
|
|
|
2,845 |
|
|
|
244,445 |
|
|
|
4,100 |
|
|
|
5,653 |
|
|
|
279,453 |
|
|
|
6,835 |
|
|
|
7,739 |
|
Shinhan Savings Bank |
|
|
123,590 |
|
|
|
26,953 |
|
|
|
26,888 |
|
|
|
163,643 |
|
|
|
30,310 |
|
|
|
30,037 |
|
|
|
241,013 |
|
|
|
38,384 |
|
|
|
37,884 |
|
Shinhan Asset Trust Co., Ltd. (*8) |
|
|
102,816 |
|
|
|
45,791 |
|
|
|
45,765 |
|
|
|
144,971 |
|
|
|
75,823 |
|
|
|
75,972 |
|
|
|
152,563 |
|
|
|
73,654 |
|
|
|
74,236 |
|
Shinhan AITAS Co., Ltd. |
|
|
58,599 |
|
|
|
13,020 |
|
|
|
12,954 |
|
|
|
53,005 |
|
|
|
9,816 |
|
|
|
9,816 |
|
|
|
55,270 |
|
|
|
9,500 |
|
|
|
9,500 |
|
Shinhan REITs Management Co., Ltd. |
|
|
12,176 |
|
|
|
3,764 |
|
|
|
3,764 |
|
|
|
16,440 |
|
|
|
8,481 |
|
|
|
8,469 |
|
|
|
11,433 |
|
|
|
540 |
|
|
|
609 |
|
Shinhan AI Co., Ltd. |
|
|
10,246 |
|
|
|
304 |
|
|
|
284 |
|
|
|
12,106 |
|
|
|
478 |
|
|
|
455 |
|
|
|
10,668 |
|
|
|
(2,217 |
) |
|
|
(2,301 |
) |
Shinhan Venture Investment Co., Ltd. |
|
|
3,500 |
|
|
|
(1,146 |
) |
|
|
(1,015 |
) |
|
|
32,134 |
|
|
|
15,929 |
|
|
|
15,750 |
|
|
|
19,839 |
|
|
|
1,526 |
|
|
|
1,418 |
|
| (*1) |
The consolidated financial statements of the consolidated subsidiaries are based on consolidated financial statements, if applicable. |
| (*2) |
Trusts, beneficiary certificates, securitization special limited liability companies, associates and private equity investment specialists that are not actually operating their own business are excluded. |
| (*3) |
This amount includes non-controlling interests. |
| (*4) |
Shinhan Investment Co., Ltd. has changed its name to Shinhan Securities Co., Ltd. on October 1, 2022. |
| (*5) |
The amount as of December 31, 2021 is revenue, net income (loss) and total comprehensive income for the six months prior to the merger with Shinhan Life Insurance Co., Ltd. |
SHINHAN FINANCIAL GROUP CO., LTD. AND SUBSIDIARIES
Notes to the Consolidated Financial Statements
(In millions of won)
|
Investment in subsidiaries (continued) |
| (*6) |
On July 28, 2022, the Company disposed 100% of shares to Shinhan Card Co., Ltd. The amount as of December 31, 2022 is revenue, net income (loss) and total comprehensive income for the six month period ended before the disposal of Shinhan Card Co., Ltd. |
| (*7) |
Shinhan Asset Management Co., Ltd. and Shinhan Alternative Investment Management Inc. merged on January 5, 2022. The company name after the merger is Shinhan Asset Management Co., Ltd. |
| (*8) |
The Group has acquired remaining shares of Asia Trust Co., Ltd. during the period, and Asia Trust Co., Ltd. became the Group’s wholly-owned subsidiary. Asia Trust Co., Ltd. has changed its name to Shinhan Asset Trust Co., Ltd. |
| (*9) |
For the acquired company, the amount is from the consolidated statements of comprehensive income for the period after the acquisition point. |
| |
(c) |
Change in the scope of consolidation |
i) Change in consolidated subsidiaries for the year ended December 31, 2022 are as follows:
|
|
|
|
|
| |
|
|
|
|
| Included |
|
Shinhan EZ General Insurance, Ltd. |
|
Newly acquired subsidiary |
| Excluded |
|
Shinhan Alternative Investment Management Inc. |
|
Extinguished due to merger with Shinhan Asset Management Co., Ltd. |
| |
(*) |
Subsidiaries such as trust, beneficiary certificate, corporate restructuring fund and private equity fund which are not actually operating their own business are excluded. |
ii) Change in consolidated subsidiaries for the year ended December 31, 2021 are as follows:
|
|
|
|
|
| |
|
|
|
|
| Included |
|
Shinhan Life Insurance Vietnam Co., Ltd. |
|
Newly acquired subsidiary |
| Included |
|
Shinhan CubeOn Co., Ltd. |
|
Newly acquired subsidiary |
| Excluded |
|
Orange Life Insurance Co., Ltd. |
|
Extinguished due to merger with Shinhan Life Insurance Co., Ltd. |
| |
(*) |
Subsidiaries such as trust, beneficiary certificate, corporate restructuring fund and private equity fund which are not actually operating their own business are excluded.
|
SHINHAN FINANCIAL GROUP CO., LTD. AND SUBSIDIARIES
Notes to the Consolidated Financial Statements
(In millions of won)
| |
The |
general descriptions by operating segments as of December 31, 2022 are as follows: |
|
|
|
| |
|
|
| Banking |
|
Credit to customers, lending to and receiving deposits from customers, and its accompanying work |
| |
|
| Credit card |
|
Sales of credit cards, cash services, card loan services, installment financing, lease and its accompanying work |
| |
|
| Securities |
|
Securities trading, consignment trading, underwriting and its accompanying work |
| |
|
| Life insurance |
|
Life insurance business and its accompanying work |
| |
|
| Credit |
|
Facility rental, new technology business financing, others and its accompanying work |
| |
|
| Others |
|
Business segments that do not belong to the above segments, such as real estate trust, investment advisory services, venture business investment and other remaining business |
SHINHAN FINANCIAL GROUP CO., LTD. AND SUBSIDIARIES
Notes to the Consolidated Financial Statements
(In millions of won)
|
Operating segments (continued) |
| |
(b) |
The following tables provide information of income and expense for each operating segment for the years ended December 31, 2020, 2021 and 2022: |
|
|
|
|
|
|
|
|
|
|
|
|
|
|
|
|
|
|
|
|
|
|
|
|
|
|
|
|
|
|
|
|
|
| |
|
|
|
| |
|
Banking |
|
|
Credit card |
|
|
Securities |
|
|
Life
insurance |
|
|
Credit |
|
|
Others |
|
|
Consolidation
adjustment |
|
|
Total |
|
| Net interest income |
|
W |
6,037,632 |
|
|
|
1,755,039 |
|
|
|
517,044 |
|
|
|
1,608,953 |
|
|
|
158,817 |
|
|
|
7,805 |
|
|
|
(202,590 |
) |
|
|
9,882,700 |
|
| Net fees and commission income |
|
|
822,408 |
|
|
|
483,486 |
|
|
|
544,183 |
|
|
|
162,284 |
|
|
|
21,346 |
|
|
|
347,004 |
|
|
|
2,222 |
|
|
|
2,382,933 |
|
| Reversal of (provision for) allowance for credit loss |
|
|
(690,084 |
) |
|
|
(483,883 |
) |
|
|
(111,796 |
) |
|
|
(12,236 |
) |
|
|
(63,429 |
) |
|
|
(22,522 |
) |
|
|
1,771 |
|
|
|
(1,382,179 |
) |
| General and administrative expenses |
|
|
(3,237,641 |
) |
|
|
(698,796 |
) |
|
|
(565,485 |
) |
|
|
(463,439 |
) |
|
|
(58,494 |
) |
|
|
(314,097 |
) |
|
|
125,479 |
|
|
|
(5,212,473 |
) |
| Other income (expense), net |
|
|
(130,488 |
) |
|
|
(169,304 |
) |
|
|
(11,348 |
) |
|
|
(727,530 |
) |
|
|
120,735 |
|
|
|
140,138 |
|
|
|
36,552 |
|
|
|
(741,245 |
) |
| Operating income |
|
|
2,801,827 |
|
|
|
886,542 |
|
|
|
372,598 |
|
|
|
568,032 |
|
|
|
178,975 |
|
|
|
158,328 |
|
|
|
(36,566 |
) |
|
|
4,929,736 |
|
| Equity method income (loss) |
|
|
(811 |
) |
|
|
— |
|
|
|
37,760 |
|
|
|
(1,244 |
) |
|
|
32,133 |
|
|
|
(2,489 |
) |
|
|
94,184 |
|
|
|
159,533 |
|
| Income tax expense |
|
|
673,972 |
|
|
|
251,357 |
|
|
|
48,464 |
|
|
|
156,698 |
|
|
|
49,211 |
|
|
|
44,883 |
|
|
|
31,210 |
|
|
|
1,255,795 |
|
| |
|
|
|
|
|
|
|
|
|
|
|
|
|
|
|
|
|
|
|
|
|
|
|
|
|
|
|
|
|
|
|
|
| Profit for the year |
|
W |
1,999,002 |
|
|
|
703,305 |
|
|
|
154,531 |
|
|
|
457,116 |
|
|
|
160,583 |
|
|
|
112,992 |
|
|
|
(89,453 |
) |
|
|
3,498,076 |
|
| |
|
|
|
|
|
|
|
|
|
|
|
|
|
|
|
|
|
|
|
|
|
|
|
|
|
|
|
|
|
|
|
|
| Controlling interest |
|
W |
1,998,563 |
|
|
|
703,204 |
|
|
|
154,772 |
|
|
|
457,116 |
|
|
|
160,583 |
|
|
|
112,992 |
|
|
|
(172,635 |
) |
|
|
3,414,595 |
|
Non-controlling interests |
|
|
439 |
|
|
|
101 |
|
|
|
(241 |
) |
|
|
— |
|
|
|
— |
|
|
|
— |
|
|
|
83,182 |
|
|
|
83,481 |
|
| |
|
| |
|
|
|
| |
|
Banking |
|
|
Credit card |
|
|
Securities |
|
|
Life
insurance |
|
|
Credit |
|
|
Others |
|
|
Consolidation
adjustment |
|
|
Total |
|
| Net interest income |
|
W |
6,738,165 |
|
|
|
1,799,153 |
|
|
|
517,296 |
|
|
|
1,620,266 |
|
|
|
231,679 |
|
|
|
68,991 |
|
|
|
(206,225 |
) |
|
|
10,769,325 |
|
| Net fees and commission income |
|
|
818,426 |
|
|
|
634,716 |
|
|
|
601,793 |
|
|
|
170,781 |
|
|
|
28,812 |
|
|
|
415,212 |
|
|
|
5,257 |
|
|
|
2,674,997 |
|
| Reversal of (provision for) allowance for credit loss |
|
|
(364,291 |
) |
|
|
(442,668 |
) |
|
|
(80,134 |
) |
|
|
(21,760 |
) |
|
|
(34,064 |
) |
|
|
(35,421 |
) |
|
|
3,653 |
|
|
|
(974,685 |
) |
| General and administrative expenses |
|
|
(3,409,144 |
) |
|
|
(790,733 |
) |
|
|
(696,278 |
) |
|
|
(557,292 |
) |
|
|
(80,056 |
) |
|
|
(366,149 |
) |
|
|
156,564 |
|
|
|
(5,743,088 |
) |
| Other income (expense), net |
|
|
(305,508 |
) |
|
|
(179,695 |
) |
|
|
234,209 |
|
|
|
(660,416 |
) |
|
|
194,564 |
|
|
|
177,912 |
|
|
|
(235,519 |
) |
|
|
(774,453 |
) |
| Operating income |
|
|
3,477,648 |
|
|
|
1,020,773 |
|
|
|
576,886 |
|
|
|
551,579 |
|
|
|
340,935 |
|
|
|
260,545 |
|
|
|
(276,270 |
) |
|
|
5,952,096 |
|
| Equity method income (loss) |
|
|
25,401 |
|
|
|
(1,109 |
) |
|
|
65,341 |
|
|
|
(739 |
) |
|
|
29,644 |
|
|
|
16,201 |
|
|
|
23,861 |
|
|
|
158,600 |
|
| Income tax expense |
|
|
821,201 |
|
|
|
266,798 |
|
|
|
94,864 |
|
|
|
139,106 |
|
|
|
94,329 |
|
|
|
71,120 |
|
|
|
(16,382 |
) |
|
|
1,471,036 |
|
| |
|
|
|
|
|
|
|
|
|
|
|
|
|
|
|
|
|
|
|
|
|
|
|
|
|
|
|
|
|
|
|
|
| Profit for the year |
|
W |
2,417,880 |
|
|
|
771,757 |
|
|
|
320,662 |
|
|
|
391,637 |
|
|
|
274,855 |
|
|
|
205,880 |
|
|
|
(270,043 |
) |
|
|
4,112,628 |
|
| |
|
|
|
|
|
|
|
|
|
|
|
|
|
|
|
|
|
|
|
|
|
|
|
|
|
|
|
|
|
|
|
|
| Controlling interest |
|
W |
2,417,361 |
|
|
|
770,457 |
|
|
|
320,783 |
|
|
|
391,637 |
|
|
|
274,855 |
|
|
|
205,880 |
|
|
|
(361,719 |
) |
|
|
4,019,254 |
|
Non-controlling interests |
|
|
519 |
|
|
|
1,300 |
|
|
|
(121 |
) |
|
|
— |
|
|
|
— |
|
|
|
— |
|
|
|
91,676 |
|
|
|
93,374 |
|
|
|
|
|
|
|
|
|
|
|
|
|
|
|
|
|
|
|
|
|
|
|
|
|
|
|
|
|
|
|
|
|
|
| |
|
|
|
| |
|
Banking |
|
|
Credit card |
|
|
Securities |
|
|
Life
insurance |
|
|
Credit |
|
|
Others |
|
|
Consolidation
adjustment |
|
|
Total |
|
| Net interest income |
|
W |
8,358,526 |
|
|
|
1,798,005 |
|
|
|
428,420 |
|
|
|
1,648,339 |
|
|
|
260,011 |
|
|
|
154,722 |
|
|
|
(184,342 |
) |
|
|
12,463,681 |
|
| Net fees and commission income |
|
|
801,109 |
|
|
|
702,392 |
|
|
|
484,632 |
|
|
|
107,385 |
|
|
|
30,587 |
|
|
|
394,319 |
|
|
|
5,142 |
|
|
|
2,525,566 |
|
| Reversal of (provision for) allowance for credit loss |
|
|
(621,690 |
) |
|
|
(560,264 |
) |
|
|
546 |
|
|
|
(16,942 |
) |
|
|
(19,803 |
) |
|
|
(72,859 |
) |
|
|
(1,284 |
) |
|
|
(1,292,296 |
) |
| General and administrative expenses |
|
|
(3,761,767 |
) |
|
|
(777,496 |
) |
|
|
(690,539 |
) |
|
|
(499,228 |
) |
|
|
(80,320 |
) |
|
|
(401,604 |
) |
|
|
197,440 |
|
|
|
(6,013,514 |
) |
| Other income (expense), net |
|
|
(715,837 |
) |
|
|
(283,011 |
) |
|
|
(102,084 |
) |
|
|
(625,653 |
) |
|
|
158,560 |
|
|
|
87,985 |
|
|
|
(315,318 |
) |
|
|
(1,795,358 |
) |
| Operating income |
|
|
4,060,341 |
|
|
|
879,626 |
|
|
|
120,975 |
|
|
|
613,901 |
|
|
|
349,035 |
|
|
|
162,563 |
|
|
|
(298,362 |
) |
|
|
5,888,079 |
|
| Equity method income (loss) |
|
|
22,301 |
|
|
|
7,115 |
|
|
|
70,270 |
|
|
|
4,222 |
|
|
|
54,937 |
|
|
|
(735 |
) |
|
|
(36,413 |
) |
|
|
121,697 |
|
| Income tax expense |
|
|
1,030,445 |
|
|
|
227,769 |
|
|
|
145,301 |
|
|
|
134,644 |
|
|
|
98,468 |
|
|
|
35,006 |
|
|
|
(54,545 |
) |
|
|
1,617,088 |
|
| |
|
|
|
|
|
|
|
|
|
|
|
|
|
|
|
|
|
|
|
|
|
|
|
|
|
|
|
|
|
|
|
|
| Profit for the year |
|
W |
2,974,716 |
|
|
|
738,391 |
|
|
|
412,339 |
|
|
|
463,593 |
|
|
|
303,275 |
|
|
|
132,375 |
|
|
|
(292,526 |
) |
|
|
4,732,163 |
|
| |
|
|
|
|
|
|
|
|
|
|
|
|
|
|
|
|
|
|
|
|
|
|
|
|
|
|
|
|
|
|
|
|
| Controlling interest |
|
W |
2,973,996 |
|
|
|
735,204 |
|
|
|
412,496 |
|
|
|
463,593 |
|
|
|
303,275 |
|
|
|
132,375 |
|
|
|
(378,647 |
) |
|
|
4,642,292 |
|
Non-controlling interests |
|
|
720 |
|
|
|
3,187 |
|
|
|
(157 |
) |
|
|
— |
|
|
|
— |
|
|
|
— |
|
|
|
86,121 |
|
|
|
89,871 |
|
SHINHAN FINANCIAL GROUP CO., LTD. AND SUBSIDIARIES
Notes to the Consolidated Financial Statements
(In millions of won)
|
Operating segments (continued) |
| |
(c) |
Interest gains and losses from segment external customers and cross-sector interest gains and losses for the years ended December 31, 2020, 2021 and 2022 are as follows: |
| |
|
|
|
|
|
|
|
|
|
|
|
|
|
|
|
|
|
|
|
|
|
|
|
|
|
|
|
|
|
|
|
|
| |
|
| |
|
|
|
| |
|
Banking |
|
|
Credit card |
|
|
Securities |
|
|
Life
insurance |
|
|
Credit |
|
|
Others |
|
|
Consolidation
adjustment (*) |
|
|
Total |
|
| Net interest income from: |
|
|
|
|
|
|
|
|
|
|
|
|
|
|
|
|
|
|
|
|
|
|
|
|
|
|
|
|
|
|
|
|
| External customers (*) |
|
|
6,037,205 |
|
|
|
1,809,149 |
|
|
|
526,167 |
|
|
|
1,605,575 |
|
|
|
169,192 |
|
|
|
(54,902 |
) |
|
|
(209,686 |
) |
|
|
9,882,700 |
|
| Internal transactions |
|
|
427 |
|
|
|
(54,110 |
) |
|
|
(9,123 |
) |
|
|
3,378 |
|
|
|
(10,375 |
) |
|
|
62,707 |
|
|
|
7,096 |
|
|
|
— |
|
| |
|
|
|
|
|
|
|
|
|
|
|
|
|
|
|
|
|
|
|
|
|
|
|
|
|
|
|
|
|
|
|
|
| |
|
|
6,037,632 |
|
|
|
1,755,039 |
|
|
|
517,044 |
|
|
|
1,608,953 |
|
|
|
158,817 |
|
|
|
7,805 |
|
|
|
(202,590 |
) |
|
|
9,882,700 |
|
| |
|
|
|
|
|
|
|
|
|
|
|
|
|
|
|
|
|
|
|
|
|
|
|
|
|
|
|
|
|
|
|
|
| |
|
| |
|
|
|
| |
|
Banking |
|
|
Credit card |
|
|
Securities |
|
|
Life
insurance |
|
|
Credit |
|
|
Others |
|
|
Consolidation
adjustment (*) |
|
|
Total |
|
| Net interest income from: |
|
|
|
|
|
|
|
|
|
|
|
|
|
|
|
|
|
|
|
|
|
|
|
|
|
|
|
|
|
|
|
|
| External customers (*) |
|
|
6,741,279 |
|
|
|
1,849,209 |
|
|
|
534,969 |
|
|
|
1,617,186 |
|
|
|
241,035 |
|
|
|
781 |
|
|
|
(215,134 |
) |
|
|
10,769,325 |
|
| Internal transactions |
|
|
(3,114 |
) |
|
|
(50,056 |
) |
|
|
(17,673 |
) |
|
|
3,080 |
|
|
|
(9,356 |
) |
|
|
68,210 |
|
|
|
8,909 |
|
|
|
— |
|
| |
|
|
|
|
|
|
|
|
|
|
|
|
|
|
|
|
|
|
|
|
|
|
|
|
|
|
|
|
|
|
|
|
| |
|
|
6,738,165 |
|
|
|
1,799,153 |
|
|
|
517,296 |
|
|
|
1,620,266 |
|
|
|
231,679 |
|
|
|
68,991 |
|
|
|
(206,225 |
) |
|
|
10,769,325 |
|
| |
|
|
|
|
|
|
|
|
|
|
|
|
|
|
|
|
|
|
|
|
|
|
|
|
|
|
|
|
|
|
|
|
| |
|
| |
|
|
|
| |
|
Banking |
|
|
Credit card |
|
|
Securities |
|
|
Life
insurance |
|
|
Credit |
|
|
Others |
|
|
Consolidation
adjustment (*) |
|
|
Total |
|
| Net interest income from: |
|
|
|
|
|
|
|
|
|
|
|
|
|
|
|
|
|
|
|
|
|
|
|
|
|
|
|
|
|
|
|
|
| External customers (*) |
|
|
8,366,892 |
|
|
|
1,857,351 |
|
|
|
442,554 |
|
|
|
1,644,953 |
|
|
|
269,230 |
|
|
|
73,068 |
|
|
|
(190,367 |
) |
|
|
12,463,681 |
|
| Internal transactions |
|
|
(8,366 |
) |
|
|
(59,346 |
) |
|
|
(14,134 |
) |
|
|
3,386 |
|
|
|
(9,219 |
) |
|
|
81,654 |
|
|
|
6,025 |
|
|
|
— |
|
| |
|
|
|
|
|
|
|
|
|
|
|
|
|
|
|
|
|
|
|
|
|
|
|
|
|
|
|
|
|
|
|
|
| |
|
|
8,358,526 |
|
|
|
1,798,005 |
|
|
|
428,420 |
|
|
|
1,648,339 |
|
|
|
260,011 |
|
|
|
154,722 |
|
|
|
(184,342 |
) |
|
|
12,463,681 |
|
| |
|
|
|
|
|
|
|
|
|
|
|
|
|
|
|
|
|
|
|
|
|
|
|
|
|
|
|
|
|
|
|
|
| (*) |
Consolidated adjustment to net interest income from external customers is from the securities and others which were measured in fair values as a part of business combination accounting. |
SHINHAN FINANCIAL GROUP CO., LTD. AND SUBSIDIARIES
Notes to the Consolidated Financial Statements
(In millions of won)
|
Operating segments (continued) |
| |
(d) |
The following tables provide information of net fees and commission income (expense) of each operating segment for the years ended December 31, 2020, 2021 and 2022 are as follows: |
|
|
|
|
|
|
|
|
|
|
|
|
|
|
|
|
|
|
|
|
|
|
|
|
|
|
|
|
|
|
|
|
|
| |
|
|
|
| |
|
Banking |
|
|
Credit
card |
|
|
Securities |
|
|
Life
insurance |
|
|
Credit |
|
|
Others |
|
|
Consolidation
adjustment |
|
|
Total |
|
| Net fees and commission income from: |
|
|
|
|
|
|
|
|
|
|
|
|
|
|
|
|
|
|
|
|
|
|
|
|
|
|
|
|
|
|
|
|
| External customers |
|
W |
859,225 |
|
|
|
531,394 |
|
|
|
553,308 |
|
|
|
173,865 |
|
|
|
22,381 |
|
|
|
242,760 |
|
|
|
— |
|
|
|
2,382,933 |
|
| Internal transactions |
|
|
(36,817 |
) |
|
|
(47,908 |
) |
|
|
(9,125 |
) |
|
|
(11,581 |
) |
|
|
(1,035 |
) |
|
|
104,244 |
|
|
|
2,222 |
|
|
|
— |
|
| |
|
|
|
|
|
|
|
|
|
|
|
|
|
|
|
|
|
|
|
|
|
|
|
|
|
|
|
|
|
|
|
|
| |
|
W |
822,408 |
|
|
|
483,486 |
|
|
|
544,183 |
|
|
|
162,284 |
|
|
|
21,346 |
|
|
|
347,004 |
|
|
|
2,222 |
|
|
|
2,382,933 |
|
| |
|
|
|
|
|
|
|
|
|
|
|
|
|
|
|
|
|
|
|
|
|
|
|
|
|
|
|
|
|
|
|
|
|
|
|
|
|
|
|
|
|
|
|
|
|
|
|
|
|
|
|
|
|
|
|
|
|
|
|
|
|
|
|
|
|
| |
|
|
|
| |
|
Banking |
|
|
Credit
card |
|
|
Securities |
|
|
Life
insurance |
|
|
Credit |
|
|
Others |
|
|
Consolidation
adjustment |
|
|
Total |
|
| Net fees and commission income from: |
|
|
|
|
|
|
|
|
|
|
|
|
|
|
|
|
|
|
|
|
|
|
|
|
|
|
|
|
|
|
|
|
| External customers |
|
W |
863,879 |
|
|
|
681,129 |
|
|
|
615,414 |
|
|
|
181,345 |
|
|
|
27,351 |
|
|
|
305,879 |
|
|
|
— |
|
|
|
2,674,997 |
|
| Internal transactions |
|
|
(45,453 |
) |
|
|
(46,413 |
) |
|
|
(13,621 |
) |
|
|
(10,564 |
) |
|
|
1,461 |
|
|
|
109,333 |
|
|
|
5,257 |
|
|
|
— |
|
| |
|
|
|
|
|
|
|
|
|
|
|
|
|
|
|
|
|
|
|
|
|
|
|
|
|
|
|
|
|
|
|
|
| |
|
W |
818,426 |
|
|
|
634,716 |
|
|
|
601,793 |
|
|
|
170,781 |
|
|
|
28,812 |
|
|
|
415,212 |
|
|
|
5,257 |
|
|
|
2,674,997 |
|
| |
|
|
|
|
|
|
|
|
|
|
|
|
|
|
|
|
|
|
|
|
|
|
|
|
|
|
|
|
|
|
|
|
|
|
|
|
|
|
|
|
|
|
|
|
|
|
|
|
|
|
|
|
|
|
|
|
|
|
|
|
|
|
|
|
|
| |
|
|
|
| |
|
Banking |
|
|
Credit
card |
|
|
Securities |
|
|
Life
insurance |
|
|
Credit |
|
|
Others |
|
|
Consolidation
adjustment |
|
|
Total |
|
| Net fees and commission income from: |
|
|
|
|
|
|
|
|
|
|
|
|
|
|
|
|
|
|
|
|
|
|
|
|
|
|
|
|
|
|
|
|
| External customers |
|
W |
844,888 |
|
|
|
734,900 |
|
|
|
496,097 |
|
|
|
121,229 |
|
|
|
26,737 |
|
|
|
301,715 |
|
|
|
— |
|
|
|
2,525,566 |
|
| Internal transactions |
|
|
(43,779 |
) |
|
|
(32,508 |
) |
|
|
(11,465 |
) |
|
|
(13,844 |
) |
|
|
3,850 |
|
|
|
92,604 |
|
|
|
5,142 |
|
|
|
— |
|
| |
|
|
|
|
|
|
|
|
|
|
|
|
|
|
|
|
|
|
|
|
|
|
|
|
|
|
|
|
|
|
|
|
| |
|
W |
801,109 |
|
|
|
702,392 |
|
|
|
484,632 |
|
|
|
107,385 |
|
|
|
30,587 |
|
|
|
394,319 |
|
|
|
5,142 |
|
|
|
2,525,566 |
|
| |
|
|
|
|
|
|
|
|
|
|
|
|
|
|
|
|
|
|
|
|
|
|
|
|
|
|
|
|
|
|
|
|
SHINHAN FINANCIAL GROUP CO., LTD. AND SUBSIDIARIES
Notes to the Consolidated Financial Statements
(In millions of won)
|
Operating segments (continued) |
| |
(e) |
Financial information of geographical area |
The following table provides information of income from external consumers by geographical area for the years ended December 31, 2020, 2021 and 2022.
|
|
|
|
|
|
|
|
|
|
|
|
|
| |
|
|
|
|
|
|
|
|
|
| Domestic |
|
W |
4,436,252 |
|
|
|
5,404,278 |
|
|
|
5,047,406 |
|
| Overseas |
|
|
493,484 |
|
|
|
547,818 |
|
|
|
840,673 |
|
| |
|
|
|
|
|
|
|
|
|
|
|
|
| |
|
W |
4,929,736 |
|
|
|
5,952,096 |
|
|
|
5,888,079 |
|
| |
|
|
|
|
|
|
|
|
|
|
|
|
The following table provides information of
non-current
assets by geographical area as of December 31, 2021 and 2022.
|
|
|
|
|
|
|
|
|
| |
|
|
|
|
|
|
| Domestic |
|
W |
10,029,650 |
|
|
|
9,825,529 |
|
| Overseas |
|
|
336,687 |
|
|
|
356,512 |
|
| |
|
|
|
|
|
|
|
|
| |
|
W |
10,366,337 |
|
|
|
10,182,041 |
|
| |
|
|
|
|
|
|
|
|
| |
(*) |
Non-current assets comprise property and equipment, intangible assets and investment properties. |
|
Cash and due from banks at amortized cost |
| |
(a) |
Cash and due from banks at amortized cost as of December 31, 2021 and 2022 are as follows: |
|
|
|
|
|
|
|
|
|
| |
|
|
|
|
|
|
Cash and cash equivalents : |
|
|
|
|
|
|
|
|
| Cash |
|
W |
4,194,831 |
|
|
|
2,304,480 |
|
| Cash equivalents |
|
|
26,560 |
|
|
|
— |
|
| |
|
|
|
|
|
|
|
|
| |
|
4,221,391 |
|
|
2,304,480 |
|
| |
|
|
|
|
|
|
|
|
| Deposits denominated in Korean won: |
|
|
|
|
|
|
|
|
| Reserve deposits |
|
|
9,851,064 |
|
|
|
8,647,429 |
|
| Time deposits |
|
|
892,053 |
|
|
|
2,205,832 |
|
| Other |
|
|
2,701,873 |
|
|
|
2,571,005 |
|
| |
|
|
|
|
|
|
|
|
| |
|
|
13,444,990 |
|
|
|
13,424,266 |
|
| |
|
|
|
|
|
|
|
|
| Deposits denominated in foreign currency: |
|
|
|
|
|
|
|
|
| Deposits |
|
|
6,731,190 |
|
|
|
8,516,315 |
|
| Time deposits |
|
|
2,148,955 |
|
|
|
3,153,208 |
|
| Other |
|
|
1,924,601 |
|
|
|
2,153,066 |
|
| |
|
|
|
|
|
|
|
|
| |
|
|
10,804,746 |
|
|
|
13,822,589 |
|
| |
|
|
|
|
|
|
|
|
| Allowance for credit losses |
|
|
(17,723 |
) |
|
|
(19,100 |
) |
| |
|
|
|
|
|
|
|
|
| |
|
W |
28,453,404 |
|
|
|
29,532,235 |
|
| |
|
|
|
|
|
|
|
|
SHINHAN FINANCIAL GROUP CO., LTD. AND SUBSIDIARIES
Notes to the Consolidated Financial Statements
|
Cash and due from banks at amortized cost (continued) |
| |
(b) |
Restricted due from banks at amortized cost as of December 31, 2021 and 2022 are as follows: |
|
|
|
|
|
|
|
|
|
|
|
| |
|
|
|
|
|
|
|
Related Regulations or Acts |
|
|
|
|
|
|
|
|
|
|
|
|
|
W |
9,851,064 |
|
|
|
8,647,429 |
|
|
Article 55 of the Bank of Korea Act |
|
|
|
1,174,670 |
|
|
|
2,192,566 |
|
|
Article 74 of the Capital Markets and Financial Investment Business Act, etc. |
| |
|
|
|
|
|
|
|
|
|
|
| |
|
|
11,025,734 |
|
|
|
10,839,995 |
|
|
|
| |
|
|
|
|
|
|
|
|
|
|
|
|
|
2,870,908 |
|
|
|
2,963,995 |
|
|
Articles of the Bank of Korea Act, New York State Banking Act, derivatives related , etc. |
| |
|
|
|
|
|
|
|
|
|
|
| |
|
W |
13,896,642 |
|
|
|
13,803,990 |
|
|
|
| |
|
|
|
|
|
|
|
|
|
|
SHINHAN FINANCIAL GROUP CO., LTD. AND SUBSIDIARIES
Notes to the Consolidated Financial Statements
|
Financial assets at fair value through profit or loss |
| |
(a) |
Financial assets at fair value through profit or loss as of December 31, 2021 and 2022 are as follows: |
|
|
|
|
|
|
|
|
|
| |
|
|
|
|
|
|
|
|
|
|
|
|
|
|
|
|
|
W |
3,961,045 |
|
|
|
4,304,950 |
|
|
|
|
13,449,550 |
|
|
|
11,616,813 |
|
|
|
|
9,618,302 |
|
|
|
7,632,222 |
|
|
|
|
627,275 |
|
|
|
353,569 |
|
Equity investment with put option |
|
|
2,625,297 |
|
|
|
3,185,222 |
|
|
|
|
13,386,212 |
|
|
|
12,169,688 |
|
|
|
|
7,042,045 |
|
|
|
4,939,927 |
|
|
|
|
3,591,822 |
|
|
|
3,850,613 |
|
|
|
|
3,925,599 |
|
|
|
3,475,213 |
|
| |
|
|
|
|
|
|
|
|
| |
|
|
58,227,147 |
|
|
|
51,528,217 |
|
|
|
|
|
|
|
|
|
|
|
|
|
2,182,829 |
|
|
|
2,410,017 |
|
|
|
|
12,962 |
|
|
|
38,515 |
|
|
|
|
179,524 |
|
|
|
175,656 |
|
| |
|
|
|
|
|
|
|
|
| |
|
|
2,375,315 |
|
|
|
2,624,188 |
|
| |
|
|
|
|
|
|
|
|
| |
|
W |
60,602,462 |
|
|
|
54,152,405 |
|
| |
|
|
|
|
|
|
|
|
|
|
|
|
|
|
|
|
|
|
|
W |
1,683,344 |
|
|
|
2,389,180 |
|
Due from banks at fair value |
|
|
34,262 |
|
|
|
26,116 |
|
|
|
|
83,691 |
|
|
|
75,969 |
|
| |
|
|
|
|
|
|
|
|
| |
|
W |
62,403,759 |
|
|
|
56,643,670 |
|
| |
|
|
|
|
|
|
|
|
| |
(*) |
As of December 31, 2022 and 2021, restricted reserve for claims of customers’ deposits (trusts) are W 1,705,724 million and W 2,080,626 million, respectively. |
| |
(b) |
Financial assets to which overlay approach are applied in accordance with IFRS 9 and IFRS 4 as of December 31, 2021 and 2022 are as follows: |
|
|
|
|
|
|
|
|
|
| |
|
|
|
|
|
|
Due from banks at fair value through profit or loss |
|
W |
34,262 |
|
|
|
26,116 |
|
Securities at fair value through profit or loss |
|
|
4,903,275 |
|
|
|
4,631,973 |
|
| |
|
|
|
|
|
|
|
|
| |
|
W |
4,937,537 |
|
|
|
4,658,089 |
|
| |
|
|
|
|
|
|
|
|
A financial asset is eligible for designation for the overlay approach, if it is measured at fair value through profit or loss applying IFRS 9 but would not have been measured at fair value through profit or loss in its entirety applying IAS 39; and it is not held in respect of an activity that is not associated with contracts within the scope of IFRS 4.
SHINHAN FINANCIAL GROUP CO., LTD. AND SUBSIDIARIES
Notes to the Consolidated Financial Statements
|
Financial assets at fair value through profit or loss (continued) |
The reclassified amounts between profit or loss and other comprehensive income due to the overlay approach as of and for the years ended December 31, 2021 and 2022 are as follows:
|
|
|
|
|
|
|
|
|
|
|
|
|
|
|
|
|
|
|
|
|
|
|
|
|
|
Other comprehensive
income (*) |
|
|
|
|
|
|
|
|
|
|
|
|
|
|
|
|
|
|
|
|
|
|
|
|
|
|
|
|
|
|
|
Net gain (loss) on valuation of financial assets at fair value through profit or loss |
|
W |
130,170 |
|
|
|
83,288 |
|
|
|
46,882 |
|
|
|
(12,893 |
) |
Net gain (loss) on disposal of financial assets at fair value through profit or loss |
|
|
(2,668 |
) |
|
|
87,217 |
|
|
|
(89,885 |
) |
|
|
24,719 |
|
| |
|
|
|
|
|
|
|
|
|
|
|
|
|
|
|
|
| |
|
W |
127,502 |
|
|
|
170,505 |
|
|
|
(43,003 |
) |
|
|
11,826 |
|
| |
|
|
|
|
|
|
|
|
|
|
|
|
|
|
|
|
| |
(*) |
The amount of the policyholders equity adjustment for the reclassification of other comprehensive income is W 11,079 million for the year ended December 31, 2021. |
|
|
|
|
|
|
|
|
|
|
|
|
|
|
|
|
|
|
|
|
|
|
|
|
|
|
Other comprehensive
income (*) |
|
|
|
|
|
|
|
|
|
|
|
|
|
|
Net gain (loss) on valuation of financial assets at fair value through profit
or loss |
|
|
W (187,706 |
) |
|
|
33,508 |
|
|
|
(221,214 |
) |
|
|
58,622 |
|
Net gain (loss) on disposal of financial assets at fair value through profit
or loss |
|
|
39,547 |
|
|
|
131,544 |
|
|
|
(91,997 |
) |
|
|
24,379 |
|
| |
|
|
|
|
|
|
|
|
|
|
|
|
|
|
|
|
| |
|
|
W (148,159 |
) |
|
|
165,052 |
|
|
|
(313,211 |
) |
|
|
83,001 |
|
| |
|
|
|
|
|
|
|
|
|
|
|
|
|
|
|
|
| |
(*) |
The amount of the policyholders equity adjustment for the reclassification of other comprehensive income is W 13,277 million for the year ended December 31, 2022. |
SHINHAN FINANCIAL GROUP CO., LTD. AND SUBSIDIARIES
Notes to the Consolidated Financial Statements
(a) The notional amounts of derivatives outstanding as of December 31, 2021 and 2022 are as follows:
|
|
|
|
|
|
|
|
|
|
|
|
|
|
|
|
Foreign currency related: |
|
|
|
|
|
|
|
|
|
|
|
|
|
|
|
|
|
|
|
W |
145,786,842 |
|
|
|
129,544,881 |
|
|
|
|
36,532,622 |
|
|
|
40,557,913 |
|
|
|
|
2,270,594 |
|
|
|
1,327,752 |
|
| |
|
|
|
|
|
|
|
|
| |
|
|
184,590,058 |
|
|
|
171,430,546 |
|
|
|
|
|
|
|
|
|
|
|
|
|
641,104 |
|
|
|
719,618 |
|
| |
|
|
|
|
|
|
|
|
| |
|
|
185,231,162 |
|
|
|
172,150,164 |
|
| |
|
|
|
|
|
|
|
|
|
|
|
|
|
|
|
|
|
|
|
|
|
|
|
|
|
|
Interest rate forwards and swaps |
|
|
35,518,719 |
|
|
|
37,170,647 |
|
|
|
|
258,460 |
|
|
|
226,924 |
|
| |
|
|
|
|
|
|
|
|
| |
|
|
35,777,179 |
|
|
|
37,397,571 |
|
| |
|
|
|
|
|
|
|
|
|
|
|
|
|
|
|
|
|
|
|
|
3,293,821 |
|
|
|
2,783,937 |
|
|
|
|
54,890 |
|
|
|
— |
|
|
|
|
72,898,275 |
|
|
|
94,803,271 |
|
| |
|
|
|
|
|
|
|
|
| |
|
|
76,246,986 |
|
|
|
97,587,208 |
|
| |
|
|
|
|
|
|
|
|
| |
|
|
112,024,165 |
|
|
|
134,984,779 |
|
| |
|
|
|
|
|
|
|
|
|
|
|
|
|
|
|
|
|
|
|
|
|
|
|
|
|
|
|
|
|
4,737,329 |
|
|
|
5,155,334 |
|
|
|
|
|
|
|
|
|
|
|
|
|
|
|
|
|
|
|
Equity swaps and forwards |
|
|
2,073,995 |
|
|
|
4,008,263 |
|
|
|
|
677,824 |
|
|
|
878,122 |
|
| |
|
|
|
|
|
|
|
|
| |
|
|
2,751,819 |
|
|
|
4,886,385 |
|
|
|
|
|
|
|
|
|
|
|
|
|
1,678,070 |
|
|
|
2,443,194 |
|
|
|
|
3,298,673 |
|
|
|
1,444,098 |
|
| |
|
|
|
|
|
|
|
|
| |
|
|
4,976,743 |
|
|
|
3,887,292 |
|
| |
|
|
|
|
|
|
|
|
| |
|
|
7,728,562 |
|
|
|
8,773,677 |
|
| |
|
|
|
|
|
|
|
|
|
|
|
|
|
|
|
|
|
|
|
|
|
|
|
|
|
|
Commodity swaps and forwards |
|
|
789,930 |
|
|
|
898,332 |
|
|
|
|
11,500 |
|
|
|
8,000 |
|
| |
|
|
|
|
|
|
|
|
| |
|
|
801,430 |
|
|
|
906,332 |
|
| |
|
|
|
|
|
|
|
|
|
|
|
|
|
|
|
|
|
Commodity futures and options |
|
|
158,550 |
|
|
|
69,373 |
|
| |
|
|
|
|
|
|
|
|
| |
|
|
959,980 |
|
|
|
975,705 |
|
| |
|
|
|
|
|
|
|
|
SHINHAN FINANCIAL GROUP CO., LTD. AND SUBSIDIARIES
Notes to the Consolidated Financial Statements
(In millions of won)
|
|
|
|
|
|
|
|
|
|
|
|
|
|
|
|
| |
|
|
|
|
|
|
|
|
| Currency forwards |
|
|
1,279,598 |
|
|
|
1,249,589 |
|
| Currency swaps |
|
|
3,726,939 |
|
|
|
4,647,279 |
|
| Interest rate forwards and swaps |
|
|
8,695,960 |
|
|
|
16,475,525 |
|
| |
|
|
|
|
|
|
|
|
| |
|
|
13,702,497 |
|
|
|
22,372,393 |
|
| |
|
|
|
|
|
|
|
|
| |
|
W |
324,383,695 |
|
|
|
344,412,052 |
|
| |
|
|
|
|
|
|
|
|
|
(*) |
The notional amounts of derivatives outstanding those will be settled in the ‘Central Counter Party (CCP)’ system. |
| |
(b) |
Fair values of derivative instruments as of December 31, 2021 and 2022 are as follows: |
|
|
|
|
|
|
|
|
|
|
|
|
|
|
|
|
|
| |
|
|
|
|
|
|
| |
|
|
|
|
|
|
|
|
|
|
|
|
Foreign currency related: |
|
|
|
|
|
|
|
|
|
|
|
|
|
|
|
|
| Over the counter: |
|
|
|
|
|
|
|
|
|
|
|
|
|
|
|
|
| Currency forwards |
|
W |
2,183,315 |
|
|
|
1,797,419 |
|
|
|
3,089,759 |
|
|
|
2,838,793 |
|
| Currency swaps |
|
|
651,292 |
|
|
|
748,302 |
|
|
|
1,626,567 |
|
|
|
1,807,229 |
|
| Currency options |
|
|
12,218 |
|
|
|
11,591 |
|
|
|
14,776 |
|
|
|
13,603 |
|
| |
|
|
|
|
|
|
|
|
|
|
|
|
|
|
|
|
| |
|
|
2,846,825 |
|
|
|
2,557,312 |
|
|
|
4,731,102 |
|
|
|
4,659,625 |
|
| Exchange traded: |
|
|
|
|
|
|
|
|
|
|
|
|
|
|
|
|
| Currency futures |
|
|
12 |
|
|
|
210 |
|
|
|
17 |
|
|
|
928 |
|
| |
|
|
|
|
|
|
|
|
|
|
|
|
|
|
|
|
| |
|
|
2,846,837 |
|
|
|
2,557,522 |
|
|
|
4,731,119 |
|
|
|
4,660,553 |
|
| |
|
|
|
|
|
|
|
|
|
|
|
|
|
|
|
|
| |
|
|
|
|
|
|
|
|
|
|
|
|
|
|
|
|
| Over the counter: |
|
|
|
|
|
|
|
|
|
|
|
|
|
|
|
|
| Interest rate forwards and swaps |
|
|
166,855 |
|
|
|
303,227 |
|
|
|
772,513 |
|
|
|
1,062,772 |
|
| Interest rate options |
|
|
3,748 |
|
|
|
611 |
|
|
|
5,169 |
|
|
|
1,983 |
|
| |
|
|
|
|
|
|
|
|
|
|
|
|
|
|
|
|
| |
|
|
170,603 |
|
|
|
303,838 |
|
|
|
777,682 |
|
|
|
1,064,755 |
|
| Exchange traded: |
|
|
|
|
|
|
|
|
|
|
|
|
|
|
|
|
| Interest rate futures |
|
|
1,701 |
|
|
|
1,828 |
|
|
|
2,555 |
|
|
|
972 |
|
| Interest rate options |
|
|
83 |
|
|
|
— |
|
|
|
— |
|
|
|
— |
|
| |
|
|
|
|
|
|
|
|
|
|
|
|
|
|
|
|
| |
|
|
1,784 |
|
|
|
1,828 |
|
|
|
2,555 |
|
|
|
972 |
|
| |
|
|
|
|
|
|
|
|
|
|
|
|
|
|
|
|
| |
|
|
172,387 |
|
|
|
305,666 |
|
|
|
780,237 |
|
|
|
1,065,727 |
|
| |
|
|
|
|
|
|
|
|
|
|
|
|
|
|
|
|
| |
|
|
|
|
|
|
|
|
|
|
|
|
|
|
|
|
| Over the counter: |
|
|
|
|
|
|
|
|
|
|
|
|
|
|
|
|
| Credit swaps |
|
|
493,829 |
|
|
|
65,103 |
|
|
|
423,966 |
|
|
|
19,235 |
|
| |
|
|
|
|
|
|
|
|
|
|
|
|
|
|
|
|
| Over the counter: |
|
|
|
|
|
|
|
|
|
|
|
|
|
|
|
|
| Equity swap and forwards |
|
|
28,803 |
|
|
|
69,880 |
|
|
|
169,504 |
|
|
|
393,810 |
|
| Equity options |
|
|
3,884 |
|
|
|
8,671 |
|
|
|
2,704 |
|
|
|
1,139 |
|
| |
|
|
|
|
|
|
|
|
|
|
|
|
|
|
|
|
| |
|
|
32,687 |
|
|
|
78,551 |
|
|
|
172,208 |
|
|
|
394,949 |
|
SHINHAN FINANCIAL GROUP CO., LTD. AND SUBSIDIARIES
Notes to the Consolidated Financial Statements
(In millions of won)
|
|
|
|
|
|
|
|
|
|
|
|
|
|
|
|
|
| |
|
|
|
|
|
|
| |
|
|
|
|
|
|
|
|
|
|
|
|
| |
|
|
|
|
|
|
|
|
|
|
|
|
|
|
|
|
| Equity futures |
|
|
817 |
|
|
|
19,903 |
|
|
|
31,035 |
|
|
|
100,490 |
|
| Equity options |
|
|
6,324 |
|
|
|
167,237 |
|
|
|
11,414 |
|
|
|
145,895 |
|
| |
|
|
|
|
|
|
|
|
|
|
|
|
|
|
|
|
| |
|
|
7,141 |
|
|
|
187,140 |
|
|
|
42,449 |
|
|
|
246,385 |
|
| |
|
|
|
|
|
|
|
|
|
|
|
|
|
|
|
|
| |
|
|
39,828 |
|
|
|
265,691 |
|
|
|
214,657 |
|
|
|
641,334 |
|
| |
|
|
|
|
|
|
|
|
|
|
|
|
|
|
|
|
| |
|
|
|
|
|
|
|
|
|
|
|
|
|
|
|
|
| Over the counter: |
|
|
|
|
|
|
|
|
|
|
|
|
|
|
|
|
| Commodity swaps and forwards |
|
|
18,557 |
|
|
|
3,149 |
|
|
|
10,983 |
|
|
|
136,701 |
|
| Commodity options |
|
|
— |
|
|
|
8,406 |
|
|
|
— |
|
|
|
1,517 |
|
| |
|
|
|
|
|
|
|
|
|
|
|
|
|
|
|
|
| |
|
|
18,557 |
|
|
|
11,555 |
|
|
|
10,983 |
|
|
|
138,218 |
|
| |
|
|
|
|
|
|
|
|
|
|
|
|
|
|
|
|
| Exchange traded: |
|
|
|
|
|
|
|
|
|
|
|
|
|
|
|
|
| Commodity futures and options |
|
|
2,688 |
|
|
|
2,218 |
|
|
|
2,530 |
|
|
|
514 |
|
| |
|
|
|
|
|
|
|
|
|
|
|
|
|
|
|
|
| |
|
|
21,245 |
|
|
|
13,773 |
|
|
|
13,513 |
|
|
|
138,732 |
|
| |
|
|
|
|
|
|
|
|
|
|
|
|
|
|
|
|
| |
|
|
|
|
|
|
|
|
|
|
|
|
|
|
|
|
| Currency forwards |
|
|
106 |
|
|
|
46,139 |
|
|
|
23,143 |
|
|
|
37,757 |
|
| Currency swaps |
|
|
63,560 |
|
|
|
79,407 |
|
|
|
158,297 |
|
|
|
72,367 |
|
| Interest rate forwards and swaps |
|
|
161,397 |
|
|
|
253,263 |
|
|
|
116,864 |
|
|
|
1,069,000 |
|
| |
|
|
|
|
|
|
|
|
|
|
|
|
|
|
|
|
| |
|
|
225,063 |
|
|
|
378,809 |
|
|
|
298,304 |
|
|
|
1,179,124 |
|
| |
|
|
|
|
|
|
|
|
|
|
|
|
|
|
|
|
| |
|
W |
3,799,189 |
|
|
|
3,586,564 |
|
|
|
6,461,796 |
|
|
|
7,704,705 |
|
| |
|
|
|
|
|
|
|
|
|
|
|
|
|
|
|
|
| |
(c) |
Gain or loss on valuation of derivatives for the years ended December 31, 2020, 2021 and 2022 are as follows: |
|
|
|
|
|
|
|
|
|
|
|
|
|
|
|
|
|
|
|
|
|
|
|
| |
|
|
|
|
|
|
|
|
|
|
|
|
| Over the counter |
|
|
|
|
|
|
|
|
|
|
|
|
| Currency forwards |
|
W |
(108,854 |
) |
|
|
268,310 |
|
|
|
44,245 |
|
| Currency swaps |
|
|
210,072 |
|
|
|
(201,500 |
) |
|
|
(143,586 |
) |
| Currency options |
|
|
4,979 |
|
|
|
2,007 |
|
|
|
4,247 |
|
| |
|
|
|
|
|
|
|
|
|
|
|
|
| |
|
|
106,197 |
|
|
|
68,817 |
|
|
|
(95,094 |
) |
| |
|
|
|
|
|
|
|
|
|
|
|
|
| Exchange traded |
|
|
|
|
|
|
|
|
|
|
|
|
| Currency futures |
|
|
(96 |
) |
|
|
(199 |
) |
|
|
(48 |
) |
| |
|
|
|
|
|
|
|
|
|
|
|
|
| |
|
|
106,101 |
|
|
|
68,618 |
|
|
|
(95,142 |
) |
| |
|
|
|
|
|
|
|
|
|
|
|
|
| |
|
|
|
|
|
|
|
|
|
|
|
|
| Over the counter |
|
|
|
|
|
|
|
|
|
|
|
|
| Interest rate forwards and swaps |
|
|
(73,926 |
) |
|
|
(142,703 |
) |
|
|
(173,277 |
) |
| Interest rate options |
|
|
(372 |
) |
|
|
792 |
|
|
|
285 |
|
| |
|
|
|
|
|
|
|
|
|
|
|
|
| |
|
|
(74,298 |
) |
|
|
(141,911 |
) |
|
|
(172,992 |
) |
| |
|
|
|
|
|
|
|
|
|
|
|
|
| Exchange traded |
|
|
|
|
|
|
|
|
|
|
|
|
| Interest rate futures |
|
|
4,236 |
|
|
|
(4 |
) |
|
|
1,582 |
|
| |
|
|
|
|
|
|
|
|
|
|
|
|
| |
|
|
(70,062 |
) |
|
|
(141,915 |
) |
|
|
(171,410 |
) |
| |
|
|
|
|
|
|
|
|
|
|
|
|
SHINHAN FINANCIAL GROUP CO., LTD. AND SUBSIDIARIES
Notes to the Consolidated Financial Statements
(In millions of won)
|
|
|
|
|
|
|
|
|
|
|
|
|
|
|
|
|
|
|
|
|
|
|
| |
|
|
|
|
|
|
|
|
|
|
|
|
| Over the counter |
|
|
|
|
|
|
|
|
|
|
|
|
| Credit swaps |
|
|
7,255 |
|
|
|
192,729 |
|
|
|
(25,562 |
) |
| |
|
|
|
|
|
|
|
|
|
|
|
|
| Over the counter |
|
|
|
|
|
|
|
|
|
|
|
|
| Equity swap and forwards |
|
|
(15,979 |
) |
|
|
(176,430 |
) |
|
|
(192,888 |
) |
| Equity options |
|
|
(2,082 |
) |
|
|
3,307 |
|
|
|
3,360 |
|
| |
|
|
|
|
|
|
|
|
|
|
|
|
| |
|
|
(18,061 |
) |
|
|
(173,123 |
) |
|
|
(189,528 |
) |
| |
|
|
|
|
|
|
|
|
|
|
|
|
| Exchange traded |
|
|
|
|
|
|
|
|
|
|
|
|
| Equity futures |
|
|
26,305 |
|
|
|
(19,408 |
) |
|
|
(69,455 |
) |
| Equity options |
|
|
196,288 |
|
|
|
32,555 |
|
|
|
(27,932 |
) |
| |
|
|
|
|
|
|
|
|
|
|
|
|
| |
|
|
222,593 |
|
|
|
13,147 |
|
|
|
(97,387 |
) |
| |
|
|
|
|
|
|
|
|
|
|
|
|
| |
|
|
204,532 |
|
|
|
(159,976 |
) |
|
|
(286,915 |
) |
| |
|
|
|
|
|
|
|
|
|
|
|
|
| |
|
|
|
|
|
|
|
|
|
|
|
|
| Over the counter |
|
|
|
|
|
|
|
|
|
|
|
|
| Commodity swaps and forwards |
|
|
(13,519 |
) |
|
|
(19,097 |
) |
|
|
(148,591 |
) |
| Commodity options |
|
|
— |
|
|
|
(4,956 |
) |
|
|
5,840 |
|
| |
|
|
|
|
|
|
|
|
|
|
|
|
| |
|
|
(13,519 |
) |
|
|
(24,053 |
) |
|
|
(142,751 |
) |
| |
|
|
|
|
|
|
|
|
|
|
|
|
| Exchange traded |
|
|
|
|
|
|
|
|
|
|
|
|
| Commodity futures |
|
|
11,374 |
|
|
|
469 |
|
|
|
2,014 |
|
| |
|
|
|
|
|
|
|
|
|
|
|
|
| |
|
|
(2,145 |
) |
|
|
(23,584 |
) |
|
|
(140,737 |
) |
| |
|
|
|
|
|
|
|
|
|
|
|
|
| |
|
|
120,700 |
|
|
|
(203,563 |
) |
|
|
(741,873 |
) |
| |
|
|
|
|
|
|
|
|
|
|
|
|
| |
|
W |
366,381 |
|
|
|
(267,691) |
|
|
|
(1,461,639 |
) |
| |
|
|
|
|
|
|
|
|
|
|
|
|
| |
(d) |
Impact of hedge accounting on the consolidated financial statements |
| |
|
Gains(losses) on fair value hedged items and hedging instruments attributable to the hedged ineffectiveness for the years ended December 31, 2021 and 2022 are as follows: |
|
|
|
|
|
|
|
|
|
|
|
|
|
|
|
|
|
|
|
Gains on
fair value hedges
(hedged items) |
|
|
Losses on
fair value hedges
(hedging
instruments) |
|
|
Hedge ineffectiveness
recognized in profit
or loss (*2) |
|
| |
|
|
|
|
|
|
|
|
|
|
|
|
| |
|
W |
273,219 |
|
|
|
(281,649 |
) |
|
|
(8,430 |
) |
| Foreign exchange risk (*1) |
|
|
26,547 |
|
|
|
(32,829 |
) |
|
|
(6,282 |
) |
| |
|
|
|
|
|
|
|
|
|
|
|
|
| |
|
W |
299,766 |
|
|
|
(314,478 |
) |
|
|
(14,712 |
) |
| |
|
|
|
|
|
|
|
|
|
|
|
|
SHINHAN FINANCIAL GROUP CO., LTD. AND SUBSIDIARIES
Notes to the Consolidated Financial Statements
(In millions of won)
|
|
|
|
|
|
|
|
|
|
|
|
|
|
|
|
|
|
|
Gains on
fair value hedges
(hedged items) |
|
|
Losses on
fair value hedges
(hedging
instruments) |
|
|
Hedge ineffectiveness
recognized in profit
or loss (*2) |
|
| |
|
|
|
|
|
|
|
|
|
|
|
|
| Interest rate risk (*1) |
|
W |
697,330 |
|
|
|
(728,397 |
) |
|
|
(31,067 |
) |
| Foreign exchange risk (*1) |
|
|
20,748 |
|
|
|
(22,056 |
) |
|
|
(1,308 |
) |
| Stock price volatility risk |
|
|
(4,762 |
) |
|
|
3,411 |
|
|
|
(1,351 |
) |
| |
|
|
|
|
|
|
|
|
|
|
|
|
| |
|
W |
713,316 |
|
|
|
(747,042 |
) |
|
|
(33,726 |
) |
| |
|
|
|
|
|
|
|
|
|
|
|
|
| |
(*1) |
The related account categories are presented as interest rate swap assets / liabilities and currency swap assets. |
| |
(*2) |
Ineffective portion of hedge: the difference between hedging instruments and hedged items. |
| |
|
Due to the ineffectiveness of hedge of cash flow risk and hedge of net investment in foreign operations during the year, the amounts recognized in the income statement and other comprehensive income are as follows: |
|
|
|
|
|
|
|
|
|
|
|
|
|
|
|
|
|
|
|
Gains (losses) on hedges
recognized in other
comprehensive income |
|
|
Hedge ineffectiveness
recognized in profit
or loss (*2) |
|
|
From cash flow hedge
reserve to profit or loss
reclassified amount |
|
| |
|
|
|
|
|
|
|
|
|
|
|
|
| Interest rate risk (*1) |
|
W |
15,492 |
|
|
|
(49,882 |
) |
|
|
— |
|
| Foreign exchange risk (*1) |
|
|
14,439 |
|
|
|
(14,955 |
) |
|
|
24,464 |
|
| Discontinuation of cash flow hedges |
|
|
— |
|
|
|
— |
|
|
|
8,799 |
|
Hedge of net investments: |
|
|
|
|
|
|
|
|
|
|
|
|
| Foreign exchange risk (*1) |
|
|
(74,525 |
) |
|
|
(2,094 |
) |
|
|
— |
|
| |
|
|
|
|
|
|
|
|
|
|
|
|
| |
|
W |
(44,594 |
) |
|
|
(66,931 |
) |
|
|
33,263 |
|
| |
|
|
|
|
|
|
|
|
|
|
|
|
| |
|
| |
|
|
|
| |
|
Gains (losses) on hedges
recognized in other
comprehensive income |
|
|
Hedge ineffectiveness
recognized in profit
or loss (*2) |
|
|
From cash flow hedge
reserve to profit or loss
reclassified amount |
|
| |
|
|
|
|
|
|
|
|
|
|
|
|
| Interest rate risk (*1) |
|
W |
(132,203 |
) |
|
|
(47,854 |
) |
|
|
(65 |
) |
| Foreign exchange risk (*1) |
|
|
32,159 |
|
|
|
(54,969 |
) |
|
|
124,214 |
|
| Discontinuation of cash flow hedges |
|
|
— |
|
|
|
— |
|
|
|
9,270 |
|
Hedge of net investments: |
|
|
|
|
|
|
|
|
|
|
|
|
| Foreign exchange risk (*1) |
|
|
(25,793 |
) |
|
|
(4,096 |
) |
|
|
— |
|
| |
|
|
|
|
|
|
|
|
|
|
|
|
| |
|
W |
(125,837 |
) |
|
|
(106,919 |
) |
|
|
133,419 |
|
| |
|
|
|
|
|
|
|
|
|
|
|
|
| |
(*1) |
The related account categories are presented as interest rate swap assets / liabilities and currency swap assets / liabilities, currency forwards assets / liabilities and borrowings. |
| |
(*2) |
Ineffective portion of hedge: The difference between hedging instruments and hedged items. |
SHINHAN FINANCIAL GROUP CO., LTD. AND SUBSIDIARIES
Notes to the Consolidated Financial Statements
(In millions of won)
| |
(e) |
Effect of hedge accounting on financial statement, statement of comprehensive income, statement of changes in equity |
| |
|
Purpose and strategy of risk avoidance |
The Group transacts with derivative financial instruments to hedge its interest rate risk and currency risk arising from the assets and liabilities of the Group. The Group applies the fair value hedge accounting for the changes in the market interest rates of the Korean won structured notes, foreign currency generated financial debentures, structured deposits in foreign currencies and foreign currency investment receivables; and cash flow hedge accounting for interest rate swaps and currency swaps to hedge cash flow risk due to interest rates and foreign exchange rates of the Korean won debt, the Korean won bonds, foreign currency bonds, etc. In addition, in order to hedge the exchange rate risk of the net investment in overseas business, the Group applies the net investment hedge accounting for foreign operations using currency forward and
non-derivative
financial instruments.
| |
|
Nominal amounts and average hedge ratios for hedging instruments as of December 31, 2021 and 2022 are as follows: |
|
|
|
|
|
|
|
|
|
|
|
|
|
|
|
|
|
|
|
|
|
|
|
|
|
|
|
|
|
|
|
|
|
|
|
Less than
1 year |
|
|
1~2
years |
|
|
2~3
years |
|
|
3~4
years |
|
|
4~5
years |
|
|
More than
5 years |
|
|
Total |
|
|
|
|
|
|
|
|
|
|
|
|
|
|
|
|
|
|
|
|
|
|
|
|
|
|
|
|
|
|
| |
|
|
|
|
|
|
|
|
|
|
|
|
|
|
|
|
|
|
|
|
|
|
|
|
|
|
|
|
| |
|
|
693,057 |
|
|
|
1,256,392 |
|
|
|
641,413 |
|
|
|
158,833 |
|
|
|
1,589,729 |
|
|
|
4,356,536 |
|
|
|
8,695,960 |
|
Average price condition (*1) |
|
|
0.88 |
% |
|
|
1.21 |
% |
|
|
1.30 |
% |
|
|
1.00 |
% |
|
|
1.00 |
% |
|
|
0.66 |
% |
|
|
0.87 |
% |
| |
|
|
100 |
% |
|
|
100 |
% |
|
|
100 |
% |
|
|
100 |
% |
|
|
100 |
% |
|
|
100 |
% |
|
|
100 |
% |
| |
|
|
|
|
|
|
|
|
|
|
|
|
|
|
|
|
|
|
|
|
|
|
|
|
|
|
|
|
| |
|
|
|
|
|
|
|
|
|
|
|
|
|
|
|
|
|
|
|
|
|
|
|
|
|
|
|
|
| |
|
|
2,328,042 |
|
|
|
2,164,591 |
|
|
|
568,991 |
|
|
|
699,433 |
|
|
|
480,878 |
|
|
|
22,525 |
|
|
|
6,264,460 |
|
| |
|
|
100 |
% |
|
|
100 |
% |
|
|
100 |
% |
|
|
100 |
% |
|
|
100 |
% |
|
|
100 |
% |
|
|
100 |
% |
| |
|
|
|
|
|
|
|
|
|
|
|
|
|
|
|
|
|
|
|
|
|
|
|
|
|
|
|
|
| |
(*1) |
Interest rate swaps consist of 3M CD, 3M USD Libor, 3M Euribor, and 3M AUD Bond. |
| |
(*2) |
The average exchange rates of net investment hedge instruments are USD/KRW 1,143.95, JPY/KRW 10.53, EUR/KRW 1,288.52, GBP/KRW 1,484.00, AUD/KRW 817.06, CAD/KRW 868.95, SGD/KRW 859.87, CNY/KRW 174.40, SEK/KRW 124.85 |
SHINHAN FINANCIAL GROUP CO., LTD. AND SUBSIDIARIES
Notes to the Consolidated Financial Statements
(In millions of won)
|
|
|
|
|
|
|
|
|
|
|
|
|
|
|
|
|
|
|
|
|
|
|
|
|
|
|
|
|
|
|
|
|
|
|
Less than
1 year |
|
|
1~2
years |
|
|
2~3
years |
|
|
3~4
years |
|
|
4~5
years |
|
|
More than
5 years |
|
|
Total |
|
|
|
|
|
|
|
|
|
|
|
|
|
|
|
|
|
|
|
|
|
|
|
|
|
|
|
|
|
|
| |
|
|
|
|
|
|
|
|
|
|
|
|
|
|
|
|
|
|
|
|
|
|
|
|
|
|
|
|
| |
|
|
5,338,313 |
|
|
|
3,023,185 |
|
|
|
612,113 |
|
|
|
2,114,152 |
|
|
|
819,140 |
|
|
|
4,568,622 |
|
|
|
16,475,525 |
|
Average price condition (*1) |
|
|
0.72 |
% |
|
|
0.82 |
% |
|
|
2.53 |
% |
|
|
1.52 |
% |
|
|
1.48 |
% |
|
|
0.68 |
% |
|
|
0.94 |
% |
| |
|
|
100 |
% |
|
|
100 |
% |
|
|
100 |
% |
|
|
100 |
% |
|
|
100 |
% |
|
|
100 |
% |
|
|
100 |
% |
| |
|
|
|
|
|
|
|
|
|
|
|
|
|
|
|
|
|
|
|
|
|
|
|
|
|
|
|
|
| |
|
|
|
|
|
|
|
|
|
|
|
|
|
|
|
|
|
|
|
|
|
|
|
|
|
|
|
|
| |
|
|
2,620,663 |
|
|
|
610,676 |
|
|
|
1,108,785 |
|
|
|
1,900,980 |
|
|
|
942,804 |
|
|
|
— |
|
|
|
7,183,908 |
|
| |
|
|
100 |
% |
|
|
100 |
% |
|
|
100 |
% |
|
|
100 |
% |
|
|
100 |
% |
|
|
— |
|
|
|
100 |
% |
| |
|
|
|
|
|
|
|
|
|
|
|
|
|
|
|
|
|
|
|
|
|
|
|
|
|
|
|
|
| |
(*1) |
Interest rate swaps consist of 3M CD, 3M USD Libor, 3M Euribor, and 3M AUD Bond. |
| |
(*2) |
The average exchange rates of net investment hedge instruments are USD/KRW 1,198.11, JPY/KRW 10.13, EUR/KRW 1,336.97, GBP/KRW 1,484.00, AUD/KRW 812.44, CAD/KRW 948.79, SGD/KRW 859.87, CNY/KRW 190.96, SEK/KRW 125.49. |
| |
|
Effect of derivatives on statement financial position, statement of comprehensive income, statement of changes in equity |
|
|
|
|
|
|
|
|
|
|
|
|
|
|
|
|
|
| |
|
|
|
|
|
Nominal amount |
|
|
Carrying value
of asset (*) |
|
|
Carrying value
of liabilities (*) |
|
|
Changes in fair
value in the period |
|
|
|
|
|
|
|
|
|
|
|
|
|
|
|
|
|
|
| |
|
|
|
|
|
|
|
|
|
|
|
|
|
|
|
|
| Interest rate swap |
|
W |
7,079,468 |
|
|
|
156,710 |
|
|
|
236,758 |
|
|
|
(277,450 |
) |
| Currency forward |
|
|
176,369 |
|
|
|
— |
|
|
|
4,995 |
|
|
|
(8,835 |
) |
| |
|
|
|
|
|
|
|
|
|
|
|
|
|
|
|
|
| Interest rate swap |
|
|
1,616,492 |
|
|
|
4,687 |
|
|
|
16,505 |
|
|
|
23,257 |
|
| Currency swap |
|
|
3,726,939 |
|
|
|
63,560 |
|
|
|
79,407 |
|
|
|
156,271 |
|
| Currency forward |
|
|
866,129 |
|
|
|
106 |
|
|
|
31,486 |
|
|
|
(63,659 |
) |
Hedge of net investments in foreign operations |
|
|
|
|
|
|
|
|
|
|
|
|
|
|
|
|
| Currency forward |
|
|
237,100 |
|
|
|
— |
|
|
|
9,658 |
|
|
|
(14,948 |
) |
| Borrowings |
|
|
1,257,923 |
|
|
|
— |
|
|
|
1,256,241 |
|
|
|
(61,672 |
) |
| |
(*) |
The related account categories are presented as interest rate swap assets / liabilities and currency forward assets and liabilities. |
SHINHAN FINANCIAL GROUP CO., LTD. AND SUBSIDIARIES
Notes to the Consolidated Financial Statements
(In millions of won)
|
|
|
|
|
|
|
|
|
|
|
|
|
|
|
|
|
|
|
|
|
|
|
Nominal amount |
|
|
Carrying value
of asset (*) |
|
|
Carrying value
of liabilities (*) |
|
|
Changes in fair
value in the period |
|
| |
|
|
|
|
|
|
|
|
|
|
|
|
|
|
|
|
| Interest rate forward and swap |
|
W |
13,530,243 |
|
|
|
77,757 |
|
|
|
895,005 |
|
|
|
(740,190 |
) |
| Currency forward |
|
|
113,126 |
|
|
|
4,038 |
|
|
|
635 |
|
|
|
1,780 |
|
| |
|
|
|
|
|
|
|
|
|
|
|
|
|
|
|
|
| Interest rate swap |
|
|
2,945,282 |
|
|
|
39,107 |
|
|
|
173,995 |
|
|
|
(126,075 |
) |
| Currency swap |
|
|
4,647,281 |
|
|
|
158,297 |
|
|
|
72,367 |
|
|
|
119,277 |
|
| Currency forward |
|
|
883,003 |
|
|
|
15,708 |
|
|
|
35,976 |
|
|
|
(3,136 |
) |
Hedge of net investments in foreign operations |
|
|
|
|
|
|
|
|
|
|
|
|
|
|
|
|
| Currency forward |
|
|
253,460 |
|
|
|
3,397 |
|
|
|
1,146 |
|
|
|
(773 |
) |
| Borrowings |
|
|
1,287,039 |
|
|
|
— |
|
|
|
1,282,361 |
|
|
|
(29,116 |
) |
| |
(*) |
The related account categories are presented as interest rate swap assets / liabilities and currency forward assets and liabilities. |
| |
|
Effect of hedging items on statement financial position, statement of comprehensive income, statement of changes in equity |
|
|
|
|
|
|
|
|
|
|
|
|
|
|
|
|
|
|
|
|
|
|
|
|
|
|
|
|
|
|
|
|
|
|
|
Carrying
value of
asset (*) |
|
|
Carrying
value of
liabilities (*) |
|
|
Assets of
Cumulative
fair value
hedge
adjustment |
|
|
Liabilities of
Cumulative
fair value
hedge
adjustment |
|
|
Changes if
fair value in
the year |
|
|
Cash flow
hedge
reserve |
|
|
Foreign
currency
conversion
reserves |
|
| |
|
|
|
|
|
|
|
|
|
|
|
|
|
|
|
|
|
|
|
|
|
|
|
|
|
|
|
|
| Interest rate risk Borrowings and others |
|
W |
704,942 |
|
|
|
6,370,330 |
|
|
|
6,207 |
|
|
|
(85,441 |
) |
|
|
274,005 |
|
|
|
— |
|
|
|
— |
|
| Foreign exchange risk Securities in foreign currency |
|
|
415,693 |
|
|
|
— |
|
|
|
— |
|
|
|
— |
|
|
|
23,109 |
|
|
|
— |
|
|
|
— |
|
| |
|
|
|
|
|
|
|
|
|
|
|
|
|
|
|
|
|
|
|
|
|
|
|
|
|
|
|
|
| Interest rate risk Debentures in won and debentures in foreign currency |
|
|
607,062 |
|
|
|
1,714,303 |
|
|
|
— |
|
|
|
— |
|
|
|
22,432 |
|
|
|
67,553 |
|
|
|
— |
|
| Foreign exchange risk Debentures in foreign currency and loans in foreign currency |
|
|
2,848,303 |
|
|
|
2,782,574 |
|
|
|
— |
|
|
|
— |
|
|
|
336,281 |
|
|
|
(19,296 |
) |
|
|
— |
|
Hedge of net investments in foreign operations |
|
|
|
|
|
|
|
|
|
|
|
|
|
|
|
|
|
|
|
|
|
|
|
|
|
|
|
|
| Foreign exchange risk Net assets in foreign operation |
|
|
— |
|
|
|
— |
|
|
|
— |
|
|
|
— |
|
|
|
74,525 |
|
|
|
— |
|
|
|
(66,626 |
) |
| |
(*) |
The related account categories are presented as interest rate swap assets / liabilities and currency forwards. |
SHINHAN FINANCIAL GROUP CO., LTD. AND SUBSIDIARIES
Notes to the Consolidated Financial Statements
(In millions of won)
|
|
|
|
|
|
|
|
|
|
|
|
|
|
|
|
|
|
|
|
|
|
|
|
|
|
|
|
|
|
|
|
|
|
|
Carrying
value of
asset (*) |
|
|
Carrying
value of
liabilities (*) |
|
|
Assets of
Cumulative
fair value
hedge
adjustment |
|
|
Liabilities of
Cumulative
fair value
hedge
adjustment |
|
|
Changes if
fair value in
the year |
|
|
Cash flow
hedge
reserve |
|
|
Foreign
currency
conversion
reserves |
|
| |
|
|
|
|
|
|
|
|
|
|
|
|
|
|
|
|
|
|
|
|
|
|
|
|
|
|
|
|
| Interest rate risk Borrowings and others |
|
W |
505,668 |
|
|
|
12,711,595 |
|
|
|
69,687 |
|
|
|
(861,128 |
) |
|
|
708,439 |
|
|
|
— |
|
|
|
— |
|
| Foreign exchange risk Securities in foreign currency |
|
|
205,470 |
|
|
|
— |
|
|
|
— |
|
|
|
— |
|
|
|
(4,002 |
) |
|
|
— |
|
|
|
— |
|
| |
|
|
|
|
|
|
|
|
|
|
|
|
|
|
|
|
|
|
|
|
|
|
|
|
|
|
|
|
| Interest rate risk Debentures in won and debentures in foreign currency |
|
|
475,027 |
|
|
|
1,689,360 |
|
|
|
— |
|
|
|
— |
|
|
|
31,830 |
|
|
|
(58,956 |
) |
|
|
— |
|
| Foreign exchange risk Debentures in foreign currency and
loans in foreign currency |
|
|
2,778,511 |
|
|
|
2,843,059 |
|
|
|
— |
|
|
|
— |
|
|
|
52,361 |
|
|
|
(1,468 |
) |
|
|
— |
|
Hedge of net investments in foreign operations |
|
|
|
|
|
|
|
|
|
|
|
|
|
|
|
|
|
|
|
|
|
|
|
|
|
|
|
|
| Foreign exchange risk Net assets in foreign operation |
|
|
— |
|
|
|
— |
|
|
|
— |
|
|
|
— |
|
|
|
25,793 |
|
|
|
— |
|
|
|
(40,834 |
) |
| |
(*) |
The related account categories are presented as interest rate swap assets / liabilities and currency forwards. |
| |
(f) |
Hedge relationships affected by an interest rate index |
The revised Standard requires exceptions to the analysis of future information in relation to the application of hedge accounting, while uncertainty exists due to movements of the interest rate indicator reform. The exception assumes that when assessing whether the expected cash flows that comply with existing interest rate indicators are highly probable, whether there is an economic relationship between the hedged item and the hedging instrument, and whether there is a high hedge effectiveness between the hedged item and the hedging instrument, the interest rate indicators that are based on the hedged item do not change due to the effect of the interest rate index reform. The nominal amount of the hedging instrument related to the interest rate index exposed to the hedging relationship due to the Group’s reform of the interest rate index as of December 31, 2021 and 2022, are as follows:
|
|
|
|
|
|
|
|
|
|
|
|
|
|
|
|
|
| |
|
Carrying value of
hedged item, Assets |
|
|
Carrying value of
hedged item, Liabilities |
|
|
Nominal amount of
hedging instrument |
|
|
|
|
|
|
|
|
|
|
|
|
|
|
| |
|
|
— |
|
|
|
2,509,045 |
|
|
|
2,580,000 |
|
| |
|
|
— |
|
|
|
241,192 |
|
|
|
241,842 |
|
| |
|
|
539,197 |
|
|
|
3,589,452 |
|
|
|
4,187,018 |
|
| |
|
|
— |
|
|
|
220,992 |
|
|
|
221,050 |
|
| |
|
|
25,094 |
|
|
|
267,830 |
|
|
|
293,972 |
|
|
|
|
|
|
|
|
|
|
|
|
|
|
|
|
|
564,291 |
|
|
|
6,828,511 |
|
|
|
7,523,882 |
|
|
|
|
|
|
|
|
|
|
|
|
|
|
|
(*1) |
Include nominal amount of the hedging instrument related to the CMS(Constant Maturity Swap) calculated based on the CD and LIBOR rate. |
|
(*2) |
Exclude the nominal amount that will mature before the end of June 30, 2023, when LIBOR interest rate calculation is discontinued. |
SHINHAN FINANCIAL GROUP CO., LTD. AND SUBSIDIARIES
Notes to the Consolidated Financial Statements
|
|
|
|
|
|
|
|
|
|
|
|
|
|
|
|
|
| |
|
Carrying value of
hedged item, Assets |
|
|
Carrying value of
hedged item, Liabilities |
|
|
Nominal amount of
hedging instrument |
|
|
|
|
|
|
|
|
|
|
|
|
|
|
| KRW 3M CD (*1) |
|
W |
— |
|
|
|
9,247,047 |
|
|
|
9,390,000 |
|
| USD 1M LIBOR (*2) |
|
|
— |
|
|
|
258,393 |
|
|
|
258,529 |
|
| USD 3M LIBOR(*1),(*2) |
|
|
283,014 |
|
|
|
3,785,641 |
|
|
|
4,196,714 |
|
| EURIBOR 1M |
|
|
— |
|
|
|
— |
|
|
|
— |
|
| EURIBOR 3M |
|
|
3,236 |
|
|
|
269,826 |
|
|
|
274,294 |
|
| |
|
|
|
|
|
|
|
|
|
|
|
|
| |
|
W |
286,250 |
|
|
|
13,560,907 |
|
|
|
14,119,537 |
|
| |
|
|
|
|
|
|
|
|
|
|
|
|
| |
(*1) |
Include nominal amount of the hedging instrument related to the CMS(Constant Maturity Swap) calculated based on the CD and LIBOR rate. |
| |
(*2) |
Exclude the nominal amount that will mature before the end of June 30, 2023, when LIBOR interest rate calculation is discontinued. |
The USD LIBOR interest rate will be replaced by a SOFR (Secured Overnight Financing Rate) based on actual transactions. In Korea, the “Korea Overnight Financing Repo Rate (KOFR)” was finally selected as the risk-free index interest rate. The Group has assumed that in this hedging relationship, the spread changed on the basis of SOFR, KOFR would be similar to the spread included in the interest rate swap and forward used as the hedging instrument after LIBOR rate is suspended. The Group does not assume any changes in other conditions.
SHINHAN FINANCIAL GROUP CO., LTD. AND SUBSIDIARIES
Notes to the Consolidated Financial Statements
|
Securities at fair value through other comprehensive income and securities at amortized cost |
|
(a) |
Details of securities at FVOCI and securities at amortized cost as of December 31, 2021 and 2022 are as follows: |
|
|
|
|
|
|
|
|
|
|
|
|
|
|
|
|
| |
|
|
|
|
|
|
|
|
| Debt securities: |
|
|
|
|
|
|
|
|
| Government bonds |
|
W |
25,687,070 |
|
|
|
27,197,987 |
|
| Financial institutions bonds |
|
|
19,702,292 |
|
|
|
19,030,714 |
|
| Corporate bonds and others |
|
|
18,417,557 |
|
|
|
15,865,207 |
|
| |
|
|
|
|
|
|
|
|
| |
|
|
63,806,919 |
|
|
|
62,093,908 |
|
| |
|
|
|
|
|
|
|
|
| Equity securities (*): |
|
|
|
|
|
|
|
|
| Stocks |
|
|
922,579 |
|
|
|
1,475,153 |
|
| Equity investments |
|
|
4,118 |
|
|
|
3,833 |
|
| Others |
|
|
104,707 |
|
|
|
88,825 |
|
| |
|
|
|
|
|
|
|
|
| |
|
|
1,031,404 |
|
|
|
1,567,811 |
|
| |
|
|
|
|
|
|
|
|
| |
|
|
64,838,323 |
|
|
|
63,661,719 |
|
| |
|
|
|
|
|
|
|
|
Securities at amortized cost: |
|
|
|
|
|
|
|
|
| Debt securities: |
|
|
|
|
|
|
|
|
| Government bonds |
|
|
34,679,301 |
|
|
|
38,371,463 |
|
| Financial institutions bonds |
|
|
3,423,536 |
|
|
|
6,530,386 |
|
| Corporate bonds and others |
|
|
11,827,239 |
|
|
|
13,069,644 |
|
| |
|
|
|
|
|
|
|
|
| |
|
|
49,930,076 |
|
|
|
57,971,493 |
|
| |
|
|
|
|
|
|
|
|
| |
|
W |
114,768,399 |
|
|
|
121,633,212 |
|
| |
|
|
|
|
|
|
|
|
| |
(*) |
Equity securities in the table above are classified as other comprehensive income—equity securities designated as fair value items, and other comprehensive income and fair value options are exercised for the purpose of holding as required by the policy. |
|
(b) |
Changes in carrying value of debt securities at fair value through other comprehensive income and securities at amortized cost for the years ended December 31, 2021 and 2022 are as follows: |
|
|
|
|
|
|
|
|
|
|
|
|
|
|
|
|
|
|
|
|
|
|
|
|
|
|
|
|
|
|
|
Debt securities at fair value through
other comprehensive income |
|
|
Debt securities at amortized cost |
|
|
|
|
|
|
|
|
|
|
|
|
|
|
|
|
|
|
|
| Beginning balance |
|
W |
57,142,298 |
|
|
|
267,135 |
|
|
|
57,409,433 |
|
|
|
47,293,109 |
|
|
|
— |
|
|
|
47,293,109 |
|
Transfer (from)to 12-month expected credit loss |
|
|
51,055 |
|
|
|
(51,055 |
) |
|
|
— |
|
|
|
— |
|
|
|
— |
|
|
|
— |
|
| Transfer (from)to life time expected credit loss |
|
|
(35,665 |
) |
|
|
35,665 |
|
|
|
— |
|
|
|
(35,505 |
) |
|
|
35,505 |
|
|
|
— |
|
| Net increase and decrease (*) |
|
|
6,496,445 |
|
|
|
(98,959 |
) |
|
|
6,397,486 |
|
|
|
2,653,129 |
|
|
|
785 |
|
|
|
2,653,914 |
|
| |
|
|
|
|
|
|
|
|
|
|
|
|
|
|
|
|
|
|
|
|
|
|
|
|
| Ending balance |
|
W |
63,654,133 |
|
|
|
152,786 |
|
|
|
63,806,919 |
|
|
|
49,910,733 |
|
|
|
36,290 |
|
|
|
49,947,023 |
|
| |
|
|
|
|
|
|
|
|
|
|
|
|
|
|
|
|
|
|
|
|
|
|
|
|
| |
(*) |
Included the effects from changes in purchase, disposal, repayment, foreign exchange rate, amortization of fair value adjustments recognized through business combination accountings. |
SHINHAN FINANCIAL GROUP CO., LTD. AND SUBSIDIARIES
Notes to the Consolidated Financial Statements
|
Securities at fair value through other comprehensive income and securities at amortized cost (continued) |
|
|
|
|
|
|
|
|
|
|
|
|
|
|
|
|
|
|
|
|
|
|
|
|
|
|
|
|
|
|
|
Debt securities at fair value through
other comprehensive income |
|
|
Debt securities at amortized cost |
|
|
12-month expected credit loss |
|
|
|
|
|
|
|
|
|
|
|
|
|
|
|
|
| Beginning balance |
|
W |
63,654,133 |
|
|
|
152,786 |
|
|
|
63,806,919 |
|
|
|
49,910,733 |
|
|
|
36,290 |
|
|
|
49,947,023 |
|
Transfer (from)to 12-month expected credit loss |
|
|
61,740 |
|
|
|
(61,740 |
) |
|
|
— |
|
|
|
18,544 |
|
|
|
(18,544 |
) |
|
|
— |
|
| Transfer (from)to life time expected credit loss |
|
|
(23,619 |
) |
|
|
23,619 |
|
|
|
— |
|
|
|
— |
|
|
|
— |
|
|
|
— |
|
| Net increase and decrease (*) |
|
|
(1,690,349 |
) |
|
|
(47,467 |
) |
|
|
(1,737,816 |
) |
|
|
8,048,071 |
|
|
|
(7,230 |
) |
|
|
8,040,841 |
|
| Business combination (Note 47) |
|
|
24,805 |
|
|
|
— |
|
|
|
24,805 |
|
|
|
— |
|
|
|
— |
|
|
|
— |
|
| |
|
|
|
|
|
|
|
|
|
|
|
|
|
|
|
|
|
|
|
|
|
|
|
|
| Ending balance |
|
W |
62,026,710 |
|
|
|
67,198 |
|
|
|
62,093,908 |
|
|
|
57,977,348 |
|
|
|
10,516 |
|
|
|
57,987,864 |
|
| |
|
|
|
|
|
|
|
|
|
|
|
|
|
|
|
|
|
|
|
|
|
|
|
|
| |
(*) |
Included the effects from changes in purchase, disposal, repayment, valuation, changes in foreign exchange rate and amortization of fair value adjustments recognized through business combination accountings and the others |
|
(c) |
Changes in allowance for credit loss of debt securities at fair value through other comprehensive income and securities at amortized cost for the years ended December 31, 2021 and 2022 are as follows: |
|
|
|
|
|
|
|
|
|
|
|
|
|
|
|
|
|
|
|
|
|
|
|
|
|
|
|
|
|
|
|
Debt securities at fair value through
other comprehensive income |
|
|
Debt securities at amortized cost |
|
|
12 months
expected
credit loss |
|
|
Life time
expected
credit loss |
|
|
|
|
|
12 months
expected
credit loss |
|
|
Life time
expected
credit loss |
|
|
|
|
| Beginning balance |
|
W |
22,493 |
|
|
|
678 |
|
|
|
23,171 |
|
|
|
10,486 |
|
|
|
— |
|
|
|
10,486 |
|
Transfer (from)to 12-month expected credit loss |
|
|
33 |
|
|
|
(33 |
) |
|
|
— |
|
|
|
— |
|
|
|
— |
|
|
|
— |
|
| Transfer (from)to life time expected credit loss |
|
|
(63 |
) |
|
|
63 |
|
|
|
— |
|
|
|
(216 |
) |
|
|
216 |
|
|
|
— |
|
| Provision (Reversal) |
|
|
19,722 |
|
|
|
(25 |
) |
|
|
19,697 |
|
|
|
5,065 |
|
|
|
240 |
|
|
|
5,305 |
|
| Disposal and others (*) |
|
|
(5,302 |
) |
|
|
(80 |
) |
|
|
(5,382 |
) |
|
|
1,149 |
|
|
|
7 |
|
|
|
1,156 |
|
| |
|
|
|
|
|
|
|
|
|
|
|
|
|
|
|
|
|
|
|
|
|
|
|
|
| Ending balance |
|
W |
36,883 |
|
|
|
603 |
|
|
|
37,486 |
|
|
|
16,484 |
|
|
|
463 |
|
|
|
16,947 |
|
| |
|
|
|
|
|
|
|
|
|
|
|
|
|
|
|
|
|
|
|
|
|
|
|
|
| |
(*) |
Included the effects from changes in foreign exchange rate, debt restructuring, investment conversion. |
SHINHAN FINANCIAL GROUP CO., LTD. AND SUBSIDIARIES
Notes to the Consolidated Financial Statements
|
Securities at fair value through other comprehensive income and securities at amortized cost (continued) |
|
|
|
|
|
|
|
|
|
|
|
|
|
|
|
|
|
|
|
|
|
|
|
|
|
|
|
|
|
|
|
Debt securities at fair value through
other comprehensive income |
|
|
Debt securities at amortized cost |
|
|
12 months
expected
credit loss |
|
|
Life time
expected
credit loss |
|
|
|
|
|
12 months
expected
credit loss |
|
|
Life time
expected
credit loss |
|
|
|
|
| Beginning balance |
|
W |
36,883 |
|
|
|
603 |
|
|
|
37,486 |
|
|
|
16,484 |
|
|
|
463 |
|
|
|
16,947 |
|
Transfer (from)to 12-month expected credit loss |
|
|
166 |
|
|
|
(166 |
) |
|
|
— |
|
|
|
203 |
|
|
|
(203 |
) |
|
|
— |
|
| Transfer (from)to life time expected credit loss |
|
|
(20 |
) |
|
|
20 |
|
|
|
— |
|
|
|
— |
|
|
|
— |
|
|
|
— |
|
| Provision (Reversal) |
|
|
(3,393 |
) |
|
|
(355 |
) |
|
|
(3,748 |
) |
|
|
(197 |
) |
|
|
(94 |
) |
|
|
(291 |
) |
| Disposal and others (*) |
|
|
(641 |
) |
|
|
11 |
|
|
|
(630 |
) |
|
|
(276 |
) |
|
|
(9 |
) |
|
|
(285 |
) |
| |
|
|
|
|
|
|
|
|
|
|
|
|
|
|
|
|
|
|
|
|
|
|
|
|
| Ending balance |
|
W |
32,995 |
|
|
|
113 |
|
|
|
33,108 |
|
|
|
16,214 |
|
|
|
157 |
|
|
|
16,371 |
|
| |
|
|
|
|
|
|
|
|
|
|
|
|
|
|
|
|
|
|
|
|
|
|
|
|
| |
(*) |
Included the effects from changes in debt restructuring, investment conversion, foreign exchange rate and the others. |
| |
(d) |
Gain or loss on disposal of securities at fair value through other comprehensive income and securities at amortized cost for the years ended December 31, 2021 and 2022 are as follows: |
|
|
|
|
|
|
|
|
|
| |
|
|
|
|
|
|
| Gain on disposal of securities at FVOCI |
|
W |
131,189 |
|
|
|
26,357 |
|
| Loss on disposal of securities at FVOCI |
|
|
(45,593 |
) |
|
|
(153,750 |
) |
| Gain on disposal of securities at amortized cost (*) |
|
|
24 |
|
|
|
4 |
|
| Loss on disposal of securities at amortized cost (*) |
|
|
(343 |
) |
|
|
(105 |
) |
| |
|
|
|
|
|
|
|
|
| |
|
W |
85,277 |
|
|
|
(127,494 |
) |
| |
|
|
|
|
|
|
|
|
| |
(*) |
The issuers of those securities have exercised the early redemption options and the others. |
| |
(e) |
Income or loss on equity securities at fair value through other comprehensive income |
| |
i) |
The Group recognizes dividends, amounting to W 24,216 million and W 26,996 million, related to equity securities at fair value through other comprehensive income for the years ended December 31, 2021 and 2022, respectively. |
| |
ii) |
The details of disposal of equity securities at fair value through other comprehensive income for the years ended December 31, 2021 and 2022 are as follows: |
|
|
|
|
|
|
|
|
|
|
|
|
|
|
|
|
|
|
Stocks acquired by
investment conversion |
|
| Fair value at the date of disposal |
|
W |
84,624 |
|
|
|
48,525 |
|
Cumulative net gain at the time of disposal |
|
|
(42,058 |
) |
|
|
2,943 |
|
|
(*) |
The reason for the disposal is the disposal of stocks acquired by investment conversion. |
SHINHAN FINANCIAL GROUP CO., LTD. AND SUBSIDIARIES
Notes to the Consolidated Financial Statements
(In millions of won)
|
Loans at amortized cost, etc. |
| |
(a) |
Loans at amortized cost for configuration by customer as of December 31, 2021 and 2022 are as follows: |
|
|
|
|
|
|
|
|
|
| |
|
|
|
|
|
|
| Retail loans |
|
W |
159,006,999 |
|
|
|
160,416,509 |
|
| Corporate loans(*) |
|
|
199,465,807 |
|
|
|
215,344,233 |
|
| Public and other loans |
|
|
3,468,917 |
|
|
|
3,788,040 |
|
| Loans between banks |
|
|
3,849,565 |
|
|
|
7,428,874 |
|
| Credit card receivables |
|
|
25,999,576 |
|
|
|
28,459,691 |
|
| |
|
|
|
|
|
|
|
|
| |
|
|
391,790,864 |
|
|
|
415,437,347 |
|
| |
|
|
|
|
|
|
|
|
| Discount |
|
|
(30,001 |
) |
|
|
(21,879 |
) |
| Deferred loan origination costs |
|
|
543,361 |
|
|
|
526,906 |
|
| |
|
|
|
|
|
|
|
|
| |
|
|
392,304,224 |
|
|
|
415,942,374 |
|
| Less: Allowance for credit loss |
|
|
(3,167,068 |
) |
|
|
(3,650,863 |
) |
| |
|
|
|
|
|
|
|
|
| |
|
W |
389,137,156 |
|
|
|
412,291,511 |
|
| |
|
|
|
|
|
|
|
|
|
(*) |
Included loans for solo proprietor business, etc. |
SHINHAN FINANCIAL GROUP CO., LTD. AND SUBSIDIARIES
Notes to the Consolidated Financial Statements
(In millions of won)
|
Loans at amortized cost, etc. (continued) |
| |
(b) |
Changes in carrying value of loans at amortized cost, etc. as of December 31, 2021 and 2022 are as follows: |
|
|
|
|
|
|
|
|
|
|
|
|
|
|
|
|
|
|
|
|
|
|
|
|
|
|
|
|
|
|
|
|
|
|
|
|
|
|
|
|
|
|
|
|
|
|
|
|
|
|
|
|
|
| |
|
|
|
| |
|
|
|
|
|
|
|
|
|
|
|
|
|
|
|
| |
12 months
expected credit
loss |
|
|
Life time
expected
credit loss |
|
|
|
|
|
12 months
expected
credit loss |
|
|
Life time
expected
credit loss |
|
|
|
|
|
12 months
expected
credit loss |
|
|
Life time
expected
credit loss |
|
|
|
|
|
12 months
expected
credit loss |
|
|
Life
time
expected
credit
loss |
|
|
|
|
|
|
|
| Beginning balance |
|
W |
138,516,630 |
|
|
|
8,215,137 |
|
|
|
466,427 |
|
|
|
152,338,024 |
|
|
|
26,210,417 |
|
|
|
1,057,932 |
|
|
|
18,969,258 |
|
|
|
3,951,689 |
|
|
|
468,377 |
|
|
|
8,405,173 |
|
|
|
665,196 |
|
|
|
18,225 |
|
|
|
359,282,485 |
|
| Transfer (from) to 12 months expected credit losses |
|
|
3,200,712 |
|
|
|
(3,192,315 |
) |
|
|
(8,397 |
) |
|
|
6,566,663 |
|
|
|
(6,494,160 |
) |
|
|
(72,503 |
) |
|
|
390,658 |
|
|
|
(390,593 |
) |
|
|
(65 |
) |
|
|
43,343 |
|
|
|
(43,343 |
) |
|
|
— |
|
|
|
— |
|
| Transfer (from) to lifetime expected credit losses |
|
|
(3,482,541 |
) |
|
|
3,516,278 |
|
|
|
(33,737 |
) |
|
|
(9,636,590 |
) |
|
|
9,659,114 |
|
|
|
(22,524 |
) |
|
|
(674,961 |
) |
|
|
675,063 |
|
|
|
(102 |
) |
|
|
(94,270 |
) |
|
|
94,272 |
|
|
|
(2 |
) |
|
|
— |
|
| Transfer (from) to credit- impaired financial assets |
|
|
(194,192 |
) |
|
|
(134,008 |
) |
|
|
328,200 |
|
|
|
(230,972 |
) |
|
|
(322,361 |
) |
|
|
553,333 |
|
|
|
(110,704 |
) |
|
|
(158,036 |
) |
|
|
268,740 |
|
|
|
(896 |
) |
|
|
(2 |
) |
|
|
898 |
|
|
|
— |
|
| Net increase and decrease(*1) |
|
|
12,821,174 |
|
|
|
(255,318 |
) |
|
|
38,153 |
|
|
|
20,922,205 |
|
|
|
(222,364 |
) |
|
|
(146,801 |
) |
|
|
2,772,167 |
|
|
|
88,680 |
|
|
|
287,576 |
|
|
|
(1,810,906 |
) |
|
|
(47,466 |
) |
|
|
(108 |
) |
|
|
34,446,992 |
|
| Charge off(*2) |
|
|
— |
|
|
|
— |
|
|
|
(279,789 |
) |
|
|
— |
|
|
|
— |
|
|
|
(299,661 |
) |
|
|
— |
|
|
|
— |
|
|
|
(566,944 |
) |
|
|
— |
|
|
|
— |
|
|
|
(1,218 |
) |
|
|
(1,147,612 |
) |
| Disposal |
|
|
— |
|
|
|
(724 |
) |
|
|
(53,241 |
) |
|
|
(84,433 |
) |
|
|
(180 |
) |
|
|
(139,019 |
) |
|
|
— |
|
|
|
— |
|
|
|
— |
|
|
|
— |
|
|
|
— |
|
|
|
(44 |
) |
|
|
(277,641 |
) |
| |
|
|
|
|
|
|
|
|
|
|
|
|
|
|
|
|
|
|
|
|
|
|
|
|
|
|
|
|
|
|
|
|
|
|
|
|
|
|
|
|
|
|
|
|
|
|
|
|
|
|
|
|
| Ending balance |
|
W |
150,861,783 |
|
|
|
8,149,050 |
|
|
|
457,616 |
|
|
|
169,874,897 |
|
|
|
28,830,466 |
|
|
|
930,757 |
|
|
|
21,346,418 |
|
|
|
4,166,803 |
|
|
|
457,582 |
|
|
|
6,542,444 |
|
|
|
668,657 |
|
|
|
17,751 |
|
|
|
392,304,224 |
|
| |
|
|
|
|
|
|
|
|
|
|
|
|
|
|
|
|
|
|
|
|
|
|
|
|
|
|
|
|
|
|
|
|
|
|
|
|
|
|
|
|
|
|
|
|
|
|
|
|
|
|
|
|
| |
(*1) |
The amount is due to execution, collection, debt restructuring, investment conversion, exchange rate fluctuation, etc. |
| |
(*2) |
The amount of uncollected loans currently in recovery (principal and interest) is 10,613,730 million, which is written off as of December 31, 2021. |
SHINHAN FINANCIAL GROUP CO., LTD. AND SUBSIDIARIES
Notes to the Consolidated Financial Statements
(In millions of won)
|
Loans at amortized cost, etc. (continued) |
| |
|
Due from banks at amortized cost and other financial assets |
|
|
|
|
|
|
|
|
|
|
|
|
|
|
|
|
|
|
|
|
|
|
|
|
|
|
|
|
|
|
|
|
|
| Beginning balance |
|
W |
51,881,798 |
|
|
|
99,899 |
|
|
|
57,658 |
|
|
|
52,039,355 |
|
| Transfer (from) to 12 month expected credit losses |
|
|
13,111 |
|
|
|
(13,079 |
) |
|
|
(32 |
) |
|
|
— |
|
| Transfer (from) to lifetime expected credit losses |
|
|
(29,026 |
) |
|
|
29,048 |
|
|
|
(22 |
) |
|
|
— |
|
| Transfer (from) to credit- impaired financial assets |
|
|
(1,049 |
) |
|
|
(11,797 |
) |
|
|
12,846 |
|
|
|
— |
|
| Net increase and decrease(*) |
|
|
(4,315,675 |
) |
|
|
580 |
|
|
|
37,428 |
|
|
|
(4,277,667 |
) |
| Charge off |
|
|
— |
|
|
|
— |
|
|
|
(27,929 |
) |
|
|
(27,929 |
) |
| Disposal |
|
|
— |
|
|
|
(1 |
) |
|
|
(855 |
) |
|
|
(856 |
) |
| |
|
|
|
|
|
|
|
|
|
|
|
|
|
|
|
|
| Ending balance |
|
W |
47,549,159 |
|
|
|
104,650 |
|
|
|
79,094 |
|
|
|
47,732,903 |
|
| |
|
|
|
|
|
|
|
|
|
|
|
|
|
|
|
|
| |
(*) |
The amount is due to execution, collection, debt restructuring, investment conversion, exchange rate fluctuation, etc. |
SHINHAN FINANCIAL GROUP CO., LTD. AND SUBSIDIARIES
Notes to the Consolidated Financial Statements
(In millions of won)
|
Loans at amortized cost, etc. (continued) |
i) Loans at amortized cost
|
|
|
|
|
|
|
|
|
|
|
|
|
|
|
|
|
|
|
|
|
|
|
|
|
|
|
|
|
|
|
|
|
|
|
|
|
|
|
|
|
|
|
|
|
|
|
|
|
|
|
|
|
| |
|
|
|
| |
|
|
|
|
|
|
|
|
|
|
|
|
|
|
|
| |
12 months
expected credit
loss |
|
|
Life time
expected
credit loss |
|
|
|
|
|
12 months
expected
credit loss |
|
|
Life time
expected
credit loss |
|
|
|
|
|
12 months
expected
credit loss |
|
|
Life time
expected
credit loss |
|
|
|
|
|
12 months
expected
credit loss |
|
|
Life
time
expected
credit
loss |
|
|
|
|
|
|
|
| Beginning balance |
|
W |
150,861,783 |
|
|
|
8,149,050 |
|
|
|
457,616 |
|
|
|
169,874,897 |
|
|
|
28,830,466 |
|
|
|
930,757 |
|
|
|
21,346,418 |
|
|
|
4,166,803 |
|
|
|
457,582 |
|
|
|
6,542,444 |
|
|
|
668,657 |
|
|
|
17,751 |
|
|
|
392,304,224 |
|
| Transfer (from) to 12 months expected credit losses |
|
|
3,402,319 |
|
|
|
(3,390,943 |
) |
|
|
(11,376 |
) |
|
|
7,620,541 |
|
|
|
(7,612,945 |
) |
|
|
(7,596 |
) |
|
|
431,252 |
|
|
|
(430,915 |
) |
|
|
(337 |
) |
|
|
55,766 |
|
|
|
(55,766 |
) |
|
|
— |
|
|
|
— |
|
| Transfer (from) to lifetime expected credit losses |
|
|
(4,240,767 |
) |
|
|
4,275,492 |
|
|
|
(34,725 |
) |
|
|
(11,480,879 |
) |
|
|
11,491,902 |
|
|
|
(11,023 |
) |
|
|
(764,938 |
) |
|
|
765,279 |
|
|
|
(341 |
) |
|
|
(52,028 |
) |
|
|
52,030 |
|
|
|
(2 |
) |
|
|
— |
|
| Transfer (from) to credit- impaired financial assets |
|
|
(255,175 |
) |
|
|
(154,510 |
) |
|
|
409,685 |
|
|
|
(222,960 |
) |
|
|
(489,488 |
) |
|
|
712,448 |
|
|
|
(115,976 |
) |
|
|
(160,843 |
) |
|
|
276,819 |
|
|
|
(18 |
) |
|
|
(12 |
) |
|
|
30 |
|
|
|
— |
|
| Net increase and decrease(*1) |
|
|
2,019,166 |
|
|
|
(385,941 |
) |
|
|
127,162 |
|
|
|
16,796,397 |
|
|
|
(164,011 |
) |
|
|
(267,984 |
) |
|
|
2,689,877 |
|
|
|
(6,713 |
) |
|
|
352,143 |
|
|
|
3,821,009 |
|
|
|
767 |
|
|
|
181 |
|
|
|
24,982,053 |
|
| Charge off(*2) |
|
|
— |
|
|
|
— |
|
|
|
(263,962 |
) |
|
|
— |
|
|
|
— |
|
|
|
(249,453 |
) |
|
|
— |
|
|
|
— |
|
|
|
(592,386 |
) |
|
|
— |
|
|
|
— |
|
|
|
(1,121 |
) |
|
|
(1,106,922 |
) |
| Disposal |
|
|
— |
|
|
|
(1,151 |
) |
|
|
(78,428 |
) |
|
|
(17,000 |
) |
|
|
(1,333 |
) |
|
|
(136,419 |
) |
|
|
— |
|
|
|
— |
|
|
|
— |
|
|
|
— |
|
|
|
— |
|
|
|
(2,748 |
) |
|
|
(237,079 |
) |
| Business combination (Note 47) |
|
|
— |
|
|
|
— |
|
|
|
— |
|
|
|
— |
|
|
|
— |
|
|
|
— |
|
|
|
— |
|
|
|
— |
|
|
|
— |
|
|
|
98 |
|
|
|
— |
|
|
|
— |
|
|
|
98 |
|
| |
|
|
|
|
|
|
|
|
|
|
|
|
|
|
|
|
|
|
|
|
|
|
|
|
|
|
|
|
|
|
|
|
|
|
|
|
|
|
|
|
|
|
|
|
|
|
|
|
|
|
|
|
| Ending balance |
|
W |
151,787,326 |
|
|
|
8,491,997 |
|
|
|
605,972 |
|
|
|
182,570,996 |
|
|
|
32,054,591 |
|
|
|
970,730 |
|
|
|
23,586,633 |
|
|
|
4,333,611 |
|
|
|
493,480 |
|
|
|
10,367,271 |
|
|
|
665,676 |
|
|
|
14,091 |
|
|
|
415,942,374 |
|
| |
|
|
|
|
|
|
|
|
|
|
|
|
|
|
|
|
|
|
|
|
|
|
|
|
|
|
|
|
|
|
|
|
|
|
|
|
|
|
|
|
|
|
|
|
|
|
|
|
|
|
|
|
| |
(*1) |
The amount is due to execution, collection, debt restructuring, investment conversion, exchange rate fluctuation, etc. |
| |
(*2) |
The amount of uncollected loans currently in recovery (principal and interest) is 9,739,237 million, which is written off as of December 31, 2022. |
SHINHAN FINANCIAL GROUP CO., LTD. AND SUBSIDIARIES
Notes to the Consolidated Financial Statements
(In millions of won)
|
Loans at amortized cost, etc. (continued) |
ii) Due from banks at amortized cost and other financial assets
|
|
|
|
|
|
|
|
|
|
|
|
|
|
|
|
|
|
|
|
|
|
|
|
|
|
|
|
|
|
|
|
|
| Beginning balance |
|
W |
47,549,159 |
|
|
|
104,650 |
|
|
|
79,094 |
|
|
|
47,732,903 |
|
| Transfer (from) to 12 month expected credit losses |
|
|
16,401 |
|
|
|
(16,309 |
) |
|
|
(92 |
) |
|
|
— |
|
| Transfer (from) to lifetime expected credit losses |
|
|
(23,870 |
) |
|
|
23,985 |
|
|
|
(115 |
) |
|
|
— |
|
| Transfer (from) to credit- impaired financial assets |
|
|
(10,008 |
) |
|
|
(3,654 |
) |
|
|
13,662 |
|
|
|
— |
|
| Net increase and decrease(*) |
|
|
1,630,953 |
|
|
|
57,051 |
|
|
|
21,722 |
|
|
|
1,709,726 |
|
| Charge off |
|
|
— |
|
|
|
— |
|
|
|
(25,636 |
) |
|
|
(25,636 |
) |
| Disposal |
|
|
— |
|
|
|
— |
|
|
|
(1,123 |
) |
|
|
(1,123 |
) |
| Business combination (Note 47) |
|
|
89,648 |
|
|
|
— |
|
|
|
— |
|
|
|
89,648 |
|
| |
|
|
|
|
|
|
|
|
|
|
|
|
|
|
|
|
| Ending balance |
|
W |
49,252,283 |
|
|
|
165,723 |
|
|
|
87,512 |
|
|
|
49,505,518 |
|
| |
|
|
|
|
|
|
|
|
|
|
|
|
|
|
|
|
| |
(*) |
The amount is due to execution, collection, debt restructuring, investment conversion, exchange rate fluctuation, etc. |
SHINHAN FINANCIAL GROUP CO., LTD. AND SUBSIDIARIES
Notes to the Consolidated Financial Statements
(In millions of won)
|
Loans at amortized cost, etc. (continued) |
| |
(c) |
Changes in allowance for credit loss of loans at amortized cost and other financial assets as of December 31, 2021 and 2022 are as follows: |
|
|
|
|
|
|
|
|
|
|
|
|
|
|
|
|
|
|
|
|
|
|
|
|
|
|
|
|
|
|
|
|
|
|
|
|
|
|
|
|
|
|
|
|
|
|
|
|
|
|
|
|
|
| |
|
|
|
| |
|
|
|
|
|
|
|
|
|
|
|
|
|
|
|
| |
12 month
expected
credit loss |
|
|
Life time
expected
credit loss |
|
|
|
|
|
12 month
expected
credit loss |
|
|
Life time
expected
credit loss |
|
|
|
|
|
12 month
expected
credit loss |
|
|
Life time
expected
credit loss |
|
|
|
|
|
12 month
expected
credit loss |
|
|
Life time
expected
credit loss |
|
|
|
|
|
|
|
| Beginning balance |
|
W |
149,034 |
|
|
|
86,048 |
|
|
|
198,440 |
|
|
|
568,614 |
|
|
|
665,083 |
|
|
|
481,244 |
|
|
|
203,908 |
|
|
|
374,453 |
|
|
|
306,690 |
|
|
|
11,434 |
|
|
|
9,601 |
|
|
|
6,417 |
|
|
|
3,060,966 |
|
| Transfer (from) to 12 months expected credit losses |
|
|
20,528 |
|
|
|
(19,794 |
) |
|
|
(734 |
) |
|
|
85,187 |
|
|
|
(79,571 |
) |
|
|
(5,616 |
) |
|
|
26,178 |
|
|
|
(26,149 |
) |
|
|
(29 |
) |
|
|
200 |
|
|
|
(200 |
) |
|
|
— |
|
|
|
— |
|
| Transfer (from) to lifetime expected credit losses |
|
|
(9,078 |
) |
|
|
21,383 |
|
|
|
(12,305 |
) |
|
|
(55,055 |
) |
|
|
63,834 |
|
|
|
(8,779 |
) |
|
|
(14,471 |
) |
|
|
14,548 |
|
|
|
(77 |
) |
|
|
(359 |
) |
|
|
359 |
|
|
|
— |
|
|
|
— |
|
| Transfer (from) to credit- impaired financial assets |
|
|
(3,203 |
) |
|
|
(7,112 |
) |
|
|
10,315 |
|
|
|
(1,830 |
) |
|
|
(48,468 |
) |
|
|
50,298 |
|
|
|
(1,003 |
) |
|
|
(1,503 |
) |
|
|
2,506 |
|
|
|
(7 |
) |
|
|
— |
|
|
|
7 |
|
|
|
— |
|
| Provision (reversal) |
|
|
10,812 |
|
|
|
(1,321 |
) |
|
|
154,260 |
|
|
|
(68,403 |
) |
|
|
135,401 |
|
|
|
263,327 |
|
|
|
75,981 |
|
|
|
202,000 |
|
|
|
137,456 |
|
|
|
(1,342 |
) |
|
|
(503 |
) |
|
|
(598 |
) |
|
|
907,070 |
|
| Charge off |
|
|
— |
|
|
|
— |
|
|
|
(279,789 |
) |
|
|
— |
|
|
|
— |
|
|
|
(299,661 |
) |
|
|
— |
|
|
|
— |
|
|
|
(566,944 |
) |
|
|
— |
|
|
|
— |
|
|
|
(1,218 |
) |
|
|
(1,147,612 |
) |
| Amortization of discount |
|
|
— |
|
|
|
— |
|
|
|
(4,651 |
) |
|
|
— |
|
|
|
— |
|
|
|
(12,894 |
) |
|
|
— |
|
|
|
— |
|
|
|
7,973 |
|
|
|
— |
|
|
|
— |
|
|
|
— |
|
|
|
(9,572 |
) |
| Disposal |
|
|
— |
|
|
|
(1 |
) |
|
|
(13,617 |
) |
|
|
(6 |
) |
|
|
— |
|
|
|
(14,528 |
) |
|
|
— |
|
|
|
— |
|
|
|
— |
|
|
|
— |
|
|
|
— |
|
|
|
(1 |
) |
|
|
(28,153 |
) |
| Collection |
|
|
— |
|
|
|
— |
|
|
|
103,316 |
|
|
|
— |
|
|
|
— |
|
|
|
76,245 |
|
|
|
— |
|
|
|
— |
|
|
|
207,631 |
|
|
|
— |
|
|
|
— |
|
|
|
887 |
|
|
|
388,079 |
|
| Others(*) |
|
|
5,912 |
|
|
|
11,209 |
|
|
|
34,571 |
|
|
|
1,793 |
|
|
|
5,973 |
|
|
|
(9,310 |
) |
|
|
(85,882 |
) |
|
|
(162,272 |
) |
|
|
194,026 |
|
|
|
269 |
|
|
|
1 |
|
|
|
— |
|
|
|
(3,710 |
) |
| |
|
|
|
|
|
|
|
|
|
|
|
|
|
|
|
|
|
|
|
|
|
|
|
|
|
|
|
|
|
|
|
|
|
|
|
|
|
|
|
|
|
|
|
|
|
|
|
|
|
|
|
|
| Ending balance |
|
W |
174,005 |
|
|
|
90,412 |
|
|
|
189,806 |
|
|
|
530,300 |
|
|
|
742,252 |
|
|
|
520,326 |
|
|
|
204,711 |
|
|
|
401,077 |
|
|
|
289,232 |
|
|
|
10,195 |
|
|
|
9,258 |
|
|
|
5,494 |
|
|
|
3,167,068 |
|
| |
|
|
|
|
|
|
|
|
|
|
|
|
|
|
|
|
|
|
|
|
|
|
|
|
|
|
|
|
|
|
|
|
|
|
|
|
|
|
|
|
|
|
|
|
|
|
|
|
|
|
|
|
| |
(*) |
Other changes are due to debt restructuring, investment conversion and changes in foreign exchange rate. |
SHINHAN FINANCIAL GROUP CO., LTD. AND SUBSIDIARIES
Notes to the Consolidated Financial Statements
(In millions of won)
|
Loans at amortized cost, etc. (continued) |
| |
|
Due from banks at amortized cost and other financial assets |
|
|
|
|
|
|
|
|
|
|
|
|
|
|
|
|
|
|
|
|
|
|
|
|
|
|
|
|
|
|
|
|
|
| Beginning balance |
|
W |
35,691 |
|
|
|
8,281 |
|
|
|
48,930 |
|
|
|
92,902 |
|
| Transfer (from) to 12 months expected credit losses |
|
|
241 |
|
|
|
(230 |
) |
|
|
(11 |
) |
|
|
— |
|
| Transfer (from) to lifetime expected credit losses |
|
|
(284 |
) |
|
|
288 |
|
|
|
(4 |
) |
|
|
— |
|
| Transfer (from) to credit- impaired financial assets |
|
|
(290 |
) |
|
|
(2,012 |
) |
|
|
2,302 |
|
|
|
— |
|
| Provision |
|
|
8,555 |
|
|
|
1,426 |
|
|
|
42,181 |
|
|
|
52,162 |
|
| Charge off |
|
|
— |
|
|
|
— |
|
|
|
(27,929 |
) |
|
|
(27,929 |
) |
| Disposal |
|
|
— |
|
|
|
— |
|
|
|
(40 |
) |
|
|
(40 |
) |
| Collection |
|
|
— |
|
|
|
— |
|
|
|
2,357 |
|
|
|
2,357 |
|
| Others (*) |
|
|
139,995 |
|
|
|
255 |
|
|
|
2,257 |
|
|
|
142,507 |
|
| |
|
|
|
|
|
|
|
|
|
|
|
|
|
|
|
|
| Ending balance |
|
W |
183,908 |
|
|
|
8,008 |
|
|
|
70,043 |
|
|
|
261,959 |
|
| |
|
|
|
|
|
|
|
|
|
|
|
|
|
|
|
|
| |
(*) |
Other changes are due to debt restructuring, investment conversion and changes in foreign exchange rate, etc. |
SHINHAN FINANCIAL GROUP CO., LTD. AND SUBSIDIARIES
Notes to the Consolidated Financial Statements
(In millions of won)
|
Loans at amortized cost, etc. (continued) |
|
|
|
|
|
|
|
|
|
|
|
|
|
|
|
|
|
|
|
|
|
|
|
|
|
|
|
|
|
|
|
|
|
|
|
|
|
|
|
|
|
|
|
|
|
|
|
|
|
|
|
|
|
| |
|
|
|
| |
|
|
|
|
|
|
|
|
|
|
|
|
|
|
|
| |
12 month
expected
credit loss |
|
|
Life
time
expected
credit
loss |
|
|
|
|
|
12
month
expected
credit
loss |
|
|
Life
time
expected
credit
loss |
|
|
|
|
|
12 month
expected
credit
loss |
|
|
Life time
expected
credit
loss |
|
|
|
|
|
12
month
expected
credit
loss |
|
|
Life
time
expected
credit
loss |
|
|
|
|
|
|
|
| Beginning balance |
|
W |
174,005 |
|
|
|
90,412 |
|
|
|
189,806 |
|
|
|
530,300 |
|
|
|
742,252 |
|
|
|
520,326 |
|
|
|
204,711 |
|
|
|
401,077 |
|
|
|
289,232 |
|
|
|
10,195 |
|
|
|
9,258 |
|
|
|
5,494 |
|
|
|
3,167,068 |
|
| Transfer (from) to 12 months expected credit losses |
|
|
17,317 |
|
|
|
(16,023 |
) |
|
|
(1,294 |
) |
|
|
92,620 |
|
|
|
(90,661 |
) |
|
|
(1,959 |
) |
|
|
24,579 |
|
|
|
(24,471 |
) |
|
|
(108 |
) |
|
|
403 |
|
|
|
(403 |
) |
|
|
— |
|
|
|
— |
|
| Transfer (from) to lifetime expected credit losses |
|
|
(9,449 |
) |
|
|
26,014 |
|
|
|
(16,565 |
) |
|
|
(62,583 |
) |
|
|
64,821 |
|
|
|
(2,238 |
) |
|
|
(14,752 |
) |
|
|
14,892 |
|
|
|
(140 |
) |
|
|
(122 |
) |
|
|
122 |
|
|
|
— |
|
|
|
— |
|
| Transfer (from) to credit- impaired financial assets |
|
|
(4,702 |
) |
|
|
(9,103 |
) |
|
|
13,805 |
|
|
|
(1,461 |
) |
|
|
(66,033 |
) |
|
|
67,494 |
|
|
|
(1,094 |
) |
|
|
(2,041 |
) |
|
|
3,135 |
|
|
|
(1 |
) |
|
|
(5 |
) |
|
|
6 |
|
|
|
— |
|
| Provision (reversal) |
|
|
95,929 |
|
|
|
84,402 |
|
|
|
244,633 |
|
|
|
(14,887 |
) |
|
|
159,287 |
|
|
|
103,935 |
|
|
|
101,644 |
|
|
|
254,090 |
|
|
|
209,353 |
|
|
|
3,405 |
|
|
|
246 |
|
|
|
2,387 |
|
|
|
1,244,424 |
|
| Charge off |
|
|
— |
|
|
|
— |
|
|
|
(263,962 |
) |
|
|
— |
|
|
|
— |
|
|
|
(249,453 |
) |
|
|
— |
|
|
|
— |
|
|
|
(592,386 |
) |
|
|
— |
|
|
|
— |
|
|
|
(1,121 |
) |
|
|
(1,106,922 |
) |
| Amortization of discount |
|
|
— |
|
|
|
— |
|
|
|
(5,923 |
) |
|
|
— |
|
|
|
— |
|
|
|
(13,189 |
) |
|
|
— |
|
|
|
— |
|
|
|
7,307 |
|
|
|
— |
|
|
|
— |
|
|
|
— |
|
|
|
(11,805 |
) |
| Disposal |
|
|
— |
|
|
|
(28 |
) |
|
|
(22,676 |
) |
|
|
— |
|
|
|
(5 |
) |
|
|
(10,723 |
) |
|
|
— |
|
|
|
— |
|
|
|
— |
|
|
|
— |
|
|
|
— |
|
|
|
(217 |
) |
|
|
(33,649 |
) |
| Collection |
|
|
— |
|
|
|
— |
|
|
|
108,666 |
|
|
|
— |
|
|
|
— |
|
|
|
55,441 |
|
|
|
— |
|
|
|
— |
|
|
|
217,407 |
|
|
|
— |
|
|
|
— |
|
|
|
145 |
|
|
|
381,659 |
|
| Others(*) |
|
|
(8,264 |
) |
|
|
(10,584 |
) |
|
|
19,121 |
|
|
|
15,187 |
|
|
|
30,896 |
|
|
|
17,605 |
|
|
|
(103,976 |
) |
|
|
(172,074 |
) |
|
|
222,175 |
|
|
|
2 |
|
|
|
— |
|
|
|
— |
|
|
|
10,088 |
|
| |
|
|
|
|
|
|
|
|
|
|
|
|
|
|
|
|
|
|
|
|
|
|
|
|
|
|
|
|
|
|
|
|
|
|
|
|
|
|
|
|
|
|
|
|
|
|
|
|
|
|
|
|
| Ending balance |
|
W |
264,836 |
|
|
|
165,090 |
|
|
|
265,611 |
|
|
|
559,176 |
|
|
|
840,557 |
|
|
|
487,239 |
|
|
|
211,112 |
|
|
|
471,473 |
|
|
|
355,975 |
|
|
|
13,882 |
|
|
|
9,218 |
|
|
|
6,694 |
|
|
|
3,650,863 |
|
| |
|
|
|
|
|
|
|
|
|
|
|
|
|
|
|
|
|
|
|
|
|
|
|
|
|
|
|
|
|
|
|
|
|
|
|
|
|
|
|
|
|
|
|
|
|
|
|
|
|
|
|
|
| (*) |
Other changes are due to debt restructuring, investment conversion and changes in foreign exchange rate, etc. |
SHINHAN FINANCIAL GROUP CO., LTD. AND SUBSIDIARIES
Notes to the Consolidated Financial Statements
(In millions of won)
|
Loans at amortized cost, etc. (continued) |
| |
|
Due from banks at amortized cost and other financial assets |
|
|
|
|
|
|
|
|
|
|
|
|
|
|
|
|
|
| |
|
|
|
| |
|
|
|
|
|
|
|
|
|
|
|
| Beginning balance |
|
W |
183,908 |
|
|
|
8,008 |
|
|
|
70,043 |
|
|
|
261,959 |
|
| Transfer (from) to 12 months expected credit losses |
|
|
315 |
|
|
|
(274 |
) |
|
|
(41 |
) |
|
|
— |
|
| Transfer (from) to lifetime expected credit losses |
|
|
(740 |
) |
|
|
765 |
|
|
|
(25 |
) |
|
|
— |
|
| Transfer (from) to credit- impaired financial assets |
|
|
(75 |
) |
|
|
(1,267 |
) |
|
|
1,342 |
|
|
|
— |
|
| Provision |
|
|
2,275 |
|
|
|
3,278 |
|
|
|
27,226 |
|
|
|
32,779 |
|
| Charge off |
|
|
— |
|
|
|
— |
|
|
|
(25,636 |
) |
|
|
(25,636 |
) |
| Disposal |
|
|
— |
|
|
|
— |
|
|
|
(61 |
) |
|
|
(61 |
) |
| Collection |
|
|
— |
|
|
|
— |
|
|
|
2,502 |
|
|
|
2,502 |
|
| Others (*) |
|
|
110,514 |
|
|
|
(70 |
) |
|
|
(729 |
) |
|
|
109,715 |
|
| Business combination (Note 47) |
|
|
16 |
|
|
|
— |
|
|
|
— |
|
|
|
16 |
|
| |
|
|
|
|
|
|
|
|
|
|
|
|
|
|
|
|
| Ending balance |
|
W |
296,213 |
|
|
|
10,440 |
|
|
|
74,621 |
|
|
|
381,274 |
|
| |
|
|
|
|
|
|
|
|
|
|
|
|
|
|
|
|
| |
(*) |
Other changes are due to debt restructuring, investment conversion and changes in foreign exchange rate, etc. |
| |
(d) |
Changes in deferred loan origination costs for the years ended December 31, 202 1 and 20 are as follows: |
|
|
|
|
|
|
|
|
|
| |
|
|
|
|
|
|
| Beginning balance |
|
W |
516,815 |
|
|
|
543,361 |
|
| Loan origination |
|
|
255,482 |
|
|
|
209,347 |
|
| Amortization, etc. |
|
|
(228,936 |
) |
|
|
(225,802 |
) |
| |
|
|
|
|
|
|
|
|
| Ending balance |
|
W |
543,361 |
|
|
|
526,906 |
|
| |
|
|
|
|
|
|
|
|
| |
(a) |
Details of property and equipment as of December 31, 2021 and 2022 are as follows: |
|
|
|
|
|
|
|
|
|
|
|
|
|
|
|
|
|
|
|
|
|
|
|
Acquisition
cost |
|
|
Accumulated
depreciation |
|
|
Accumulated
Impairment |
|
|
Carrying
value |
|
| Land |
|
W |
2,173,134 |
|
|
|
— |
|
|
|
— |
|
|
|
2,173,134 |
|
| Buildings |
|
|
1,210,401 |
|
|
|
(446,321 |
) |
|
|
(7,594 |
) |
|
|
756,486 |
|
| |
|
|
1,229,169 |
|
|
|
(621,042 |
) |
|
|
— |
|
|
|
608,127 |
|
| Other assets |
|
|
2,294,740 |
|
|
|
(1,786,323 |
) |
|
|
— |
|
|
|
508,417 |
|
| |
|
|
|
|
|
|
|
|
|
|
|
|
|
|
|
|
| |
|
6,907,444 |
|
|
(2,853,686 |
) |
|
(7,594 |
) |
|
4,046,164 |
|
| |
|
|
|
|
|
|
|
|
|
|
|
|
|
|
|
|
SHINHAN FINANCIAL GROUP CO., LTD. AND SUBSIDIARIES
Notes to the Consolidated Financial Statements
(In millions of won)
|
Property and equipment (continued) |
|
|
|
|
|
|
|
|
|
|
|
|
|
|
|
|
|
|
|
|
|
|
|
Acquisition
cost |
|
|
Accumulated
depreciation |
|
|
Accumulated
Impairment |
|
|
Carrying
value |
|
| Land |
|
W |
2,101,176 |
|
|
|
— |
|
|
|
— |
|
|
|
2,101,176 |
|
| Buildings |
|
|
1,165,468 |
|
|
|
(455,617 |
) |
|
|
(7,594 |
) |
|
|
702,257 |
|
| Other assets |
|
|
2,424,987 |
|
|
|
(1,836,533 |
) |
|
|
— |
|
|
|
588,454 |
|
| |
|
|
1,208,728 |
|
|
|
(589,518 |
) |
|
|
— |
|
|
|
619,210 |
|
| |
|
|
|
|
|
|
|
|
|
|
|
|
|
|
|
|
|
|
|
6,900,359 |
|
|
|
(2,881,668 |
) |
|
|
(7,594 |
) |
|
|
4,011,097 |
|
| |
|
|
|
|
|
|
|
|
|
|
|
|
|
|
|
|
| |
(b) |
Changes in property and equipment for the years ended December 31, 2021 and 2022 are as follows: |
|
|
|
|
|
|
|
|
|
|
|
|
|
|
|
|
|
|
|
|
|
|
|
|
|
|
|
Land |
|
|
Buildings |
|
|
|
|
|
Others |
|
|
Total |
|
| Beginning balance |
|
W |
2,219,227 |
|
|
|
810,761 |
|
|
|
590,417 |
|
|
|
369,292 |
|
|
|
3,989,697 |
|
| Acquisition(*1) |
|
|
513 |
|
|
|
32,777 |
|
|
|
316,925 |
|
|
|
289,614 |
|
|
|
639,829 |
|
| Disposal |
|
|
(709 |
) |
|
|
(1,378 |
) |
|
|
(26,930 |
) |
|
|
(5,086 |
) |
|
|
(34,103 |
) |
| Depreciation(*2) |
|
|
— |
|
|
|
(49,646 |
) |
|
|
(289,585 |
) |
|
|
(154,104 |
) |
|
|
(493,335 |
) |
| Impairment |
|
|
— |
|
|
|
(7,594 |
) |
|
|
— |
|
|
|
— |
|
|
|
(7,594 |
) |
| Amounts transferred from(to) investment property |
|
|
(46,046 |
) |
|
|
(27,727 |
) |
|
|
— |
|
|
|
— |
|
|
|
(73,773 |
) |
| Amounts transferred from(to) intangible assets |
|
|
— |
|
|
|
— |
|
|
|
— |
|
|
|
3,676 |
|
|
|
3,676 |
|
Amounts transferred from(to) non-current assets held for sale(*3) |
|
|
(169 |
) |
|
|
(853 |
) |
|
|
— |
|
|
|
— |
|
|
|
(1,022 |
) |
| Effects of foreign currency adjustments |
|
|
318 |
|
|
|
146 |
|
|
|
17,300 |
|
|
|
5,025 |
|
|
|
22,789 |
|
| |
|
|
|
|
|
|
|
|
|
|
|
|
|
|
|
|
|
|
|
|
| Ending balance |
|
W |
2,173,134 |
|
|
|
756,486 |
|
|
|
608,127 |
|
|
|
508,417 |
|
|
|
4,046,164 |
|
| |
|
|
|
|
|
|
|
|
|
|
|
|
|
|
|
|
|
|
|
|
| |
(*1) |
W 18,748 million transferred from assets-under-construction is included. |
| |
(*2) |
Included in general administrative expense and other operating income(loss) of the consolidated statements of comprehensive income. |
| |
(*3) |
Includes buildings, land, etc. |
SHINHAN FINANCIAL GROUP CO., LTD. AND SUBSIDIARIES
Notes to the Consolidated Financial Statements
(In millions of won)
|
Property and equipment (continued) |
|
|
|
|
|
|
|
|
|
|
|
|
|
|
|
|
|
|
|
|
|
| |
|
|
|
| |
|
Land |
|
|
Buildings |
|
|
Others |
|
|
assets |
|
|
Total |
|
| Beginning balance |
|
W |
2,173,134 |
|
|
|
756,486 |
|
|
|
508,417 |
|
|
|
608,127 |
|
|
|
4,046,164 |
|
| Acquisition(*1) |
|
|
631 |
|
|
|
49,220 |
|
|
|
257,662 |
|
|
|
369,153 |
|
|
|
676,666 |
|
| Disposal |
|
|
(13,173 |
) |
|
|
(1,124 |
) |
|
|
(4,212 |
) |
|
|
(75,563 |
) |
|
|
(94,072 |
) |
| Depreciation(*2) |
|
|
— |
|
|
|
(49,935 |
) |
|
|
(186,307 |
) |
|
|
(287,886 |
) |
|
|
(524,128 |
) |
| Amounts transferred from(to) investment property |
|
|
2,892 |
|
|
|
(12,446 |
) |
|
|
— |
|
|
|
— |
|
|
|
(9,554 |
) |
| Amounts transferred from(to) intangible assets |
|
|
— |
|
|
|
— |
|
|
|
6,916 |
|
|
|
— |
|
|
|
6,916 |
|
Amounts transferred from(to) non-current assets held for sale(*3) |
|
|
(62,288 |
) |
|
|
(39,469 |
) |
|
|
— |
|
|
|
— |
|
|
|
(101,757 |
) |
| Amounts transferred from(to) operating lease assets |
|
|
— |
|
|
|
— |
|
|
|
214 |
|
|
|
— |
|
|
|
214 |
|
| Effects of foreign currency adjustments |
|
|
(20 |
) |
|
|
(475 |
) |
|
|
4,877 |
|
|
|
4,328 |
|
|
|
8,710 |
|
| Business combination (Note 47) |
|
|
— |
|
|
|
— |
|
|
|
887 |
|
|
|
1,051 |
|
|
|
1,938 |
|
| |
|
|
|
|
|
|
|
|
|
|
|
|
|
|
|
|
|
|
|
|
| Ending balance |
|
W |
2,101,176 |
|
|
|
702,257 |
|
|
|
588,454 |
|
|
|
619,210 |
|
|
|
4,011,097 |
|
| |
|
|
|
|
|
|
|
|
|
|
|
|
|
|
|
|
|
|
|
|
| |
(*1) |
33,983 million transferred from assets-under-construction is included. |
| |
(*2) |
Included in general administrative expense and other operating income(loss) of the consolidated statements of comprehensive income. |
| |
(*3) |
Includes buildings, land, etc. |
| |
(c) |
Insured assets and liability insurance as of December 31, 2022 are as follows: |
|
|
|
|
|
|
|
|
|
|
|
|
| |
|
Insured assets and objects |
|
Amount
covered |
|
|
Insurance company |
|
|
|
|
|
|
|
|
|
| Comprehensive insurance for financial institutions |
|
Cash(including
ATM) |
|
|
25,500 |
|
|
Samsung Fire & Marine Insurance Co., Ltd., etc. |
| Comprehensive Property insurance |
|
Property Total Risk,
Machine Risk,
General Liability
Collateral |
|
|
1,667,825 |
|
|
Samsung Fire & Marine Insurance Co., Ltd., etc. |
| Fire insurance |
|
Business property
and real estate |
|
|
35,062 |
|
|
Meritz Fire & Marine
Insurance Co., Ltd., etc. |
| Compensation liability insurance for officers |
|
Officer liability of executives |
|
|
50,000 |
|
|
Meritz Fire & Marine
Insurance Co., Ltd., etc. |
| Compensation liability insurance for employee accident |
|
Employee |
|
|
82,029 |
|
|
Meritz Fire & Marine
Insurance Co., Ltd., etc. |
| Burglary insurance |
|
Cash and securities |
|
|
60,480 |
|
|
Samsung Fire & Marine Insurance Co., Ltd., etc. |
| Others |
|
Personal
information liability
insurance, etc. |
|
|
56,862 |
|
|
Samsung Fire & Marine Insurance Co., Ltd., etc. |
| |
(*) |
Aside from the insurance mentioned above, the Group has entered into car insurance , medical insurance, property insurance, and employee accident insurance. |
SHINHAN FINANCIAL GROUP CO., LTD. AND SUBSIDIARIES
Notes to the Consolidated Financial Statements
(In millions of won)
| |
(a) |
Details of intangible assets as of December 31, 2021 and 2022 are as follows: |
|
|
|
|
|
|
|
|
|
| |
|
|
|
|
|
|
| Goodwill |
|
W |
4,670,134 |
|
|
|
4,683,902 |
|
| Software |
|
|
192,582 |
|
|
|
263,341 |
|
| Development cost |
|
|
229,148 |
|
|
|
454,284 |
|
| Others |
|
|
552,918 |
|
|
|
406,309 |
|
| |
|
|
|
|
|
|
|
|
| |
|
W 5,644,782 |
|
|
5,807,836 |
|
| |
|
|
|
|
|
|
|
|
| |
(b) |
Changes in intangible assets for the years ended December 31, 2021 and 2022 are as follows: |
|
|
|
|
|
|
|
|
|
|
|
|
|
|
|
|
|
|
|
|
|
|
|
|
|
|
|
Goodwill |
|
|
Software |
|
|
Development
cost |
|
|
Others |
|
|
Total |
|
| Beginning balance |
|
W |
4,689,792 |
|
|
|
144,535 |
|
|
|
183,592 |
|
|
|
462,700 |
|
|
|
5,480,619 |
|
| Acquisition |
|
|
— |
|
|
|
103,929 |
|
|
|
127,993 |
|
|
|
225,228 |
|
|
|
457,150 |
|
| Business combination |
|
|
13,851 |
|
|
|
— |
|
|
|
— |
|
|
|
— |
|
|
|
13,851 |
|
| |
|
|
— |
|
|
|
(2,341 |
) |
|
|
(719 |
) |
|
|
(5,349 |
) |
|
|
(8,409 |
) |
| Amounts transferred from(to) property and equipment |
|
|
— |
|
|
|
— |
|
|
|
(3,676 |
) |
|
|
— |
|
|
|
(3,676 |
) |
| Impairment(*1) |
|
|
(33,509 |
) |
|
|
— |
|
|
|
(270 |
) |
|
|
(765 |
) |
|
|
(34,544 |
) |
| Amortization(*2) |
|
|
— |
|
|
|
(55,531 |
) |
|
|
(77,734 |
) |
|
|
(129,615 |
) |
|
|
(262,880 |
) |
| Effects of changes in foreign exchange rate |
|
|
— |
|
|
|
1,990 |
|
|
|
(38 |
) |
|
|
719 |
|
|
|
2,671 |
|
| |
|
|
|
|
|
|
|
|
|
|
|
|
|
|
|
|
|
|
|
|
| Ending balance |
|
W |
4,670,134 |
|
|
|
192,582 |
|
|
|
229,148 |
|
|
|
552,918 |
|
|
|
5,644,782 |
|
| |
|
|
|
|
|
|
|
|
|
|
|
|
|
|
|
|
|
|
|
|
| |
(*1) |
Goodwill impairment has occurred at Shinhan Bank Indonesia within the banking sector and PT Shinhan Sekuritas Indonesia within the securities sector among the cash-generating units. After the impairment test for goodwill of Shinhan Bank Indonesia, among the carrying value exceeding recoverable amount of cash-generating unit, which is 32,396 million, the Group has recognized 32,072 million as an impairment of goodwill which is 99 % of the Group’s total stake. After the impairment test for goodwill of PT Shinhan Sekuritas Indonesia, among the carrying value exceeding recoverable amount of cash-generating unit, which is 2,595 million, the Group has recognized 2,569 million as an impairment of goodwill which is 99 % of the Group’s total stake. This has occurred as a result of the persistent low-interest rate in Indonesia, the impact of COVID-19, and the decrease in the recoverable amount due to increased provisions of corporate borrowers. For the year ended December 31, 2021, the decrease in the asset’s recoverable amount in comparison to the previous year is 56,587 million and 8,715 million, respectively. The amount of goodwill impairment recognized is included in the non-operating expenses of the consolidated statement of comprehensive income. |
| |
(*2) |
Included in general administrative expense and other operating income(expense) of the consolidated statements of comprehensive income. |
SHINHAN FINANCIAL GROUP CO., LTD. AND SUBSIDIARIES
Notes to the Consolidated Financial Statements
(In millions of won)
|
Intangible assets (continued) |
|
|
|
|
|
|
|
|
|
|
|
|
|
|
|
|
|
|
|
|
|
|
|
|
|
|
|
Goodwill |
|
|
Software |
|
|
Development
cost |
|
|
Others |
|
|
Total |
|
| Beginning balance |
|
W |
4,670,134 |
|
|
|
192,582 |
|
|
|
229,148 |
|
|
|
552,918 |
|
|
|
5,644,782 |
|
| Acquisition |
|
|
— |
|
|
|
143,766 |
|
|
|
332,826 |
|
|
|
211,511 |
|
|
|
688,103 |
|
| Business combination (Note 47) |
|
|
— |
|
|
|
1,472 |
|
|
|
2,638 |
|
|
|
315 |
|
|
|
4,425 |
|
| |
|
|
— |
|
|
|
(253 |
) |
|
|
(434 |
) |
|
|
(236,881 |
) |
|
|
(237,568 |
) |
| Amounts transferred from(to) property and equipment |
|
|
— |
|
|
|
— |
|
|
|
(6,337 |
) |
|
|
(579 |
) |
|
|
(6,916 |
) |
| Impairment(*1) |
|
|
(2,258 |
) |
|
|
— |
|
|
|
(702 |
) |
|
|
198 |
|
|
|
(2,762 |
) |
| Amortization(*2) |
|
|
— |
|
|
|
(74,916 |
) |
|
|
(102,849 |
) |
|
|
(120,844 |
) |
|
|
(298,609 |
) |
| Effects of changes in foreign exchange rate |
|
|
16,026 |
|
|
|
690 |
|
|
|
(6 |
) |
|
|
(329 |
) |
|
|
16,381 |
|
| |
|
|
|
|
|
|
|
|
|
|
|
|
|
|
|
|
|
|
|
|
| Ending balance |
|
W |
4,683,902 |
|
|
|
263,341 |
|
|
|
454,284 |
|
|
|
406,309 |
|
|
|
5,807,836 |
|
| |
|
|
|
|
|
|
|
|
|
|
|
|
|
|
|
|
|
|
|
|
| |
(*1) |
Goodwill impairment incurred from the cash-generating unit of security sector at PT Shinhan Sekuritas Indonesia. As a result of the impairment test for goodwill of PT Shinhan Sekuritas Indonesia’s cash-generating unit, the Group’s interests of the carrying amount exceeding the recoverable amount of the cash-generating unit was recognized as an impairment loss for 2,258 million. This is attributable to the continued high prices caused by the prolonged crisis in Ukraine in 2022, the local and global economic downturn, and the increase in the discount rate due to the global high interest rate economic phenomenon, and recoverable amount decreased by 1,569 million compared to the previous year. The amount of impairment loss recognized is included in the non-operating expenses, the line item of the consolidated statement of comprehensive income. |
| |
(*2) |
Included in general administrative expense and other operating income(expense) of the consolidated statements of comprehensive income. |
| |
|
Goodwill allocated in the Group’s CGUs as of December 31, 2021 and 2022 is as follows: |
|
|
|
|
|
|
|
|
|
| |
|
|
|
|
|
|
| Banking |
|
W |
764,883 |
|
|
|
768,766 |
|
| Credit card |
|
|
2,880,383 |
|
|
|
2,892,610 |
|
| Securities |
|
|
5,335 |
|
|
|
2,993 |
|
| Life insurance |
|
|
853,798 |
|
|
|
853,798 |
|
| Others |
|
|
165,735 |
|
|
|
165,735 |
|
| |
|
|
|
|
|
|
|
|
| |
|
W |
4,670,134 |
|
|
|
4,683,902 |
|
| |
|
|
|
|
|
|
|
|
SHINHAN FINANCIAL GROUP CO., LTD. AND SUBSIDIARIES
Notes to the Consolidated Financial Statements
(In millions of won)
|
Intangible assets (continued) |
| |
|
Changes in goodwill for the years ended December 31, 2021 and 2022 are as follows: |
|
|
|
|
|
|
|
|
|
| |
|
|
|
|
|
|
| Beginning balance |
|
W |
4,689,792 |
|
|
|
4,670,134 |
|
| Additional recognition(*1) |
|
|
13,851 |
|
|
|
— |
|
| Impairment losses |
|
|
(33,509 |
) |
|
|
(2,258 |
) |
| Others (*2) |
|
|
— |
|
|
|
16,026 |
|
| |
|
|
|
|
|
|
|
|
| Ending balance |
|
W |
4,670,134 |
|
|
|
4,683,902 |
|
| |
|
|
|
|
|
|
|
|
| |
(*1) |
It is the goodwill recognized by Shinhan Financial Plus, a subsidiary acquired in the previous year, from a business transfer for the GF division and IMGA division of Leaders Financial Marketing. |
| |
(*2) |
Other changes are due to effects of changes in foreign exchange rate. |
| |
The |
recoverable amounts of each CGU are evaluated based on their respective value in use. |
| |
• |
|
Explanation on evaluation method |
The discounted cash flow method (DCF) is applied when evaluating the recoverable amounts based on value in use, considering the characteristics of each unit or group of CGU. However, the CGU of life insurance applied an actuarial enterprise valuation methodology based on probabilistically expected cash flows in consideration of the characteristics of the insurance business.
When evaluating the value in use, 5.5 years of cash flow estimates are used in projection and the value thereafter is reflected as terminal value. However, 99 years of cash flow estimates for Shinhan Life Insurance Co., Ltd. is applied and the present value of the future cash flows thereafter is not applied as it is not significant.
| |
• |
|
Discount rates and terminal growth rates |
The required rates of return expected by shareholders are applied to the discount rates. It is calculated in consideration of which comprises a risk-free interest rate, a market risk premium and systemic risk (beta factor). In addition, terminal growth rate is estimated based on inflation rate. However, since the life insurance cash-generating unit reflects the cost of risk in future cash flows, the discount rate based on the risk-free government bond interest rate term structure reflecting only the time value of money was applied.
Discount rates and terminal growth rates applied to each CGU are as follows:
|
|
|
|
|
| |
|
|
|
|
| Banking |
|
7.1 ~ 14.2 |
|
0.0 ~ 2.0 |
| Credit card |
|
8.7 ~ 13.9 |
|
1.0 ~ 2.0 |
| Securities |
|
13.6 ~ 13.9 |
|
2.0 |
| Others |
|
8.9 ~ 10.9 |
|
1.0 |
In case of the life insurance CGU, a term structure discount rate of 2.37% to 4.95% was applied for each future period corresponding to future cash flows for 99 years.
SHINHAN FINANCIAL GROUP CO., LTD. AND SUBSIDIARIES
Notes to the Consolidated Financial Statements
(In millions of won)
|
Intangible assets (continued) |
Key assumptions used in the discounted cash flow calculations of CGUs (other than life insurance components) are as follows:
|
|
|
|
|
|
|
|
|
|
|
|
|
|
|
|
|
|
|
|
|
|
|
|
|
| |
|
|
|
|
|
|
|
|
|
|
|
|
|
|
|
|
|
|
| CPI growth(%) |
|
|
5.50 |
|
|
|
2.80 |
|
|
|
0.80 |
|
|
|
1.00 |
|
|
|
1.20 |
|
|
|
1.20 |
|
| Private consumption growth(%) |
|
|
3.40 |
|
|
|
2.20 |
|
|
|
2.30 |
|
|
|
2.60 |
|
|
|
2.80 |
|
|
|
2.80 |
|
| Real GDP growth(%) |
|
|
2.70 |
|
|
|
2.30 |
|
|
|
2.60 |
|
|
|
2.80 |
|
|
|
2.70 |
|
|
|
2.70 |
|
Key assumptions used in the discounted cash flow calculations of life insurance (Shinhan life insurance) components are as follows:
|
|
|
|
|
| |
|
|
|
| Consumer price index growth rate(Bank of Korea)(%) |
|
|
2.00 |
|
| Risk-based confidence level(%) |
|
|
99.50 |
|
| |
|
Total recoverable amount and total carrying value of CGUs to which goodwill has been allocated, are as follows: |
|
|
|
|
|
| |
|
|
|
| Total recoverable amount |
|
W |
55,081,110 |
|
| Total carrying value(*) |
|
|
46,383,778 |
|
| |
|
|
|
|
| |
|
W |
8,697,332 |
|
| |
|
|
|
|
| |
(*) |
It is the carrying value after reflecting the impairment loss in the securities sector. |
|
Investments in associates |
| |
(a) |
Investments in associates as of December 31, 2021 and 2022 are as follows: |
|
|
|
|
|
|
|
|
|
|
|
|
|
| |
|
|
|
|
|
|
|
|
|
|
|
|
|
| BNP Paribas Cardif Life Insurance (*1),(*2) |
|
Korea |
|
September 30 |
|
|
14.99 |
|
|
|
14.99 |
|
| Songrim Partners (*7) |
|
Korea |
|
— |
|
|
35.34 |
|
|
|
— |
|
| Partners 4th Growth Investment Fund (*4) |
|
Korea |
|
November 30 |
|
|
25.00 |
|
|
|
25.00 |
|
| KTB Newlake Global Healthcare PEF |
|
Korea |
|
December 31 |
|
|
30.00 |
|
|
|
20.57 |
|
| Shinhan-Neoplux Energy Newbiz Fund (*1),(*5) |
|
Korea |
|
December 31 |
|
|
31.66 |
|
|
|
31.66 |
|
| Shinhan-Albatross tech investment Fund (*4),(*5) |
|
Korea |
|
November 30 |
|
|
50.00 |
|
|
|
50.00 |
|
Meritz Investment Type Private Placement Special Asset Fund |
|
Korea |
|
December 31 |
|
|
23.89 |
|
|
|
23.89 |
|
Meritz Investment Type Private Placement Special Asset Fund |
|
Korea |
|
December 31 |
|
|
20.16 |
|
|
|
20.16 |
|
| VOGO Debt Strategy Qualified IV Private |
|
Korea |
|
December 31 |
|
|
20.00 |
|
|
|
20.00 |
|
| Shinhan-Midas Donga Secondary Fund (*6) |
|
Korea |
|
December 31 |
|
|
50.00 |
|
|
|
50.00 |
|
SHINHAN FINANCIAL GROUP CO., LTD. AND SUBSIDIARIES
Notes to the Consolidated Financial Statements
(In millions of won)
|
Investments in associates (continued) |
|
|
|
|
|
|
|
|
|
|
|
|
|
|
|
|
|
| |
|
|
|
|
|
|
|
|
|
|
|
|
|
|
|
| ShinHan – Soo Young Entrepreneur Investment Fund No.1 |
|
|
Korea |
|
|
|
December 31 |
|
|
|
24.00 |
|
|
|
24.00 |
|
Shinhan Praxis K-Growth Global Private Equity Fund (*9) |
|
|
Korea |
|
|
|
December 31 |
|
|
|
18.87 |
|
|
|
14.15 |
|
| Kiwoom Milestone Professional Private Real Estate Trust 19 |
|
|
Korea |
|
|
|
December 31 |
|
|
|
50.00 |
|
|
|
50.00 |
|
| AIP EURO Green Private Real Estate Trust No.3 (*7) |
|
|
Korea |
|
|
|
— |
|
|
|
21.28 |
|
|
|
— |
|
| Shinhan Global Healthcare Fund 1 (*9) |
|
|
Korea |
|
|
|
December 31 |
|
|
|
4.41 |
|
|
|
4.41 |
|
| KB NA Hickory Private Special Asset Fund |
|
|
Korea |
|
|
|
December 31 |
|
|
|
37.50 |
|
|
|
37.50 |
|
Koramco Europe Core Private Placement Real Estate Fund No.2-2 |
|
|
Korea |
|
|
|
December 31 |
|
|
|
44.02 |
|
|
|
44.02 |
|
| Shinhan EZ General Insurance, Ltd. (*12) |
|
|
Korea |
|
|
|
— |
|
|
|
5.46 |
|
|
|
85.10 |
|
| Hermes Private Investment Equity Fund |
|
|
Korea |
|
|
|
December 31 |
|
|
|
29.17 |
|
|
|
29.17 |
|
KDBC-Midas Dong-A Global contents Fund |
|
|
Korea |
|
|
|
December 31 |
|
|
|
23.26 |
|
|
|
23.26 |
|
| Shinhan-Nvestor Liquidity Solution Fund |
|
|
Korea |
|
|
|
December 31 |
|
|
|
24.92 |
|
|
|
24.92 |
|
| |
|
|
Korea |
|
|
|
December 31 |
|
|
|
25.00 |
|
|
|
25.00 |
|
IGIS Global Credit Fund 150-1 |
|
|
Korea |
|
|
|
December 31 |
|
|
|
25.00 |
|
|
|
25.00 |
|
| Partner One Value up I Private Equity Fund |
|
|
Korea |
|
|
|
December 31 |
|
|
|
27.91 |
|
|
|
27.91 |
|
| Genesis No.1 Private Equity Fund |
|
|
Korea |
|
|
|
December 31 |
|
|
|
22.80 |
|
|
|
22.80 |
|
| Korea Omega Project Fund III |
|
|
Korea |
|
|
|
December 31 |
|
|
|
23.53 |
|
|
|
23.53 |
|
| Soo Delivery Platform Growth Fund (*7) |
|
|
Korea |
|
|
|
— |
|
|
|
30.00 |
|
|
|
— |
|
| Genesis North America Power Company No.1 PEF |
|
|
Korea |
|
|
|
December 31 |
|
|
|
40.03 |
|
|
|
39.11 |
|
| SH MAIN Professional Investment Type Private Mixed Asset Investment Trust No.3 |
|
|
Korea |
|
|
|
December 31 |
|
|
|
23.33 |
|
|
|
23.33 |
|
| MIEL CO.,LTD.(*3),(*4) |
|
|
Korea |
|
|
|
December 31 |
|
|
|
28.77 |
|
|
|
28.77 |
|
| AIP Transportation Specialized Privately Placed Fund Trust #1 |
|
|
Korea |
|
|
|
December 31 |
|
|
|
35.73 |
|
|
|
35.73 |
|
| E&Healthcare Investment Fund No.6 |
|
|
Korea |
|
|
|
December 31 |
|
|
|
21.05 |
|
|
|
21.05 |
|
| One Shinhan Global Fund 1 (*5) |
|
|
Korea |
|
|
|
December 31 |
|
|
|
20.56 |
|
|
|
20.52 |
|
| Kiwoom-Shinhan Innovation Fund I (*6) |
|
|
Korea |
|
|
|
December 31 |
|
|
|
50.00 |
|
|
|
50.00 |
|
Daishin-K&T New Technology Investment Fund (*7) |
|
|
Korea |
|
|
|
— |
|
|
|
31.25 |
|
|
|
— |
|
| Midas Asset Global CRE Debt Private Fund No.6 |
|
|
Korea |
|
|
|
December 31 |
|
|
|
41.16 |
|
|
|
41.16 |
|
Samchully Midstream Private Placement Special Asset Fund 5-4 |
|
|
Korea |
|
|
|
December 31 |
|
|
|
42.92 |
|
|
|
42.92 |
|
| SH Senior Loan Professional Investment Type Private Mixed Asset Investment Trust No.3 (*1) |
|
|
Korea |
|
|
|
September 30 |
|
|
|
20.00 |
|
|
|
20.00 |
|
NH-Amundi Global Infrastructure Trust 14 |
|
|
Korea |
|
|
|
December 31 |
|
|
|
30.00 |
|
|
|
30.00 |
|
| Jarvis Memorial Private Investment Trust 1 (*6) |
|
|
Korea |
|
|
|
December 31 |
|
|
|
99.01 |
|
|
|
99.01 |
|
| Vestas Qualified Investors Private Real Estate Fund Investment Trust No.37 (*8) |
|
|
Korea |
|
|
|
December 31 |
|
|
|
60.00 |
|
|
|
60.00 |
|
| Milestone Private Real Estate Fund 3 |
|
|
Korea |
|
|
|
December 31 |
|
|
|
32.06 |
|
|
|
32.06 |
|
| Nomura-Rifa Private Real Estate Investment Trust 31 |
|
|
Korea |
|
|
|
December 31 |
|
|
|
31.31 |
|
|
|
31.31 |
|
SHINHAN FINANCIAL GROUP CO., LTD. AND SUBSIDIARIES
Notes to the Consolidated Financial Statements
(In millions of won)
|
Investments in associates (continued) |
|
|
|
|
|
|
|
|
|
|
|
|
|
| |
|
|
|
|
|
|
|
|
|
|
|
|
|
SH Senior Loan Professional Investment Type Private Mixed Asset Investment Trust No.2 (*1) |
|
Korea |
|
September 30 |
|
|
21.27 |
|
|
|
21.27 |
|
T&F 2019 bearing Private Equity Fund Specializing in Start-up and Venture Business |
|
Korea |
|
December 31 |
|
|
28.25 |
|
|
|
28.25 |
|
| Cape IT Fund No.3 (*7) |
|
Korea |
|
— |
|
|
32.89 |
|
|
|
— |
|
| FuturePlay-Shinhan TechInnovation Fund 1 (*6) |
|
Korea |
|
December 31 |
|
|
50.00 |
|
|
|
50.00 |
|
| Stonebridge Corporate 1st Fund |
|
Korea |
|
December 31 |
|
|
44.12 |
|
|
|
44.12 |
|
| Vogo Realty Partners Private Real Estate Fund V |
|
Korea |
|
December 31 |
|
|
21.64 |
|
|
|
21.64 |
|
| Korea Credit Bureau (*1),(*9) |
|
Korea |
|
September 30 |
|
|
9.00 |
|
|
|
9.00 |
|
| Goduck Gangil1 PFV Co., Ltd. (*1),(*9) |
|
Korea |
|
September 30 |
|
|
1.04 |
|
|
|
1.04 |
|
| SBC PFV Co., Ltd. (*1),(*10) |
|
Korea |
|
September 30 |
|
|
25.00 |
|
|
|
25.00 |
|
NH-amundi global infra private fund 16 |
|
Korea |
|
December 31 |
|
|
50.00 |
|
|
|
50.00 |
|
| IMM Global Private Equity Fund |
|
Korea |
|
December 31 |
|
|
33.00 |
|
|
|
33.00 |
|
| HANA Alternative Estate Professional Private122 (*7) |
|
Korea |
|
— |
|
|
74.02 |
|
|
|
— |
|
| SH Corporate Professional Investment Type Private Security Investment Trust No.7 (*7) |
|
Korea |
|
— |
|
|
45.96 |
|
|
|
— |
|
| SH BNCT Professional Investment Type Private Special Asset Investment Trust (*11) |
|
Korea |
|
December 31 |
|
|
72.50 |
|
|
|
72.50 |
|
| Deutsche Global Professional Investment Type Private Real Estate Investment Trust No. 24 (*8) |
|
Korea |
|
December 31 |
|
|
52.28 |
|
|
|
52.28 |
|
| Sparklabs-Shinhan Opportunity Fund 1 |
|
Korea |
|
December 31 |
|
|
49.50 |
|
|
|
49.50 |
|
| BNW Tech-Innovation Private Equity Fund |
|
Korea |
|
December 31 |
|
|
29.85 |
|
|
|
29.85 |
|
| IGIS Real-estate Private Investment Trust No.33 |
|
Korea |
|
December 31 |
|
|
40.86 |
|
|
|
40.86 |
|
| WWG Global Real Estate Investment Trust no.4 |
|
Korea |
|
December 31 |
|
|
29.55 |
|
|
|
29.55 |
|
| Goduck Gangil10 PFV Co., Ltd. (*1),(*9) |
|
Korea |
|
September 30 |
|
|
19.90 |
|
|
|
19.90 |
|
| Fidelis Global Private Real Estate Trust No.2 (*8) |
|
Korea |
|
December 31 |
|
|
78.26 |
|
|
|
79.70 |
|
| AIP EURO PRIVATE REAL ESTATE TRUST No. 12 |
|
Korea |
|
December 31 |
|
|
28.70 |
|
|
|
28.70 |
|
| Shinhan Healthcare Fund 2(*9) |
|
Korea |
|
December 31 |
|
|
13.68 |
|
|
|
13.68 |
|
| Pebblestone CGV Private Real Estate Trust No.1 (*7) |
|
Korea |
|
— |
|
|
48.53 |
|
|
|
— |
|
| SH Corporate Professional Investment Type Private Security Investment Trust No.45 (*7) |
|
Korea |
|
— |
|
|
43.65 |
|
|
|
— |
|
| Shinhan AIM Real Estate Fund No.2 (*1) |
|
Korea |
|
September 30 |
|
|
30.00 |
|
|
|
30.00 |
|
| Shinhan AIM Real Estate Fund No.1 (*1) |
|
Korea |
|
September 30 |
|
|
21.01 |
|
|
|
21.01 |
|
| SH Daegu Green Power Cogeneration System Professional Investment Type Private Special Asset Investment Trust |
|
Korea |
|
December 31 |
|
|
22.02 |
|
|
|
22.02 |
|
| SH Sangju YC Expressway Professional Investment Type Private Special Asset Investment Trust (*1) |
|
Korea |
|
September 30 |
|
|
29.19 |
|
|
|
29.19 |
|
SH Global Infrastructure Professional Investment Type Private Special Asset Investment Trust No.7-2 (*1),(*8) |
|
Korea |
|
September 30 |
|
|
71.43 |
|
|
|
71.43 |
|
SHINHAN FINANCIAL GROUP CO., LTD. AND SUBSIDIARIES
Notes to the Consolidated Financial Statements
|
Investments in associates (continued) |
|
|
|
|
|
|
|
|
|
|
|
|
|
| |
|
|
|
|
|
|
|
|
|
|
|
|
|
|
|
|
|
|
|
|
|
|
|
|
|
|
Korea Omega-Shinhan Project Fund I (*6) |
|
Korea |
|
December 31 |
|
|
50.00 |
|
|
|
50.00 |
|
| |
|
Korea |
|
December 31 |
|
|
38.83 |
|
|
|
38.83 |
|
Samsung SRA Real Estate Professional Private 45 |
|
Korea |
|
December 31 |
|
|
25.00 |
|
|
|
25.00 |
|
IBK Global New Renewable Energy Special Asset Professional Private2 |
|
Korea |
|
December 31 |
|
|
28.98 |
|
|
|
28.98 |
|
| |
|
Korea |
|
December 31 |
|
|
41.18 |
|
|
|
41.18 |
|
Aone Mezzanine Opportunity Professional Private (*8) |
|
Korea |
|
December 31 |
|
|
66.09 |
|
|
|
64.41 |
|
NH-Amundi US Infrastructure Private Fund2 |
|
Korea |
|
December 31 |
|
|
25.91 |
|
|
|
25.91 |
|
KB Distribution Private Real Estate1 (*7) |
|
Korea |
|
— |
|
|
62.00 |
|
|
|
— |
|
SH Japan Photovoltaic Private Special Asset Investment Trust No.2 (*1) |
|
Korea |
|
September 30 |
|
|
30.00 |
|
|
|
30.00 |
|
Kakao-Shinhan 1st TNYT Fund |
|
Korea |
|
December 31 |
|
|
48.62 |
|
|
|
48.62 |
|
IMM Special Situation 1-2 PRIVATE EQUITY FUND |
|
Korea |
|
December 31 |
|
|
20.00 |
|
|
|
20.00 |
|
Pacific Private Placement Real Estate Fund No.40 |
|
Korea |
|
December 31 |
|
|
24.73 |
|
|
|
24.73 |
|
Mastern Private Real Estate Loan Fund No.2 |
|
Korea |
|
December 31 |
|
|
33.57 |
|
|
|
33.57 |
|
LB Scotland Amazon Fulfillment Center Fund 29(*8) |
|
Korea |
|
December 31 |
|
|
70.14 |
|
|
|
70.14 |
|
JR AMC Hungary Budapest Office Fund 16 |
|
Korea |
|
December 31 |
|
|
32.57 |
|
|
|
32.57 |
|
| |
|
Korea |
|
December 31 |
|
|
19.87 |
|
|
|
13.47 |
|
Future-Creation Neoplux Venture Capital Fund (*1),(*5) |
|
Korea |
|
September 30 |
|
|
16.25 |
|
|
|
16.25 |
|
Gyeonggi-Neoplux Superman Fund (*1),(*5) |
|
Korea |
|
September 30 |
|
|
21.76 |
|
|
|
21.76 |
|
| |
|
Korea |
|
December 31 |
|
|
30.00 |
|
|
|
30.00 |
|
KTC-NP Growth Champ 2011-2 Private Equity Fund (*1),(*5) |
|
Korea |
|
September 30 |
|
|
5.56 |
|
|
|
5.56 |
|
Neoplux No.3 Private Equity Fund (*1),(*5) |
|
Korea |
|
September 30 |
|
|
10.00 |
|
|
|
10.00 |
|
PCC Amberstone Private Equity Fund I |
|
Korea |
|
December 31 |
|
|
21.67 |
|
|
|
21.67 |
|
KIAMCO POWERLOAN TRUST 4TH |
|
Korea |
|
December 31 |
|
|
47.37 |
|
|
|
47.37 |
|
Mastern Opportunity Seeking Real Estate Fund II |
|
Korea |
|
December 31 |
|
|
20.00 |
|
|
|
20.00 |
|
AION ELFIS PROFESSIONAL PRIVATE 1 |
|
Korea |
|
December 31 |
|
|
20.00 |
|
|
|
20.00 |
|
T&F 2020 SS Private Equity Fund Specializing in Start-up and Venture Business |
|
Korea |
|
December 31 |
|
|
29.68 |
|
|
|
29.68 |
|
Neoplux Market-Frontier Secondary Fund (*5) |
|
Korea |
|
December 31 |
|
|
19.74 |
|
|
|
19.74 |
|
Harvest Private Equity Fund II |
|
Korea |
|
December 31 |
|
|
22.06 |
|
|
|
22.06 |
|
| Synergy Green New Deal 1st New Technology Business Investment Fund |
|
Korea |
|
December 31 |
|
|
28.17 |
|
|
|
28.17 |
|
KAIM Real-estate Private Investment Trust 20 |
|
Korea |
|
December 31 |
|
|
38.46 |
|
|
|
38.46 |
|
KIAMCO Vietnam Solar Special Asset Private Investment Trust (*6) |
|
Korea |
|
December 31 |
|
|
50.00 |
|
|
|
50.00 |
|
Daishin New Technology Investment Fund 5th |
|
Korea |
|
December 31 |
|
|
23.44 |
|
|
|
23.44 |
|
CSQUARE SNIPER PROFESSIONAL PRIVATE 10 (*7) |
|
Korea |
|
— |
|
|
62.50 |
|
|
|
— |
|
SHINHAN FINANCIAL GROUP CO., LTD. AND SUBSIDIARIES
Notes to the Consolidated Financial Statements
|
Investments in associates (continued) |
| |
|
|
|
|
|
|
|
|
|
|
|
|
|
|
|
|
|
|
|
|
|
|
|
|
|
|
|
|
|
|
|
|
|
|
|
|
|
|
|
Acurus Hyundai Investment Partners New Technology (*7) |
|
Korea |
|
— |
|
|
26.79 |
|
|
|
— |
|
IGIS GLIP Professional Investment Private Real Estate Investment Trust No. 1-1 (*7) |
|
Korea |
|
— |
|
|
97.10 |
|
|
|
— |
|
IGIS GLIP Professional Investment Private Real Estate Investment Trust No. 1-2 (*7) |
|
Korea |
|
— |
|
|
97.10 |
|
|
|
— |
|
Pacific Sunny Professional Investors Private Placement Real Estate Investment Company No.45 (*7) |
|
Korea |
|
— |
|
|
25.00 |
|
|
|
— |
|
|
|
|
|
|
|
|
|
|
|
|
|
|
SHINHAN-NEO Core Industrial Technology Fund (*5) |
|
Korea |
|
December 31 |
|
|
49.75 |
|
|
|
49.75 |
|
| SHBNPP Green New Deal Energy Professional Investment Type Private Special Asset Investment Trust No.2 (*1) |
|
Korea |
|
September 30 |
|
|
30.00 |
|
|
|
30.00 |
|
| SIMONE Mezzanine Fund No.3 |
|
Korea |
|
December 31 |
|
|
29.38 |
|
|
|
28.97 |
|
| Eum Private Equity Fund No.7 |
|
Korea |
|
December 31 |
|
|
21.00 |
|
|
|
21.00 |
|
Kiwoom Private Equity Ant-Man Startup Venture Specialized Private Equity Fund (*7) |
|
Korea |
|
— |
|
|
25.00 |
|
|
|
— |
|
| Kiwoom Hero No.4 Private Equity Fund |
|
Korea |
|
December 31 |
|
|
21.05 |
|
|
|
21.05 |
|
| Vogo Canister Professional Trust Private Fund I |
|
Korea |
|
December 31 |
|
|
36.53 |
|
|
|
36.27 |
|
| SW-S Fund |
|
Korea |
|
December 31 |
|
|
30.30 |
|
|
|
30.30 |
|
| CL Buyout 1st PEF |
|
Korea |
|
December 31 |
|
|
21.43 |
|
|
|
21.43 |
|
Timefolio The Venture-V second |
|
Korea |
|
December 31 |
|
|
20.73 |
|
|
|
20.73 |
|
| Newlake Growth Capital Partners2 PEF (*4) |
|
Korea |
|
November 30 |
|
|
29.91 |
|
|
|
29.91 |
|
| Shinhan Smilegate Global PEF I (*9) |
|
Korea |
|
December 31 |
|
|
14.21 |
|
|
|
14.21 |
|
| Fount Professional Investors Private Investment Trust No.3 (*7) |
|
Korea |
|
— |
|
|
49.98 |
|
|
|
— |
|
| Genesis Eco No.1 PEF |
|
Korea |
|
December 31 |
|
|
29.01 |
|
|
|
29.01 |
|
SHINHAN-NEO Market-Frontier 2nd Fund (*5) |
|
Korea |
|
December 31 |
|
|
42.70 |
|
|
|
42.70 |
|
NH-Synergy Core Industrial New Technology Fund |
|
Korea |
|
December 31 |
|
|
36.93 |
|
|
|
36.93 |
|
| J& Moorim Jade Investment Fund |
|
Korea |
|
December 31 |
|
|
24.89 |
|
|
|
24.89 |
|
| Helios-KDBC Digital Contents 1st |
|
Korea |
|
December 31 |
|
|
23.26 |
|
|
|
23.26 |
|
| Ulmus SHC innovation investment fund |
|
Korea |
|
December 31 |
|
|
24.04 |
|
|
|
24.04 |
|
| Mirae Asset Partners X Private Equity Fund |
|
Korea |
|
December 31 |
|
|
35.71 |
|
|
|
35.71 |
|
| T Core Industrial Technology 1st Venture PEF |
|
Korea |
|
December 31 |
|
|
31.47 |
|
|
|
31.47 |
|
| Curious Finale Corporate Recovery Private Equity Fund |
|
Korea |
|
December 31 |
|
|
27.78 |
|
|
|
27.78 |
|
| TI First Property Private Investment Trust 1 |
|
Korea |
|
December 31 |
|
|
40.00 |
|
|
|
40.00 |
|
| MPLUS Professional Private Real Estate Fund 25 |
|
Korea |
|
December 31 |
|
|
41.67 |
|
|
|
41.67 |
|
| IBKC Global Contents Investment Fund |
|
Korea |
|
December 31 |
|
|
24.39 |
|
|
|
24.39 |
|
| Nautic Smart No.6 Private Equity Fund |
|
Korea |
|
December 31 |
|
|
37.74 |
|
|
|
37.74 |
|
| Premier Luminous Private Equity Fund |
|
Korea |
|
December 31 |
|
|
27.78 |
|
|
|
25.12 |
|
| Hanyang-Meritz 1 Fund |
|
Korea |
|
December 31 |
|
|
22.58 |
|
|
|
22.58 |
|
SHINHAN FINANCIAL GROUP CO., LTD. AND SUBSIDIARIES
Notes to the Consolidated Financial Statements
|
Investments in associates (continued) |
|
|
|
|
|
|
|
|
|
|
|
|
|
| |
|
|
|
|
|
|
|
|
|
|
|
|
|
|
|
|
|
|
|
|
|
|
|
|
|
|
| KNT 2ND PRIVATE EQUITY FUND |
|
Korea |
|
December 31 |
|
|
21.74 |
|
|
|
21.74 |
|
| Kiwoom-Shinhan Innovation Fund 2 |
|
Korea |
|
December 31 |
|
|
42.86 |
|
|
|
42.86 |
|
| Maple Mobility Fund |
|
Korea |
|
December 31 |
|
|
20.18 |
|
|
|
20.18 |
|
| SJ ESG Innovative Growth Fund |
|
Korea |
|
December 31 |
|
|
28.57 |
|
|
|
28.57 |
|
| AVES 1st Corporate Recovery Private Equity Fund (*6) |
|
Korea |
|
December 31 |
|
|
76.19 |
|
|
|
76.19 |
|
| JS Shinhan Private Equity Fund (*5) |
|
Korea |
|
December 31 |
|
|
3.85 |
|
|
|
3.85 |
|
| NH Kyobo AI Solution Investment Fund |
|
Korea |
|
December 31 |
|
|
26.09 |
|
|
|
26.09 |
|
Daishin Newgen New Technology Investment Fund 1 st (*8) |
|
Korea |
|
December 31 |
|
|
50.60 |
|
|
|
50.60 |
|
| META ESG Private Equity Fund I |
|
Korea |
|
December 31 |
|
|
27.40 |
|
|
|
27.40 |
|
| |
|
Korea |
|
December 31 |
|
|
40.25 |
|
|
|
40.25 |
|
| PHAROS DK FUND |
|
Korea |
|
December 31 |
|
|
24.24 |
|
|
|
24.14 |
|
|
|
|
|
|
|
|
|
|
|
|
|
|
| Shinhan VC tomorrow venture fund 1 (*5) |
|
Korea |
|
December 31 |
|
|
39.62 |
|
|
|
39.62 |
|
| |
|
Korea |
|
December 31 |
|
|
32.67 |
|
|
|
32.67 |
|
| |
|
Korea |
|
December 31 |
|
|
24.81 |
|
|
|
24.81 |
|
| Stonebridge-Shinhan Unicorn Secondary Fund (*5) |
|
Korea |
|
December 31 |
|
|
19.92 |
|
|
|
17.57 |
|
| Tres-Yujin Trust (*6) |
|
Korea |
|
December 31 |
|
|
50.00 |
|
|
|
50.00 |
|
| Shinhan-Time mezzanine blind Fund (*6) |
|
Korea |
|
December 31 |
|
|
50.00 |
|
|
|
50.00 |
|
| Capstone REITs No.26 (*6) |
|
Korea |
|
December 31 |
|
|
50.00 |
|
|
|
50.00 |
|
| JB Incheon-Bucheon REITS No.54 |
|
Korea |
|
December 31 |
|
|
39.31 |
|
|
|
39.31 |
|
| Hankook Smart Real Asset Investment Trust No.3 |
|
Korea |
|
December 31 |
|
|
33.33 |
|
|
|
33.33 |
|
| JB Hwaseong-Hadong REITs No.53 |
|
Korea |
|
December 31 |
|
|
31.03 |
|
|
|
31.03 |
|
| KB Oaktree Trust No.3 |
|
Korea |
|
December 31 |
|
|
33.33 |
|
|
|
33.33 |
|
| Daehan No.36 Office Asset Management Company |
|
Korea |
|
December 31 |
|
|
48.05 |
|
|
|
48.05 |
|
| Rhinos Premier Mezzanine Private Investment Fund No.1 |
|
Korea |
|
December 31 |
|
|
27.93 |
|
|
|
27.93 |
|
| SH Real Estate Loan Investment Type Private Real Estate Investment Trust No.2 |
|
Korea |
|
December 31 |
|
|
29.73 |
|
|
|
29.73 |
|
| Shinhan JigaeNamsan Road Private Special Asset Investment Trust (*1) |
|
Korea |
|
September 30 |
|
|
24.85 |
|
|
|
24.85 |
|
| |
|
Korea |
|
December 31 |
|
|
29.85 |
|
|
|
29.85 |
|
| IBKC-METIS Global Contents Investment Fund |
|
Korea |
|
December 31 |
|
|
36.36 |
|
|
|
36.36 |
|
| Keistone Unicorn Private Equity Fund |
|
Korea |
|
December 31 |
|
|
28.00 |
|
|
|
28.00 |
|
KB Distribution Private Real Estate 3-1 |
|
Korea |
|
December 31 |
|
|
— |
|
|
|
37.50 |
|
Pacific Private Investment Trust No.49-1 (*8) |
|
Korea |
|
December 31 |
|
|
— |
|
|
|
79.28 |
|
| KIWOOM Real estate private placement fund for normal investors No. 31 (*8) |
|
Korea |
|
December 31 |
|
|
— |
|
|
|
60.00 |
|
| RIFA Real estate private placement fund for normal investoes No. 51 |
|
Korea |
|
December 31 |
|
|
— |
|
|
|
40.00 |
|
| Fivetree general private equity fund No.15 |
|
Korea |
|
December 31 |
|
|
— |
|
|
|
49.98 |
|
| Shinhan-Kunicorn first Fund |
|
Korea |
|
December 31 |
|
|
— |
|
|
|
38.31 |
|
SHINHAN FINANCIAL GROUP CO., LTD. AND SUBSIDIARIES
Notes to the Consolidated Financial Statements
(In millions of won)
|
Investments in associates (continued) |
|
|
|
|
|
|
|
|
|
|
|
|
|
| |
|
|
|
|
|
|
|
|
|
|
|
|
|
|
|
|
|
|
|
|
|
|
|
|
|
|
| |
|
Korea |
|
December 31 |
|
|
— |
|
|
|
44.67 |
|
| |
|
Korea |
|
December 31 |
|
|
— |
|
|
|
38.46 |
|
Korea Investment develop seed Trust No.1 |
|
Korea |
|
December 31 |
|
|
— |
|
|
|
40.00 |
|
Tiger Green alpah Trust No.29 (*6) |
|
Korea |
|
December 31 |
|
|
— |
|
|
|
95.24 |
|
STIC ALT Global II Private Equity Fund |
|
Korea |
|
December 31 |
|
|
— |
|
|
|
21.74 |
|
| |
|
Korea |
|
December 31 |
|
|
— |
|
|
|
25.00 |
|
DDI LVC Master Real Estate Investment Trust Co., Ltd. (*1),(*9) |
|
Korea |
|
September 30 |
|
|
— |
|
|
|
15.00 |
|
Find-Green New Deal 2nd Equity Fund |
|
Korea |
|
December 31 |
|
|
— |
|
|
|
22.57 |
|
ShinhanFitrin 1st Technology Business Investment Association (*5) |
|
Korea |
|
December 31 |
|
|
— |
|
|
|
16.17 |
|
PARATUS No.3 Private Equity Fund |
|
Korea |
|
December 31 |
|
|
— |
|
|
|
25.64 |
|
Golden Route 2nd Startup Venture Specialized Private Equity Fund |
|
Korea |
|
December 31 |
|
|
— |
|
|
|
22.73 |
|
Koramco Private Real Estate Fund 143 |
|
Korea |
|
December 31 |
|
|
— |
|
|
|
30.30 |
|
|
|
|
|
|
|
|
|
|
|
|
|
|
| Korea Investment Top Mezzanine Private Real Esate Trust No.1 |
|
Korea |
|
December 31 |
|
|
— |
|
|
|
22.22 |
|
| LB YoungNam Logistics Private Trust No.40 |
|
Korea |
|
December 31 |
|
|
— |
|
|
|
25.00 |
|
Shinhan-Cognitive Start-up Fund L.P. |
|
Korea |
|
December 31 |
|
|
— |
|
|
|
32.74 |
|
| IGEN2022 No.1 private Equity Fund |
|
Korea |
|
December 31 |
|
|
— |
|
|
|
27.95 |
|
| Cornerstone J&M Fund I |
|
Korea |
|
December 31 |
|
|
— |
|
|
|
26.67 |
|
| Logisvalley Shinhan REIT Co.,Ltd. (*1) |
|
Korea |
|
September 30 |
|
|
— |
|
|
|
20.27 |
|
| KDB Investment Global Healthcare Private Equity Fund I |
|
Korea |
|
December 31 |
|
|
— |
|
|
|
24.14 |
|
| Korea Investment Green Newdeal Infra Trust No.1 |
|
Korea |
|
December 31 |
|
|
— |
|
|
|
27.97 |
|
| BTS 2nd Private Equity Fund (*1) |
|
Korea |
|
September 30 |
|
|
— |
|
|
|
26.00 |
|
| Shinhan Global Active REIT Co.Ltd |
|
Korea |
|
December 31 |
|
|
— |
|
|
|
20.37 |
|
NH-J&-IBKC Label Technology Fund |
|
Korea |
|
December 31 |
|
|
— |
|
|
|
27.81 |
|
| IMM Global Venture Opportunity, LP |
|
Korea |
|
December 31 |
|
|
— |
|
|
|
35.50 |
|
| Capstone Develop Frontier Trust |
|
Korea |
|
December 31 |
|
|
— |
|
|
|
21.43 |
|
| Nextrade Co., Ltd. (*9) |
|
Korea |
|
December 31 |
|
|
— |
|
|
|
8.00 |
|
| SH Sustainable Management ESG Short term Bond Security Feeder Investment Trust No.1 |
|
Korea |
|
December 31 |
|
|
— |
|
|
|
26.90 |
|
| SH 1.5years Maturity Investment Type Security Investment Trust No.2 |
|
Korea |
|
December 31 |
|
|
— |
|
|
|
29.00 |
|
| Eventus-IBKC LIB Fund |
|
Korea |
|
December 31 |
|
|
— |
|
|
|
21.88 |
|
NH-Daishin-Kyobo healthcare 1 Fund |
|
Korea |
|
December 31 |
|
|
— |
|
|
|
25.00 |
|
| IBKC-Behigh Fund 1st |
|
Korea |
|
December 31 |
|
|
— |
|
|
|
29.73 |
|
Nautic Green Innovation ESG Co-investment No.1 Private Equity Fund |
|
Korea |
|
December 31 |
|
|
— |
|
|
|
24.10 |
|
| ON No.1 Private Equity Fund |
|
Korea |
|
December 31 |
|
|
— |
|
|
|
28.57 |
|
| Digital New Deal Kappa Private Equity Fund |
|
Korea |
|
December 31 |
|
|
— |
|
|
|
30.12 |
|
|
(*1) |
The financial statements of September 30, 2022 are used for the equity method since the financial statements as of December 31, 2022 are not available. Significant trades and events occurred within the period are properly reflected. |
SHINHAN FINANCIAL GROUP CO., LTD. AND SUBSIDIARIES
Notes to the Consolidated Financial Statements
|
Investments in associates (continued) |
|
(*2) |
The Group applies the equity method accounting as the Group has a significant influence on the investees through important business transactions. |
|
(*3) |
In the course of the rehabilitation process, the shares were acquired through investment conversion. Although voting rights cannot be exercised during the rehabilitation process, normal voting rights are exercised because the rehabilitation process was completed before December 31, 2022. Also, it has been reclassified into the investments in associates. |
|
(*4) |
The latest financial statements are used for the equity method since the financial statements as of December 31, 2022 are not available. Significant trades and events occurred within the period are properly reflected. |
|
(*5) |
As a managing partner, the Group has a significant influence over the investees. |
|
(*6) |
As a limited partner, the Group does not have an ability to participate in policy-making processes to obtain economic benefit from the investees that would allow the Group to control the entity. |
|
(*7) |
Excluded from the investments in associates due to full or partial disposal of shares, or loss of significant influence. |
|
(*8) |
Although the ownership percentages are more than 50%, the Group applies the equity method accounting as the Group does not have an ability to participate in the financial and operating policy-making process. |
|
(*9) |
Although the ownership percentages are less than 20%, the Group applies the equity method accounting since it participates in policy-making processes and therefore can exercise significant influence on investees. |
| |
(*10) |
The rate of Group’s voting rights is 4.65%. |
| |
(*11) |
Although the Group has a significant influence with ownership percentage more than 50%, the contribution was classified as investments in associates as the Group is not exposed to variable returns due to the payment guarantee for the entire investment amount. |
| |
(*12) |
For the year ended December 31, 2022, it is incorporated into the consolidation target as the Group held control due to increased equity ratio and BNP Paribas Cardif General Insurance, Ltd. has changed its name to Shinhan EZ General Insurance, Ltd. |
|
(b) |
Changes in investments in associates for the years ended December 31, 2021 and 2022 are as follows: |
|
|
|
|
|
|
|
|
|
|
|
|
|
|
|
|
|
|
|
|
|
|
|
|
|
|
|
|
|
| |
|
|
|
|
|
|
|
|
|
|
|
|
|
|
|
|
|
|
| BNP Paribas Cardif Life Insurance |
|
W |
50,600 |
|
|
|
— |
|
|
|
(660 |
) |
|
|
(5,918 |
) |
|
|
— |
|
|
|
44,022 |
|
| Songrim Partners(*1) |
|
|
— |
|
|
|
— |
|
|
|
— |
|
|
|
— |
|
|
|
— |
|
|
|
— |
|
| Partners 4th Growth Investment Fund |
|
|
11,958 |
|
|
|
(16,144 |
) |
|
|
12,525 |
|
|
|
4,694 |
|
|
|
— |
|
|
|
13,033 |
|
| KTB Newlake Global Healthcare PEF |
|
|
9,404 |
|
|
|
— |
|
|
|
8 |
|
|
|
— |
|
|
|
— |
|
|
|
9,412 |
|
| Daekwang Semiconductor Co., Ltd. |
|
|
3,631 |
|
|
|
(3,742 |
) |
|
|
113 |
|
|
|
(2 |
) |
|
|
— |
|
|
|
— |
|
| Shinhan-Neoplux Energy Newbiz Fund |
|
|
14,470 |
|
|
|
475 |
|
|
|
1,087 |
|
|
|
— |
|
|
|
— |
|
|
|
16,032 |
|
| Shinhan-Albatross tech investment Fund |
|
|
13,322 |
|
|
|
(9,000 |
) |
|
|
6,067 |
|
|
|
— |
|
|
|
— |
|
|
|
10,389 |
|
| VOGO Debt Strategy Qualified IV Private |
|
|
8,702 |
|
|
|
(1,733 |
) |
|
|
210 |
|
|
|
— |
|
|
|
— |
|
|
|
7,179 |
|
| Shinhan-Midas Donga Secondary Fund |
|
|
4,752 |
|
|
|
(500 |
) |
|
|
(301 |
) |
|
|
— |
|
|
|
— |
|
|
|
3,951 |
|
SHINHAN FINANCIAL GROUP CO., LTD. AND SUBSIDIARIES
Notes to the Consolidated Financial Statements
|
Investments in associates (continued) |
|
|
|
|
|
|
|
|
|
|
|
|
|
|
|
|
|
|
|
|
|
|
|
|
|
|
|
|
|
| |
|
|
|
|
|
|
|
|
|
|
|
|
|
|
|
|
|
|
|
|
|
|
|
|
|
|
|
|
|
|
|
|
|
|
|
|
|
|
|
|
|
|
|
|
|
|
|
|
|
|
|
|
|
|
|
|
|
|
|
|
|
|
|
|
|
|
|
|
ShinHan – Soo Young Entrepreneur Investment
Fund No.1 |
|
|
9,968 |
|
|
|
(7,879 |
) |
|
|
2,137 |
|
|
|
— |
|
|
|
— |
|
|
|
4,226 |
|
Shinhan Praxis K-Growth Global Private Equity Fund |
|
|
9,945 |
|
|
|
(2,310 |
) |
|
|
126 |
|
|
|
— |
|
|
|
— |
|
|
|
7,761 |
|
Credian Healthcare Private Equity Fund II |
|
|
5,835 |
|
|
|
(5,835 |
) |
|
|
— |
|
|
|
— |
|
|
|
— |
|
|
|
— |
|
Kiwoom Milestone Professional Private Real Estate Trust 19 |
|
|
9,918 |
|
|
|
(66 |
) |
|
|
(361 |
) |
|
|
— |
|
|
|
(4,238 |
) |
|
|
5,253 |
|
AIP EURO Green Private Real Estate Trust No.3 |
|
|
21,021 |
|
|
|
(1,335 |
) |
|
|
10,017 |
|
|
|
— |
|
|
|
— |
|
|
|
29,703 |
|
Shinhan Global Healthcare Fund 1(*1) |
|
|
— |
|
|
|
— |
|
|
|
— |
|
|
|
— |
|
|
|
— |
|
|
|
— |
|
JB Power TL Investment Type Private Placement Special Asset Fund 7 |
|
|
16,186 |
|
|
|
(15,947 |
) |
|
|
(239 |
) |
|
|
— |
|
|
|
— |
|
|
|
— |
|
KB NA Hickory Private Special Asset Fund |
|
|
34,938 |
|
|
|
(2,266 |
) |
|
|
1,704 |
|
|
|
— |
|
|
|
— |
|
|
|
34,376 |
|
Koramco Europe Core Private Placement Real Estate Fund No.2-2 |
|
|
18,618 |
|
|
|
(1,204 |
) |
|
|
2,078 |
|
|
|
— |
|
|
|
— |
|
|
|
19,492 |
|
BNP Paribas Cardif General Insurance |
|
|
3,895 |
|
|
|
176 |
|
|
|
(708 |
) |
|
|
(9 |
) |
|
|
— |
|
|
|
3,354 |
|
Hermes Private Investment Equity Fund |
|
|
6,099 |
|
|
|
(3,167 |
) |
|
|
6,850 |
|
|
|
— |
|
|
|
— |
|
|
|
9,782 |
|
|
|
|
|
|
|
|
|
|
|
|
|
|
|
|
|
|
|
|
|
|
|
|
|
|
| Shinhan-Nvestor Liquidity Solution Fund |
|
|
4,493 |
|
|
|
331 |
|
|
|
514 |
|
|
|
— |
|
|
|
— |
|
|
|
5,338 |
|
| |
|
|
8,760 |
|
|
|
(79 |
) |
|
|
475 |
|
|
|
— |
|
|
|
— |
|
|
|
9,156 |
|
IGIS Global Credit Fund 150-1 |
|
|
7,282 |
|
|
|
(3,246 |
) |
|
|
1,366 |
|
|
|
— |
|
|
|
— |
|
|
|
5,402 |
|
| Partner One Value up I Private Equity Fund |
|
|
11,779 |
|
|
|
(6,933 |
) |
|
|
3,045 |
|
|
|
— |
|
|
|
— |
|
|
|
7,891 |
|
| Genesis No.1 Private Equity Fund |
|
|
80,113 |
|
|
|
388 |
|
|
|
(24,968 |
) |
|
|
— |
|
|
|
— |
|
|
|
55,533 |
|
| Korea Omega Project Fund III |
|
|
3,563 |
|
|
|
— |
|
|
|
727 |
|
|
|
— |
|
|
|
— |
|
|
|
4,290 |
|
| Soo Delivery Platform Growth Fund |
|
|
4,068 |
|
|
|
— |
|
|
|
1,805 |
|
|
|
— |
|
|
|
— |
|
|
|
5,873 |
|
| Genesis North America Power Company No.1 PEF |
|
|
16,983 |
|
|
|
(5,229 |
) |
|
|
1,982 |
|
|
|
— |
|
|
|
— |
|
|
|
13,736 |
|
| Hyungje art printing(*2) |
|
|
— |
|
|
|
— |
|
|
|
— |
|
|
|
— |
|
|
|
— |
|
|
|
— |
|
| SH MAIN Professional Investment Type Private Mixed Asset Investment Trust No.3 |
|
|
10,582 |
|
|
|
24,500 |
|
|
|
6,467 |
|
|
|
— |
|
|
|
— |
|
|
|
41,549 |
|
| Korea Finance Security |
|
|
3,055 |
|
|
|
— |
|
|
|
(61 |
) |
|
|
— |
|
|
|
— |
|
|
|
2,994 |
|
| Multimedia Tech Co.Ltd.(*2) |
|
|
— |
|
|
|
— |
|
|
|
— |
|
|
|
— |
|
|
|
— |
|
|
|
— |
|
| MIEL CO.,LTD.(*1) |
|
|
— |
|
|
|
— |
|
|
|
— |
|
|
|
— |
|
|
|
— |
|
|
|
— |
|
SHINHAN FINANCIAL GROUP CO., LTD. AND SUBSIDIARIES
Notes to the Consolidated Financial Statements
|
Investments in associates (continued) |
|
|
|
|
|
|
|
|
|
|
|
|
|
|
|
|
|
|
|
|
|
|
|
|
|
|
|
|
|
| |
|
|
|
|
|
|
|
|
|
|
|
|
|
|
|
|
|
|
AIP Transportation Specialized Privately Placed Fund Trust #1 |
|
|
32,993 |
|
|
|
347 |
|
|
|
1,348 |
|
|
|
— |
|
|
|
— |
|
|
|
34,688 |
|
| DB Epic Convertiblebond Private Trust No.2 |
|
|
5,785 |
|
|
|
(5,538 |
) |
|
|
(247 |
) |
|
|
— |
|
|
|
— |
|
|
|
— |
|
| E&Healthcare Investment Fund No.6 |
|
|
15,163 |
|
|
|
(3,431 |
) |
|
|
(4,866 |
) |
|
|
— |
|
|
|
— |
|
|
|
6,866 |
|
| One Shinhan Global Fund 1 |
|
|
4,029 |
|
|
|
(519 |
) |
|
|
263 |
|
|
|
— |
|
|
|
— |
|
|
|
3,773 |
|
| Kiwoom-Shinhan Innovation Fund I |
|
|
15,969 |
|
|
|
(5,150 |
) |
|
|
912 |
|
|
|
— |
|
|
|
— |
|
|
|
11,731 |
|
Daishin-K&T New Technology Investment Fund |
|
|
7,000 |
|
|
|
— |
|
|
|
991 |
|
|
|
— |
|
|
|
— |
|
|
|
7,991 |
|
| Midas Asset Global CRE Debt Private Fund No.6 |
|
|
47,389 |
|
|
|
(2,701 |
) |
|
|
3,617 |
|
|
|
— |
|
|
|
— |
|
|
|
48,305 |
|
| Richmond Private Investment Trust No.82 |
|
|
15,049 |
|
|
|
(19,411 |
) |
|
|
4,362 |
|
|
|
— |
|
|
|
— |
|
|
|
— |
|
| Tiger Alternative Real Estate Professional Private5 |
|
|
18,499 |
|
|
|
(20,848 |
) |
|
|
2,349 |
|
|
|
— |
|
|
|
— |
|
|
|
— |
|
Samchully Midstream Private Placement Special Asset Fund 5-4 |
|
|
28,818 |
|
|
|
(843 |
) |
|
|
(504 |
) |
|
|
— |
|
|
|
— |
|
|
|
27,471 |
|
| SH Senior Loan Professional Investment Type Private Mixed Asset Investment Trust No.3 |
|
|
65,616 |
|
|
|
(41,622 |
) |
|
|
1,210 |
|
|
|
— |
|
|
|
— |
|
|
|
25,204 |
|
NH-Amundi Global Infrastructure Trust 14 |
|
|
18,819 |
|
|
|
(1,609 |
) |
|
|
1,091 |
|
|
|
— |
|
|
|
— |
|
|
|
18,301 |
|
| Jarvis Memorial Private Investment Trust 1 |
|
|
10,043 |
|
|
|
(700 |
) |
|
|
766 |
|
|
|
— |
|
|
|
— |
|
|
|
10,109 |
|
| Mastern Private Private Investment Trust 68 |
|
|
10,010 |
|
|
|
(10,332 |
) |
|
|
322 |
|
|
|
— |
|
|
|
— |
|
|
|
— |
|
| Vestas Qualified Investors Private Real Estate Fund Investment Trust No.37 |
|
|
35,641 |
|
|
|
(4,981 |
) |
|
|
2,493 |
|
|
|
— |
|
|
|
— |
|
|
|
33,153 |
|
| Milestone Private Real Estate Fund 3 |
|
|
18,528 |
|
|
|
(472 |
) |
|
|
488 |
|
|
|
— |
|
|
|
— |
|
|
|
18,544 |
|
| IGIS Private Real Estate Investment Trust 286 |
|
|
8,844 |
|
|
|
(9,176 |
) |
|
|
332 |
|
|
|
— |
|
|
|
— |
|
|
|
— |
|
| Nomura-Rifa Private Real Estate Investment Trust 31 |
|
|
8,407 |
|
|
|
(705 |
) |
|
|
200 |
|
|
|
— |
|
|
|
— |
|
|
|
7,902 |
|
| SH Senior Loan Professional Investment Type Private Mixed Asset Investment Trust No.2 |
|
|
13,323 |
|
|
|
(3,511 |
) |
|
|
424 |
|
|
|
— |
|
|
|
— |
|
|
|
10,236 |
|
| Hana Semiconductor New Technology Fund |
|
|
24,131 |
|
|
|
(26,129 |
) |
|
|
1,998 |
|
|
|
— |
|
|
|
— |
|
|
|
— |
|
| J&Magnet Startup Venture Specialized Private Equity Fund |
|
|
5,935 |
|
|
|
(7,247 |
) |
|
|
1,312 |
|
|
|
— |
|
|
|
— |
|
|
|
— |
|
| Cape IT Fund No.3 |
|
|
10,649 |
|
|
|
(580 |
) |
|
|
(4 |
) |
|
|
— |
|
|
|
— |
|
|
|
10,065 |
|
SHINHAN FINANCIAL GROUP CO., LTD. AND SUBSIDIARIES
Notes to the Consolidated Financial Statements
|
Investments in associates (continued) |
|
|
|
|
|
|
|
|
|
|
|
|
|
|
|
|
|
|
|
|
|
|
|
|
|
|
|
|
|
| |
|
|
|
|
|
|
|
|
|
|
|
|
|
|
|
|
|
|
| FuturePlay-Shinhan TechInnovation Fund 1 |
|
W |
4,295 |
|
|
|
3,025 |
|
|
|
(171 |
) |
|
|
— |
|
|
|
— |
|
|
|
7,149 |
|
| Stonebridge Corporate 1st Fund |
|
|
3,239 |
|
|
|
— |
|
|
|
(275 |
) |
|
|
— |
|
|
|
— |
|
|
|
2,964 |
|
| Vogo Realty Partners Private Real Estate Fund V |
|
|
10,827 |
|
|
|
(681 |
) |
|
|
620 |
|
|
|
— |
|
|
|
— |
|
|
|
10,766 |
|
| Korea Credit Bureau |
|
|
6,976 |
|
|
|
(90 |
) |
|
|
809 |
|
|
|
— |
|
|
|
— |
|
|
|
7,695 |
|
| Goduck Gangil1 PFV Co., Ltd.(*1) |
|
|
— |
|
|
|
— |
|
|
|
— |
|
|
|
— |
|
|
|
— |
|
|
|
— |
|
| SBC PFV Co., Ltd. |
|
|
18,208 |
|
|
|
12,499 |
|
|
|
(1,121 |
) |
|
|
— |
|
|
|
— |
|
|
|
29,586 |
|
NH-amundi global infra private fund 16 |
|
|
43,839 |
|
|
|
346 |
|
|
|
7,823 |
|
|
|
— |
|
|
|
— |
|
|
|
52,008 |
|
| IMM Global Private Equity Fund |
|
|
120,855 |
|
|
|
(10,462 |
) |
|
|
8,222 |
|
|
|
— |
|
|
|
— |
|
|
|
118,615 |
|
| HANA Alternative Estate Professional Private122 |
|
|
29,631 |
|
|
|
(1,001 |
) |
|
|
859 |
|
|
|
— |
|
|
|
— |
|
|
|
29,489 |
|
| Hanwha-Incus Plus New Technology Fund No.1 |
|
|
11,026 |
|
|
|
(8,284 |
) |
|
|
(2,742 |
) |
|
|
— |
|
|
|
— |
|
|
|
— |
|
| SH Corporate Professional Investment Type Private Security Investment Trust No.7 |
|
|
51,210 |
|
|
|
(1,518 |
) |
|
|
207 |
|
|
|
— |
|
|
|
— |
|
|
|
49,899 |
|
| SH BNCT Professional Investment Type Private Special Asset Investment Trust |
|
|
286,531 |
|
|
|
(15,191 |
) |
|
|
10,859 |
|
|
|
— |
|
|
|
— |
|
|
|
282,199 |
|
| PSA EMP Private Equity Fund |
|
|
9,814 |
|
|
|
(9,755 |
) |
|
|
(59 |
) |
|
|
— |
|
|
|
— |
|
|
|
— |
|
| Deutsche Global Professional Investment Type Private Real Estate Investment Trust No. 24 |
|
|
29,401 |
|
|
|
(2,630 |
) |
|
|
1,541 |
|
|
|
— |
|
|
|
— |
|
|
|
28,312 |
|
| BRAIN DO PROFESSIONALE PRIVATE No. 27 |
|
|
3,441 |
|
|
|
(3,048 |
) |
|
|
583 |
|
|
|
— |
|
|
|
— |
|
|
|
976 |
|
| UI Venture Fund 7th |
|
|
3,279 |
|
|
|
(3,269 |
) |
|
|
(10 |
) |
|
|
— |
|
|
|
— |
|
|
|
— |
|
| Sparklabs-Shinhan Opportunity Fund 1 |
|
|
4,832 |
|
|
|
— |
|
|
|
(192 |
) |
|
|
— |
|
|
|
— |
|
|
|
4,640 |
|
BNW Tech-Innovation Private Equity Fund |
|
|
5,942 |
|
|
|
— |
|
|
|
(61 |
) |
|
|
— |
|
|
|
— |
|
|
|
5,881 |
|
IGIS Real-estate Private Investment Trust No.33 |
|
|
14,099 |
|
|
|
(714 |
) |
|
|
499 |
|
|
|
— |
|
|
|
— |
|
|
|
13,884 |
|
Findvalue PreIPO 6th Professional Investment Type Private Investment Trust |
|
|
3,002 |
|
|
|
(3,301 |
) |
|
|
299 |
|
|
|
— |
|
|
|
— |
|
|
|
— |
|
WWG Global Real Estate Investment Trust no.4 |
|
|
17,752 |
|
|
|
(7,855 |
) |
|
|
747 |
|
|
|
— |
|
|
|
— |
|
|
|
10,644 |
|
Goduck Gangil10 PFV Co., Ltd(*1) |
|
|
32 |
|
|
|
— |
|
|
|
(32 |
) |
|
|
— |
|
|
|
— |
|
|
|
— |
|
Fidelis Global Private Real Estate Trust No.2 |
|
|
19,485 |
|
|
|
(911 |
) |
|
|
1,199 |
|
|
|
— |
|
|
|
— |
|
|
|
19,773 |
|
SHINHAN FINANCIAL GROUP CO., LTD. AND SUBSIDIARIES
Notes to the Consolidated Financial Statements
|
Investments in associates (continued) |
|
|
|
|
|
|
|
|
|
|
|
|
|
|
|
|
|
|
|
|
|
|
|
|
|
|
|
|
|
|
|
|
|
|
|
|
|
|
|
|
|
|
|
|
|
|
|
|
IGIS PRIVATE REAL ESTATE TRUST NO.331 |
|
|
3,765 |
|
|
|
(3,765 |
) |
|
|
— |
|
|
|
— |
|
|
|
— |
|
|
|
— |
|
AIP EURO PRIVATE REAL ESTATE TRUST No. 12 |
|
|
48,344 |
|
|
|
(5,436 |
) |
|
|
6,309 |
|
|
|
— |
|
|
|
— |
|
|
|
49,217 |
|
Shinhan Healthcare Fund 2(*1) |
|
|
986 |
|
|
|
— |
|
|
|
(75 |
) |
|
|
— |
|
|
|
(911 |
) |
|
|
— |
|
Pebblestone CGV Private Real Estate Trust No.1 |
|
|
13,346 |
|
|
|
(748 |
) |
|
|
1,112 |
|
|
|
— |
|
|
|
— |
|
|
|
13,710 |
|
SH Corporate Professional Investment Type Private Security Investment Trust No.45 |
|
|
— |
|
|
|
174,154 |
|
|
|
(199 |
) |
|
|
— |
|
|
|
— |
|
|
|
173,955 |
|
Shinhan AIM Real Estate Fund No.2 |
|
|
22,464 |
|
|
|
1,911 |
|
|
|
(1,100 |
) |
|
|
— |
|
|
|
— |
|
|
|
23,275 |
|
Shinhan AIM Real Estate Fund No.1 |
|
|
46,945 |
|
|
|
(4,412 |
) |
|
|
1,779 |
|
|
|
— |
|
|
|
— |
|
|
|
44,312 |
|
SH Daegu Green Power Cogeneration System Professional Investment Type Private Special Asset Investment Trust |
|
|
32,944 |
|
|
|
(911 |
) |
|
|
915 |
|
|
|
— |
|
|
|
— |
|
|
|
32,948 |
|
SH Sangju YC Expressway Professional Investment Type Private Special Asset Investment Trust |
|
|
20,902 |
|
|
|
7 |
|
|
|
(359 |
) |
|
|
— |
|
|
|
— |
|
|
|
20,550 |
|
SH Global Infrastructure Professional Investment Type Private Special Asset Investment Trust No.7-2 |
|
|
6,692 |
|
|
|
13,667 |
|
|
|
(1,504 |
) |
|
|
— |
|
|
|
— |
|
|
|
18,855 |
|
SH Japan Photovoltaic Private Special Asset Investment Trust No.1 |
|
|
4,845 |
|
|
|
(4,845 |
) |
|
|
— |
|
|
|
— |
|
|
|
— |
|
|
|
— |
|
Korea Omega-Shinhan Project Fund I |
|
|
5,931 |
|
|
|
2,000 |
|
|
|
(687 |
) |
|
|
— |
|
|
|
— |
|
|
|
7,244 |
|
|
|
|
1,993 |
|
|
|
— |
|
|
|
1,366 |
|
|
|
— |
|
|
|
— |
|
|
|
3,359 |
|
New Green Shinhan Mezzanine Fund |
|
|
4,916 |
|
|
|
(5,622 |
) |
|
|
706 |
|
|
|
— |
|
|
|
— |
|
|
|
— |
|
KORAMKO-Daum Professional Private Investment Trust No.12 |
|
|
7,528 |
|
|
|
(7,756 |
) |
|
|
228 |
|
|
|
— |
|
|
|
— |
|
|
|
— |
|
Samsung SRA Real Estate Professional Private 45 |
|
|
10,666 |
|
|
|
2,656 |
|
|
|
(442 |
) |
|
|
— |
|
|
|
— |
|
|
|
12,880 |
|
|
|
|
|
|
|
|
|
|
|
|
|
|
|
|
|
|
|
|
|
|
|
|
|
|
IBK Global New Renewable Energy Special Asset Professional Private2 |
|
|
32,349 |
|
|
|
(1,988 |
) |
|
|
1,526 |
|
|
|
— |
|
|
|
— |
|
|
|
31,887 |
|
VS Cornerstone Fund |
|
|
3,464 |
|
|
|
— |
|
|
|
(54 |
) |
|
|
— |
|
|
|
— |
|
|
|
3,410 |
|
Aone Mezzanine Opportunity Professional Private |
|
|
9,580 |
|
|
|
(28 |
) |
|
|
(12 |
) |
|
|
— |
|
|
|
— |
|
|
|
9,540 |
|
SHINHAN FINANCIAL GROUP CO., LTD. AND SUBSIDIARIES
Notes to the Consolidated Financial Statements
|
Investments in associates (continued) |
|
|
|
|
|
|
|
|
|
|
|
|
|
|
|
|
|
|
|
|
|
|
|
|
|
|
|
|
|
|
|
|
|
|
|
|
|
|
|
|
|
|
|
|
|
|
|
|
|
|
|
|
|
|
|
|
|
|
|
|
|
|
|
|
|
|
|
|
|
|
|
|
|
KiwoomUnicorn3 New Technology Business Investment Fund |
|
|
4,283 |
|
|
|
(3,633 |
) |
|
|
(650 |
) |
|
|
— |
|
|
|
— |
|
|
|
— |
|
Multi Asset The United States Thortons Professional Private1 |
|
|
41,440 |
|
|
|
(41,607 |
) |
|
|
167 |
|
|
|
— |
|
|
|
— |
|
|
|
— |
|
Kiwoom Milestone US Real Estate Professional Private20 |
|
|
51,512 |
|
|
|
(51,512 |
) |
|
|
— |
|
|
|
— |
|
|
|
— |
|
|
|
— |
|
NH-Amundi US Infrastructure Private Fund2 |
|
|
25,430 |
|
|
|
207 |
|
|
|
1,387 |
|
|
|
— |
|
|
|
— |
|
|
|
27,024 |
|
KB Distribution Private Real Estate1 |
|
|
30,698 |
|
|
|
(1,423 |
) |
|
|
1,419 |
|
|
|
— |
|
|
|
— |
|
|
|
30,694 |
|
SH Jigae Namsan BTO professional Investment Type Private Special Asset Investment Trust |
|
|
20,712 |
|
|
|
(22,293 |
) |
|
|
1,581 |
|
|
|
— |
|
|
|
— |
|
|
|
— |
|
SH Japan Photovoltaic Private Special Asset Investment Trust No.2 |
|
|
29,149 |
|
|
|
(16,798 |
) |
|
|
665 |
|
|
|
— |
|
|
|
— |
|
|
|
13,016 |
|
Kakao-Shinhan 1st TNYT Fund |
|
|
5,681 |
|
|
|
9,000 |
|
|
|
(184 |
) |
|
|
— |
|
|
|
— |
|
|
|
14,497 |
|
IMM Special Situation 1-2 PRIVATE EQUITY FUND |
|
|
10,870 |
|
|
|
(160 |
) |
|
|
883 |
|
|
|
— |
|
|
|
— |
|
|
|
11,593 |
|
Pacific Private Placement Real Estate Fund
No.40 |
|
|
11,647 |
|
|
|
(747 |
) |
|
|
698 |
|
|
|
— |
|
|
|
— |
|
|
|
11,598 |
|
Mastern Private Real Estate Loan Fund No.2 |
|
|
5,692 |
|
|
|
1,429 |
|
|
|
370 |
|
|
|
— |
|
|
|
— |
|
|
|
7,491 |
|
LB Scotland Amazon Fulfillment Center Fund 29 |
|
|
31,182 |
|
|
|
(1,734 |
) |
|
|
1,820 |
|
|
|
— |
|
|
|
— |
|
|
|
31,268 |
|
JR AMC Hungary Budapest Office Fund 16 |
|
|
12,204 |
|
|
|
(821 |
) |
|
|
757 |
|
|
|
— |
|
|
|
— |
|
|
|
12,140 |
|
IGIS 372 Real Estate Professional Private |
|
|
56,835 |
|
|
|
(56,835 |
) |
|
|
— |
|
|
|
— |
|
|
|
— |
|
|
|
— |
|
EDNCENTRAL Co.,Ltd.(*1) |
|
|
1,040 |
|
|
|
— |
|
|
|
(1,040 |
) |
|
|
— |
|
|
|
— |
|
|
|
— |
|
KoFC-Neoplux R&D-Biz Creation 2013-1 Venture Capital Fund |
|
|
3,830 |
|
|
|
(8,388 |
) |
|
|
4,558 |
|
|
|
— |
|
|
|
— |
|
|
|
— |
|
Future-Creation Neoplux Venture Capital Fund |
|
|
3,796 |
|
|
|
(995 |
) |
|
|
216 |
|
|
|
— |
|
|
|
— |
|
|
|
3,017 |
|
Gyeonggi-Neoplux Superman Fund |
|
|
6,399 |
|
|
|
(2,257 |
) |
|
|
3,736 |
|
|
|
— |
|
|
|
— |
|
|
|
7,878 |
|
NewWave 6th Fund |
|
|
6,150 |
|
|
|
7,575 |
|
|
|
730 |
|
|
|
— |
|
|
|
— |
|
|
|
14,455 |
|
KTC-NP Growth Champ 2011-2 Private Equity Fund |
|
|
2,853 |
|
|
|
— |
|
|
|
1,137 |
|
|
|
— |
|
|
|
— |
|
|
|
3,990 |
|
Neoplux No.3 Private Equity Fund |
|
|
10,295 |
|
|
|
10,182 |
|
|
|
2,124 |
|
|
|
— |
|
|
|
— |
|
|
|
22,601 |
|
PCC Amberstone Private Equity Fund I |
|
|
22,480 |
|
|
|
(2,356 |
) |
|
|
2,666 |
|
|
|
— |
|
|
|
— |
|
|
|
22,790 |
|
KIAMCO POWERLOAN TRUST 4TH |
|
|
43,955 |
|
|
|
(164 |
) |
|
|
1,510 |
|
|
|
— |
|
|
|
— |
|
|
|
45,301 |
|
SHINHAN FINANCIAL GROUP CO., LTD. AND SUBSIDIARIES
Notes to the Consolidated Financial Statements
(In millions of won)
|
Investments in associates (continued) |
|
|
|
|
|
|
|
|
|
|
|
|
|
|
|
|
|
|
|
|
|
|
|
|
|
|
|
|
|
| |
|
|
|
|
|
|
|
|
|
|
|
|
|
|
|
|
|
|
| Mastern Opportunity Seeking Real Estate Fund II |
|
W |
19,799 |
|
|
|
(737 |
) |
|
|
2,255 |
|
|
|
— |
|
|
|
— |
|
|
|
21,317 |
|
| AION ELFIS PROFESSIONAL PRIVATE 1 |
|
|
5,528 |
|
|
|
(1,350 |
) |
|
|
244 |
|
|
|
— |
|
|
|
— |
|
|
|
4,422 |
|
T&F 2020 SS Private Equity Fund Specializing in Start-up and Venture Business |
|
|
4,453 |
|
|
|
— |
|
|
|
(93 |
) |
|
|
— |
|
|
|
— |
|
|
|
4,360 |
|
| Neoplux Market-Frontier Secondary Fund |
|
|
11,545 |
|
|
|
(614 |
) |
|
|
382 |
|
|
|
— |
|
|
|
— |
|
|
|
11,313 |
|
| Harvest Private Equity Fund II |
|
|
2,982 |
|
|
|
— |
|
|
|
499 |
|
|
|
— |
|
|
|
— |
|
|
|
3,481 |
|
| Synergy Green New Deal 1st New Technology Business Investment Fund |
|
|
10,008 |
|
|
|
(247 |
) |
|
|
(77 |
) |
|
|
— |
|
|
|
— |
|
|
|
9,684 |
|
| KAIM Real-estate Private Investment Trust 20 |
|
|
5,098 |
|
|
|
(350 |
) |
|
|
300 |
|
|
|
— |
|
|
|
— |
|
|
|
5,048 |
|
| KIAMCO Vietnam Solar Special Asset Private Investment Trust |
|
|
7,948 |
|
|
|
(1,112 |
) |
|
|
691 |
|
|
|
— |
|
|
|
— |
|
|
|
7,527 |
|
| Daishin New Technology Investment Fund 5th |
|
|
2,850 |
|
|
|
— |
|
|
|
1,589 |
|
|
|
— |
|
|
|
— |
|
|
|
4,439 |
|
| CSQUARE SNIPER PROFESSIONAL PRIVATE 10 |
|
|
3,125 |
|
|
|
— |
|
|
|
122 |
|
|
|
— |
|
|
|
— |
|
|
|
3,247 |
|
| Acurus Hyundai Investment Partners New Technology |
|
|
2,927 |
|
|
|
— |
|
|
|
1,787 |
|
|
|
— |
|
|
|
— |
|
|
|
4,714 |
|
IGIS GLIP Professional Investment Private Real Estate Investment Trust No. 1-1 |
|
|
44,594 |
|
|
|
4,103 |
|
|
|
11,371 |
|
|
|
3,876 |
|
|
|
— |
|
|
|
63,944 |
|
IGIS GLIP Professional Investment Private Real Estate Investment Trust No. 1-2 |
|
|
44,594 |
|
|
|
4,103 |
|
|
|
11,371 |
|
|
|
3,876 |
|
|
|
— |
|
|
|
63,944 |
|
| Pacific Sunny Professional Investors Private Placement Real Estate Investment Company No.45 |
|
|
15,855 |
|
|
|
— |
|
|
|
(1,077 |
) |
|
|
— |
|
|
|
— |
|
|
|
14,778 |
|
| IGIS Professional Investors Private Investment Real Estate Investment LLC No.395 |
|
|
29,644 |
|
|
|
(29,644 |
) |
|
|
— |
|
|
|
— |
|
|
|
— |
|
|
|
— |
|
SHINHAN-NEO Core Industrial Technology Fund |
|
|
1,979 |
|
|
|
3,960 |
|
|
|
(248 |
) |
|
|
— |
|
|
|
— |
|
|
|
5,691 |
|
| SHBNPP Green New Deal Energy Professional Investment Type Private Special Asset Investment Trust No.2 |
|
|
21,142 |
|
|
|
5,271 |
|
|
|
830 |
|
|
|
— |
|
|
|
— |
|
|
|
27,243 |
|
| SIMONE Mezzanine Fund No.3 |
|
|
2,980 |
|
|
|
— |
|
|
|
74 |
|
|
|
— |
|
|
|
— |
|
|
|
3,054 |
|
SHINHAN FINANCIAL GROUP CO., LTD. AND SUBSIDIARIES
Notes to the Consolidated Financial Statements
(In millions of won)
|
Investments in associates (continued) |
|
|
|
|
|
|
|
|
|
|
|
|
|
|
|
|
|
|
|
|
|
|
|
|
|
|
|
|
|
| |
|
|
|
|
|
|
|
|
|
|
|
|
|
|
|
|
|
|
Eum Private Equity Fund No.7 |
|
|
7,872 |
|
|
|
121 |
|
|
|
(120 |
) |
|
|
— |
|
|
|
— |
|
|
|
7,873 |
|
Kiwoom Private Equity Ant-Man Startup Venture Specialized Private Equity Fund |
|
|
5,034 |
|
|
|
— |
|
|
|
2,560 |
|
|
|
— |
|
|
|
— |
|
|
|
7,594 |
|
| Kiwoom Hero No.4 Private Equity Fund |
|
|
4,707 |
|
|
|
— |
|
|
|
(402 |
) |
|
|
— |
|
|
|
— |
|
|
|
4,305 |
|
| Vogo Canister Professional Trust Private Fund I |
|
|
43,975 |
|
|
|
(4,712 |
) |
|
|
1,809 |
|
|
|
— |
|
|
|
— |
|
|
|
41,072 |
|
| SW-S Fund |
|
|
— |
|
|
|
7,000 |
|
|
|
(276 |
) |
|
|
— |
|
|
|
— |
|
|
|
6,724 |
|
| CL Buyout 1st PEF |
|
|
— |
|
|
|
13,875 |
|
|
|
(84 |
) |
|
|
— |
|
|
|
— |
|
|
|
13,791 |
|
Timefolio The Venture-V second |
|
|
— |
|
|
|
4,000 |
|
|
|
572 |
|
|
|
— |
|
|
|
— |
|
|
|
4,572 |
|
| Newlake Growth Capital Partners2 PEF |
|
|
— |
|
|
|
13,000 |
|
|
|
(79 |
) |
|
|
— |
|
|
|
— |
|
|
|
12,921 |
|
| Shinhan Smilegate Global PEF I |
|
|
— |
|
|
|
3,376 |
|
|
|
(40 |
) |
|
|
— |
|
|
|
— |
|
|
|
3,336 |
|
| Fount Professional Investors Private Investment Trust No.3 |
|
|
— |
|
|
|
5,000 |
|
|
|
197 |
|
|
|
— |
|
|
|
— |
|
|
|
5,197 |
|
| Genesis Eco No.1 PEF |
|
|
— |
|
|
|
11,292 |
|
|
|
(162 |
) |
|
|
— |
|
|
|
— |
|
|
|
11,130 |
|
SHINHAN-NEO Market-Frontier 2nd Fund(*3) |
|
|
— |
|
|
|
25,620 |
|
|
|
(1,014 |
) |
|
|
— |
|
|
|
— |
|
|
|
24,606 |
|
NH-Synergy Core Industrial New Technology Fund |
|
|
— |
|
|
|
6,500 |
|
|
|
(63 |
) |
|
|
— |
|
|
|
— |
|
|
|
6,437 |
|
| J& Moorim Jade Investment Fund |
|
|
— |
|
|
|
5,500 |
|
|
|
40 |
|
|
|
— |
|
|
|
— |
|
|
|
5,540 |
|
| Ulmus SHC innovation investment fund |
|
|
— |
|
|
|
5,000 |
|
|
|
192 |
|
|
|
— |
|
|
|
— |
|
|
|
5,192 |
|
| Mirae Asset Partners X Private Equity Fund |
|
|
— |
|
|
|
8,000 |
|
|
|
(142 |
) |
|
|
— |
|
|
|
— |
|
|
|
7,858 |
|
| T Core Industrial Technology 1st Venture PEF |
|
|
— |
|
|
|
4,500 |
|
|
|
35 |
|
|
|
— |
|
|
|
— |
|
|
|
4,535 |
|
| Curious Finale Corporate Recovery Private Equity Fund |
|
|
— |
|
|
|
3,377 |
|
|
|
313 |
|
|
|
— |
|
|
|
— |
|
|
|
3,690 |
|
| TI First Property Private Investment Trust 1 |
|
|
— |
|
|
|
2,879 |
|
|
|
176 |
|
|
|
— |
|
|
|
— |
|
|
|
3,055 |
|
| MPLUS Professional Private Real Estate Fund 25 |
|
|
— |
|
|
|
3,010 |
|
|
|
280 |
|
|
|
— |
|
|
|
— |
|
|
|
3,290 |
|
| IBKC Global Contents Investment Fund |
|
|
— |
|
|
|
5,000 |
|
|
|
(57 |
) |
|
|
— |
|
|
|
— |
|
|
|
4,943 |
|
| Nautic Smart No.6 Private Equity Fund |
|
|
— |
|
|
|
4,000 |
|
|
|
(26 |
) |
|
|
— |
|
|
|
— |
|
|
|
3,974 |
|
| Premier Luminous Private Equity Fund |
|
|
— |
|
|
|
7,095 |
|
|
|
(104 |
) |
|
|
— |
|
|
|
— |
|
|
|
6,991 |
|
| Hanyang-Meritz 1 Fund |
|
|
— |
|
|
|
3,500 |
|
|
|
(17 |
) |
|
|
— |
|
|
|
— |
|
|
|
3,483 |
|
SHINHAN FINANCIAL GROUP CO., LTD. AND SUBSIDIARIES
Notes to the Consolidated Financial Statements
|
Investments in associates (continued) |
|
|
|
|
|
|
|
|
|
|
|
|
|
|
|
|
|
|
|
|
|
|
|
|
|
|
|
|
|
|
|
|
|
|
|
|
|
|
|
|
|
|
|
|
|
|
|
|
KNT 2ND PRIVATE EQUITY FUND |
|
|
— |
|
|
|
3,000 |
|
|
|
1,157 |
|
|
|
— |
|
|
|
— |
|
|
|
4,157 |
|
|
|
|
— |
|
|
|
9,274 |
|
|
|
(591 |
) |
|
|
— |
|
|
|
— |
|
|
|
8,683 |
|
AVES 1st Corporate Recovery Private Equity Fund |
|
|
— |
|
|
|
4,800 |
|
|
|
(64 |
) |
|
|
— |
|
|
|
— |
|
|
|
4,736 |
|
JS Shinhan Private Equity Fund |
|
|
— |
|
|
|
5,076 |
|
|
|
(39 |
) |
|
|
— |
|
|
|
— |
|
|
|
5,037 |
|
Daishin Newgen New Technology Investment Fund 1 st |
|
|
— |
|
|
|
8,000 |
|
|
|
4,169 |
|
|
|
— |
|
|
|
— |
|
|
|
12,169 |
|
META ESG Private Equity Fund I |
|
|
— |
|
|
|
5,726 |
|
|
|
(49 |
) |
|
|
— |
|
|
|
— |
|
|
|
5,677 |
|
|
|
|
— |
|
|
|
9,700 |
|
|
|
(54 |
) |
|
|
— |
|
|
|
— |
|
|
|
9,646 |
|
PHAROS DK FUND |
|
|
— |
|
|
|
4,000 |
|
|
|
(51 |
) |
|
|
— |
|
|
|
— |
|
|
|
3,949 |
|
Shinhan VC tomorrow venture fund 1 |
|
|
— |
|
|
|
9,113 |
|
|
|
(71 |
) |
|
|
— |
|
|
|
— |
|
|
|
9,042 |
|
|
|
|
— |
|
|
|
4,900 |
|
|
|
(1 |
) |
|
|
— |
|
|
|
— |
|
|
|
4,899 |
|
|
|
|
— |
|
|
|
9,752 |
|
|
|
(24 |
) |
|
|
— |
|
|
|
— |
|
|
|
9,728 |
|
Tres-Yujin Trust |
|
|
— |
|
|
|
10,000 |
|
|
|
(5 |
) |
|
|
— |
|
|
|
— |
|
|
|
9,995 |
|
Shinhan-Time mezzanine blind Fund |
|
|
— |
|
|
|
15,000 |
|
|
|
(58 |
) |
|
|
— |
|
|
|
— |
|
|
|
14,942 |
|
Capstone REITs No.26 |
|
|
— |
|
|
|
4,849 |
|
|
|
(454 |
) |
|
|
— |
|
|
|
— |
|
|
|
4,395 |
|
JB Incheon-Bucheon REITS No.54 |
|
|
— |
|
|
|
5,000 |
|
|
|
(1 |
) |
|
|
— |
|
|
|
— |
|
|
|
4,999 |
|
Hankook Smart Real Asset Investment Trust No.3 |
|
|
— |
|
|
|
4,173 |
|
|
|
169 |
|
|
|
— |
|
|
|
— |
|
|
|
4,342 |
|
JB Hwaseong-Hadong REITs No.53 |
|
|
— |
|
|
|
5,000 |
|
|
|
(1 |
) |
|
|
— |
|
|
|
— |
|
|
|
4,999 |
|
KB Oaktree Trust No.3 |
|
|
— |
|
|
|
3,141 |
|
|
|
18 |
|
|
|
— |
|
|
|
— |
|
|
|
3,159 |
|
Daehan No.36 Office Asset Management Company |
|
|
— |
|
|
|
21,500 |
|
|
|
— |
|
|
|
— |
|
|
|
— |
|
|
|
21,500 |
|
Rhinos Premier Mezzanine Private Investment Fund No.1 |
|
|
— |
|
|
|
3,000 |
|
|
|
5 |
|
|
|
— |
|
|
|
— |
|
|
|
3,005 |
|
SH Real Estate Loan Investment Type Private Real Estate Investment Trust No.2 |
|
|
— |
|
|
|
19,426 |
|
|
|
477 |
|
|
|
— |
|
|
|
— |
|
|
|
19,903 |
|
Shinhan JigaeNamsan Road Private Special Asset Investment Trust |
|
|
— |
|
|
|
39,996 |
|
|
|
109 |
|
|
|
— |
|
|
|
— |
|
|
|
40,105 |
|
|
|
|
— |
|
|
|
6,000 |
|
|
|
(55 |
) |
|
|
— |
|
|
|
— |
|
|
|
5,945 |
|
IBKC-METIS Global Contents Investment Fund |
|
|
— |
|
|
|
4,000 |
|
|
|
— |
|
|
|
— |
|
|
|
— |
|
|
|
4,000 |
|
Keistone Unicorn Private Equity Fund |
|
|
— |
|
|
|
6,300 |
|
|
|
— |
|
|
|
— |
|
|
|
— |
|
|
|
6,300 |
|
Others |
|
|
121,040 |
|
|
|
63,729 |
|
|
|
5,881 |
|
|
|
(3 |
) |
|
|
(5,570 |
) |
|
|
185,077 |
|
| |
|
|
|
|
|
|
|
|
|
|
|
|
|
|
|
|
|
|
|
|
|
|
|
|
| |
|
W |
2,657,768 |
|
|
|
101,582 |
|
|
|
158,600 |
|
|
|
6,514 |
|
|
|
(10,719 |
) |
|
|
2,913,745 |
|
| |
|
|
|
|
|
|
|
|
|
|
|
|
|
|
|
|
|
|
|
|
|
|
|
|
(*1) The Group has stopped recognizing its equity method income or loss due to the carrying value of ‘0’ resulting from the investees’ cumulative loss.
SHINHAN FINANCIAL GROUP CO., LTD. AND SUBSIDIARIES
Notes to the Consolidated Financial Statements
|
Investments in associates (continued) |
(*2) For the year ended December 31, 2021, the Group has stopped recognizing its equity method income or loss to accumulated deficits and the shares are retired for the year ended December 31, 2021.
(*3) Classified as investments in associates without cash transactions.
|
|
|
|
|
|
|
|
|
|
|
|
|
|
|
|
|
|
|
|
|
|
|
|
|
|
|
|
|
|
|
|
|
|
|
|
|
|
|
|
|
|
|
|
|
|
|
|
|
|
|
|
|
|
|
|
|
|
|
|
|
|
|
|
|
|
|
|
|
|
|
|
|
|
|
|
|
|
|
|
|
|
|
|
|
|
|
|
|
|
|
|
|
|
|
|
|
|
BNP Paribas Cardif Life Insurance |
|
|
44,022 |
|
|
|
— |
|
|
|
(1,774 |
) |
|
|
(12,079 |
) |
|
|
— |
|
|
|
30,169 |
|
Songrim Partners |
|
|
— |
|
|
|
— |
|
|
|
— |
|
|
|
— |
|
|
|
— |
|
|
|
— |
|
Partners 4th Growth Investment Fund |
|
|
13,033 |
|
|
|
(1,714 |
) |
|
|
6,917 |
|
|
|
(4,694 |
) |
|
|
— |
|
|
|
13,542 |
|
KTB Newlake Global Healthcare PEF |
|
|
9,412 |
|
|
|
(5,832 |
) |
|
|
729 |
|
|
|
— |
|
|
|
— |
|
|
|
4,309 |
|
Shinhan-Neoplux Energy Newbiz Fund |
|
|
16,032 |
|
|
|
(391 |
) |
|
|
5,196 |
|
|
|
— |
|
|
|
— |
|
|
|
20,837 |
|
Shinhan-Albatross tech investment Fund |
|
|
10,389 |
|
|
|
(1,800 |
) |
|
|
3,792 |
|
|
|
(128 |
) |
|
|
— |
|
|
|
12,253 |
|
Meritz Investment Type Private Placement Special Asset Fund |
|
|
— |
|
|
|
676 |
|
|
|
34 |
|
|
|
— |
|
|
|
3,522 |
|
|
|
4,232 |
|
Meritz Investment Type Private Placement Special Asset Fund |
|
|
— |
|
|
|
1,471 |
|
|
|
— |
|
|
|
— |
|
|
|
255 |
|
|
|
1,726 |
|
VOGO Debt Strategy Qualified IV Private |
|
|
7,179 |
|
|
|
(1,433 |
) |
|
|
339 |
|
|
|
— |
|
|
|
— |
|
|
|
6,085 |
|
Shinhan -Midas Dong-A Secondary Fund |
|
|
3,951 |
|
|
|
(1,025 |
) |
|
|
1,505 |
|
|
|
— |
|
|
|
— |
|
|
|
4,431 |
|
ShinHan – Soo Young Entrepreneur Investment Fund
No.1 |
|
|
4,226 |
|
|
|
— |
|
|
|
188 |
|
|
|
— |
|
|
|
— |
|
|
|
4,414 |
|
Shinhan Praxis K-Growth Global Private Equity Fund |
|
|
7,761 |
|
|
|
(8,512 |
) |
|
|
4,442 |
|
|
|
— |
|
|
|
— |
|
|
|
3,691 |
|
Kiwoom Milestone Professional Private Real Estate Trust
19 |
|
|
5,253 |
|
|
|
— |
|
|
|
(150 |
) |
|
|
— |
|
|
|
(1,142) |
|
|
|
3,961 |
|
AIP EURO Green Private Real Estate Trust No.3 |
|
|
29,703 |
|
|
|
(29,008 |
) |
|
|
(695 |
) |
|
|
— |
|
|
|
— |
|
|
|
— |
|
Shinhan Global Healthcare Fund 1 (*1) |
|
|
— |
|
|
|
— |
|
|
|
— |
|
|
|
— |
|
|
|
— |
|
|
|
— |
|
KB NA Hickory Private Special Asset Fund |
|
|
34,376 |
|
|
|
(1,545 |
) |
|
|
1,508 |
|
|
|
— |
|
|
|
— |
|
|
|
34,339 |
|
Koramco Europe Core Private Placement Real Estate Fund No.2-2 |
|
|
19,492 |
|
|
|
(464 |
) |
|
|
208 |
|
|
|
— |
|
|
|
— |
|
|
|
19,236 |
|
Shinhan EZ General Insurance, Ltd. (*2) |
|
|
3,354 |
|
|
|
(3,181 |
) |
|
|
(182 |
) |
|
|
9 |
|
|
|
— |
|
|
|
— |
|
Hermes Private Investment Equity Fund |
|
|
9,782 |
|
|
|
— |
|
|
|
(4,220 |
) |
|
|
— |
|
|
|
— |
|
|
|
5,562 |
|
SHINHAN FINANCIAL GROUP CO., LTD. AND SUBSIDIARIES
Notes to the Consolidated Financial Statements
|
Investments in associates (continued) |
|
|
|
|
|
|
|
|
|
|
|
|
|
|
|
|
|
|
|
|
|
|
|
|
|
| |
|
|
|
| |
|
|
|
|
|
|
|
|
|
|
|
|
|
|
|
|
|
|
|
|
|
|
|
|
|
|
|
|
|
|
|
|
|
|
|
|
|
|
|
|
|
|
|
KDBC-Midas Dong-A Global contents Fund |
|
|
2,955 |
|
|
|
— |
|
|
|
1,322 |
|
|
|
— |
|
|
|
— |
|
|
|
4,277 |
|
Shinhan-Nvestor Liquidity Solution Fund |
|
|
5,338 |
|
|
|
700 |
|
|
|
400 |
|
|
|
— |
|
|
|
— |
|
|
|
6,438 |
|
| |
|
|
9,156 |
|
|
|
51 |
|
|
|
903 |
|
|
|
— |
|
|
|
— |
|
|
|
10,110 |
|
IGIS Global Credit Fund 150-1 |
|
|
5,402 |
|
|
|
(1,267 |
) |
|
|
557 |
|
|
|
— |
|
|
|
— |
|
|
|
4,692 |
|
Partner One Value up I Private Equity Fund |
|
|
7,891 |
|
|
|
— |
|
|
|
(2,747 |
) |
|
|
— |
|
|
|
— |
|
|
|
5,144 |
|
Genesis No.1 Private Equity Fund |
|
|
55,533 |
|
|
|
408 |
|
|
|
3,983 |
|
|
|
— |
|
|
|
— |
|
|
|
59,924 |
|
Korea Omega Project Fund III |
|
|
4,290 |
|
|
|
— |
|
|
|
(616 |
) |
|
|
— |
|
|
|
— |
|
|
|
3,674 |
|
Soo Delivery Platform Growth Fund |
|
|
5,873 |
|
|
|
(6,093 |
) |
|
|
220 |
|
|
|
— |
|
|
|
— |
|
|
|
— |
|
Genesis North America Power Company No.1 PEF |
|
|
13,736 |
|
|
|
(12,629 |
) |
|
|
7,011 |
|
|
|
— |
|
|
|
— |
|
|
|
8,118 |
|
SHBNPP MAIN Professional Investment Type
Private Mixed Asset Investment Trust No.3 |
|
|
41,549 |
|
|
|
12,056 |
|
|
|
(10,361 |
) |
|
|
— |
|
|
|
— |
|
|
|
43,244 |
|
|
|
|
|
|
|
|
|
|
|
|
|
|
|
|
|
|
|
|
|
|
|
|
|
|
| MIEL CO.,LTD. (*1) |
|
|
— |
|
|
|
— |
|
|
|
— |
|
|
|
— |
|
|
|
— |
|
|
|
— |
|
| AIP Transportation Specialized Privately Placed
Fund Trust #1 |
|
|
34,688 |
|
|
|
5,527 |
|
|
|
4,606 |
|
|
|
— |
|
|
|
— |
|
|
|
44,821 |
|
| E&Healthcare Investment Fund No.6 |
|
|
6,866 |
|
|
|
(3,190 |
) |
|
|
(3,079 |
) |
|
|
— |
|
|
|
— |
|
|
|
597 |
|
| One Shinhan Global Fund 1 |
|
|
3,773 |
|
|
|
— |
|
|
|
(1,183 |
) |
|
|
— |
|
|
|
(642 |
) |
|
|
1,948 |
|
| Kiwoom-Shinhan Innovation Fund I |
|
|
11,731 |
|
|
|
(1,500 |
) |
|
|
(790 |
) |
|
|
— |
|
|
|
— |
|
|
|
9,441 |
|
Daishin-K&T New Technology Investment Fund |
|
|
7,991 |
|
|
|
(7,430 |
) |
|
|
(561 |
) |
|
|
— |
|
|
|
— |
|
|
|
— |
|
| Midas Asset Global CRE Debt Private Fund No.6 |
|
|
48,305 |
|
|
|
5,873 |
|
|
|
2,851 |
|
|
|
— |
|
|
|
— |
|
|
|
57,029 |
|
Samchully Midstream Private Placement Special Asset Fund 5-4 |
|
|
27,471 |
|
|
|
5,033 |
|
|
|
(1,880 |
) |
|
|
— |
|
|
|
— |
|
|
|
30,624 |
|
| SHBNPP Senior Loan Professional Investment Type Private Mixed Asset Investment Trust No.3 |
|
|
25,204 |
|
|
|
(912 |
) |
|
|
200 |
|
|
|
— |
|
|
|
— |
|
|
|
24,492 |
|
NH-Amundi Global Infrastructure Trust 14 |
|
|
18,301 |
|
|
|
1,714 |
|
|
|
960 |
|
|
|
— |
|
|
|
— |
|
|
|
20,975 |
|
| Jarvis Memorial Private Investment Trust 1 |
|
|
10,109 |
|
|
|
(700 |
) |
|
|
377 |
|
|
|
— |
|
|
|
— |
|
|
|
9,786 |
|
| Vestas Qualified Investors Private Real Estate Fund Investment Trust No.37 |
|
|
33,153 |
|
|
|
(22 |
) |
|
|
226 |
|
|
|
— |
|
|
|
— |
|
|
|
33,357 |
|
| Milestone Private Real Estate Fund 3 (Derivative Type) |
|
|
18,544 |
|
|
|
(201 |
) |
|
|
728 |
|
|
|
— |
|
|
|
— |
|
|
|
19,071 |
|
| RIFA Real estate private placement fund for normal investors No. 31 |
|
|
7,902 |
|
|
|
(607 |
) |
|
|
69 |
|
|
|
— |
|
|
|
— |
|
|
|
7,364 |
|
SHINHAN FINANCIAL GROUP CO., LTD. AND SUBSIDIARIES
Notes to the Consolidated Financial Statements
|
Investments in associates (continued) |
|
|
|
|
|
|
|
|
|
|
|
|
|
|
|
|
|
|
|
|
|
|
|
|
|
|
|
|
|
| |
|
|
|
|
|
|
|
|
|
|
|
|
|
|
|
|
|
|
SHBNPP Senior Loan Professional Investment Type Private Mixed Asset Investment Trust No.2 |
|
|
10,236 |
|
|
|
(5,292 |
) |
|
|
(1,975 |
) |
|
|
— |
|
|
|
— |
|
|
|
2,969 |
|
T&F 2019 bearing Private Equity Fund Specializing in Start-up and Venture Business |
|
|
2,864 |
|
|
|
— |
|
|
|
367 |
|
|
|
— |
|
|
|
— |
|
|
|
3,231 |
|
| Cape IT Fund No.3 |
|
|
10,065 |
|
|
|
(10,580 |
) |
|
|
515 |
|
|
|
— |
|
|
|
— |
|
|
|
— |
|
| FuturePlay-Shinhan TechInnovation Fund 1 |
|
|
7,149 |
|
|
|
— |
|
|
|
(233 |
) |
|
|
— |
|
|
|
— |
|
|
|
6,916 |
|
| Stonebridge Corporate 1st Fund |
|
|
2,964 |
|
|
|
— |
|
|
|
658 |
|
|
|
— |
|
|
|
— |
|
|
|
3,622 |
|
| Vogo Realty Partners Private Real Estate Fund V |
|
|
10,766 |
|
|
|
(638 |
) |
|
|
787 |
|
|
|
— |
|
|
|
— |
|
|
|
10,915 |
|
| Korea Credit Bureau |
|
|
7,695 |
|
|
|
— |
|
|
|
(2,656 |
) |
|
|
— |
|
|
|
— |
|
|
|
5,039 |
|
| Goduck Gangil1 PFV Co., Ltd. |
|
|
— |
|
|
|
— |
|
|
|
60 |
|
|
|
— |
|
|
|
— |
|
|
|
60 |
|
| SBC PFV Co., Ltd. |
|
|
29,586 |
|
|
|
— |
|
|
|
(1,118 |
) |
|
|
— |
|
|
|
— |
|
|
|
28,468 |
|
NH-amundi global infra private fund 16 |
|
|
52,008 |
|
|
|
(15,362 |
) |
|
|
19,565 |
|
|
|
— |
|
|
|
— |
|
|
|
56,211 |
|
| IMM Global Private Equity Fund |
|
|
118,615 |
|
|
|
19,045 |
|
|
|
9,724 |
|
|
|
— |
|
|
|
— |
|
|
|
147,384 |
|
|
|
|
|
|
|
|
|
|
|
|
|
|
|
|
|
|
|
|
|
|
|
|
|
|
| HANA Alternative Eastate Professional Private122 |
|
|
29,489 |
|
|
|
(28,570 |
) |
|
|
(918 |
) |
|
|
— |
|
|
|
— |
|
|
|
1 |
|
| SHBNPP Corporate Professional Investment Type Private Security Investment Trust No.7 |
|
|
49,899 |
|
|
|
(50,540 |
) |
|
|
641 |
|
|
|
— |
|
|
|
— |
|
|
|
— |
|
| SHBNPP BNCT Professional Investment Type Private Special Asset Investment Trust |
|
|
282,199 |
|
|
|
(24,838 |
) |
|
|
5,691 |
|
|
|
— |
|
|
|
— |
|
|
|
263,052 |
|
| Deutsche Global Professional Investment Type Private Real Estate Investment Trust No. 24 |
|
|
28,312 |
|
|
|
(6,937 |
) |
|
|
1,308 |
|
|
|
— |
|
|
|
— |
|
|
|
22,683 |
|
| Sparklabs-Shinhan Opportunity Fund 1 |
|
|
4,640 |
|
|
|
(826 |
) |
|
|
817 |
|
|
|
— |
|
|
|
— |
|
|
|
4,631 |
|
| BNW Tech-Innovation Private Equity Fund |
|
|
5,881 |
|
|
|
— |
|
|
|
(48 |
) |
|
|
— |
|
|
|
— |
|
|
|
5,833 |
|
| IGIS Real-estate Private Investment Trust No.33 |
|
|
13,884 |
|
|
|
(715 |
) |
|
|
1,383 |
|
|
|
— |
|
|
|
— |
|
|
|
14,552 |
|
| WWG Global Real Estate Investment Trust no.4 |
|
|
10,644 |
|
|
|
(659 |
) |
|
|
346 |
|
|
|
— |
|
|
|
— |
|
|
|
10,331 |
|
| Goduck Gangil10 PFV Co., Ltd. |
|
|
— |
|
|
|
— |
|
|
|
3,236 |
|
|
|
— |
|
|
|
— |
|
|
|
3,236 |
|
| Fidelis Global Private Real Estate Trust No.2 |
|
|
19,773 |
|
|
|
2,183 |
|
|
|
(11 |
) |
|
|
— |
|
|
|
— |
|
|
|
21,945 |
|
| AIP EURO PRIVATE REAL ESTATE TRUST No. 12 |
|
|
49,217 |
|
|
|
(5,640 |
) |
|
|
4,850 |
|
|
|
— |
|
|
|
— |
|
|
|
48,427 |
|
SHINHAN FINANCIAL GROUP CO., LTD. AND SUBSIDIARIES
Notes to the Consolidated Financial Statements
|
Investments in associates (continued) |
|
|
|
|
|
|
|
|
|
|
|
|
|
|
|
|
|
|
|
|
|
|
|
|
|
|
|
|
|
| |
|
|
|
|
|
|
|
|
|
|
|
|
|
|
|
|
|
|
Shinhan Global Healthcare Fund 2 (*1) |
|
|
— |
|
|
|
— |
|
|
|
— |
|
|
|
— |
|
|
|
— |
|
|
|
— |
|
Pebblestone CGV Private Real Estate Trust No.1 |
|
|
13,710 |
|
|
|
(13,971 |
) |
|
|
261 |
|
|
|
— |
|
|
|
— |
|
|
|
— |
|
SH Corporate Professional Investment Type Private Security Investment Trust No.45 |
|
|
173,955 |
|
|
|
(173,955 |
) |
|
|
— |
|
|
|
— |
|
|
|
— |
|
|
|
— |
|
Shinhan AIM Real Estate Fund No.2 |
|
|
23,275 |
|
|
|
3,346 |
|
|
|
(1,378 |
) |
|
|
— |
|
|
|
— |
|
|
|
25,243 |
|
Shinhan AIM Real Estate Fund No.1 |
|
|
44,312 |
|
|
|
(2,176 |
) |
|
|
2,506 |
|
|
|
— |
|
|
|
— |
|
|
|
44,642 |
|
SHBNPP Daegu Green Power Cogeneration System Professional Investment Type Private Special Asset Investment Trust |
|
|
32,948 |
|
|
|
(915 |
) |
|
|
594 |
|
|
|
— |
|
|
|
— |
|
|
|
32,627 |
|
SHBNPP Sangju YC Expressway Professional Investment Type Private Special Asset Investment Trust |
|
|
20,550 |
|
|
|
6 |
|
|
|
(1,260 |
) |
|
|
— |
|
|
|
— |
|
|
|
19,296 |
|
SHBNPP Global Infrastructure Professional Investment Type Private Special Asset Investment Trust No.7-2 |
|
|
18,855 |
|
|
|
5,114 |
|
|
|
629 |
|
|
|
— |
|
|
|
— |
|
|
|
24,598 |
|
Korea Omega-Shinhan Project Fund I |
|
|
7,244 |
|
|
|
2,000 |
|
|
|
778 |
|
|
|
— |
|
|
|
— |
|
|
|
10,022 |
|
| |
|
|
3,359 |
|
|
|
(621 |
) |
|
|
(107 |
) |
|
|
— |
|
|
|
— |
|
|
|
2,631 |
|
| Samsung SRA Real Estate Professional Private 45[FoFs] |
|
|
12,880 |
|
|
|
5,279 |
|
|
|
3,491 |
|
|
|
— |
|
|
|
— |
|
|
|
21,650 |
|
| IBK Global New Renewable Energy Special Asset Professional Private2 |
|
|
31,887 |
|
|
|
(2,516 |
) |
|
|
4,041 |
|
|
|
— |
|
|
|
— |
|
|
|
33,412 |
|
| VS Cornerstone Fund |
|
|
3,410 |
|
|
|
— |
|
|
|
(75 |
) |
|
|
— |
|
|
|
— |
|
|
|
3,335 |
|
| Aone Mezzanine Opportunity Professional Private |
|
|
9,540 |
|
|
|
(5,084 |
) |
|
|
553 |
|
|
|
— |
|
|
|
— |
|
|
|
5,009 |
|
NH-Amundi US Infrastructure Private Fund2 |
|
|
27,024 |
|
|
|
2,446 |
|
|
|
2,471 |
|
|
|
— |
|
|
|
— |
|
|
|
31,941 |
|
| KB Distribution Private Real Estate1 |
|
|
30,694 |
|
|
|
(30,694 |
) |
|
|
— |
|
|
|
— |
|
|
|
— |
|
|
|
— |
|
| SHBNPP Japan Photovoltaic Private Special Asset Investment Trust No.2 |
|
|
13,016 |
|
|
|
(7,291 |
) |
|
|
607 |
|
|
|
— |
|
|
|
— |
|
|
|
6,332 |
|
| Kakao-Shinhan 1st TNYT Fund |
|
|
14,497 |
|
|
|
— |
|
|
|
6,833 |
|
|
|
— |
|
|
|
— |
|
|
|
21,330 |
|
IMM Special Situation 1-2 PRIVATE EQUITY FUND |
|
|
11,593 |
|
|
|
(8,690 |
) |
|
|
(300 |
) |
|
|
— |
|
|
|
— |
|
|
|
2,603 |
|
| Pacific Private Placement Real Estate Fund No.40 |
|
|
11,598 |
|
|
|
(748 |
) |
|
|
772 |
|
|
|
— |
|
|
|
— |
|
|
|
11,622 |
|
| Mastern Private Real Estate Loan Fund No.2 |
|
|
7,491 |
|
|
|
(1,359 |
) |
|
|
255 |
|
|
|
— |
|
|
|
— |
|
|
|
6,387 |
|
SHINHAN FINANCIAL GROUP CO., LTD. AND SUBSIDIARIES
Notes to the Consolidated Financial Statements
|
Investments in associates (continued) |
|
|
|
|
|
|
|
|
|
|
|
|
|
|
|
|
|
|
|
|
|
|
|
|
|
|
|
|
|
| |
|
|
|
|
|
|
|
|
|
|
|
|
|
|
|
|
|
|
LB Scotland Amazon Fulfillment Center Fund 29 |
|
|
31,268 |
|
|
|
(2,189 |
) |
|
|
558 |
|
|
|
— |
|
|
|
— |
|
|
|
29,637 |
|
| JR AMC Hungary Budapest Office Fund 16 |
|
|
12,140 |
|
|
|
(821 |
) |
|
|
1,138 |
|
|
|
— |
|
|
|
— |
|
|
|
12,457 |
|
| EDNCENTRAL Co.,Ltd. (*1) |
|
|
— |
|
|
|
— |
|
|
|
— |
|
|
|
— |
|
|
|
— |
|
|
|
— |
|
| Future-Creation Neoplux Venture Capital Fund |
|
|
3,017 |
|
|
|
— |
|
|
|
1,234 |
|
|
|
— |
|
|
|
— |
|
|
|
4,251 |
|
| Gyeonggi-Neoplux Superman Fund |
|
|
7,878 |
|
|
|
(1,195 |
) |
|
|
(1,216 |
) |
|
|
— |
|
|
|
— |
|
|
|
5,467 |
|
| NewWave 6th Fund |
|
|
14,455 |
|
|
|
— |
|
|
|
(915 |
) |
|
|
— |
|
|
|
— |
|
|
|
13,540 |
|
KTC-NP Growth Champ 2011-2 Private Equity Fund |
|
|
3,990 |
|
|
|
(2,490 |
) |
|
|
(293 |
) |
|
|
— |
|
|
|
— |
|
|
|
1,207 |
|
| Neoplux No.3 Private Equity Fund |
|
|
22,601 |
|
|
|
(2 |
) |
|
|
(2,145 |
) |
|
|
— |
|
|
|
— |
|
|
|
20,454 |
|
| PCC Amberstone Private Equity Fund I |
|
|
22,790 |
|
|
|
(2,509 |
) |
|
|
(1,496 |
) |
|
|
— |
|
|
|
— |
|
|
|
18,785 |
|
| KIAMCO POWERLOAN TRUST 4TH |
|
|
45,301 |
|
|
|
(2,305 |
) |
|
|
528 |
|
|
|
— |
|
|
|
— |
|
|
|
43,524 |
|
| Mastern Opportunity Seeking Real Estate Fund II |
|
|
21,317 |
|
|
|
(6,457 |
) |
|
|
(150 |
) |
|
|
— |
|
|
|
— |
|
|
|
14,710 |
|
| AION ELFIS PROFESSIONAL PRIVATE 1 |
|
|
4,422 |
|
|
|
232 |
|
|
|
(1,088 |
) |
|
|
— |
|
|
|
— |
|
|
|
3,566 |
|
T&F 2020 SS Private Equity Fund Specializing in Start-up and Venture Business |
|
|
4,360 |
|
|
|
(1,732 |
) |
|
|
3,081 |
|
|
|
— |
|
|
|
— |
|
|
|
5,709 |
|
| Neoplux Market-Frontier Secondary Fund |
|
|
11,313 |
|
|
|
(653 |
) |
|
|
3,300 |
|
|
|
— |
|
|
|
— |
|
|
|
13,960 |
|
|
|
|
|
|
|
|
|
|
|
|
|
|
|
|
|
|
|
|
|
|
|
|
|
|
| Harvest Private Equity Fund II |
|
|
3,481 |
|
|
|
(159 |
) |
|
|
(183 |
) |
|
|
— |
|
|
|
— |
|
|
|
3,139 |
|
| Synergy Green New Deal 1st New Technology Business Investment Fund |
|
|
9,684 |
|
|
|
(146 |
) |
|
|
1,094 |
|
|
|
— |
|
|
|
— |
|
|
|
10,632 |
|
| KAIM Real-estate Private Investment Trust 20 |
|
|
5,048 |
|
|
|
(4,176 |
) |
|
|
315 |
|
|
|
— |
|
|
|
— |
|
|
|
1,187 |
|
| KIAMCO Vietnam Solar Special Asset Private Investment Trust |
|
|
7,527 |
|
|
|
(2,019 |
) |
|
|
1,219 |
|
|
|
— |
|
|
|
— |
|
|
|
6,727 |
|
| Daishin New Technology Investment Fund 5th |
|
|
4,439 |
|
|
|
(844 |
) |
|
|
(1,165 |
) |
|
|
— |
|
|
|
— |
|
|
|
2,430 |
|
| CSQUARE SNIPER PROFESSIONAL PRIVATE 10 |
|
|
3,247 |
|
|
|
(3,806 |
) |
|
|
559 |
|
|
|
— |
|
|
|
— |
|
|
|
— |
|
| Acurus Hyundai Investment Partners New Technology |
|
|
4,714 |
|
|
|
(3,979 |
) |
|
|
(735 |
) |
|
|
— |
|
|
|
— |
|
|
|
— |
|
IGIS GLIP Professional Investment Private Real Estate Investment Trust No. 1-1 |
|
|
63,944 |
|
|
|
(60,279 |
) |
|
|
— |
|
|
|
(3,665 |
) |
|
|
— |
|
|
|
— |
|
SHINHAN FINANCIAL GROUP CO., LTD. AND SUBSIDIARIES
Notes to the Consolidated Financial Statements
|
Investments in associates (continued) |
|
|
|
|
|
|
|
|
|
|
|
|
|
|
|
|
|
|
|
|
|
|
|
|
|
|
|
|
|
| |
|
|
|
|
|
|
|
|
|
|
|
|
|
|
|
|
|
|
IGIS GLIP Professional Investment Private Real Estate Investment Trust No. 1-2 |
|
|
63,944 |
|
|
|
(60,279 |
) |
|
|
— |
|
|
|
(3,665 |
) |
|
|
— |
|
|
|
— |
|
| Pacific Sunny Professional Investors Private Placement Real Estate Investment Company No.45 |
|
|
14,778 |
|
|
|
(14,778 |
) |
|
|
— |
|
|
|
— |
|
|
|
— |
|
|
|
— |
|
SHINHAN-NEO Core Industrial Technology Fund |
|
|
5,691 |
|
|
|
3,960 |
|
|
|
(242 |
) |
|
|
— |
|
|
|
— |
|
|
|
9,409 |
|
| SHBNPP Green New Deal Energy Professional Investment Type Private Special Asset Investment Trust No.2 |
|
|
27,243 |
|
|
|
(2,559 |
) |
|
|
340 |
|
|
|
— |
|
|
|
— |
|
|
|
25,024 |
|
| SIMONE Mezzanine Fund No.3 |
|
|
3,054 |
|
|
|
4 |
|
|
|
(41 |
) |
|
|
— |
|
|
|
— |
|
|
|
3,017 |
|
| Eum Private Equity Fund No.7 |
|
|
7,873 |
|
|
|
(86 |
) |
|
|
1,383 |
|
|
|
— |
|
|
|
— |
|
|
|
9,170 |
|
Kiwoom Private Equity Ant-Man Startup Venture Specialized Private Equity Fund |
|
|
7,594 |
|
|
|
(4,870 |
) |
|
|
(2,724 |
) |
|
|
— |
|
|
|
— |
|
|
|
— |
|
| Kiwoom Hero No.4 Private Equity Fund |
|
|
4,305 |
|
|
|
— |
|
|
|
(788 |
) |
|
|
— |
|
|
|
— |
|
|
|
3,517 |
|
| Vogo Canister Professional Trust Private Fund I |
|
|
41,072 |
|
|
|
2,103 |
|
|
|
3,154 |
|
|
|
— |
|
|
|
— |
|
|
|
46,329 |
|
| SW-S Fund |
|
|
6,724 |
|
|
|
— |
|
|
|
524 |
|
|
|
— |
|
|
|
— |
|
|
|
7,248 |
|
| CL Buyout 1st PEF |
|
|
13,791 |
|
|
|
273 |
|
|
|
(1,222 |
) |
|
|
— |
|
|
|
— |
|
|
|
12,842 |
|
Timefolio The Venture-V second |
|
|
4,572 |
|
|
|
— |
|
|
|
(476 |
) |
|
|
— |
|
|
|
— |
|
|
|
4,096 |
|
| Newlake Growth Capital Partners2 PEF |
|
|
12,921 |
|
|
|
(177 |
) |
|
|
(248 |
) |
|
|
— |
|
|
|
— |
|
|
|
12,496 |
|
| Shinhan Smilegate Global PEF I |
|
|
3,336 |
|
|
|
(1,828 |
) |
|
|
2,263 |
|
|
|
— |
|
|
|
— |
|
|
|
3,771 |
|
| Fount Professional Investors Private Investment Trust No.3 |
|
|
5,197 |
|
|
|
(5,197 |
) |
|
|
— |
|
|
|
— |
|
|
|
— |
|
|
|
— |
|
| |
|
|
11,130 |
|
|
|
195 |
|
|
|
93 |
|
|
|
— |
|
|
|
— |
|
|
|
11,418 |
|
SHINHAN-NEO Market-Frontier 2nd Fund |
|
|
24,606 |
|
|
|
8,540 |
|
|
|
1,274 |
|
|
|
— |
|
|
|
— |
|
|
|
34,420 |
|
NH-Synergy Core Industrial New Technology Fund |
|
|
6,437 |
|
|
|
— |
|
|
|
(60 |
) |
|
|
— |
|
|
|
— |
|
|
|
6,377 |
|
J& Moorim Jade Investment Fund |
|
|
5,540 |
|
|
|
(385 |
) |
|
|
279 |
|
|
|
— |
|
|
|
— |
|
|
|
5,434 |
|
Helios-KDBC Digital Contents 1st |
|
|
1,695 |
|
|
|
1,720 |
|
|
|
(59 |
) |
|
|
— |
|
|
|
— |
|
|
|
3,356 |
|
Ulmus SHC innovation investment fund |
|
|
5,192 |
|
|
|
— |
|
|
|
(306 |
) |
|
|
— |
|
|
|
— |
|
|
|
4,886 |
|
Mirae Asset Partners X Private Equity Fund |
|
|
7,858 |
|
|
|
— |
|
|
|
(66 |
) |
|
|
— |
|
|
|
— |
|
|
|
7,792 |
|
T Core Industrial Technology 1st Venture PEF |
|
|
4,535 |
|
|
|
— |
|
|
|
(6 |
) |
|
|
— |
|
|
|
— |
|
|
|
4,529 |
|
SHINHAN FINANCIAL GROUP CO., LTD. AND SUBSIDIARIES
Notes to the Consolidated Financial Statements
|
Investments in associates (continued) |
|
|
|
|
|
|
|
|
|
|
|
|
|
|
|
|
|
|
|
|
|
|
|
|
|
|
|
|
|
| |
|
|
|
|
|
|
|
|
|
|
|
|
|
|
|
|
|
|
Curious Finale Corporate Recovery Private Equity Fund |
|
|
3,690 |
|
|
|
(245 |
) |
|
|
146 |
|
|
|
— |
|
|
|
— |
|
|
|
3,591 |
|
| TI First Property Private Investment Trust 1 |
|
|
3,055 |
|
|
|
(101 |
) |
|
|
173 |
|
|
|
— |
|
|
|
— |
|
|
|
3,127 |
|
| MPLUS Professional Private Real Estate Fund 25 |
|
|
3,290 |
|
|
|
655 |
|
|
|
286 |
|
|
|
— |
|
|
|
— |
|
|
|
4,231 |
|
| IBKC Global Contents Investment Fund |
|
|
4,943 |
|
|
|
— |
|
|
|
(391 |
) |
|
|
— |
|
|
|
— |
|
|
|
4,552 |
|
| Nautic Smart No.6 Private Equity Fund |
|
|
3,974 |
|
|
|
(3,752 |
) |
|
|
956 |
|
|
|
— |
|
|
|
— |
|
|
|
1,178 |
|
| Premier Luminous Private Equity Fund |
|
|
6,991 |
|
|
|
(2,314 |
) |
|
|
4,289 |
|
|
|
— |
|
|
|
— |
|
|
|
8,966 |
|
| Hanyang-Meritz 1 Fund |
|
|
3,483 |
|
|
|
— |
|
|
|
(17 |
) |
|
|
— |
|
|
|
— |
|
|
|
3,466 |
|
| KNT 2ND PRIVATE EQUITY FUND |
|
|
4,157 |
|
|
|
(3,000 |
) |
|
|
(207 |
) |
|
|
— |
|
|
|
— |
|
|
|
950 |
|
| Kiwoom-Shinhan Innovation Fund 2 |
|
|
2,677 |
|
|
|
9,000 |
|
|
|
(406 |
) |
|
|
— |
|
|
|
— |
|
|
|
11,271 |
|
| Maple Mobility Fund |
|
|
8,683 |
|
|
|
91 |
|
|
|
8,085 |
|
|
|
— |
|
|
|
— |
|
|
|
16,859 |
|
| SJ ESG Innovative Growth Fund |
|
|
2,998 |
|
|
|
— |
|
|
|
1,199 |
|
|
|
— |
|
|
|
— |
|
|
|
4,197 |
|
| AVES 1st Corporate Recovery Private Equity Fund |
|
|
4,736 |
|
|
|
— |
|
|
|
321 |
|
|
|
— |
|
|
|
— |
|
|
|
5,057 |
|
| JS Shinhan Private Equity Fund |
|
|
5,037 |
|
|
|
— |
|
|
|
(84 |
) |
|
|
— |
|
|
|
— |
|
|
|
4,953 |
|
| NH Kyobo AI Solution Investment Fund |
|
|
2,973 |
|
|
|
— |
|
|
|
315 |
|
|
|
— |
|
|
|
— |
|
|
|
3,288 |
|
| Daishin Newgen New Technology Investment Fund 1st |
|
|
12,169 |
|
|
|
(2,277 |
) |
|
|
(4,188 |
) |
|
|
— |
|
|
|
— |
|
|
|
5,704 |
|
| META ESG Private Equity Fund I |
|
|
5,677 |
|
|
|
— |
|
|
|
180 |
|
|
|
— |
|
|
|
— |
|
|
|
5,857 |
|
| |
|
|
9,646 |
|
|
|
— |
|
|
|
(518 |
) |
|
|
— |
|
|
|
— |
|
|
|
9,128 |
|
| PHAROS DK FUND |
|
|
3,949 |
|
|
|
— |
|
|
|
(114 |
) |
|
|
— |
|
|
|
— |
|
|
|
3,835 |
|
| Shinhan VC tomorrow venture fund 1 |
|
|
9,042 |
|
|
|
18,226 |
|
|
|
(342 |
) |
|
|
— |
|
|
|
— |
|
|
|
26,926 |
|
| |
|
|
4,899 |
|
|
|
— |
|
|
|
(73 |
) |
|
|
— |
|
|
|
— |
|
|
|
4,826 |
|
| |
|
|
9,728 |
|
|
|
(88 |
) |
|
|
(17 |
) |
|
|
— |
|
|
|
— |
|
|
|
9,623 |
|
| Stonebridge-Shinhan Unicorn Secondary Fund |
|
|
2,074 |
|
|
|
4,160 |
|
|
|
(152 |
) |
|
|
— |
|
|
|
— |
|
|
|
6,082 |
|
| Tres-Yujin Trust |
|
|
9,995 |
|
|
|
(546 |
) |
|
|
555 |
|
|
|
— |
|
|
|
— |
|
|
|
10,004 |
|
| Shinhan-Time mezzanine blind Fund |
|
|
14,942 |
|
|
|
— |
|
|
|
(1,630 |
) |
|
|
— |
|
|
|
— |
|
|
|
13,312 |
|
| Capstone REITs No.26 |
|
|
4,395 |
|
|
|
(300 |
) |
|
|
(243 |
) |
|
|
— |
|
|
|
— |
|
|
|
3,852 |
|
| JB Incheon-Bucheon REITS No.54 |
|
|
4,999 |
|
|
|
— |
|
|
|
(10 |
) |
|
|
— |
|
|
|
— |
|
|
|
4,989 |
|
| Hankook Smart Real Asset Investment Trust No.3 |
|
|
4,342 |
|
|
|
2,195 |
|
|
|
456 |
|
|
|
— |
|
|
|
— |
|
|
|
6,993 |
|
| JB Hwaseong-Hadong REITs No.53 |
|
|
4,999 |
|
|
|
— |
|
|
|
(8 |
) |
|
|
— |
|
|
|
— |
|
|
|
4,991 |
|
| KB Oaktree Trust No.3 |
|
|
3,159 |
|
|
|
5,376 |
|
|
|
70 |
|
|
|
— |
|
|
|
— |
|
|
|
8,605 |
|
| Daehan No.36 Office Asset Management Company |
|
|
21,500 |
|
|
|
(635 |
) |
|
|
1,193 |
|
|
|
— |
|
|
|
— |
|
|
|
22,058 |
|
SHINHAN FINANCIAL GROUP CO., LTD. AND SUBSIDIARIES
Notes to the Consolidated Financial Statements
|
Investments in associates (continued) |
|
|
|
|
|
|
|
|
|
|
|
|
|
|
|
|
|
|
|
|
|
|
|
|
|
|
|
|
|
| |
|
|
|
|
|
|
|
|
|
|
|
|
|
|
|
|
|
|
Rhinos Premier Mezzanine Private Investment Fund No.1 |
|
|
3,005 |
|
|
|
— |
|
|
|
(132 |
) |
|
|
— |
|
|
|
— |
|
|
|
2,873 |
|
| SH Real Estate Loan Investment Type Private Real Estate Investment Trust No.2 |
|
|
19,903 |
|
|
|
35,762 |
|
|
|
1,669 |
|
|
|
— |
|
|
|
— |
|
|
|
57,334 |
|
| Shinhan JigaeNamsan Road Private Special Asset Investment Trust |
|
|
40,105 |
|
|
|
(795 |
) |
|
|
1,261 |
|
|
|
— |
|
|
|
— |
|
|
|
40,571 |
|
| |
|
|
5,945 |
|
|
|
— |
|
|
|
654 |
|
|
|
— |
|
|
|
— |
|
|
|
6,599 |
|
| IBKC-METIS Global Contents Investment Fund |
|
|
4,000 |
|
|
|
— |
|
|
|
550 |
|
|
|
— |
|
|
|
— |
|
|
|
4,550 |
|
| Keistone Unicorn Private Equity Fund |
|
|
6,300 |
|
|
|
— |
|
|
|
(51 |
) |
|
|
— |
|
|
|
— |
|
|
|
6,249 |
|
KB Distribution Private Real Estate 3-1 |
|
|
— |
|
|
|
24,000 |
|
|
|
2,651 |
|
|
|
— |
|
|
|
— |
|
|
|
26,651 |
|
Pacific Private Investment Trust No.49-1 |
|
|
— |
|
|
|
28,000 |
|
|
|
641 |
|
|
|
— |
|
|
|
— |
|
|
|
28,641 |
|
| KIWOOM Real estate private placement fund for normal investors No. 31 |
|
|
— |
|
|
|
8,474 |
|
|
|
84 |
|
|
|
— |
|
|
|
— |
|
|
|
8,558 |
|
| RIFA Real estate private placement fund for normal investoes No. 51 |
|
|
— |
|
|
|
5,650 |
|
|
|
76 |
|
|
|
— |
|
|
|
— |
|
|
|
5,726 |
|
| Fivetree general private equity fund No.15 |
|
|
— |
|
|
|
11,995 |
|
|
|
286 |
|
|
|
— |
|
|
|
— |
|
|
|
12,281 |
|
| Shinhan-Kunicorn first Fund |
|
|
— |
|
|
|
10,000 |
|
|
|
(169 |
) |
|
|
— |
|
|
|
— |
|
|
|
9,831 |
|
| Harvest Fund No.3 |
|
|
— |
|
|
|
13,000 |
|
|
|
2,854 |
|
|
|
— |
|
|
|
— |
|
|
|
15,854 |
|
| Shinhan Simone Fund I |
|
|
— |
|
|
|
5,000 |
|
|
|
(204 |
) |
|
|
— |
|
|
|
— |
|
|
|
4,796 |
|
| Korea Investment develop seed Trust No.1 |
|
|
— |
|
|
|
9,562 |
|
|
|
680 |
|
|
|
— |
|
|
|
— |
|
|
|
10,242 |
|
| Tiger Green alpah Trust No.29 |
|
|
— |
|
|
|
26,180 |
|
|
|
626 |
|
|
|
— |
|
|
|
— |
|
|
|
26,806 |
|
| STIC ALT Global II Private Equity Fund |
|
|
— |
|
|
|
10,000 |
|
|
|
(141 |
) |
|
|
— |
|
|
|
— |
|
|
|
9,859 |
|
| |
|
|
— |
|
|
|
13,000 |
|
|
|
(1,408 |
) |
|
|
— |
|
|
|
— |
|
|
|
11,592 |
|
| DDI LVC Master Real Estate Investment Trust Co., Ltd. |
|
|
— |
|
|
|
6,625 |
|
|
|
(220 |
) |
|
|
— |
|
|
|
— |
|
|
|
6,405 |
|
| Find-Green New Deal 2nd Equity Fund |
|
|
— |
|
|
|
4,549 |
|
|
|
(41 |
) |
|
|
— |
|
|
|
— |
|
|
|
4,508 |
|
| ShinhanFitrin 1st Technology Business Investment Association |
|
|
— |
|
|
|
4,850 |
|
|
|
(413 |
) |
|
|
— |
|
|
|
— |
|
|
|
4,437 |
|
| PARATUS No.3 Private Equity Fund |
|
|
— |
|
|
|
5,000 |
|
|
|
(64 |
) |
|
|
— |
|
|
|
— |
|
|
|
4,936 |
|
| Golden Route 2nd Startup Venture Specialized Private Equity Fund |
|
|
— |
|
|
|
3,000 |
|
|
|
3 |
|
|
|
— |
|
|
|
— |
|
|
|
3,003 |
|
| Koramco Private Real Estate Fund 143 |
|
|
— |
|
|
|
3,030 |
|
|
|
— |
|
|
|
— |
|
|
|
— |
|
|
|
3,030 |
|
SHINHAN FINANCIAL GROUP CO., LTD. AND SUBSIDIARIES
Notes to the Consolidated Financial Statements
(In millions of won)
|
Investments in associates (continued) |
|
|
|
|
|
|
|
|
|
|
|
|
|
|
|
|
|
|
|
|
|
|
|
|
|
|
|
|
|
| |
|
|
|
|
|
|
|
|
|
|
|
|
|
|
|
|
|
|
| Korea Investment Top Mezzanine Private Real Esate
Trust No.1 |
|
W |
— |
|
|
|
8,884 |
|
|
|
1,001 |
|
|
|
— |
|
|
|
— |
|
|
|
9,885 |
|
| LB YoungNam Logistics Private Trust No.40 |
|
|
— |
|
|
|
9,706 |
|
|
|
42 |
|
|
|
— |
|
|
|
— |
|
|
|
9,748 |
|
Shinhan-Cognitive Start-up Fund L.P. |
|
|
— |
|
|
|
9,200 |
|
|
|
753 |
|
|
|
— |
|
|
|
— |
|
|
|
9,953 |
|
| IGEN2022 No.1 private Equity Fund |
|
|
— |
|
|
|
8,280 |
|
|
|
765 |
|
|
|
— |
|
|
|
— |
|
|
|
9,045 |
|
| Cornerstone J&M Fund I |
|
|
— |
|
|
|
3,600 |
|
|
|
(39 |
) |
|
|
— |
|
|
|
— |
|
|
|
3,561 |
|
| Logisvalley Shinhan REIT Co.,Ltd. |
|
|
— |
|
|
|
3,880 |
|
|
|
(60 |
) |
|
|
(16 |
) |
|
|
— |
|
|
|
3,804 |
|
| KDB Investment Global Healthcare Private Equity Fund I |
|
|
— |
|
|
|
35,000 |
|
|
|
(532 |
) |
|
|
— |
|
|
|
— |
|
|
|
34,468 |
|
| Korea Investment Green Newdeal Infra Trust No.1 |
|
|
— |
|
|
|
5,734 |
|
|
|
(20 |
) |
|
|
— |
|
|
|
— |
|
|
|
5,714 |
|
| BTS 2nd Private Equity Fund |
|
|
— |
|
|
|
3,934 |
|
|
|
(162 |
) |
|
|
— |
|
|
|
— |
|
|
|
3,772 |
|
| Shinhan Global Active REIT Co.Ltd. |
|
|
— |
|
|
|
19,900 |
|
|
|
(678 |
) |
|
|
— |
|
|
|
— |
|
|
|
19,222 |
|
NH-J&-IBKC Label Technology Fund |
|
|
— |
|
|
|
9,976 |
|
|
|
(110 |
) |
|
|
— |
|
|
|
— |
|
|
|
9,866 |
|
| IMM Global Venture Opportunity, LP |
|
|
— |
|
|
|
3,115 |
|
|
|
— |
|
|
|
— |
|
|
|
— |
|
|
|
3,115 |
|
| Capstone Develop Frontier Trust |
|
|
— |
|
|
|
6,857 |
|
|
|
— |
|
|
|
— |
|
|
|
— |
|
|
|
6,857 |
|
| Nextrade Co., Ltd. |
|
|
— |
|
|
|
9,700 |
|
|
|
— |
|
|
|
— |
|
|
|
— |
|
|
|
9,700 |
|
| SH Sustainable Management ESG Short term Bond Security Feeder Investment Trust No.1 |
|
|
— |
|
|
|
3,000 |
|
|
|
11 |
|
|
|
— |
|
|
|
— |
|
|
|
3,011 |
|
| SH 1.5years Maturity Investment Type Security Investment Trust No.2 |
|
|
— |
|
|
|
4,600 |
|
|
|
1 |
|
|
|
— |
|
|
|
— |
|
|
|
4,601 |
|
| Eventus-IBKC LIB Fund |
|
|
— |
|
|
|
7,000 |
|
|
|
(965 |
) |
|
|
— |
|
|
|
— |
|
|
|
6,035 |
|
NH-Daishin-Kyobo healthcare 1 Fund |
|
|
— |
|
|
|
4,000 |
|
|
|
(52 |
) |
|
|
— |
|
|
|
— |
|
|
|
3,948 |
|
| IBKC-Behigh Fund 1st |
|
|
— |
|
|
|
3,300 |
|
|
|
(32 |
) |
|
|
— |
|
|
|
— |
|
|
|
3,268 |
|
Nautic Green Innovation ESG Co-investment No.1 Private Equity Fund |
|
|
— |
|
|
|
4,000 |
|
|
|
(44 |
) |
|
|
— |
|
|
|
— |
|
|
|
3,956 |
|
| ON No.1 Private Equity Fund |
|
|
— |
|
|
|
6,000 |
|
|
|
(638 |
) |
|
|
— |
|
|
|
— |
|
|
|
5,362 |
|
| Digital New Deal Kappa Private Equity Fund |
|
|
— |
|
|
|
5,000 |
|
|
|
(54 |
) |
|
|
— |
|
|
|
— |
|
|
|
4,946 |
|
| Others |
|
|
170,811 |
|
|
|
50,920 |
|
|
|
12,089 |
|
|
|
— |
|
|
|
(3,598 |
) |
|
|
230,222 |
|
| |
|
|
|
|
|
|
|
|
|
|
|
|
|
|
|
|
|
|
|
|
|
|
|
|
| |
|
W |
2,913,745 |
|
|
|
(105,125 |
) |
|
|
121,697 |
|
|
|
(24,238 |
) |
|
|
(1,605 |
) |
|
|
2,904,474 |
|
| |
|
|
|
|
|
|
|
|
|
|
|
|
|
|
|
|
|
|
|
|
|
|
|
|
|
(*1) |
The Group has stopped recognizing its equity method income or loss due to the carrying value of ‘0’ resulting from the investees’ cumulative loss. |
|
(*2) |
For the year ended December 31, 2022, it is incorporated into the consolidation target as the Group held control due to increased equity ratio and BNP Paribas Cardif General Insurance, Ltd. has changed its name to Shinhan EZ General Insurance, Ltd. |
SHINHAN FINANCIAL GROUP CO., LTD. AND SUBSIDIARIES
Notes to the Consolidated Financial Statements
(In millions of won)
|
Investments in associates (continued) |
| |
(c) |
The statement of financial information as of and for the years ended December 31, 2021 and 2022 are as follows: |
|
|
|
|
|
|
|
|
|
|
|
|
|
|
|
|
|
|
|
|
|
|
|
|
|
|
|
|
|
| |
|
|
|
|
|
|
|
|
|
|
|
|
|
|
|
|
|
|
| BNP Paribas Cardif Life Insurance |
|
W |
3,268,153 |
|
|
|
2,974,519 |
|
|
|
48,207 |
|
|
|
(4,499 |
) |
|
|
(39,454 |
) |
|
|
(43,953 |
) |
| Songrim Partners |
|
|
1,003 |
|
|
|
1,065 |
|
|
|
548 |
|
|
|
— |
|
|
|
— |
|
|
|
— |
|
| Partners 4th Growth Investment Fund |
|
|
60,073 |
|
|
|
7,939 |
|
|
|
52,019 |
|
|
|
50,100 |
|
|
|
18,774 |
|
|
|
68,874 |
|
| KTB Newlake Global Healthcare PEF |
|
|
30,969 |
|
|
|
161 |
|
|
|
552 |
|
|
|
27 |
|
|
|
— |
|
|
|
27 |
|
| Shinhan-Neoplux Energy Newbiz Fund |
|
|
66,213 |
|
|
|
1,002 |
|
|
|
20,575 |
|
|
|
18,016 |
|
|
|
— |
|
|
|
18,016 |
|
| Shinhan-Albatross tech investment Fund |
|
|
20,677 |
|
|
|
464 |
|
|
|
12,058 |
|
|
|
10,912 |
|
|
|
— |
|
|
|
10,912 |
|
| VOGO Debt Strategy Qualified IV Private |
|
|
35,919 |
|
|
|
23 |
|
|
|
5,393 |
|
|
|
1,138 |
|
|
|
— |
|
|
|
1,138 |
|
| Shinhan-Midas Donga Secondary Fund |
|
|
7,902 |
|
|
|
— |
|
|
|
72 |
|
|
|
(602 |
) |
|
|
— |
|
|
|
(602 |
) |
| ShinHan – Soo Young Entrepreneur Investment Fund
No.1 |
|
|
17,960 |
|
|
|
352 |
|
|
|
27,318 |
|
|
|
8,906 |
|
|
|
— |
|
|
|
8,906 |
|
Shinhan Praxis K-Growth Global Private Equity Fund |
|
|
41,193 |
|
|
|
60 |
|
|
|
1,217 |
|
|
|
669 |
|
|
|
— |
|
|
|
669 |
|
| Kiwoom Milestone Professional Private Real Estate
Trust 19 |
|
|
49,101 |
|
|
|
38,596 |
|
|
|
2,505 |
|
|
|
(9,199 |
) |
|
|
— |
|
|
|
(9,199 |
) |
| AIP EURO Green Private Real Estate Trust No.3 |
|
|
219,110 |
|
|
|
79,534 |
|
|
|
52,789 |
|
|
|
47,070 |
|
|
|
— |
|
|
|
47,070 |
|
| Shinhan Global Healthcare Fund 1 |
|
|
43 |
|
|
|
3,507 |
|
|
|
— |
|
|
|
(1,414 |
) |
|
|
— |
|
|
|
(1,414 |
) |
| KB NA Hickory Private Special Asset Fund |
|
|
91,752 |
|
|
|
84 |
|
|
|
15,540 |
|
|
|
4,502 |
|
|
|
— |
|
|
|
4,502 |
|
Koramco Europe Core Private Placement Real Estate Fund No.2-2 |
|
|
46,169 |
|
|
|
1,894 |
|
|
|
7,743 |
|
|
|
4,719 |
|
|
|
— |
|
|
|
4,719 |
|
| BNP Paribas Cardif General Insurance |
|
|
140,179 |
|
|
|
78,748 |
|
|
|
61,951 |
|
|
|
(6,872 |
) |
|
|
(28 |
) |
|
|
(6,900 |
) |
| Hermes Private Investment Equity Fund |
|
|
33,545 |
|
|
|
8 |
|
|
|
23,536 |
|
|
|
23,486 |
|
|
|
— |
|
|
|
23,486 |
|
| Shinhan-Nvestor Liquidity Solution Fund |
|
|
21,420 |
|
|
|
— |
|
|
|
2,169 |
|
|
|
2,064 |
|
|
|
— |
|
|
|
2,064 |
|
| Shinhan AIM FoF Fund 1-A |
|
|
36,651 |
|
|
|
28 |
|
|
|
4,527 |
|
|
|
(1,466 |
) |
|
|
— |
|
|
|
(1,466 |
) |
IGIS Global Credit Fund 150-1 |
|
|
21,625 |
|
|
|
16 |
|
|
|
3,138 |
|
|
|
1,763 |
|
|
|
— |
|
|
|
1,763 |
|
| Partner One Value up I Private Equity Fund |
|
|
28,273 |
|
|
|
— |
|
|
|
304 |
|
|
|
10,910 |
|
|
|
— |
|
|
|
10,910 |
|
| Genesis No.1 Private Equity Fund |
|
|
243,534 |
|
|
|
— |
|
|
|
— |
|
|
|
(109,494 |
) |
|
|
— |
|
|
|
(109,494 |
) |
SHINHAN FINANCIAL GROUP CO., LTD. AND SUBSIDIARIES
Notes to the Consolidated Financial Statements
|
Investments in associates (continued) |
|
|
|
|
|
|
|
|
|
|
|
|
|
|
|
|
|
|
|
|
|
|
|
|
|
|
|
|
|
|
|
|
|
|
|
|
|
|
|
|
|
|
|
|
|
|
|
|
|
|
|
|
|
|
|
|
|
|
|
|
|
|
|
|
|
|
|
|
|
|
|
|
|
Korea Omega Project Fund III |
|
|
18,234 |
|
|
|
— |
|
|
|
3,154 |
|
|
|
3,093 |
|
|
|
— |
|
|
|
3,093 |
|
Soo Delivery Platform Growth Fund |
|
|
19,578 |
|
|
|
— |
|
|
|
6,243 |
|
|
|
6,018 |
|
|
|
— |
|
|
|
6,018 |
|
Genesis North America Power Company No.1 PEF |
|
|
34,626 |
|
|
|
316 |
|
|
|
11,654 |
|
|
|
4,951 |
|
|
|
— |
|
|
|
4,951 |
|
SH MAIN Professional Investment Type Private Mixed Asset Investment Trust No.3 |
|
|
178,427 |
|
|
|
358 |
|
|
|
28,997 |
|
|
|
27,719 |
|
|
|
— |
|
|
|
27,719 |
|
|
|
|
|
|
|
|
|
|
|
|
|
|
|
|
|
|
|
|
|
|
|
|
|
Korea Finance Security |
|
|
35,044 |
|
|
|
14,966 |
|
|
|
63,693 |
|
|
|
(412 |
) |
|
|
— |
|
|
|
(412 |
) |
MIEL CO.,LTD. |
|
|
491 |
|
|
|
632 |
|
|
|
36 |
|
|
|
(56 |
) |
|
|
— |
|
|
|
(56 |
) |
AIP Transportation Specialized Privately Placed Fund Trust
#1 |
|
|
104,512 |
|
|
|
7,415 |
|
|
|
16,239 |
|
|
|
3,773 |
|
|
|
— |
|
|
|
3,773 |
|
E&Healthcare Investment Fund No.6 |
|
|
32,615 |
|
|
|
— |
|
|
|
17,133 |
|
|
|
(23,116 |
) |
|
|
— |
|
|
|
(23,116 |
) |
One Shinhan Global Fund 1 |
|
|
15,799 |
|
|
|
41 |
|
|
|
8,276 |
|
|
|
(1,280 |
) |
|
|
— |
|
|
|
(1,280 |
) |
Kiwoom-Shinhan Innovation Fund I |
|
|
23,613 |
|
|
|
151 |
|
|
|
4,803 |
|
|
|
1,823 |
|
|
|
— |
|
|
|
1,823 |
|
Daishin-K&T New Technology Investment Fund |
|
|
25,637 |
|
|
|
66 |
|
|
|
8,639 |
|
|
|
3,171 |
|
|
|
— |
|
|
|
3,171 |
|
Midas Asset Global CRE Debt Private Fund No.6 |
|
|
117,396 |
|
|
|
49 |
|
|
|
2,817 |
|
|
|
1,451 |
|
|
|
— |
|
|
|
1,451 |
|
Samchully Midstream Private Placement Special Asset Fund 5-4 |
|
|
65,966 |
|
|
|
35 |
|
|
|
11,141 |
|
|
|
(4,113 |
) |
|
|
— |
|
|
|
(4,113 |
) |
SH Senior Loan Professional Investment Type Private Mixed
Asset Investment Trust No.3 |
|
|
126,043 |
|
|
|
23 |
|
|
|
6,544 |
|
|
|
6,048 |
|
|
|
— |
|
|
|
6,048 |
|
NH-Amundi Global Infrastructure Trust 14 |
|
|
61,005 |
|
|
|
1 |
|
|
|
4,134 |
|
|
|
4 |
|
|
|
— |
|
|
|
4 |
|
Jarvis Memorial Private Investment Trust 1 |
|
|
10,214 |
|
|
|
4 |
|
|
|
39 |
|
|
|
35 |
|
|
|
— |
|
|
|
35 |
|
Vestas Qualified Investors Private Real Estate Fund Investment Trust No.37 |
|
|
55,273 |
|
|
|
19 |
|
|
|
6,500 |
|
|
|
23 |
|
|
|
— |
|
|
|
23 |
|
Milestone Private Real Estate Fund 3 |
|
|
57,956 |
|
|
|
114 |
|
|
|
1,880 |
|
|
|
1,522 |
|
|
|
— |
|
|
|
1,522 |
|
Nomura-Rifa Private Real Estate Investment Trust 31 |
|
|
97,211 |
|
|
|
72,103 |
|
|
|
7,364 |
|
|
|
639 |
|
|
|
— |
|
|
|
639 |
|
SH Senior Loan Professional Investment Type Private Mixed Asset Investment Trust No.2 |
|
|
48,157 |
|
|
|
33 |
|
|
|
2,106 |
|
|
|
1,991 |
|
|
|
— |
|
|
|
1,991 |
|
Cape IT Fund No.3 |
|
|
30,651 |
|
|
|
52 |
|
|
|
2,100 |
|
|
|
(11 |
) |
|
|
— |
|
|
|
(11 |
) |
SHINHAN FINANCIAL GROUP CO., LTD. AND SUBSIDIARIES
Notes to the Consolidated Financial Statements
|
Investments in associates (continued) |
|
|
|
|
|
|
|
|
|
|
|
|
|
|
|
|
|
|
|
|
|
|
|
|
|
|
|
|
|
|
|
|
|
|
|
|
|
|
|
|
|
|
|
|
|
|
|
|
FuturePlay-Shinhan TechInnovation Fund 1 |
|
|
14,297 |
|
|
|
— |
|
|
|
3 |
|
|
|
(342 |
) |
|
|
— |
|
|
|
(342 |
) |
Stonebridge Corporate 1st Fund |
|
|
6,718 |
|
|
|
— |
|
|
|
1 |
|
|
|
(622 |
) |
|
|
— |
|
|
|
(622 |
) |
Vogo Realty Partners Private Real Estate Fund V |
|
|
49,842 |
|
|
|
82 |
|
|
|
2,110 |
|
|
|
(2,066 |
) |
|
|
— |
|
|
|
(2,066 |
) |
Korea Credit Bureau |
|
|
129,478 |
|
|
|
43,981 |
|
|
|
121,982 |
|
|
|
8,988 |
|
|
|
— |
|
|
|
8,988 |
|
Goduck Gangil1 PFV Co., Ltd |
|
|
301,513 |
|
|
|
317,276 |
|
|
|
88,085 |
|
|
|
(1,835 |
) |
|
|
— |
|
|
|
(1,835 |
) |
SBC PFV Co., Ltd. |
|
|
334,262 |
|
|
|
175,976 |
|
|
|
— |
|
|
|
(4,462 |
) |
|
|
— |
|
|
|
(4,462 |
) |
NH-amundi global infra private fund 16 |
|
|
297,837 |
|
|
|
193,821 |
|
|
|
25,560 |
|
|
|
14,770 |
|
|
|
— |
|
|
|
14,770 |
|
IMM Global Private Equity Fund |
|
|
362,514 |
|
|
|
3,099 |
|
|
|
50,060 |
|
|
|
24,933 |
|
|
|
— |
|
|
|
24,933 |
|
HANA Alternative Estate Professional Private122 |
|
|
39,878 |
|
|
|
38 |
|
|
|
2,608 |
|
|
|
1,160 |
|
|
|
— |
|
|
|
1,160 |
|
|
|
|
|
|
|
|
|
|
|
|
|
|
|
|
|
|
|
|
|
|
|
|
|
|
SH Corporate Professional Investment Type Private Security Investment Trust No.7 |
|
|
268,037 |
|
|
|
167,939 |
|
|
|
3,231 |
|
|
|
415 |
|
|
|
— |
|
|
|
415 |
|
SH BNCT Professional Investment Type Private Special Asset Investment Trust |
|
|
389,240 |
|
|
|
— |
|
|
|
14,978 |
|
|
|
14,978 |
|
|
|
— |
|
|
|
14,978 |
|
Deutsche Global Professional Investment Type Private Real Estate Investment Trust No. 24 |
|
|
54,914 |
|
|
|
756 |
|
|
|
23,920 |
|
|
|
2,948 |
|
|
|
— |
|
|
|
2,948 |
|
BRAIN DO PROFESSIONALE PRIVATE No. 27 |
|
|
3,351 |
|
|
|
— |
|
|
|
2,002 |
|
|
|
2,002 |
|
|
|
— |
|
|
|
2,002 |
|
Sparklabs-Shinhan Opportunity Fund 1 |
|
|
9,372 |
|
|
|
— |
|
|
|
— |
|
|
|
(388 |
) |
|
|
— |
|
|
|
(388 |
) |
BNW Tech-Innovation Private Equity Fund |
|
|
20,215 |
|
|
|
513 |
|
|
|
95 |
|
|
|
(204 |
) |
|
|
— |
|
|
|
(204 |
) |
IGIS Real-estate Private Investment Trust No.33 |
|
|
87,790 |
|
|
|
53,808 |
|
|
|
1,123 |
|
|
|
440 |
|
|
|
— |
|
|
|
440 |
|
WWG Global Real Estate Investment Trust no.4 |
|
|
36,030 |
|
|
|
11 |
|
|
|
2,538 |
|
|
|
293 |
|
|
|
— |
|
|
|
293 |
|
Goduck Gangil10 PFV Co., Ltd |
|
|
253,607 |
|
|
|
261,969 |
|
|
|
— |
|
|
|
(8,526 |
) |
|
|
— |
|
|
|
(8,526 |
) |
Fidelis Global Private Real Estate Trust No.2 |
|
|
25,271 |
|
|
|
6 |
|
|
|
1,575 |
|
|
|
1,532 |
|
|
|
— |
|
|
|
1,532 |
|
AIP EURO PRIVATE REAL ESTATE TRUST No. 12 |
|
|
172,398 |
|
|
|
909 |
|
|
|
23,567 |
|
|
|
21,983 |
|
|
|
— |
|
|
|
21,983 |
|
Shinhan Healthcare Fund 2 |
|
|
35 |
|
|
|
138 |
|
|
|
340 |
|
|
|
(7,310 |
) |
|
|
— |
|
|
|
(7,310 |
) |
Pebblestone CGV Private Real Estate Trust No.1 |
|
|
64,667 |
|
|
|
36,415 |
|
|
|
7,147 |
|
|
|
2,350 |
|
|
|
— |
|
|
|
2,350 |
|
Shinhan AIM Real Estate Fund No.2 |
|
|
79,162 |
|
|
|
1,580 |
|
|
|
9,672 |
|
|
|
(3,666 |
) |
|
|
— |
|
|
|
(3,666 |
) |
Shinhan AIM Real Estate Fund No.1 |
|
|
226,809 |
|
|
|
15,901 |
|
|
|
20,209 |
|
|
|
8,467 |
|
|
|
— |
|
|
|
8,467 |
|
SHINHAN FINANCIAL GROUP CO., LTD. AND SUBSIDIARIES
Notes to the Consolidated Financial Statements
|
Investments in associates (continued) |
|
|
|
|
|
|
|
|
|
|
|
|
|
|
|
|
|
|
|
|
|
|
|
|
|
|
|
|
|
| |
|
|
|
|
|
|
|
|
|
|
|
|
|
|
|
|
|
|
SH Daegu Green Power Cogeneration System Professional Investment Type Private Special Asset Investment Trust |
|
|
149,702 |
|
|
|
75 |
|
|
|
4,451 |
|
|
|
4,152 |
|
|
|
— |
|
|
|
4,152 |
|
SH Sangju YC Expressway Professional Investment Type Private Special Asset Investment Trust |
|
|
70,637 |
|
|
|
236 |
|
|
|
— |
|
|
|
(1,231 |
) |
|
|
— |
|
|
|
(1,231 |
) |
SH Global Infrastructure Professional Investment Type Private Special Asset Investment Trust No.7-2 |
|
|
26,429 |
|
|
|
33 |
|
|
|
2,310 |
|
|
|
(2,105 |
) |
|
|
— |
|
|
|
(2,105 |
) |
Korea Omega-Shinhan Project Fund I |
|
|
14,488 |
|
|
|
— |
|
|
|
— |
|
|
|
(1,373 |
) |
|
|
— |
|
|
|
(1,373 |
) |
| |
|
|
8,650 |
|
|
|
— |
|
|
|
3,666 |
|
|
|
3,519 |
|
|
|
— |
|
|
|
3,519 |
|
Samsung SRA Real Estate Professional Private 45 |
|
|
56,083 |
|
|
|
4,564 |
|
|
|
3,833 |
|
|
|
(1,769 |
) |
|
|
— |
|
|
|
(1,769 |
) |
IBK Global New Renewable Energy Special Asset Professional Private2 |
|
|
114,645 |
|
|
|
4,633 |
|
|
|
5,520 |
|
|
|
5,265 |
|
|
|
— |
|
|
|
5,265 |
|
| VS Cornerstone Fund |
|
|
8,281 |
|
|
|
— |
|
|
|
2 |
|
|
|
(132 |
) |
|
|
— |
|
|
|
(132 |
) |
| Aone Mezzanine Opportunity Professional Private |
|
|
15,247 |
|
|
|
800 |
|
|
|
1,409 |
|
|
|
(18 |
) |
|
|
— |
|
|
|
(18 |
) |
NH-Amundi US Infrastructure Private Fund2 |
|
|
104,374 |
|
|
|
61 |
|
|
|
6,769 |
|
|
|
5,351 |
|
|
|
— |
|
|
|
5,351 |
|
| KB Distribution Private Real Estate1 |
|
|
50,014 |
|
|
|
508 |
|
|
|
2,335 |
|
|
|
2,289 |
|
|
|
— |
|
|
|
2,289 |
|
| SH Japan Photovoltaic Private Special Asset Investment Trust No.2 |
|
|
43,540 |
|
|
|
155 |
|
|
|
7,216 |
|
|
|
2,216 |
|
|
|
— |
|
|
|
2,216 |
|
| Kakao-Shinhan 1st TNYT Fund |
|
|
29,948 |
|
|
|
133 |
|
|
|
8 |
|
|
|
(379 |
) |
|
|
— |
|
|
|
(379 |
) |
IMM Special Situation 1-2 PRIVATE EQUITY FUND |
|
|
57,965 |
|
|
|
3 |
|
|
|
4,610 |
|
|
|
4,418 |
|
|
|
— |
|
|
|
4,418 |
|
| Pacific Private Placement Real Estate Fund No.40 |
|
|
46,898 |
|
|
|
— |
|
|
|
398 |
|
|
|
398 |
|
|
|
— |
|
|
|
398 |
|
| Mastern Private Real Estate Loan Fund No.2 |
|
|
22,453 |
|
|
|
139 |
|
|
|
549 |
|
|
|
410 |
|
|
|
— |
|
|
|
410 |
|
| LB Scotland Amazon Fulfillment Center Fund 29 |
|
|
44,614 |
|
|
|
37 |
|
|
|
5,177 |
|
|
|
3,345 |
|
|
|
— |
|
|
|
3,345 |
|
| JR AMC Hungary Budapest Office Fund 16 |
|
|
38,545 |
|
|
|
1,271 |
|
|
|
— |
|
|
|
— |
|
|
|
— |
|
|
|
— |
|
| EDNCENTRAL Co.,Ltd. |
|
|
94,405 |
|
|
|
96,892 |
|
|
|
1,381 |
|
|
|
(5,093 |
) |
|
|
— |
|
|
|
(5,093 |
) |
| Future-Creation Neoplux Venture Capital Fund |
|
|
22,488 |
|
|
|
3,919 |
|
|
|
10,294 |
|
|
|
1,332 |
|
|
|
— |
|
|
|
1,332 |
|
| Gyeonggi-Neoplux Superman Fund |
|
|
36,815 |
|
|
|
620 |
|
|
|
21,349 |
|
|
|
17,163 |
|
|
|
— |
|
|
|
17,163 |
|
| NewWave 6th Fund |
|
|
48,185 |
|
|
|
— |
|
|
|
4,009 |
|
|
|
2,434 |
|
|
|
— |
|
|
|
2,434 |
|
SHINHAN FINANCIAL GROUP CO., LTD. AND SUBSIDIARIES
Notes to the Consolidated Financial Statements
|
Investments in associates (continued) |
|
|
|
|
|
|
|
|
|
|
|
|
|
|
|
|
|
|
|
|
|
|
|
|
|
|
|
|
|
| |
|
|
|
|
|
|
|
|
|
|
|
|
|
|
|
|
|
|
KTC-NP Growth Champ 2011-2 Private Equity Fund |
|
|
80,853 |
|
|
|
9,024 |
|
|
|
20,479 |
|
|
|
20,472 |
|
|
|
— |
|
|
|
20,472 |
|
| Neoplux No.3 Private Equity Fund |
|
|
226,970 |
|
|
|
962 |
|
|
|
38,467 |
|
|
|
21,233 |
|
|
|
— |
|
|
|
21,233 |
|
| PCC Amberstone Private Equity Fund I |
|
|
105,169 |
|
|
|
— |
|
|
|
12,174 |
|
|
|
12,302 |
|
|
|
— |
|
|
|
12,302 |
|
| KIAMCO POWERLOAN TRUST 4TH |
|
|
95,658 |
|
|
|
24 |
|
|
|
3,282 |
|
|
|
3,188 |
|
|
|
— |
|
|
|
3,188 |
|
| Mastern Opportunity Seeking Real Estate Fund II |
|
|
111,276 |
|
|
|
4,692 |
|
|
|
11,332 |
|
|
|
11,274 |
|
|
|
— |
|
|
|
11,274 |
|
| AION ELFIS PROFESSIONAL PRIVATE 1 |
|
|
22,143 |
|
|
|
31 |
|
|
|
4,212 |
|
|
|
1,219 |
|
|
|
— |
|
|
|
1,219 |
|
T&F 2020 SS Private Equity Fund Specializing in Start-up and Venture Business |
|
|
15,062 |
|
|
|
374 |
|
|
|
— |
|
|
|
(312 |
) |
|
|
— |
|
|
|
(312 |
) |
| Neoplux Market-Frontier Secondary Fund |
|
|
58,273 |
|
|
|
954 |
|
|
|
7,913 |
|
|
|
1,932 |
|
|
|
— |
|
|
|
1,932 |
|
| Harvest Private Equity Fund II |
|
|
15,877 |
|
|
|
97 |
|
|
|
2,496 |
|
|
|
2,262 |
|
|
|
— |
|
|
|
2,262 |
|
| Synergy Green New Deal 1st New Technology Business Investment Fund |
|
|
34,379 |
|
|
|
— |
|
|
|
977 |
|
|
|
(272 |
) |
|
|
— |
|
|
|
(272 |
) |
| KAIM Real-estate Private Investment Trust 20 |
|
|
13,125 |
|
|
|
— |
|
|
|
125 |
|
|
|
125 |
|
|
|
— |
|
|
|
125 |
|
| KIAMCO Vietnam Solar Special Asset Private Investment Trust |
|
|
15,065 |
|
|
|
12 |
|
|
|
— |
|
|
|
— |
|
|
|
— |
|
|
|
— |
|
| Daishin New Technology Investment Fund 5th |
|
|
18,970 |
|
|
|
30 |
|
|
|
6,903 |
|
|
|
6,778 |
|
|
|
— |
|
|
|
6,778 |
|
| CSQUARE SNIPER PROFESSIONAL PRIVATE 10 |
|
|
5,269 |
|
|
|
75 |
|
|
|
425 |
|
|
|
195 |
|
|
|
— |
|
|
|
195 |
|
| Acurus Hyundai Investment Partners New Technology |
|
|
17,642 |
|
|
|
42 |
|
|
|
6,881 |
|
|
|
6,679 |
|
|
|
— |
|
|
|
6,679 |
|
IGIS GLIP Professional Investment Private Real Estate Investment Trust No. 1-1 |
|
|
60,740 |
|
|
|
59 |
|
|
|
6,767 |
|
|
|
6,637 |
|
|
|
2,339 |
|
|
|
8,976 |
|
IGIS GLIP Professional Investment Private Real Estate Investment Trust No. 1-2 |
|
|
60,740 |
|
|
|
59 |
|
|
|
6,767 |
|
|
|
6,637 |
|
|
|
2,339 |
|
|
|
8,976 |
|
| Pacific Sunny Professional Investors Private Placement Real Estate Investment Company No.45 |
|
|
134,667 |
|
|
|
94,282 |
|
|
|
6 |
|
|
|
(8,090 |
) |
|
|
— |
|
|
|
(8,090 |
) |
SHINHAN-NEO Core Industrial Technology Fund |
|
|
11,439 |
|
|
|
— |
|
|
|
5 |
|
|
|
(499 |
) |
|
|
— |
|
|
|
(499 |
) |
SHINHAN FINANCIAL GROUP CO., LTD. AND SUBSIDIARIES
Notes to the Consolidated Financial Statements
|
Investments in associates (continued) |
|
|
|
|
|
|
|
|
|
|
|
|
|
|
|
|
|
|
|
|
|
|
|
|
|
|
|
|
|
| |
|
|
|
|
|
|
|
|
|
|
|
|
|
|
|
|
|
|
SHBNPP Green New Deal Energy Professional Investment Type Private Special Asset Investment Trust No.2 |
|
|
90,848 |
|
|
|
38 |
|
|
|
3,650 |
|
|
|
2,767 |
|
|
|
— |
|
|
|
2,767 |
|
| SIMONE Mezzanine Fund No.3 |
|
|
10,404 |
|
|
|
9 |
|
|
|
345 |
|
|
|
253 |
|
|
|
— |
|
|
|
253 |
|
| Eum Private Equity Fund No.7 |
|
|
37,495 |
|
|
|
— |
|
|
|
— |
|
|
|
(573 |
) |
|
|
— |
|
|
|
(573 |
) |
Kiwoom Private Equity Ant-Man Startup Venture Specialized Private Equity Fund |
|
|
30,434 |
|
|
|
59 |
|
|
|
10,475 |
|
|
|
10,241 |
|
|
|
— |
|
|
|
10,241 |
|
| Kiwoom Hero No.4 Private Equity Fund |
|
|
20,478 |
|
|
|
29 |
|
|
|
1 |
|
|
|
(1,908 |
) |
|
|
— |
|
|
|
(1,908 |
) |
| Vogo Canister Professional Trust Private Fund I |
|
|
112,505 |
|
|
|
72 |
|
|
|
16,029 |
|
|
|
4,949 |
|
|
|
— |
|
|
|
4,949 |
|
| SW-S Fund |
|
|
22,191 |
|
|
|
— |
|
|
|
— |
|
|
|
(909 |
) |
|
|
— |
|
|
|
(909 |
) |
| CL Buyout 1st PEF |
|
|
64,518 |
|
|
|
159 |
|
|
|
1 |
|
|
|
(390 |
) |
|
|
— |
|
|
|
(390 |
) |
Timefolio The Venture-V second |
|
|
22,829 |
|
|
|
769 |
|
|
|
3,361 |
|
|
|
2,941 |
|
|
|
— |
|
|
|
2,941 |
|
| Newlake Growth Capital Partners2 PEF |
|
|
43,187 |
|
|
|
— |
|
|
|
290 |
|
|
|
(263 |
) |
|
|
— |
|
|
|
(263 |
) |
| Shinhan Smilegate Global PEF I |
|
|
23,469 |
|
|
|
— |
|
|
|
— |
|
|
|
(281 |
) |
|
|
— |
|
|
|
(281 |
) |
| Fount Professional Investors Private Investment Trust No.3 |
|
|
10,416 |
|
|
|
17 |
|
|
|
411 |
|
|
|
394 |
|
|
|
— |
|
|
|
394 |
|
| Genesis Eco No.1 PEF |
|
|
38,369 |
|
|
|
4 |
|
|
|
308 |
|
|
|
(377 |
) |
|
|
— |
|
|
|
(377 |
) |
SHINHAN-NEO Market-Frontier 2nd Fund |
|
|
58,138 |
|
|
|
513 |
|
|
|
1,466 |
|
|
|
(2,375 |
) |
|
|
— |
|
|
|
(2,375 |
) |
NH-Synergy Core Industrial New Technology Fund |
|
|
17,430 |
|
|
|
— |
|
|
|
— |
|
|
|
(170 |
) |
|
|
— |
|
|
|
(170 |
) |
| J& Moorim Jade Investment Fund |
|
|
22,265 |
|
|
|
6 |
|
|
|
356 |
|
|
|
160 |
|
|
|
— |
|
|
|
160 |
|
| Ulmus SHC innovation investment fund |
|
|
21,601 |
|
|
|
— |
|
|
|
956 |
|
|
|
801 |
|
|
|
— |
|
|
|
801 |
|
| Mirae Asset Partners X Private Equity Fund |
|
|
22,035 |
|
|
|
33 |
|
|
|
1 |
|
|
|
(398 |
) |
|
|
— |
|
|
|
(398 |
) |
T Core Industrial Technology 1st Venture PEF |
|
|
14,418 |
|
|
|
5 |
|
|
|
197 |
|
|
|
113 |
|
|
|
— |
|
|
|
113 |
|
Curious Finale Corporate Recovery Private Equity Fund |
|
|
13,346 |
|
|
|
61 |
|
|
|
1,275 |
|
|
|
1,126 |
|
|
|
— |
|
|
|
1,126 |
|
TI First Property Private Investment Trust 1 |
|
|
7,654 |
|
|
|
17 |
|
|
|
156 |
|
|
|
139 |
|
|
|
— |
|
|
|
139 |
|
MPLUS Professional Private Real Estate Fund 25 |
|
|
8,186 |
|
|
|
290 |
|
|
|
451 |
|
|
|
396 |
|
|
|
— |
|
|
|
396 |
|
IBKC Global Contents Investment Fund |
|
|
20,265 |
|
|
|
— |
|
|
|
— |
|
|
|
(235 |
) |
|
|
— |
|
|
|
(235 |
) |
SHINHAN FINANCIAL GROUP CO., LTD. AND SUBSIDIARIES
Notes to the Consolidated Financial Statements
|
Investments in associates (continued) |
|
|
|
|
|
|
|
|
|
|
|
|
|
|
|
|
|
|
|
|
|
|
|
|
|
|
|
|
|
| |
|
|
|
|
|
|
|
|
|
|
|
|
|
|
|
|
|
|
Nautic Smart No.6 Private Equity Fund |
|
|
10,565 |
|
|
|
32 |
|
|
|
50 |
|
|
|
(68 |
) |
|
|
— |
|
|
|
(68 |
) |
| Premier Luminous Private Equity Fund |
|
|
25,170 |
|
|
|
3 |
|
|
|
— |
|
|
|
(375 |
) |
|
|
— |
|
|
|
(375 |
) |
| Hanyang-Meritz 1 Fund |
|
|
15,423 |
|
|
|
— |
|
|
|
— |
|
|
|
(77 |
) |
|
|
— |
|
|
|
(77 |
) |
| KNT 2ND PRIVATE EQUITY FUND |
|
|
19,133 |
|
|
|
9 |
|
|
|
5,402 |
|
|
|
5,324 |
|
|
|
— |
|
|
|
5,324 |
|
| Maple Mobility Fund |
|
|
43,024 |
|
|
|
1 |
|
|
|
— |
|
|
|
(2,930 |
) |
|
|
— |
|
|
|
(2,930 |
) |
| AVES 1st Corporate Recovery Private Equity Fund |
|
|
6,215 |
|
|
|
— |
|
|
|
— |
|
|
|
(85 |
) |
|
|
— |
|
|
|
(85 |
) |
| JS Shinhan Private Equity Fund |
|
|
130,967 |
|
|
|
1 |
|
|
|
7 |
|
|
|
(1,036 |
) |
|
|
— |
|
|
|
(1,036 |
) |
Daishin Newgen New Technology Investment Fund 1 st |
|
|
24,050 |
|
|
|
2 |
|
|
|
1 |
|
|
|
8,238 |
|
|
|
— |
|
|
|
8,238 |
|
| META ESG Private Equity Fund I |
|
|
21,722 |
|
|
|
— |
|
|
|
1 |
|
|
|
(178 |
) |
|
|
— |
|
|
|
(178 |
) |
| |
|
|
24,055 |
|
|
|
90 |
|
|
|
— |
|
|
|
(135 |
) |
|
|
— |
|
|
|
(135 |
) |
| PHAROS DK FUND |
|
|
16,349 |
|
|
|
60 |
|
|
|
— |
|
|
|
(210 |
) |
|
|
— |
|
|
|
(210 |
) |
| Shinhan VC tomorrow venture fund 1 |
|
|
22,603 |
|
|
|
— |
|
|
|
23 |
|
|
|
(397 |
) |
|
|
— |
|
|
|
(397 |
) |
| |
|
|
15,000 |
|
|
|
2 |
|
|
|
— |
|
|
|
(2 |
) |
|
|
— |
|
|
|
(2 |
) |
| |
|
|
39,217 |
|
|
|
15 |
|
|
|
— |
|
|
|
(98 |
) |
|
|
— |
|
|
|
(98 |
) |
| Tres-Yujin Trust |
|
|
20,000 |
|
|
|
11 |
|
|
|
— |
|
|
|
(11 |
) |
|
|
— |
|
|
|
(11 |
) |
| Shinhan-Time mezzanine blind Fund |
|
|
29,885 |
|
|
|
— |
|
|
|
— |
|
|
|
(115 |
) |
|
|
— |
|
|
|
(115 |
) |
| Capstone REITs No.26 |
|
|
12,223 |
|
|
|
3,433 |
|
|
|
— |
|
|
|
— |
|
|
|
— |
|
|
|
— |
|
| JB Incheon-Bucheon REITS No.54 |
|
|
12,718 |
|
|
|
2 |
|
|
|
— |
|
|
|
(2 |
) |
|
|
— |
|
|
|
(2 |
) |
| Hankook Smart Real Asset Investment Trust No.3 |
|
|
13,146 |
|
|
|
120 |
|
|
|
532 |
|
|
|
506 |
|
|
|
— |
|
|
|
506 |
|
| JB Hwaseong-Hadong REITs No.53 |
|
|
16,113 |
|
|
|
2 |
|
|
|
— |
|
|
|
(2 |
) |
|
|
— |
|
|
|
(2 |
) |
| KB Oaktree Trust No.3 |
|
|
9,552 |
|
|
|
77 |
|
|
|
130 |
|
|
|
52 |
|
|
|
— |
|
|
|
52 |
|
| Daehan No.36 Office Asset Management Company |
|
|
133,884 |
|
|
|
95,993 |
|
|
|
1,000 |
|
|
|
111 |
|
|
|
— |
|
|
|
111 |
|
| Rhinos Premier Mezzanine Private Investment Fund No.1 |
|
|
10,759 |
|
|
|
— |
|
|
|
19 |
|
|
|
17 |
|
|
|
— |
|
|
|
17 |
|
| SH Real Estate Loan Investment Type Private Real Estate Investment Trust No.2 |
|
|
66,959 |
|
|
|
12 |
|
|
|
1,617 |
|
|
|
1,605 |
|
|
|
— |
|
|
|
1,605 |
|
| Shinhan JigaeNamsan Road Private Special Asset Investment Trust |
|
|
161,417 |
|
|
|
27 |
|
|
|
467 |
|
|
|
440 |
|
|
|
— |
|
|
|
440 |
|
| |
|
|
19,915 |
|
|
|
— |
|
|
|
1 |
|
|
|
(185 |
) |
|
|
— |
|
|
|
(185 |
) |
|
(*) |
Excluded the financial information of associates that are not subject to equity method due to disposal or of which the financial information is not available as of end of the year. |
SHINHAN FINANCIAL GROUP CO., LTD. AND SUBSIDIARIES
Notes to the Consolidated Financial Statements
(In millions of won)
|
Investments in associates (continued) |
|
|
|
|
|
|
|
|
|
|
|
|
|
|
|
|
|
|
|
|
|
|
|
|
|
|
|
|
|
| |
|
|
|
|
|
|
|
|
|
|
|
|
|
|
|
|
|
|
| BNP Paribas Cardif Life Insurance |
|
W |
2,528,558 |
|
|
|
2,327,352 |
|
|
|
47,631 |
|
|
|
(11,901 |
) |
|
|
(80,527 |
) |
|
|
(92,428 |
) |
| Partners 4th Growth Investment Fund |
|
|
54,661 |
|
|
|
496 |
|
|
|
14,432 |
|
|
|
27,663 |
|
|
|
(18,774 |
) |
|
|
8,889 |
|
| KTB Newlake Global Healthcare PEF |
|
|
21,000 |
|
|
|
55 |
|
|
|
3,091 |
|
|
|
2,996 |
|
|
|
— |
|
|
|
2,996 |
|
| Shinhan-Neoplux Energy Newbiz Fund |
|
|
66,792 |
|
|
|
978 |
|
|
|
3,371 |
|
|
|
21,618 |
|
|
|
— |
|
|
|
21,618 |
|
| Shinhan-Albatross tech investment Fund |
|
|
24,870 |
|
|
|
363 |
|
|
|
1,469 |
|
|
|
10,429 |
|
|
|
(383 |
) |
|
|
10,046 |
|
Meritz Investment Type Private Placement Special Asset Fund |
|
|
17,718 |
|
|
|
2 |
|
|
|
14,888 |
|
|
|
14,888 |
|
|
|
— |
|
|
|
14,888 |
|
Meritz Investment Type Private Placement Special Asset Fund |
|
|
8,569 |
|
|
|
6 |
|
|
|
1,267 |
|
|
|
1,265 |
|
|
|
— |
|
|
|
1,265 |
|
| VOGO Debt Strategy Qualified IV Private |
|
|
30,440 |
|
|
|
20 |
|
|
|
3,963 |
|
|
|
1,691 |
|
|
|
— |
|
|
|
1,691 |
|
Shinhan -Midas Dong-A Secondary Fund |
|
|
8,863 |
|
|
|
— |
|
|
|
3,749 |
|
|
|
3,011 |
|
|
|
— |
|
|
|
3,011 |
|
| ShinHan – Soo Young Entrepreneur Investment Fund No.1 |
|
|
18,660 |
|
|
|
269 |
|
|
|
1,056 |
|
|
|
784 |
|
|
|
— |
|
|
|
784 |
|
Shinhan Praxis K-Growth Global Private Equity Fund |
|
|
|
|
|
|
|
|
|
|
|
|
|
|
|
|
|
|
|
|
|
|
|
|
|
|
|
|
|
|
|
|
|
|
|
|
|
|
|
|
|
|
|
|
|
|
|
|
|
| Kiwoom Milestone Professional Private Real Estate Trust 19 |
|
|
46,585 |
|
|
|
38,663 |
|
|
|
2,605 |
|
|
|
(2,584 |
) |
|
|
— |
|
|
|
(2,584 |
) |
| Shinhan Global Healthcare Fund 1 |
|
|
40 |
|
|
|
4,558 |
|
|
|
— |
|
|
|
(1,406 |
) |
|
|
— |
|
|
|
(1,406 |
) |
| KB NA Hickory Private Special Asset Fund |
|
|
91,617 |
|
|
|
45 |
|
|
|
17,394 |
|
|
|
8,543 |
|
|
|
— |
|
|
|
8,543 |
|
Koramco Europe Core Private Placement Real Estate Fund No.2-2 |
|
|
45,492 |
|
|
|
1,798 |
|
|
|
7,431 |
|
|
|
574 |
|
|
|
— |
|
|
|
574 |
|
| Hermes Private Investment Equity Fund |
|
|
19,078 |
|
|
|
7 |
|
|
|
— |
|
|
|
(14,465 |
) |
|
|
— |
|
|
|
(14,465 |
) |
KDBC-Midas Dong-A Global contents Fund |
|
|
18,412 |
|
|
|
19 |
|
|
|
7,110 |
|
|
|
5,689 |
|
|
|
— |
|
|
|
5,689 |
|
SHINHAN FINANCIAL GROUP CO., LTD. AND SUBSIDIARIES
Notes to the Consolidated Financial Statements
|
Investments in associates (continued) |
|
|
|
|
|
|
|
|
|
|
|
|
|
|
|
|
|
|
|
|
|
|
|
|
|
|
|
|
|
| |
|
|
|
|
|
|
|
|
|
|
|
|
|
|
|
|
|
|
Shinhan-Nvestor Liquidity Solution Fund |
|
|
26,085 |
|
|
|
249 |
|
|
|
2,297 |
|
|
|
1,607 |
|
|
|
— |
|
|
|
1,607 |
|
| |
|
|
40,471 |
|
|
|
27 |
|
|
|
16,497 |
|
|
|
3,617 |
|
|
|
— |
|
|
|
3,617 |
|
IGIS Global Credit Fund 150-1 |
|
|
18,779 |
|
|
|
14 |
|
|
|
5,436 |
|
|
|
2,223 |
|
|
|
— |
|
|
|
2,223 |
|
| Partner One Value up I Private Equity Fund |
|
|
18,496 |
|
|
|
68 |
|
|
|
1,281 |
|
|
|
(9,798 |
) |
|
|
— |
|
|
|
(9,798 |
) |
| Genesis No.1 Private Equity Fund |
|
|
262,825 |
|
|
|
2 |
|
|
|
19,226 |
|
|
|
17,898 |
|
|
|
— |
|
|
|
17,898 |
|
| Korea Omega Project Fund III |
|
|
15,610 |
|
|
|
— |
|
|
|
— |
|
|
|
(2,624 |
) |
|
|
— |
|
|
|
(2,624 |
) |
| Genesis North America Power Company No.1 PEF |
|
|
20,898 |
|
|
|
138 |
|
|
|
20,864 |
|
|
|
20,155 |
|
|
|
— |
|
|
|
20,155 |
|
| SHBNPP MAIN Professional Investment Type Private Mixed Asset Investment Trust No.3 |
|
|
185,777 |
|
|
|
444 |
|
|
|
— |
|
|
|
(44,452 |
) |
|
|
— |
|
|
|
(44,452 |
) |
| MIEL CO.,LTD. |
|
|
422 |
|
|
|
565 |
|
|
|
36 |
|
|
|
(1 |
) |
|
|
— |
|
|
|
(1 |
) |
| AIP Transportation Specialized Privately Placed Fund Trust #1 |
|
|
125,545 |
|
|
|
86 |
|
|
|
7,398 |
|
|
|
(3,978 |
) |
|
|
— |
|
|
|
(3,978 |
) |
| E&Healthcare Investment Fund No.6 |
|
|
2,839 |
|
|
|
— |
|
|
|
3,243 |
|
|
|
(14,623 |
) |
|
|
— |
|
|
|
(14,623 |
) |
| One Shinhan Global Fund 1 |
|
|
9,575 |
|
|
|
80 |
|
|
|
— |
|
|
|
(6,263 |
) |
|
|
— |
|
|
|
(6,263 |
) |
| Kiwoom-Shinhan Innovation Fund I |
|
|
19,130 |
|
|
|
249 |
|
|
|
1,545 |
|
|
|
(1,581 |
) |
|
|
— |
|
|
|
(1,581 |
) |
| Midas Asset Global CRE Debt Private Fund No.6 |
|
|
139,200 |
|
|
|
662 |
|
|
|
10,515 |
|
|
|
6,925 |
|
|
|
— |
|
|
|
6,925 |
|
Samchully Midstream Private Placement Special Asset Fund 5-4 |
|
|
71,399 |
|
|
|
47 |
|
|
|
16,238 |
|
|
|
(4,512 |
) |
|
|
— |
|
|
|
(4,512 |
) |
| SHBNPP Senior Loan Professional Investment Type Private Mixed Asset Investment Trust No.3 |
|
|
122,479 |
|
|
|
23 |
|
|
|
4,534 |
|
|
|
1,007 |
|
|
|
— |
|
|
|
1,007 |
|
NH-Amundi Global Infrastructure Trust 14 |
|
|
69,933 |
|
|
|
14 |
|
|
|
14,823 |
|
|
|
3,201 |
|
|
|
— |
|
|
|
3,201 |
|
SHINHAN FINANCIAL GROUP CO., LTD. AND SUBSIDIARIES
Notes to the Consolidated Financial Statements
|
Investments in associates (continued) |
|
|
|
|
|
|
|
|
|
|
|
|
|
|
|
|
|
|
|
|
|
|
|
|
|
|
|
|
|
| |
|
|
|
|
|
|
|
|
|
|
|
|
|
|
|
|
|
|
Jarvis Memorial Private Investment Trust 1 |
|
|
9,887 |
|
|
|
4 |
|
|
|
384 |
|
|
|
380 |
|
|
|
— |
|
|
|
380 |
|
| Vestas Qualified Investors Private Real Estate Fund Investment Trust No.37 |
|
|
55,618 |
|
|
|
20 |
|
|
|
15,784 |
|
|
|
379 |
|
|
|
— |
|
|
|
379 |
|
| Milestone Private Real Estate Fund 3 (Derivative Type) |
|
|
59,697 |
|
|
|
212 |
|
|
|
1,865 |
|
|
|
(4,045 |
) |
|
|
— |
|
|
|
(4,045 |
) |
| RIFA Real estate private placement fund for normal investors No. 31 |
|
|
95,314 |
|
|
|
71,795 |
|
|
|
13,708 |
|
|
|
108 |
|
|
|
— |
|
|
|
108 |
|
| SHBNPP Senior Loan Professional Investment Type Private Mixed Asset Investment Trust No.2 |
|
|
13,967 |
|
|
|
6 |
|
|
|
2,226 |
|
|
|
(9,585 |
) |
|
|
— |
|
|
|
(9,585 |
) |
T&F 2019 bearing Private Equity Fund Specializing in Start-up and Venture Business |
|
|
11,446 |
|
|
|
6 |
|
|
|
1,527 |
|
|
|
1,333 |
|
|
|
— |
|
|
|
1,333 |
|
| FuturePlay-Shinhan TechInnovation Fund 1 |
|
|
13,832 |
|
|
|
— |
|
|
|
2 |
|
|
|
(465 |
) |
|
|
— |
|
|
|
(465 |
) |
| Stonebridge Corporate 1st Fund |
|
|
8,211 |
|
|
|
— |
|
|
|
1,575 |
|
|
|
1,493 |
|
|
|
— |
|
|
|
1,493 |
|
| Vogo Realty Partners Private Real Estate Fund V |
|
|
50,529 |
|
|
|
83 |
|
|
|
3,851 |
|
|
|
3,637 |
|
|
|
— |
|
|
|
3,637 |
|
| Korea Credit Bureau |
|
|
144,765 |
|
|
|
88,766 |
|
|
|
141,445 |
|
|
|
(29,498 |
) |
|
|
— |
|
|
|
(29,498 |
) |
| Goduck Gangil1 PFV Co., Ltd. |
|
|
212,608 |
|
|
|
206,893 |
|
|
|
187,295 |
|
|
|
21,478 |
|
|
|
— |
|
|
|
21,478 |
|
| SBC PFV Co., Ltd. |
|
|
424,242 |
|
|
|
290,391 |
|
|
|
— |
|
|
|
(4,471 |
) |
|
|
— |
|
|
|
(4,471 |
) |
NH-amundi global infra private fund 16 |
|
|
112,489 |
|
|
|
66 |
|
|
|
32,982 |
|
|
|
22,026 |
|
|
|
— |
|
|
|
22,026 |
|
| IMM Global Private Equity Fund |
|
|
451,407 |
|
|
|
4,821 |
|
|
|
25,234 |
|
|
|
(48,679 |
) |
|
|
— |
|
|
|
(48,679 |
) |
| SHBNPP BNCT Professional Investment Type Private Special Asset Investment Trust |
|
|
362,896 |
|
|
|
66 |
|
|
|
10,788 |
|
|
|
(18,077 |
) |
|
|
— |
|
|
|
(18,077 |
) |
| Deutsche Global Professional Investment Type Private Real Estate Investment Trust No. 24 |
|
|
43,941 |
|
|
|
552 |
|
|
|
25,185 |
|
|
|
2,665 |
|
|
|
— |
|
|
|
2,665 |
|
SHINHAN FINANCIAL GROUP CO., LTD. AND SUBSIDIARIES
Notes to the Consolidated Financial Statements
|
Investments in associates (continued) |
|
|
|
|
|
|
|
|
|
|
|
|
|
|
|
|
|
|
|
|
|
|
|
|
|
|
|
|
|
|
|
|
|
|
|
|
|
|
|
|
|
|
|
|
|
|
|
|
Sparklabs-Shinhan Opportunity Fund 1 |
|
|
9,356 |
|
|
|
— |
|
|
|
1,951 |
|
|
|
1,652 |
|
|
|
— |
|
|
|
1,652 |
|
BNW Tech-Innovation Private Equity Fund |
|
|
20,303 |
|
|
|
763 |
|
|
|
92 |
|
|
|
(161 |
) |
|
|
— |
|
|
|
(161 |
) |
IGIS Real-estate Private Investment Trust
No.33 |
|
|
89,582 |
|
|
|
53,964 |
|
|
|
5,202 |
|
|
|
3,387 |
|
|
|
— |
|
|
|
3,387 |
|
WWG Global Real Estate Investment Trust
no.4 |
|
|
34,970 |
|
|
|
11 |
|
|
|
4,402 |
|
|
|
1,169 |
|
|
|
— |
|
|
|
1,169 |
|
Goduck Gangil10 PFV Co., Ltd. |
|
|
179,923 |
|
|
|
163,660 |
|
|
|
210,961 |
|
|
|
24,625 |
|
|
|
— |
|
|
|
24,625 |
|
Fidelis Global Private Real Estate Trust No.2 |
|
|
30,217 |
|
|
|
32 |
|
|
|
— |
|
|
|
(821 |
) |
|
|
— |
|
|
|
(821 |
) |
AIP EURO PRIVATE REAL ESTATE
TRUST No. 12 |
|
|
169,704 |
|
|
|
969 |
|
|
|
17,932 |
|
|
|
13,514 |
|
|
|
— |
|
|
|
13,514 |
|
Shinhan Global Healthcare Fund 2 |
|
|
32 |
|
|
|
192 |
|
|
|
1 |
|
|
|
(75 |
) |
|
|
— |
|
|
|
(75 |
) |
Shinhan AIM Real Estate Fund No.2 |
|
|
84,946 |
|
|
|
806 |
|
|
|
10,262 |
|
|
|
(4,595 |
) |
|
|
— |
|
|
|
(4,595 |
) |
Shinhan AIM Real Estate Fund No.1 |
|
|
239,734 |
|
|
|
27,259 |
|
|
|
15,006 |
|
|
|
11,925 |
|
|
|
— |
|
|
|
11,925 |
|
SHBNPP Daegu Green Power Cogeneration System Professional Investment Type
Private Special Asset Investment Trust |
|
|
148,236 |
|
|
|
75 |
|
|
|
4,456 |
|
|
|
2,688 |
|
|
|
— |
|
|
|
2,688 |
|
SHBNPP Sangju YC Expressway
Professional Investment Type Private
Special Asset Investment Trust |
|
|
66,408 |
|
|
|
301 |
|
|
|
655 |
|
|
|
(4,315 |
) |
|
|
— |
|
|
|
(4,315 |
) |
SHBNPP Global Infrastructure Professional Investment Type Private Special Asset Investment Trust No.7-2 |
|
|
34,479 |
|
|
|
42 |
|
|
|
4,149 |
|
|
|
2,310 |
|
|
|
— |
|
|
|
2,310 |
|
Korea Omega-Shinhan Project Fund I |
|
|
20,043 |
|
|
|
— |
|
|
|
1,776 |
|
|
|
1,555 |
|
|
|
— |
|
|
|
1,555 |
|
|
|
|
6,775 |
|
|
|
— |
|
|
|
202 |
|
|
|
(275 |
) |
|
|
— |
|
|
|
(275 |
) |
Samsung SRA Real Estate Professional
Private 45[FoFs] |
|
|
93,284 |
|
|
|
7,161 |
|
|
|
5,721 |
|
|
|
(7,106 |
) |
|
|
— |
|
|
|
(7,106 |
) |
SHINHAN FINANCIAL GROUP CO., LTD. AND SUBSIDIARIES
Notes to the Consolidated Financial Statements
|
Investments in associates (continued) |
|
|
|
|
|
|
|
|
|
|
|
|
|
|
|
|
|
|
|
|
|
|
|
|
|
|
|
|
|
|
|
|
|
|
|
|
|
|
|
|
|
|
|
|
|
|
|
|
|
|
|
|
|
|
|
|
|
|
|
|
|
|
|
|
|
|
|
|
|
|
|
|
|
|
|
|
|
|
|
|
|
|
|
|
|
|
|
|
|
|
|
|
|
|
|
|
|
|
IBK Global New Renewable Energy Special Asset Professional Private2 |
|
W |
115,311 |
|
|
|
41 |
|
|
|
8,791 |
|
|
|
8,504 |
|
|
|
— |
|
|
|
8,504 |
|
VS Cornerstone Fund |
|
|
8,098 |
|
|
|
— |
|
|
|
1 |
|
|
|
(131 |
) |
|
|
— |
|
|
|
(131 |
) |
Aone Mezzanine Opportunity Professional Private |
|
|
8,006 |
|
|
|
229 |
|
|
|
992 |
|
|
|
729 |
|
|
|
— |
|
|
|
729 |
|
NH-Amundi US Infrastructure Private Fund2 |
|
|
123,363 |
|
|
|
72 |
|
|
|
32,302 |
|
|
|
9,571 |
|
|
|
— |
|
|
|
9,571 |
|
SHBNPP Japan Photovoltaic Private Special Asset Investment Trust No.2 |
|
|
21,202 |
|
|
|
99 |
|
|
|
6,709 |
|
|
|
2,901 |
|
|
|
— |
|
|
|
2,901 |
|
Kakao-Shinhan 1st TNYT Fund |
|
|
44,003 |
|
|
|
134 |
|
|
|
14,778 |
|
|
|
14,054 |
|
|
|
— |
|
|
|
14,054 |
|
IMM Special Situation 1-2 PRIVATE EQUITY FUND |
|
|
13,058 |
|
|
|
39 |
|
|
|
6,499 |
|
|
|
(1,494 |
) |
|
|
— |
|
|
|
(1,494 |
) |
Pacific Private Placement Real Estate Fund No.40 |
|
|
145,569 |
|
|
|
98,572 |
|
|
|
4,155 |
|
|
|
3,122 |
|
|
|
— |
|
|
|
3,122 |
|
Mastern Private Real Estate Loan Fund No.2 |
|
|
19,200 |
|
|
|
175 |
|
|
|
919 |
|
|
|
759 |
|
|
|
— |
|
|
|
759 |
|
|
|
|
|
|
|
|
|
|
|
|
|
|
|
|
|
|
|
|
|
|
|
|
|
|
LB Scotland Amazon Fulfillment Center Fund 29 |
|
|
42,291 |
|
|
|
39 |
|
|
|
2,226 |
|
|
|
795 |
|
|
|
— |
|
|
|
795 |
|
JR AMC Hungary Budapest Office Fund 16 |
|
|
38,247 |
|
|
|
— |
|
|
|
3,493 |
|
|
|
3,493 |
|
|
|
— |
|
|
|
3,493 |
|
EDNCENTRAL Co.,Ltd. |
|
|
114,856 |
|
|
|
138,293 |
|
|
|
1,193 |
|
|
|
(9,338 |
) |
|
|
— |
|
|
|
(9,338 |
) |
Future-Creation Neoplux Venture Capital Fund |
|
|
30,109 |
|
|
|
3,949 |
|
|
|
13,584 |
|
|
|
7,591 |
|
|
|
— |
|
|
|
7,591 |
|
Gyeonggi-Neoplux Superman Fund |
|
|
25,739 |
|
|
|
623 |
|
|
|
12,768 |
|
|
|
(5,587 |
) |
|
|
— |
|
|
|
(5,587 |
) |
NewWave 6th Fund |
|
|
45,981 |
|
|
|
849 |
|
|
|
2,167 |
|
|
|
(3,053 |
) |
|
|
— |
|
|
|
(3,053 |
) |
KTC-NP Growth Champ 2011-2 Private Equity Fund |
|
|
27,070 |
|
|
|
5,349 |
|
|
|
463 |
|
|
|
(5,288 |
) |
|
|
— |
|
|
|
(5,288 |
) |
Neoplux No.3 Private Equity Fund |
|
|
207,723 |
|
|
|
3,194 |
|
|
|
10,686 |
|
|
|
(21,454 |
) |
|
|
— |
|
|
|
(21,454 |
) |
PCC Amberstone Private Equity Fund I |
|
|
89,577 |
|
|
|
2,892 |
|
|
|
9,177 |
|
|
|
(10,097 |
) |
|
|
— |
|
|
|
(10,097 |
) |
SHINHAN FINANCIAL GROUP CO., LTD. AND SUBSIDIARIES
Notes to the Consolidated Financial Statements
|
Investments in associates (continued) |
|
|
|
|
|
|
|
|
|
|
|
|
|
|
|
|
|
|
|
|
|
|
|
|
|
|
|
|
|
|
|
|
|
|
|
|
|
|
|
|
|
|
|
|
|
|
|
|
KIAMCO POWERLOAN TRUST 4TH |
|
|
91,908 |
|
|
|
24 |
|
|
|
5,024 |
|
|
|
1,117 |
|
|
|
— |
|
|
|
1,117 |
|
Mastern Opportunity Seeking Real Estate Fund II |
|
|
73,584 |
|
|
|
40 |
|
|
|
13,201 |
|
|
|
(2,950 |
) |
|
|
— |
|
|
|
(2,950 |
) |
AION ELFIS PROFESSIONAL PRIVATE 1 |
|
|
17,833 |
|
|
|
2 |
|
|
|
395 |
|
|
|
(4,280 |
) |
|
|
— |
|
|
|
(4,280 |
) |
T&F 2020 SS Private Equity Fund Specializing in Start-up and Venture Business |
|
|
19,257 |
|
|
|
22 |
|
|
|
10,655 |
|
|
|
10,381 |
|
|
|
— |
|
|
|
10,381 |
|
Neoplux Market-Frontier Secondary Fund |
|
|
71,633 |
|
|
|
904 |
|
|
|
29,131 |
|
|
|
16,720 |
|
|
|
— |
|
|
|
16,720 |
|
Harvest Private Equity Fund II |
|
|
14,387 |
|
|
|
157 |
|
|
|
119 |
|
|
|
(831 |
) |
|
|
— |
|
|
|
(831 |
) |
Synergy Green New Deal 1st New Technology Business Investment Fund |
|
|
37,743 |
|
|
|
— |
|
|
|
4,283 |
|
|
|
3,883 |
|
|
|
— |
|
|
|
3,883 |
|
KAIM Real-estate Private Investment Trust 20 |
|
|
3,089 |
|
|
|
— |
|
|
|
820 |
|
|
|
820 |
|
|
|
— |
|
|
|
820 |
|
KIAMCO Vietnam Solar Special Asset Private Investment Trust |
|
|
13,473 |
|
|
|
18 |
|
|
|
5,271 |
|
|
|
2,438 |
|
|
|
— |
|
|
|
2,438 |
|
Daishin New Technology Investment Fund 5th |
|
|
10,384 |
|
|
|
15 |
|
|
|
227 |
|
|
|
107 |
|
|
|
— |
|
|
|
107 |
|
SHINHAN-NEO Core Industrial Technology Fund |
|
|
19,037 |
|
|
|
124 |
|
|
|
136 |
|
|
|
(486 |
) |
|
|
— |
|
|
|
(486 |
) |
SHBNPP Green New Deal Energy Professional Investment Type Private Special Asset Investment Trust No.2 |
|
|
83,453 |
|
|
|
36 |
|
|
|
3,580 |
|
|
|
1,158 |
|
|
|
— |
|
|
|
1,158 |
|
SIMONE Mezzanine Fund No.3 |
|
|
10,427 |
|
|
|
8 |
|
|
|
120 |
|
|
|
(129 |
) |
|
|
— |
|
|
|
(129 |
) |
Eum Private Equity Fund No.7 |
|
|
43,679 |
|
|
|
6 |
|
|
|
7,116 |
|
|
|
6,587 |
|
|
|
— |
|
|
|
6,587 |
|
Kiwoom Hero No.4 Private Equity Fund |
|
|
16,731 |
|
|
|
26 |
|
|
|
399 |
|
|
|
191 |
|
|
|
(3,936 |
) |
|
|
(3,745 |
) |
Vogo Canister Professional Trust Private Fund I |
|
|
127,808 |
|
|
|
61 |
|
|
|
22,709 |
|
|
|
8,743 |
|
|
|
— |
|
|
|
8,743 |
|
SHINHAN FINANCIAL GROUP CO., LTD. AND SUBSIDIARIES
Notes to the Consolidated Financial Statements
|
Investments in associates (continued) |
|
|
|
|
|
|
|
|
|
|
|
|
|
|
|
|
|
|
|
|
|
|
|
|
|
|
|
|
|
| |
|
|
|
|
|
|
|
|
|
|
|
|
|
|
|
|
|
|
| |
|
|
23,919 |
|
|
|
— |
|
|
|
1,978 |
|
|
|
1,728 |
|
|
|
— |
|
|
|
1,728 |
|
| CL Buyout 1st PEF |
|
|
60,144 |
|
|
|
214 |
|
|
|
1 |
|
|
|
(5,704 |
) |
|
|
— |
|
|
|
(5,704 |
) |
Timefolio The Venture-V second |
|
|
19,764 |
|
|
|
— |
|
|
|
— |
|
|
|
(2,296 |
) |
|
|
— |
|
|
|
(2,296 |
) |
| Newlake Growth Capital Partners2 PEF |
|
|
42,358 |
|
|
|
592 |
|
|
|
— |
|
|
|
(829 |
) |
|
|
— |
|
|
|
(829 |
) |
| Shinhan Smilegate Global PEF I |
|
|
28,792 |
|
|
|
— |
|
|
|
6,610 |
|
|
|
6,118 |
|
|
|
— |
|
|
|
6,118 |
|
| Genesis Eco No.1 PEF |
|
|
39,363 |
|
|
|
4 |
|
|
|
657 |
|
|
|
1,400 |
|
|
|
— |
|
|
|
1,400 |
|
SHINHAN-NEO Market-Frontier 2nd Fund |
|
|
81,123 |
|
|
|
513 |
|
|
|
8,166 |
|
|
|
2,985 |
|
|
|
— |
|
|
|
2,985 |
|
NH-Synergy Core Industrial New Technology Fund |
|
|
17,269 |
|
|
|
— |
|
|
|
— |
|
|
|
100 |
|
|
|
— |
|
|
|
100 |
|
| J& Moorim Jade Investment Fund |
|
|
21,837 |
|
|
|
1 |
|
|
|
1,134 |
|
|
|
969 |
|
|
|
— |
|
|
|
969 |
|
| Helios-KDBC Digital Contents 1st |
|
|
14,518 |
|
|
|
87 |
|
|
|
3,529 |
|
|
|
3,272 |
|
|
|
— |
|
|
|
3,272 |
|
| Ulmus SHC innovation investment fund |
|
|
20,326 |
|
|
|
— |
|
|
|
1 |
|
|
|
(1,275 |
) |
|
|
— |
|
|
|
(1,275 |
) |
| Mirae Asset Partners X Private Equity Fund |
|
|
21,850 |
|
|
|
33 |
|
|
|
2 |
|
|
|
(185 |
) |
|
|
— |
|
|
|
(185 |
) |
| T Core Industrial Technology 1st Venture
PEF |
|
|
14,405 |
|
|
|
12 |
|
|
|
208 |
|
|
|
(20 |
) |
|
|
— |
|
|
|
(20 |
) |
| Curious Finale Corporate Recovery Private
Equity Fund |
|
|
12,986 |
|
|
|
61 |
|
|
|
946 |
|
|
|
522 |
|
|
|
— |
|
|
|
522 |
|
| TI First Property Private Investment Trust 1 |
|
|
7,817 |
|
|
|
— |
|
|
|
432 |
|
|
|
432 |
|
|
|
— |
|
|
|
432 |
|
| MPLUS Professional Private Real Estate
Fund 25 |
|
|
12,395 |
|
|
|
2,242 |
|
|
|
686 |
|
|
|
686 |
|
|
|
— |
|
|
|
686 |
|
| IBKC Global Contents Investment Fund |
|
|
18,739 |
|
|
|
78 |
|
|
|
— |
|
|
|
(1,603 |
) |
|
|
— |
|
|
|
(1,603 |
) |
|
|
|
|
|
|
|
|
|
|
|
|
|
|
|
|
|
|
|
|
|
|
|
|
|
| Nautic Smart No.6 Private Equity Fund |
|
|
3,212 |
|
|
|
91 |
|
|
|
2,718 |
|
|
|
2,531 |
|
|
|
— |
|
|
|
2,531 |
|
| Premier Luminous Private Equity Fund |
|
|
35,763 |
|
|
|
63 |
|
|
|
10,762 |
|
|
|
10,534 |
|
|
|
— |
|
|
|
10,534 |
|
| Hanyang-Meritz 1 Fund |
|
|
15,348 |
|
|
|
— |
|
|
|
41 |
|
|
|
(74 |
) |
|
|
— |
|
|
|
(74 |
) |
| KNT 2ND PRIVATE EQUITY FUND |
|
|
5,182 |
|
|
|
5 |
|
|
|
6,186 |
|
|
|
5,983 |
|
|
|
— |
|
|
|
5,983 |
|
SHINHAN FINANCIAL GROUP CO., LTD. AND SUBSIDIARIES
Notes to the Consolidated Financial Statements
|
Investments in associates (continued) |
|
|
|
|
| |
|
|
|
|
|
|
|
|
|
|
|
|
|
|
|
|
|
|
|
|
|
|
|
|
|
|
|
|
|
|
|
|
|
|
|
|
|
|
|
|
|
|
|
Kiwoom-Shinhan Innovation Fund 2 |
|
|
26,475 |
|
|
|
176 |
|
|
|
16 |
|
|
|
(947 |
) |
|
|
— |
|
|
|
(947 |
) |
| Maple Mobility Fund |
|
|
83,540 |
|
|
|
1 |
|
|
|
40,442 |
|
|
|
40,066 |
|
|
|
— |
|
|
|
40,066 |
|
| SJ ESG Innovative Growth Fund |
|
|
14,689 |
|
|
|
— |
|
|
|
4,319 |
|
|
|
4,195 |
|
|
|
— |
|
|
|
4,195 |
|
| AVES 1st Corporate Recovery Private
Equity Fund |
|
|
6,641 |
|
|
|
3 |
|
|
|
431 |
|
|
|
422 |
|
|
|
— |
|
|
|
422 |
|
| JS Shinhan Private Equity Fund |
|
|
128,728 |
|
|
|
1 |
|
|
|
12 |
|
|
|
(2,098 |
) |
|
|
— |
|
|
|
(2,098 |
) |
| NH Kyobo AI Solution Investment Fund |
|
|
12,601 |
|
|
|
— |
|
|
|
2,182 |
|
|
|
2,002 |
|
|
|
— |
|
|
|
2,002 |
|
| Daishin Newgen New Technology
Investment Fund 1st |
|
|
11,298 |
|
|
|
25 |
|
|
|
184 |
|
|
|
38 |
|
|
|
(8,314 |
) |
|
|
(8,276 |
) |
| META ESG Private Equity Fund I |
|
|
21,380 |
|
|
|
— |
|
|
|
2 |
|
|
|
(341 |
) |
|
|
— |
|
|
|
(341 |
) |
| |
|
|
22,678 |
|
|
|
— |
|
|
|
— |
|
|
|
(1,287 |
) |
|
|
— |
|
|
|
(1,287 |
) |
| PHAROS DK FUND |
|
|
15,918 |
|
|
|
32 |
|
|
|
— |
|
|
|
(403 |
) |
|
|
— |
|
|
|
(403 |
) |
| Shinhan VC tomorrow venture fund 1 |
|
|
68,808 |
|
|
|
850 |
|
|
|
2,775 |
|
|
|
(645 |
) |
|
|
— |
|
|
|
(645 |
) |
| |
|
|
14,924 |
|
|
|
154 |
|
|
|
— |
|
|
|
(228 |
) |
|
|
— |
|
|
|
(228 |
) |
| |
|
|
38,933 |
|
|
|
149 |
|
|
|
356 |
|
|
|
(64 |
) |
|
|
— |
|
|
|
(64 |
) |
| Stonebridge-Shinhan Unicorn Secondary
Fund |
|
|
34,621 |
|
|
|
— |
|
|
|
3 |
|
|
|
(866 |
) |
|
|
— |
|
|
|
(866 |
) |
| Tres-Yujin Trust |
|
|
20,010 |
|
|
|
3 |
|
|
|
1,114 |
|
|
|
1,111 |
|
|
|
— |
|
|
|
1,111 |
|
| Shinhan-Time mezzanine blind Fund |
|
|
26,625 |
|
|
|
— |
|
|
|
42 |
|
|
|
(3,260 |
) |
|
|
— |
|
|
|
(3,260 |
) |
| Capstone REITs No.26 |
|
|
16,709 |
|
|
|
9,006 |
|
|
|
— |
|
|
|
(486 |
) |
|
|
— |
|
|
|
(486 |
) |
| JB Incheon-Bucheon REITS No.54 |
|
|
12,695 |
|
|
|
5 |
|
|
|
2 |
|
|
|
(26 |
) |
|
|
— |
|
|
|
(26 |
) |
| Hankook Smart Real Asset Investment Trust
No.3 |
|
|
21,085 |
|
|
|
105 |
|
|
|
1,408 |
|
|
|
1,368 |
|
|
|
— |
|
|
|
1,368 |
|
| JB Hwaseong-Hadong REITs No.53 |
|
|
16,090 |
|
|
|
6 |
|
|
|
2 |
|
|
|
(27 |
) |
|
|
— |
|
|
|
(27 |
) |
| KB Oaktree Trust No.3 |
|
|
25,822 |
|
|
|
8 |
|
|
|
3,266 |
|
|
|
210 |
|
|
|
— |
|
|
|
210 |
|
| Daehan No.36 Office Asset Management Company |
|
|
141,037 |
|
|
|
96,073 |
|
|
|
5,231 |
|
|
|
2,047 |
|
|
|
— |
|
|
|
2,047 |
|
Rhinos Premier Mezzanine Private
Investment Fund No.1 |
|
|
2,880 |
|
|
|
7 |
|
|
|
1,137 |
|
|
|
1,073 |
|
|
|
— |
|
|
|
1,073 |
|
SH Real Estate Loan Investment Type
Private Real Estate Investment Trust No.2 |
|
|
192,904 |
|
|
|
53 |
|
|
|
11,005 |
|
|
|
5,638 |
|
|
|
— |
|
|
|
5,638 |
|
SHINHAN FINANCIAL GROUP CO., LTD. AND SUBSIDIARIES
Notes to the Consolidated Financial Statements
(In millions of won)
|
Investments in associates (continued) |
|
|
|
|
|
|
|
|
|
|
|
|
|
|
|
|
|
|
|
|
|
|
|
|
|
|
|
|
|
| |
|
|
|
|
|
|
|
|
|
|
|
|
|
|
|
|
|
|
Shinhan JigaeNamsan Road Private Special Asset Investment Trust
|
|
W |
163,349 |
|
|
|
82 |
|
|
|
5,679 |
|
|
|
5,076 |
|
|
|
— |
|
|
|
5,076 |
|
| |
|
|
22,110 |
|
|
|
— |
|
|
|
2,505 |
|
|
|
2,196 |
|
|
|
— |
|
|
|
2,196 |
|
| IBKC-METIS Global Contents Investment Fund |
|
|
12,513 |
|
|
|
— |
|
|
|
1 |
|
|
|
1,513 |
|
|
|
— |
|
|
|
1,513 |
|
| Keistone Unicorn Private Equity Fund |
|
|
22,318 |
|
|
|
— |
|
|
|
— |
|
|
|
(176 |
) |
|
|
— |
|
|
|
(176 |
) |
KB Distribution Private Real Estate 3-1 |
|
|
71,093 |
|
|
|
24 |
|
|
|
85 |
|
|
|
14 |
|
|
|
— |
|
|
|
14 |
|
Pacific Private Investment Trust No.49-1 |
|
|
36,126 |
|
|
|
— |
|
|
|
— |
|
|
|
(23 |
) |
|
|
— |
|
|
|
(23 |
) |
| KIWOOM Real estate private placement fund for
normal investors No. 31 |
|
|
14,278 |
|
|
|
14 |
|
|
|
435 |
|
|
|
260 |
|
|
|
— |
|
|
|
260 |
|
| RIFA Real estate private placement fund for
normal investoes No. 51 |
|
|
14,343 |
|
|
|
28 |
|
|
|
218 |
|
|
|
170 |
|
|
|
— |
|
|
|
170 |
|
| Fivetree general private equity fund No.15 |
|
|
24,606 |
|
|
|
33 |
|
|
|
2,003 |
|
|
|
1,920 |
|
|
|
— |
|
|
|
1,920 |
|
| Shinhan-Kunicorn first Fund |
|
|
25,658 |
|
|
|
— |
|
|
|
10 |
|
|
|
(442 |
) |
|
|
— |
|
|
|
(442 |
) |
| Harvest Fund No.3 |
|
|
35,577 |
|
|
|
89 |
|
|
|
6,855 |
|
|
|
6,388 |
|
|
|
— |
|
|
|
6,388 |
|
| Shinhan Simone Fund I |
|
|
12,468 |
|
|
|
— |
|
|
|
24 |
|
|
|
(532 |
) |
|
|
— |
|
|
|
(532 |
) |
| Korea Investment develop seed Trust No.1 |
|
|
26,334 |
|
|
|
730 |
|
|
|
1,806 |
|
|
|
1,702 |
|
|
|
— |
|
|
|
1,702 |
|
| Tiger Green alpah Trust No.29 |
|
|
28,200 |
|
|
|
54 |
|
|
|
1,431 |
|
|
|
658 |
|
|
|
— |
|
|
|
658 |
|
| STIC ALT Global II Private Equity Fund |
|
|
45,480 |
|
|
|
130 |
|
|
|
2 |
|
|
|
(649 |
) |
|
|
— |
|
|
|
(649 |
) |
| |
|
|
46,369 |
|
|
|
— |
|
|
|
2 |
|
|
|
(5,631 |
) |
|
|
— |
|
|
|
(5,631 |
) |
| DDI LVC Master Real Estate Investment Trust Co.,
Ltd. |
|
|
42,665 |
|
|
|
43 |
|
|
|
— |
|
|
|
(1,466 |
) |
|
|
— |
|
|
|
(1,466 |
) |
| Find-Green New Deal 2nd Equity Fund |
|
|
19,969 |
|
|
|
— |
|
|
|
26 |
|
|
|
(181 |
) |
|
|
— |
|
|
|
(181 |
) |
| ShinhanFitrin 1st Technology Business Investment Association |
|
|
27,520 |
|
|
|
76 |
|
|
|
1 |
|
|
|
(2,556 |
) |
|
|
— |
|
|
|
(2,556 |
) |
SHINHAN FINANCIAL GROUP CO., LTD. AND SUBSIDIARIES
Notes to the Consolidated Financial Statements
(In millions of won)
|
Investments in associates (continued) |
|
|
|
|
|
|
|
|
|
|
|
|
|
|
|
|
|
|
|
|
|
|
|
|
|
|
|
|
|
| |
|
|
|
|
|
|
|
|
|
|
|
|
|
|
|
|
|
|
| PARATUS No.3 Private Equity Fund |
|
W |
19,372 |
|
|
|
123 |
|
|
|
— |
|
|
|
(250 |
) |
|
|
— |
|
|
|
(250 |
) |
| Golden Route 2nd Startup Venture
Specialized Private Equity Fund |
|
|
13,272 |
|
|
|
58 |
|
|
|
73 |
|
|
|
14 |
|
|
|
— |
|
|
|
14 |
|
| Koramco Private Real Estate Fund 143 |
|
|
10,006 |
|
|
|
6 |
|
|
|
4 |
|
|
|
— |
|
|
|
— |
|
|
|
— |
|
| Korea Investment Top Mezzanine Private
Real Esate Trust No.1 |
|
|
45,126 |
|
|
|
649 |
|
|
|
4,554 |
|
|
|
4,499 |
|
|
|
— |
|
|
|
4,499 |
|
| LB YoungNam Logistics Private Trust
No.40 |
|
|
39,001 |
|
|
|
9 |
|
|
|
191 |
|
|
|
169 |
|
|
|
— |
|
|
|
169 |
|
Shinhan-Cognitive Start-up Fund L.P. |
|
|
30,744 |
|
|
|
386 |
|
|
|
899 |
|
|
|
384 |
|
|
|
— |
|
|
|
384 |
|
| IGEN2022 No.1 private Equity Fund |
|
|
32,483 |
|
|
|
122 |
|
|
|
3,166 |
|
|
|
2,737 |
|
|
|
— |
|
|
|
2,737 |
|
| Cornerstone J&M Fund I |
|
|
13,355 |
|
|
|
2 |
|
|
|
1 |
|
|
|
(147 |
) |
|
|
— |
|
|
|
(147 |
) |
| Logisvalley Shinhan REIT Co.,Ltd. |
|
|
79,248 |
|
|
|
55,619 |
|
|
|
1,000 |
|
|
|
(296 |
) |
|
|
— |
|
|
|
(296 |
) |
| KDB Investment Global Healthcare Private
Equity Fund I |
|
|
143,070 |
|
|
|
276 |
|
|
|
— |
|
|
|
(2,206 |
) |
|
|
— |
|
|
|
(2,206 |
) |
| Korea Investment Green Newdeal Infra
Trust No.1 |
|
|
20,438 |
|
|
|
7 |
|
|
|
— |
|
|
|
(70 |
) |
|
|
— |
|
|
|
(70 |
) |
| BTS 2nd Private Equity Fund |
|
|
15,018 |
|
|
|
513 |
|
|
|
1 |
|
|
|
(625 |
) |
|
|
— |
|
|
|
(625 |
) |
| Shinhan Global Active REIT Co.Ltd. |
|
|
192,742 |
|
|
|
98,372 |
|
|
|
— |
|
|
|
(1,703 |
) |
|
|
— |
|
|
|
(1,703 |
) |
NH-J&-IBKC Label Technology Fund |
|
|
35,481 |
|
|
|
4 |
|
|
|
2 |
|
|
|
(123 |
) |
|
|
— |
|
|
|
(123 |
) |
| IMM Global Venture Opportunity, LP |
|
|
8,775 |
|
|
|
— |
|
|
|
— |
|
|
|
— |
|
|
|
— |
|
|
|
— |
|
| Capstone Develop Frontier Trust |
|
|
32,000 |
|
|
|
— |
|
|
|
— |
|
|
|
— |
|
|
|
— |
|
|
|
— |
|
| Nextrade Co., Ltd. |
|
|
141,561 |
|
|
|
140 |
|
|
|
— |
|
|
|
(2,323 |
) |
|
|
— |
|
|
|
(2,323 |
) |
| SH Sustainable Management ESG Short
term Bond Security Feeder Investment
Trust No.1 |
|
|
11,196 |
|
|
|
2 |
|
|
|
72 |
|
|
|
49 |
|
|
|
— |
|
|
|
49 |
|
SHINHAN FINANCIAL GROUP CO., LTD. AND SUBSIDIARIES
Notes to the Consolidated Financial Statements
(In millions of won)
|
Investments in associates (continued) |
|
|
|
|
|
|
|
|
|
|
|
|
|
|
|
|
|
|
|
|
|
|
|
|
|
|
|
|
|
|
|
|
|
|
|
|
|
|
|
|
|
|
|
|
|
|
|
|
SH 1.5years Maturity Investment Type Security Investment Trust No.2 |
|
|
15,865 |
|
|
|
— |
|
|
|
4 |
|
|
|
4 |
|
|
|
— |
|
|
|
4 |
|
|
|
|
27,617 |
|
|
|
27 |
|
|
|
6 |
|
|
|
(4,409 |
) |
|
|
— |
|
|
|
(4,409 |
) |
NH-Daishin-Kyobo healthcare 1 Fund |
|
|
15,792 |
|
|
|
— |
|
|
|
17 |
|
|
|
(208 |
) |
|
|
— |
|
|
|
(208 |
) |
IBKC-Behigh Fund 1st |
|
|
10,992 |
|
|
|
— |
|
|
|
1 |
|
|
|
(108 |
) |
|
|
— |
|
|
|
(108 |
) |
Nautic Green Innovation ESG Co-investment No.1 Private Equity Fund |
|
|
16,569 |
|
|
|
150 |
|
|
|
1 |
|
|
|
(181 |
) |
|
|
— |
|
|
|
(181 |
) |
ON No.1 Private Equity Fund |
|
|
18,767 |
|
|
|
— |
|
|
|
— |
|
|
|
(2,233 |
) |
|
|
— |
|
|
|
(2,233 |
) |
Digital New Deal Kappa Private Equity Fund |
|
|
16,569 |
|
|
|
149 |
|
|
|
1 |
|
|
|
(180 |
) |
|
|
— |
|
|
|
(180 |
) |
|
(*) |
Excluded the financial information of associates that are not subject to equity method due to disposal or of which the financial information is not available as of end of the year. |
|
(d) |
Reconciliation of the financial information to the carrying value of its interests in the associates as of December 31, 2021 and 2022 are as follows: |
|
|
|
|
|
|
|
|
|
|
|
|
|
|
|
|
|
|
|
|
|
|
|
|
|
|
|
|
|
|
|
|
|
|
|
|
|
Interests
in the net
assets |
|
|
|
|
|
|
|
|
|
|
|
|
|
|
|
|
|
|
|
|
|
|
|
|
|
|
|
|
|
|
|
|
|
|
|
BNP Paribas Cardif Life Insurance |
|
W |
293,634 |
|
|
|
14.99 |
|
|
|
44,039 |
|
|
|
(17 |
) |
|
|
— |
|
|
|
44,022 |
|
Songrim Partners(*1) |
|
|
(62 |
) |
|
|
35.34 |
|
|
|
(22 |
) |
|
|
— |
|
|
|
22 |
|
|
|
— |
|
Partners 4th Growth Investment Fund |
|
|
52,134 |
|
|
|
25.00 |
|
|
|
13,033 |
|
|
|
— |
|
|
|
— |
|
|
|
13,033 |
|
KTB Newlake Global Healthcare PEF(*1) |
|
|
30,808 |
|
|
|
30.00 |
|
|
|
9,299 |
|
|
|
— |
|
|
|
113 |
|
|
|
9,412 |
|
Shinhan-Neoplux Energy Newbiz Fund |
|
|
65,211 |
|
|
|
31.66 |
|
|
|
16,032 |
|
|
|
— |
|
|
|
— |
|
|
|
16,032 |
|
Shinhan-Albatross tech investment Fund |
|
|
20,213 |
|
|
|
50.00 |
|
|
|
10,389 |
|
|
|
— |
|
|
|
— |
|
|
|
10,389 |
|
VOGO Debt Strategy Qualified IV Private |
|
|
35,896 |
|
|
|
20.00 |
|
|
|
7,179 |
|
|
|
— |
|
|
|
— |
|
|
|
7,179 |
|
Shinhan-Midas Donga Secondary Fund |
|
|
7,902 |
|
|
|
50.00 |
|
|
|
3,951 |
|
|
|
— |
|
|
|
— |
|
|
|
3,951 |
|
ShinHan – Soo Young Entrepreneur Investment Fund No.1 |
|
|
17,608 |
|
|
|
24.00 |
|
|
|
4,226 |
|
|
|
— |
|
|
|
— |
|
|
|
4,226 |
|
Shinhan Praxis K-Growth Global Private Equity Fund |
|
|
41,133 |
|
|
|
18.87 |
|
|
|
7,761 |
|
|
|
— |
|
|
|
— |
|
|
|
7,761 |
|
Kiwoom Milestone Professional Private Real Estate Trust 19 |
|
|
10,505 |
|
|
|
50.00 |
|
|
|
5,253 |
|
|
|
— |
|
|
|
— |
|
|
|
5,253 |
|
AIP EURO Green Private Real Estate Trust No.3 |
|
|
139,576 |
|
|
|
21.28 |
|
|
|
29,703 |
|
|
|
— |
|
|
|
— |
|
|
|
29,703 |
|
Shinhan Global Healthcare Fund 1(*1) |
|
|
(3,464 |
) |
|
|
4.41 |
|
|
|
(153 |
) |
|
|
— |
|
|
|
153 |
|
|
|
— |
|
SHINHAN FINANCIAL GROUP CO., LTD. AND SUBSIDIARIES
Notes to the Consolidated Financial Statements
|
Investments in associates (continued) |
| |
|
|
|
|
|
|
|
|
|
|
|
Interests
in the net
assets |
|
|
|
|
|
|
|
|
|
|
KB NA Hickory Private Special Asset Fund |
|
|
91,668 |
|
|
|
37.50 |
|
|
|
34,376 |
|
|
|
— |
|
|
|
— |
|
|
|
34,376 |
|
Koramco Europe Core Private Placement Real Estate Fund No.2-2 |
|
|
44,275 |
|
|
|
44.02 |
|
|
|
19,492 |
|
|
|
— |
|
|
|
— |
|
|
|
19,492 |
|
BNP Paribas Cardif General Insurance |
|
|
61,431 |
|
|
|
5.46 |
|
|
|
3,354 |
|
|
|
— |
|
|
|
— |
|
|
|
3,354 |
|
Hermes Private Investment Equity Fund |
|
|
33,537 |
|
|
|
29.17 |
|
|
|
9,782 |
|
|
|
— |
|
|
|
— |
|
|
|
9,782 |
|
Shinhan-Nvestor Liquidity Solution Fund |
|
|
21,420 |
|
|
|
24.92 |
|
|
|
5,338 |
|
|
|
— |
|
|
|
— |
|
|
|
5,338 |
|
Shinhan AIM FoF Fund 1-A |
|
|
36,623 |
|
|
|
25.00 |
|
|
|
9,156 |
|
|
|
— |
|
|
|
— |
|
|
|
9,156 |
|
IGIS Global Credit Fund 150-1 |
|
|
21,609 |
|
|
|
25.00 |
|
|
|
5,402 |
|
|
|
— |
|
|
|
— |
|
|
|
5,402 |
|
Partner One Value up I Private Equity Fund |
|
|
28,273 |
|
|
|
27.91 |
|
|
|
7,891 |
|
|
|
— |
|
|
|
— |
|
|
|
7,891 |
|
Genesis No.1 Private Equity Fund |
|
|
243,534 |
|
|
|
22.80 |
|
|
|
55,533 |
|
|
|
— |
|
|
|
— |
|
|
|
55,533 |
|
Korea Omega Project Fund III |
|
|
18,234 |
|
|
|
23.53 |
|
|
|
4,290 |
|
|
|
— |
|
|
|
— |
|
|
|
4,290 |
|
Soo Delivery Platform Growth Fund |
|
|
19,578 |
|
|
|
30.00 |
|
|
|
5,873 |
|
|
|
— |
|
|
|
— |
|
|
|
5,873 |
|
Genesis North America Power Company No.1 PEF |
|
|
34,310 |
|
|
|
40.03 |
|
|
|
13,736 |
|
|
|
— |
|
|
|
— |
|
|
|
13,736 |
|
SH MAIN Professional Investment Type Private Mixed Asset
Investment Trust No.3 |
|
|
178,069 |
|
|
|
23.33 |
|
|
|
41,549 |
|
|
|
— |
|
|
|
— |
|
|
|
41,549 |
|
Korea Finance Security |
|
|
20,078 |
|
|
|
14.91 |
|
|
|
2,994 |
|
|
|
— |
|
|
|
— |
|
|
|
2,994 |
|
MIEL CO.,LTD.(*1) |
|
|
(141 |
) |
|
|
28.77 |
|
|
|
(41 |
) |
|
|
— |
|
|
|
41 |
|
|
|
— |
|
AIP Transportation Specialized Privately Placed Fund Trust #1 |
|
|
97,097 |
|
|
|
35.73 |
|
|
|
34,688 |
|
|
|
— |
|
|
|
— |
|
|
|
34,688 |
|
E&Healthcare Investment Fund No.6 |
|
|
32,615 |
|
|
|
21.05 |
|
|
|
6,866 |
|
|
|
— |
|
|
|
— |
|
|
|
6,866 |
|
One Shinhan Global Fund 1 |
|
|
15,758 |
|
|
|
20.56 |
|
|
|
3,773 |
|
|
|
— |
|
|
|
— |
|
|
|
3,773 |
|
Kiwoom-Shinhan Innovation Fund I |
|
|
23,462 |
|
|
|
50.00 |
|
|
|
11,731 |
|
|
|
— |
|
|
|
— |
|
|
|
11,731 |
|
Daishin-K&T New Technology Investment Fund |
|
|
25,571 |
|
|
|
31.25 |
|
|
|
7,991 |
|
|
|
— |
|
|
|
— |
|
|
|
7,991 |
|
Midas Asset Global CRE Debt Private Fund No.6 |
|
|
117,347 |
|
|
|
41.16 |
|
|
|
48,305 |
|
|
|
— |
|
|
|
— |
|
|
|
48,305 |
|
Samchully Midstream Private Placement Special Asset Fund 5-4 |
|
|
65,931 |
|
|
|
42.92 |
|
|
|
27,471 |
|
|
|
— |
|
|
|
— |
|
|
|
27,471 |
|
SH Senior Loan Professional Investment Type Private Mixed Asset Investment Trust No.3 |
|
|
126,020 |
|
|
|
20.00 |
|
|
|
25,204 |
|
|
|
— |
|
|
|
— |
|
|
|
25,204 |
|
NH-Amundi Global Infrastructure Trust 14 |
|
|
61,004 |
|
|
|
30.00 |
|
|
|
18,301 |
|
|
|
— |
|
|
|
— |
|
|
|
18,301 |
|
Jarvis Memorial Private Investment Trust 1 |
|
|
10,210 |
|
|
|
99.01 |
|
|
|
10,109 |
|
|
|
— |
|
|
|
— |
|
|
|
10,109 |
|
Vestas Qualified Investors Private Real Estate Fund Investment
Trust No.37 |
|
|
55,254 |
|
|
|
60.00 |
|
|
|
33,153 |
|
|
|
— |
|
|
|
— |
|
|
|
33,153 |
|
Milestone Private Real Estate Fund 3 |
|
|
57,842 |
|
|
|
32.06 |
|
|
|
18,544 |
|
|
|
— |
|
|
|
— |
|
|
|
18,544 |
|
Nomura-Rifa Private Real Estate Investment Trust 31 |
|
|
25,108 |
|
|
|
31.31 |
|
|
|
7,902 |
|
|
|
— |
|
|
|
— |
|
|
|
7,902 |
|
SH Senior Loan Professional Investment Type Private Mixed Asset Investment Trust No.2 |
|
|
48,124 |
|
|
|
21.27 |
|
|
|
10,236 |
|
|
|
— |
|
|
|
— |
|
|
|
10,236 |
|
Cape IT Fund No.3 |
|
|
30,599 |
|
|
|
32.89 |
|
|
|
10,065 |
|
|
|
— |
|
|
|
— |
|
|
|
10,065 |
|
FuturePlay-Shinhan TechInnovation Fund 1 |
|
|
14,297 |
|
|
|
50.00 |
|
|
|
7,149 |
|
|
|
— |
|
|
|
— |
|
|
|
7,149 |
|
Stonebridge Corporate 1st Fund |
|
|
6,718 |
|
|
|
44.12 |
|
|
|
2,964 |
|
|
|
— |
|
|
|
— |
|
|
|
2,964 |
|
Vogo Realty Partners Private Real Estate Fund V |
|
|
49,760 |
|
|
|
21.64 |
|
|
|
10,766 |
|
|
|
— |
|
|
|
— |
|
|
|
10,766 |
|
SHINHAN FINANCIAL GROUP CO., LTD. AND SUBSIDIARIES
Notes to the Consolidated Financial Statements
|
Investments in associates (continued) |
|
|
|
|
|
|
|
|
|
|
|
|
|
|
|
|
|
|
|
|
|
|
|
|
|
|
|
|
|
| |
|
|
|
|
|
|
|
Interests
in the net
assets |
|
|
|
|
|
|
|
|
|
|
| |
|
|
85,497 |
|
|
|
9.00 |
|
|
|
7,695 |
|
|
|
— |
|
|
|
— |
|
|
|
7,695 |
|
Goduck Gangil1 PFV Co., Ltd(*1) |
|
|
(15,763 |
) |
|
|
1.04 |
|
|
|
(164 |
) |
|
|
— |
|
|
|
164 |
|
|
|
— |
|
| |
|
|
158,286 |
|
|
|
25.00 |
|
|
|
34,581 |
|
|
|
— |
|
|
|
(4,995 |
) |
|
|
29,586 |
|
NH-amundi global infra private fund 16 |
|
|
104,016 |
|
|
|
50.00 |
|
|
|
52,008 |
|
|
|
— |
|
|
|
— |
|
|
|
52,008 |
|
IMM Global Private Equity Fund |
|
|
359,415 |
|
|
|
33.00 |
|
|
|
118,615 |
|
|
|
— |
|
|
|
— |
|
|
|
118,615 |
|
HANA Alternative Estate Professional Private122 |
|
|
39,840 |
|
|
|
74.02 |
|
|
|
29,489 |
|
|
|
— |
|
|
|
— |
|
|
|
29,489 |
|
SH Corporate Professional Investment Type Private Security Investment Trust No.7 |
|
|
100,098 |
|
|
|
45.96 |
|
|
|
49,899 |
|
|
|
— |
|
|
|
— |
|
|
|
49,899 |
|
|
|
|
|
|
|
|
|
|
|
|
|
|
|
|
|
|
|
|
|
|
|
|
|
|
| SH BNCT Professional Investment Type Private Special Asset Investment Trust |
|
|
389,240 |
|
|
|
72.50 |
|
|
|
282,199 |
|
|
|
— |
|
|
|
— |
|
|
|
282,199 |
|
| Deutsche Global Professional Investment Type Private Real Estate Investment Trust No. 24 |
|
|
54,158 |
|
|
|
52.28 |
|
|
|
28,312 |
|
|
|
— |
|
|
|
— |
|
|
|
28,312 |
|
| BRAIN DO PROFESSIONALE PRIVATE No. 27 |
|
|
3,351 |
|
|
|
29.13 |
|
|
|
976 |
|
|
|
— |
|
|
|
— |
|
|
|
976 |
|
| Sparklabs-Shinhan Opportunity Fund 1 |
|
|
9,372 |
|
|
|
49.50 |
|
|
|
4,640 |
|
|
|
— |
|
|
|
— |
|
|
|
4,640 |
|
| BNW Tech-Innovation Private Equity Fund |
|
|
19,702 |
|
|
|
29.85 |
|
|
|
5,881 |
|
|
|
— |
|
|
|
— |
|
|
|
5,881 |
|
| IGIS Real-estate Private Investment Trust No.33 |
|
|
33,982 |
|
|
|
40.86 |
|
|
|
13,884 |
|
|
|
— |
|
|
|
— |
|
|
|
13,884 |
|
| WWG Global Real Estate Investment Trust no.4 |
|
|
36,019 |
|
|
|
29.55 |
|
|
|
10,644 |
|
|
|
— |
|
|
|
— |
|
|
|
10,644 |
|
| Goduck Gangil10 PFV Co., Ltd(*1) |
|
|
(8,362 |
) |
|
|
19.90 |
|
|
|
(1,664 |
) |
|
|
— |
|
|
|
1,664 |
|
|
|
— |
|
| Fidelis Global Private Real Estate Trust No.2 |
|
|
25,265 |
|
|
|
78.26 |
|
|
|
19,773 |
|
|
|
— |
|
|
|
— |
|
|
|
19,773 |
|
| AIP EURO PRIVATE REAL ESTATE TRUST No. 12 |
|
|
171,489 |
|
|
|
28.70 |
|
|
|
49,217 |
|
|
|
— |
|
|
|
— |
|
|
|
49,217 |
|
| Shinhan Healthcare Fund 2(*1) |
|
|
(103 |
) |
|
|
13.68 |
|
|
|
(14 |
) |
|
|
— |
|
|
|
14 |
|
|
|
— |
|
| Pebblestone CGV Private Real Estate Trust No.1 |
|
|
28,252 |
|
|
|
48.53 |
|
|
|
13,710 |
|
|
|
— |
|
|
|
— |
|
|
|
13,710 |
|
| Shinhan AIM Real Estate Fund No.2 |
|
|
77,582 |
|
|
|
30.00 |
|
|
|
23,275 |
|
|
|
— |
|
|
|
— |
|
|
|
23,275 |
|
| Shinhan AIM Real Estate Fund No.1 |
|
|
210,908 |
|
|
|
21.01 |
|
|
|
44,312 |
|
|
|
— |
|
|
|
— |
|
|
|
44,312 |
|
| SH Daegu Green Power Cogeneration System Professional Investment Type Private Special Asset Investment Trust |
|
|
149,627 |
|
|
|
22.02 |
|
|
|
32,948 |
|
|
|
— |
|
|
|
— |
|
|
|
32,948 |
|
| SH Sangju YC Expressway Professional Investment Type Private Special Asset Investment Trust |
|
|
70,401 |
|
|
|
29.19 |
|
|
|
20,550 |
|
|
|
— |
|
|
|
— |
|
|
|
20,550 |
|
SH Global Infrastructure Professional Investment Type Private Special Asset Investment Trust No.7-2 |
|
|
26,396 |
|
|
|
71.43 |
|
|
|
18,855 |
|
|
|
— |
|
|
|
— |
|
|
|
18,855 |
|
| Korea Omega-Shinhan Project Fund I |
|
|
14,488 |
|
|
|
50.00 |
|
|
|
7,244 |
|
|
|
— |
|
|
|
— |
|
|
|
7,244 |
|
| |
|
|
8,650 |
|
|
|
38.83 |
|
|
|
3,359 |
|
|
|
— |
|
|
|
— |
|
|
|
3,359 |
|
| Samsung SRA Real Estate Professional Private 45 |
|
|
51,519 |
|
|
|
25.00 |
|
|
|
12,880 |
|
|
|
— |
|
|
|
— |
|
|
|
12,880 |
|
| IBK Global New Renewable Energy Special Asset Professional Private2 |
|
|
110,012 |
|
|
|
28.98 |
|
|
|
31,887 |
|
|
|
— |
|
|
|
— |
|
|
|
31,887 |
|
SHINHAN FINANCIAL GROUP CO., LTD. AND SUBSIDIARIES
Notes to the Consolidated Financial Statements
|
Investments in associates (continued) |
|
|
|
|
|
|
|
|
|
|
|
|
|
|
|
|
|
|
|
|
|
|
|
|
|
|
|
|
|
| |
|
|
|
|
|
|
|
Interests
in the net
assets |
|
|
|
|
|
|
|
|
|
|
| |
|
|
8,281 |
|
|
|
41.18 |
|
|
|
3,410 |
|
|
|
— |
|
|
|
— |
|
|
|
3,410 |
|
| Aone Mezzanine Opportunity Professional Private |
|
|
14,447 |
|
|
|
66.09 |
|
|
|
9,540 |
|
|
|
— |
|
|
|
— |
|
|
|
9,540 |
|
NH-Amundi US Infrastructure Private Fund2 |
|
|
104,313 |
|
|
|
25.91 |
|
|
|
27,024 |
|
|
|
— |
|
|
|
— |
|
|
|
27,024 |
|
| KB Distribution Private Real Estate1 |
|
|
49,506 |
|
|
|
62.00 |
|
|
|
30,694 |
|
|
|
— |
|
|
|
— |
|
|
|
30,694 |
|
| SH Japan Photovoltaic Private Special Asset Investment Trust No.2 |
|
|
43,385 |
|
|
|
30.00 |
|
|
|
13,016 |
|
|
|
— |
|
|
|
— |
|
|
|
13,016 |
|
| Kakao-Shinhan 1st TNYT Fund |
|
|
29,815 |
|
|
|
48.62 |
|
|
|
14,497 |
|
|
|
— |
|
|
|
— |
|
|
|
14,497 |
|
IMM Special Situation 1-2 PRIVATE EQUITY FUND |
|
|
57,962 |
|
|
|
20.00 |
|
|
|
11,593 |
|
|
|
— |
|
|
|
— |
|
|
|
11,593 |
|
| Pacific Private Placement Real Estate Fund No.40 |
|
|
46,898 |
|
|
|
24.73 |
|
|
|
11,598 |
|
|
|
— |
|
|
|
— |
|
|
|
11,598 |
|
| Mastern Private Real Estate Loan Fund No.2 |
|
|
22,314 |
|
|
|
33.57 |
|
|
|
7,491 |
|
|
|
— |
|
|
|
— |
|
|
|
7,491 |
|
| LB Scotland Amazon Fulfillment Center Fund 29 |
|
|
44,577 |
|
|
|
70.14 |
|
|
|
31,268 |
|
|
|
— |
|
|
|
— |
|
|
|
31,268 |
|
| JR AMC Hungary Budapest Office Fund 16 |
|
|
37,274 |
|
|
|
32.57 |
|
|
|
12,140 |
|
|
|
— |
|
|
|
— |
|
|
|
12,140 |
|
| EDNCENTRAL Co.,Ltd.(*1) |
|
|
(2,487 |
) |
|
|
19.87 |
|
|
|
(494 |
) |
|
|
— |
|
|
|
494 |
|
|
|
— |
|
| Future-Creation Neoplux Venture Capital Fund |
|
|
18,569 |
|
|
|
16.25 |
|
|
|
3,017 |
|
|
|
— |
|
|
|
— |
|
|
|
3,017 |
|
| Gyeonggi-Neoplux Superman Fund |
|
|
36,195 |
|
|
|
21.76 |
|
|
|
7,878 |
|
|
|
— |
|
|
|
— |
|
|
|
7,878 |
|
| NewWave 6th Fund |
|
|
48,185 |
|
|
|
30.00 |
|
|
|
14,455 |
|
|
|
— |
|
|
|
— |
|
|
|
14,455 |
|
KTC-NP Growth Champ 2011-2 Private Equity Fund |
|
|
71,829 |
|
|
|
5.56 |
|
|
|
3,990 |
|
|
|
— |
|
|
|
— |
|
|
|
3,990 |
|
| Neoplux No.3 Private Equity Fund |
|
|
226,008 |
|
|
|
10.00 |
|
|
|
22,601 |
|
|
|
— |
|
|
|
— |
|
|
|
22,601 |
|
| PCC Amberstone Private Equity Fund I |
|
|
105,169 |
|
|
|
21.67 |
|
|
|
22,790 |
|
|
|
— |
|
|
|
— |
|
|
|
22,790 |
|
| KIAMCO POWERLOAN TRUST 4TH |
|
|
95,634 |
|
|
|
47.37 |
|
|
|
45,301 |
|
|
|
— |
|
|
|
— |
|
|
|
45,301 |
|
| Mastern Opportunity Seeking Real Estate Fund II |
|
|
106,584 |
|
|
|
20.00 |
|
|
|
21,317 |
|
|
|
— |
|
|
|
— |
|
|
|
21,317 |
|
| AION ELFIS PROFESSIONAL PRIVATE 1 |
|
|
22,112 |
|
|
|
20.00 |
|
|
|
4,422 |
|
|
|
— |
|
|
|
— |
|
|
|
4,422 |
|
T&F 2020 SS Private Equity Fund Specializing in Start-up and Venture Business |
|
|
14,688 |
|
|
|
29.68 |
|
|
|
4,360 |
|
|
|
— |
|
|
|
— |
|
|
|
4,360 |
|
| Neoplux Market-Frontier Secondary Fund |
|
|
57,319 |
|
|
|
19.74 |
|
|
|
11,313 |
|
|
|
— |
|
|
|
— |
|
|
|
11,313 |
|
| Harvest Private Equity Fund II |
|
|
15,780 |
|
|
|
22.06 |
|
|
|
3,481 |
|
|
|
— |
|
|
|
— |
|
|
|
3,481 |
|
Synergy Green New Deal 1st New Technology Business Investment Fund |
|
|
34,379 |
|
|
|
28.17 |
|
|
|
9,684 |
|
|
|
— |
|
|
|
— |
|
|
|
9,684 |
|
| KAIM Real-estate Private Investment Trust 20 |
|
|
13,125 |
|
|
|
38.46 |
|
|
|
5,048 |
|
|
|
— |
|
|
|
— |
|
|
|
5,048 |
|
| KIAMCO Vietnam Solar Special Asset Private Investment Trust |
|
|
15,053 |
|
|
|
50.00 |
|
|
|
7,527 |
|
|
|
— |
|
|
|
— |
|
|
|
7,527 |
|
| Daishin New Technology Investment Fund 5th |
|
|
18,940 |
|
|
|
23.44 |
|
|
|
4,439 |
|
|
|
— |
|
|
|
— |
|
|
|
4,439 |
|
| CSQUARE SNIPER PROFESSIONAL PRIVATE 10 |
|
|
5,194 |
|
|
|
62.50 |
|
|
|
3,247 |
|
|
|
— |
|
|
|
— |
|
|
|
3,247 |
|
| Acurus Hyundai Investment Partners New Technology |
|
|
17,600 |
|
|
|
26.79 |
|
|
|
4,714 |
|
|
|
— |
|
|
|
— |
|
|
|
4,714 |
|
IGIS GLIP Professional Investment Private Real Estate Investment Trust No. 1-1 |
|
|
60,681 |
|
|
|
97.10 |
|
|
|
63,944 |
|
|
|
— |
|
|
|
— |
|
|
|
63,944 |
|
IGIS GLIP Professional Investment Private Real Estate Investment Trust No. 1-2 |
|
|
60,681 |
|
|
|
97.10 |
|
|
|
63,944 |
|
|
|
— |
|
|
|
— |
|
|
|
63,944 |
|
SHINHAN FINANCIAL GROUP CO., LTD. AND SUBSIDIARIES
Notes to the Consolidated Financial Statements
(In millions of won)
|
Investments in associates (continued) |
|
|
|
|
|
|
|
|
|
|
|
|
|
|
|
|
|
|
|
|
|
|
|
|
|
|
|
|
|
| |
|
|
|
|
|
|
|
Interests
in the net
assets |
|
|
|
|
|
|
|
|
|
|
|
|
|
|
|
|
|
|
|
|
|
|
|
|
|
|
|
|
|
|
|
|
|
|
|
|
|
|
|
|
|
|
|
|
|
|
|
|
|
|
|
|
|
|
|
|
|
|
|
|
|
|
|
|
|
|
|
|
|
|
|
|
|
|
|
|
|
|
|
|
|
|
|
|
|
| Pacific Sunny Professional Investors Private Placement Real
Estate Investment Company No.45 |
|
W |
40,385 |
|
|
|
25.00 |
|
|
|
14,778 |
|
|
|
— |
|
|
|
— |
|
|
|
14,778 |
|
SHINHAN-NEO Core Industrial Technology Fund |
|
|
11,439 |
|
|
|
49.75 |
|
|
|
5,691 |
|
|
|
— |
|
|
|
— |
|
|
|
5,691 |
|
| SHBNPP Green New Deal Energy Professional Investment
Type Private Special Asset Investment Trust No.2 |
|
|
90,810 |
|
|
|
30.00 |
|
|
|
27,243 |
|
|
|
— |
|
|
|
— |
|
|
|
27,243 |
|
| SIMONE Mezzanine Fund No.3 |
|
|
10,395 |
|
|
|
29.38 |
|
|
|
3,054 |
|
|
|
— |
|
|
|
— |
|
|
|
3,054 |
|
| Eum Private Equity Fund No.7 |
|
|
37,495 |
|
|
|
21.00 |
|
|
|
7,873 |
|
|
|
— |
|
|
|
— |
|
|
|
7,873 |
|
Kiwoom Private Equity Ant-Man Startup Venture Specialized Private Equity Fund |
|
|
30,375 |
|
|
|
25.00 |
|
|
|
7,594 |
|
|
|
— |
|
|
|
— |
|
|
|
7,594 |
|
| Kiwoom Hero No.4 Private Equity Fund |
|
|
20,449 |
|
|
|
21.05 |
|
|
|
4,305 |
|
|
|
— |
|
|
|
— |
|
|
|
4,305 |
|
| Vogo Canister Professional Trust Private Fund I |
|
|
112,433 |
|
|
|
36.53 |
|
|
|
41,072 |
|
|
|
— |
|
|
|
— |
|
|
|
41,072 |
|
| SW-S Fund |
|
|
22,191 |
|
|
|
30.30 |
|
|
|
6,724 |
|
|
|
— |
|
|
|
— |
|
|
|
6,724 |
|
| CL Buyout 1st PEF |
|
|
64,359 |
|
|
|
21.43 |
|
|
|
13,791 |
|
|
|
— |
|
|
|
— |
|
|
|
13,791 |
|
Timefolio The Venture-V second |
|
|
22,060 |
|
|
|
20.73 |
|
|
|
4,572 |
|
|
|
— |
|
|
|
— |
|
|
|
4,572 |
|
| Newlake Growth Capital Partners2 PEF |
|
|
43,187 |
|
|
|
29.91 |
|
|
|
12,921 |
|
|
|
— |
|
|
|
— |
|
|
|
12,921 |
|
| Shinhan Smilegate Global PEF I |
|
|
23,469 |
|
|
|
14.21 |
|
|
|
3,336 |
|
|
|
— |
|
|
|
— |
|
|
|
3,336 |
|
| Fount Professional Investors Private Investment Trust No.3 |
|
|
10,399 |
|
|
|
49.98 |
|
|
|
5,197 |
|
|
|
— |
|
|
|
— |
|
|
|
5,197 |
|
| Genesis Eco No.1 PEF |
|
|
38,365 |
|
|
|
29.01 |
|
|
|
11,130 |
|
|
|
— |
|
|
|
— |
|
|
|
11,130 |
|
SHINHAN-NEO Market-Frontier 2nd Fund |
|
|
57,625 |
|
|
|
42.70 |
|
|
|
24,606 |
|
|
|
— |
|
|
|
— |
|
|
|
24,606 |
|
NH-Synergy Core Industrial New Technology Fund |
|
|
17,430 |
|
|
|
36.93 |
|
|
|
6,437 |
|
|
|
— |
|
|
|
— |
|
|
|
6,437 |
|
| J& Moorim Jade Investment Fund |
|
|
22,259 |
|
|
|
24.89 |
|
|
|
5,540 |
|
|
|
— |
|
|
|
— |
|
|
|
5,540 |
|
| Ulmus SHC innovation investment fund |
|
|
21,601 |
|
|
|
24.04 |
|
|
|
5,192 |
|
|
|
— |
|
|
|
— |
|
|
|
5,192 |
|
| Mirae Asset Partners X Private Equity Fund |
|
|
22,002 |
|
|
|
35.71 |
|
|
|
7,858 |
|
|
|
— |
|
|
|
— |
|
|
|
7,858 |
|
| T Core Industrial Technology 1st Venture PEF |
|
|
14,413 |
|
|
|
31.47 |
|
|
|
4,535 |
|
|
|
— |
|
|
|
— |
|
|
|
4,535 |
|
| Curious Finale Corporate Recovery Private Equity Fund |
|
|
13,285 |
|
|
|
27.78 |
|
|
|
3,690 |
|
|
|
— |
|
|
|
— |
|
|
|
3,690 |
|
| TI First Property Private Investment Trust 1 |
|
|
7,637 |
|
|
|
40.00 |
|
|
|
3,055 |
|
|
|
— |
|
|
|
— |
|
|
|
3,055 |
|
| MPLUS Professional Private Real Estate Fund 25 |
|
|
7,896 |
|
|
|
41.67 |
|
|
|
3,290 |
|
|
|
— |
|
|
|
— |
|
|
|
3,290 |
|
| IBKC Global Contents Investment Fund |
|
|
20,265 |
|
|
|
24.39 |
|
|
|
4,943 |
|
|
|
— |
|
|
|
— |
|
|
|
4,943 |
|
| Nautic Smart No.6 Private Equity Fund |
|
|
10,533 |
|
|
|
37.74 |
|
|
|
3,974 |
|
|
|
— |
|
|
|
— |
|
|
|
3,974 |
|
| Premier Luminous Private Equity Fund |
|
|
25,167 |
|
|
|
27.78 |
|
|
|
6,991 |
|
|
|
— |
|
|
|
— |
|
|
|
6,991 |
|
| Hanyang-Meritz 1 Fund |
|
|
15,423 |
|
|
|
22.58 |
|
|
|
3,483 |
|
|
|
— |
|
|
|
— |
|
|
|
3,483 |
|
| KNT 2ND PRIVATE EQUITY FUND |
|
|
19,124 |
|
|
|
21.74 |
|
|
|
4,157 |
|
|
|
— |
|
|
|
— |
|
|
|
4,157 |
|
SHINHAN FINANCIAL GROUP CO., LTD. AND SUBSIDIARIES
Notes to the Consolidated Financial Statements
|
Investments in associates (continued) |
|
|
|
|
|
|
|
|
|
|
|
|
|
|
|
|
|
|
|
|
|
|
|
|
|
|
|
|
|
| |
|
|
|
|
|
|
|
Interests
in the net
assets |
|
|
|
|
|
|
|
|
|
|
| Maple Mobility Fund |
|
W |
43,023 |
|
|
|
20.18 |
|
|
|
8,683 |
|
|
|
— |
|
|
|
— |
|
|
|
8,683 |
|
| AVES 1st Corporate Recovery Private Equity Fund |
|
|
6,215 |
|
|
|
76.19 |
|
|
|
4,736 |
|
|
|
— |
|
|
|
— |
|
|
|
4,736 |
|
| JS Shinhan Private Equity Fund |
|
|
130,966 |
|
|
|
3.85 |
|
|
|
5,037 |
|
|
|
— |
|
|
|
— |
|
|
|
5,037 |
|
Daishin Newgen New Technology Investment Fund 1 st |
|
|
24,048 |
|
|
|
50.60 |
|
|
|
12,169 |
|
|
|
— |
|
|
|
— |
|
|
|
12,169 |
|
| META ESG Private Equity Fund I |
|
|
21,722 |
|
|
|
27.40 |
|
|
|
5,677 |
|
|
|
— |
|
|
|
— |
|
|
|
5,677 |
|
| |
|
|
23,965 |
|
|
|
40.25 |
|
|
|
9,646 |
|
|
|
— |
|
|
|
— |
|
|
|
9,646 |
|
| PHAROS DK FUND |
|
|
16,289 |
|
|
|
24.24 |
|
|
|
3,949 |
|
|
|
— |
|
|
|
— |
|
|
|
3,949 |
|
| Shinhan VC tomorrow venture fund 1 |
|
|
22,603 |
|
|
|
39.62 |
|
|
|
9,042 |
|
|
|
— |
|
|
|
— |
|
|
|
9,042 |
|
| |
|
|
14,998 |
|
|
|
32.67 |
|
|
|
4,899 |
|
|
|
— |
|
|
|
— |
|
|
|
4,899 |
|
| |
|
|
39,202 |
|
|
|
24.81 |
|
|
|
9,728 |
|
|
|
— |
|
|
|
— |
|
|
|
9,728 |
|
| Tres-Yujin Trust |
|
|
19,989 |
|
|
|
50.00 |
|
|
|
9,995 |
|
|
|
— |
|
|
|
— |
|
|
|
9,995 |
|
| Shinhan-Time mezzanine blind Fund |
|
|
29,885 |
|
|
|
50.00 |
|
|
|
14,942 |
|
|
|
— |
|
|
|
— |
|
|
|
14,942 |
|
| Capstone REITs No.26 |
|
|
8,790 |
|
|
|
50.00 |
|
|
|
4,395 |
|
|
|
— |
|
|
|
— |
|
|
|
4,395 |
|
| JB Incheon-Bucheon REITS No.54 |
|
|
12,716 |
|
|
|
39.31 |
|
|
|
4,999 |
|
|
|
— |
|
|
|
— |
|
|
|
4,999 |
|
| Hankook Smart Real Asset Investment Trust No.3 |
|
|
13,026 |
|
|
|
33.33 |
|
|
|
4,342 |
|
|
|
— |
|
|
|
— |
|
|
|
4,342 |
|
| JB Hwaseong-Hadong REITs No.53 |
|
|
16,111 |
|
|
|
31.03 |
|
|
|
4,999 |
|
|
|
— |
|
|
|
— |
|
|
|
4,999 |
|
| KB Oaktree Trust No.3 |
|
|
9,475 |
|
|
|
33.33 |
|
|
|
3,159 |
|
|
|
— |
|
|
|
— |
|
|
|
3,159 |
|
| Daehan No.36 Office Asset Management Company(*1) |
|
|
37,891 |
|
|
|
48.05 |
|
|
|
18,206 |
|
|
|
— |
|
|
|
3,294 |
|
|
|
21,500 |
|
| Rhinos Premier Mezzanine Private Investment Fund No.1 |
|
|
10,759 |
|
|
|
27.93 |
|
|
|
3,005 |
|
|
|
— |
|
|
|
— |
|
|
|
3,005 |
|
| SH Real Estate Loan Investment Type Private Real Estate Investment Trust No.2 |
|
|
66,947 |
|
|
|
29.73 |
|
|
|
19,903 |
|
|
|
— |
|
|
|
— |
|
|
|
19,903 |
|
| Shinhan JigaeNamsan Road Private Special Asset
Investment Trust |
|
|
161,390 |
|
|
|
24.85 |
|
|
|
40,105 |
|
|
|
— |
|
|
|
— |
|
|
|
40,105 |
|
| |
|
|
19,915 |
|
|
|
29.85 |
|
|
|
5,945 |
|
|
|
— |
|
|
|
— |
|
|
|
5,945 |
|
| Others |
|
|
666,941 |
|
|
|
— |
|
|
|
367,840 |
|
|
|
— |
|
|
|
1,492 |
|
|
|
369,332 |
|
| |
|
|
|
|
|
|
|
|
|
|
|
|
|
|
|
|
|
|
|
|
|
|
|
|
| |
|
W |
8,508,993 |
|
|
|
— |
|
|
|
2,911,306 |
|
|
|
(17 |
) |
|
|
2,456 |
|
|
|
2,913,745 |
|
| |
|
|
|
|
|
|
|
|
|
|
|
|
|
|
|
|
|
|
|
|
|
|
|
|
|
(*1) |
Other represents the adjustments of fair value when acquired. |
|
(*2) |
The adjustments for others are the unrecognized equity method for preferred stocks without voting rights issued by the invested company. |
SHINHAN FINANCIAL GROUP CO., LTD. AND SUBSIDIARIES
Notes to the Consolidated Financial Statements
(In millions of won)
|
Investments in associates (continued) |
|
|
|
|
| |
|
|
|
|
|
|
|
Interests
in the net
assets |
|
|
|
|
|
|
|
|
|
|
|
|
|
|
|
|
|
|
|
|
|
|
|
|
|
|
|
|
|
|
|
|
|
|
|
| BNP Paribas Cardif Life Insurance |
|
W |
201,205 |
|
|
|
14.99 |
|
|
|
30,161 |
|
|
|
8 |
|
|
|
— |
|
|
|
30,169 |
|
| Partners 4th Growth Investment Fund |
|
|
54,165 |
|
|
|
25.00 |
|
|
|
13,542 |
|
|
|
— |
|
|
|
— |
|
|
|
13,542 |
|
| KTB Newlake Global Healthcare PEF |
|
|
20,945 |
|
|
|
20.57 |
|
|
|
4,309 |
|
|
|
— |
|
|
|
— |
|
|
|
4,309 |
|
| Shinhan-Neoplux Energy Newbiz Fund |
|
|
65,814 |
|
|
|
31.66 |
|
|
|
20,837 |
|
|
|
— |
|
|
|
— |
|
|
|
20,837 |
|
| Shinhan-Albatross tech investment Fund |
|
|
24,507 |
|
|
|
50.00 |
|
|
|
12,253 |
|
|
|
— |
|
|
|
— |
|
|
|
12,253 |
|
Meritz Investment Type Private Placement Special Asset Fund |
|
|
17,716 |
|
|
|
23.89 |
|
|
|
4,232 |
|
|
|
— |
|
|
|
— |
|
|
|
4,232 |
|
Meritz Investment Type Private Placement Special Asset Fund |
|
|
8,563 |
|
|
|
20.16 |
|
|
|
1,726 |
|
|
|
— |
|
|
|
— |
|
|
|
1,726 |
|
| VOGO Debt Strategy Qualified IV Private |
|
|
30,420 |
|
|
|
20.00 |
|
|
|
6,085 |
|
|
|
— |
|
|
|
— |
|
|
|
6,085 |
|
Shinhan -Midas Dong-A Secondary Fund |
|
|
8,863 |
|
|
|
50.00 |
|
|
|
4,431 |
|
|
|
— |
|
|
|
— |
|
|
|
4,431 |
|
| ShinHan – Soo Young Entrepreneur Investment Fund No.1 |
|
|
18,391 |
|
|
|
24.00 |
|
|
|
4,414 |
|
|
|
— |
|
|
|
— |
|
|
|
4,414 |
|
Shinhan Praxis K-Growth Global Private Equity Fund |
|
|
26,082 |
|
|
|
14.15 |
|
|
|
3,691 |
|
|
|
— |
|
|
|
— |
|
|
|
3,691 |
|
| Kiwoom Milestone Professional Private Real Estate Trust 19 |
|
|
7,922 |
|
|
|
50.00 |
|
|
|
3,961 |
|
|
|
— |
|
|
|
— |
|
|
|
3,961 |
|
| Shinhan Global Healthcare Fund 1 (*2) |
|
|
(4,518 |
) |
|
|
4.41 |
|
|
|
(199 |
) |
|
|
— |
|
|
|
199 |
|
|
|
— |
|
| KB NA Hickory Private Special Asset Fund |
|
|
91,572 |
|
|
|
37.50 |
|
|
|
34,339 |
|
|
|
— |
|
|
|
— |
|
|
|
34,339 |
|
Koramco Europe Core Private Placement Real Estate Fund No.2-2 |
|
|
43,694 |
|
|
|
44.02 |
|
|
|
19,236 |
|
|
|
— |
|
|
|
— |
|
|
|
19,236 |
|
| Hermes Private Investment Equity Fund |
|
|
19,071 |
|
|
|
29.17 |
|
|
|
5,562 |
|
|
|
— |
|
|
|
— |
|
|
|
5,562 |
|
KDBC-Midas Dong-A Global contents Fund |
|
|
18,393 |
|
|
|
23.26 |
|
|
|
4,277 |
|
|
|
— |
|
|
|
— |
|
|
|
4,277 |
|
| Shinhan-Nvestor Liquidity Solution Fund |
|
|
25,836 |
|
|
|
24.92 |
|
|
|
6,438 |
|
|
|
— |
|
|
|
— |
|
|
|
6,438 |
|
| |
|
|
40,444 |
|
|
|
25.00 |
|
|
|
10,110 |
|
|
|
— |
|
|
|
— |
|
|
|
10,110 |
|
IGIS Global Credit Fund 150-1 |
|
|
18,765 |
|
|
|
25.00 |
|
|
|
4,692 |
|
|
|
— |
|
|
|
— |
|
|
|
4,692 |
|
SHINHAN FINANCIAL GROUP CO., LTD. AND SUBSIDIARIES
Notes to the Consolidated Financial Statements
|
Investments in associates (continued) |
|
|
|
|
|
|
|
|
|
|
|
|
|
|
|
|
|
|
|
|
|
|
|
|
|
|
|
|
|
| |
|
|
|
|
|
|
|
Interests
in the net
assets |
|
|
|
|
|
|
|
|
|
|
| Partner One Value up I Private Equity Fund |
|
W |
18,428 |
|
|
|
27.91 |
|
|
|
5,144 |
|
|
|
— |
|
|
|
— |
|
|
|
5,144 |
|
| Genesis No.1 Private Equity Fund |
|
|
262,823 |
|
|
|
22.80 |
|
|
|
59,924 |
|
|
|
— |
|
|
|
— |
|
|
|
59,924 |
|
| Korea Omega Project Fund III |
|
|
15,610 |
|
|
|
23.53 |
|
|
|
3,674 |
|
|
|
— |
|
|
|
— |
|
|
|
3,674 |
|
| Genesis North America Power Company No.1 PEF |
|
|
20,760 |
|
|
|
39.11 |
|
|
|
8,118 |
|
|
|
— |
|
|
|
— |
|
|
|
8,118 |
|
| SHBNPP MAIN Professional Investment Type Private Mixed Asset Investment Trust No.3 |
|
|
185,333 |
|
|
|
23.33 |
|
|
|
43,244 |
|
|
|
— |
|
|
|
— |
|
|
|
43,244 |
|
| MIEL CO.,LTD. (*2) |
|
|
(143 |
) |
|
|
28.77 |
|
|
|
(41 |
) |
|
|
— |
|
|
|
41 |
|
|
|
— |
|
| AIP Transportation Specialized Privately Placed Fund Trust #1 |
|
|
125,459 |
|
|
|
35.73 |
|
|
|
44,821 |
|
|
|
— |
|
|
|
— |
|
|
|
44,821 |
|
| E&Healthcare Investment Fund No.6 |
|
|
2,839 |
|
|
|
21.05 |
|
|
|
597 |
|
|
|
— |
|
|
|
— |
|
|
|
597 |
|
| One Shinhan Global Fund 1 |
|
|
9,495 |
|
|
|
20.52 |
|
|
|
1,948 |
|
|
|
— |
|
|
|
— |
|
|
|
1,948 |
|
| Kiwoom-Shinhan Innovation Fund I |
|
|
18,881 |
|
|
|
50.00 |
|
|
|
9,441 |
|
|
|
— |
|
|
|
— |
|
|
|
9,441 |
|
| Midas Asset Global CRE Debt Private Fund No.6 |
|
|
138,538 |
|
|
|
41.16 |
|
|
|
57,029 |
|
|
|
— |
|
|
|
— |
|
|
|
57,029 |
|
Samchully Midstream Private Placement Special Asset Fund 5-4 |
|
|
71,352 |
|
|
|
42.92 |
|
|
|
30,624 |
|
|
|
— |
|
|
|
— |
|
|
|
30,624 |
|
| SHBNPP Senior Loan Professional Investment Type Private Mixed Asset Investment Trust No.3 |
|
|
122,456 |
|
|
|
20.00 |
|
|
|
24,492 |
|
|
|
— |
|
|
|
— |
|
|
|
24,492 |
|
NH-Amundi Global Infrastructure Trust 14 |
|
|
69,919 |
|
|
|
30.00 |
|
|
|
20,975 |
|
|
|
— |
|
|
|
— |
|
|
|
20,975 |
|
| Jarvis Memorial Private Investment Trust 1 |
|
|
9,883 |
|
|
|
99.01 |
|
|
|
9,786 |
|
|
|
— |
|
|
|
— |
|
|
|
9,786 |
|
| Vestas Qualified Investors Private Real Estate Fund Investment Trust No.37 |
|
|
55,598 |
|
|
|
60.00 |
|
|
|
33,357 |
|
|
|
— |
|
|
|
— |
|
|
|
33,357 |
|
| Milestone Private Real Estate Fund 3 (Derivative Type) |
|
|
59,485 |
|
|
|
32.06 |
|
|
|
19,071 |
|
|
|
— |
|
|
|
— |
|
|
|
19,071 |
|
| RIFA Real estate private placement fund for normal investors No. 31 |
|
|
23,519 |
|
|
|
31.31 |
|
|
|
7,364 |
|
|
|
— |
|
|
|
— |
|
|
|
7,364 |
|
| SHBNPP Senior Loan Professional Investment Type Private Mixed Asset Investment Trust No.2 |
|
|
13,961 |
|
|
|
21.27 |
|
|
|
2,969 |
|
|
|
— |
|
|
|
— |
|
|
|
2,969 |
|
T&F 2019 bearing Private Equity Fund Specializing in Start-up and Venture Business |
|
|
11,440 |
|
|
|
28.25 |
|
|
|
3,231 |
|
|
|
— |
|
|
|
— |
|
|
|
3,231 |
|
SHINHAN FINANCIAL GROUP CO., LTD. AND SUBSIDIARIES
Notes to the Consolidated Financial Statements
|
Investments in associates (continued) |
|
|
|
|
|
|
|
|
|
|
|
|
|
|
|
|
|
|
|
|
|
|
|
|
|
|
|
|
|
|
|
|
|
|
|
|
|
Interests
in the net
assets |
|
|
|
|
|
|
|
|
|
|
FuturePlay-Shinhan TechInnovation Fund 1 |
|
|
13,832 |
|
|
|
50.00 |
|
|
|
6,916 |
|
|
|
— |
|
|
|
— |
|
|
|
6,916 |
|
Stonebridge Corporate 1st Fund |
|
|
8,211 |
|
|
|
44.12 |
|
|
|
3,622 |
|
|
|
— |
|
|
|
— |
|
|
|
3,622 |
|
Vogo Realty Partners Private Real Estate Fund V |
|
|
50,446 |
|
|
|
21.64 |
|
|
|
10,915 |
|
|
|
— |
|
|
|
— |
|
|
|
10,915 |
|
|
|
|
55,999 |
|
|
|
9.00 |
|
|
|
5,039 |
|
|
|
— |
|
|
|
— |
|
|
|
5,039 |
|
Goduck Gangil1 PFV Co., Ltd. |
|
|
5,715 |
|
|
|
1.04 |
|
|
|
60 |
|
|
|
— |
|
|
|
— |
|
|
|
60 |
|
SBC PFV Co., Ltd. (*3) |
|
|
133,851 |
|
|
|
25.00 |
|
|
|
33,463 |
|
|
|
— |
|
|
|
(4,995 |
) |
|
|
28,468 |
|
NH-amundi global infra private fund 16 |
|
|
112,423 |
|
|
|
50.00 |
|
|
|
56,211 |
|
|
|
— |
|
|
|
— |
|
|
|
56,211 |
|
IMM Global Private Equity Fund |
|
|
446,586 |
|
|
|
33.00 |
|
|
|
147,384 |
|
|
|
— |
|
|
|
— |
|
|
|
147,384 |
|
SHBNPP BNCT Professional Investment Type Private Special Asset Investment Trust |
|
|
362,830 |
|
|
|
72.50 |
|
|
|
263,052 |
|
|
|
— |
|
|
|
— |
|
|
|
263,052 |
|
Deutsche Global Professional Investment Type Private Real Estate Investment Trust No. 24 |
|
|
43,389 |
|
|
|
52.28 |
|
|
|
22,683 |
|
|
|
— |
|
|
|
— |
|
|
|
22,683 |
|
Sparklabs-Shinhan Opportunity Fund 1 |
|
|
9,356 |
|
|
|
49.50 |
|
|
|
4,631 |
|
|
|
— |
|
|
|
— |
|
|
|
4,631 |
|
BNW Tech-Innovation Private Equity Fund |
|
|
19,540 |
|
|
|
29.85 |
|
|
|
5,833 |
|
|
|
— |
|
|
|
— |
|
|
|
5,833 |
|
IGIS Real-estate Private Investment Trust No.33 |
|
|
35,618 |
|
|
|
40.86 |
|
|
|
14,552 |
|
|
|
— |
|
|
|
— |
|
|
|
14,552 |
|
WWG Global Real Estate Investment Trust no.4 |
|
|
34,959 |
|
|
|
29.55 |
|
|
|
10,331 |
|
|
|
— |
|
|
|
— |
|
|
|
10,331 |
|
Goduck Gangil10 PFV Co., Ltd. |
|
|
16,263 |
|
|
|
19.90 |
|
|
|
3,236 |
|
|
|
— |
|
|
|
— |
|
|
|
3,236 |
|
Fidelis Global Private Real Estate Trust No.2 (*1) |
|
|
30,185 |
|
|
|
79.70 |
|
|
|
24,055 |
|
|
|
— |
|
|
|
(2,110 |
) |
|
|
21,945 |
|
AIP EURO PRIVATE REAL ESTATE TRUST No. 12 |
|
|
168,735 |
|
|
|
28.70 |
|
|
|
48,427 |
|
|
|
— |
|
|
|
— |
|
|
|
48,427 |
|
Shinhan Global Healthcare Fund 2 (*2) |
|
|
(160 |
) |
|
|
13.68 |
|
|
|
(22 |
) |
|
|
— |
|
|
|
22 |
|
|
|
— |
|
Shinhan AIM Real Estate Fund No.2 |
|
|
84,140 |
|
|
|
30.00 |
|
|
|
25,243 |
|
|
|
— |
|
|
|
— |
|
|
|
25,243 |
|
Shinhan AIM Real Estate Fund No.1 |
|
|
212,475 |
|
|
|
21.01 |
|
|
|
44,642 |
|
|
|
— |
|
|
|
— |
|
|
|
44,642 |
|
SHBNPP Daegu Green Power Cogeneration System Professional Investment Type Private Special Asset Investment Trust |
|
|
148,161 |
|
|
|
22.02 |
|
|
|
32,627 |
|
|
|
— |
|
|
|
— |
|
|
|
32,627 |
|
SHBNPP Sangju YC Expressway Professional Investment Type Private Special Asset Investment Trust |
|
|
66,107 |
|
|
|
29.19 |
|
|
|
19,296 |
|
|
|
— |
|
|
|
— |
|
|
|
19,296 |
|
SHINHAN FINANCIAL GROUP CO., LTD. AND SUBSIDIARIES
Notes to the Consolidated Financial Statements
|
Investments in associates (continued) |
|
|
|
|
|
|
|
|
|
|
|
|
|
|
|
|
|
|
|
|
|
|
|
|
|
|
|
|
|
|
|
|
|
|
|
|
|
Interests
in the net
assets |
|
|
|
|
|
|
|
|
|
|
|
|
|
|
|
|
|
|
|
|
|
|
|
|
|
|
|
|
|
|
|
|
|
|
|
SHBNPP Global Infrastructure Professional Investment Type Private Special Asset Investment Trust No.7-2 |
|
W |
34,437 |
|
|
|
71.43 |
|
|
|
24,598 |
|
|
|
— |
|
|
|
— |
|
|
|
24,598 |
|
Korea Omega-Shinhan Project Fund I |
|
|
20,043 |
|
|
|
50.00 |
|
|
|
10,022 |
|
|
|
— |
|
|
|
— |
|
|
|
10,022 |
|
|
|
|
6,775 |
|
|
|
38.83 |
|
|
|
2,631 |
|
|
|
— |
|
|
|
— |
|
|
|
2,631 |
|
Samsung SRA Real Estate Professional Private 45[FoFs] (*1) |
|
|
86,123 |
|
|
|
25.00 |
|
|
|
21,531 |
|
|
|
— |
|
|
|
119 |
|
|
|
21,650 |
|
IBK Global New Renewable Energy Special Asset Professional Private2 |
|
|
115,270 |
|
|
|
28.98 |
|
|
|
33,412 |
|
|
|
— |
|
|
|
— |
|
|
|
33,412 |
|
VS Cornerstone Fund |
|
|
8,098 |
|
|
|
41.18 |
|
|
|
3,335 |
|
|
|
— |
|
|
|
— |
|
|
|
3,335 |
|
Aone Mezzanine Opportunity Professional Private |
|
|
7,777 |
|
|
|
64.41 |
|
|
|
5,009 |
|
|
|
— |
|
|
|
— |
|
|
|
5,009 |
|
NH-Amundi US Infrastructure Private Fund2 |
|
|
123,291 |
|
|
|
25.91 |
|
|
|
31,941 |
|
|
|
— |
|
|
|
— |
|
|
|
31,941 |
|
SHBNPP Japan Photovoltaic Private Special Asset Investment Trust No.2 |
|
|
21,103 |
|
|
|
30.00 |
|
|
|
6,332 |
|
|
|
— |
|
|
|
— |
|
|
|
6,332 |
|
Kakao-Shinhan 1st TNYT Fund |
|
|
43,869 |
|
|
|
48.62 |
|
|
|
21,330 |
|
|
|
— |
|
|
|
— |
|
|
|
21,330 |
|
IMM Special Situation 1-2 PRIVATE EQUITY FUND |
|
|
13,019 |
|
|
|
20.00 |
|
|
|
2,603 |
|
|
|
— |
|
|
|
— |
|
|
|
2,603 |
|
Pacific Private Placement Real Estate Fund No.40 |
|
|
46,997 |
|
|
|
24.73 |
|
|
|
11,622 |
|
|
|
— |
|
|
|
— |
|
|
|
11,622 |
|
Mastern Private Real Estate Loan Fund No.2 |
|
|
19,025 |
|
|
|
33.57 |
|
|
|
6,387 |
|
|
|
— |
|
|
|
— |
|
|
|
6,387 |
|
LB Scotland Amazon Fulfillment Center Fund 29 |
|
|
42,252 |
|
|
|
70.14 |
|
|
|
29,637 |
|
|
|
— |
|
|
|
— |
|
|
|
29,637 |
|
JR AMC Hungary Budapest Office Fund 16 |
|
|
38,247 |
|
|
|
32.57 |
|
|
|
12,457 |
|
|
|
— |
|
|
|
— |
|
|
|
12,457 |
|
EDNCENTRAL Co.,Ltd. (*2) |
|
|
(23,437 |
) |
|
|
13.47 |
|
|
|
(3,156 |
) |
|
|
— |
|
|
|
3,156 |
|
|
|
— |
|
Future-Creation Neoplux Venture Capital Fund |
|
|
26,160 |
|
|
|
16.25 |
|
|
|
4,251 |
|
|
|
— |
|
|
|
— |
|
|
|
4,251 |
|
Gyeonggi-Neoplux Superman Fund |
|
|
25,116 |
|
|
|
21.76 |
|
|
|
5,467 |
|
|
|
— |
|
|
|
— |
|
|
|
5,467 |
|
NewWave 6th Fund |
|
|
45,132 |
|
|
|
30.00 |
|
|
|
13,540 |
|
|
|
— |
|
|
|
— |
|
|
|
13,540 |
|
KTC-NP Growth Champ 2011-2 Private Equity Fund |
|
|
21,721 |
|
|
|
5.56 |
|
|
|
1,207 |
|
|
|
— |
|
|
|
— |
|
|
|
1,207 |
|
Neoplux No.3 Private Equity Fund |
|
|
204,529 |
|
|
|
10.00 |
|
|
|
20,454 |
|
|
|
— |
|
|
|
— |
|
|
|
20,454 |
|
SHINHAN FINANCIAL GROUP CO., LTD. AND SUBSIDIARIES
Notes to the Consolidated Financial Statements
|
Investments in associates (continued) |
|
|
|
|
|
|
|
|
|
|
|
|
|
|
|
|
|
|
|
|
|
|
|
|
|
|
|
|
|
| |
|
|
|
|
|
|
|
Interests
in the net
assets |
|
|
|
|
|
|
|
|
|
|
PCC Amberstone Private Equity Fund I |
|
|
86,685 |
|
|
|
21.67 |
|
|
|
18,785 |
|
|
|
— |
|
|
|
— |
|
|
|
18,785 |
|
KIAMCO POWERLOAN TRUST 4TH |
|
|
91,884 |
|
|
|
47.37 |
|
|
|
43,524 |
|
|
|
— |
|
|
|
— |
|
|
|
43,524 |
|
Mastern Opportunity Seeking Real Estate Fund II |
|
|
73,544 |
|
|
|
20.00 |
|
|
|
14,710 |
|
|
|
— |
|
|
|
— |
|
|
|
14,710 |
|
AION ELFIS PROFESSIONAL PRIVATE 1 |
|
|
17,831 |
|
|
|
20.00 |
|
|
|
3,566 |
|
|
|
— |
|
|
|
— |
|
|
|
3,566 |
|
T&F 2020 SS Private Equity Fund Specializing in Start-up and Venture Business |
|
|
19,235 |
|
|
|
29.68 |
|
|
|
5,709 |
|
|
|
— |
|
|
|
— |
|
|
|
5,709 |
|
| Neoplux Market-Frontier Secondary Fund |
|
|
70,729 |
|
|
|
19.74 |
|
|
|
13,960 |
|
|
|
— |
|
|
|
— |
|
|
|
13,960 |
|
| Harvest Private Equity Fund II |
|
|
14,230 |
|
|
|
22.06 |
|
|
|
3,139 |
|
|
|
— |
|
|
|
— |
|
|
|
3,139 |
|
| Synergy Green New Deal 1st New Technology Business Investment Fund |
|
|
37,743 |
|
|
|
28.17 |
|
|
|
10,632 |
|
|
|
— |
|
|
|
— |
|
|
|
10,632 |
|
| KAIM Real-estate Private Investment Trust 20 |
|
|
3,089 |
|
|
|
38.46 |
|
|
|
1,187 |
|
|
|
— |
|
|
|
— |
|
|
|
1,187 |
|
| KIAMCO Vietnam Solar Special Asset Private Investment Trust |
|
|
13,455 |
|
|
|
50.00 |
|
|
|
6,727 |
|
|
|
— |
|
|
|
— |
|
|
|
6,727 |
|
Daishin New Technology Investment Fund 5 |
|
|
10,369 |
|
|
|
23.44 |
|
|
|
2,430 |
|
|
|
— |
|
|
|
— |
|
|
|
2,430 |
|
SHINHAN-NEO Core Industrial Technology Fund |
|
|
18,913 |
|
|
|
49.75 |
|
|
|
9,409 |
|
|
|
— |
|
|
|
— |
|
|
|
9,409 |
|
| SHBNPP Green New Deal Energy Professional Investment Type Private Special Asset Investment Trust No.2 |
|
|
83,417 |
|
|
|
30.00 |
|
|
|
25,024 |
|
|
|
— |
|
|
|
— |
|
|
|
25,024 |
|
| SIMONE Mezzanine Fund No.3 |
|
|
10,419 |
|
|
|
28.97 |
|
|
|
3,017 |
|
|
|
— |
|
|
|
— |
|
|
|
3,017 |
|
| Eum Private Equity Fund No.7 |
|
|
43,673 |
|
|
|
21.00 |
|
|
|
9,170 |
|
|
|
— |
|
|
|
— |
|
|
|
9,170 |
|
| Kiwoom Hero No.4 Private Equity Fund |
|
|
16,705 |
|
|
|
21.05 |
|
|
|
3,517 |
|
|
|
— |
|
|
|
— |
|
|
|
3,517 |
|
| Vogo Canister Professional Trust Private Fund I |
|
|
127,747 |
|
|
|
36.27 |
|
|
|
46,329 |
|
|
|
— |
|
|
|
— |
|
|
|
46,329 |
|
| SW-S Fund |
|
|
23,919 |
|
|
|
30.30 |
|
|
|
7,248 |
|
|
|
— |
|
|
|
— |
|
|
|
7,248 |
|
| CL Buyout 1st PEF |
|
|
59,930 |
|
|
|
21.43 |
|
|
|
12,842 |
|
|
|
— |
|
|
|
— |
|
|
|
12,842 |
|
Timefolio The Venture-V second |
|
|
19,764 |
|
|
|
20.73 |
|
|
|
4,096 |
|
|
|
— |
|
|
|
— |
|
|
|
4,096 |
|
| Newlake Growth Capital Partners2 PEF |
|
|
41,766 |
|
|
|
29.91 |
|
|
|
12,496 |
|
|
|
— |
|
|
|
— |
|
|
|
12,496 |
|
SHINHAN FINANCIAL GROUP CO., LTD. AND SUBSIDIARIES
Notes to the Consolidated Financial Statements
|
Investments in associates (continued) |
|
|
|
|
|
|
|
|
|
|
|
|
|
|
|
|
|
|
|
|
|
|
|
|
|
|
|
|
|
| |
|
|
|
|
|
|
|
Interests
in the net
assets |
|
|
|
|
|
|
|
|
|
|
| Shinhan Smilegate Global PEF I (*1) |
|
W |
28,792 |
|
|
|
14.21 |
|
|
|
4,091 |
|
|
|
— |
|
|
|
(320 |
) |
|
|
3,771 |
|
| Genesis Eco No.1 PEF |
|
|
39,359 |
|
|
|
29.01 |
|
|
|
11,418 |
|
|
|
— |
|
|
|
— |
|
|
|
11,418 |
|
SHINHAN-NEO Market-Frontier 2nd Fund |
|
|
80,610 |
|
|
|
42.70 |
|
|
|
34,420 |
|
|
|
— |
|
|
|
— |
|
|
|
34,420 |
|
NH-Synergy Core Industrial New Technology Fund |
|
|
17,269 |
|
|
|
36.93 |
|
|
|
6,377 |
|
|
|
— |
|
|
|
— |
|
|
|
6,377 |
|
| J& Moorim Jade Investment Fund |
|
|
21,836 |
|
|
|
24.89 |
|
|
|
5,434 |
|
|
|
— |
|
|
|
— |
|
|
|
5,434 |
|
Helios-KDBC Digital Contents 1 st |
|
|
14,431 |
|
|
|
23.26 |
|
|
|
3,356 |
|
|
|
— |
|
|
|
— |
|
|
|
3,356 |
|
| Ulmus SHC innovation investment fund |
|
|
20,326 |
|
|
|
24.04 |
|
|
|
4,886 |
|
|
|
— |
|
|
|
— |
|
|
|
4,886 |
|
| Mirae Asset Partners X Private Equity Fund |
|
|
21,817 |
|
|
|
35.71 |
|
|
|
7,792 |
|
|
|
— |
|
|
|
— |
|
|
|
7,792 |
|
| T Core Industrial Technology 1st Venture PEF |
|
|
14,393 |
|
|
|
31.47 |
|
|
|
4,529 |
|
|
|
— |
|
|
|
— |
|
|
|
4,529 |
|
| Curious Finale Corporate Recovery Private Equity Fund |
|
|
12,925 |
|
|
|
27.78 |
|
|
|
3,591 |
|
|
|
— |
|
|
|
— |
|
|
|
3,591 |
|
| TI First Property Private Investment Trust 1 |
|
|
7,817 |
|
|
|
40.00 |
|
|
|
3,127 |
|
|
|
— |
|
|
|
— |
|
|
|
3,127 |
|
| MPLUS Professional Private Real Estate Fund 25 |
|
|
10,153 |
|
|
|
41.67 |
|
|
|
4,231 |
|
|
|
— |
|
|
|
— |
|
|
|
4,231 |
|
| IBKC Global Contents Investment Fund |
|
|
18,661 |
|
|
|
24.39 |
|
|
|
4,552 |
|
|
|
— |
|
|
|
— |
|
|
|
4,552 |
|
| Nautic Smart No.6 Private Equity Fund |
|
|
3,121 |
|
|
|
37.74 |
|
|
|
1,178 |
|
|
|
— |
|
|
|
— |
|
|
|
1,178 |
|
| Premier Luminous Private Equity Fund |
|
|
35,700 |
|
|
|
25.12 |
|
|
|
8,966 |
|
|
|
— |
|
|
|
— |
|
|
|
8,966 |
|
| Hanyang-Meritz 1 Fund |
|
|
15,348 |
|
|
|
22.58 |
|
|
|
3,466 |
|
|
|
— |
|
|
|
— |
|
|
|
3,466 |
|
| KNT 2ND PRIVATE EQUITY FUND (*1) |
|
|
5,177 |
|
|
|
21.74 |
|
|
|
1,124 |
|
|
|
— |
|
|
|
(174 |
) |
|
|
950 |
|
| Kiwoom-Shinhan Innovation Fund 2 |
|
|
26,299 |
|
|
|
42.86 |
|
|
|
11,271 |
|
|
|
— |
|
|
|
— |
|
|
|
11,271 |
|
| Maple Mobility Fund |
|
|
83,539 |
|
|
|
20.18 |
|
|
|
16,859 |
|
|
|
— |
|
|
|
— |
|
|
|
16,859 |
|
| SJ ESG Innovative Growth Fund |
|
|
14,689 |
|
|
|
28.57 |
|
|
|
4,197 |
|
|
|
— |
|
|
|
— |
|
|
|
4,197 |
|
| AVES 1st Corporate Recovery Private Equity Fund |
|
|
6,638 |
|
|
|
76.19 |
|
|
|
5,057 |
|
|
|
— |
|
|
|
— |
|
|
|
5,057 |
|
| JS Shinhan Private Equity Fund |
|
|
128,727 |
|
|
|
3.85 |
|
|
|
4,953 |
|
|
|
— |
|
|
|
— |
|
|
|
4,953 |
|
| NH Kyobo AI Solution Investment Fund |
|
|
12,601 |
|
|
|
26.09 |
|
|
|
3,288 |
|
|
|
— |
|
|
|
— |
|
|
|
3,288 |
|
| Daishin Newgen New Technology Investment
Fund 1st |
|
|
11,273 |
|
|
|
50.60 |
|
|
|
5,704 |
|
|
|
— |
|
|
|
— |
|
|
|
5,704 |
|
SHINHAN FINANCIAL GROUP CO., LTD. AND SUBSIDIARIES
Notes to the Consolidated Financial Statements
|
Investments in associates (continued) |
|
|
|
|
|
|
|
|
|
|
|
|
|
|
|
|
|
|
|
|
|
|
|
|
|
|
|
|
|
| |
|
|
|
|
|
|
|
Interests
in the net
assets |
|
|
|
|
|
|
|
|
|
|
| META ESG Private Equity Fund I |
|
W |
21,380 |
|
|
|
27.40 |
|
|
|
5,857 |
|
|
|
— |
|
|
|
— |
|
|
|
5,857 |
|
| |
|
|
22,678 |
|
|
|
40.25 |
|
|
|
9,128 |
|
|
|
— |
|
|
|
— |
|
|
|
9,128 |
|
| PHAROS DK FUND |
|
|
15,886 |
|
|
|
24.14 |
|
|
|
3,835 |
|
|
|
— |
|
|
|
— |
|
|
|
3,835 |
|
| Shinhan VC tomorrow venture fund 1 |
|
|
67,958 |
|
|
|
39.62 |
|
|
|
26,926 |
|
|
|
— |
|
|
|
— |
|
|
|
26,926 |
|
| |
|
|
14,770 |
|
|
|
32.67 |
|
|
|
4,826 |
|
|
|
— |
|
|
|
— |
|
|
|
4,826 |
|
| |
|
|
38,784 |
|
|
|
24.81 |
|
|
|
9,623 |
|
|
|
— |
|
|
|
— |
|
|
|
9,623 |
|
| Stonebridge-Shinhan Unicorn Secondary Fund |
|
|
34,621 |
|
|
|
17.57 |
|
|
|
6,082 |
|
|
|
— |
|
|
|
— |
|
|
|
6,082 |
|
| Tres-Yujin Trust |
|
|
20,007 |
|
|
|
50.00 |
|
|
|
10,004 |
|
|
|
— |
|
|
|
— |
|
|
|
10,004 |
|
| Shinhan-Time mezzanine blind Fund |
|
|
26,625 |
|
|
|
50.00 |
|
|
|
13,312 |
|
|
|
— |
|
|
|
— |
|
|
|
13,312 |
|
| Capstone REITs No.26 |
|
|
7,703 |
|
|
|
50.00 |
|
|
|
3,852 |
|
|
|
— |
|
|
|
— |
|
|
|
3,852 |
|
| JB Incheon-Bucheon REITS No.54 |
|
|
12,690 |
|
|
|
39.31 |
|
|
|
4,989 |
|
|
|
— |
|
|
|
— |
|
|
|
4,989 |
|
| Hankook Smart Real Asset Investment Trust No.3 |
|
|
20,980 |
|
|
|
33.33 |
|
|
|
6,993 |
|
|
|
— |
|
|
|
— |
|
|
|
6,993 |
|
| JB Hwaseong-Hadong REITs No.53 |
|
|
16,084 |
|
|
|
31.03 |
|
|
|
4,991 |
|
|
|
— |
|
|
|
— |
|
|
|
4,991 |
|
| |
|
|
25,814 |
|
|
|
33.33 |
|
|
|
8,605 |
|
|
|
— |
|
|
|
— |
|
|
|
8,605 |
|
Daehan No.36 Office Asset Management Company (*1) |
|
|
44,964 |
|
|
|
48.05 |
|
|
|
21,604 |
|
|
|
— |
|
|
|
454 |
|
|
|
22,058 |
|
Rhinos Premier Mezzanine Private Investment Fund No.1 (*1) |
|
|
2,873 |
|
|
|
27.93 |
|
|
|
802 |
|
|
|
— |
|
|
|
2,071 |
|
|
|
2,873 |
|
SH Real Estate Loan Investment Type Private Real Estate Investment Trust No.2 |
|
|
192,851 |
|
|
|
29.73 |
|
|
|
57,334 |
|
|
|
— |
|
|
|
— |
|
|
|
57,334 |
|
Shinhan JigaeNamsan Road Private Special Asset Investment Trust |
|
|
163,267 |
|
|
|
24.85 |
|
|
|
40,571 |
|
|
|
— |
|
|
|
— |
|
|
|
40,571 |
|
| |
|
|
22,110 |
|
|
|
29.85 |
|
|
|
6,599 |
|
|
|
— |
|
|
|
— |
|
|
|
6,599 |
|
IBKC-METIS Global Contents Investment Fund |
|
|
12,513 |
|
|
|
36.36 |
|
|
|
4,550 |
|
|
|
— |
|
|
|
— |
|
|
|
4,550 |
|
Keistone Unicorn Private Equity Fund |
|
|
22,318 |
|
|
|
28.00 |
|
|
|
6,249 |
|
|
|
— |
|
|
|
— |
|
|
|
6,249 |
|
KB Distribution Private Real Estate 3-1 |
|
|
71,069 |
|
|
|
37.50 |
|
|
|
26,651 |
|
|
|
— |
|
|
|
— |
|
|
|
26,651 |
|
Pacific Private Investment Trust No.49-1 |
|
|
36,126 |
|
|
|
79.28 |
|
|
|
28,641 |
|
|
|
— |
|
|
|
— |
|
|
|
28,641 |
|
SHINHAN FINANCIAL GROUP CO., LTD. AND SUBSIDIARIES
Notes to the Consolidated Financial Statements
|
Investments in associates (continued) |
|
|
|
|
|
|
|
|
|
|
|
|
|
|
|
|
|
|
|
|
|
|
|
|
|
|
|
|
|
|
|
|
|
|
|
|
|
|
Interests
in the net
assets |
|
|
|
|
|
|
|
|
|
|
|
|
|
|
|
|
|
|
|
|
|
|
|
|
|
|
|
|
|
|
|
|
|
|
|
|
KIWOOM Real estate private placement fund for normal investors No. 31 |
|
|
|
14,264 |
|
|
|
60.00 |
|
|
|
8,558 |
|
|
|
— |
|
|
|
— |
|
|
|
8,558 |
|
RIFA Real estate private placement fund for normal investoes No. 51 |
|
|
|
14,315 |
|
|
|
40.00 |
|
|
|
5,726 |
|
|
|
— |
|
|
|
— |
|
|
|
5,726 |
|
Fivetree general private equity fund No.15 |
|
|
|
24,573 |
|
|
|
49.98 |
|
|
|
12,281 |
|
|
|
— |
|
|
|
— |
|
|
|
12,281 |
|
Shinhan-Kunicorn first Fund |
|
|
|
25,658 |
|
|
|
38.31 |
|
|
|
9,831 |
|
|
|
— |
|
|
|
— |
|
|
|
9,831 |
|
Harvest Fund No.3 |
|
|
|
35,488 |
|
|
|
44.67 |
|
|
|
15,854 |
|
|
|
— |
|
|
|
— |
|
|
|
15,854 |
|
Shinhan Simone Fund I |
|
|
|
12,468 |
|
|
|
38.46 |
|
|
|
4,796 |
|
|
|
— |
|
|
|
— |
|
|
|
4,796 |
|
Korea Investment develop seed Trust No.1 |
|
|
|
25,604 |
|
|
|
40.00 |
|
|
|
10,242 |
|
|
|
— |
|
|
|
— |
|
|
|
10,242 |
|
Tiger Green alpah Trust No.29 |
|
|
|
28,146 |
|
|
|
95.24 |
|
|
|
26,806 |
|
|
|
— |
|
|
|
— |
|
|
|
26,806 |
|
STIC ALT Global II Private Equity Fund |
|
|
|
45,350 |
|
|
|
21.74 |
|
|
|
9,859 |
|
|
|
— |
|
|
|
— |
|
|
|
9,859 |
|
|
|
|
|
46,369 |
|
|
|
25.00 |
|
|
|
11,592 |
|
|
|
— |
|
|
|
— |
|
|
|
11,592 |
|
DDI LVC Master Real Estate Investment Trust Co., Ltd. (*1) |
|
|
|
42,622 |
|
|
|
15.00 |
|
|
|
6,393 |
|
|
|
— |
|
|
|
12 |
|
|
|
6,405 |
|
Find-Green New Deal 2nd Equity Fund |
|
|
|
19,969 |
|
|
|
22.57 |
|
|
|
4,508 |
|
|
|
— |
|
|
|
— |
|
|
|
4,508 |
|
ShinhanFitrin 1st Technology Business Investment Association |
|
|
|
27,444 |
|
|
|
16.17 |
|
|
|
4,437 |
|
|
|
— |
|
|
|
— |
|
|
|
4,437 |
|
PARATUS No.3 Private Equity Fund |
|
|
|
19,249 |
|
|
|
25.64 |
|
|
|
4,936 |
|
|
|
— |
|
|
|
— |
|
|
|
4,936 |
|
Golden Route 2nd Startup Venture Specialized Private Equity Fund |
|
|
|
13,214 |
|
|
|
22.73 |
|
|
|
3,003 |
|
|
|
— |
|
|
|
— |
|
|
|
3,003 |
|
Koramco Private Real Estate Fund 143 |
|
|
|
10,000 |
|
|
|
30.30 |
|
|
|
3,030 |
|
|
|
— |
|
|
|
— |
|
|
|
3,030 |
|
Korea Investment Top Mezzanine Private Real Esate Trust No.1 |
|
|
|
44,477 |
|
|
|
22.22 |
|
|
|
9,885 |
|
|
|
— |
|
|
|
— |
|
|
|
9,885 |
|
LB YoungNam Logistics Private Trust No.40 |
|
|
|
38,992 |
|
|
|
25.00 |
|
|
|
9,748 |
|
|
|
— |
|
|
|
— |
|
|
|
9,748 |
|
Shinhan-Cognitive Start-up Fund L.P. (*1) |
|
|
|
30,358 |
|
|
|
32.74 |
|
|
|
9,939 |
|
|
|
— |
|
|
|
14 |
|
|
|
9,953 |
|
IGEN2022 No.1 private Equity Fund |
|
|
|
32,361 |
|
|
|
27.95 |
|
|
|
9,045 |
|
|
|
— |
|
|
|
— |
|
|
|
9,045 |
|
Cornerstone J&M Fund I |
|
|
|
13,353 |
|
|
|
26.67 |
|
|
|
3,561 |
|
|
|
— |
|
|
|
— |
|
|
|
3,561 |
|
Logisvalley Shinhan REIT Co.,Ltd. (*1) |
|
|
|
23,629 |
|
|
|
20.27 |
|
|
|
4,790 |
|
|
|
— |
|
|
|
(986 |
) |
|
|
3,804 |
|
SHINHAN FINANCIAL GROUP CO., LTD. AND SUBSIDIARIES
Notes to the Consolidated Financial Statements
|
Investments in associates (continued) |
|
|
|
|
|
|
|
|
|
|
|
|
|
|
|
|
|
|
|
|
|
|
|
|
|
|
|
|
|
|
|
|
|
|
|
|
|
Interests
in the net
assets |
|
|
|
|
|
|
|
|
|
|
KDB Investment Global Healthcare Private Equity Fund I |
|
W |
142,794 |
|
|
|
24.14 |
|
|
|
34,468 |
|
|
|
— |
|
|
|
— |
|
|
|
34,468 |
|
Korea Investment Green Newdeal Infra Trust No.1 |
|
|
20,431 |
|
|
|
27.97 |
|
|
|
5,714 |
|
|
|
— |
|
|
|
— |
|
|
|
5,714 |
|
BTS 2nd Private Equity Fund |
|
|
14,505 |
|
|
|
26.00 |
|
|
|
3,772 |
|
|
|
— |
|
|
|
— |
|
|
|
3,772 |
|
Shinhan Global Active REIT Co.Ltd. |
|
|
94,370 |
|
|
|
20.37 |
|
|
|
19,222 |
|
|
|
— |
|
|
|
— |
|
|
|
19,222 |
|
NH-J&-IBKC Label Technology Fund |
|
|
35,477 |
|
|
|
27.81 |
|
|
|
9,866 |
|
|
|
— |
|
|
|
— |
|
|
|
9,866 |
|
IMM Global Venture Opportunity, LP |
|
|
8,775 |
|
|
|
35.50 |
|
|
|
3,115 |
|
|
|
— |
|
|
|
— |
|
|
|
3,115 |
|
Capstone Develop Frontier Trust |
|
|
32,000 |
|
|
|
21.43 |
|
|
|
6,857 |
|
|
|
— |
|
|
|
— |
|
|
|
6,857 |
|
Nextrade Co., Ltd. (*1) |
|
|
141,421 |
|
|
|
8.00 |
|
|
|
11,314 |
|
|
|
— |
|
|
|
(1,614 |
) |
|
|
9,700 |
|
SH Sustainable Management ESG Short term Bond Security Feeder Investment Trust No.1 |
|
|
11,194 |
|
|
|
26.90 |
|
|
|
3,011 |
|
|
|
— |
|
|
|
— |
|
|
|
3,011 |
|
SH 1.5years Maturity Investment Type Security Investment Trust No.2 |
|
|
15,865 |
|
|
|
29.00 |
|
|
|
4,601 |
|
|
|
— |
|
|
|
— |
|
|
|
4,601 |
|
Eventus-IBKC LIB Fund |
|
|
27,590 |
|
|
|
21.88 |
|
|
|
6,035 |
|
|
|
— |
|
|
|
— |
|
|
|
6,035 |
|
NH-Daishin-Kyobo healthcare 1 Fund |
|
|
15,792 |
|
|
|
25.00 |
|
|
|
3,948 |
|
|
|
— |
|
|
|
— |
|
|
|
3,948 |
|
|
|
|
10,992 |
|
|
|
29.73 |
|
|
|
3,268 |
|
|
|
— |
|
|
|
— |
|
|
|
3,268 |
|
Nautic Green Innovation ESG Co-investment No.1 Private Equity Fund |
|
|
16,419 |
|
|
|
24.10 |
|
|
|
3,956 |
|
|
|
— |
|
|
|
— |
|
|
|
3,956 |
|
ON No.1 Private Equity Fund |
|
|
18,767 |
|
|
|
28.57 |
|
|
|
5,362 |
|
|
|
— |
|
|
|
— |
|
|
|
5,362 |
|
Digital New Deal Kappa Private Equity Fund |
|
|
16,420 |
|
|
|
30.12 |
|
|
|
4,946 |
|
|
|
— |
|
|
|
— |
|
|
|
4,946 |
|
Others |
|
|
797,590 |
|
|
|
— |
|
|
|
228,801 |
|
|
|
— |
|
|
|
1,422 |
|
|
|
230,223 |
|
| |
|
|
|
|
|
|
|
|
|
|
|
|
|
|
|
|
|
|
|
|
|
|
|
|
| |
|
W |
9,416,618 |
|
|
|
— |
|
|
|
2,907,155 |
|
|
|
8 |
|
|
|
(2,689 |
) |
|
|
2,904,474 |
|
| |
|
|
|
|
|
|
|
|
|
|
|
|
|
|
|
|
|
|
|
|
|
|
|
|
|
(*1) |
Other represents the adjustments of fair value when acquired. |
|
(*2) |
Others are the amount of fair value adjustments that occurred at the time of acquisition and accumulated losses that were not recognized due to the suspension of equity method recognition as the investment account balance became “0” due to the accumulation of losses for the current period. |
|
(*3) |
The adjustments for others are the unrecognized equity method for preferred stocks without voting rights issued by the invested company. |
SHINHAN FINANCIAL GROUP CO., LTD. AND SUBSIDIARIES
Notes to the Consolidated Financial Statements
(In millions of won)
|
Investments in associates (continued) |
| |
(e) |
The unrecognized equity method losses as of and for the years ended December 31, 2021 and 2022 are as follows: |
|
|
|
|
|
|
|
|
|
| |
|
|
|
|
|
Unrecognized equity
method losses |
|
|
Cumulative unrecognized
equity method losses |
|
Songrim Partners |
|
W |
— |
|
|
|
(22 |
) |
MIEL CO.,LTD. |
|
|
(16 |
) |
|
|
(41 |
) |
Goduck Gangil1 PFV Co.,Ltd. |
|
|
(19 |
) |
|
|
(164 |
) |
Goduck Gangil10 PFV Co.,Ltd. |
|
|
(1,664 |
) |
|
|
(1,664 |
) |
Shinhan Global Healthcare Fund 1 |
|
|
(153 |
) |
|
|
(153 |
) |
Shinhan Global Healthcare Fund 2 |
|
|
(14 |
) |
|
|
(14 |
) |
EDNCENTRAL Co.,Ltd. |
|
|
(494 |
) |
|
|
(494 |
) |
| |
|
|
|
|
|
|
|
|
| |
|
W |
(2,360 |
) |
|
|
(2,552 |
) |
| |
|
|
|
|
|
|
|
|
|
|
|
|
|
|
|
|
|
| |
|
|
|
|
|
Unrecognized equity
method losses |
|
|
Cumulative
unrecognized equity
method losses |
|
MSTEEL Co.,Ltd. |
|
W |
(371 |
) |
|
|
(371 |
) |
MIEL CO.,LTD. |
|
|
— |
|
|
|
(41 |
) |
Shinhan Global Healthcare Fund 1 |
|
|
(61 |
) |
|
|
(214 |
) |
Shinhan Global Healthcare Fund 2 |
|
|
(82 |
) |
|
|
(96 |
) |
EDNCENTRAL Co.,Ltd. |
|
|
(504 |
) |
|
|
(998 |
) |
| |
|
|
|
|
|
|
|
|
| |
|
W |
(1,018 |
) |
|
|
(1,720 |
) |
| |
|
|
|
|
|
|
|
|
| |
(a) |
Investment properties as of December 31, 2021 and 2022 are as follows: |
|
|
|
|
|
|
|
|
|
| |
|
|
|
|
|
|
Acquisition cost |
|
W |
852,458 |
|
|
|
513,986 |
|
Accumulated depreciation |
|
|
(177,067 |
) |
|
|
(150,878 |
) |
| |
|
|
|
|
|
|
|
|
Carrying value |
|
W |
675,391 |
|
|
|
363,108 |
|
| |
|
|
|
|
|
|
|
|
SHINHAN FINANCIAL GROUP CO., LTD. AND SUBSIDIARIES
Notes to the Consolidated Financial Statements
(In millions of won)
|
Investment properties (continued) |
| |
(b) |
Changes in investment properties for the years ended December 31, 2021 and 2022 are as follows: |
|
|
|
|
|
|
|
|
|
|
|
|
|
|
|
|
Beginning balance |
|
W |
615,235 |
|
|
|
675,391 |
|
Acquisition |
|
|
8,292 |
|
|
|
10,090 |
|
Disposal |
|
|
(2,279 |
) |
|
|
(230,148 |
) |
Depreciation |
|
|
(21,616 |
) |
|
|
(18,115 |
) |
Amounts transferred from (to) property and equipment |
|
|
73,773 |
|
|
|
9,554 |
|
Amounts transferred from (to) assets held for sale(*) |
|
|
2,238 |
|
|
|
(83,664 |
) |
Foreign currency adjustment |
|
|
(252 |
) |
|
|
— |
|
| |
|
|
|
|
|
|
|
|
Ending balance |
|
W |
675,391 |
|
|
|
363,108 |
|
| |
|
|
|
|
|
|
|
|
| |
(*) |
Comprise buildings and land, etc. |
| |
(c) |
Income and expenses on investment property for the years ended December 31, 2020, 2021 and 2022 are as follows: |
|
|
|
|
|
|
|
|
|
|
|
|
|
|
|
|
|
|
|
|
|
|
|
Rental income |
|
W |
23,890 |
|
|
|
35,887 |
|
|
|
33,366 |
|
Direct operating expenses for investment properties that generated rental income |
|
|
11,951 |
|
|
|
12,033 |
|
|
|
16,980 |
|
| |
(d) |
The fair value of investment property as of December 31, 2021 and 2022 is as follows: |
|
|
|
|
|
|
|
|
|
| |
|
|
|
|
|
|
Land and buildings(*) |
|
W |
1,374,389 |
|
|
|
1,063,031 |
|
| |
(*) |
Fair value of investment properties is estimated based in the recent market transaction conditions with an independent third party and certain significant unobservable inputs. Accordingly, fair value of investment properties is classified as level 3. |
SHINHAN FINANCIAL GROUP CO., LTD. AND SUBSIDIARIES
Notes to the Consolidated Financial Statements
(In millions of won)
| |
(a) |
Other assets as of December 31, 2021 and 2022 are as follows: |
|
|
|
|
|
|
|
|
|
| |
|
|
|
|
|
|
| Accounts receivable |
|
W |
12,754,436 |
|
|
|
11,594,139 |
|
| Domestic exchange settlement debit |
|
|
6,700,373 |
|
|
|
6,034,816 |
|
| Guarantee deposits |
|
|
1,077,644 |
|
|
|
1,016,748 |
|
| Accrued income |
|
|
2,655,894 |
|
|
|
3,254,404 |
|
| Prepaid expense |
|
|
491,950 |
|
|
|
784,630 |
|
| Provisional payments |
|
|
295,149 |
|
|
|
378,993 |
|
| Sundry assets |
|
|
88,797 |
|
|
|
96,190 |
|
| Separate account assets |
|
|
9,501,135 |
|
|
|
8,086,147 |
|
| Advance payments |
|
|
207,128 |
|
|
|
288,466 |
|
| Unamortized deferred acquisition cost |
|
|
954,949 |
|
|
|
949,322 |
|
| Leased assets |
|
|
1,395,334 |
|
|
|
1,932,791 |
|
| Others |
|
|
125,815 |
|
|
|
505,230 |
|
| Discounted present value |
|
|
(30,614 |
) |
|
|
(51,864 |
) |
| Allowances for credit loss of other assets |
|
|
(244,236 |
) |
|
|
(362,174 |
) |
| |
|
|
|
|
|
|
|
|
| |
|
W 35,973,754 |
|
|
34,507,838 |
|
| |
|
|
|
|
|
|
|
|
|
(b) |
Changes in unamortized deferred acquisition cost by insurance type for the year ended December 31, 2021 and 2022 are as follows: |
|
|
|
|
|
|
|
|
|
|
|
|
|
|
|
|
|
|
|
|
|
|
|
|
|
|
|
|
|
|
|
|
|
|
Acquisition cost incurred |
|
|
|
|
|
|
|
|
|
|
|
|
|
|
|
|
| Individual insurance |
|
|
|
|
|
|
|
|
|
|
|
|
|
|
|
|
|
|
|
|
|
|
|
|
| Pure endowment insurance |
|
W |
37,504 |
|
|
|
12,386 |
|
|
|
(3,680 |
) |
|
|
8,706 |
|
|
|
(23,468 |
) |
|
|
22,742 |
|
| Death insurance |
|
|
932,922 |
|
|
|
655,210 |
|
|
|
(278,147 |
) |
|
|
377,063 |
|
|
|
(393,942 |
) |
|
|
916,043 |
|
| Endowment insurance |
|
|
8,925 |
|
|
|
19,703 |
|
|
|
(8,382 |
) |
|
|
11,321 |
|
|
|
(4,477 |
) |
|
|
15,769 |
|
| |
|
|
|
|
|
|
|
|
|
|
|
|
|
|
|
|
|
|
|
|
|
|
|
|
| |
|
|
979,351 |
|
|
|
687,299 |
|
|
|
(290,209 |
) |
|
|
397,090 |
|
|
|
(421,887 |
) |
|
|
954,554 |
|
| Group insurance |
|
|
|
|
|
|
|
|
|
|
|
|
|
|
|
|
|
|
|
|
|
|
|
|
| Pure protection |
|
|
591 |
|
|
|
170 |
|
|
|
(64 |
) |
|
|
106 |
|
|
|
(302 |
) |
|
|
395 |
|
| |
|
|
|
|
|
|
|
|
|
|
|
|
|
|
|
|
|
|
|
|
|
|
|
|
| |
|
W |
979,942 |
|
|
|
687,469 |
|
|
|
(290,273 |
) |
|
|
397,196 |
|
|
|
(422,189 |
) |
|
|
954,949 |
|
| |
|
|
|
|
|
|
|
|
|
|
|
|
|
|
|
|
|
|
|
|
|
|
|
|
SHINHAN FINANCIAL GROUP CO., LTD. AND SUBSIDIARIES
Notes to the Consolidated Financial Statements
|
|
|
|
|
|
|
|
|
|
|
|
|
|
|
|
|
|
|
|
|
|
|
|
|
|
|
|
|
|
|
|
|
|
|
|
|
|
|
|
|
Acquisition cost incurred |
|
|
Business
combination
(Note 47) |
|
|
|
|
|
|
|
|
|
|
|
|
|
|
|
|
| Individual insurance |
|
|
|
|
|
|
|
|
|
|
|
|
|
|
|
|
|
|
|
|
|
|
|
|
|
|
|
|
| Pure endowment insurance |
|
W |
22,742 |
|
|
|
10,216 |
|
|
|
(4,569 |
) |
|
|
5,647 |
|
|
|
— |
|
|
|
(12,491 |
) |
|
|
15,898 |
|
| Death insurance |
|
|
916,043 |
|
|
|
636,753 |
|
|
|
(247,827 |
) |
|
|
388,926 |
|
|
|
— |
|
|
|
(385,664 |
) |
|
|
919,305 |
|
| Endowment insurance |
|
|
15,769 |
|
|
|
15,139 |
|
|
|
(11,168 |
) |
|
|
3,971 |
|
|
|
— |
|
|
|
(5,974 |
) |
|
|
13,766 |
|
| |
|
|
|
|
|
|
|
|
|
|
|
|
|
|
|
|
|
|
|
|
|
|
|
|
|
|
|
|
| |
|
|
954,554 |
|
|
|
662,108 |
|
|
|
(263,564 |
) |
|
|
398,544 |
|
|
|
— |
|
|
|
(404,129 |
) |
|
|
948,969 |
|
| Group insurance |
|
|
|
|
|
|
|
|
|
|
|
|
|
|
|
|
|
|
|
|
|
|
|
|
|
|
|
|
| Pure protection |
|
|
395 |
|
|
|
136 |
|
|
|
(20 |
) |
|
|
116 |
|
|
|
— |
|
|
|
(168 |
) |
|
|
343 |
|
| General insurance |
|
|
|
|
|
|
|
|
|
|
|
|
|
|
|
|
|
|
|
|
|
|
|
|
|
|
|
|
| Long-term |
|
|
— |
|
|
|
— |
|
|
|
— |
|
|
|
— |
|
|
|
13 |
|
|
|
(3 |
) |
|
|
10 |
|
| |
|
|
|
|
|
|
|
|
|
|
|
|
|
|
|
|
|
|
|
|
|
|
|
|
|
|
|
|
| |
|
W |
954,949 |
|
|
|
662,244 |
|
|
|
(263,584 |
) |
|
|
398,660 |
|
|
|
13 |
|
|
|
(404,300 |
) |
|
|
949,322 |
|
| |
|
|
|
|
|
|
|
|
|
|
|
|
|
|
|
|
|
|
|
|
|
|
|
|
|
|
|
|
|
(a) |
Gross investment and present value of minimum lease payment of finance lease as of December 31, 2021 and 2022 are as follows: |
|
|
|
|
|
|
|
|
|
|
|
|
|
| |
|
|
|
| |
|
|
|
|
Unrealized interest
income |
|
|
Present value of
minimum lease
payment |
|
| Not later than 1 year |
|
W |
635,826 |
|
|
|
65,349 |
|
|
|
570,477 |
|
| 1 ~ 2 years |
|
|
470,800 |
|
|
|
39,631 |
|
|
|
431,169 |
|
| 2 ~ 3 years |
|
|
308,999 |
|
|
|
18,738 |
|
|
|
290,261 |
|
| 3 ~ 4 years |
|
|
191,257 |
|
|
|
6,606 |
|
|
|
184,651 |
|
| 4 ~ 5 years |
|
|
113,638 |
|
|
|
4,417 |
|
|
|
109,221 |
|
| Later than 5 years |
|
|
5,170 |
|
|
|
32 |
|
|
|
5,138 |
|
| |
|
|
|
|
|
|
|
|
|
|
|
|
| |
|
W |
1,725,690 |
|
|
|
134,773 |
|
|
|
1,590,917 |
|
| |
|
|
|
|
|
|
|
|
|
|
|
|
| |
(*) |
Interest income on finance lease receivables recognized for the year ended December 31, 2021 is W 60,475 million. |
SHINHAN FINANCIAL GROUP CO., LTD. AND SUBSIDIARIES
Notes to the Consolidated Financial Statements
|
|
|
|
|
|
|
|
|
|
|
|
|
| |
|
|
|
| |
|
|
|
|
Unrealized interest
income |
|
|
Present value of
minimum lease
payment |
|
| Not later than 1 year |
|
W |
654,159 |
|
|
|
82,286 |
|
|
|
571,873 |
|
| 1 ~ 2 years |
|
|
477,216 |
|
|
|
55,860 |
|
|
|
421,356 |
|
| 2 ~ 3 years |
|
|
379,998 |
|
|
|
36,353 |
|
|
|
343,645 |
|
| 3 ~ 4 years |
|
|
312,014 |
|
|
|
20,816 |
|
|
|
291,198 |
|
| 4 ~ 5 years |
|
|
250,568 |
|
|
|
7,415 |
|
|
|
243,153 |
|
| Later than 5 years |
|
|
1,682 |
|
|
|
4 |
|
|
|
1,678 |
|
| |
|
|
|
|
|
|
|
|
|
|
|
|
| |
|
W |
2,075,637 |
|
|
|
202,734 |
|
|
|
1,872,903 |
|
| |
|
|
|
|
|
|
|
|
|
|
|
|
| |
(*) |
Interest income on finance lease receivables recognized for the year ended December 31, 2022 is W 64,679 million. |
|
(b) |
Minimum lease payment receivable schedule for lease contracts of the Group as lessor as of December 31, 2021 and 2022 are as follows: |
|
|
|
|
|
|
|
|
|
|
|
|
|
| |
|
|
|
| |
|
|
|
|
|
|
|
Present value
of minimum
lease payment |
|
| Not later than 1 year |
|
W |
635,826 |
|
|
|
65,349 |
|
|
|
570,477 |
|
| 1 ~ 2 years |
|
|
470,800 |
|
|
|
39,631 |
|
|
|
431,169 |
|
| 2 ~ 3 years |
|
|
308,999 |
|
|
|
18,738 |
|
|
|
290,261 |
|
| 3 ~ 4 years |
|
|
191,257 |
|
|
|
6,606 |
|
|
|
184,651 |
|
| 4 ~ 5 years |
|
|
113,638 |
|
|
|
4,417 |
|
|
|
109,221 |
|
| Later than 5 years |
|
|
5,170 |
|
|
|
32 |
|
|
|
5,138 |
|
| |
|
|
|
|
|
|
|
|
|
|
|
|
| |
|
W |
1,725,690 |
|
|
|
134,773 |
|
|
|
1,590,917 |
|
| |
|
|
|
|
|
|
|
|
|
|
|
|
|
|
|
|
|
|
|
|
|
|
|
|
|
| |
|
|
|
| |
|
|
|
|
|
|
|
Present value
of minimum
lease payment |
|
| Not later than 1 year |
|
W |
654,159 |
|
|
|
82,286 |
|
|
|
571,873 |
|
| 1 ~ 2 years |
|
|
477,216 |
|
|
|
55,860 |
|
|
|
421,356 |
|
| 2 ~ 3 years |
|
|
379,998 |
|
|
|
36,353 |
|
|
|
343,645 |
|
| 3 ~ 4 years |
|
|
312,014 |
|
|
|
20,816 |
|
|
|
291,198 |
|
| 4 ~ 5 years |
|
|
250,568 |
|
|
|
7,415 |
|
|
|
243,153 |
|
| Later than 5 years |
|
|
1,682 |
|
|
|
4 |
|
|
|
1,678 |
|
| |
|
|
|
|
|
|
|
|
|
|
|
|
| |
|
W |
2,075,637 |
|
|
|
202,734 |
|
|
|
1,872,903 |
|
| |
|
|
|
|
|
|
|
|
|
|
|
|
SHINHAN FINANCIAL GROUP CO., LTD. AND SUBSIDIARIES
Notes to the Consolidated Financial Statements
|
|
|
|
|
|
|
|
|
| |
|
|
|
| |
|
|
|
|
|
|
| Not later than 1 year |
|
W |
371,521 |
|
|
|
513,245 |
|
| 1 ~ 2 years |
|
|
320,603 |
|
|
|
439,678 |
|
| 2 ~ 3 years |
|
|
251,720 |
|
|
|
322,125 |
|
| 3 ~ 4 years |
|
|
147,134 |
|
|
|
189,375 |
|
| 4 ~ 5 years |
|
|
53,879 |
|
|
|
72,000 |
|
| Later than 5 years |
|
|
94,143 |
|
|
|
6,997 |
|
| |
|
|
|
|
|
|
|
|
| |
|
W |
1,239,000 |
|
|
|
1,543,420 |
|
| |
|
|
|
|
|
|
|
|
|
(c) |
Changes in operating lease assets for the years ended December 31, 2021 and 2022 are as follows: |
|
|
|
|
|
|
|
|
|
| |
|
|
|
|
|
|
| Beginning balance |
|
W |
1,014,300 |
|
|
|
1,393,738 |
|
| Acquisition |
|
|
691,192 |
|
|
|
1,017,137 |
|
| Disposal |
|
|
(54,721 |
) |
|
|
(128,950 |
) |
| Depreciation |
|
|
(257,033 |
) |
|
|
(351,208 |
) |
| Amounts transferred from(to) property and equipment |
|
|
— |
|
|
|
(214 |
) |
| |
|
|
|
|
|
|
|
|
| Ending balance |
|
W |
1,393,738 |
|
|
|
1,930,503 |
|
| |
|
|
|
|
|
|
|
|
| |
(d) |
The details of the assets by the lessee’s underlying asset type as of December 31, 2021 and 2022 are as follows: |
|
|
|
|
|
|
|
|
|
|
|
|
|
| |
|
|
|
| |
|
|
|
|
|
|
|
|
|
| Real estate |
|
W |
1,153,021 |
|
|
|
(578,980 |
) |
|
|
574,041 |
|
| Vehicle |
|
|
45,670 |
|
|
|
(23,821 |
) |
|
|
21,849 |
|
| Others |
|
|
30,478 |
|
|
|
(18,241 |
) |
|
|
12,237 |
|
| |
|
|
|
|
|
|
|
|
|
|
|
|
| |
|
W |
1,229,169 |
|
|
|
(621,042 |
) |
|
|
608,127 |
|
| |
|
|
|
|
|
|
|
|
|
|
|
|
|
|
|
|
|
|
|
|
|
|
|
|
|
| |
|
|
|
| |
|
|
|
|
|
|
|
|
|
| Real estate |
|
W |
1,124,151 |
|
|
|
(538,076 |
) |
|
|
586,075 |
|
| Vehicle |
|
|
51,644 |
|
|
|
(29,317 |
) |
|
|
22,327 |
|
| Others |
|
|
32,933 |
|
|
|
(22,125 |
) |
|
|
10,808 |
|
| |
|
|
|
|
|
|
|
|
|
|
|
|
| |
|
W |
1,208,728 |
|
|
|
(589,518 |
) |
|
|
619,210 |
|
| |
|
|
|
|
|
|
|
|
|
|
|
|
SHINHAN FINANCIAL GROUP CO., LTD. AND SUBSIDIARIES
Notes to the Consolidated Financial Statements
(In millions of won)
| |
(e) |
The details of the changes in the assets for the years ended December 31, 2021 and 2022 are as follows: |
|
|
|
|
|
|
|
|
|
|
|
|
|
|
|
|
|
|
|
|
|
|
|
|
|
|
|
|
|
|
|
|
|
|
| Beginning balance |
|
W |
556,419 |
|
|
|
20,621 |
|
|
|
13,377 |
|
|
|
590,417 |
|
| Acquisition |
|
|
295,228 |
|
|
|
17,524 |
|
|
|
4,173 |
|
|
|
316,925 |
|
| Disposal |
|
|
(22,829 |
) |
|
|
(4,070 |
) |
|
|
(31 |
) |
|
|
(26,930 |
) |
| Depreciation(*) |
|
|
(271,895 |
) |
|
|
(12,408 |
) |
|
|
(5,282 |
) |
|
|
(289,585 |
) |
| Effects of foreign currency movements |
|
|
17,118 |
|
|
|
182 |
|
|
|
— |
|
|
|
17,300 |
|
| |
|
|
|
|
|
|
|
|
|
|
|
|
|
|
|
|
| Ending balance |
|
W |
574,041 |
|
|
|
21,849 |
|
|
|
12,237 |
|
|
|
608,127 |
|
| |
|
|
|
|
|
|
|
|
|
|
|
|
|
|
|
|
|
|
|
|
|
|
|
|
|
|
|
|
|
|
|
|
|
|
|
|
|
|
|
|
|
|
|
|
|
|
|
|
|
|
| Beginning balance |
|
W |
574,041 |
|
|
|
21,849 |
|
|
|
12,237 |
|
|
|
608,127 |
|
| Acquisition |
|
|
350,328 |
|
|
|
14,834 |
|
|
|
3,991 |
|
|
|
369,153 |
|
| Disposal |
|
|
(72,323 |
) |
|
|
(2,404 |
) |
|
|
(836 |
) |
|
|
(75,563 |
) |
| Depreciation(*) |
|
|
(271,299 |
) |
|
|
(12,004 |
) |
|
|
(4,583 |
) |
|
|
(287,886 |
) |
| Effects of foreign currency movements |
|
|
4,277 |
|
|
|
52 |
|
|
|
(1 |
) |
|
|
4,328 |
|
| Business combination (Note 47) |
|
|
1,051 |
|
|
|
— |
|
|
|
— |
|
|
|
1,051 |
|
| |
|
|
|
|
|
|
|
|
|
|
|
|
|
|
|
|
| Ending balance |
|
W |
586,075 |
|
|
|
22,327 |
|
|
|
10,808 |
|
|
|
619,210 |
|
| |
|
|
|
|
|
|
|
|
|
|
|
|
|
|
|
|
|
(*) |
Included in general administrative expense and other operating income(expense) of the consolidated statements of comprehensive income. |
| |
(f) |
The details of the maturity of the lease liability as of December 31, 2021 and 2022 are as follows: |
|
|
|
|
|
|
|
|
|
|
|
|
|
|
|
|
|
|
|
|
|
|
|
|
|
|
|
|
|
| |
|
|
|
| |
|
|
|
|
|
|
|
|
|
|
|
|
|
|
|
|
|
|
|
|
|
| Real estate |
|
W |
22,890 |
|
|
|
33,950 |
|
|
|
46,532 |
|
|
|
82,467 |
|
|
|
266,299 |
|
|
|
121,360 |
|
|
|
573,498 |
|
| Vehicle |
|
|
4,496 |
|
|
|
1,935 |
|
|
|
2,536 |
|
|
|
4,718 |
|
|
|
12,298 |
|
|
|
513 |
|
|
|
26,496 |
|
| Others |
|
|
465 |
|
|
|
650 |
|
|
|
1,124 |
|
|
|
2,205 |
|
|
|
8,226 |
|
|
|
26 |
|
|
|
12,696 |
|
| |
|
|
|
|
|
|
|
|
|
|
|
|
|
|
|
|
|
|
|
|
|
|
|
|
|
|
|
|
| |
|
W |
27,851 |
|
|
|
36,535 |
|
|
|
50,192 |
|
|
|
89,390 |
|
|
|
286,823 |
|
|
|
121,899 |
|
|
|
612,690 |
|
| |
|
|
|
|
|
|
|
|
|
|
|
|
|
|
|
|
|
|
|
|
|
|
|
|
|
|
|
|
|
|
|
|
|
|
|
|
|
|
|
|
|
|
|
|
|
|
|
|
|
|
|
|
|
|
|
|
|
| |
|
|
|
| |
|
|
|
|
|
|
|
|
|
|
|
|
|
|
|
|
|
|
|
|
|
| Real estate |
|
W |
26,601 |
|
|
|
34,980 |
|
|
|
48,209 |
|
|
|
84,706 |
|
|
|
315,267 |
|
|
|
74,190 |
|
|
|
583,953 |
|
| Vehicle |
|
|
4,999 |
|
|
|
1,851 |
|
|
|
2,543 |
|
|
|
4,566 |
|
|
|
13,910 |
|
|
|
92 |
|
|
|
27,961 |
|
| Others |
|
|
463 |
|
|
|
588 |
|
|
|
1,151 |
|
|
|
2,219 |
|
|
|
6,994 |
|
|
|
10 |
|
|
|
11,425 |
|
| |
|
|
|
|
|
|
|
|
|
|
|
|
|
|
|
|
|
|
|
|
|
|
|
|
|
|
|
|
| |
|
W |
32,063 |
|
|
|
37,419 |
|
|
|
51,903 |
|
|
|
91,491 |
|
|
|
336,171 |
|
|
|
74,292 |
|
|
|
623,339 |
|
| |
|
|
|
|
|
|
|
|
|
|
|
|
|
|
|
|
|
|
|
|
|
|
|
|
|
|
|
|
|
(*) |
The above amounts are based on undiscounted cash flows, and have been classified at the earliest maturity that the Group has the obligation to pay. |
SHINHAN FINANCIAL GROUP CO., LTD. AND SUBSIDIARIES
Notes to the Consolidated Financial Statements
(In millions of won)
| |
(g) |
The lease payments for low-value assets and short-term leases for the years ended December 31, 2021 and 2022 are as follows: |
|
|
|
|
|
|
|
|
|
| |
|
|
|
|
|
|
| |
|
W |
5,885 |
|
|
|
6,888 |
|
| Short-term lease (*) |
|
|
766 |
|
|
|
268 |
|
| |
|
|
|
|
|
|
|
|
| Total |
|
W |
6,651 |
|
|
|
7,156 |
|
| |
|
|
|
|
|
|
|
|
| |
(*) |
The payments for leases with terms less than 1 month are included. |
| |
(a) |
Assets pledged as collateral as of December 31, 2021 and 2022 are as follows: |
|
|
|
|
|
|
|
|
|
|
|
| |
|
|
|
|
|
|
|
|
| Securities: |
|
|
|
|
|
|
|
|
|
|
| Securities at FVTPL |
|
W |
14,944,525 |
|
|
|
12,627,388 |
|
|
Customer RP, etc. |
| Securities at FVOCI |
|
|
3,244,232 |
|
|
|
9,282,016 |
|
|
Borrowings, Settlement security for Bank of Korea, Borrowing securities, etc. |
| Securities at amortized cost |
|
|
16,284,795 |
|
|
|
15,004,325 |
|
|
Borrowings, Settlement security for Bank of Korea, Customer RP, etc. |
| |
|
|
|
|
|
|
|
|
|
|
| |
|
|
34,473,552 |
|
|
|
36,913,729 |
|
|
|
| |
|
|
|
|
|
|
|
|
|
|
| Deposits at amortized cost |
|
|
958,206 |
|
|
|
1,883,755 |
|
|
Borrowings, etc. |
| Property and Equipment (real estate) |
|
|
300,352 |
|
|
|
29,288 |
|
|
Establishing the right to collateral security, etc. |
| |
|
|
|
|
|
|
|
|
|
|
| |
|
W |
35,732,110 |
|
|
|
38,826,772 |
|
|
|
| |
|
|
|
|
|
|
|
|
|
|
| |
(*) |
The carrying values of assets pledged that the pledgees have the right to sell or re-pledge regardless of the Group’s default as of December 31, 2021 and 2022 are W 11,017,362 million and W 9,754,980 million, respectively. |
| |
(b) |
The fair value of collateral held that the Group has the right to sell or re-pledge regardless of the pledger’s default as of December 31, 2021 and 2022 are as follows: |
|
|
|
|
|
|
|
|
|
|
|
|
|
|
|
|
|
|
|
|
|
|
|
|
|
|
The fair value of
assets received
as collateral |
|
|
re-provided as collateral |
|
|
The fair value of
assets received
as collateral |
|
|
re-provided as collateral |
|
| Securities |
|
W |
2,163,744 |
|
|
|
— |
|
|
|
3,750,199 |
|
|
|
— |
|
SHINHAN FINANCIAL GROUP CO., LTD. AND SUBSIDIARIES
Notes to the Consolidated Financial Statements
(In millions of won)
| |
Deposits |
as of December 31, 2021 and 2022 are as follows: |
|
|
|
|
|
|
|
|
|
| |
|
|
|
|
|
|
| Demand deposits: |
|
|
|
|
|
|
|
|
| Korean won |
|
W |
151,787,483 |
|
|
|
132,604,867 |
|
| Foreign currencies |
|
|
20,320,241 |
|
|
|
24,841,409 |
|
| |
|
|
|
|
|
|
|
|
| |
|
|
172,107,724 |
|
|
|
157,446,276 |
|
| |
|
|
|
|
|
|
|
|
| Time deposits: |
|
|
|
|
|
|
|
|
| Korean won |
|
|
140,651,250 |
|
|
|
171,355,724 |
|
| Foreign currencies |
|
|
20,847,651 |
|
|
|
24,910,187 |
|
| |
|
|
|
|
|
|
|
|
| |
|
|
161,498,901 |
|
|
|
196,265,911 |
|
| |
|
|
|
|
|
|
|
|
| Certificates of deposits |
|
|
16,576,536 |
|
|
|
14,921,375 |
|
| Discount note deposits |
|
|
5,818,001 |
|
|
|
6,631,858 |
|
| CMA |
|
|
5,246,478 |
|
|
|
4,634,010 |
|
| Others |
|
|
3,649,035 |
|
|
|
3,111,315 |
|
| |
|
|
|
|
|
|
|
|
| |
|
W |
364,896,675 |
|
|
|
383,010,745 |
|
| |
|
|
|
|
|
|
|
|
|
Financial liabilities at fair value through profit or loss |
Financial liabilities at fair value through profit or loss as of December 31, 2021 and 2022 are as follows:
|
|
|
|
|
|
|
|
|
|
|
|
|
|
|
|
| Securities sold: |
|
|
|
|
|
|
|
|
| Stocks |
|
W |
275,451 |
|
|
|
278,341 |
|
| Bonds |
|
|
505,202 |
|
|
|
438,689 |
|
| Others |
|
|
7,114 |
|
|
|
7,074 |
|
| |
|
|
|
|
|
|
|
|
| |
|
|
787,767 |
|
|
|
724,104 |
|
| Gold/silver deposits |
|
|
581,458 |
|
|
|
422,006 |
|
| |
|
|
|
|
|
|
|
|
| |
|
W |
1,369,225 |
|
|
|
1,146,110 |
|
| |
|
|
|
|
|
|
|
|
SHINHAN FINANCIAL GROUP CO., LTD. AND SUBSIDIARIES
Notes to the Consolidated Financial Statements
|
Financial liabilities designated at fair value through profit or loss |
| |
(a) |
Financial liabilities designated at fair value through profit or loss as of December 31, 2021 and 2022 are as follows: |
|
|
|
|
|
|
|
|
|
|
|
|
|
| |
|
|
|
|
|
|
|
|
|
| Equity-linked securities sold |
|
W |
5,795,071 |
|
|
|
5,437,434 |
|
|
|
Compound financial instrument |
|
| Securities sold with embedded derivatives |
|
|
2,228,799 |
|
|
|
2,882,607 |
|
|
|
|
|
| Debt securities issued |
|
|
— |
|
|
|
47,327 |
|
|
|
Fair value measurement and management |
|
| |
|
|
|
|
|
|
|
|
|
|
|
|
| |
|
W |
8,023,870 |
|
|
|
8,367,368 |
|
|
|
|
|
| |
|
|
|
|
|
|
|
|
|
|
|
|
| |
(*) |
The Group designated the financial liabilities at the initial recognition(or subsequently) in accordance with paragraph 6.7.1 of IFRS 9 as financial liabilities at fair value through profit or loss. |
Maximum credit risk exposure of the financial liabilities designated at fair value through profit or loss amounts to
W
8,367,368 million as of December 31, 2022. Decrease in values of the liability due to credit risk changes is
W
5,919 million for the year ended December 31, 2022 and the accumulated changes in values are
W
(-)
7,014 million as of December 31, 2022.
| |
(b) |
The difference between the carrying value of financial liabilities designated at fair value through profit or loss and the amount required to be paid at contractual maturity as of December 31, 2021 and 2022 are as follows: |
|
|
|
|
|
|
|
|
|
| |
|
|
|
|
|
|
| Expiration payment |
|
W |
7,325,678 |
|
|
|
7,733,506 |
|
| Carrying value |
|
|
8,023,870 |
|
|
|
8,367,368 |
|
| |
|
|
|
|
|
|
|
|
| Difference from carrying value |
|
W |
(698,192 |
) |
|
|
(633,862 |
) |
| |
|
|
|
|
|
|
|
|
SHINHAN FINANCIAL GROUP CO., LTD. AND SUBSIDIARIES
Notes to the Consolidated Financial Statements
Borrowings as of December 31, 2021 and 2022 are as follows:
|
|
|
|
|
|
|
|
|
|
|
|
|
|
|
|
|
|
|
|
|
|
|
|
|
|
Interest
rate (%) |
|
|
Amount |
|
|
Interest
rate (%) |
|
|
Amount |
|
Borrowings denominated in Korean won: |
|
|
|
|
|
|
|
|
|
|
|
|
|
|
|
|
| Borrowings from Bank of Korea |
|
|
0.25~0.25 |
|
|
W |
5,278,331 |
|
|
|
0.25~1.75 |
|
|
W |
5,100,325 |
|
| Others |
|
|
0.00~3.93 |
|
|
|
18,412,343 |
|
|
|
0.00~7.60 |
|
|
|
23,091,971 |
|
| |
|
|
|
|
|
|
|
|
|
|
|
|
|
|
|
|
| |
|
|
|
|
|
|
23,690,674 |
|
|
|
|
|
|
|
28,192,296 |
|
| |
|
|
|
|
|
|
|
|
|
|
|
|
|
|
|
|
| Borrowings denominated in foreign currencies: |
|
|
|
|
|
|
|
|
|
|
|
|
|
|
|
|
| Overdraft due from banks |
|
|
0.00~0.30 |
|
|
|
42,434 |
|
|
|
0.00~0.30 |
|
|
|
48,072 |
|
| Borrowings from banks |
|
|
(0.49)~12.29 |
|
|
|
5,292,872 |
|
|
|
0.15~21.20 |
|
|
|
7,811,701 |
|
| Others |
|
|
0.00~11.25 |
|
|
|
1,890,291 |
|
|
|
0.00~22.65 |
|
|
|
2,397,605 |
|
| |
|
|
|
|
|
|
|
|
|
|
|
|
|
|
|
|
| |
|
|
|
|
|
|
7,225,597 |
|
|
|
|
|
|
|
10,257,378 |
|
| |
|
|
|
|
|
|
|
|
|
|
|
|
|
|
|
|
| Call money |
|
|
(0.30)~1.52 |
|
|
|
1,534,611 |
|
|
|
0.05~6.30 |
|
|
|
1,276,301 |
|
| Bill of sale |
|
|
0.00~1.47 |
|
|
|
9,032 |
|
|
|
0.00~3.95 |
|
|
|
15,057 |
|
| Bonds sold under repurchase agreements |
|
|
0.00~6.25 |
|
|
|
10,709,115 |
|
|
|
0.00~6.80 |
|
|
|
9,544,536 |
|
| Deferred origination costs |
|
|
|
|
|
|
(1,964 |
) |
|
|
|
|
|
|
(6,393 |
) |
| |
|
|
|
|
|
|
|
|
|
|
|
|
|
|
|
|
| |
|
|
|
|
|
W |
43,167,065 |
|
|
|
|
|
|
W |
49,279,175 |
|
| |
|
|
|
|
|
|
|
|
|
|
|
|
|
|
|
|
SHINHAN FINANCIAL GROUP CO., LTD. AND SUBSIDIARIES
Notes to the Consolidated Financial Statements
(In millions of won)
Debt securities issued as of December 31, 2021 and 2022 are as follows:
|
|
|
|
|
|
|
|
|
|
|
|
|
|
|
| |
|
|
|
|
|
|
| |
|
|
|
|
|
|
|
|
|
|
|
| Debt securities issued in Korean won: |
|
|
|
|
|
|
|
|
|
|
|
|
|
|
| Debt securities issued |
|
0.79~8.00 |
|
W |
64,419,771 |
|
|
|
0.05~9.00 |
|
|
W |
61,038,481 |
|
| Subordinated debt securities issued |
|
2.20~4.60 |
|
|
5,030,125 |
|
|
|
2.20~4.17 |
|
|
|
3,275,225 |
|
| Gain on fair value hedges |
|
— |
|
|
(122,069 |
) |
|
|
— |
|
|
|
(348,700 |
) |
| Discount on debt securities issued |
|
— |
|
|
(38,845 |
) |
|
|
— |
|
|
|
(37,943 |
) |
| |
|
|
|
|
|
|
|
|
|
|
|
|
|
|
| |
|
|
|
|
69,288,982 |
|
|
|
|
|
|
|
63,927,063 |
|
| |
|
|
|
|
|
|
|
|
|
|
|
|
|
|
| Debt securities issued in foreign currencies: |
|
|
|
|
|
|
|
|
|
|
|
|
|
|
| Debt securities issued |
|
0.25 ~7.59 |
|
|
7,462,087 |
|
|
|
0.25~7.59 |
|
|
|
9,586,831 |
|
| Subordinated debt securities issued |
|
3.34 ~5.10 |
|
|
3,307,306 |
|
|
|
3.34~5.10 |
|
|
|
4,145,264 |
|
| Loss(Gain) on fair value hedges |
|
— |
|
|
130,392 |
|
|
|
— |
|
|
|
(324,901 |
) |
| Discount on debt securities issued |
|
— |
|
|
(39,404 |
) |
|
|
— |
|
|
|
(45,474 |
) |
| |
|
|
|
|
|
|
|
|
|
|
|
|
|
|
| |
|
|
|
|
10,860,381 |
|
|
|
|
|
|
|
13,361,720 |
|
| |
|
|
|
|
|
|
|
|
|
|
|
|
|
|
| |
|
|
|
W |
80,149,363 |
|
|
|
|
|
|
W |
77,288,783 |
|
| |
|
|
|
|
|
|
|
|
|
|
|
|
|
|
(a) Defined benefit plan assets and obligations
The Group has operated a defined benefit plan and calculates defined benefit obligations based on the employee’s pension compensation benefits and service period.
Defined benefit obligations and plan assets as of December 31, 2021 and 2022 are as follows:
|
|
|
|
|
|
|
|
|
|
|
|
|
|
|
|
|
|
|
|
|
|
|
|
|
| Present value of defined benefit obligations |
|
W |
2,205,869 |
|
|
|
1,934,643 |
|
| Fair value of plan assets |
|
|
(2,296,685 |
) |
|
|
(2,539,632 |
) |
| |
|
|
|
|
|
|
|
|
| Recognized liability(asset) for defined benefit obligations(*) |
|
W |
(90,816 |
) |
|
|
(604,989 |
) |
| |
|
|
|
|
|
|
|
|
| |
(*) |
The liability for defined benefit obligation of W 90,816 million as of December 31, 2021 is the net defined benefit assets of
W 142,020 million less the net defined liabilities of W 51,204 million. In addition, the asset for defined benefit obligation of W 604,989 million as of December 31, 2022 is the net defined benefit assets of W 619,653 million less the net defined liabilities of W 14,664 million. |
SHINHAN FINANCIAL GROUP CO., LTD. AND SUBSIDIARIES
Notes to the Consolidated Financial Statements
(In millions of won)
|
Defined benefit plans (continued) |
| |
(b) |
Changes in the present value of defined benefit obligation and plan assets for the years ended December 31, 2021 and 2022 are as follows: |
|
|
|
|
|
|
|
|
|
|
|
|
|
| |
|
|
|
| |
|
|
|
|
|
|
|
Net defined
benefit
liability (asset) |
|
| Beginning balance |
|
W |
2,182,464 |
|
|
|
(2,138,324 |
) |
|
|
44,140 |
|
| Included in profit or loss: |
|
|
|
|
|
|
|
|
|
|
|
|
| Current service cost |
|
|
179,751 |
|
|
|
— |
|
|
|
179,751 |
|
| Past service cost |
|
|
2,570 |
|
|
|
— |
|
|
|
2,570 |
|
| Interest expense (income) |
|
|
64,729 |
|
|
|
(64,759 |
) |
|
|
(30 |
) |
| Settlement gain or loss |
|
|
(4,844 |
) |
|
|
— |
|
|
|
(4,844 |
) |
| |
|
|
|
|
|
|
|
|
|
|
|
|
| |
|
|
242,206 |
|
|
|
(64,759 |
) |
|
|
177,447 |
|
| |
|
|
|
|
|
|
|
|
|
|
|
|
| Included in other comprehensive income: |
|
|
|
|
|
|
|
|
|
|
|
|
| Remeasurement loss (gain): |
|
|
|
|
|
|
|
|
|
|
|
|
| - Actuarial losses (gains) arising from : |
|
|
|
|
|
|
|
|
|
|
|
|
| Demographic assumptions |
|
|
(1,642 |
) |
|
|
— |
|
|
|
(1,642 |
) |
| Financial assumptions |
|
|
(87,406 |
) |
|
|
— |
|
|
|
(87,406 |
) |
| Experience adjustment |
|
|
(5,450 |
) |
|
|
— |
|
|
|
(5,450 |
) |
| - Return on plan assets excluding interest income |
|
|
— |
|
|
|
35,141 |
|
|
|
35,141 |
|
| |
|
|
|
|
|
|
|
|
|
|
|
|
| |
|
|
(94,498 |
) |
|
|
35,141 |
|
|
|
(59,357 |
) |
| |
|
|
|
|
|
|
|
|
|
|
|
|
| Other: |
|
|
|
|
|
|
|
|
|
|
|
|
| Benefits paid by the plan |
|
|
(122,358 |
) |
|
|
120,347 |
|
|
|
(2,011 |
) |
| Contributions paid into the plan |
|
|
(10 |
) |
|
|
(249,099 |
) |
|
|
(249,109 |
) |
| Settlement gain or loss |
|
|
(2,231 |
) |
|
|
9 |
|
|
|
(2,222 |
) |
| Effect of changes in foreign exchange rates |
|
|
296 |
|
|
|
— |
|
|
|
296 |
|
| |
|
|
|
|
|
|
|
|
|
|
|
|
| |
|
|
(124,303 |
) |
|
|
(128,743 |
) |
|
|
(253,046 |
) |
| |
|
|
|
|
|
|
|
|
|
|
|
|
| Ending balance |
|
W |
2,205,869 |
|
|
|
(2,296,685 |
) |
|
|
(90,816 |
) |
| |
|
|
|
|
|
|
|
|
|
|
|
|
|
(*) |
Profit and loss related to defined benefit plans are all included in the general administrative expense. |
SHINHAN FINANCIAL GROUP CO., LTD. AND SUBSIDIARIES
Notes to the Consolidated Financial Statements
(In millions of won)
|
Defined benefit plans (continued) |
|
|
|
|
|
|
|
|
|
|
|
|
|
| |
|
|
|
| |
|
|
|
|
|
|
|
Net defined
benefit
liability (asset) |
|
| Beginning balance |
|
W |
2,205,869 |
|
|
|
(2,296,685 |
) |
|
|
(90,816 |
) |
| Included in profit or loss: |
|
|
|
|
|
|
|
|
|
|
|
|
| Current service cost |
|
|
170,772 |
|
|
|
— |
|
|
|
170,772 |
|
| Past service cost |
|
|
8,330 |
|
|
|
— |
|
|
|
8,330 |
|
| Interest expense (income) |
|
|
72,307 |
|
|
|
(78,823 |
) |
|
|
(6,516 |
) |
| Settlement gain or loss |
|
|
(466 |
) |
|
|
— |
|
|
|
(466 |
) |
| |
|
|
|
|
|
|
|
|
|
|
|
|
| |
|
|
250,943 |
|
|
|
(78,823 |
) |
|
|
172,120 |
|
| |
|
|
|
|
|
|
|
|
|
|
|
|
| Included in other comprehensive income: |
|
|
|
|
|
|
|
|
|
|
|
|
| Remeasurement loss (gain): |
|
|
|
|
|
|
|
|
|
|
|
|
| - Actuarial losses (gains) arising from: |
|
|
|
|
|
|
|
|
|
|
|
|
| Demographic assumptions |
|
|
(938 |
) |
|
|
— |
|
|
|
(938 |
) |
| Financial assumptions |
|
|
(419,764 |
) |
|
|
— |
|
|
|
(419,764 |
) |
| Experience adjustment |
|
|
35,758 |
|
|
|
— |
|
|
|
35,758 |
|
| - Return on plan assets excluding interest income |
|
|
— |
|
|
|
36,725 |
|
|
|
36,725 |
|
| |
|
|
|
|
|
|
|
|
|
|
|
|
| |
|
|
(384,944 |
) |
|
|
36,725 |
|
|
|
(348,219 |
) |
| |
|
|
|
|
|
|
|
|
|
|
|
|
| Other: |
|
|
|
|
|
|
|
|
|
|
|
|
| Benefits paid by the plan |
|
|
(138,290 |
) |
|
|
145,130 |
|
|
|
6,840 |
|
| Contributions paid into the plan |
|
|
— |
|
|
|
(345,979 |
) |
|
|
(345,979 |
) |
| Changes in the scope of consolidation |
|
|
1,507 |
|
|
|
— |
|
|
|
1,507 |
|
| Effect of changes in foreign exchange rates |
|
|
(442 |
) |
|
|
— |
|
|
|
(442 |
) |
| |
|
|
|
|
|
|
|
|
|
|
|
|
| |
|
|
(137,225 |
) |
|
|
(200,849 |
) |
|
|
(338,074 |
) |
| |
|
|
|
|
|
|
|
|
|
|
|
|
| Ending balance |
|
W |
1,934,643 |
|
|
|
(2,539,632 |
) |
|
|
(604,989 |
) |
| |
|
|
|
|
|
|
|
|
|
|
|
|
| |
(*) |
Profit and loss related to defined benefit plans are all included in the general administrative expense. |
| |
(c) |
The composition of plan assets as of December 31, 2021 and 2022 are as follows: |
|
|
|
|
|
|
|
|
|
| |
|
|
|
|
|
|
| Plan assets comprise: |
|
|
|
|
|
|
|
|
| Debt securities |
|
W |
43,607 |
|
|
|
31,140 |
|
| Due from banks |
|
|
1,915,361 |
|
|
|
2,220,218 |
|
| Others |
|
|
337,717 |
|
|
|
288,274 |
|
| |
|
|
|
|
|
|
|
|
| |
|
W |
2,296,685 |
|
|
|
2,539,632 |
|
| |
|
|
|
|
|
|
|
|
SHINHAN FINANCIAL GROUP CO., LTD. AND SUBSIDIARIES
Notes to the Consolidated Financial Statements
|
Defined benefit plans (continued) |
| |
(d) |
Actuarial assumptions as of December 31, 2021 and 2022 are as follows: |
|
|
|
|
|
|
|
| |
|
|
|
|
|
|
| Discount rate |
|
3.19%~3.77% |
|
5.05%~5.93% |
|
AA0 corporate bond yields |
| Future salary increase rate |
|
1.98%~5.00% + Upgrade rate |
|
2.00%~7.00% + Upgrade rate |
|
Average for 5 years |
| Weighted average maturity |
|
7.4 years~ 14.8 years |
|
6.7 years~ 10.9 years |
|
|
As of December 31, 2021 and 2022, reasonably possible changes in one of the relevant actuarial assumptions, holding other assumptions constant, would have affected the defined benefit obligation by the amounts shown below.
|
|
|
|
|
|
|
|
|
| |
|
|
|
| |
|
Defined benefit obligation |
|
| |
|
Increase |
|
|
Decrease |
|
| Discount rate (1%p movement) |
|
W |
(197,174 |
) |
|
|
216,226 |
|
| Future salary increase rate (1%p movement) |
|
|
216,450 |
|
|
|
(200,843 |
) |
|
|
|
|
|
|
|
|
|
| |
|
|
|
| |
|
Defined benefit obligation |
|
| |
|
Increase |
|
|
Decrease |
|
| Discount rate (1%p movement) |
|
W |
(154,651 |
) |
|
|
168,565 |
|
| Future salary increase rate (1%p movement) |
|
|
172,716 |
|
|
|
(160,649 |
) |
| |
(f) |
The Group’s estimated contribution is 145,699 million as of December 31, 2023. |
| |
(a) |
Provisions as of December 31, 2021 and 2022 are as follows: |
|
|
|
|
|
|
|
|
|
| |
|
|
|
|
|
|
| Asset retirement obligations |
|
W |
82,123 |
|
|
|
91,571 |
|
| Expected loss related to litigation |
|
|
9,693 |
|
|
|
29,238 |
|
| Unused credit commitments |
|
|
300,008 |
|
|
|
317,590 |
|
| Guarantee contracts issued |
|
|
81,922 |
|
|
|
83,411 |
|
| Financial guarantee contracts issued |
|
|
55,344 |
|
|
|
55,828 |
|
Non-financial guarantee contracts issued |
|
|
26,578 |
|
|
|
27,583 |
|
| Others(*) |
|
|
693,110 |
|
|
|
744,504 |
|
| |
|
|
|
|
|
|
|
|
| |
|
W |
1,166,856 |
|
|
|
1,266,314 |
|
| |
|
|
|
|
|
|
|
|
| |
(*) |
As of December 31, 2021 and 2022, the Group recognizes a provision of W 518,955 million and W 574,013 million, respectively, an estimated amount which is highly probable to be paid for customer losses expected due to delays in redemption of Lime CI funds, etc. |
SHINHAN FINANCIAL GROUP CO., LTD. AND SUBSIDIARIES
Notes to the Consolidated Financial Statements
(In millions of won)
| |
(b) |
Changes in provision for unused credit commitments and financial guarantee contracts issued for the years ended December 31, 2021 and 2022 are as follows: |
|
|
|
|
|
|
|
|
|
|
|
|
|
|
|
|
|
|
|
|
|
|
|
|
|
|
|
|
|
| |
|
|
|
| |
|
Unused credit commitments |
|
|
Financial guarantee contracts issued |
|
|
|
|
| |
|
12 months
expected
credit loss |
|
|
Life time
expected
credit loss |
|
|
|
|
|
12 months
expected
credit loss |
|
|
Life time
expected
credit loss |
|
|
|
|
| Beginning balance |
|
W |
164,147 |
|
|
|
140,137 |
|
|
|
1,435 |
|
|
|
54,550 |
|
|
|
7,335 |
|
|
|
10 |
|
|
|
367,614 |
|
| Transfer (from)to 12 months expected credit loss |
|
|
63,335 |
|
|
|
(63,249 |
) |
|
|
(86 |
) |
|
|
2,931 |
|
|
|
(2,931 |
) |
|
|
— |
|
|
|
— |
|
| Transfer (from)to life time expected credit loss |
|
|
(11,889 |
) |
|
|
11,917 |
|
|
|
(28 |
) |
|
|
(3,621 |
) |
|
|
3,621 |
|
|
|
— |
|
|
|
— |
|
| Transfer (from)to impaired financial asset |
|
|
(274 |
) |
|
|
(939 |
) |
|
|
1,213 |
|
|
|
— |
|
|
|
— |
|
|
|
— |
|
|
|
— |
|
| Provided (reversed) |
|
|
(66,373 |
) |
|
|
58,188 |
|
|
|
(610 |
) |
|
|
(581 |
) |
|
|
(178 |
) |
|
|
5 |
|
|
|
(9,549 |
) |
| Change in foreign exchange rate |
|
|
1,964 |
|
|
|
1,077 |
|
|
|
— |
|
|
|
1,910 |
|
|
|
534 |
|
|
|
— |
|
|
|
5,485 |
|
| Others(*) |
|
|
(337 |
) |
|
|
380 |
|
|
|
— |
|
|
|
(6,582 |
) |
|
|
(1,672 |
) |
|
|
13 |
|
|
|
(8,198 |
) |
| |
|
|
|
|
|
|
|
|
|
|
|
|
|
|
|
|
|
|
|
|
|
|
|
|
|
|
|
|
| Ending balance |
|
W |
150,573 |
|
|
|
147,511 |
|
|
|
1,924 |
|
|
|
48,607 |
|
|
|
6,709 |
|
|
|
28 |
|
|
|
355,352 |
|
| |
|
|
|
|
|
|
|
|
|
|
|
|
|
|
|
|
|
|
|
|
|
|
|
|
|
|
|
|
| (*) |
Others include effects of the provision from the new financial guarantee contracts measured at fair value, and the expired contracts, the change of discount rate and others.
|
|
|
|
|
|
|
|
|
|
|
|
|
|
|
|
|
|
|
|
|
|
|
|
|
|
|
|
|
|
| |
|
|
|
| |
|
Unused credit commitments |
|
|
Financial guarantee contracts issued |
|
|
|
|
| |
|
12 months
expected
credit loss |
|
|
Life time
expected
credit loss |
|
|
|
|
|
12 months
expected
credit loss |
|
|
Life time
expected
credit loss |
|
|
|
|
| Beginning balance |
|
W |
150,573 |
|
|
|
147,511 |
|
|
|
1,924 |
|
|
|
48,607 |
|
|
|
6,709 |
|
|
|
28 |
|
|
|
355,352 |
|
| Transfer (from)to 12 months expected credit loss |
|
|
68,226 |
|
|
|
(67,945 |
) |
|
|
(281 |
) |
|
|
2,680 |
|
|
|
(2,680 |
) |
|
|
— |
|
|
|
— |
|
| Transfer (from)to life time expected credit loss |
|
|
(10,794 |
) |
|
|
10,842 |
|
|
|
(48 |
) |
|
|
(3,715 |
) |
|
|
3,715 |
|
|
|
— |
|
|
|
— |
|
| Transfer (from)to impaired financial asset |
|
|
(316 |
) |
|
|
(1,274 |
) |
|
|
1,590 |
|
|
|
— |
|
|
|
— |
|
|
|
— |
|
|
|
— |
|
| Provided (reversed) |
|
|
(30,016 |
) |
|
|
50,733 |
|
|
|
(1,155 |
) |
|
|
(972 |
) |
|
|
537 |
|
|
|
5 |
|
|
|
19,132 |
|
| Change in foreign exchange rate |
|
|
(2,068 |
) |
|
|
131 |
|
|
|
— |
|
|
|
910 |
|
|
|
118 |
|
|
|
— |
|
|
|
(909 |
) |
| Others(*) |
|
|
(43 |
) |
|
|
— |
|
|
|
— |
|
|
|
603 |
|
|
|
(712 |
) |
|
|
(5 |
) |
|
|
(157 |
) |
| |
|
|
|
|
|
|
|
|
|
|
|
|
|
|
|
|
|
|
|
|
|
|
|
|
|
|
|
|
| Ending balance |
|
W |
175,562 |
|
|
|
139,998 |
|
|
|
2,030 |
|
|
|
48,113 |
|
|
|
7,687 |
|
|
|
28 |
|
|
|
373,418 |
|
| |
|
|
|
|
|
|
|
|
|
|
|
|
|
|
|
|
|
|
|
|
|
|
|
|
|
|
|
|
| (*) |
Others include effects of the provision from the new financial guarantee contracts measured at fair value, and the expired contracts, the change of discount rate and others. |
SHINHAN FINANCIAL GROUP CO., LTD. AND SUBSIDIARIES
Notes to the Consolidated Financial Statements
| |
(c) |
Changes in provisions for the years ended December 31, 2021 are as follows: |
|
|
|
|
|
|
|
|
|
|
|
|
|
|
|
|
|
|
|
|
|
| |
|
|
|
| |
|
|
|
|
|
|
|
|
|
|
|
|
|
|
|
| |
|
W |
65,659 |
|
|
|
12,468 |
|
|
|
21,956 |
|
|
|
337,039 |
|
|
|
437,122 |
|
| |
|
|
8,185 |
|
|
|
2,552 |
|
|
|
3,457 |
|
|
|
350,090 |
|
|
|
364,284 |
|
| |
|
|
(3,793 |
) |
|
|
(5,327 |
) |
|
|
— |
|
|
|
(37,604 |
) |
|
|
(46,724 |
) |
Change in foreign exchange rate |
|
|
4 |
|
|
|
— |
|
|
|
1,265 |
|
|
|
(1,314 |
) |
|
|
(45 |
) |
| |
|
|
12,068 |
|
|
|
— |
|
|
|
(100 |
) |
|
|
44,899 |
|
|
|
56,867 |
|
| |
|
|
|
|
|
|
|
|
|
|
|
|
|
|
|
|
|
|
|
|
| |
|
W |
82,123 |
|
|
|
9,693 |
|
|
|
26,578 |
|
|
|
693,110 |
|
|
|
811,504 |
|
| |
|
|
|
|
|
|
|
|
|
|
|
|
|
|
|
|
|
|
|
|
| (*) |
Others include increase in provisions based on the present value, the effect of changes in discount rate over the period and others.
|
|
|
|
|
|
|
|
|
|
|
|
|
|
|
|
|
|
|
|
|
|
| |
|
|
|
| |
|
|
|
|
|
|
|
|
|
|
|
|
|
|
|
| |
|
W |
82,123 |
|
|
|
9,693 |
|
|
|
26,578 |
|
|
|
693,110 |
|
|
|
811,504 |
|
| |
|
|
27,474 |
|
|
|
20,733 |
|
|
|
(410 |
) |
|
|
127,460 |
|
|
|
175,257 |
|
| |
|
|
(25,228 |
) |
|
|
(779 |
) |
|
|
— |
|
|
|
(75,355 |
) |
|
|
(101,362 |
) |
Change in foreign exchange rate |
|
|
4 |
|
|
|
— |
|
|
|
1,352 |
|
|
|
315 |
|
|
|
1,671 |
|
| |
|
|
7,090 |
|
|
|
(409 |
) |
|
|
63 |
|
|
|
(1,026 |
) |
|
|
5,718 |
|
Business combination (Note 47) |
|
|
108 |
|
|
|
— |
|
|
|
— |
|
|
|
— |
|
|
|
108 |
|
| |
|
|
|
|
|
|
|
|
|
|
|
|
|
|
|
|
|
|
|
|
| |
|
W |
91,571 |
|
|
|
29,238 |
|
|
|
27,583 |
|
|
|
744,504 |
|
|
|
892,896 |
|
| |
|
|
|
|
|
|
|
|
|
|
|
|
|
|
|
|
|
|
|
|
| (*) |
Others include increase in provisions based on the present value, the effect of changes in discount rate over the period and others. |
| |
(d) |
Asset retirement obligation liabilities represent the estimated cost to restore the existing leased properties which is discounted to the present value using the appropriate discount rate at the end of the reporting period. Disbursements of such costs are expected to incur at the end of lease contract. Such costs are reasonably estimated using the average lease year and the average restoration expenses. The average lease year is calculated based on the past ten-year historical data of the expired leases. The average restoration expense is calculated based on the actual costs incurred for the past three years using the three-year average inflation rate. |
|
(e) |
Allowance for guarantees and acceptances as of December 31, 2021 and 2022 are as follows: |
|
|
|
|
|
|
|
|
|
|
|
|
|
|
|
|
Outstanding guarantees and acceptances |
|
W |
10,540,968 |
|
|
|
12,154,088 |
|
Contingent guarantees and acceptances |
|
|
4,670,771 |
|
|
|
4,565,829 |
|
ABS and ABCP purchase commitments |
|
|
1,525,768 |
|
|
|
1,496,604 |
|
| |
|
|
8,199 |
|
|
|
10,025 |
|
| |
|
|
|
|
|
|
|
|
| |
|
W |
16,745,706 |
|
|
|
18,226,546 |
|
| |
|
|
|
|
|
|
|
|
Allowance for loss on guarantees and acceptances |
|
W |
81,922 |
|
|
|
83,411 |
|
| |
|
|
0.49 |
% |
|
|
0.46 |
|
SHINHAN FINANCIAL GROUP CO., LTD. AND SUBSIDIARIES
Notes to the Consolidated Financial Statements
|
Liability under insurance contracts |
|
(a) |
Overview of the insurance risk – Shinhan Life Insurance Co., Ltd. |
i) Overview of the insurance risk
i-1)
Insurance risk and reinsurance
Insurance risk is the likelihood of an insurance event occurring and the uncertainty as to the total amount and timing of benefits paid as a result of the event. The main risk covered by insurance contracts is the risk that the actual claim or benefit payment will exceed the accumulated liability. This risk can occur for the following reasons:
① Frequency risk: Possibility that the number of occurrences of the insurance event is different from the expected number
② Severity risk: The cost of an incident may be different from the expected cost level
Experience shows that more or more similar insurance contracts are less likely to have an unusual effect from some contracts, and the Group forms a sufficiently diversified group of contracts in consideration of this when acquiring the contracts.
Insurance risk includes a lack of risk diversification and relates to geographical location and the nature of the policyholder as well as to the diversification of risk forms or sizes.
If the insurance contract covers death, the catastrophe affects the frequency the most and can affect the frequency of death earlier than expected due to a wide range of causes such as eating habits, smoking, and exercise habits. And if the coverage is survival, medical technology and social conditions can increase the survival rate. The frequency may also be affected by excessive concentration in the coverage area.
Insurance accidents in life insurance include not only the death of the insured (insured) but also survival, disability and hospitalization.
The Group basically classifies the Group’s insurance products into individual insurance and group insurance according to the policyholder. Group insurance means a contract under which the insured belongs to a group of a certain size or larger and in which the policyholder is the representative of the Group or organization. The group insurance can be divided into savings and protections. Protection insurance means insurance in which the sum of benefits paid for survival at the base age does not exceed the premium already paid; savings insurance is defined as insurance, except for protection insurance, in which the sum of benefits paid for survival exceeds the premium already paid. Individual insurance can be classified into death insurance in which the insured’s death is insured, survival insurance in which the life is insured for a certain period of time, and endowment insurance.
Life insurance products can also be divided into guaranteed fixed rates, floating rates, interest-sensitive, and variable types.
In the guaranteed fixed interest type, since the expected rate does not change from the time the policyholder enters into the contract to the end of the insurance period, the Group assumes the interest rate risk if the asset management yield or market interest rate is lower than the expected rate. Floating interest rate type divides the net insurance premium into the guaranteed portion and the reserve portion, so that the guaranteed portion is applied with the predetermined expected rate, and the reserve portion changes the reserve rate of policy reserve according to asset management yield, and some hedging on interest rate risk is feasible.
SHINHAN FINANCIAL GROUP CO., LTD. AND SUBSIDIARIES
Notes to the Consolidated Financial Statements
|
Liability under insurance contracts (continued) |
The Group uses acquisition strategies and reinsurance strategies to manage the uncertainty of the total amount and timing of insurance claims paid out as a result of an insured event.
Acquisition strategy means diversifying the type of risk or the level of benefits that are acquired. For example, a company can balance mortality and survival risks. In addition, the selection of policyholders through regular
check-ups
is one of the major acquisition strategies.
The risk to be ceded by the Group is based on the acquired insurance contract, which can be the total amount of risk or risk per contract on a per capita basis or per contract basis. In principle, the reinsurance method provides the risk premium excess reinsurance, but other methods may be used within the scope of the relevant laws as required. The degree of reinsurance held by the Group shall be determined by considering the Group’s assets, contract conditions, risk level, and technology for selecting the contract.
Insurance risk can also be affected by the policyholder’s right to terminate the contract or exercise annuity conversion rights to reduce or not pay the full premium. As a result, insurance risks may be affected by the policyholder’s actions and decisions. The Group’s insurance risk can be estimated on the assumption that the policyholder is reasonable. For example, a person who is worse than a person in good health would have less intention of terminating insurance that guarantees death. These factors are also reflected in the assumptions about the Group’s insurance liability.
i-2)
Discretionary participation features
The discretionary participation feature is a contractual right to receive additional benefits which have the following characteristics in addition to the unconditional rights of the policyholder or investor, which fulfils all three requirements below. Insurance premiums for investment contracts without discretionary participation feature are recognized as deposits, and premiums for investment contracts with discretionary participation feature are recognized as profit or loss.
① It constitutes a significant portion of the total payments in the contract.
② The amount or timing is determined at the discretion of the issuer under the contract.
③ The contract is based on one or more of the following:
- The performance arising from specific contract groups or specific contract types;
- Realized or unrealized return on investment arising from the specific asset group held by the issuer; or
- Profit or loss of the entity, fund or other entity that issued the contract;
The Group’s participating contract meets all three of the above requirements and includes a discretionary participation feature.
If the actual base rate matches with the expected base rate assumed upon calculation of the insurance premium of the Group, income and expenses are balanced over the insurance period, that the premiums do not fall short. In practice, however, the expected risk, expected interest rate, and projected expense ratio
SHINHAN FINANCIAL GROUP CO., LTD. AND SUBSIDIARIES
Notes to the Consolidated Financial Statements
|
Liability under insurance contracts (continued) |
applied when calculating premiums will differ from the actual rate where the interest rate or expense ratio changes due to changes in risk rate or economic situation. These differences constitute the Group’s profit or losses and, depending on the source, these may consist of mortality risk, interest rate, interest rate risk, and expense rate.
Compared to contracts without discretionary participation feature, in contracts with discretionary participation, the sources of profit or loss below are shared between the policyholders and the Group, thereby reducing the risk.
① Gain or losses on mortality risk
It is caused by the difference between the expected risk rate and the actual risk rate. In case of death insurance, if the actual mortality rate is lower than the expected mortality rate, there is a risk difference gain, and vice versa.
② Gain or losses on interest rate risk
It is caused by the difference between the expected interest rate and the actual interest rate. If the actual asset management return is higher than the expected interest rate, interest rate difference is generated, and vice versa.
③ Gain or losses on expense rate risk
It is caused by the difference between the business expense and the actual expense. If the actual expense is lower than the business expense, the difference in expense is incurred, and vice versa.
As described above, if the expected base rate used by the Group to calculate the premium is different from the actual, the profits generated from the settlement must be refunded to the policyholder because the profits generated are taken in the calculation of premiums, and the dividend paid to the policyholder is distinguished from the dividend paid to shareholders.
The Group first accumulates policy reserves at the end of each reporting period, and then divides the remainder into gain or losses from participating and
non-participating
insurance contracts and gain or losses on management of the capital account. Gain or losses from
non-participating
insurance and management of the capital account are treated as the shareholder’s interest, shareholder’s interest for the gain or losses on participating insurance is less than 10th of 100th, and the remaining portion shall be treated as the policyholder’s interest. Policyholder’s shares may not be used or accumulated for purpose other than the financial resources for policyholder dividends and the purpose of accumulating excess participating policyholder dividend reserve.
Policyholder dividends represent amounts payable to policyholders due to interest rate difference, long-term duration, mortality rate difference, and expense rate difference, and the reserve for policyholder dividends is divided into policyholder dividend reserve and excess participating policyholder dividend reserve. Excess participating policyholder dividend reserve is the amount to be accumulated in the total amount to be used for future policyholder dividends if there is surplus after accumulating the reserve for loss from participating insurance and the policyholder dividend reserve from the policyholders’ interest of participating interest in the year.
The policyholder dividend reserve is a defined dividend reserve that determines the amount to be paid for each policyholder, whereas the amount of excess participating policyholder dividend reserve is not
SHINHAN FINANCIAL GROUP CO., LTD. AND SUBSIDIARIES
Notes to the Consolidated Financial Statements
|
Liability under insurance contracts (continued) |
confirmed for each policyholder. The Group should first use the excess participating policyholder dividend reserve accumulated in gross amount prior to the year and the excess participating policyholder dividend reserve accumulated should be used as the policyholder dividend within 5 years from the end of the year.
Reserve for loss from participating insurance is the amount that is accumulated for the purpose of preserving the loss of participating insurance according to laws and regulations. Prior to accumulate the policyholder dividend reserve, the dividend reserves of the retained dividends take precedence over the policyholder dividend reserve and the excess participating policyholder dividend reserve.
Reserve for loss from participating insurance is accumulated within 30th of the policyholder’s interests, preferentially compensates for losses incurred in participating insurance within 5 years of accumulation, and the remaining amount after compensation is used for the dividends of the policyholder.
| |
ii) |
Insurance risk management policy |
Unlike other financial instruments, life insurance companies’ insurance policies have the characteristics of long-term contracts, which can be exposed to insurance risk that may arise due to an increase in actual claim payments than the risk rate determined at the time of development of the product and interest rate risk that may arise due to differences in interest rates and maturities between insurance liabilities and asset management.
The purpose of the Group’s risk management is to generate long-term stable growth and profits by proactively preventing and systematically managing the various risks that may arise in the course of management activities, reflecting these uncertain financial environments and the characteristics of life insurance products with long-term attributes.
To achieve this risk management policy, the Group’s risk management strategy measures the risk-based capital stock (RBC) required capital and manages it within acceptable limits. To this end, the Group has established the basic principles of risk management and established and implemented regulations and management systems to implement them. In addition, through the Risk Management Committee and Risk Management Organization, various risk-related decision-making is supported, and risk management procedures are in place to identify and manage risks in a timely manner.
In general, risk management procedures are to recognize exposed risks, measure their size, set acceptable limits, monitor them regularly to report to management, and efficiently control and manage risks in case they exceed their limits.
Management methods by risk type are as follows:
① Insurance risk management: From the time of product development, by setting profitability guidelines, products are developed to ensure proper profitability, and appropriate acceptance criteria are set and operated to prevent reverse selection, and claim payments can be made fairly.
② Interest rate risk management: Establish a guideline and consider the market interest rate and asset management profit rate to determine the published interest rate and expected interest rate within the guidelines. In addition, the asset management strategy is set considering the interest rate level and maturity of liabilities, after analyzing the attributes of long-term insurance liabilities, the long-term target portfolio is established, and the annual portfolio can be guided by comprehensively considering the risk level and return of the managed asset.
③ Liquidity risk management: Inspect and manage the amount of paid insurance and liquid assets on a daily basis.
SHINHAN FINANCIAL GROUP CO., LTD. AND SUBSIDIARIES
Notes to the Consolidated Financial Statements
|
Liability under insurance contracts (continued) |
| |
|
Standard policy reserve system |
The policy reserve is a liability to the policyholder and the faithfulness of the reserve on the basis of the profit or loss account is directly linked to the maintenance of the Group’s management integrity and the protection of the policyholder’s interests, so it is subject to strict regulatory regulations. Accordingly, the supervisory authorities apply the standard policy reserve system in relation to the method of setting up and calculating the respective policy reserves.
The current method of using the reserve base rate equal to the insurance premium calculation base rate can threaten the financial health of the Group by causing insolvency of the reserve fund in case of liberalization of insurance prices, so the standard policy reserve system is introduced to use objective and conservative basic rates to prevent insolvency of the financial structure that can result from liberalization of insurance premium prices and protect the rights and interests of policyholders.
In other words, the standard policy reserve is an institutional device that dualizes the contract base rate by setting the risk or interest rate applied to calculating the policy reserve in a more conservative manner than the risk or interest rate applied to calculating the insurance premium. In order for the insurance company to calculate the policy reserve, the future expected basic rate, such as the expected interest rate and the expected risk rate, is necessary, and the policy reserve is the estimated amount of the debt estimated by the expected basic rate. Since the real intention of liberalization is not to leave such a policy reserve entirely to the discretion of the insurer after price liberalization, the government needed an objective and certain level of reserve accumulation system to strengthen the financial stability of insurance companies and protection of policyholders, and prevent insurers’ insolvency due to price competition such as insurance premium dumping after price liberalization.
According to the Regulation on Supervision of Insurance Business, premium reserves are calculated by applying the standard rate and standard risk rate set by the supervisor authority. In this case, the standard rate is to apply the standard rate of the year in which the insurance contract was signed over the entire insurance period. However, the highest interest rate among the interest rates specified in the insurance premium and policy reserve calculation method for the floating interest rate product is applied. As a result, when the premium reserve calculated at the base rate applied when calculating the premium differs from the premium reserve calculated at the standard interest rate and the standard risk rate, a large amount is required to be accumulated as the premium reserve so that more than a certain minimum reserve is accumulated, hence the system tends to protect policyholders by enhancing reserves.
The current reserve for liability is calculated using the evaluation method for the year of issuance. In other words, the basic rate of evaluation of the reserve for liability is applied in the same way as the interest rate and risk rate applied at the time the insurance contract was established until the end of the contract. This method is suitable for a stable situation in which the financial environment at the time of sale of the insurance product and the financial environment during the insurance period are almost unchanged, however, in the event of fluctuations such as market interest rates and the expected risk rate at the time of sale of a contract, it is not possible to react flexibly. Therefore, there is a possibility that the policy reserve may not properly reflect the fair value of the contract. A liability adequacy test system was introduced to compensate for the shortcomings that could not reflect such market changes.
SHINHAN FINANCIAL GROUP CO., LTD. AND SUBSIDIARIES
Notes to the Consolidated Financial Statements
|
Liability under insurance contracts (continued) |
| |
|
Financial risks related to insurance contracts |
iv-1)
Form of exposure by each type of risk
Investment contracts that include insurance contracts and discretionary participation feature may be exposed to financial risks although it is an insurance liability, and the form of exposure is as follows:
Credit risk refers to the risk of loss resulting from the borrower’s failure to repay a loan or meet contractual obligations. The Group’s reinsurance assets and reinsurance receivables are exposed to credit risk as assets that may incur losses if the reinsurer defaults at the time of receipt of the claims and receivables.
Interest rate risk means the risk that arises when the Group’s financial position fluctuates unfavorably due to the effect of interest rates on assets and liabilities.
Liquidity risk refers to the risk that assets and liabilities are subject to inconsistency or failure to respond to unexpected cash outflows. Therefore, future cash outflows from investment contracts, including insurance liabilities which account for most of the Company’s liabilities and dividend components, are factors used to determine the level of risk associated with the Group’s liquidity.
Market risk refers to the risk of loss arising when the Group’s financial position fluctuates unfavourably due to adverse price fluctuations such as stock prices and exchange rates. There is no impact on profit or loss or capital due to changes in each liability amount, since fluctuations in stock prices and exchange rates, the prices of investment contracts, including insurance liabilities which account for most of the Group’s liabilities and dividend components, do not fluctuate.
iv-2)
The degree to which the discretionary participation feature mitigates or aggravates risk
A relatively high premium is received by setting and producing a relatively conservative base rate compared to a contract without discretionary participation features, and a relatively high premium is later refunded to the contractor through a policyholder dividend for the premium payment based on conservative calculation of the expected base rate. However, contracts without a discretionary participation feature will set the expected optimal base rate, which is not conservative, and receive a relatively low premium when establishing the initial expected base rate. Thereafter, if the expected basic rate is different from the actual result, the Group will assume the profit or loss according to the result. Thus, a contract with a discretionary participation feature is a structure that establishes a conservative base rate and shares the risks associated with the contract with the policyholder, and in the case of a contract without discretionary participation element, the Group assumes the risk for the initial basis set by the Group.
iv-3)
Risks associated with guarantees
The guarantee options inherent in insurance contracts include guaranteed minimum death benefit, guaranteed minimum annuity guarantee benefit, and guaranteed minimum interest rate benefit. These guarantees can increase cash flow outflows when market prices and interest rates fall below a certain level.
SHINHAN FINANCIAL GROUP CO., LTD. AND SUBSIDIARIES
Notes to the Consolidated Financial Statements
|
Liability under insurance contracts (continued) |
| |
(b) |
Overview of the insurance risk – Shinhan EZ General Insurance, Ltd. |
Insurance risk is the risk that arises in relation to the acquisition of insurance contracts and payment of insurance claims, which are business of the Group, and is classified into insurance price risk and reserve risk. Insurance price risk refers to the risk of exceeding the expected risk rate and expected expense ratio set at the time of insurance premium calculation, and reserve risk refers to the loss of the Group due to the occurrence of more insurance payments in the future due to insufficient reserves accumulated at the time of evaluation. Reserve risk is measured for general
non-life
insurance.
| |
|
Measurement and management |
| |
① |
Measurement of insurance risk |
The insurance risk is measured by using the standard model (Article
7-2,
Paragraph 4 of the Insurance Industry Supervision Regulations) and calculated by dividing the insurance price risk and the reserve risk, and considering the diversification effect on the assumption that the two risks are mutually independent. Insurance price risk is calculated by multiplying the premium held by insurance product category by the risk coefficient, and reserve risk is calculated by multiplying the risk coefficient by the reserve payable by insurance product category of general
non-life
insurance.
| |
② |
The method of insurance risk management |
The Group sets an insurance risk permissible limit every year, monitors compliance with the limit, and executes in accordance with preset countermeasures when the limit is exceeded. In addition, underwriting guidelines, retention, and reinsurance strategies are established and operated so that risks can be retained at an appropriate level for each type of insurance.
| |
|
The target of insurance risk management |
The insurance risk management targets of the Group are the appropriateness of the insurance price and the adequacy of the reserve, and are identified as follows.
| |
- |
Appropriateness of insurance price: Changes in the ratio of incurred loss to premium for earned risk (risk loss ratio) are being verified. |
| |
- |
Adequacy of reserve: Based on the insurance industry supervision regulation, an evaluation of conducted for the adequacy of reserves and a report on the review of reserve requirements is submitted to the Financial Supervisory Service. |
The product development department of the Group proceeds with product development according to the product development and approval process so that the related department can fully review and make decisions about possible risks in the development and sale of new products. In addition,
pre-analysis
and evaluation are conducted, such as analysis of the adequacy of the expected risk rate and expected expense ratio of new products, profit and loss analysis, etc., and a senior actuary confirms the adequacy of the basic documents and related coefficients.
SHINHAN FINANCIAL GROUP CO., LTD. AND SUBSIDIARIES
Notes to the Consolidated Financial Statements
|
Liability under insurance contracts (continued) |
The senior accountant regularly verifies the adequacy of the reserve by using the total amount estimation method. Total amount estimation is based on Paid Ladder Development Method (PLDM), Incurred Ladder Development Method (ILDM), Average Payment Method (APM), frequency/severity method, and Bornhuetter-Ferguson method. It is calculated by applying the method allowed under the Supervisory Regulations, etc. In addition, we have submitted a verification opinion on this to the Financial Supervisory Service.
|
|
Sensitivity analysis of insurance risk |
The Group manages insurance risk by conducting sensitivity analysis based on the discount rate, claim payment rate, retention rate and expense ratio, etc. that are judged to have a significant impact on the amount, timing and uncertainty of the future cash flow of the insurer.
|
|
Concentration of insurance risk and reinsurance |
Every year, a reinsurance operation strategy for each item (automotive/general) is established and implemented after deliberation and resolution by the Risk Management Committee. The reinsurance operation strategy is established after reviewing its adequacy based on the Group’s underlying assets, insurance risk level, and reinsurance cost.
|
• |
|
Objective of reinsurance transactions |
|
• |
|
Setting acceptable risk holding limits and planning for ceding reinsurance |
|
• |
|
Monitoring method for adequacy of reinsurance operation |
|
• |
|
Method for selecting reinsurers and reinsurance brokers and criteria of security |
In principle, reinsurance transactions are executed according to the reinsurance operation strategy, and in the case of underwriting contracts in excess of the holding limit, the Risk Management Committee consider and determine whether or not to underwrite.
|
|
Credit risk from insurance contracts |
Credit risk arising from contracts refers to economic losses resulting from the inability to fulfill the obligations specified in the contracts due to default or deterioration of credit ratings of the counterparty, reinsurer. The Group enters into voluntary reinsurance or special contractual reinsurance contracts with reinsurance companies or
non-life
insurance companies for a part of the total insurance amount. The holding and reinsurance strategy is the risk transfer strategy of the Group. Holding and ceding are determined through the risk evaluation of each contract. When applying the new holding and reinsurance strategy, the expected profit and loss compared to the existing reinsurance strategy, the expected profit and loss against risk, and the cost of financing are calculated. It is decided by the Risk Management Committee.
|
|
Liquidity risk from insurance contracts |
Liquidity risk arising from insurance contracts may result in inability to respond to a request for claim payment due to mismatched fund management or loss due to the raising of high-interest financing to resolve such a mismatch of funds or the unfavorable sale of owned assets. The Group the liquidity gap ratio of general accounts to manage liquidity risk.
SHINHAN FINANCIAL GROUP CO., LTD. AND SUBSIDIARIES
Notes to the Consolidated
Financial
Statements
|
Liability under insurance contracts (continued) |
| |
(c) |
Insurance liabilities as of December 31, 2021 and 2022 are as follows: |
|
|
|
|
|
|
|
|
|
| |
|
|
|
|
|
|
Policy reserve |
|
W |
54,330,046 |
|
|
|
54,316,740 |
|
Policyholder’s equity adjustment |
|
|
3,452 |
|
|
|
(1,616 |
) |
| |
|
|
|
|
|
|
|
|
| |
|
W |
54,333,498 |
|
|
|
54,315,124 |
|
| |
|
|
|
|
|
|
|
|
| |
(d) |
Policy reserve as of December 31, 2021 and 2022 are as follows: |
|
|
|
|
|
|
|
|
|
| |
|
|
|
|
|
|
Life insurance: |
|
|
|
|
|
|
|
|
Variable interest rate |
|
W |
29,399,446 |
|
|
|
27,303,550 |
|
Fixed interest rate |
|
|
24,930,600 |
|
|
|
26,919,128 |
|
| |
|
|
|
|
|
|
|
|
| |
|
|
54,330,046 |
|
|
|
54,222,678 |
|
| |
|
|
|
|
|
|
|
|
General insurance: |
|
|
|
|
|
|
|
|
Automotive |
|
|
— |
|
|
|
1,880 |
|
General |
|
|
— |
|
|
|
89,297 |
|
Long-term |
|
|
— |
|
|
|
2,885 |
|
| |
|
|
|
|
|
|
|
|
| |
|
|
— |
|
|
|
94,062 |
|
| |
|
|
|
|
|
|
|
|
| |
|
W |
54,330,046 |
|
|
|
54,316,740 |
|
| |
|
|
|
|
|
|
|
|
SHINHAN FINANCIAL GROUP CO., LTD. AND SUBSIDIARIES
Notes to the Consolidated Financial Statements
(In millions of won)
|
Liability under insurance contracts (continued) |
| |
(e) |
The details of policy reserves for insurance risk classification as of December 31, 2021 and 2022 are as follows: |
|
|
|
|
|
|
|
|
|
|
|
|
|
|
|
|
|
|
|
|
|
|
|
|
|
|
|
|
|
|
|
|
|
| |
|
|
|
| |
|
Individual insurance |
|
|
Group insurance |
|
| |
|
Pure
endowment |
|
|
Death |
|
|
Endowment |
|
|
Subtotal |
|
|
Pure
protection |
|
|
Savings |
|
|
Subtotal |
|
|
Total |
|
| Premium reserve |
|
W |
14,515,676 |
|
|
|
28,443,718 |
|
|
|
9,078,015 |
|
|
|
52,037,409 |
|
|
|
15,609 |
|
|
|
64 |
|
|
|
15,673 |
|
|
|
52,053,082 |
|
| Guarantee reserve |
|
|
24,717 |
|
|
|
284,474 |
|
|
|
871 |
|
|
|
310,062 |
|
|
|
— |
|
|
|
— |
|
|
|
— |
|
|
|
310,062 |
|
| Unearned premium reserve |
|
|
1 |
|
|
|
1,660 |
|
|
|
— |
|
|
|
1,661 |
|
|
|
8 |
|
|
|
— |
|
|
|
8 |
|
|
|
1,669 |
|
| Reserve for outstanding claims |
|
|
266,157 |
|
|
|
1,137,858 |
|
|
|
424,897 |
|
|
|
1,828,912 |
|
|
|
14,376 |
|
|
|
— |
|
|
|
14,376 |
|
|
|
1,843,288 |
|
| Interest rate difference guarantee reserve |
|
|
1,734 |
|
|
|
130 |
|
|
|
7 |
|
|
|
1,871 |
|
|
|
— |
|
|
|
— |
|
|
|
— |
|
|
|
1,871 |
|
| Mortality gains reserve |
|
|
6,894 |
|
|
|
34,085 |
|
|
|
88 |
|
|
|
41,067 |
|
|
|
2 |
|
|
|
— |
|
|
|
2 |
|
|
|
41,069 |
|
| Interest gains reserve |
|
|
23,031 |
|
|
|
242 |
|
|
|
12 |
|
|
|
23,285 |
|
|
|
— |
|
|
|
— |
|
|
|
— |
|
|
|
23,285 |
|
| Expense gains reserve |
|
|
6,068 |
|
|
|
7,595 |
|
|
|
— |
|
|
|
13,663 |
|
|
|
— |
|
|
|
— |
|
|
|
— |
|
|
|
13,663 |
|
| Long term duration dividend reserve |
|
|
26,799 |
|
|
|
12,663 |
|
|
|
7 |
|
|
|
39,469 |
|
|
|
— |
|
|
|
— |
|
|
|
— |
|
|
|
39,469 |
|
| Reserve for policyholder’s profit dividend |
|
|
1,635 |
|
|
|
— |
|
|
|
— |
|
|
|
1,635 |
|
|
|
— |
|
|
|
— |
|
|
|
— |
|
|
|
1,635 |
|
| Reserve for losses on dividend insurance contract |
|
|
953 |
|
|
|
— |
|
|
|
— |
|
|
|
953 |
|
|
|
— |
|
|
|
— |
|
|
|
— |
|
|
|
953 |
|
| |
|
|
|
|
|
|
|
|
|
|
|
|
|
|
|
|
|
|
|
|
|
|
|
|
|
|
|
|
|
|
|
|
| |
|
W |
14,873,665 |
|
|
|
29,922,425 |
|
|
|
9,503,897 |
|
|
|
54,299,987 |
|
|
|
29,995 |
|
|
|
64 |
|
|
|
30,059 |
|
|
|
54,330,046 |
|
| |
|
|
|
|
|
|
|
|
|
|
|
|
|
|
|
|
|
|
|
|
|
|
|
|
|
|
|
|
|
|
|
|
SHINHAN FINANCIAL GROUP CO., LTD. AND SUBSIDIARIES
Notes to the Consolidated Financial Statements
(In millions of won)
|
Liability under insurance contracts (continued) |
|
|
|
|
|
|
|
|
|
|
|
|
|
|
|
|
|
|
|
|
|
|
|
|
|
|
|
|
|
| |
|
|
|
| |
|
Individual insurance |
|
|
Group insurance |
|
| |
|
Pure
endowment |
|
|
Death |
|
|
Endowment |
|
|
Subtotal |
|
|
Pure
protection |
|
|
Savings |
|
|
Subtotal |
|
| Premium reserve |
|
W |
14,123,768 |
|
|
|
30,270,677 |
|
|
|
7,589,977 |
|
|
|
51,984,422 |
|
|
|
13,556 |
|
|
|
66 |
|
|
|
13,622 |
|
| Guarantee reserve |
|
|
20,514 |
|
|
|
278,826 |
|
|
|
745 |
|
|
|
300,085 |
|
|
|
— |
|
|
|
— |
|
|
|
— |
|
| Unearned premium reserve |
|
|
2 |
|
|
|
1,642 |
|
|
|
— |
|
|
|
1,644 |
|
|
|
1 |
|
|
|
— |
|
|
|
1 |
|
| Reserve for outstanding claims |
|
|
275,089 |
|
|
|
1,182,023 |
|
|
|
338,747 |
|
|
|
1,795,859 |
|
|
|
14,154 |
|
|
|
— |
|
|
|
14,154 |
|
| Interest rate difference guarantee reserve |
|
|
1,496 |
|
|
|
106 |
|
|
|
6 |
|
|
|
1,608 |
|
|
|
— |
|
|
|
— |
|
|
|
— |
|
| Mortality gains reserve |
|
|
5,932 |
|
|
|
31,100 |
|
|
|
70 |
|
|
|
37,102 |
|
|
|
2 |
|
|
|
— |
|
|
|
2 |
|
| Interest gains reserve |
|
|
22,202 |
|
|
|
209 |
|
|
|
10 |
|
|
|
22,421 |
|
|
|
— |
|
|
|
— |
|
|
|
— |
|
| Expense gains reserve |
|
|
5,490 |
|
|
|
7,060 |
|
|
|
— |
|
|
|
12,550 |
|
|
|
— |
|
|
|
— |
|
|
|
— |
|
| Long term duration dividend reserve |
|
|
24,550 |
|
|
|
11,881 |
|
|
|
6 |
|
|
|
36,437 |
|
|
|
— |
|
|
|
— |
|
|
|
— |
|
| Reserve for policyholder’s profit dividend |
|
|
1,616 |
|
|
|
— |
|
|
|
— |
|
|
|
1,616 |
|
|
|
— |
|
|
|
— |
|
|
|
— |
|
| Reserve for losses on dividend insurance contract |
|
|
1,155 |
|
|
|
— |
|
|
|
— |
|
|
|
1,155 |
|
|
|
— |
|
|
|
— |
|
|
|
— |
|
| |
|
|
|
|
|
|
|
|
|
|
|
|
|
|
|
|
|
|
|
|
|
|
|
|
|
|
|
|
| |
|
W |
14,481,814 |
|
|
|
31,783,524 |
|
|
|
7,929,561 |
|
|
|
54,194,899 |
|
|
|
27,713 |
|
|
|
66 |
|
|
|
27,779 |
|
| |
|
|
|
|
|
|
|
|
|
|
|
|
|
|
|
|
|
|
|
|
|
|
|
|
|
|
|
|
|
|
|
|
|
|
|
|
|
|
|
|
|
|
|
|
|
|
|
|
|
| |
|
|
|
| |
|
General insurance |
|
|
|
|
| |
|
Automotive |
|
|
General |
|
|
Long-term |
|
|
Subtotal |
|
|
Total |
|
| Premium reserve |
|
W |
— |
|
|
|
— |
|
|
|
2,814 |
|
|
|
2,814 |
|
|
|
52,000,858 |
|
| Guarantee reserve |
|
|
— |
|
|
|
— |
|
|
|
— |
|
|
|
— |
|
|
|
300,085 |
|
| Unearned premium reserve |
|
|
— |
|
|
|
86,699 |
|
|
|
— |
|
|
|
86,699 |
|
|
|
88,344 |
|
| Reserve for outstanding claims |
|
|
1,880 |
|
|
|
2,598 |
|
|
|
71 |
|
|
|
4,549 |
|
|
|
1,814,562 |
|
| Interest rate difference guarantee reserve |
|
|
— |
|
|
|
— |
|
|
|
— |
|
|
|
— |
|
|
|
1,608 |
|
| Mortality gains reserve |
|
|
— |
|
|
|
— |
|
|
|
— |
|
|
|
— |
|
|
|
37,104 |
|
| Interest gains reserve |
|
|
— |
|
|
|
— |
|
|
|
— |
|
|
|
— |
|
|
|
22,421 |
|
| Expense gains reserve |
|
|
— |
|
|
|
— |
|
|
|
— |
|
|
|
— |
|
|
|
12,550 |
|
| Long term duration dividend reserve |
|
|
— |
|
|
|
— |
|
|
|
— |
|
|
|
— |
|
|
|
36,437 |
|
| Reserve for policyholder’s profit dividend |
|
|
— |
|
|
|
— |
|
|
|
— |
|
|
|
— |
|
|
|
1,616 |
|
| Reserve for losses on dividend insurance contract |
|
|
— |
|
|
|
— |
|
|
|
— |
|
|
|
— |
|
|
|
1,155 |
|
| |
|
|
|
|
|
|
|
|
|
|
|
|
|
|
|
|
|
|
|
|
| |
|
W |
1,880 |
|
|
|
89,297 |
|
|
|
2,885 |
|
|
|
94,062 |
|
|
|
54,316,740 |
|
| |
|
|
|
|
|
|
|
|
|
|
|
|
|
|
|
|
|
|
|
|
SHINHAN FINANCIAL GROUP CO., LTD. AND SUBSIDIARIES
Notes to the Consolidated Financial Statements
(In millions of won)
|
Liability under insurance contracts (continued) |
| |
(f) |
Changes in policy reserves |
| |
Changes |
in policy reserves for the year ended December 31, 2021 and 2022 are as follows |
|
|
|
|
|
|
|
|
|
|
|
|
|
|
|
|
|
|
|
Insurance
contracts with
fixed-interest |
|
|
Insurance contracts with variable-interest |
|
|
Total |
|
Beginning balance |
|
W |
23,414,098 |
|
|
|
29,977,303 |
|
|
|
53,391,401 |
|
Reserve (*) |
|
|
1,516,502 |
|
|
|
(577,857 |
) |
|
|
938,645 |
|
| |
|
|
|
|
|
|
|
|
|
|
|
|
Ending balance |
|
W |
24,930,600 |
|
|
|
29,399,446 |
|
|
|
54,330,046 |
|
| |
|
|
|
|
|
|
|
|
|
|
|
|
|
(*) |
This is the amount of provision for insurance contract liabilities less changes in reinsurance assets and includes effects from changes in foreign exchange rate . |
|
|
|
|
|
|
|
|
|
|
|
|
|
|
|
|
|
|
|
|
|
|
|
|
|
|
|
|
|
|
|
|
|
| |
|
|
|
| |
|
Life insurance |
|
|
General insurance |
|
| |
|
Insurance
contracts with
fixed-interest |
|
|
Insurance
contracts with
variable-interest |
|
|
Subtotal |
|
|
Automotive |
|
|
General |
|
|
Long-term |
|
|
Subtotal |
|
|
Total |
|
Beginning balance |
|
W |
24,930,600 |
|
|
|
29,399,446 |
|
|
|
54,330,046 |
|
|
|
— |
|
|
|
— |
|
|
|
— |
|
|
|
— |
|
|
|
54,330,046 |
|
Reserve (*) |
|
|
1,988,528 |
|
|
|
(2,095,896 |
) |
|
|
(107,368 |
) |
|
|
978 |
|
|
|
20,127 |
|
|
|
1,551 |
|
|
|
22,656 |
|
|
|
(84,712 |
) |
Business combination (Note 47) |
|
|
— |
|
|
|
— |
|
|
|
— |
|
|
|
902 |
|
|
|
69,170 |
|
|
|
1,334 |
|
|
|
71,406 |
|
|
|
71,406 |
|
| |
|
|
|
|
|
|
|
|
|
|
|
|
|
|
|
|
|
|
|
|
|
|
|
|
|
|
|
|
|
|
|
|
Ending balance |
|
W |
26,919,128 |
|
|
|
27,303,550 |
|
|
|
54,222,678 |
|
|
|
1,880 |
|
|
|
89,297 |
|
|
|
2,885 |
|
|
|
94,062 |
|
|
|
54,316,740 |
|
| |
|
|
|
|
|
|
|
|
|
|
|
|
|
|
|
|
|
|
|
|
|
|
|
|
|
|
|
|
|
|
|
|
| (*) |
This is the amount of provision for insurance contract liabilities less changes in reinsurance assets and includes effects from changes in foreign exchange rate. |
| |
(g) |
Changes in policy reserves by insurance risk classification |
|
|
|
|
|
|
|
|
|
|
|
|
|
|
|
|
|
|
|
|
|
|
|
|
|
|
|
|
|
|
|
|
|
| |
|
|
|
| |
|
Individual insurance |
|
|
Group insurance |
|
| |
|
Pure
endowment |
|
|
Death |
|
|
Endowment |
|
|
Subtotal |
|
|
Pure
protection |
|
|
Savings |
|
|
Sub
total |
|
|
Total |
|
Beginning balance |
|
W |
14,936,578 |
|
|
|
28,074,444 |
|
|
|
10,346,489 |
|
|
|
53,357,511 |
|
|
|
33,828 |
|
|
|
62 |
|
|
|
33,890 |
|
|
|
53,391,401 |
|
Reserve (reversal) (*) |
|
|
(62,913 |
) |
|
|
1,847,981 |
|
|
|
(842,592 |
) |
|
|
942,476 |
|
|
|
(3,833 |
) |
|
|
2 |
|
|
|
(3,831 |
) |
|
|
938,645 |
|
| |
|
|
|
|
|
|
|
|
|
|
|
|
|
|
|
|
|
|
|
|
|
|
|
|
|
|
|
|
|
|
|
|
Ending balance |
|
W |
14,873,665 |
|
|
|
29,922,425 |
|
|
|
9,503,897 |
|
|
|
54,299,987 |
|
|
|
29,995 |
|
|
|
64 |
|
|
|
30,059 |
|
|
|
54,330,046 |
|
| |
|
|
|
|
|
|
|
|
|
|
|
|
|
|
|
|
|
|
|
|
|
|
|
|
|
|
|
|
|
|
|
|
| (*) |
This is the amount of provision for insurance contract liabilities less changes in reinsurance assets and includes effects from changes in foreign exchange rate. |
SHINHAN FINANCIAL GROUP CO., LTD. AND SUBSIDIARIES
Notes to the Consolidated Financial Statements
(In millions of won)
|
Liability under insurance contracts (continued) |
|
|
|
|
|
|
|
|
|
|
|
|
|
|
|
|
|
|
|
|
|
|
|
|
|
|
|
|
|
|
|
|
|
|
|
|
|
|
|
|
|
|
|
|
|
|
|
|
|
| |
|
|
|
| |
|
Individual insurance |
|
|
Group insurance |
|
|
General insurance |
|
| |
|
Pure
endowment |
|
|
Death |
|
|
Endowment |
|
|
Sub
total |
|
|
Pure
protection |
|
|
Savings |
|
|
Sub
total |
|
|
Auto-
motive |
|
|
General |
|
|
Long-
term |
|
|
Sub
total |
|
|
Total |
|
Beginning balance |
|
W |
14,873,665 |
|
|
|
29,922,425 |
|
|
|
9,503,897 |
|
|
|
54,299,987 |
|
|
|
29,995 |
|
|
|
64 |
|
|
|
30,059 |
|
|
|
— |
|
|
|
— |
|
|
|
— |
|
|
|
— |
|
|
|
54,330,046 |
|
Reserve (reversal) (*) |
|
|
(391,851 |
) |
|
|
1,861,099 |
|
|
|
(1,574,336 |
) |
|
|
(105,088 |
) |
|
|
(2,282 |
) |
|
|
2 |
|
|
|
(2,280 |
) |
|
|
978 |
|
|
|
20,127 |
|
|
|
1,551 |
|
|
|
22,656 |
|
|
|
(84,712 |
) |
Business combination (Note 47) |
|
|
— |
|
|
|
— |
|
|
|
— |
|
|
|
— |
|
|
|
— |
|
|
|
— |
|
|
|
— |
|
|
|
902 |
|
|
|
69,170 |
|
|
|
1,334 |
|
|
|
71,406 |
|
|
|
71,406 |
|
| |
|
|
|
|
|
|
|
|
|
|
|
|
|
|
|
|
|
|
|
|
|
|
|
|
|
|
|
|
|
|
|
|
|
|
|
|
|
|
|
|
|
|
|
|
|
|
|
|
Ending balance |
|
W |
14,481,814 |
|
|
|
31,783,524 |
|
|
|
7,929,561 |
|
|
|
54,194,899 |
|
|
|
27,713 |
|
|
|
66 |
|
|
|
27,779 |
|
|
|
1,880 |
|
|
|
89,297 |
|
|
|
2,885 |
|
|
|
94,062 |
|
|
|
54,316,740 |
|
| |
|
|
|
|
|
|
|
|
|
|
|
|
|
|
|
|
|
|
|
|
|
|
|
|
|
|
|
|
|
|
|
|
|
|
|
|
|
|
|
|
|
|
|
|
|
|
|
|
| (*) |
This is the amount of provision for insurance contract liabilities less changes in reinsurance assets and includes effects from changes in foreign exchange rate. |
SHINHAN FINANCIAL GROUP CO., LTD. AND SUBSIDIARIES
Notes to the Consolidated Financial Statements
(In millions of won)
|
Liability under insurance contracts (continued) |
| |
(h) |
Reinsurance credit risk as of December 31, 2021 and 2022 are as follows: |
|
|
|
|
|
|
|
|
|
|
|
|
|
|
|
|
|
|
|
|
|
|
|
|
|
|
Reinsurance
assets |
|
|
Reinsurance
account
receivable |
|
|
Reinsurance
assets |
|
|
Reinsurance
account
receivable |
|
| AAA |
|
W |
— |
|
|
|
— |
|
|
|
22,687 |
|
|
|
4,525 |
|
| |
|
|
15,310 |
|
|
|
23,472 |
|
|
|
33,859 |
|
|
|
53,317 |
|
| |
|
|
31,740 |
|
|
|
46,615 |
|
|
|
274,704 |
|
|
|
93,633 |
|
| Unrated |
|
|
— |
|
|
|
— |
|
|
|
118 |
|
|
|
204 |
|
| |
|
|
|
|
|
|
|
|
|
|
|
|
|
|
|
|
| |
|
W |
47,050 |
|
|
|
70,087 |
|
|
|
331,368 |
|
|
|
151,679 |
|
| |
|
|
|
|
|
|
|
|
|
|
|
|
|
|
|
|
| |
(i) |
Income or expenses on insurance for the years ended December 31, 2020, 2021 and 2022 are as follows: |
|
|
|
|
|
|
|
|
|
|
|
|
|
|
|
|
|
|
|
|
|
|
|
| Insurance income: |
|
|
|
|
|
|
|
|
|
|
|
|
| Premium income |
|
W |
7,037,308 |
|
|
|
6,255,872 |
|
|
|
6,258,858 |
|
| Reinsurance income (*1) |
|
|
152,892 |
|
|
|
153,534 |
|
|
|
182,566 |
|
| Provision for insurance liabilities (*1),(*2) |
|
|
— |
|
|
|
— |
|
|
|
342,088 |
|
| Separate account income |
|
|
57,553 |
|
|
|
75,117 |
|
|
|
107,393 |
|
| |
|
|
|
|
|
|
|
|
|
|
|
|
| |
|
|
7,247,753 |
|
|
|
6,484,523 |
|
|
|
6,890,905 |
|
| |
|
|
|
|
|
|
|
|
|
|
|
|
| Insurance expenses: |
|
|
|
|
|
|
|
|
|
|
|
|
| Claims paid |
|
|
5,564,875 |
|
|
|
5,346,364 |
|
|
|
6,467,553 |
|
| Reinsurance premium expenses (*1) |
|
|
167,215 |
|
|
|
175,282 |
|
|
|
456,732 |
|
| Provision for insurance liabilities (*1),(*2) |
|
|
1,311,252 |
|
|
|
933,875 |
|
|
|
— |
|
| Separate account expenses |
|
|
57,553 |
|
|
|
75,116 |
|
|
|
107,394 |
|
| Acquisition costs |
|
|
802,942 |
|
|
|
687,469 |
|
|
|
662,244 |
|
| Collection expenses and discount fee |
|
|
19,922 |
|
|
|
16,810 |
|
|
|
18,575 |
|
| Deferred acquisition costs |
|
|
(486,972 |
) |
|
|
(397,196 |
) |
|
|
(398,660 |
) |
| Amortization of deferred acquisition costs |
|
|
414,898 |
|
|
|
422,189 |
|
|
|
404,300 |
|
| |
|
|
|
|
|
|
|
|
|
|
|
|
| |
|
|
7,851,685 |
|
|
|
7,259,909 |
|
|
|
7,718,138 |
|
| |
|
|
|
|
|
|
|
|
|
|
|
|
| Net loss on insurance |
|
W |
(603,932 |
) |
|
|
(775,386 |
) |
|
|
(827,233 |
) |
| |
|
|
|
|
|
|
|
|
|
|
|
|
| |
(*1) |
It includes reinsurance expenses of W 244,855 million, reinsurance income of W 7,314 million and reversal of insurance liabilities of W 242,071 million due to the joint reinsurance . |
| |
(*2) |
Interest expenses on savings insurance contracts are included. |
SHINHAN FINANCIAL GROUP CO., LTD. AND SUBSIDIARIES
Notes to the Consolidated Financial Statements
(In millions of won)
|
Liability under insurance contracts (continued) |
| |
(j) |
Maturity of premium reserve as of December 31, 2021 and 2022 are as follows: |
|
|
|
|
|
|
|
|
|
|
|
|
|
|
|
|
|
|
|
|
|
|
|
|
|
|
|
|
|
| |
|
|
|
| |
|
Less than or
equal to
1 year |
|
|
1 ~ 3
years |
|
|
3 ~ 7
years |
|
|
7 ~ 10
years |
|
|
10 ~ 20
years |
|
|
More than
20 years |
|
|
Total |
|
| Life insurance: |
|
|
|
|
|
|
|
|
|
|
|
|
|
|
|
|
|
|
|
|
|
|
|
|
|
|
|
|
| Variable interest rate |
|
W |
906,017 |
|
|
|
1,492,275 |
|
|
|
1,420,942 |
|
|
|
653,388 |
|
|
|
2,001,348 |
|
|
|
20,082,744 |
|
|
|
26,556,714 |
|
| Fixed interest rate |
|
|
99,289 |
|
|
|
471,909 |
|
|
|
772,549 |
|
|
|
687,077 |
|
|
|
2,072,122 |
|
|
|
21,393,422 |
|
|
|
25,496,368 |
|
| |
|
|
|
|
|
|
|
|
|
|
|
|
|
|
|
|
|
|
|
|
|
|
|
|
|
|
|
|
| Ending balance |
|
W |
1,005,306 |
|
|
|
1,964,184 |
|
|
|
2,193,491 |
|
|
|
1,340,465 |
|
|
|
4,073,470 |
|
|
|
41,476,166 |
|
|
|
52,053,082 |
|
| |
|
|
|
|
|
|
|
|
|
|
|
|
|
|
|
|
|
|
|
|
|
|
|
|
|
|
|
|
|
|
|
|
|
|
|
|
|
|
|
|
|
|
|
|
|
|
|
|
|
|
|
|
|
|
|
|
|
| |
|
|
|
| |
|
Less than or
equal to
1 year |
|
|
1 ~ 3
years |
|
|
3 ~ 7
years |
|
|
7 ~ 10
years |
|
|
10 ~ 20
years |
|
|
More than
20 years |
|
|
Total |
|
| Life insurance: |
|
|
|
|
|
|
|
|
|
|
|
|
|
|
|
|
|
|
|
|
|
|
|
|
|
|
|
|
| Variable interest rate |
|
W |
616,479 |
|
|
|
911,463 |
|
|
|
856,451 |
|
|
|
650,770 |
|
|
|
1,847,433 |
|
|
|
19,601,653 |
|
|
|
24,484,249 |
|
| Fixed interest rate |
|
|
223,095 |
|
|
|
546,105 |
|
|
|
1,011,399 |
|
|
|
698,021 |
|
|
|
1,979,082 |
|
|
|
23,056,093 |
|
|
|
27,513,795 |
|
| |
|
|
|
|
|
|
|
|
|
|
|
|
|
|
|
|
|
|
|
|
|
|
|
|
|
|
|
|
| |
|
|
839,574 |
|
|
|
1,457,568 |
|
|
|
1,867,850 |
|
|
|
1,348,791 |
|
|
|
3,826,515 |
|
|
|
42,657,746 |
|
|
|
51,998,044 |
|
| General insurance: |
|
|
|
|
|
|
|
|
|
|
|
|
|
|
|
|
|
|
|
|
|
|
|
|
|
|
|
|
| Long-term |
|
|
— |
|
|
|
— |
|
|
|
— |
|
|
|
40 |
|
|
|
2,774 |
|
|
|
— |
|
|
|
2,814 |
|
| |
|
|
|
|
|
|
|
|
|
|
|
|
|
|
|
|
|
|
|
|
|
|
|
|
|
|
|
|
| Ending balance |
|
W |
839,574 |
|
|
|
1,457,568 |
|
|
|
1,867,850 |
|
|
|
1,348,831 |
|
|
|
3,829,289 |
|
|
|
42,657,746 |
|
|
|
52,000,858 |
|
| |
|
|
|
|
|
|
|
|
|
|
|
|
|
|
|
|
|
|
|
|
|
|
|
|
|
|
|
|
| |
(k) |
Liability adequacy test, LAT |
[Shinhan Life Insurance Co., Ltd.]
Liability adequacy tests were performed on the premium reserve, unearned premium reserve and guarantee reserve for the contracts held at December 31, 2022. The premium reserve considered the amount net level premium reserve less, where appropriate, deferred acquisition cost and Loan on policy in accordance with the Article
6-3
of Regulation on Supervision of Insurance Business Act.
In the debt appraisal system, the insurance premium surplus method is applied to calculate premium deficits. Premium deficiency refers to deficiency when the amount of accumulated reserve is insufficient due to a decrease in the interest rate after the sale of the product or an increase in the risk rate compared with the expected basic rate at the time of product development.
The insurance premium standard inspection method is a method of calculating the reserve amount based on the present value of total income reflecting the interest rate, the risk rate, the business ratio, the cancelation rate, etc. and the present value of the total expenditure, that is, interest rate(discount rate), business ratio, risk rate, and cancelation rate calculated based on the Group’s own experience, which reflects company-specific characteristics, and does not reflect subjective factors such as management’s willingness to improve management.
SHINHAN FINANCIAL GROUP CO., LTD. AND SUBSIDIARIES
Notes to the Consolidated Financial Statements
(In millions of won)
|
Liability under insurance contracts (continued) |
iii) Assumptions and basis of calculation applied
The assumptions and basis of calculation applied to calculate the estimates of future cash flows when performing liability adequacy test for the years ended December 31, 2021 and 2022 are as follows. The criteria of Insurance contract liability adequacy test were changed during the period, and the Group has applied the change in the accounting policy as it provides more reliable and relevant information on the estimate of future cash flows, and the notes as of December 31, 2021 and January 1, 2021 have been restated.
|
|
|
|
|
|
|
|
|
| |
|
|
|
|
| |
|
|
|
|
|
|
|
Assumption applied and
calculation method |
| Discount rate |
|
Shinhan Life Insurance Co., Ltd. -3.623% ~ 23.477% Orange Life Insurance Co., Ltd. -3.623% ~ 23.477% |
|
-3.39% ~ 19.541% |
|
-2.838% ~ 21.144% |
|
The interest rate scenario calculated and presented by the Financial Supervisory Service as a scenario in which a liquidity premium is added to the risk-free rate of return scenario. |
| |
|
|
|
|
| Mortality rate |
|
Shinhan Life Insurance Co., Ltd. 10.38% ~ 585.90% Orange Life Insurance Co., Ltd. 15% ~ 255% |
|
16% ~ 751% |
|
9% ~ 771% |
|
• Death due to other causes: Based on the statistics illustrating the past five-year experience, the ratio of premiums to on-level risk premiums by risk collateral and time elapsed. • Death due to natural causes: The ratio of actual mortality to the latest expected mortality |
| |
|
|
|
|
| Surrender ratio |
|
Shinhan Life Insurance Co., Ltd. 0.53% ~ 29.83% Orange Life Insurance Co., Ltd. 0% ~ 61% |
|
0% ~ 84% |
|
0% ~ 78% |
|
Lapse rate by sales channel, product, and time elapsed for the past five years. |
SHINHAN FINANCIAL GROUP CO., LTD. AND SUBSIDIARIES
Notes to the Consolidated Financial Statements
(In millions of won)
|
Liability under insurance contracts (continued) |
iv) The result of liability adequacy test as of January 1, 2021 and December 31, 2021 and 2022 are as follows:
|
|
|
|
|
|
|
|
|
|
|
|
|
| |
|
|
|
| |
|
|
|
|
|
|
|
|
|
| Participating: |
|
|
|
|
|
|
|
|
|
|
|
|
| Fixed interest |
|
W |
598,793 |
|
|
|
1,371,496 |
|
|
|
(772,703 |
) |
| Variable interest |
|
|
915,382 |
|
|
|
1,062,384 |
|
|
|
(147,002 |
) |
| |
|
|
|
|
|
|
|
|
|
|
|
|
| Fixed interest |
|
|
7,230,482 |
|
|
|
4,222,670 |
|
|
|
3,007,812 |
|
| Variable interest |
|
|
14,456,394 |
|
|
|
13,753,963 |
|
|
|
702,431 |
|
| Variable type |
|
|
165,259 |
|
|
|
61,212 |
|
|
|
104,047 |
|
| |
|
|
|
|
|
|
|
|
|
|
|
|
| |
|
W |
23,366,310 |
|
|
|
20,471,725 |
|
|
|
2,894,585 |
|
| |
|
|
|
|
|
|
|
|
|
|
|
|
|
|
|
|
|
|
|
|
|
|
|
|
|
| |
|
|
|
| |
|
|
|
|
|
|
|
|
|
| Participating: |
|
|
|
|
|
|
|
|
|
|
|
|
| Fixed interest |
|
W |
1,371,625 |
|
|
|
2,098,387 |
|
|
|
(726,762 |
) |
| Variable interest |
|
|
2,099,040 |
|
|
|
3,024,911 |
|
|
|
(925,871 |
) |
| |
|
|
|
|
|
|
|
|
|
|
|
|
| Fixed interest |
|
|
18,749,426 |
|
|
|
8,155,797 |
|
|
|
10,593,629 |
|
| Variable interest |
|
|
23,059,035 |
|
|
|
21,378,217 |
|
|
|
1,680,818 |
|
| Variable type |
|
|
109,753 |
|
|
|
(1,437,388 |
) |
|
|
1,547,141 |
|
| |
|
|
|
|
|
|
|
|
|
|
|
|
| |
|
W |
45,388,879 |
|
|
|
33,219,924 |
|
|
|
12,168,955 |
|
| |
|
|
|
|
|
|
|
|
|
|
|
|
|
|
|
|
|
|
|
|
|
|
|
|
|
| |
|
|
|
| |
|
|
|
|
|
|
|
|
|
| Participating: |
|
|
|
|
|
|
|
|
|
|
|
|
| Fixed interest |
|
W |
1,388,054 |
|
|
|
1,679,179 |
|
|
|
(291,125 |
) |
| Variable interest |
|
|
2,082,019 |
|
|
|
2,890,311 |
|
|
|
(808,292 |
) |
| |
|
|
|
|
|
|
|
|
|
|
|
|
| Fixed interest |
|
|
20,382,784 |
|
|
|
6,245,441 |
|
|
|
14,137,343 |
|
| Variable interest |
|
|
21,124,126 |
|
|
|
17,994,755 |
|
|
|
3,129,371 |
|
| Variable type |
|
|
147,988 |
|
|
|
(1,104,320 |
) |
|
|
1,252,308 |
|
| |
|
|
240,720 |
|
|
|
135,465 |
|
|
|
105,255 |
|
| |
|
|
|
|
|
|
|
|
|
|
|
|
| |
|
W |
45,365,691 |
|
|
|
27,840,831 |
|
|
|
17,524,860 |
|
| |
|
|
|
|
|
|
|
|
|
|
|
|
SHINHAN FINANCIAL GROUP CO., LTD. AND SUBSIDIARIES
Notes to the Consolidated Financial Statements
(In millions of won)
|
Liability under insurance contracts (continued) |
<Orange Life Insurance>
|
|
|
|
|
|
|
|
|
|
|
|
|
| |
|
|
|
| |
|
|
|
|
|
|
|
|
|
| Participating: |
|
|
|
|
|
|
|
|
|
|
|
|
| Fixed interest |
|
W |
745,614 |
|
|
|
793,719 |
|
|
|
(48,105 |
) |
| Variable interest |
|
|
1,174,807 |
|
|
|
1,698,984 |
|
|
|
(524,177 |
) |
| |
|
|
|
|
|
|
|
|
|
|
|
|
| Fixed interest |
|
|
10,061,004 |
|
|
|
5,850,160 |
|
|
|
4,210,844 |
|
| Variable interest |
|
|
9,190,507 |
|
|
|
8,998,793 |
|
|
|
191,714 |
|
| Variable type |
|
|
(15,032 |
) |
|
|
(1,548,878 |
) |
|
|
1,533,846 |
|
| |
|
|
|
|
|
|
|
|
|
|
|
|
| |
|
W |
21,156,900 |
|
|
|
15,792,778 |
|
|
|
5,364,122 |
|
| |
|
|
|
|
|
|
|
|
|
|
|
|
[Shinhan EZ General Insurance, Ltd.]
Liability adequacy tests are performed on the premium reserve and unearned premium reserve for the contracts held at December 31, 2022. The premium reserve considered the amount net level premium reserve less, where appropriate, deferred acquisition cost in accordance with the Article
6-3
of Regulation on Supervision of Insurance Business Act.
In the debt appraisal system, the insurance premium surplus method is applied to calculate premium deficits. Premium deficiency refers to deficiency when the amount of accumulated reserve is insufficient due to a decrease in the interest rate after the sale of the product or an increase in the risk rate compared with the expected basic rate at the time of product development.
The insurance premium standard inspection method is a method of calculating the reserve amount based on the present value of total income reflecting the interest rate, the risk rate, the business ratio, the cancelation rate, etc. and the present value of the total expenditure, that is, business ratio, risk rate, and cancelation rate calculated based on the Group’s own experience, which reflects company-specific characteristics, and does not reflect subjective factors such as management’s willingness to improve management.
SHINHAN FINANCIAL GROUP CO., LTD. AND SUBSIDIARIES
Notes to the Consolidated Financial Statements
(In millions of won)
|
Liability under insurance contracts (continued) |
iii) Assumptions and basis of calculation applied
The assumptions and basis of calculation applied to calculate the estimates of future cash flows when performing liability adequacy test for the year ended December 31, 2022 are as follows.
|
|
|
|
|
|
|
|
|
|
|
|
|
|
|
| |
|
|
|
|
|
| |
|
|
|
|
|
|
|
|
|
|
Assumption applied and
calculation method |
| Long-term (*): |
|
|
|
|
|
|
|
|
|
|
|
|
|
|
| |
|
|
|
|
| Discount rate |
|
|
-3.623%~23.477% |
|
|
|
-3.39%~19.541% |
|
|
|
-2.838%~21.144% |
|
|
The interest rate scenario calculated and presented by the Financial Supervisory Service as a scenario in which a liquidity premium is added to the risk-free rate of return scenario. |
| |
|
|
|
|
| Loss rate |
|
|
3%~365% |
|
|
|
19%~131% |
|
|
|
49%~145% |
|
|
Due to lack of empirical statistics, the application of long-term non-life insurance industry statistics and risk rates applied to calculating product prices by insurance coverage |
| |
|
|
|
|
| Lapse ratio |
|
|
0%~15% |
|
|
|
0%~17% |
|
|
|
0%~18% |
|
|
Due to lack of empirical statistics, the application of long-term non-life insurance industry statistics |
| |
|
|
|
|
| General: |
|
|
|
|
|
|
|
|
|
|
|
|
|
|
| |
|
|
|
|
| Loss rate |
|
|
39% |
|
|
|
36% |
|
|
|
37% |
|
|
Based on the statistics illustrating the past five-year experience, the ratio of incurred loss to earned premium |
| |
|
|
|
|
| Loss Assumed Expense ratio |
|
|
11% |
|
|
|
21% |
|
|
|
19% |
|
|
Based on the statistics illustrating the past three-year experience, the ratio of best estimated LAE(Loss Assumed Expense) ratio |
| |
|
|
|
|
| Administration expense ratio |
|
|
63% |
|
|
|
62% |
|
|
|
70% |
|
|
Based on the statistics illustrating the past one-year experience, the ratio of best estimated expense ratio |
| (*) |
Among the expense ratios, the new acquisition cost was calculated based on the amount to be executed in the future in accordance with related regulations such as internal recruitment allowance regulations, and the maintenance cost was calculated for each cost driver based on experience statistics for the last year. |
SHINHAN FINANCIAL GROUP CO., LTD. AND SUBSIDIARIES
Notes to the Consolidated Financial Statements
(In millions of won)
|
Liability under insurance contracts (continued) |
iv) The result of liability adequacy test as of January 1, 2021 and December 31, 2021 and 2022 are as follows:
|
|
|
|
|
|
|
|
|
|
|
|
|
| |
|
|
|
| |
|
|
|
|
|
|
|
|
|
| Long-term |
|
W |
— |
|
|
|
(1,610 |
) |
|
|
1,610 |
|
| General |
|
|
21,453 |
|
|
|
19,188 |
|
|
|
2,265 |
|
| |
|
|
|
|
|
|
|
|
|
|
|
|
| |
|
W |
21,453 |
|
|
|
17,578 |
|
|
|
3,875 |
|
| |
|
|
|
|
|
|
|
|
|
|
|
|
|
|
|
|
|
|
|
|
|
|
|
|
|
| |
|
|
|
| |
|
|
|
|
|
|
|
|
|
| Long-term |
|
W |
12 |
|
|
|
2,496 |
|
|
|
(2,484 |
) |
| General |
|
|
53,442 |
|
|
|
53,663 |
|
|
|
(221 |
) |
| |
|
|
|
|
|
|
|
|
|
|
|
|
| |
|
W |
53,454 |
|
|
|
56,159 |
|
|
|
(2,705 |
) |
| |
|
|
|
|
|
|
|
|
|
|
|
|
|
|
|
|
|
|
|
|
|
|
|
|
|
| |
|
|
|
| |
|
|
|
|
|
|
|
|
|
| Long-term |
|
W |
16 |
|
|
|
2,627 |
|
|
|
(2,611 |
) |
| General |
|
|
85,187 |
|
|
|
86,699 |
|
|
|
(1,512 |
) |
| |
|
|
|
|
|
|
|
|
|
|
|
|
| |
|
W |
85,203 |
|
|
|
89,326 |
|
|
|
(4,123 |
) |
| |
|
|
|
|
|
|
|
|
|
|
|
|
SHINHAN FINANCIAL GROUP CO., LTD. AND SUBSIDIARIES
Notes to the Consolidated Financial Statements
(In millions of won)
Other liabilities as of December 31, 2021 and 2022 are as follows:
|
|
|
|
|
|
|
|
|
| |
|
|
|
|
|
|
| Lease liabilities (*) |
|
W |
612,690 |
|
|
|
623,339 |
|
| Accounts payable |
|
|
14,041,740 |
|
|
|
12,452,551 |
|
| Accrued expenses |
|
|
3,273,939 |
|
|
|
4,416,908 |
|
| Dividend payable |
|
|
32,275 |
|
|
|
34,698 |
|
| Advance received |
|
|
177,121 |
|
|
|
186,134 |
|
| Unearned income |
|
|
397,010 |
|
|
|
451,757 |
|
| Withholding value-added tax and other taxes |
|
|
673,294 |
|
|
|
750,547 |
|
| Securities deposit received |
|
|
1,985,269 |
|
|
|
2,451,521 |
|
| Foreign exchange settlement pending |
|
|
221,521 |
|
|
|
359,422 |
|
| Domestic exchange settlement pending |
|
|
1,890,408 |
|
|
|
2,308,574 |
|
| Payable from trust account |
|
|
5,191,901 |
|
|
|
6,579,457 |
|
| Due to agencies |
|
|
887,400 |
|
|
|
718,082 |
|
| Deposits for subscription |
|
|
133,550 |
|
|
|
18,931 |
|
| Separate account liabilities |
|
|
9,834,895 |
|
|
|
8,004,363 |
|
| Sundry liabilities |
|
|
1,563,832 |
|
|
|
2,149,043 |
|
| Others |
|
|
126,455 |
|
|
|
81,148 |
|
| Present value discount |
|
|
(52,464 |
) |
|
|
(97,703 |
) |
| |
|
|
|
|
|
|
|
|
| |
|
W |
40,990,836 |
|
|
|
41,488,772 |
|
| |
|
|
|
|
|
|
|
|
| (*) |
As of December 31, 2021 and 2022, the Group accounts for the lease liabilities as other liabilities. For the year ended December 31, 2021, the amount of variable lease payments that are not included in the measurement of lease liabilities is W 79 million, cash outflows from leases are W 283,470 million, and interest expense on lease liabilities is W 10,873 million. For the year ended December 31, 2022, the amount of variable lease payments that are not included in the measurement of lease liabilities is W 12,337 million, cash outflows from leases are W 279,406 million, and interest expense on lease liabilities is W 13,379 million . |
SHINHAN FINANCIAL GROUP CO., LTD. AND SUBSIDIARIES
Notes to the Consolidated Financial Statements
(In millions of won)
| |
(a) |
Equity as of December 31, 2021 and 2022 are as follows: |
|
|
|
|
|
|
|
|
|
| |
|
|
|
|
|
|
| Capital stock: |
|
|
|
|
|
|
|
|
| Common stock |
|
W |
2,608,176 |
|
|
|
2,608,176 |
|
| Preferred stock |
|
|
361,465 |
|
|
|
361,465 |
|
| |
|
|
|
|
|
|
|
|
| |
|
|
2,969,641 |
|
|
|
2,969,641 |
|
| |
|
|
|
|
|
|
|
|
| Hybrid bond |
|
|
3,334,531 |
|
|
|
4,196,968 |
|
| |
|
|
| Capital surplus: |
|
|
|
|
|
|
|
|
| Share premium |
|
|
11,352,819 |
|
|
|
11,352,819 |
|
| Others |
|
|
742,224 |
|
|
|
742,224 |
|
| |
|
|
|
|
|
|
|
|
| |
|
|
12,095,043 |
|
|
|
12,095,043 |
|
| |
|
|
|
|
|
|
|
|
| Capital adjustments |
|
|
(664,429 |
) |
|
|
(582,859 |
) |
| |
|
|
| Accumulated other comprehensive income, net of tax: |
|
|
|
|
|
|
|
|
| Loss on financial assets at fair value through other comprehensive income |
|
|
(614,872 |
) |
|
|
(3,053,865 |
) |
| Gain (loss) on financial assets at fair value through profit or loss (Overlay approach) |
|
|
141,821 |
|
|
|
(78,276 |
) |
| Equity in other comprehensive income of associates |
|
|
7,595 |
|
|
|
(8,126 |
) |
| Foreign currency translation adjustments for foreign operations |
|
|
(125,219 |
) |
|
|
(112,283 |
) |
| Net loss from cash flow hedges |
|
|
(26,471 |
) |
|
|
(96,965 |
) |
| Other comprehensive loss of separate account |
|
|
(22,850 |
) |
|
|
(136,057 |
) |
| Remeasurement of net defined benefit liabilities (assets) |
|
|
(343,124 |
) |
|
|
(91,993 |
) |
| Changes in own credit risk on financial liabilities designated under fair value option |
|
|
(1,816 |
) |
|
|
(5,155 |
) |
| |
|
|
|
|
|
|
|
|
| |
|
|
(984,936 |
) |
|
|
(3,582,720 |
) |
| |
|
|
|
|
|
|
|
|
| Retained earnings (*1),(*2),(*3) |
|
|
30,541,300 |
|
|
|
33,342,633 |
|
Non-controlling interest (*4),(*5) |
|
|
2,247,272 |
|
|
|
2,691,716 |
|
| |
|
|
|
|
|
|
|
|
| |
|
W |
49,538,422 |
|
|
|
51,130,422 |
|
| |
|
|
|
|
|
|
|
|
| (*1) |
As of December 31, 2021 and 2022, profits reserved by the Group as of Article 53 of the Financial Holding Companies Act amounted to W 2,432,039 million and W 2,573,435 million, respectively. |
| (*2) |
As of December 31, 2021 and 2022, the regulatory reserves for loan losses the Group appropriated in retained earnings are W 15,552 million and W 18,524 million, respectively. |
| (*3) |
As of December 31, 2022, profit dividends within retained earnings of subsidiaries of the Group restricted in accordance with laws, etc. are amounted to W 7,428,897 million. |
| (*4) |
As of December 31, 2021 and 2022, the total amounts of hybrid bonds that Shinhan Bank, Jeju Bank, Shinhan Capital Co,.Ltd. and Shinhan Life Insurance Co., Ltd. have recognized as non-controlling interests are W 2,035,762 million and W 2,537,569 million, respectively. And, for the years ended December 31, 2021 and 2022, the amounts of dividends paid for the hybrid bonds by Shinhan Bank, Jeju Bank, Shinhan Capital |
SHINHAN FINANCIAL GROUP CO., LTD. AND SUBSIDIARIES
Notes to the Consolidated Financial Statements
(In millions of won)
| |
Co,.Ltd. and Shinhan Life Insurance Co., Ltd. W 71,746 million and W 81,262 million, respectively, are allocated to profit attributed to non-controlling interest. |
| (*5) |
During the year ended December 31, 2021, non-controlling interests decreased by W 59,709 million due to the acquisition of the remaining shares by Shinhan Asset Management Co., Ltd. During the year ended December 31, 2022, non-controlling interests decreased by W 89,912 million due to the acquisition of remaining shares by Shinhan Asset Trust Co., Ltd., and non-controlling interests increased by W 19,454 million due to paid-in capital increase of Shinhan EZ General Insurance, Ltd. |
Capital stock of the Group as of December 31, 2021 and 2021 are as follows:
|
|
|
|
|
| Number of authorized shares |
|
|
1,000,000,000 |
|
| Par value per share in won |
|
W |
5,000 |
|
| Number of issued common stocks as of December 31, 2021 |
|
|
516,599,554 |
|
| Number of issued common stocks as of December 31, 2022 |
|
|
508,784,869 |
|
| Number of issued preferred stocks as of December 31, 2021 and 2022 |
|
|
17,482,000 |
|
The details of changes in the number of common shares outstanding as of December 31, 2021 and 2022 are as follows:
|
|
|
|
|
|
|
|
|
| |
|
|
|
|
|
|
|
|
|
|
|
|
|
|
|
|
|
|
|
|
|
|
|
|
|
|
|
|
|
|
|
|
|
|
|
|
|
|
|
|
|
|
|
|
|
|
|
|
|
|
|
|
|
|
|
|
|
|
|
|
| Beginning balance |
|
W |
515,894,758 |
|
|
|
516,593,202 |
|
| Increase |
|
|
700,870 |
|
|
|
— |
|
| Decrease |
|
|
(2,426 |
) |
|
|
(7,814,685 |
) |
| Ending balance |
|
W |
516,593,202 |
|
|
|
508,778,517 |
|
| |
(c) |
The details of preferred stock are as follows: |
|
|
|
|
|
|
|
|
|
|
|
| |
|
|
|
|
|
|
Conversion request
period(*) |
|
| Convertible preferred stock |
|
|
17,482,000 |
|
|
4.0% per year based on issue price (non-cumulative participating) |
|
|
2020.05.01~2023.04.30 |
|
|
(*) |
Preferred stocks that have not been converted for 4 years from the issuance date and until the expiration date of the period of existence are automatically converted to common stocks at the expiration date of the period of existence. |
SHINHAN FINANCIAL GROUP CO., LTD. AND SUBSIDIARIES
Notes to the Consolidated Financial Statements
(In millions of won)
Hybrid bonds classified as other equity instruments as of December 31, 2021 and 2022 are as follows:
|
|
|
|
|
|
|
|
|
|
|
|
|
|
|
|
|
|
|
| |
|
|
|
|
|
|
|
|
|
|
|
|
|
|
| KRW |
|
June 25, 2015 |
|
|
June 25, 2045 |
|
|
|
4.38 |
|
|
W |
199,455 |
|
|
|
199,455 |
|
| |
September 15, 2017 |
|
|
Perpetual bond |
|
|
|
3.77 |
|
|
|
134,683 |
|
|
|
— |
|
| |
September 15, 2017 |
|
|
Perpetual bond |
|
|
|
4.25 |
|
|
|
89,783 |
|
|
|
89,783 |
|
| |
April 13, 2018 |
|
|
Perpetual bond |
|
|
|
4.08 |
|
|
|
134,678 |
|
|
|
134,678 |
|
| |
April 13, 2018 |
|
|
Perpetual bond |
|
|
|
4.56 |
|
|
|
14,955 |
|
|
|
14,955 |
|
| |
August 29, 2018 |
|
|
Perpetual bond |
|
|
|
4.15 |
|
|
|
398,679 |
|
|
|
398,679 |
|
| |
June 28, 2019 |
|
|
Perpetual bond |
|
|
|
3.27 |
|
|
|
199,476 |
|
|
|
199,476 |
|
| |
September 17, 2020 |
|
|
Perpetual bond |
|
|
|
3.12 |
|
|
|
448,699 |
|
|
|
448,699 |
|
| |
March 16, 2021 |
|
|
Perpetual bond |
|
|
|
2.94 |
|
|
|
429,009 |
|
|
|
429,009 |
|
| |
March 16, 2021 |
|
|
Perpetual bond |
|
|
|
3.30 |
|
|
|
169,581 |
|
|
|
169,581 |
|
| |
January 25, 2022 |
|
|
Perpetual bond |
|
|
|
3.90 |
|
|
|
— |
|
|
|
560,438 |
|
| |
January 25, 2022 |
|
|
Perpetual bond |
|
|
|
4.00 |
|
|
|
— |
|
|
|
37,853 |
|
| |
August 26, 2022 |
|
|
Perpetual bond |
|
|
|
4.93 |
|
|
|
— |
|
|
|
343,026 |
|
| |
August 26, 2022 |
|
|
Perpetual bond |
|
|
|
5.15 |
|
|
|
— |
|
|
|
55,803 |
|
| |
|
|
|
|
|
| USD |
|
August 13, 2018 |
|
|
Perpetual bond |
|
|
|
5.88 |
|
|
|
559,526 |
|
|
|
559,526 |
|
| |
May 12, 2021 |
|
|
Perpetual bond |
|
|
|
2.88 |
|
|
|
556,007 |
|
|
|
556,007 |
|
| |
|
|
|
|
|
|
|
|
|
|
|
|
|
|
|
|
|
|
| |
|
|
|
|
|
|
|
|
|
|
|
W |
3,334,531 |
|
|
|
4,196,968 |
|
| |
|
|
|
|
|
|
|
|
|
|
|
|
|
|
|
|
|
|
| |
(*) |
For the year ended December 31, 2022, the deduction for capital related to hybrid bonds issued is W 2,880 million. |
The hybrid bonds above can be repaid early after 5 or 10 years from the date of issuance, and the controlling company has an unconditional right to extend the maturity under the same condition.
Changes in capital adjustments for the years ended December 31, 2021 and 2022 are as follows:
|
|
|
|
|
|
|
|
|
| |
|
|
|
|
|
|
| Beginning balance |
|
W |
(687,935 |
) |
|
|
(664,429 |
) |
| Acquisition of treasury stocks |
|
|
(79 |
) |
|
|
(300,000 |
) |
| Disposal and retirement of treasury stocks |
|
|
23,589 |
|
|
|
300,000 |
|
| The acquisition commitment amount for subsidiaries’ remaining shares |
|
|
— |
|
|
|
86,711 |
|
| Repayments of hybrid bonds |
|
|
— |
|
|
|
(317 |
) |
| Other transactions with owners |
|
|
(4 |
) |
|
|
(4,824 |
) |
| |
|
|
|
|
|
|
|
|
| Ending balance |
|
W |
(664,429 |
) |
|
|
(582,859 |
) |
| |
|
|
|
|
|
|
|
|
SHINHAN FINANCIAL GROUP CO., LTD. AND SUBSIDIARIES
Notes to the Consolidated Financial Statements
(In millions of won)
| |
(f) |
Accumulated other comprehensive income |
Changes in accumulated other comprehensive income for the years ended December 31, 2021 and 2022 are as follows:
|
|
|
|
|
|
|
|
|
|
|
|
|
|
|
|
|
|
|
|
|
|
|
|
|
|
|
|
|
|
|
|
|
|
|
|
|
|
|
|
|
|
|
|
|
| |
|
|
|
| |
|
Items that are or may be reclassified to profit or loss |
|
|
Items that will never be reclassified to profit or loss |
|
|
Total |
|
| |
|
Gain (loss) on
securities at
fair value
through other
comprehensive
income |
|
|
Gain (loss) on
valuation of
financial asset
measured at
FVTPL
(overlay
approach) |
|
|
Equity in
other
comprehensive
income
(loss) of
associates |
|
|
Foreign
currency
translation
adjustments
for foreign
operations |
|
|
Net gain
(loss)
from cash
flow
hedges |
|
|
Other
comprehen-
sive income
(loss) of
separate
account |
|
|
Remeasure
-ments of
the defined
benefit
plans |
|
|
Equity in
other
comprehensive
income
(expense) of
associates |
|
|
Gain (loss) on
securities at
fair value
through other
comprehensive
income |
|
|
Gain (loss) on
financial
Liabilities
measured at
FVTPL
attributable to
changes in
credit risk |
|
| Beginning balance |
|
W |
146,829 |
|
|
|
161,919 |
|
|
|
4,875 |
|
|
|
(377,061 |
) |
|
|
(48,171 |
) |
|
|
18,423 |
|
|
|
(385,780 |
) |
|
|
(26 |
) |
|
|
79,982 |
|
|
|
(5,171 |
) |
|
|
(404,181 |
) |
| Change due to fair value |
|
|
(1,110,290 |
) |
|
|
(31,924 |
) |
|
|
6,517 |
|
|
|
— |
|
|
|
— |
|
|
|
(56,484 |
) |
|
|
— |
|
|
|
(3 |
) |
|
|
21,408 |
|
|
|
(1,526 |
) |
|
|
(1,172,302 |
) |
| Reclassification: |
|
|
|
|
|
|
|
|
|
|
|
|
|
|
|
|
|
|
|
|
|
|
|
|
|
|
|
|
|
|
|
|
|
|
|
|
|
|
|
|
|
|
|
|
| Change due to impairment or disposal |
|
|
(114,399 |
) |
|
|
— |
|
|
|
— |
|
|
|
— |
|
|
|
— |
|
|
|
— |
|
|
|
— |
|
|
|
— |
|
|
|
— |
|
|
|
— |
|
|
|
(114,399 |
) |
| Effect of hedge accounting |
|
|
— |
|
|
|
— |
|
|
|
— |
|
|
|
— |
|
|
|
(209,869 |
) |
|
|
— |
|
|
|
— |
|
|
|
— |
|
|
|
— |
|
|
|
— |
|
|
|
(209,869 |
) |
| Hedging |
|
|
10,627 |
|
|
|
— |
|
|
|
— |
|
|
|
(74,525 |
) |
|
|
239,800 |
|
|
|
— |
|
|
|
— |
|
|
|
— |
|
|
|
— |
|
|
|
— |
|
|
|
175,902 |
|
| Effects from changes in foreign exchange rate |
|
|
— |
|
|
|
— |
|
|
|
— |
|
|
|
333,059 |
|
|
|
— |
|
|
|
— |
|
|
|
— |
|
|
|
— |
|
|
|
673 |
|
|
|
— |
|
|
|
333,732 |
|
| Remeasurements of the defined benefit plans |
|
|
— |
|
|
|
— |
|
|
|
— |
|
|
|
— |
|
|
|
— |
|
|
|
— |
|
|
|
59,441 |
|
|
|
— |
|
|
|
— |
|
|
|
— |
|
|
|
59,441 |
|
| Deferred income taxes |
|
|
334,391 |
|
|
|
11,826 |
|
|
|
(3,769 |
) |
|
|
(6,226 |
) |
|
|
(8,231 |
) |
|
|
15,211 |
|
|
|
(16,164 |
) |
|
|
1 |
|
|
|
(16,061 |
) |
|
|
(1,272 |
) |
|
|
309,706 |
|
| Transfer to other account |
|
|
— |
|
|
|
— |
|
|
|
— |
|
|
|
— |
|
|
|
— |
|
|
|
— |
|
|
|
— |
|
|
|
— |
|
|
|
29,421 |
|
|
|
6,153 |
|
|
|
35,574 |
|
Non-controlling interests |
|
|
2,547 |
|
|
|
— |
|
|
|
— |
|
|
|
(466 |
) |
|
|
— |
|
|
|
— |
|
|
|
(621 |
) |
|
|
— |
|
|
|
— |
|
|
|
— |
|
|
|
1,460 |
|
| |
|
|
|
|
|
|
|
|
|
|
|
|
|
|
|
|
|
|
|
|
|
|
|
|
|
|
|
|
|
|
|
|
|
|
|
|
|
|
|
|
|
|
|
|
| Ending balance |
|
W |
(730,295 |
) |
|
|
141,821 |
|
|
|
7,623 |
|
|
|
(125,219 |
) |
|
|
(26,471 |
) |
|
|
(22,850 |
) |
|
|
(343,124 |
) |
|
|
(28 |
) |
|
|
115,423 |
|
|
|
(1,816 |
) |
|
|
(984,936 |
) |
| |
|
|
|
|
|
|
|
|
|
|
|
|
|
|
|
|
|
|
|
|
|
|
|
|
|
|
|
|
|
|
|
|
|
|
|
|
|
|
|
|
|
|
|
|
SHINHAN FINANCIAL GROUP CO., LTD. AND SUBSIDIARIES
Notes to the Consolidated Financial Statements
(In millions of won)
|
|
|
|
|
|
|
|
|
|
|
|
|
|
|
|
|
|
|
|
|
|
|
|
|
|
|
|
|
|
|
|
|
|
|
|
|
|
|
|
|
|
|
|
|
| |
|
|
|
| |
|
Items that are or may be reclassified to profit or loss |
|
|
Items that will never be reclassified to profit or loss |
|
|
Total |
|
| |
|
Gain (loss) on
securities at
fair value
through other
comprehensive
income |
|
|
Gain (loss) on
valuation of
financial asset
measured at
FVTPL
(overlay
approach) |
|
|
Equity in
other
comprehensive
income
(loss) of
associates |
|
|
Foreign
currency
translation
adjustments
for foreign
operations |
|
|
Net gain
(loss)
from cash
flow
hedges |
|
|
Other
comprehen-
sive income
(loss) of
separate
account |
|
|
Remeasure
-ments of
the defined
benefit
plans |
|
|
Equity in
other
comprehensive
income
(expense) of
associates |
|
|
Gain (loss) on
securities at
fair value
through other
comprehensive
income |
|
|
Gain (loss) on
financial
Liabilities
measured at
FVTPL
attributable to
changes in
credit risk |
|
| Beginning balance |
|
W |
(730,295 |
) |
|
|
141,821 |
|
|
|
7,623 |
|
|
|
(125,219 |
) |
|
|
(26,471 |
) |
|
|
(22,850 |
) |
|
|
(343,124 |
) |
|
|
(28 |
) |
|
|
115,423 |
|
|
|
(1,816 |
) |
|
|
(984,936 |
) |
| Change due to fair value |
|
|
(3,340,230 |
) |
|
|
(299,934 |
) |
|
|
(16,914 |
) |
|
|
— |
|
|
|
— |
|
|
|
(153,594 |
) |
|
|
— |
|
|
|
9 |
|
|
|
19,610 |
|
|
|
(5,919 |
) |
|
|
(3,796,972 |
) |
| Reclassification: |
|
|
|
|
|
|
|
|
|
|
|
|
|
|
|
|
|
|
|
|
|
|
|
|
|
|
|
|
|
|
|
|
|
|
|
|
|
|
|
|
|
|
|
|
| Change due to impairment or disposal |
|
|
(37,142 |
) |
|
|
— |
|
|
|
(7,333 |
) |
|
|
— |
|
|
|
— |
|
|
|
— |
|
|
|
— |
|
|
|
— |
|
|
|
— |
|
|
|
— |
|
|
|
(44,475 |
) |
| Effect of hedge accounting |
|
|
— |
|
|
|
— |
|
|
|
— |
|
|
|
— |
|
|
|
(190,372 |
) |
|
|
— |
|
|
|
— |
|
|
|
— |
|
|
|
— |
|
|
|
— |
|
|
|
(190,372 |
) |
| Hedging |
|
|
63,480 |
|
|
|
— |
|
|
|
— |
|
|
|
(25,793 |
) |
|
|
90,328 |
|
|
|
— |
|
|
|
— |
|
|
|
— |
|
|
|
— |
|
|
|
— |
|
|
|
128,015 |
|
| Effects from changes in foreign exchange rate |
|
|
— |
|
|
|
— |
|
|
|
— |
|
|
|
40,679 |
|
|
|
— |
|
|
|
— |
|
|
|
— |
|
|
|
— |
|
|
|
(823 |
) |
|
|
— |
|
|
|
39,856 |
|
| Remeasurements of the defined benefit plans |
|
|
— |
|
|
|
— |
|
|
|
— |
|
|
|
— |
|
|
|
— |
|
|
|
— |
|
|
|
348,248 |
|
|
|
— |
|
|
|
— |
|
|
|
— |
|
|
|
348,248 |
|
| Deferred income taxes (*) |
|
|
866,180 |
|
|
|
79,837 |
|
|
|
8,489 |
|
|
|
(154 |
) |
|
|
29,550 |
|
|
|
40,387 |
|
|
|
(96,257 |
) |
|
|
(14 |
) |
|
|
(11,520 |
) |
|
|
1,170 |
|
|
|
917,668 |
|
| Transfer to other account |
|
|
— |
|
|
|
— |
|
|
|
— |
|
|
|
— |
|
|
|
— |
|
|
|
— |
|
|
|
— |
|
|
|
42 |
|
|
|
(2,134 |
) |
|
|
1,410 |
|
|
|
(682 |
) |
Non-controlling interests |
|
|
3,586 |
|
|
|
— |
|
|
|
— |
|
|
|
(1,796 |
) |
|
|
— |
|
|
|
— |
|
|
|
(860 |
) |
|
|
— |
|
|
|
— |
|
|
|
— |
|
|
|
930 |
|
| |
|
|
|
|
|
|
|
|
|
|
|
|
|
|
|
|
|
|
|
|
|
|
|
|
|
|
|
|
|
|
|
|
|
|
|
|
|
|
|
|
|
|
|
|
| Ending balance |
|
W |
(3,174,421 |
) |
|
|
(78,276 |
) |
|
|
(8,135 |
) |
|
|
(112,283 |
) |
|
|
(96,965 |
) |
|
|
(136,057 |
) |
|
|
(91,993 |
) |
|
|
9 |
|
|
|
120,556 |
|
|
|
(5,155 |
) |
|
|
(3,582,720 |
) |
| |
|
|
|
|
|
|
|
|
|
|
|
|
|
|
|
|
|
|
|
|
|
|
|
|
|
|
|
|
|
|
|
|
|
|
|
|
|
|
|
|
|
|
|
|
(*) |
The effect of the tax rate change due to the revision of the tax law at the end of 2022 was reflected. |
SHINHAN FINANCIAL GROUP CO., LTD. AND SUBSIDIARIES
Notes to the Consolidated Financial Statements
(In millions of won)
| |
(g) |
Appropriation of retained earnings |
The appropriation of retained earnings for the years ended December 31, 2021 and 2022 are as follows:
|
|
|
|
|
|
|
|
|
|
|
|
|
|
|
|
|
|
|
|
|
|
|
|
|
|
|
|
|
|
|
|
|
|
Date of appropriation: |
|
March 24, 2022 |
|
|
March 23, 2023 |
|
|
|
|
|
|
|
|
|
|
Unappropriated retained earnings: |
|
|
|
|
|
|
|
|
| Balance at beginning of year |
|
W |
5,355,358 |
|
|
|
5,461,771 |
|
| Retirement of treasury stock |
|
|
— |
|
|
|
(300,661 |
) |
| Dividend to hybrid bonds |
|
|
(116,388 |
) |
|
|
(156,277 |
) |
| Interim dividends |
|
|
(299,082 |
) |
|
|
(637,598 |
) |
| Net income |
|
|
1,413,956 |
|
|
|
1,249,251 |
|
| |
|
|
|
|
|
|
|
|
| |
|
|
6,353,844 |
|
|
|
5,616,486 |
|
Appropriation of retained earnings: |
|
|
|
|
|
|
|
|
| Legal reserve |
|
|
(141,396 |
) |
|
|
(124,925 |
) |
| Dividends |
|
|
|
|
|
|
|
|
| Dividends on common stocks paid |
|
|
(723,230 |
) |
|
|
(440,093 |
) |
| Dividends on preferred stocks paid |
|
|
(24,475 |
) |
|
|
(15,122 |
) |
| Regulatory reserve for loan losses |
|
|
(2,972 |
) |
|
|
(2,554 |
) |
| Loss on repayments of hybrid bonds |
|
|
— |
|
|
|
(317 |
) |
| |
|
|
|
|
|
|
|
|
| |
|
|
(892,073 |
) |
|
|
(583,011 |
) |
| |
|
|
|
|
|
|
|
|
Unappropriated retained earnings to be carried over to subsequent year |
|
W |
5,461,771 |
|
|
|
5,033,475 |
|
| |
|
|
|
|
|
|
|
|
| |
(*) |
These statements of appropriation of retained earnings are based on the separate financial statements of Shinhan Finance Group. |
| |
(h) |
Regulatory reserve for loan losses |
In accordance with Regulations for the Supervision of Financial Institutions, the Group reserves the difference between allowance for credit losses by IFRS and that as required by the Regulations at the account of regulatory reserve for loan losses in retained earnings.
i) Changes in regulatory reserve for loan losses including
non-controlling
interests as of December 31, 2021 and 2022 are as follows:
|
|
|
|
|
|
|
|
|
| |
|
|
|
|
|
|
| Beginning balance |
|
W |
3,329,899 |
|
|
|
3,699,315 |
|
| Planned regulatory provision (reversal) of loan losses |
|
|
369,416 |
|
|
|
(37,228 |
) |
| |
|
|
|
|
|
|
|
|
| Ending balance |
|
W |
3,699,315 |
|
|
|
3,662,087 |
|
| |
|
|
|
|
|
|
|
|
SHINHAN FINANCIAL GROUP CO., LTD. AND SUBSIDIARIES
Notes to the Consolidated Financial Statements
(In millions of won)
ii) Profit attributable to equity holders of Shinhan Financial Group and earnings per share after factoring in regulatory reserve for loan losses for the years ended December 31, 2021 and 2022 are as follows:
|
|
|
|
|
|
|
|
|
| |
|
|
|
|
|
|
| Profit attributable to equity holders of Shinhan Financial Group |
|
W |
4,019,254 |
|
|
|
4,642,292 |
|
| Provision for regulatory reserve for loan losses |
|
|
(364,882 |
) |
|
|
37,614 |
|
| |
|
|
|
|
|
|
|
|
| Profit attributable to equity holders of Shinhan Financial Group adjusted for regulatory reserve |
|
W |
3,654,372 |
|
|
|
4,679,906 |
|
| |
|
|
|
|
|
|
|
|
| Basic and diluted earnings per share adjusted for regulatory reserve in won (*) |
|
|
6,625 |
|
|
|
8,525 |
|
| |
(*) |
Dividends for hybrid bonds are deducted. |
The acquisitions of treasury stock for the years ended December 31, 2021 and 2022 are as follows:
|
|
|
|
|
|
|
|
|
|
|
|
|
|
|
|
|
|
|
|
|
|
|
|
|
|
The number of
share |
|
|
Carrying
value |
|
|
The number of
share |
|
|
Carrying
value |
|
|
|
|
|
|
|
|
|
|
|
|
|
|
|
|
|
|
|
|
|
|
|
|
|
|
|
|
|
|
|
|
|
|
|
| Beginning balance |
|
|
704,796 |
|
|
W |
28,215 |
|
|
|
6,352 |
|
|
W |
227 |
|
| Acquisition |
|
|
2,426 |
|
|
|
79 |
|
|
|
7,814,685 |
|
|
|
300,000 |
|
| Disposal |
|
|
(700,870 |
) |
|
|
(28,067 |
) |
|
|
— |
|
|
|
— |
|
| Retirement |
|
|
— |
|
|
|
— |
|
|
|
(7,814,685 |
) |
|
|
(300,000 |
) |
| |
|
|
|
|
|
|
|
|
|
|
|
|
|
|
|
|
| Ending balance |
|
|
6,352 |
|
|
W |
227 |
|
|
|
6,352 |
|
|
W |
227 |
|
| |
|
|
|
|
|
|
|
|
|
|
|
|
|
|
|
|
| |
(*) |
The controlling company has acquired treasury stocks for retirement for the years ended December 31, 2022 and completed retirement of treasury stocks by retained earnings on April 25 (3,665,423 shares) and November 23, 2022 (4,149,262 shares). |
SHINHAN FINANCIAL GROUP CO., LTD. AND SUBSIDIARIES
Notes to the Consolidated Financial Statements
(In millions of won)
| |
(a) |
For the year ended December 31, 2022, the interim dividends paid are as follows: |
|
|
|
|
|
|
|
|
|
|
|
March 31, 2022 (1 st Quarter) |
|
Common stock ( W 400 per share) |
|
W |
206,277 |
|
| |
|
Convertible preferred stock ( W 400 per share) |
|
|
6,993 |
|
| |
|
|
|
|
|
|
| |
|
|
|
W |
213,270 |
|
| |
|
|
|
|
|
|
| |
|
|
June 30, 2022 (2 nd Quarter) |
|
Common stock ( W 400 per share) |
|
W |
205,171 |
|
| |
|
Convertible preferred stock ( W 400 per share) |
|
|
6,993 |
|
| |
|
|
|
|
|
|
| |
|
|
|
W |
212,164 |
|
| |
|
|
|
|
|
|
| |
|
|
September 30, 2022 (3 rd Quarter) |
|
Common stock ( W 400 per share) |
|
W |
205,171 |
|
| |
|
Convertible preferred stock ( W 400 per share) |
|
|
6,993 |
|
| |
|
|
|
|
|
|
| |
|
|
|
W |
212,164 |
|
| |
|
|
|
|
|
|
| |
|
|
|
W |
637,598 |
|
| |
|
|
|
|
|
|
| |
(b) |
Details of dividends recognized as distributions to stockholders for the years ended December 31, 2021 and 2022 are as follows: |
|
|
|
|
|
|
|
|
|
|
|
|
|
|
|
|
|
|
|
|
|
|
|
|
|
| |
|
|
|
|
|
|
|
|
| Total number of shares issued and outstanding |
|
|
516,599,554 |
|
|
|
508,784,869 |
|
| Par value per share in won |
|
|
5,000 |
|
|
|
5,000 |
|
| Dividend per share in won |
|
|
1,400 |
|
|
|
865 |
|
| Dividends (*2) |
|
W |
723,230 |
|
|
|
440,093 |
|
| |
|
|
|
|
|
|
|
|
| Dividend rate per share |
|
|
28.0 |
% |
|
|
17.3 |
|
| |
|
|
|
|
|
|
|
|
| |
|
|
|
|
|
|
|
|
| Total number of shares issued and outstanding |
|
|
17,482,000 |
|
|
|
17,482,000 |
|
| Par value per share in won |
|
|
5,000 |
|
|
|
5,000 |
|
| Dividend per share in won |
|
|
1,400 |
|
|
|
865 |
|
| Dividends |
|
W |
24,475 |
|
|
|
15,122 |
|
| |
|
|
|
|
|
|
|
|
| Dividend rate per share |
|
|
28.0 |
% |
|
|
17.3 |
|
| |
|
|
|
|
|
|
|
|
| |
(*1) |
The current dividend(plan) was decided on March 23, 2023. The amount of dividends was not recognized as a distribution to the owner during the period. |
| |
(*2) |
Dividends on own shares held by the Group are excluded. |
SHINHAN FINANCIAL GROUP CO., LTD. AND SUBSIDIARIES
Notes to the Consolidated Financial Statements
(In millions of won)
| |
(c) |
The details of dividends paid by the Group related to the preferred stock issued for the years ended December 31, 2021 and 2022 are as follows: |
|
|
|
|
|
|
|
|
|
|
|
|
|
|
|
|
|
|
|
|
|
| |
|
|
|
| |
|
|
|
|
|
|
|
|
|
|
|
|
|
Dividend rate
per issue
price (%) |
|
Convertible preferred stock |
|
|
17,482,000 |
|
|
|
1,960 |
|
|
|
34,265 |
|
|
|
42,900 |
|
|
|
4.57 |
|
|
|
|
|
|
|
|
|
|
|
|
|
|
|
|
|
|
|
|
|
|
| |
|
|
|
| |
|
|
|
|
|
|
|
|
|
|
|
|
|
Dividend rate
per issue
price (%) |
|
Convertible preferred stock |
|
|
17,482,000 |
|
|
|
2,065 |
|
|
|
36,101 |
|
|
|
42,900 |
|
|
|
4.81 |
|
| |
(d) |
Dividends for hybrid bond is calculated as follows for the years ended December 31, 2021 and 2022: |
|
|
|
|
|
|
|
|
|
|
|
|
|
|
|
|
|
|
|
|
|
|
|
|
|
|
|
|
|
|
|
|
|
|
Amount of hybrid bond |
|
W |
3,347,700 |
|
|
|
4,212,700 |
|
Interest rate |
|
|
2.88 ~ 5.88 |
% |
|
|
2.88 ~ 5.88 |
|
| |
|
|
|
|
|
|
|
|
Dividends |
|
W |
116,388 |
|
|
|
156,277 |
|
| |
|
|
|
|
|
|
|
|
Net interest income for the years ended December 31, 2020, 2021 and 2022 are as follows:
|
|
|
|
|
|
|
|
|
|
|
|
|
| |
|
|
|
|
|
|
|
|
|
Interest income: |
|
|
|
|
|
|
|
|
|
|
|
|
Cash and due from banks at amortized cost |
|
W |
128,023 |
|
|
|
85,846 |
|
|
|
272,407 |
|
Deposits at FVTPL |
|
|
13,888 |
|
|
|
1,298 |
|
|
|
1,329 |
|
Securities at FVTPL |
|
|
742,958 |
|
|
|
659,927 |
|
|
|
870,441 |
|
Securities at FVOCI |
|
|
957,817 |
|
|
|
896,027 |
|
|
|
1,209,153 |
|
Securities at amortized cost |
|
|
1,076,849 |
|
|
|
1,091,974 |
|
|
|
1,275,368 |
|
Loans at amortized cost |
|
|
11,697,775 |
|
|
|
11,889,767 |
|
|
|
16,316,497 |
|
Loans at FVTPL |
|
|
73,991 |
|
|
|
35,587 |
|
|
|
69,146 |
|
Others |
|
|
82,695 |
|
|
|
63,804 |
|
|
|
94,325 |
|
| |
|
|
|
|
|
|
|
|
|
|
|
|
| |
|
|
14,773,996 |
|
|
|
14,724,230 |
|
|
|
20,108,666 |
|
| |
|
|
|
|
|
|
|
|
|
|
|
|
Interest expense: |
|
|
|
|
|
|
|
|
|
|
|
|
Deposits |
|
|
(2,842,625 |
) |
|
|
(2,173,804 |
) |
|
|
(4,642,670 |
) |
Financial liabilities designated at FVTPL |
|
|
— |
|
|
|
— |
|
|
|
(1,296 |
) |
Borrowings |
|
|
(426,607 |
) |
|
|
(330,548 |
) |
|
|
(938,641 |
) |
Debt securities issued |
|
|
(1,554,544 |
) |
|
|
(1,390,230 |
) |
|
|
(1,901,458 |
) |
Others |
|
|
(67,520 |
) |
|
|
(60,323 |
) |
|
|
(160,920 |
) |
| |
|
|
|
|
|
|
|
|
|
|
|
|
| |
|
|
(4,891,296 |
) |
|
|
(3,954,905 |
) |
|
|
(7,644,985 |
) |
| |
|
|
|
|
|
|
|
|
|
|
|
|
Net interest income |
|
W |
9,882,700 |
|
|
|
10,769,325 |
|
|
|
12,463,681 |
|
| |
|
|
|
|
|
|
|
|
|
|
|
|
SHINHAN FINANCIAL GROUP CO., LTD. AND SUBSIDIARIES
Notes to the Consolidated Financial Statements
(In millions of won)
|
Net fees and commission income |
Net fees and commission income for the years ended December 31, 2020, 2021 and 2022 are as follows:
|
|
|
|
|
|
|
|
|
|
|
|
|
| |
|
|
|
|
|
|
|
|
|
Fees and commission income: |
|
|
|
|
|
|
|
|
|
|
|
|
Credit placement fees |
|
W |
94,836 |
|
|
|
71,480 |
|
|
|
68,002 |
|
Commission received as electronic charge receipt |
|
|
143,449 |
|
|
|
148,626 |
|
|
|
147,727 |
|
Brokerage fees |
|
|
546,236 |
|
|
|
577,238 |
|
|
|
341,634 |
|
Commission received as agency |
|
|
145,162 |
|
|
|
146,662 |
|
|
|
136,114 |
|
Investment banking fees |
|
|
161,439 |
|
|
|
188,644 |
|
|
|
232,512 |
|
Commission received in foreign exchange activities |
|
|
239,467 |
|
|
|
271,808 |
|
|
|
295,161 |
|
Trust management fees |
|
|
255,043 |
|
|
|
310,376 |
|
|
|
308,353 |
|
Credit card fees |
|
|
1,170,078 |
|
|
|
1,175,084 |
|
|
|
1,202,129 |
|
Operating lease fees (*) |
|
|
245,173 |
|
|
|
365,447 |
|
|
|
478,374 |
|
Others |
|
|
813,591 |
|
|
|
884,520 |
|
|
|
900,570 |
|
| |
|
|
|
|
|
|
|
|
|
|
|
|
| |
|
|
3,814,474 |
|
|
|
4,139,885 |
|
|
|
4,110,576 |
|
| |
|
|
|
|
|
|
|
|
|
|
|
|
Fees and commission expense: |
|
|
|
|
|
|
|
|
|
|
|
|
Credit-related fee |
|
|
(46,456 |
) |
|
|
(38,668 |
) |
|
|
(37,331 |
) |
Credit card fees |
|
|
(849,256 |
) |
|
|
(836,990 |
) |
|
|
(895,787 |
) |
Others |
|
|
(535,829 |
) |
|
|
(589,230 |
) |
|
|
(651,892 |
) |
| |
|
|
|
|
|
|
|
|
|
|
|
|
| |
|
|
(1,431,541 |
) |
|
|
(1,464,888 |
) |
|
|
(1,585,010 |
) |
| |
|
|
|
|
|
|
|
|
|
|
|
|
Net fees and commission income |
|
W |
2,382,933 |
|
|
|
2,674,997 |
|
|
|
2,525,566 |
|
| |
|
|
|
|
|
|
|
|
|
|
|
|
| |
(*) |
Among operating lease fees recognized for the years ended December 31, 2020, 2021 and 2022, there is no variable lease fee income which does not vary by index or rate. |
Dividend income for the years ended December 31, 2020, 2021 and 2022 are as follows:
|
|
|
|
|
|
|
|
|
|
|
|
|
| |
|
|
|
|
|
|
|
|
|
Securities at FVTPL |
|
W |
76,453 |
|
|
|
100,315 |
|
|
|
115,533 |
|
Securities at FVOCI |
|
|
21,503 |
|
|
|
24,216 |
|
|
|
26,996 |
|
| |
|
|
|
|
|
|
|
|
|
|
|
|
| |
|
W |
97,956 |
|
|
|
124,531 |
|
|
|
142,529 |
|
| |
|
|
|
|
|
|
|
|
|
|
|
|
SHINHAN FINANCIAL GROUP CO., LTD. AND SUBSIDIARIES
Notes to the Consolidated Financial Statements
(In millions of won)
|
Net gain (loss) on financial instruments measured at fair value through profit or loss |
Net gain(loss) on financial instruments measured at fair value through profit or loss for the ended December 31, 2020 2021 and 2022 are as follows:
|
|
|
|
|
|
|
|
|
|
|
|
|
| |
|
|
|
|
|
|
|
|
|
Net gain (loss) on due from banks measured at FVTPL |
|
|
|
|
|
|
|
|
|
|
|
|
Gain (loss) on valuation |
|
W |
1,267 |
|
|
|
(296 |
) |
|
|
(10,600 |
) |
Gain (loss) on sale |
|
|
28,461 |
|
|
|
(1,479 |
) |
|
|
— |
|
| |
|
|
|
|
|
|
|
|
|
|
|
|
| |
|
|
29,728 |
|
|
|
(1,775 |
) |
|
|
(10,600 |
) |
| |
|
|
|
|
|
|
|
|
|
|
|
|
Net gain (loss) on loans measured at FVTPL Loss on valuation |
|
|
(204,702 |
) |
|
|
(78,416 |
) |
|
|
(35,652 |
) |
Gain on sale |
|
|
17,516 |
|
|
|
15,312 |
|
|
|
14,063 |
|
| |
|
|
|
|
|
|
|
|
|
|
|
|
| |
|
|
(187,186 |
) |
|
|
(63,104 |
) |
|
|
(21,589 |
) |
| |
|
|
|
|
|
|
|
|
|
|
|
|
Net gain (loss) on securities measured at FVTPL |
|
|
|
|
|
|
|
|
|
|
|
|
Debt securities |
|
|
|
|
|
|
|
|
|
|
|
|
Gain (loss) on valuation |
|
|
41,208 |
|
|
|
97,281 |
|
|
|
(432,967 |
) |
Gain (loss) on sale |
|
|
72,338 |
|
|
|
(92,230 |
) |
|
|
(86,011 |
) |
Other gains |
|
|
331,837 |
|
|
|
506,980 |
|
|
|
573,600 |
|
| |
|
|
|
|
|
|
|
|
|
|
|
|
| |
|
|
445,383 |
|
|
|
512,031 |
|
|
|
54,622 |
|
| |
|
|
|
|
|
|
|
|
|
|
|
|
Equity securities |
|
|
|
|
|
|
|
|
|
|
|
|
Gain (loss) on valuation |
|
|
134,922 |
|
|
|
180,363 |
|
|
|
(67,022 |
) |
Gain (loss) on sale |
|
|
283,265 |
|
|
|
199,702 |
|
|
|
(124,557 |
) |
| |
|
|
|
|
|
|
|
|
|
|
|
|
| |
|
|
418,187 |
|
|
|
380,065 |
|
|
|
(191,579 |
) |
| |
|
|
|
|
|
|
|
|
|
|
|
|
Other |
|
|
|
|
|
|
|
|
|
|
|
|
Gain on valuation |
|
|
22,690 |
|
|
|
9,316 |
|
|
|
2,089 |
|
| |
|
|
|
|
|
|
|
|
|
|
|
|
| |
|
|
886,260 |
|
|
|
901,412 |
|
|
|
(134,868 |
) |
| |
|
|
|
|
|
|
|
|
|
|
|
|
Net gain (loss) on financial liabilities measured at FVTPL |
|
|
|
|
|
|
|
|
|
|
|
|
Debt securities |
|
|
|
|
|
|
|
|
|
|
|
|
Gain (loss) on valuation |
|
|
(48,261 |
) |
|
|
(7,745 |
) |
|
|
41,317 |
|
Gain (loss) on disposal |
|
|
82,724 |
|
|
|
(67,522 |
) |
|
|
53,067 |
|
| |
|
|
|
|
|
|
|
|
|
|
|
|
| |
|
|
34,463 |
|
|
|
(75,267 |
) |
|
|
94,384 |
|
| |
|
|
|
|
|
|
|
|
|
|
|
|
Other |
|
|
|
|
|
|
|
|
|
|
|
|
Loss on valuation |
|
|
(83,316 |
) |
|
|
(26,224 |
) |
|
|
(38,997 |
) |
Gain on disposal |
|
|
8,313 |
|
|
|
3,489 |
|
|
|
2,724 |
|
| |
|
|
|
|
|
|
|
|
|
|
|
|
| |
|
|
(75,003 |
) |
|
|
(22,735 |
) |
|
|
(36,273 |
) |
| |
|
|
|
|
|
|
|
|
|
|
|
|
| |
|
|
(40,540 |
) |
|
|
(98,002 |
) |
|
|
58,111 |
|
| |
|
|
|
|
|
|
|
|
|
|
|
|
Derivatives: |
|
|
|
|
|
|
|
|
|
|
|
|
Gain (loss) on valuation |
|
|
245,681 |
|
|
|
(64,128 |
) |
|
|
(719,766 |
) |
Gain (loss) on transaction |
|
|
(661,113 |
) |
|
|
429,228 |
|
|
|
524,599 |
|
| |
|
|
|
|
|
|
|
|
|
|
|
|
| |
|
|
(415,432 |
) |
|
|
365,100 |
|
|
|
(195,167 |
) |
| |
|
|
|
|
|
|
|
|
|
|
|
|
| |
|
W |
272,830 |
|
|
|
1,103,631 |
|
|
|
(304,113 |
) |
| |
|
|
|
|
|
|
|
|
|
|
|
|
SHINHAN FINANCIAL GROUP CO., LTD. AND SUBSIDIARIES
Notes to the Consolidated Financial Statements
(In millions of won)
|
Net gain (loss) on financial instruments designated at fair value through profit or loss |
Net gain (loss) on financial instruments designated at fair value through profit or loss for the years ended December 31, 2020, 2021 and 2022 are as follows:
|
|
|
|
|
|
|
|
|
|
|
|
|
| |
|
|
|
|
|
|
|
|
|
Financial liabilities designated at fair value through profit or loss: |
|
|
|
|
|
|
|
|
|
|
|
|
Debt securities issued: |
|
|
|
|
|
|
|
|
|
|
|
|
Gain on valuation |
|
W |
— |
|
|
|
— |
|
|
|
2,673 |
|
Compound financial instruments : |
|
|
|
|
|
|
|
|
|
|
|
|
Gain on valuation |
|
|
241,066 |
|
|
|
423,914 |
|
|
|
804,068 |
|
Loss on sale and redemption |
|
|
(42,827 |
) |
|
|
(512,215 |
) |
|
|
(229,799 |
) |
| |
|
|
|
|
|
|
|
|
|
|
|
|
| |
|
|
198,239 |
|
|
|
(88,301 |
) |
|
|
574,269 |
|
| |
|
|
|
|
|
|
|
|
|
|
|
|
| |
|
W |
198,239 |
|
|
|
(88,301 |
) |
|
|
576,942 |
|
| |
|
|
|
|
|
|
|
|
|
|
|
|
|
Reversal of (provision for) credit loss allowance |
Reversal of (provision for) credit loss allowance on financial assets for the years ended December 31, 2020, 2021 and 2022 are as follows:
|
|
|
|
|
|
|
|
|
|
|
|
|
| |
|
|
|
|
|
|
|
|
|
Allowance provided: |
|
|
|
|
|
|
|
|
|
|
|
|
Loans at amortized cost |
|
W |
(1,290,695 |
) |
|
|
(907,070 |
) |
|
|
(1,244,424 |
) |
Other financial assets at amortized cost |
|
|
(33,785 |
) |
|
|
(52,162 |
) |
|
|
(32,779 |
) |
Securities at fair value through other comprehensive income |
|
|
(3,829 |
) |
|
|
(19,697 |
) |
|
|
— |
|
Unused credit line and financial guarantee |
|
|
(52,795 |
) |
|
|
— |
|
|
|
(19,132 |
) |
Securities at amortized cost |
|
|
(1,075 |
) |
|
|
(5,305 |
) |
|
|
— |
|
| |
|
|
|
|
|
|
|
|
|
|
|
|
| |
|
|
(1,382,179 |
) |
|
|
(984,234 |
) |
|
|
(1,296,335 |
) |
| |
|
|
|
|
|
|
|
|
|
|
|
|
Allowance reversed: |
|
|
|
|
|
|
|
|
|
|
|
|
Securities at fair value through other comprehensive income |
|
W |
— |
|
|
|
— |
|
|
|
3,748 |
|
Securities at amortized cost |
|
|
— |
|
|
|
— |
|
|
|
291 |
|
Unused credit commitment and financial guarantee |
|
|
— |
|
|
|
9,549 |
|
|
|
— |
|
|
|
|
|
|
|
|
|
|
|
|
|
|
|
|
|
— |
|
|
|
9,549 |
|
|
|
4,039 |
|
| |
|
|
|
|
|
|
|
|
|
|
|
|
| |
|
W |
(1,382,179 |
) |
|
|
(974,685 |
) |
|
|
(1,292,296 |
) |
| |
|
|
|
|
|
|
|
|
|
|
|
|
SHINHAN FINANCIAL GROUP CO., LTD. AND SUBSIDIARIES
Notes to the Consolidated Financial Statements
(In millions of won)
|
General and administrative expenses |
General and administrative expenses for the years ended December 31, 2020, 2021 and 2022 are as follows:
|
|
|
|
|
|
|
|
|
|
|
|
|
|
|
|
|
|
|
|
|
|
|
|
|
|
|
|
|
|
|
|
|
|
|
|
Employee benefits: |
|
|
|
|
|
|
|
|
|
|
|
|
Salaries |
|
W |
3,034,543 |
|
|
|
3,283,436 |
|
|
|
3,423,186 |
|
Severance benefits: |
|
|
|
|
|
|
|
|
|
|
|
|
Defined contribution |
|
|
36,660 |
|
|
|
38,577 |
|
|
|
38,902 |
|
Defined benefit |
|
|
184,753 |
|
|
|
192,614 |
|
|
|
169,882 |
|
Termination benefits |
|
|
94,723 |
|
|
|
268,089 |
|
|
|
154,012 |
|
| |
|
|
|
|
|
|
|
|
|
|
|
|
| |
|
|
3,350,679 |
|
|
|
3,782,716 |
|
|
|
3,785,982 |
|
| |
|
|
|
|
|
|
|
|
|
|
|
|
Entertainment |
|
|
34,963 |
|
|
|
38,552 |
|
|
|
46,359 |
|
Depreciation |
|
|
475,506 |
|
|
|
490,457 |
|
|
|
516,164 |
|
Amortization |
|
|
129,976 |
|
|
|
155,202 |
|
|
|
186,448 |
|
Taxes and utility bills |
|
|
197,996 |
|
|
|
187,432 |
|
|
|
226,197 |
|
Advertising |
|
|
204,308 |
|
|
|
280,780 |
|
|
|
339,955 |
|
Research |
|
|
20,271 |
|
|
|
25,320 |
|
|
|
29,289 |
|
Others |
|
|
798,774 |
|
|
|
782,629 |
|
|
|
883,120 |
|
| |
|
|
|
|
|
|
|
|
|
|
|
|
| |
|
W |
5,212,473 |
|
|
|
5,743,088 |
|
|
|
6,013,514 |
|
| |
|
|
|
|
|
|
|
|
|
|
|
|
| |
(a) |
Performance shares granted as of December 31, 2022 are as follows: |
|
|
|
|
|
|
|
|
|
|
Type |
|
Cash-settled share-based payment |
Performance conditions |
|
Relative stock price linked (20.0%), management index (80.0%) |
Exercising period |
|
4 years from the commencement date of the year to which the grant date belongs |
Estimated number of shares vested at December 31, 2022 |
|
743,160 |
|
2,182,644 |
Fair value per share in Korean won (*) |
|
W 44,222, W 33,122,
W 37,387 and
W 37,081 for the
expiration of
exercising period
from 2019 to 2022 |
|
W 35,200 |
| |
(*) |
Based on performance-based stock compensation, the reference stock price (the arithmetic average of the weighted average share price of transaction volume for the past two month, the previous one month, and the past one week) of four years after the commencement of the grant year is paid in cash, and the fair value of the reference stock to be paid in the future is assessed as the closing price of the settlement. |
SHINHAN FINANCIAL GROUP CO., LTD. AND SUBSIDIARIES
Notes to the Consolidated Financial Statements
(In millions of won)
|
Share-based payments (continued) |
| |
(b) |
Share-based compensation costs for the years ended December 31, 2020, 2021 and 2022 are as follows: |
|
|
|
|
|
|
|
|
|
|
|
|
|
|
|
|
|
|
|
|
|
|
|
|
|
|
|
|
|
|
|
|
|
|
|
|
|
|
|
|
|
|
|
|
|
|
|
Stock options granted: |
|
|
|
|
|
|
|
|
|
|
|
|
|
|
W |
(1 |
) |
|
|
(4 |
) |
|
|
(5 |
) |
|
|
|
(18 |
) |
|
|
(26 |
) |
|
|
(44 |
) |
Performance shares |
|
|
(257 |
) |
|
|
(3,902 |
) |
|
|
(4,159 |
) |
| |
|
|
|
|
|
|
|
|
|
|
|
|
| |
|
W |
(276 |
) |
|
|
(3,932 |
) |
|
|
(4,208 |
) |
| |
|
|
|
|
|
|
|
|
|
|
|
|
|
|
|
|
|
|
|
|
|
|
|
|
|
|
|
|
|
|
|
|
|
|
|
|
|
|
|
|
|
|
|
|
|
|
|
|
|
|
|
|
|
|
|
|
|
|
|
Stock options granted: |
|
|
|
|
|
|
|
|
|
|
|
|
|
|
W |
(1 |
) |
|
|
(1 |
) |
|
|
(2 |
) |
Performance shares |
|
|
4,286 |
|
|
|
32,899 |
|
|
|
37,185 |
|
| |
|
|
|
|
|
|
|
|
|
|
|
|
| |
|
W |
4,285 |
|
|
|
32,898 |
|
|
|
37,183 |
|
| |
|
|
|
|
|
|
|
|
|
|
|
|
|
|
|
|
|
|
|
|
|
|
|
|
|
|
|
|
|
|
|
|
|
|
|
|
|
|
|
|
|
|
|
|
|
|
|
|
|
|
|
|
|
|
|
|
|
|
|
Stock options granted: |
|
|
|
|
|
|
|
|
|
|
|
|
|
|
W |
— |
|
|
|
— |
|
|
|
— |
|
Performance shares |
|
|
3,159 |
|
|
|
25,092 |
|
|
|
28,251 |
|
| |
|
|
|
|
|
|
|
|
|
|
|
|
| |
|
W |
3,159 |
|
|
|
25,092 |
|
|
|
28,251 |
|
| |
|
|
|
|
|
|
|
|
|
|
|
|
| |
(*) |
As of December 31, 2021, all stock options have expired. |
| |
(c) |
Accrued expenses and the intrinsic value as of December 31, 2020, 2021 and 2022 are as follows: |
|
|
|
|
|
|
|
|
|
|
|
|
|
|
|
|
|
|
|
|
|
|
|
|
|
|
|
|
|
|
|
|
|
|
|
|
|
|
|
|
|
|
|
|
|
|
|
Stock options granted: |
|
|
|
|
|
|
|
|
|
|
|
|
|
|
W |
1 |
|
|
|
1 |
|
|
|
2 |
|
Performance shares |
|
|
7,201 |
|
|
|
60,241 |
|
|
|
67,442 |
|
| |
|
|
|
|
|
|
|
|
|
|
|
|
| |
|
W |
7,202 |
|
|
|
60,242 |
|
|
|
67,444 |
|
| |
|
|
|
|
|
|
|
|
|
|
|
|
| |
(*) |
The intrinsic value of share-based payments is W 67,442 million as of December 31, 2020. For the calculation, the quoted market price of W 32,050 per share is used for stock options and the fair value is considered as intrinsic value for performance shares, respectively. |
SHINHAN FINANCIAL GROUP CO., LTD. AND SUBSIDIARIES
Notes to the Consolidated Financial Statements
(In millions of won)
|
Share-based payments (continued) |
|
|
|
|
|
|
|
|
|
|
|
|
|
|
|
|
|
|
|
|
|
|
|
|
|
|
|
|
|
|
|
|
|
|
Performance shares |
|
W |
10,598 |
|
|
|
82,498 |
|
|
|
93,096 |
|
|
(*) |
As of December 31, 2021, all stock options have expired. |
|
|
|
|
|
|
|
|
|
|
|
|
|
|
|
|
|
|
|
|
|
|
|
|
|
|
|
|
|
|
|
|
|
|
Performance shares |
|
W |
12,746 |
|
|
|
91,469 |
|
|
|
104,215 |
|
|
Net other operating expense |
Other operating income and other operating expense for the years ended December 31, 2020, 2021 and 2022 are as follows:
|
|
|
|
|
|
|
|
|
|
|
|
|
|
|
|
|
|
|
|
|
|
|
|
|
|
|
|
|
|
|
|
|
|
|
|
Gain on disposal of assets: |
|
|
|
|
|
|
|
|
|
|
|
|
Loans at amortized cost |
|
W |
21,348 |
|
|
|
18,843 |
|
|
|
33,147 |
|
Others: |
|
|
|
|
|
|
|
|
|
|
|
|
Gain on hedged items |
|
|
536,768 |
|
|
|
501,676 |
|
|
|
1,122,823 |
|
Reversal of allowance for guarantees and acceptances |
|
|
2,709 |
|
|
|
— |
|
|
|
410 |
|
Gain on other trust accounts |
|
|
— |
|
|
|
44,238 |
|
|
|
142 |
|
Reversal of other allowance |
|
|
850 |
|
|
|
8,886 |
|
|
|
13,348 |
|
Others |
|
|
164,999 |
|
|
|
356,611 |
|
|
|
448,640 |
|
| |
|
|
|
|
|
|
|
|
|
|
|
|
| |
|
|
705,326 |
|
|
|
911,411 |
|
|
|
1,585,363 |
|
| |
|
|
|
|
|
|
|
|
|
|
|
|
| |
|
|
726,674 |
|
|
|
930,254 |
|
|
|
1,618,510 |
|
| |
|
|
|
|
|
|
|
|
|
|
|
|
|
|
|
|
|
|
|
|
|
|
|
|
|
Loss on disposal of assets: |
|
|
|
|
|
|
|
|
|
|
|
|
Loans at amortized cost |
|
|
(18,675 |
) |
|
|
(347 |
) |
|
|
(5,533 |
) |
Others: |
|
|
|
|
|
|
|
|
|
|
|
|
Loss on hedged items |
|
|
(605,808 |
) |
|
|
(518,891 |
) |
|
|
(1,089,220 |
) |
Fund contribution |
|
|
(367,993 |
) |
|
|
(397,884 |
) |
|
|
(440,715 |
) |
Provision for guarantees and acceptances |
|
|
— |
|
|
|
(3,457 |
) |
|
|
— |
|
Provision for other debt allowances |
|
|
(16,862 |
) |
|
|
(52,123 |
) |
|
|
(22,721 |
) |
Depreciation of operating lease assets |
|
|
(163,006 |
) |
|
|
(257,033 |
) |
|
|
(351,208 |
) |
Others |
|
|
(924,796 |
) |
|
|
(1,190,546 |
) |
|
|
(1,458,617 |
) |
| |
|
|
|
|
|
|
|
|
|
|
|
|
| |
|
|
(2,078,465 |
) |
|
|
(2,419,934 |
) |
|
|
(3,362,481 |
) |
| |
|
|
|
|
|
|
|
|
|
|
|
|
| |
|
|
(2,097,140 |
) |
|
|
(2,420,281 |
) |
|
|
(3,368,014 |
) |
| |
|
|
|
|
|
|
|
|
|
|
|
|
Net other operating expenses |
|
W |
(1,370,466 |
) |
|
|
(1,490,027 |
) |
|
|
(1,749,504 |
) |
| |
|
|
|
|
|
|
|
|
|
|
|
|
SHINHAN FINANCIAL GROUP CO., LTD. AND SUBSIDIARIES
Notes to the Consolidated Financial Statements
(In millions of won)
|
Net other non-operating income |
Other
non-operating
income and other
non-operating
expense for the years ended December 31, 2020, 2021 and 2022 are as follows:
|
|
|
|
|
|
|
|
|
|
|
|
|
| |
|
|
|
|
|
|
|
|
|
Other non-operating income |
|
|
|
|
|
|
|
|
|
|
|
|
Gain on disposal of assets: |
|
|
|
|
|
|
|
|
|
|
|
|
Property and equipment (*1) |
|
W |
64,427 |
|
|
|
1,836 |
|
|
|
67,411 |
|
Investment property (*1) |
|
|
20,701 |
|
|
|
108 |
|
|
|
29,305 |
|
Assets held for sale (*2) |
|
|
1,147 |
|
|
|
16,976 |
|
|
|
448,770 |
|
Lease assets |
|
|
2,712 |
|
|
|
247 |
|
|
|
36 |
|
|
|
|
3,415 |
|
|
|
2,986 |
|
|
|
4,131 |
|
Others |
|
|
24 |
|
|
|
— |
|
|
|
— |
|
| |
|
|
|
|
|
|
|
|
|
|
|
|
| |
|
|
92,426 |
|
|
|
22,153 |
|
|
|
549,653 |
|
| |
|
|
|
|
|
|
|
|
|
|
|
|
Investments in associates: |
|
|
|
|
|
|
|
|
|
|
|
|
Gain on disposal |
|
|
11,325 |
|
|
|
39,593 |
|
|
|
8,965 |
|
Reversal of impairment loss |
|
|
— |
|
|
|
— |
|
|
|
5,924 |
|
| |
|
|
|
|
|
|
|
|
|
|
|
|
| |
|
|
11,325 |
|
|
|
39,593 |
|
|
|
14,889 |
|
| |
|
|
|
|
|
|
|
|
|
|
|
|
Others: |
|
|
|
|
|
|
|
|
|
|
|
|
Rental income on investment property |
|
|
23,890 |
|
|
|
35,887 |
|
|
|
33,366 |
|
Reversal of impairment losses on intangible asset |
|
|
119 |
|
|
|
372 |
|
|
|
396 |
|
Gain from assets contributed |
|
|
4 |
|
|
|
20 |
|
|
|
4 |
|
Gain from bargain purchase |
|
|
— |
|
|
|
— |
|
|
|
12,349 |
|
Others |
|
|
66,268 |
|
|
|
64,272 |
|
|
|
75,504 |
|
| |
|
|
|
|
|
|
|
|
|
|
|
|
| |
|
|
90,281 |
|
|
|
100,551 |
|
|
|
121,619 |
|
| |
|
|
|
|
|
|
|
|
|
|
|
|
| |
|
|
194,032 |
|
|
|
162,297 |
|
|
|
686,161 |
|
| |
|
|
|
|
|
|
|
|
|
|
|
|
Other non-operating expense |
|
|
|
|
|
|
|
|
|
|
|
|
Loss on disposal of assets: |
|
|
|
|
|
|
|
|
|
|
|
|
Property and equipment (*1) |
|
|
(5,884 |
) |
|
|
(2,027 |
) |
|
|
(2,546 |
) |
Investment property |
|
|
— |
|
|
|
(2,111 |
) |
|
|
— |
|
Lease assets |
|
|
(5,538 |
) |
|
|
— |
|
|
|
(9 |
) |
|
|
|
(1,195 |
) |
|
|
(2,920 |
) |
|
|
(737 |
) |
Others |
|
|
(64 |
) |
|
|
(1,186 |
) |
|
|
(183 |
) |
| |
|
|
|
|
|
|
|
|
|
|
|
|
| |
|
|
(12,681 |
) |
|
|
(8,244 |
) |
|
|
(3,475 |
) |
| |
|
|
|
|
|
|
|
|
|
|
|
|
Investments in associates: |
|
|
|
|
|
|
|
|
|
|
|
|
Loss on disposal |
|
|
(5,754 |
) |
|
|
(11,002 |
) |
|
|
(19,045 |
) |
Impairment loss |
|
|
(9,407 |
) |
|
|
(10,719 |
) |
|
|
(7,529 |
) |
| |
|
|
|
|
|
|
|
|
|
|
|
|
| |
|
|
(15,161 |
) |
|
|
(21,721 |
) |
|
|
(26,574 |
) |
| |
|
|
|
|
|
|
|
|
|
|
|
|
Others: |
|
|
|
|
|
|
|
|
|
|
|
|
Donations |
|
|
(86,608 |
) |
|
|
(64,098 |
) |
|
|
(67,558 |
) |
Depreciation of investment properties |
|
|
(20,165 |
) |
|
|
(21,616 |
) |
|
|
(18,115 |
) |
Impairment loss on property and equipment |
|
|
— |
|
|
|
(7,594 |
) |
|
|
— |
|
Impairment loss on intangible assets |
|
|
(41,429 |
) |
|
|
(34,916 |
) |
|
|
(3,158 |
) |
Write-off of intangible assets |
|
|
(474 |
) |
|
|
(1,346 |
) |
|
|
(1,822 |
) |
Expenses on collection of special bonds |
|
|
(7,978 |
) |
|
|
(11,275 |
) |
|
|
(10,259 |
) |
Others (*3) |
|
|
(344,934 |
) |
|
|
(518,519 |
) |
|
|
(215,725 |
) |
| |
|
|
|
|
|
|
|
|
|
|
|
|
| |
|
|
(501,588 |
) |
|
|
(659,364 |
) |
|
|
(316,637 |
) |
| |
|
|
|
|
|
|
|
|
|
|
|
|
| |
|
|
(529,430 |
) |
|
|
(689,329 |
) |
|
|
(346,686 |
) |
| |
|
|
|
|
|
|
|
|
|
|
|
|
Net other non-operating gain (loss) |
|
W |
(335,398) |
|
|
|
(527,032 |
) |
|
|
339,475 |
|
| |
|
|
|
|
|
|
|
|
|
|
|
|
SHINHAN FINANCIAL GROUP CO., LTD. AND SUBSIDIARIES
Notes to the Consolidated Financial Statements
(In millions of won)
|
Net other non-operating income (continued) |
| |
(*1) |
Gain and loss on disposal of are included in gain and loss on disposal of property, plant, and equipment and gain on disposal of investment property, respectively. Gain on disposal of for the year ended December 31, 2020 is W 9,761 million. |
| |
(*2) |
Gain and loss on disposal of are included in gain and loss on disposal of property and equipment, gain and loss on disposal of investment property and gain on assets held for sale, respectively. Gain on disposal of for the years ended December 31, 2021 and 2022 are W 9,761 million and W 443,780 million, respectively. |
| |
(*3) |
It includes W 284,176 million, W 466,775 million and W 168,020 million, respectively, for the years ended December 31, 2020, 2021 and 2022 of estimated claim for damages that are highly probable to be paid in case of customer losses expected due to redemption delays of Lime CI funds, etc. |
|
(a) |
Income tax expense for the years ended December 31, 2020, 2021 and 2022 are as follows: |
|
|
|
|
|
|
|
|
|
|
|
|
|
|
|
|
|
|
|
|
|
|
|
| Current income tax expense |
|
W |
1,131,254 |
|
|
|
1,498,819 |
|
|
|
1,666,075 |
|
| Temporary differences (*) |
|
|
131,862 |
|
|
|
(322,279 |
) |
|
|
(926,268 |
) |
| Income tax recognized in other comprehensive income (*) |
|
|
(7,321 |
) |
|
|
294,496 |
|
|
|
877,281 |
|
| |
|
|
|
|
|
|
|
|
|
|
|
|
| Income tax expenses |
|
W |
1,255,795 |
|
|
|
1,471,036 |
|
|
|
1,617,088 |
|
| |
|
|
|
|
|
|
|
|
|
|
|
|
|
(*) |
As the corporate tax rate was changed due to the tax law revision in the end of 2022, the effect of the tax rate change was reflected in deferred tax assets (liabilities) expected to be realized 2023 onward. |
|
(b) |
Income tax expense calculated by multiplying net income before tax with the tax rate for the years ended December 31, 2020, 2021 and 2022 are as follows: |
|
|
|
|
|
|
|
|
|
|
|
|
|
|
|
|
|
|
|
|
|
|
|
| Profit before income taxes |
|
W |
4,753,871 |
|
|
|
5,583,664 |
|
|
|
6,349,251 |
|
| |
|
|
|
| Income taxes at statutory tax rates |
|
|
1,301,836 |
|
|
|
1,530,030 |
|
|
|
1,735,682 |
|
| Adjustments: |
|
|
|
|
|
|
|
|
|
|
|
|
| |
|
|
(4,932 |
) |
|
|
(8,417 |
) |
|
|
(13,902 |
) |
| |
|
|
14,529 |
|
|
|
15,975 |
|
|
|
16,762 |
|
| Tax credit |
|
|
(88 |
) |
|
|
(159 |
) |
|
|
(1,233 |
) |
| |
|
|
(55,550 |
) |
|
|
(66,393 |
) |
|
|
(120,221 |
) |
| |
|
|
|
|
|
|
|
|
|
|
|
|
| Income tax expense |
|
W |
1,255,795 |
|
|
|
1,471,036 |
|
|
|
1,617,088 |
|
| |
|
|
|
|
|
|
|
|
|
|
|
|
| Effective tax rate |
|
|
26.42 |
% |
|
|
26.35 |
|
|
|
25.47 |
|
SHINHAN FINANCIAL GROUP CO., LTD. AND SUBSIDIARIES
Notes to the Consolidated Financial Statements
(In millions of won)
|
Income tax expense (continued) |
| |
(c) |
Deferred tax expenses by origination and reversal of deferred assets and liabilities and temporary differences for the years ended December 31, 2021 and 2022 are as follows: |
|
|
|
|
|
|
|
|
|
|
|
|
|
|
|
|
|
| |
|
|
|
| |
|
Beginning
Balance |
|
|
Profit or
loss |
|
|
Other
comprehensive
income (loss) |
|
|
Ending
Balance (*) |
|
| Unearned income |
|
W |
(328,278 |
) |
|
|
(12,714 |
) |
|
|
— |
|
|
|
(340,992 |
) |
| Account receivable |
|
|
(29,078 |
) |
|
|
2,498 |
|
|
|
— |
|
|
|
(26,580 |
) |
| Financial assets measured at fair value |
|
|
(142,085 |
) |
|
|
83,716 |
|
|
|
325,327 |
|
|
|
266,958 |
|
| Investment in associates and etc. |
|
|
161,270 |
|
|
|
22,616 |
|
|
|
(5,624 |
) |
|
|
178,262 |
|
| Valuation and depreciation of property and equipment |
|
|
(150,786 |
) |
|
|
14,616 |
|
|
|
— |
|
|
|
(136,170 |
) |
| Derivative asset (liability) |
|
|
(55,590 |
) |
|
|
86,234 |
|
|
|
(8,995 |
) |
|
|
21,649 |
|
| Deposits |
|
|
27,632 |
|
|
|
(3,202 |
) |
|
|
— |
|
|
|
24,430 |
|
| Accrued expenses |
|
|
140,864 |
|
|
|
13,852 |
|
|
|
— |
|
|
|
154,716 |
|
| Defined benefit obligation |
|
|
538,654 |
|
|
|
26,411 |
|
|
|
(15,115 |
) |
|
|
549,950 |
|
| Plan assets |
|
|
(553,907 |
) |
|
|
(47,067 |
) |
|
|
(870 |
) |
|
|
(601,844 |
) |
| Other provisions |
|
|
312,278 |
|
|
|
77,268 |
|
|
|
— |
|
|
|
389,546 |
|
| Allowance for acceptances and guarantees |
|
|
88,050 |
|
|
|
(55,588 |
) |
|
|
— |
|
|
|
32,462 |
|
| Allowance related to asset revaluation |
|
|
(49,713 |
) |
|
|
— |
|
|
|
— |
|
|
|
(49,713 |
) |
| Allowance for expensing depreciation |
|
|
(337 |
) |
|
|
63 |
|
|
|
— |
|
|
|
(274 |
) |
| Accrued contributions |
|
|
16,618 |
|
|
|
19,496 |
|
|
|
— |
|
|
|
36,114 |
|
| Financial liabilities designated at fair value through profit of loss |
|
|
(28,226 |
) |
|
|
(46,429 |
) |
|
|
— |
|
|
|
(74,655 |
) |
| Allowances |
|
|
223,651 |
|
|
|
(91,412 |
) |
|
|
— |
|
|
|
132,239 |
|
| Constructive dividend |
|
|
16,291 |
|
|
|
446 |
|
|
|
— |
|
|
|
16,737 |
|
| Liability under insurance contracts |
|
|
1,739 |
|
|
|
132 |
|
|
|
— |
|
|
|
1,871 |
|
| Deficit carried over |
|
|
311 |
|
|
|
(311 |
) |
|
|
— |
|
|
|
— |
|
| Others |
|
|
(837,736 |
) |
|
|
(44,441 |
) |
|
|
(227 |
) |
|
|
(882,404 |
) |
| |
|
|
|
|
|
|
|
|
|
|
|
|
|
|
|
|
| |
|
|
(648,378 |
) |
|
|
46,184 |
|
|
|
294,496 |
|
|
|
(307,698 |
) |
| |
|
|
|
|
|
|
|
|
|
|
|
|
|
|
|
|
| Expired unused tax losses: |
|
|
|
|
|
|
|
|
|
|
|
|
|
|
|
|
| Extinguishment of deposit and insurance liabilities |
|
|
284,067 |
|
|
|
(17,462 |
) |
|
|
— |
|
|
|
266,605 |
|
| |
|
|
|
|
|
|
|
|
|
|
|
|
|
|
|
|
| |
|
W |
(364,311 |
) |
|
|
28,722 |
|
|
|
294,496 |
|
|
|
(41,093 |
) |
| |
|
|
|
|
|
|
|
|
|
|
|
|
|
|
|
|
| |
(*) |
Deferred tax assets from overseas subsidiaries are increased by W 939 million due to foreign exchange rate movements. |
SHINHAN FINANCIAL GROUP CO., LTD. AND SUBSIDIARIES
Notes to the Consolidated Financial Statements
(In millions of won)
|
Income tax expense (continued) |
|
|
|
|
|
|
|
|
|
|
|
|
|
|
|
|
|
|
|
|
|
|
|
Beginning
Balance |
|
|
Profit or
loss |
|
|
Other
comprehensive
income (loss) |
|
|
Ending
Balance (*1)(*2) |
|
| Unearned income |
|
W |
(340,992 |
) |
|
|
(9,780 |
) |
|
|
— |
|
|
|
(350,772 |
) |
| Account receivable |
|
|
(26,580 |
) |
|
|
2,885 |
|
|
|
— |
|
|
|
(23,695 |
) |
| Financial assets measured at fair value |
|
|
266,958 |
|
|
|
84,474 |
|
|
|
937,122 |
|
|
|
1,288,554 |
|
| Investment in associates and etc. |
|
|
178,262 |
|
|
|
(3,681 |
) |
|
|
8,829 |
|
|
|
183,410 |
|
| Valuation and depreciation of property and equipment |
|
|
(136,170 |
) |
|
|
34,750 |
|
|
|
— |
|
|
|
(101,420 |
) |
| Derivative asset |
|
|
21,649 |
|
|
|
207,136 |
|
|
|
32,965 |
|
|
|
261,750 |
|
| Deposits |
|
|
24,430 |
|
|
|
12,617 |
|
|
|
— |
|
|
|
37,047 |
|
| Accrued expenses |
|
|
154,716 |
|
|
|
55,021 |
|
|
|
(9 |
) |
|
|
209,728 |
|
| Defined benefit obligation |
|
|
549,950 |
|
|
|
23,951 |
|
|
|
(98,124 |
) |
|
|
475,777 |
|
| Plan assets |
|
|
(601,844 |
) |
|
|
(36,244 |
) |
|
|
2,107 |
|
|
|
(635,981 |
) |
| Other provisions |
|
|
389,546 |
|
|
|
9,304 |
|
|
|
— |
|
|
|
398,850 |
|
| Allowance for acceptances and guarantees |
|
|
32,462 |
|
|
|
(8,039 |
) |
|
|
— |
|
|
|
24,423 |
|
| Allowance related to asset revaluation |
|
|
(49,713 |
) |
|
|
1,822 |
|
|
|
— |
|
|
|
(47,891 |
) |
| Allowance for expensing depreciation |
|
|
(274 |
) |
|
|
72 |
|
|
|
— |
|
|
|
(202 |
) |
| Accrued contributions |
|
|
36,114 |
|
|
|
925 |
|
|
|
— |
|
|
|
37,039 |
|
| Financial liabilities designated at fair value through profit of
loss |
|
|
(74,655 |
) |
|
|
(204,434 |
) |
|
|
— |
|
|
|
(279,089 |
) |
| Allowances |
|
|
132,239 |
|
|
|
33,839 |
|
|
|
— |
|
|
|
166,078 |
|
| Constructive dividend |
|
|
16,737 |
|
|
|
450 |
|
|
|
— |
|
|
|
17,187 |
|
| Liability under insurance contracts |
|
|
1,871 |
|
|
|
(15 |
) |
|
|
— |
|
|
|
1,856 |
|
| Others |
|
|
(882,404 |
) |
|
|
(111,817 |
) |
|
|
(5,609 |
) |
|
|
(999,830 |
) |
| |
|
|
|
|
|
|
|
|
|
|
|
|
|
|
|
|
| |
|
|
(307,698 |
) |
|
|
93,236 |
|
|
|
877,281 |
|
|
|
662,819 |
|
| |
|
|
|
|
|
|
|
|
|
|
|
|
|
|
|
|
| Expired unused tax losses: |
|
|
|
|
|
|
|
|
|
|
|
|
|
|
|
|
| Extinguishment of deposit and insurance liabilities |
|
|
266,605 |
|
|
|
(47,047 |
) |
|
|
— |
|
|
|
219,558 |
|
| |
|
|
|
|
|
|
|
|
|
|
|
|
|
|
|
|
| |
|
W |
(41,093 |
) |
|
|
46,189 |
|
|
|
877,281 |
|
|
|
882,377 |
|
| |
|
|
|
|
|
|
|
|
|
|
|
|
|
|
|
|
| |
(*1) |
Deferred tax assets from overseas subsidiaries are decreased by W 2,797 million due to foreign exchange rate movements. |
| |
(*2) |
As the corporate tax rate was changed due to the tax law revision in the end of 2022, the effect of the tax rate change was reflected in deferred tax assets (liabilities) expected to be realized 2023 onward. |
SHINHAN FINANCIAL GROUP CO., LTD. AND SUBSIDIARIES
Notes to the Consolidated Financial Statements
(In millions of won)
|
Income tax expense (continued) |
| |
(d) |
Deferred tax assets and liabilities that are directly charged or credited to equity for the years ended December 31, 2021 and 2022 are as follows: |
|
|
|
|
|
|
|
|
|
|
|
|
|
|
|
|
|
|
|
|
|
|
|
|
|
| |
|
|
|
|
|
|
|
|
|
| |
|
OCI |
|
|
Tax effect |
|
|
OCI |
|
|
Tax effect |
|
|
OCI |
|
|
Tax effect |
|
| Gain (loss) on valuation of financial assets measured at FVOCI |
|
W |
335,800 |
|
|
|
(108,989 |
) |
|
|
(1,160,013 |
) |
|
|
318,331 |
|
|
|
(824,213 |
) |
|
|
209,342 |
|
| Gain (loss) on financial liabilities measured at FVTPL attributable to changes in credit risk |
|
|
(7,133 |
) |
|
|
1,961 |
|
|
|
4,627 |
|
|
|
(1,272 |
) |
|
|
(2,506 |
) |
|
|
689 |
|
| Foreign currency translation adjustments for foreign operations |
|
|
(374,944 |
) |
|
|
(2,117 |
) |
|
|
258,068 |
|
|
|
(6,226 |
) |
|
|
(116,876 |
) |
|
|
(8,343 |
) |
| Gain (loss) on cash flow hedges |
|
|
(67,935 |
) |
|
|
19,764 |
|
|
|
29,931 |
|
|
|
(8,232 |
) |
|
|
(38,004 |
) |
|
|
11,532 |
|
| Equity in other comprehensive income of associates |
|
|
6,850 |
|
|
|
(2,000 |
) |
|
|
6,512 |
|
|
|
(3,766 |
) |
|
|
13,362 |
|
|
|
(5,766 |
) |
| The accumulated other comprehensive income(loss) in separate account (*) |
|
|
25,412 |
|
|
|
(6,988 |
) |
|
|
(56,484 |
) |
|
|
15,211 |
|
|
|
(31,072 |
) |
|
|
8,223 |
|
| Remeasurements of the defined benefit liability |
|
|
(532,176 |
) |
|
|
146,396 |
|
|
|
58,820 |
|
|
|
(16,164 |
) |
|
|
(473,356 |
) |
|
|
130,232 |
|
| Gain (loss) on valuation of financial asset measured at FVTPL (Overlay approach) |
|
|
224,049 |
|
|
|
(62,130 |
) |
|
|
(31,924 |
) |
|
|
11,826 |
|
|
|
192,125 |
|
|
|
(50,304 |
) |
| |
|
|
|
|
|
|
|
|
|
|
|
|
|
|
|
|
|
|
|
|
|
|
|
|
| |
|
W |
(390,077 |
) |
|
|
(14,103 |
) |
|
|
(890,463 |
) |
|
|
309,708 |
|
|
|
(1,280,540 |
) |
|
|
295,605 |
|
| |
|
|
|
|
|
|
|
|
|
|
|
|
|
|
|
|
|
|
|
|
|
|
|
|
|
|
|
|
|
|
|
|
|
|
|
|
|
|
|
|
|
|
|
|
|
|
|
|
|
| |
|
|
|
|
|
|
|
|
|
| |
|
OCI |
|
|
Tax effect |
|
|
OCI |
|
|
Tax effect |
|
|
OCI |
|
|
Tax effect |
|
| Loss on valuation of financial assets measured at FVOCI |
|
W |
(824,213 |
) |
|
|
209,342 |
|
|
|
(3,293,654 |
) |
|
|
854,660 |
|
|
|
(4,117,867 |
) |
|
|
1,064,002 |
|
| Loss on financial liabilities measured at FVTPL attributable to changes in credit risk |
|
|
(2,506 |
) |
|
|
689 |
|
|
|
(4,508 |
) |
|
|
1,170 |
|
|
|
(7,014 |
) |
|
|
1,859 |
|
| Foreign currency translation adjustments for foreign operations |
|
|
(116,876 |
) |
|
|
(8,343 |
) |
|
|
13,091 |
|
|
|
(155 |
) |
|
|
(103,785 |
) |
|
|
(8,498 |
) |
| Loss on cash flow hedges |
|
|
(38,004 |
) |
|
|
11,532 |
|
|
|
(100,043 |
) |
|
|
29,551 |
|
|
|
(138,047 |
) |
|
|
41,083 |
|
| Equity in other comprehensive income(loss) of associates |
|
|
13,362 |
|
|
|
(5,766 |
) |
|
|
(24,196 |
) |
|
|
8,474 |
|
|
|
(10,834 |
) |
|
|
2,708 |
|
| The accumulated other comprehensive loss in separate account(*) |
|
|
(31,072 |
) |
|
|
8,223 |
|
|
|
(153,594 |
) |
|
|
40,387 |
|
|
|
(184,666 |
) |
|
|
48,610 |
|
| Remeasurements of the defined benefit liability |
|
|
(473,356 |
) |
|
|
130,232 |
|
|
|
347,388 |
|
|
|
(96,257 |
) |
|
|
(125,968 |
) |
|
|
33,975 |
|
| Gain (loss) on valuation of financial asset measured at FVTPL (Overlay approach) |
|
|
192,125 |
|
|
|
(50,304 |
) |
|
|
(299,934 |
) |
|
|
79,837 |
|
|
|
(107,809 |
) |
|
|
29,533 |
|
| |
|
|
|
|
|
|
|
|
|
|
|
|
|
|
|
|
|
|
|
|
|
|
|
|
| |
|
W |
(1,280,540 |
) |
|
|
295,605 |
|
|
|
(3,515,450 |
) |
|
|
917,667 |
|
|
|
(4,795,990 |
) |
|
|
1,213,272 |
|
| |
|
|
|
|
|
|
|
|
|
|
|
|
|
|
|
|
|
|
|
|
|
|
|
|
| (*) |
Deferred tax effects, which are originated from the accumulated other comprehensive income in separate account, are included in the other liabilities of principle and interest guaranteed separate account’s financial statement. |
SHINHAN FINANCIAL GROUP CO., LTD. AND SUBSIDIARIES
Notes to the Consolidated Financial Statements
(In millions of won)
|
Income tax expense (continued) |
|
(e) |
The amount of deductible temporary differences that are not recognized as deferred tax assets as of December 31, 2021 and 2022 are as follows: |
|
|
|
|
|
|
|
|
|
|
|
|
|
|
|
|
|
|
| |
|
|
|
|
|
|
| Temporary differences related to Shinhan EZ General Insurance, Ltd. (*) |
|
W |
— |
|
|
|
119,553 |
|
|
(*) |
Shinhan EZ General Insurance, Ltd., a newly incorporated subsidiary for the current period, suffered a net loss for the current period, etc. As of the end of 2022, deferred corporate tax assets were not recognized as it was determined that the temporary difference to be deducted in excess of the temporary difference to be added and the tax loss were not feasible. The expiration date of unused carried tax losses not recognized as deferred tax assets as of the end of the reporting period is as follows: |
|
|
|
|
|
|
|
|
|
|
|
|
|
|
|
|
|
|
|
|
|
|
|
|
|
|
|
|
|
|
|
|
|
|
|
|
|
| Tax loss carried-forward |
|
W |
9,207 |
|
|
|
19,979 |
|
|
|
9,006 |
|
|
|
76,230 |
|
|
|
114,422 |
|
|
(f) |
The amount of temporary difference regarding investment in subsidiaries that are not recognized as deferred tax liabilities as of December 31, 2021 and 2022 are as follows: |
|
|
|
|
|
|
|
|
|
|
|
|
|
|
|
|
| Investment in subsidiaries, etc. |
|
W |
(8,486,919 |
) |
|
|
(8,888,268 |
) |
|
(g) |
The Group set off a deferred tax asset against a deferred tax liability of the same taxable entity if, and only if, they relate to income taxes levied by the same taxation authority and the entity has a legally enforceable right to set off current tax assets against current tax liabilities. Deferred tax assets and liabilities presented on a gross basis prior to any offsetting as of December 31, 2021 and 2022 are as follows: |
|
|
|
|
|
|
|
|
|
|
|
|
|
|
|
|
| Deferred tax assets |
|
W |
593,852 |
|
|
|
1,072,327 |
|
| Deferred tax liabilities |
|
|
(634,945 |
) |
|
|
(189,950 |
) |
| |
(h) |
As of the end of 2022, the Group is in the process of litigation for cases where tax uncertainty exists (claim amount: W 30,590 million). The Group determined that there is a high probability of winning the case and reflected it as current corporate tax assets and corporate tax expenses. |
SHINHAN FINANCIAL GROUP CO., LTD. AND SUBSIDIARIES
Notes to the Consolidated Financial Statements
(In millions of won)
|
(a) |
Basic and diluted earnings per share for the years ended December 31, 2020, 2021 and 2022 are as follows: |
|
|
|
|
|
|
|
|
|
|
|
|
|
|
|
|
|
|
|
|
|
|
|
| Profit attributable to equity holders of Shinhan Financial Group |
|
W |
3,414,595 |
|
|
|
4,019,254 |
|
|
|
4,642,292 |
|
| Less: |
|
|
|
|
|
|
|
|
|
|
|
|
| Dividends to hybrid bond |
|
|
(85,327 |
) |
|
|
(116,388 |
) |
|
|
(156,277 |
) |
| |
|
|
|
|
|
|
|
|
|
|
|
|
| Net profit available for common stock |
|
W |
3,329,268 |
|
|
|
3,902,866 |
|
|
|
4,486,015 |
|
| |
|
|
|
|
|
|
|
|
|
|
|
|
| Weighted average number of common shares outstanding (*1)(*2) |
|
|
500,343,324 |
|
|
|
534,049,948 |
|
|
|
530,638,621 |
|
| Basic and diluted earnings per share in won |
|
W |
6,654 |
|
|
|
7,308 |
|
|
|
8,454 |
|
| |
|
|
|
|
|
|
|
|
|
|
|
|
| |
(*1) |
The number of basic ordinary shares outstanding is 508,784,869 shares and the above weighted-average stocks are calculated by reflecting treasury stocks issued and 17,482,000 shares of convertible preferred shares issued on May 1, 2019. |
| |
(*2) |
Treasury stock has retired on June 1, 2020. |
|
(b) |
The calculation details of the weighted average number of ordinary shares for the years ended December 31, 2021 and 2022 are as follows: |
|
|
|
|
|
|
|
|
|
|
|
|
|
|
|
|
|
|
|
|
| Number of common shares issued |
|
|
516,599,554 |
|
|
|
188,558,837,210 |
|
| Shares of convertible preferred stock |
|
|
17,482,000 |
|
|
|
6,380,930,000 |
|
| Shares of treasury stock |
|
|
(6,352 |
) |
|
|
(11,536,338 |
) |
| Average number of ordinary shares |
|
|
534,075,202 |
|
|
|
194,928,230,872 |
|
| Days |
|
|
|
|
|
|
365 days |
|
| Weighted average number of ordinary shares |
|
|
|
|
|
|
534,049,948 |
|
|
|
|
|
|
|
|
|
|
|
|
|
|
|
|
|
|
|
|
|
| Number of common shares issued |
|
|
508,784,869 |
|
|
|
187,476,994,819 |
|
| Shares of convertible preferred stock |
|
|
17,482,000 |
|
|
|
6,380,930,000 |
|
| Shares of treasury stock |
|
|
(6,352 |
) |
|
|
(174,828,329 |
) |
| Average number of ordinary shares |
|
|
526,260,517 |
|
|
|
193,683,096,490 |
|
| Days |
|
|
|
|
|
|
365 days |
|
| Weighted average number of ordinary shares |
|
|
|
|
|
|
530,638,621 |
|
SHINHAN FINANCIAL GROUP CO., LTD. AND SUBSIDIARIES
Notes to the Consolidated Financial Statements
(In millions of won)
|
Commitments and contingencies |
|
(a) |
Guarantees, acceptances and credit commitments as of December 31, 2021 and 2022 are as follows: |
|
|
|
|
|
|
|
|
|
|
|
|
|
|
|
|
Guarantees and purchase agreements: |
|
|
|
|
|
|
|
|
| Outstanding guarantees |
|
W |
10,540,968 |
|
|
|
12,154,088 |
|
| Contingent guarantees |
|
|
4,670,771 |
|
|
|
4,565,829 |
|
| ABS and ABCP purchase agreements |
|
|
1,525,768 |
|
|
|
1,496,604 |
|
| |
|
|
|
|
|
|
|
|
| |
|
|
16,737,507 |
|
|
|
18,216,521 |
|
| |
|
|
|
|
|
|
|
|
| Commitments to extend credit: |
|
|
|
|
|
|
|
|
| Loan commitments in won |
|
|
81,707,963 |
|
|
|
83,231,840 |
|
| Loan commitments in foreign currency |
|
|
19,807,686 |
|
|
|
25,052,284 |
|
| Other agreements (*) |
|
|
92,338,217 |
|
|
|
96,971,153 |
|
| |
|
|
|
|
|
|
|
|
| |
|
|
193,853,866 |
|
|
|
205,255,277 |
|
| |
|
|
|
|
|
|
|
|
| Endorsed bills: |
|
|
|
|
|
|
|
|
| Secured endorsed bills |
|
|
8,199 |
|
|
|
10,025 |
|
| Unsecured endorsed bills |
|
|
7,683,165 |
|
|
|
7,046,806 |
|
| |
|
|
|
|
|
|
|
|
| |
|
|
7,691,364 |
|
|
|
7,056,831 |
|
| |
|
|
|
|
|
|
|
|
| |
|
W |
218,282,737 |
|
|
|
230,528,629 |
|
| |
|
|
|
|
|
|
|
|
| |
(*) |
Unused credit commitments provided to the card customers are included, the amounts are W 86,979,545 million for the year ended December 31, 2021 and W 90,452,012 million for the year ended December 31, 2022. |
SHINHAN FINANCIAL GROUP CO., LTD. AND SUBSIDIARIES
Notes to the Consolidated Financial Statements
(In millions of won)
|
Commitments and contingencies (continued) |
| |
The |
Group’s pending lawsuits as a defendant as of December 31, 2022 are as follows: |
|
|
|
|
|
|
|
|
|
|
|
| Case |
|
Number
of claim |
|
Claim
amount |
|
|
Description |
|
Status |
| Return of unjust earning |
|
1 |
|
W |
33,096 |
|
|
The Plaintiff believes that the group of lenders including the Group unfairly sold two oil drilling vessels that are the core assets for borrowers and it caused losses to other bankrupt creditors of the borrower. Therefore, the Plaintiff filed a lawsuit for damages. |
|
The first trial is ongoing as of December 31, 2022. |
| |
|
|
|
|
| Loss claim |
|
1 |
|
|
64,748 |
|
|
Joint Tort liability and Vicarious liability |
|
The first trial is ongoing as of December 31, 2022. |
| |
|
|
|
|
| Loss claim |
|
1 |
|
|
36,436 |
|
|
Joint Tort liability and Vicarious liability |
|
The first trial is ongoing as of December 31, 2022. |
| |
|
|
|
|
| Hwaseong Bansong-dong Construction Payment Litigation (Hyosung Heavy Industries, etc. 1) |
|
1 |
|
|
25,507 |
|
|
The plaintiffs, as contractors, claimed unpaid construction costs. |
|
The first trial is ongoing as of December 31, 2022. |
| |
|
|
|
|
| Others |
|
588 |
|
|
370,892 |
|
|
It includes various cases, such as compensation for loss claim. |
|
|
| |
|
|
|
|
|
|
|
|
|
|
| |
|
592 |
|
W |
530,679 |
|
|
|
|
|
| |
|
|
|
|
|
|
|
|
|
|
As of the December 31, 2022, the Group has recorded
W
29,238 million and
W
3,991 million, respectively, as provisions and insurance contract liabilities (reserve for claims) for litigations, etc., which have been decided to lose at the first trial. The outcome of the remaining litigations other than those accounted for provisions, etc. are not expected to have a material impact on the consolidated financial statements, but additional losses may result from future litigation.
| |
(c) |
As a Prime Brokerage Service operator, the Group entered into a total return swap agreement (“TRS”, derivatives that exchange profits and losses from underlying assets such as stocks, bonds and funds) with a fund operated by Lime Asset Management (“Lime Fund”). Through TRS with the Group, the Lime Fund invested approximately $ 200 million in IIG Global Trade Finance Fund, IIG Trade Finance Fund, and IIG Trade Finance Fund-FX Hedge (“IIG Fund”) from May 2017 to September 2017. The |
SHINHAN FINANCIAL GROUP CO., LTD. AND SUBSIDIARIES
Notes to the Consolidated Financial Statements
|
Commitments and contingencies (continued) |
| |
Group invested the IIG Fund in LAM Enhanced Finance III L.P (“LAM III Fund”) in kind and acquired the LAM III Fund’s beneficiary certificates in accordance with the management instructions of Lime Asset Management in 2019. The recoverable value of the LAM III Fund beneficiary certificates is affected by the recoverable value of the IIG Fund invested in kind. |
Meanwhile, IIG Fund received cancellation of registration and asset freeze from the US Securities and Exchange Commission in November 2019. The Financial Supervisory Service (FSS) announced in its interim inspection of Lime Fund in February 2020 that the Group is charged of being involved in poor concealment and fraud of Lime Fund while operating TRSs with Lime Fund, and a related prosecution investigation has been under way since then.
Institutional sanctions (banned from the sale of new private equity funds and etc. for six months) against the Group was finalized by the Financial Services Commission on November 12, 2021.
In addition, the prosecution arrested and indicted the former director of Prime Brokerage Services for fraud charges and violation of the Capital Market and Financial Investment Services Act. Finally, the former director of Prime Brokerage Services was found guilty.
The prosecution had indicted the Group and the former director of Prime Brokerage Services on January 22, 2021 for violating ‘Financial Investment Services and Capital Markets Act’ by applying the joint penal provisions. On March 15, 2023 the Group was fined
W
50
million won for negligence in its supervisory duties. The Group has determined the additional legal responsibility that may arise in the future related to the above indictment is not significant.
Considering the board resolutions and the results of the Financial Supervisory Service’s dispute settlement committee, the Group has been completed or will be carried out the compensation and liquidity supply for some of the Lime Fund sales in the future.
| |
(d) |
The Group has sold Gen2 related trust instruments from May 2014 to November 2019. As of December 31, 2022, approximately W 420 billion, the entire outstanding balance, is suspended from redemption and delayed in repayment. In accordance with a resolution of the Board of Directors on September 28, 2021, the Group has decided to pay 40% of the investment principal to the customers who have agreed to the suspension of redemption and settle the amount upon investment recovery. |
| |
(e) |
The Group is responsible for the completion of construction when the contractor fails to fulfill its responsibilities. In case the Group fails to fulfill its responsibility, it is in the process of a responsible-for-completion land trust project (154 cases other than the new residential and commercial apartment project in Jongno-gu, Seoul (excluding completed workplaces)) to compensate for damages incurred to the financial institutions, and for the period ended December 31, 2022, the total PF loans amounted to W 5,194.9 billion. The amount of claim for damages of the Group is determined after identifying whether it is a damage caused by the Group’s failure to fulfill its responsibilities. As of December 31, 2022, the risk of the Group to bear the responsibility to complete the project is low, and the loss cannot be reliably measured, hence this was not reflected in the financial statements for the period ended December 31, 2022. Meanwhile, the process of each business sites will be continuously monitored. |
SHINHAN FINANCIAL GROUP CO., LTD. AND SUBSIDIARIES
Notes to the Consolidated Financial Statements
(In millions of won)
| |
(a) |
Cash and cash equivalents in the consolidated statements of cash flows as of December 31, 2020, 2021 and 2022 are as follows: |
|
|
|
|
|
|
|
|
|
|
|
|
|
| |
|
|
|
|
|
|
|
|
|
| Cash and due from banks at amortized cost |
|
W |
33,420,549 |
|
|
|
28,471,127 |
|
|
|
29,551,335 |
|
| Adjustments: |
|
|
|
|
|
|
|
|
|
|
|
|
| Due from financial institutions with a maturity over three months from date of acquisition |
|
|
(2,488,156 |
) |
|
|
(1,490,600 |
) |
|
|
(1,886,179 |
) |
| Restricted due from banks |
|
|
(4,072,993 |
) |
|
|
(2,877,084 |
) |
|
|
(3,663,731 |
) |
| |
|
|
|
|
|
|
|
|
|
|
|
|
| |
|
|
(6,561,149 |
) |
|
|
(4,367,684 |
) |
|
|
(5,549,910 |
) |
| |
|
|
|
|
|
|
|
|
|
|
|
|
| |
|
W |
26,859,400 |
|
|
|
24,103,443 |
|
|
|
24,001,425 |
|
| |
|
|
|
|
|
|
|
|
|
|
|
|
| |
(b) |
Significant non-cash activities for the years ended December 31, 2020, 2021 and 2022 are as follows: |
|
|
|
|
|
|
|
|
|
|
|
|
|
| |
|
|
|
|
|
|
|
|
|
| Investment conversion |
|
W |
58,528 |
|
|
|
32,239 |
|
|
|
— |
|
Transfers from to property and equipment |
|
|
56,575 |
|
|
|
18,748 |
|
|
|
33,983 |
|
| Transfers between property and equipment and investment property |
|
|
4,064 |
|
|
|
73,773 |
|
|
|
9,554 |
|
| Transfers between assets held for sale and property and equipment |
|
|
31,633 |
|
|
|
1,022 |
|
|
|
101,757 |
|
| Transfers between investment property and assets held for sale |
|
|
910 |
|
|
|
2,238 |
|
|
|
83,664 |
|
| Accounts payable for purchase of intangible assets, etc. |
|
|
137,476 |
|
|
|
137,058 |
|
|
|
117,743 |
|
| |
|
|
281,785 |
|
|
|
289,995 |
|
|
|
293,590 |
|
| Exchange of shares related to acquisition of subsidiaries |
|
|
629,449 |
|
|
|
— |
|
|
|
— |
|
| Exchange of shares related to disposal of treasury stocks |
|
|
287,669 |
|
|
|
— |
|
|
|
— |
|
SHINHAN FINANCIAL GROUP CO., LTD. AND SUBSIDIARIES
Notes to the Consolidated Financial Statements
(In millions of won)
|
Statement of cash flows (continued) |
| |
(c) |
Changes in assets and liabilities arising from financing activities for the years ended December 31, 2021 and 2022 are as follows: |
|
|
|
|
|
|
|
|
|
|
|
|
|
|
|
|
|
|
|
|
|
| |
|
|
|
| |
|
Net
Derivative
liabilities |
|
|
|
|
|
|
|
|
|
|
|
|
|
| Beginning balance |
|
W |
(88,784 |
) |
|
|
41,594,064 |
|
|
|
75,134,394 |
|
|
|
594,161 |
|
|
|
117,233,835 |
|
| Changes from cash flows |
|
|
12,667 |
|
|
|
849,212 |
|
|
|
4,417,830 |
|
|
|
(275,273 |
) |
|
|
5,004,436 |
|
Changes from non-cash flows |
|
|
|
|
|
|
|
|
|
|
|
|
|
|
|
|
|
|
|
|
| Amortization of discount on borrowings and debentures |
|
|
— |
|
|
|
(71,390 |
) |
|
|
9,257 |
|
|
|
10,873 |
|
|
|
(51,260 |
) |
| Changes in foreign currency |
|
|
— |
|
|
|
193,892 |
|
|
|
779,919 |
|
|
|
16,235 |
|
|
|
990,046 |
|
| Other |
|
|
(5,290 |
) |
|
|
601,287 |
|
|
|
(192,037 |
) |
|
|
266,694 |
|
|
|
670,654 |
|
| |
|
|
|
|
|
|
|
|
|
|
|
|
|
|
|
|
|
|
|
|
| Ending balance |
|
W |
(81,407 |
) |
|
|
43,167,065 |
|
|
|
80,149,363 |
|
|
|
612,690 |
|
|
|
123,847,711 |
|
| |
|
|
|
|
|
|
|
|
|
|
|
|
|
|
|
|
|
|
|
|
|
|
|
|
|
|
|
|
|
|
|
|
|
|
|
|
|
|
|
|
|
|
|
|
|
| |
|
|
|
| |
|
Net
Derivative
liabilities |
|
|
|
|
|
|
|
|
|
|
|
Financial
liabilities
designated
at FVTPL |
|
|
|
|
| Beginning balance |
|
W |
(81,407 |
) |
|
|
43,167,065 |
|
|
|
80,149,363 |
|
|
|
612,690 |
|
|
|
— |
|
|
|
123,847,711 |
|
| Changes from cash flows |
|
|
71,629 |
|
|
|
6,145,271 |
|
|
|
(2,255,974 |
) |
|
|
(259,913 |
) |
|
|
49,993 |
|
|
|
3,751,006 |
|
Changes from non-cash flows |
|
|
|
|
|
|
|
|
|
|
|
|
|
|
|
|
|
|
|
|
|
|
|
|
| Amortization of discount on borrowings and debentures |
|
|
— |
|
|
|
(94,209 |
) |
|
|
45,713 |
|
|
|
13,379 |
|
|
|
— |
|
|
|
(35,117 |
) |
| Changes in foreign currency |
|
|
— |
|
|
|
294,867 |
|
|
|
58,406 |
|
|
|
19,032 |
|
|
|
— |
|
|
|
372,305 |
|
| Other |
|
|
541,712 |
|
|
|
(233,819 |
) |
|
|
(708,725 |
) |
|
|
237,049 |
|
|
|
(2,666 |
) |
|
|
(166,449 |
) |
| Business combination (Note 47) |
|
|
— |
|
|
|
— |
|
|
|
— |
|
|
|
1,102 |
|
|
|
— |
|
|
|
1,102 |
|
| |
|
|
|
|
|
|
|
|
|
|
|
|
|
|
|
|
|
|
|
|
|
|
|
|
| Ending balance |
|
W |
531,934 |
|
|
|
49,279,175 |
|
|
|
77,288,783 |
|
|
|
623,339 |
|
|
|
47,327 |
|
|
|
127,770,558 |
|
| |
|
|
|
|
|
|
|
|
|
|
|
|
|
|
|
|
|
|
|
|
|
|
|
|
Intra-group balances, and income and expenses arising from intra-group transactions are eliminated in preparing the consolidated financial statements. In accordance with IAS 24, the Group defines the retirement benefit plans of the associates, key management and their families, the consolidation group and related parties as the scope of related parties. The amount of profit and loss, bond and debt balance between the Group and the related parties are disclosed. For details of the subsidiaries and associates, refer to ‘Note 15’.
SHINHAN FINANCIAL GROUP CO., LTD. AND SUBSIDIARIES
Notes to the Consolidated Financial Statements
(In millions of won)
|
Related parties (continued) |
| |
(a) |
Balances with the related parties as of December 31, 2021 and 2022 are as follows: |
|
|
|
|
|
|
|
|
|
|
|
|
|
| |
|
|
|
|
|
|
|
|
|
Investments in associates: |
|
|
|
|
|
|
|
|
|
|
|
|
| BNP Paribas Cardif Life Insurance |
|
|
Other assets |
|
|
W |
61 |
|
|
|
38 |
|
| ” |
|
|
Credit card loans |
|
|
|
87 |
|
|
|
117 |
|
| ” |
|
|
Deposits |
|
|
|
14,870 |
|
|
|
18,745 |
|
| ” |
|
|
Unused credit commitments |
|
|
|
— |
|
|
|
1 |
|
| Partners 4th Growth Investment Fund |
|
|
Deposits |
|
|
|
10,096 |
|
|
|
742 |
|
| Shinhan EZ General Insurance, Ltd. (*2) |
|
|
Credit card loans |
|
|
|
24 |
|
|
|
— |
|
| ” |
|
|
ACL |
|
|
|
(2 |
) |
|
|
— |
|
| ” |
|
|
Other provisions |
|
|
|
4 |
|
|
|
— |
|
| ” |
|
|
Deposits |
|
|
|
1,455 |
|
|
|
— |
|
| Dream High Fund III (*1) |
|
|
Deposits |
|
|
|
4 |
|
|
|
— |
|
Midas Dong-A Snowball Venture Fund 2 |
|
|
Deposits |
|
|
|
350 |
|
|
|
— |
|
| Incorporated association Finance Saving Information Center |
|
|
Deposits |
|
|
|
16 |
|
|
|
2 |
|
| Nomura-Rifa Private Real Estate Investment Trust No.19 |
|
|
Loans |
|
|
|
11,880 |
|
|
|
11,880 |
|
| ” |
|
|
Other assets |
|
|
|
— |
|
|
|
44 |
|
| SH MAIN Professional Investment Type Private Mixed Asset Investment Trust No.3 |
|
|
Other assets |
|
|
|
345 |
|
|
|
427 |
|
| Korea Finance Security |
|
|
Deposits |
|
|
|
457 |
|
|
|
415 |
|
| SHINHAN-CORE TREND GLOBAL FUND 1 (*1) |
|
|
Unearned revenue |
|
|
|
17 |
|
|
|
— |
|
| Hermes Private Investment Equity Fund |
|
|
Deposits |
|
|
|
246 |
|
|
|
218 |
|
| Korea Credit Bureau |
|
|
Deposits |
|
|
|
1,394 |
|
|
|
721 |
|
| Goduck Gangil1 PFV Co., Ltd |
|
|
Loans |
|
|
|
12,000 |
|
|
|
6,825 |
|
| ” |
|
|
ACL |
|
|
|
(52 |
) |
|
|
(20 |
) |
| ” |
|
|
Deposits |
|
|
|
— |
|
|
|
3 |
|
| SBC PFV Co., Ltd |
|
|
Deposits |
|
|
|
33,278 |
|
|
|
21,163 |
|
| Sprott Global Renewable Private Equity Fund I |
|
|
Deposits |
|
|
|
176 |
|
|
|
100 |
|
| IMM Global Private Equity Fund |
|
|
Loans |
|
|
|
800 |
|
|
|
800 |
|
| ” |
|
|
ACL |
|
|
|
(3 |
) |
|
|
(3 |
) |
| ” |
|
|
Deposits |
|
|
|
21,543 |
|
|
|
14,824 |
|
| Goduck Gangil10 PFV Co., Ltd |
|
|
Loans |
|
|
|
7,600 |
|
|
|
3,100 |
|
| ” |
|
|
ACL |
|
|
|
(24 |
) |
|
|
(9 |
) |
| ” |
|
|
Deposits |
|
|
|
72,740 |
|
|
|
26,880 |
|
| Shinhan Global Healthcare Fund 2 |
|
|
Deposits |
|
|
|
1 |
|
|
|
1 |
|
| One Shinhan Global Fund 1 |
|
|
Unearned revenue |
|
|
|
104 |
|
|
|
— |
|
IMM Special Situation 1-2 PRIVATE EQUITY FUND |
|
|
Deposits |
|
|
|
23 |
|
|
|
151 |
|
| EDNCENTRAL Co.,Ltd. |
|
|
Loans |
|
|
|
19,739 |
|
|
|
— |
|
| ” |
|
|
Accrued income |
|
|
|
9 |
|
|
|
— |
|
| ” |
|
|
Deposits |
|
|
|
1 |
|
|
|
— |
|
| ” |
|
|
Unearned revenue |
|
|
|
40 |
|
|
|
— |
|
| Future-Creation Neoplux Venture Capital Fund |
|
|
Account receivables |
|
|
|
3,919 |
|
|
|
3,949 |
|
SHINHAN FINANCIAL GROUP CO., LTD. AND SUBSIDIARIES
Notes to the Consolidated Financial Statements
(In millions of won)
|
Related parties (continued) |
|
|
|
|
|
|
|
|
|
|
|
| |
|
|
|
|
|
|
|
|
Investments in associates (continued): |
|
|
|
|
|
|
|
|
|
|
| Neoplux Market-Frontier Secondary Fund |
|
Account receivables |
|
W |
954 |
|
|
|
904 |
|
| Gyeonggi-Neoplux Superman Fund |
|
Account receivables |
|
|
620 |
|
|
|
623 |
|
| Shinhan-Neoplux Energy Newbiz Fund |
|
Account receivables |
|
|
1,002 |
|
|
|
978 |
|
SHINHAN-NEO Core Industrial Technology Fund |
|
Account receivables |
|
|
— |
|
|
|
124 |
|
KTC-NP Growth Champ 2011-2 Private Equity Fund |
|
Account receivables |
|
|
4,512 |
|
|
|
2,675 |
|
| Neoplux No.3 Private Equity Fund |
|
Account receivables |
|
|
662 |
|
|
|
3,190 |
|
| NV Station Private Equity Fund |
|
Deposits |
|
|
41 |
|
|
|
21 |
|
| Korea Digital Asset Custody |
|
Deposits |
|
|
526 |
|
|
|
153 |
|
| |
|
Deposits |
|
|
115 |
|
|
|
112 |
|
| Shinhan Smilegate Global PEF I |
|
Unearned revenue |
|
|
49 |
|
|
|
9 |
|
| WaveTechnology co.Ltd |
|
Deposits |
|
|
99 |
|
|
|
41 |
|
SHINHAN-NEO Market-Frontier 2nd Fund |
|
Account receivables |
|
|
513 |
|
|
|
513 |
|
| iPIXEL Co.,Ltd. |
|
Loans |
|
|
55 |
|
|
|
— |
|
| ” |
|
Deposits |
|
|
651 |
|
|
|
225 |
|
| CJL No.1 Private Equity Fund |
|
Deposits |
|
|
779 |
|
|
|
603 |
|
| NewWave 6th Fund |
|
Account receivables |
|
|
— |
|
|
|
849 |
|
| Nova New Technology Investment Fund No.1 |
|
Deposits |
|
|
357 |
|
|
|
215 |
|
| DS Power Semicon Private Equity Fund |
|
Deposits |
|
|
— |
|
|
|
100 |
|
| Genesis No.1 Private Equity Fund |
|
Deposits |
|
|
— |
|
|
|
19 |
|
| DDI LVC Master Real Estate Investment Trust Co., Ltd. |
|
Deposits |
|
|
— |
|
|
|
59 |
|
| Newlake Growth Capital Partners2 PEF |
|
Deposits |
|
|
— |
|
|
|
353 |
|
| Logisvalley Shinhan REIT Co.,Ltd. |
|
Loans |
|
|
— |
|
|
|
43,000 |
|
| ” |
|
ACL |
|
|
— |
|
|
|
(28 |
) |
| ” |
|
Account receivables |
|
|
— |
|
|
|
81 |
|
| ” |
|
Deposits |
|
|
— |
|
|
|
1,421 |
|
| Shinhan-Albatross tech investment Fund |
|
Deposits |
|
|
— |
|
|
|
3,402 |
|
| Shinhan Global Active REIT Co.Ltd |
|
Deposits |
|
|
— |
|
|
|
393 |
|
| Shinhan VC tomorrow venture fund 1 |
|
Account receivables |
|
|
— |
|
|
|
850 |
|
| SH Sustainable Management ESG Short term Bond Security Feeder Investment Trust No.1 |
|
Accrued income |
|
|
— |
|
|
|
1 |
|
| SH Global Net Zero Solution Security Investment Trust |
|
Accrued income |
|
|
— |
|
|
|
2 |
|
| SEOKWANG T&I |
|
Deposits |
|
|
— |
|
|
|
1 |
|
| Shinhan Time 1st Investment fund |
|
Deposits |
|
|
— |
|
|
|
238 |
|
| DeepBlue No.1 Private Equity Fund |
|
Deposits |
|
|
— |
|
|
|
400 |
|
Key management personnel and their immediate relatives: |
|
Loans |
|
|
6,149 |
|
|
|
6,561 |
|
| |
|
|
|
|
|
|
|
|
|
|
| |
|
Assets |
|
|
70,850 |
|
|
|
87,471 |
|
| |
|
|
|
|
|
|
|
|
|
|
| |
|
Liabilities |
|
W |
159,432 |
|
|
|
91,731 |
|
| |
|
|
|
|
|
|
|
|
|
|
SHINHAN FINANCIAL GROUP CO., LTD. AND SUBSIDIARIES
Notes to the Consolidated Financial Statements
|
Related parties (continued) |
|
(*1) |
Excluded from the associates due to disposal and liquidation for the year ended December 31, 2022. |
|
(*2) |
For the year ended December 31, 2022, it is incorporated into the consolidation target as the Group held control due to increased equity ratio and BNP Paribas Cardif General Insurance, Ltd. has changed its name to Shinhan EZ General Insurance, Ltd. |
|
(b) |
Transactions with the related parties for the years ended December 31, 2020, 2021 and 2022 are as follows: |
|
|
|
|
|
|
|
|
|
|
|
|
|
|
|
|
|
| |
|
|
|
|
|
|
|
|
|
|
|
|
Investments in associates |
|
|
|
|
|
|
|
|
|
|
|
|
|
|
|
|
| BNP Paribas Cardif Life Insurance |
|
|
Fees and commission income |
|
|
W |
3,390 |
|
|
|
3,023 |
|
|
|
1,890 |
|
| ” |
|
|
Interest expense |
|
|
|
(5 |
) |
|
|
(13 |
) |
|
|
(52 |
) |
| ” |
|
|
General and administrative
expenses |
|
|
|
(4 |
) |
|
|
(2 |
) |
|
|
(1 |
) |
Shinhan Praxis K-Growth Global Private Equity Fund |
|
|
Fees and commission income |
|
|
|
361 |
|
|
|
323 |
|
|
|
42 |
|
| Shinhan EZ General Insurance, Ltd. (*4) |
|
|
Fees and commission income |
|
|
|
10 |
|
|
|
10 |
|
|
|
2 |
|
| ” |
|
|
Reversal for credit loss |
|
|
|
— |
|
|
|
6 |
|
|
|
5 |
|
| ” |
|
|
Other operating income |
|
|
|
333 |
|
|
|
— |
|
|
|
|
|
| ” |
|
|
Interest expense |
|
|
|
— |
|
|
|
(1 |
) |
|
|
(1 |
) |
| SM New Technology Business Investment Fund I (*2) |
|
|
Fees and commission income |
|
|
|
— |
|
|
|
187 |
|
|
|
— |
|
| Partners 4th Growth Investment Fund |
|
|
Interest expense |
|
|
|
(4 |
) |
|
|
(11 |
) |
|
|
(12 |
) |
| Shinhan-Albatross Technology Investment Fund |
|
|
Fees and commission income |
|
|
|
54 |
|
|
|
129 |
|
|
|
146 |
|
KDBC Midas Dong-A Snowball Venture Fund No.2 |
|
|
Interest expense |
|
|
|
(2 |
) |
|
|
— |
|
|
|
— |
|
SHC-K2 Global Material Fund (*1) |
|
|
Fees and commission income |
|
|
|
19 |
|
|
|
— |
|
|
|
— |
|
| Synergy-Shinhan Mezzanine New Technology Investment Fund (*1) |
|
|
Fees and commission income |
|
|
|
50 |
|
|
|
— |
|
|
|
— |
|
Shinhan-Midas Dong-A Secondary Fund |
|
|
Fees and commission income |
|
|
|
63 |
|
|
|
115 |
|
|
|
121 |
|
| GX Shinhan interest 1st Private Equity Fund (*1) |
|
|
Fees and commission income |
|
|
|
454 |
|
|
|
— |
|
|
|
— |
|
| Shinhan-Nvestor Liquidity Solution Fund |
|
|
Fees and commission income |
|
|
|
361 |
|
|
|
271 |
|
|
|
181 |
|
| SHC ULMUS Fund No.1 (*1) |
|
|
Fees and commission income |
|
|
|
39 |
|
|
|
— |
|
|
|
— |
|
Shinhan-PS Investment Fund No.1 |
|
|
Fees and commission income |
|
|
|
20 |
|
|
|
20 |
|
|
|
15 |
|
| Nomura-Rifa Private Real Estate Investment Trust No.19 |
|
|
Interest income |
|
|
|
525 |
|
|
|
530 |
|
|
|
522 |
|
| ” |
|
|
Other operating income |
|
|
|
3 |
|
|
|
— |
|
|
|
— |
|
SHINHAN FINANCIAL GROUP CO., LTD. AND SUBSIDIARIES
Notes to the Consolidated Financial Statements
(In millions of won)
|
Related parties (continued) |
|
|
|
|
|
|
|
|
|
|
|
|
|
|
|
|
|
| |
|
|
|
|
|
|
|
|
|
|
|
|
Investments in associates (continued): |
|
|
|
|
|
|
|
|
|
|
|
|
|
|
|
|
| SH MAIN Professional Investment Type Private Mixed Asset Investment Trust No.3 |
|
|
Fees and commission income |
|
|
W |
2,501 |
|
|
|
974 |
|
|
|
1,550 |
|
| KOREA FINANCE SECURITY |
|
|
Fees and commission income |
|
|
|
10 |
|
|
|
8 |
|
|
|
6 |
|
| ” |
|
|
Interest expense |
|
|
|
(1 |
) |
|
|
(1 |
) |
|
|
— |
|
| ShinHan – Soo Young Entrepreneur Investment Fund |
|
|
Fees and commission income |
|
|
|
206 |
|
|
|
1,028 |
|
|
|
140 |
|
| Shinhan-Rhinos 1 Fund (*3) |
|
|
Fees and commission income |
|
|
|
64 |
|
|
|
47 |
|
|
|
61 |
|
| SHINHAN-CORE TREND GLOBAL FUND1 (*3) |
|
|
Fees and commission income |
|
|
|
100 |
|
|
|
106 |
|
|
|
— |
|
| Kiwoom-Shinhan Innovation Fund I |
|
|
Fees and commission income |
|
|
|
240 |
|
|
|
240 |
|
|
|
118 |
|
| One Shinhan Global Fund1 |
|
|
Fees and commission income |
|
|
|
399 |
|
|
|
208 |
|
|
|
104 |
|
| Open-Shinhan Portfolio Investment Association No. 1 |
|
|
Fees and commission income |
|
|
|
59 |
|
|
|
59 |
|
|
|
— |
|
| FuturePlay-Shinhan TechInnovation Fund 1 |
|
|
Fees and commission income |
|
|
|
218 |
|
|
|
241 |
|
|
|
227 |
|
| Korea Credit Bureau |
|
|
Fees and commission income |
|
|
|
13 |
|
|
|
14 |
|
|
|
13 |
|
| ” |
|
|
Interest expense |
|
|
|
(12 |
) |
|
|
(9 |
) |
|
|
— |
|
| Goduck Gangil1 PFV Co., Ltd |
|
|
Interest income |
|
|
|
915 |
|
|
|
754 |
|
|
|
377 |
|
| ” |
|
|
Reversal
for credit
loss |
|
|
|
7 |
|
|
|
20 |
|
|
|
31 |
|
| SBC PFV Co., Ltd |
|
|
Fees and commission income |
|
|
|
732 |
|
|
|
776 |
|
|
|
808 |
|
| ” |
|
|
Interest expense |
|
|
|
(5 |
) |
|
|
(14 |
) |
|
|
(23 |
) |
| IMM Global Private Equity Fund |
|
|
Interest income |
|
|
|
25 |
|
|
|
23 |
|
|
|
29 |
|
| ” |
|
|
Interest expense |
|
|
|
(13 |
) |
|
|
(49 |
) |
|
|
(274 |
) |
| ” |
|
|
Provision for credit loss |
|
|
|
— |
|
|
|
(1 |
) |
|
|
— |
|
| Goduck Gangil10 PFV Co., Ltd |
|
|
Interest income |
|
|
|
299 |
|
|
|
283 |
|
|
|
171 |
|
| ” |
|
|
Fees and commission income |
|
|
|
793 |
|
|
|
— |
|
|
|
— |
|
| ” |
|
|
Interest expense |
|
|
|
(4 |
) |
|
|
(78 |
) |
|
|
(738 |
) |
| ” |
|
|
Provision for credit loss |
|
|
|
(19 |
) |
|
|
(4 |
) |
|
|
14 |
|
| IGIS PRIVATE REAL ESTATE TRUST NO.331 (*2) |
|
|
Interest income |
|
|
|
731 |
|
|
|
— |
|
|
|
— |
|
| ” |
|
|
Other operating expense |
|
|
|
(67 |
) |
|
|
— |
|
|
|
— |
|
| ” |
|
|
Fees and commission income |
|
|
|
478 |
|
|
|
— |
|
|
|
— |
|
| COSPEC BIM tech (*2) |
|
|
Interest income |
|
|
|
— |
|
|
|
41 |
|
|
|
— |
|
| ” |
|
|
Reversal(provision) for
credit loss |
|
|
|
(95 |
) |
|
|
95 |
|
|
|
— |
|
| Korea Omega Project Fund I |
|
|
Fees and commission income |
|
|
|
131 |
|
|
|
180 |
|
|
|
180 |
|
SHINHAN FINANCIAL GROUP CO., LTD. AND SUBSIDIARIES
Notes to the Consolidated Financial Statements
(In millions of won)
|
Related parties (continued) |
|
|
|
|
|
|
|
|
|
|
|
|
|
|
|
|
|
| |
|
|
|
|
|
|
|
|
|
|
|
|
Investments in associates (continued): |
|
|
|
|
|
|
|
|
|
|
|
|
|
|
|
|
| New Green Shinhan Mezzanine Fund (*2) |
|
|
Fees and commission income |
|
|
W |
42 |
|
|
|
334 |
|
|
|
— |
|
| Sparklabs-Shinhan Opportunity Fund 1 |
|
|
Fees and commission income |
|
|
|
174 |
|
|
|
202 |
|
|
|
202 |
|
| EDNCENTRAL Co.,Ltd. |
|
|
Interest income |
|
|
|
649 |
|
|
|
1,140 |
|
|
|
267 |
|
| ” |
|
|
Fees and commission income |
|
|
|
578 |
|
|
|
714 |
|
|
|
3,212 |
|
| ” |
|
|
Other operating expense |
|
|
|
(121 |
) |
|
|
— |
|
|
|
— |
|
| Shinhan Western T&D Consignment Management Real Estate Investment Co., Ltd (*1) |
|
|
Fees and commission income |
|
|
|
300 |
|
|
|
— |
|
|
|
— |
|
| Kakao-Shinhan 1st TNYT Fund |
|
|
Fees and commission income |
|
|
|
165 |
|
|
|
386 |
|
|
|
386 |
|
KoFC-Neoplux R&D-Biz Creation 2013-1 Investment (*2) |
|
|
Interest income |
|
|
|
9 |
|
|
|
1 |
|
|
|
— |
|
| ” |
|
|
Fees and commission income |
|
|
|
44 |
|
|
|
5,474 |
|
|
|
— |
|
| Future-Creation Neoplux Venture Capital Fund |
|
|
Interest income |
|
|
|
14 |
|
|
|
31 |
|
|
|
74 |
|
| ” |
|
|
Fees and commission income |
|
|
|
116 |
|
|
|
308 |
|
|
|
53 |
|
| Neoplux Market-Frontier Secondary Fund |
|
|
Fees and commission income |
|
|
|
416 |
|
|
|
954 |
|
|
|
904 |
|
| Gyeonggi-Neoplux Superman Fund |
|
|
Fees and commission income |
|
|
|
149 |
|
|
|
621 |
|
|
|
623 |
|
| Shinhan-Neoplux Energy Newbiz Fund |
|
|
Fees and commission income |
|
|
|
308 |
|
|
|
1,002 |
|
|
|
978 |
|
| NewWave 6th Fund |
|
|
Fees and commission income |
|
|
|
303 |
|
|
|
1,210 |
|
|
|
1,014 |
|
SHINHAN-NEO Core Industrial Technology Fund |
|
|
Fees and commission income |
|
|
|
3 |
|
|
|
498 |
|
|
|
498 |
|
KTC-NP Growth Champ 2011-2 Private Equity Fund |
|
|
Interest income |
|
|
|
5 |
|
|
|
26 |
|
|
|
59 |
|
| ” |
|
|
Fees and commission income |
|
|
|
86 |
|
|
|
— |
|
|
|
— |
|
| Neoplux No.3 Private Equity Fund |
|
|
Fees and commission income |
|
|
|
748 |
|
|
|
2,433 |
|
|
|
3,190 |
|
| Pacific Sunny Professional Investors Private Placement Real Estate Investment Company No.45 (*3) |
|
|
Fees and commission income |
|
|
|
1,412 |
|
|
|
83 |
|
|
|
— |
|
| CREDIAN T&F 2020 CORPORATE FINANCIAL STABILITY PRIVATE EQUITY FUND (*1) |
|
|
Interest expense |
|
|
|
(1 |
) |
|
|
— |
|
|
|
— |
|
| Shinhan Smilegate Global PEF I |
|
|
Fees and commission income |
|
|
|
— |
|
|
|
189 |
|
|
|
49 |
|
SHINHAN-NEO Market-Frontier 2nd Fund |
|
|
Fees and commission income |
|
|
|
— |
|
|
|
2,026 |
|
|
|
2,050 |
|
SHINHAN FINANCIAL GROUP CO., LTD. AND SUBSIDIARIES
Notes to the Consolidated Financial Statements
(In millions of won)
|
Related parties (continued) |
|
|
|
|
|
|
|
|
|
|
|
|
|
|
|
|
|
| |
|
|
|
|
|
|
|
|
|
|
|
|
Investments in associates (continued): |
|
|
|
|
|
|
|
|
|
|
|
|
|
|
|
|
| Korea Digital Asset Custody |
|
|
Interest expense |
|
|
W |
— |
|
|
|
(2 |
) |
|
|
— |
|
SWK-Shinhan New Technology Investment Fund 1st |
|
|
Fees and commission income |
|
|
|
— |
|
|
|
41 |
|
|
|
76 |
|
| Ulmus SHC innovation investment fund |
|
|
Fees and commission income |
|
|
|
— |
|
|
|
63 |
|
|
|
94 |
|
| iPIXEL Co.,Ltd. |
|
|
Interest income |
|
|
|
— |
|
|
|
2 |
|
|
|
1 |
|
| CJL No.1 Private Equity Fund |
|
|
Interest expense |
|
|
|
— |
|
|
|
(2 |
) |
|
|
(7 |
) |
| Reverent-Shinhan Vista Fund |
|
|
Fees and commission income |
|
|
|
— |
|
|
|
90 |
|
|
|
40 |
|
| Hermes Private Investment Equity Fund |
|
|
Interest expense |
|
|
|
— |
|
|
|
(1 |
) |
|
|
— |
|
| Kiwoom-Shinhan Innovation Fund 2 |
|
|
Fees and commission income |
|
|
|
— |
|
|
|
115 |
|
|
|
279 |
|
| ETRI Holdings-Shinhan 1st Unicorn Fund |
|
|
Fees and commission income |
|
|
|
— |
|
|
|
32 |
|
|
|
100 |
|
| Shinhan-Time mezzanine blind Fund |
|
|
Fees and commission income |
|
|
|
— |
|
|
|
300 |
|
|
|
107 |
|
| Shinhan VC tomorrow venture fund 1 |
|
|
Fees and commission income |
|
|
|
— |
|
|
|
419 |
|
|
|
3,400 |
|
| JS Shinhan Private Equity Fund |
|
|
Fees and commission income |
|
|
|
— |
|
|
|
250 |
|
|
|
587 |
|
| Stonebridge-Shinhan Unicorn Secondary Fund |
|
|
Fees and commission income |
|
|
|
— |
|
|
|
— |
|
|
|
591 |
|
| Shinhan-Kunicorn first Fund |
|
|
Fees and commission income |
|
|
|
— |
|
|
|
— |
|
|
|
261 |
|
| Shinhan-Quantum Startup Fund |
|
|
Fees and commission income |
|
|
|
— |
|
|
|
— |
|
|
|
125 |
|
| Shinhan Simone Fund I |
|
|
Fees and commission income |
|
|
|
— |
|
|
|
— |
|
|
|
78 |
|
| ShinhanFitrin 1st Technology Business Investment Association |
|
|
Fees and commission income |
|
|
|
— |
|
|
|
— |
|
|
|
59 |
|
| DDI LVC Master Real Estate Investment Trust Co., Ltd. |
|
|
Interest expense |
|
|
|
— |
|
|
|
— |
|
|
|
(1 |
) |
| Logisvalley Shinhan REIT Co.,Ltd. |
|
|
Interest income |
|
|
|
— |
|
|
|
— |
|
|
|
1,018 |
|
| ” |
|
|
Fees and commission income |
|
|
|
— |
|
|
|
— |
|
|
|
458 |
|
| ” |
|
|
Interest expense |
|
|
|
— |
|
|
|
— |
|
|
|
(1 |
) |
| ” |
|
|
Provision(reversal) for credit
loss |
|
|
|
— |
|
|
|
— |
|
|
|
(28 |
) |
| Shinhan-Albatross tech investment Fund |
|
|
Interest expense |
|
|
|
— |
|
|
|
— |
|
|
|
(7 |
) |
Shinhan-Dev healthcare Fund I |
|
|
Fees and commission income |
|
|
|
— |
|
|
|
— |
|
|
|
66 |
|
Shinhan-Cognitive Start-up Fund L.P. |
|
|
Fees and commission income |
|
|
|
— |
|
|
|
— |
|
|
|
192 |
|
| Global Commerce Fund |
|
|
Fees and commission income |
|
|
|
— |
|
|
|
— |
|
|
|
10 |
|
Shinhan-HGI Social Enterprise Fund |
|
|
Fees and commission income |
|
|
|
— |
|
|
|
— |
|
|
|
27 |
|
SHINHAN FINANCIAL GROUP CO., LTD. AND SUBSIDIARIES
Notes to the Consolidated Financial Statements
(In millions of won)
|
Related parties (continued) |
|
|
|
|
|
|
|
|
|
|
|
|
|
|
|
|
|
| |
|
|
|
|
|
|
|
|
|
|
|
|
Investments in associates (continued): |
|
|
|
|
|
|
|
|
|
|
|
|
|
|
|
|
Shinhan-WWG Energy Fund New Technology Venture Investment Fund |
|
|
Fees and commission income |
|
|
W |
— |
|
|
|
— |
|
|
|
22 |
|
| IGIS-Shinhan New Technology Fund 1 |
|
|
Fees and commission income |
|
|
|
— |
|
|
|
— |
|
|
|
36 |
|
Shinhan-G.N.Tech Smart Innovation Fund |
|
|
Fees and commission income |
|
|
|
— |
|
|
|
— |
|
|
|
81 |
|
| SH Sustainable Management ESG Short term Bond Security Feeder Investment Trust No.1 |
|
|
Fees and commission income |
|
|
|
— |
|
|
|
— |
|
|
|
6 |
|
| SH Global Net Zero Solution Security Investment Trust |
|
|
Fees and commission income |
|
|
|
— |
|
|
|
— |
|
|
|
82 |
|
| Newlake Growth Capital Partners2 PEF |
|
|
Interest expense |
|
|
|
— |
|
|
|
— |
|
|
|
(1 |
) |
| Shinhan Global Active REIT Co.Ltd |
|
|
Interest expense |
|
|
|
— |
|
|
|
— |
|
|
|
(1 |
) |
| DeepBlue No.1 Private Equity Fund |
|
|
Interest expense |
|
|
|
— |
|
|
|
— |
|
|
|
(2 |
) |
| DS SHINHAN Content Investment Fund 1 |
|
|
Fees and commission income |
|
|
|
— |
|
|
|
— |
|
|
|
18 |
|
| Shinhan Time 1st Investment fund |
|
|
Fees and commission income |
|
|
|
— |
|
|
|
— |
|
|
|
4 |
|
| SHINHAN SGC ESG Fund No.1 |
|
|
Fees and commission income |
|
|
|
— |
|
|
|
— |
|
|
|
5 |
|
| Shinhan-Sneak Peek Bio&Healthcare Bounce Back Fund |
|
|
Fees and commission income |
|
|
|
— |
|
|
|
— |
|
|
|
4 |
|
| Shinhan-iSquare Venture Fund 1st |
|
|
Fees and commission income |
|
|
|
— |
|
|
|
— |
|
|
|
3 |
|
Key management personnel and their immediate relatives |
|
| Interest income |
|
|
|
|
|
|
126 |
|
|
|
122 |
|
|
|
205 |
|
| |
|
|
|
|
|
|
|
|
|
|
|
|
|
|
|
|
| |
|
|
|
|
|
W |
18,897 |
|
|
|
28,589 |
|
|
|
27,198 |
|
| |
|
|
|
|
|
|
|
|
|
|
|
|
|
|
|
|
|
(*1) |
Excluded from the associates due to disposal and liquidation for the year ended December 31, 2020. |
|
(*2) |
Excluded from the associates due to disposal and liquidation for the year ended December 31, 2021. |
|
(*3) |
Excluded from the associates due to disposal and liquidation for the year ended December 31, 2022. |
|
(*4) |
For the year ended December 31, 2022, it is incorporated into the consolidation target as the Group held control due to increased equity ratio and BNP Paribas Cardif General Insurance, Ltd. has changed its name to Shinhan EZ General Insurance, Ltd. The transaction amount for the years ended December 31, 2020, 2011 and 2022 is the amount before being incorporated into the consolidation target. |
SHINHAN FINANCIAL GROUP CO., LTD. AND SUBSIDIARIES
Notes to the Consolidated Financial State
ment
s
(In millions of won)
|
Related parties (continued) |
| |
(c) |
Key management personnel compensation |
Key management personnel compensation for the years ended December 31, 2020, 2021 and 2022 are as follows:
|
|
|
|
|
|
|
|
|
|
|
|
|
| |
|
|
|
|
|
|
|
|
|
| Short-term employee benefits |
|
W |
23,468 |
|
|
|
23,972 |
|
|
|
27,591 |
|
| Severance benefits |
|
|
651 |
|
|
|
686 |
|
|
|
817 |
|
| Share-based payment transactions (*) |
|
|
2,628 |
|
|
|
13,886 |
|
|
|
9,777 |
|
| |
|
|
|
|
|
|
|
|
|
|
|
|
| |
|
W |
26,747 |
|
|
|
38,544 |
|
|
|
38,185 |
|
| |
|
|
|
|
|
|
|
|
|
|
|
|
|
(*) |
The expenses of share-based payment transactions are the renumeration expenses during the vesting period. |
|
(d) |
The guarantees provided between the related parties as of December 31, 2021 and 2022 are as follows: |
|
|
|
|
|
|
|
|
|
|
|
|
|
|
|
|
|
|
|
|
|
| |
|
|
|
|
|
|
|
|
|
|
| Shinhan Bank |
|
BNP Paribas Cardif Life Insurance |
|
W |
10,000 |
|
|
|
10,000 |
|
|
Unused loan limit |
| ” |
|
Key Management Personnel |
|
|
1,607 |
|
|
|
2,143 |
|
|
” |
| Shinhan Card |
|
BNP Paribas Cardif Life Insurance |
|
|
913 |
|
|
|
883 |
|
|
Unused credit line |
| ” |
|
Shinhan EZ General Insurance, Ltd. (*) |
|
|
226 |
|
|
|
— |
|
|
” |
| The Group |
|
Structured entities |
|
|
207,078 |
|
|
|
296,118 |
|
|
Purchase agreement |
| |
|
|
|
|
|
|
|
|
|
|
|
|
| |
|
|
|
W 219,824 |
|
|
309,144 |
|
|
|
| |
|
|
|
|
|
|
|
|
|
|
|
|
|
(*) |
For the year ended December 31, 2022, it is incorporated into the consolidation target as the Group held control due to increased equity ratio and BNP Paribas Cardif General Insurance, Ltd. has changed its name to Shinhan EZ General Insurance, Ltd. |
SHINHAN FINANCIAL GROUP CO., LTD. AND SUBSIDIARIES
Notes to the Consolidated Financial Statements
(In millions of won)
|
Related parties (continued) |
| |
(e) |
Details of collaterals provided by the related parties as of December 31, 2021 and 2022 are as follows: |
|
|
|
|
|
|
|
|
|
|
|
|
|
| |
|
|
|
|
|
|
|
| |
|
|
|
|
|
|
|
|
|
|
| Shinhan Bank |
|
BNP Paribas Cardif Life Insurance |
|
Government bonds |
|
W |
12,000 |
|
|
|
12,400 |
|
| |
|
iPIXEL Co.,Ltd. |
|
Electronic credit guarantee |
|
|
190 |
|
|
|
190 |
|
| |
|
Logisvalley Shinhan REIT Co.,Ltd. |
|
Collateral trust |
|
|
— |
|
|
|
51,600 |
|
| |
|
Key Management Personnel |
|
Properties |
|
|
10,012 |
|
|
|
8,073 |
|
| |
|
” |
|
Deposits and etc. |
|
|
2,011 |
|
|
|
1,306 |
|
| |
|
” |
|
Guarantee |
|
|
375 |
|
|
|
3,092 |
|
| |
|
|
|
|
|
|
|
|
|
|
|
|
| |
|
|
|
|
|
|
12,398 |
|
|
|
12,471 |
|
| |
|
|
|
|
|
|
|
|
|
|
|
|
| |
|
|
|
|
|
W |
24,588 |
|
|
|
76,661 |
|
| |
|
|
|
|
|
|
|
|
|
|
|
|
| |
(f) |
Details of significant loan transactions with related parties as of December 31, 2021 and 2022 are as follows: |
|
|
|
|
|
|
|
|
|
|
|
|
|
|
|
|
|
|
|
|
|
|
|
| |
|
|
|
|
|
| |
|
|
|
|
|
|
|
|
|
|
|
|
|
|
|
|
|
| Investments in associates |
|
Nomura-Rifa Private Real Estate Investment Trust No.19 |
|
W |
11,973 |
|
|
|
— |
|
|
|
— |
|
|
|
(93 |
) |
|
|
11,880 |
|
| |
IGIS PRIVATE REAL ESTATE TRUST NO.331 |
|
|
9,688 |
|
|
|
— |
|
|
|
(9,769 |
) |
|
|
81 |
|
|
|
— |
|
| |
EDNCENTRAL Co.,Ltd. |
|
|
19,381 |
|
|
|
— |
|
|
|
— |
|
|
|
358 |
|
|
|
19,739 |
|
| |
Goduck Gangil1 PFV Co., Ltd. |
|
|
24,000 |
|
|
|
— |
|
|
|
(12,000 |
) |
|
|
— |
|
|
|
12,000 |
|
| |
Goduck Gangil10 PFV Co., Ltd. |
|
|
9,400 |
|
|
|
600 |
|
|
|
(2,400 |
) |
|
|
|
|
|
|
7,600 |
|
| |
IMM Global Private Equity Fund |
|
|
800 |
|
|
|
— |
|
|
|
— |
|
|
|
— |
|
|
|
800 |
|
| |
COSPEC BIM tech |
|
|
151 |
|
|
|
— |
|
|
|
— |
|
|
|
(151 |
) |
|
|
— |
|
| |
|
iPIXEL Co.,Ltd. |
|
|
— |
|
|
|
71 |
|
|
|
— |
|
|
|
(16 |
) |
|
|
55 |
|
| Key Management Personnel |
|
|
5,146 |
|
|
|
5,315 |
|
|
|
(4,311 |
) |
|
|
— |
|
|
|
6,150 |
|
| |
|
|
|
|
|
|
|
|
|
|
|
|
|
|
|
|
|
|
|
|
|
|
| |
|
Total |
|
W |
80,539 |
|
|
|
5,986 |
|
|
|
(28,480 |
) |
|
|
179 |
|
|
|
58,224 |
|
| |
|
|
|
|
|
|
|
|
|
|
|
|
|
|
|
|
|
|
|
|
| (*) |
The effect on changes in allowance for credit loss is included. |
SHINHAN FINANCIAL GROUP CO., LTD. AND SUBSIDIARIES
Notes to the Consolidated Financial Statements
(In millions of won)
|
Related parties (continued) |
|
|
|
|
|
|
|
|
|
|
|
|
|
|
|
|
|
|
|
|
|
|
|
| |
|
|
|
|
|
| |
|
|
|
|
|
|
|
|
|
|
|
|
|
|
|
|
|
| Investments in associates |
|
Nomura-Rifa Private Real Estate Investment Trust No.19 |
|
W |
11,880 |
|
|
|
— |
|
|
|
— |
|
|
|
— |
|
|
|
11,880 |
|
| |
EDNCENTRAL Co.,Ltd. |
|
|
19,739 |
|
|
|
— |
|
|
|
(20,000 |
) |
|
|
261 |
|
|
|
— |
|
| |
Goduck Gangil1 PFV Co., Ltd. |
|
|
12,000 |
|
|
|
— |
|
|
|
(5,175 |
) |
|
|
— |
|
|
|
6,825 |
|
| |
Goduck Gangil10 PFV Co., Ltd. |
|
|
7,600 |
|
|
|
— |
|
|
|
(4,500 |
) |
|
|
— |
|
|
|
3,100 |
|
| |
IMM Global Private Equity Fund |
|
|
800 |
|
|
|
— |
|
|
|
— |
|
|
|
— |
|
|
|
800 |
|
| |
iPIXEL Co.,Ltd. |
|
|
55 |
|
|
|
— |
|
|
|
— |
|
|
|
(55 |
) |
|
|
— |
|
| |
Logisvalley Shinhan REIT Co.,Ltd. |
|
|
— |
|
|
|
43,000 |
|
|
|
— |
|
|
|
— |
|
|
|
43,000 |
|
| Key Management Personnel |
|
|
|
|
6,150 |
|
|
|
4,590 |
|
|
|
(4,177 |
) |
|
|
— |
|
|
|
6,563 |
|
| |
|
|
|
|
|
|
|
|
|
|
|
|
|
|
|
|
|
|
|
|
|
|
| |
|
Total |
|
W |
58,224 |
|
|
|
47,590 |
|
|
|
(33,852 |
) |
|
|
206 |
|
|
|
72,168 |
|
| |
|
|
|
|
|
|
|
|
|
|
|
|
|
|
|
|
|
|
|
|
| (*) |
The effect on changes in allowance for credit loss is included. |
|
Interests in unconsolidated structured entities |
| |
(a) |
The nature and extent of interests in unconsolidated structured entities |
The Group involved in assets-backed securitization, structured financing, beneficiary certificates (primarily investment funds) and other structured entities and characteristics of these structured entities are as follows:
|
|
|
| |
|
|
| Assets-backed securitization |
|
Securitization vehicles are established to buy assets from originators and issue asset-backed securities in order to facilitate the originators’ funding activities and enhance their financial soundness. The Group is involved in the securitization vehicles by purchasing (or committing to purchase) the asset-backed securities issued and/or providing other forms of credit enhancement. The Group does not consolidate a securitization vehicle if (i) the Group is unable to make or approve decisions as to the modification of the terms and conditions of the securities issued by such vehicle or disposal of such vehicles’ assets, (ii) (even if the Group is so able) if the Group does not have the exclusive or primary power to do so, or (iii) if the Group does not have exposure, or right, to a significant amount of variable returns from such entity due to the purchase (or commitment to purchase) of asset-backed securities so issued or subordinated obligations or by providing other forms of credit support. |
SHINHAN FINANCIAL GROUP CO., LTD. AND SUBSIDIARIES
Notes to the Consolidated Financial Statements
(In millions of won)
|
Interests in unconsolidated structured entities (continued) |
|
|
|
| |
|
|
| |
|
| Structured financing |
|
Structured entities for project financing are established to raise funds and invest in a specific project such as M&A (mergers and acquisitions), BTL (build-transfer-lease), shipping finance, etc. The Group is involved in the structured entities by originating loans, investing in equity, or providing credit enhancement. |
| |
|
| Investment fund |
|
Investment fund means an investment trust, a PEF (private equity fund) or a partnership which invests in a group of assets such as stocks or bonds by issuing a type of beneficiary certificates to raise funds from the general public, and distributes its income and capital gains to their investors. The Group manages assets by investing in shares of investment fund or playing a role of an operator or a GP (general partner) of investment fund, on behalf of other investors. |
The size of unconsolidated structured entities as of December 31, 2021 and 2022 are as follows:
|
|
|
|
|
|
|
|
|
| |
|
|
|
|
|
|
| Total assets: |
|
|
|
|
|
|
|
|
| Asset-backed securitization |
|
W |
248,200,446 |
|
|
|
237,920,155 |
|
| Structured financing |
|
|
255,854,384 |
|
|
|
343,752,304 |
|
| Investment fund |
|
|
301,241,508 |
|
|
|
343,504,568 |
|
| |
|
|
|
|
|
|
|
|
| |
|
W |
805,296,338 |
|
|
|
925,177,027 |
|
| |
|
|
|
|
|
|
|
|
SHINHAN FINANCIAL GROUP CO., LTD. AND SUBSIDIARIES
Notes to the Consolidated Financial Statements
(In millions of won)
|
Interests in unconsolidated structured entities (continued) |
i) The carrying values of the assets and liabilities relating to its interests in unconsolidated structured entities as of December 31, 2021 and 2022 are as follows:
|
|
|
|
|
|
|
|
|
|
|
|
|
|
|
|
|
| |
|
|
|
| |
|
Assets-backed securitization |
|
|
|
|
|
|
|
|
|
|
| Assets under consolidated financial statements: |
|
|
|
|
|
|
|
|
|
|
|
|
|
|
|
|
| Loans measured at fair value through profit or loss |
|
W |
16,352 |
|
|
|
156,630 |
|
|
|
42,231 |
|
|
|
215,213 |
|
| Loan at amortized cost |
|
|
731,184 |
|
|
|
13,548,490 |
|
|
|
155,572 |
|
|
|
14,435,246 |
|
| Securities at fair value through profit or loss |
|
|
3,752,394 |
|
|
|
235,238 |
|
|
|
14,014,493 |
|
|
|
18,002,125 |
|
| Derivate assets |
|
|
4,343 |
|
|
|
16,560 |
|
|
|
— |
|
|
|
20,903 |
|
| Securities at fair value through other comprehensive income |
|
|
2,510,057 |
|
|
|
215,237 |
|
|
|
— |
|
|
|
2,725,294 |
|
| Securities at amortized cost |
|
|
6,493,106 |
|
|
|
— |
|
|
|
— |
|
|
|
6,493,106 |
|
| Other assets |
|
|
138 |
|
|
|
17,280 |
|
|
|
177 |
|
|
|
17,595 |
|
| |
|
|
|
|
|
|
|
|
|
|
|
|
|
|
|
|
| |
|
W |
13,507,574 |
|
|
|
14,189,435 |
|
|
|
14,212,473 |
|
|
|
41,909,482 |
|
| |
|
|
|
|
|
|
|
|
|
|
|
|
|
|
|
|
| Liabilities under consolidated financial statements: |
|
|
|
|
|
|
|
|
|
|
|
|
|
|
|
|
| Derivate liabilities |
|
W |
3,817 |
|
|
|
48 |
|
|
|
— |
|
|
|
3,865 |
|
| Other liabilities |
|
|
103 |
|
|
|
21,683 |
|
|
|
— |
|
|
|
21,786 |
|
| |
|
|
|
|
|
|
|
|
|
|
|
|
|
|
|
|
| |
|
W |
3,920 |
|
|
|
21,731 |
|
|
|
— |
|
|
|
25,651 |
|
| |
|
|
|
|
|
|
|
|
|
|
|
|
|
|
|
|
|
|
|
|
|
|
|
|
|
|
|
|
|
|
|
|
|
| |
|
|
|
| |
|
Assets-backed securitization |
|
|
|
|
|
|
|
|
|
|
| Assets under consolidated financial statements: |
|
|
|
|
|
|
|
|
|
|
|
|
|
|
|
|
| Loans measured at fair value through profit or loss |
|
W |
9,269 |
|
|
|
693,630 |
|
|
|
498 |
|
|
|
703,397 |
|
| Loan at amortized cost |
|
|
869,478 |
|
|
|
15,725,255 |
|
|
|
183,263 |
|
|
|
16,777,996 |
|
| Securities at fair value through profit or loss |
|
|
2,475,307 |
|
|
|
250,470 |
|
|
|
13,767,837 |
|
|
|
16,493,614 |
|
| Derivate assets |
|
|
4,432 |
|
|
|
— |
|
|
|
— |
|
|
|
4,432 |
|
| Securities at fair value through other comprehensive income |
|
|
1,832,987 |
|
|
|
179,714 |
|
|
|
— |
|
|
|
2,012,701 |
|
| Securities at amortized cost |
|
|
6,894,241 |
|
|
|
— |
|
|
|
— |
|
|
|
6,894,241 |
|
| Other assets |
|
|
4,337 |
|
|
|
44,448 |
|
|
|
5,608 |
|
|
|
54,393 |
|
| |
|
|
|
|
|
|
|
|
|
|
|
|
|
|
|
|
| |
|
W |
12,090,051 |
|
|
|
16,893,517 |
|
|
|
13,957,206 |
|
|
|
42,940,774 |
|
| |
|
|
|
|
|
|
|
|
|
|
|
|
|
|
|
|
| Liabilities under consolidated financial statements: |
|
|
|
|
|
|
|
|
|
|
|
|
|
|
|
|
| Derivate liabilities |
|
W |
24,902 |
|
|
|
91 |
|
|
|
— |
|
|
|
24,993 |
|
| Other liabilities |
|
|
788 |
|
|
|
18,840 |
|
|
|
101 |
|
|
|
19,729 |
|
| |
|
|
|
|
|
|
|
|
|
|
|
|
|
|
|
|
| |
|
W |
25,690 |
|
|
|
18,931 |
|
|
|
101 |
|
|
|
44,722 |
|
| |
|
|
|
|
|
|
|
|
|
|
|
|
|
|
|
|
SHINHAN FINANCIAL GROUP CO., LTD. AND SUBSIDIARIES
Notes to the Consolidated Financial Statements
(In millions of won)
|
Interests in unconsolidated structured entities (continued) |
ii) The maximum risk exposure of the Group relating to its interests in unconsolidated structured entities as of December 31, 2021 and 2022 are as follows:
|
|
|
|
|
|
|
|
|
|
|
|
|
|
|
|
|
| |
|
|
|
| |
|
Assets-backed
securitization |
|
|
|
|
|
|
|
|
|
|
| Assets held |
|
W |
13,507,574 |
|
|
|
14,189,435 |
|
|
|
14,212,473 |
|
|
|
41,909,482 |
|
| ABS and ABCP purchase agreements |
|
|
895,273 |
|
|
|
2,210 |
|
|
|
2,703,353 |
|
|
|
3,600,836 |
|
| Loan commitments |
|
|
439,843 |
|
|
|
984,082 |
|
|
|
6,900 |
|
|
|
1,430,825 |
|
| Guarantees |
|
|
21,200 |
|
|
|
105,550 |
|
|
|
— |
|
|
|
126,750 |
|
| Others |
|
|
— |
|
|
|
150,579 |
|
|
|
— |
|
|
|
150,579 |
|
| |
|
|
|
|
|
|
|
|
|
|
|
|
|
|
|
|
| |
|
W |
14,863,890 |
|
|
|
15,431,856 |
|
|
|
16,922,726 |
|
|
|
47,218,472 |
|
| |
|
|
|
|
|
|
|
|
|
|
|
|
|
|
|
|
|
|
|
|
|
|
|
|
|
|
|
|
|
|
|
|
|
| |
|
|
|
| |
|
Assets-backed
securitization |
|
|
|
|
|
|
|
|
|
|
| Assets held |
|
W |
12,090,051 |
|
|
|
16,893,517 |
|
|
|
13,957,206 |
|
|
|
42,940,774 |
|
| ABS and ABCP purchase agreements |
|
|
1,014,702 |
|
|
|
104,773 |
|
|
|
2,257,564 |
|
|
|
3,377,039 |
|
| Loan commitments |
|
|
419,039 |
|
|
|
988,331 |
|
|
|
— |
|
|
|
1,407,370 |
|
| Guarantees |
|
|
15,000 |
|
|
|
80,000 |
|
|
|
— |
|
|
|
95,000 |
|
| Others |
|
|
— |
|
|
|
103,039 |
|
|
|
— |
|
|
|
103,039 |
|
| |
|
|
|
|
|
|
|
|
|
|
|
|
|
|
|
|
| |
|
W |
13,538,792 |
|
|
|
18,169,660 |
|
|
|
16,214,770 |
|
|
|
47,923,222 |
|
| |
|
|
|
|
|
|
|
|
|
|
|
|
|
|
|
|
| |
(a) |
Shinhan EZ General Insurance, Ltd. |
On June 30, 2022, the Group obtained control by acquiring
94.54% (The acquisition price of
W
41 billion) of the total issued shares of Shinhan EZ General Insurance, Ltd. (formerly, BNP Paribas Cardif General Life Insurance Ltd.) after the Financial Services Commission approved the incorporation of subsidiary on June 9, 2022. The main reason for business combination is to secure new business opportunities in the insurance finance area and to achieve synergy between existing businesses.
SHINHAN FINANCIAL GROUP CO., LTD. AND SUBSIDIARIES
Notes to the Consolidated Financial Statements
(In millions of won)
|
Business combination (continued) |
ii) Identifiable net assets
Fair values of assets acquired and liabilities assumed as of acquisition date are as follows:
|
|
|
|
|
| |
|
|
|
| Assets: |
|
|
|
|
| Cash and due from banks at amortized cost |
|
W |
79,723 |
|
| Securities at fair value through profit or loss |
|
|
5,977 |
|
| Securities at fair value through other comprehensive income |
|
|
24,805 |
|
| Loans at amortized cost (*2) |
|
|
98 |
|
| Property and equipment |
|
|
1,938 |
|
| Intangible assets |
|
|
4,425 |
|
| Other assets |
|
|
36,980 |
|
| |
|
|
|
|
| |
|
|
153,946 |
|
| |
|
|
|
|
| Liabilities: |
|
|
|
|
| Liabilities under insurance contracts (*3) |
|
|
71,406 |
|
| Other liabilities |
|
|
26,824 |
|
| |
|
|
|
|
| |
|
|
98,230 |
|
| |
|
|
|
|
| Fair value of the identifiable net assets |
|
W |
55,716 |
|
| |
|
|
|
|
| |
(*1) |
The accounting for the acquisition of Shinhan EZ General Insurance, Ltd. was determined using the identifiable assets and liabilities recognized by Shinhan EZ General Insurance, Ltd. at the time of business combination. |
| |
(*2) |
During the business combination, the Group acquired receivables that were fair value of W 98 million, and the total contract amount was W 98 million. There is no contractual cash flow that is not expected to be recovered from the receivables. |
| |
(*3) |
VOBA (Value Of Business Acquired) measured separately was adjusted by applying the direct method based on the actuarial appraisal value model to the carrying amount of the acquired company’s insurance contract liabilities. |
iii) Gain from bargain purchase
Gain from bargain purchase recognized as a result of business combination is as follows:
|
|
|
|
|
| |
|
|
|
| Transfer cost (*) |
|
W |
43,367 |
|
| Fair value of the identifiable net assets |
|
|
55,716 |
|
| |
|
|
|
|
| Gain from bargain purchase |
|
W |
(12,349 |
) |
| |
|
|
|
|
| |
(*) |
Includes the 5.46% shares Shinhan Life Insurance Co., Ltd. held. |
iv) Expenses related to business combination
The expenses in connection with the business combination amounts to
W
1,259 million, including legal fees and due diligence fees, and the fee was recognized as a fee and commission expense in the consolidated comprehensive income.
SHINHAN FINANCIAL GROUP CO., LTD. AND SUBSIDIARIES
Notes to the Consolidated Financial Statements
(In millions of won)
|
Business combination (continued) |
v) Net cash outflows from business combination
|
|
|
|
|
| |
|
|
|
| Consideration paid in cash |
|
W |
41,000 |
|
| Cash and cash equivalent acquired |
|
|
13,869 |
|
| |
|
|
|
|
| Net cash outflows |
|
W |
27,131 |
|
| |
|
|
|
|
vi) If Shinhan EZ General Insurance had been consolidated from the beginning of the current year, the operating loss and net loss of Shinhan EZ General Insurance, which would have been recorded in the consolidated statement of comprehensive income, ar
W
W
15,030 million, respectively.
| |
(b) |
The merger of Shinhan Asset Management Co., Ltd. and Shinhan Alternative Investment Management Inc. |
Shinhan Asset Management Co., Ltd. and Shinhan Alternative Investment Management Inc. have merged on January 5, 2022 to form a holding company named Shinhan Asset Management Co., Ltd. As a result of the merger, the common shareholders as of immediately prior to the merger of Shinhan Alternative Investment Management Inc. (the merged company) are entitled to receive
0.4430946 share of Shinhan Asset Management Co., Ltd. (the surviving company)’s common share (
W
5,000 per share) per common share of Shinhan Alternative Investment Management Inc. There is no further transfer of any such shares except in accordance with the exchange ratio agreed upon by both parties under the merger agreement addressed above.
|
Events after reporting period |
| |
(a) |
Decided to acquire and retire treasury stock |
The controlling company decided to acquire and retire treasury stocks that worth
W
150 billion through a resolution of the Board of Directors on February 8, 2023, in order to enhance shareholder value.
|
Uncertainty due to changes in domestic and global economic conditions |
Increased internal and external economic uncertainty, such as inflation and rising market interest rates, and the prolonged
COVID-19
are negatively affecting the global economy. The Group uses forward-looking information to estimate expected credit losses in accordance with IFRS 9 ‘Financial Instruments’ and there have been changes in forward-looking information due to the increase in future uncertainty. Accordingly, the probability of default rate for the year ended December 31, 2022 is
re-estimated
using changed forward-looking information on major variables such as GDP growth rate, consumer price fluctuation rate and unemployment rate to compute the probability of default rate. The Group will continue to monitor internal and external economic uncertainties and the impact of the
COVID-19
on the economy.
SHINHAN FINANCIAL GROUP CO., LTD. AND SUBSIDIARIES
Notes to the Consolidated Financial Statements
(In millions of won)
|
Uncertainty due to changes in domestic and global economic conditions (continued) |
Risk exposures by major consolidated subsidiaries due to
COVID-19
are as follows, figures may significantly vary for industries that are highly affected by future economic conditions:
|
|
|
|
|
|
|
|
|
|
|
|
|
|
|
|
|
|
|
|
|
|
|
|
|
|
|
|
|
|
|
|
|
| |
|
|
|
| |
|
|
|
|
|
|
|
|
|
|
|
|
|
|
|
|
|
|
|
|
|
|
|
|
| Loans at amortized cost |
|
W |
164,904 |
|
|
|
3,314,684 |
|
|
|
937,385 |
|
|
|
219,859 |
|
|
|
86,241 |
|
|
|
2,082,545 |
|
|
|
92,152 |
|
|
|
6,897,770 |
|
| Securities at fair value through profit or loss |
|
|
— |
|
|
|
— |
|
|
|
29,911 |
|
|
|
— |
|
|
|
— |
|
|
|
— |
|
|
|
2,737 |
|
|
|
32,648 |
|
| Securities at fair value through other comprehensive income |
|
|
114,158 |
|
|
|
18,142 |
|
|
|
264,343 |
|
|
|
— |
|
|
|
7,123 |
|
|
|
10,678 |
|
|
|
— |
|
|
|
414,444 |
|
| |
|
|
364,351 |
|
|
|
323,638 |
|
|
|
2,650,311 |
|
|
|
20,196 |
|
|
|
91,622 |
|
|
|
982,026 |
|
|
|
37,941 |
|
|
|
4,470,085 |
|
| |
|
|
|
|
|
|
|
|
|
|
|
|
|
|
|
|
|
|
|
|
|
|
|
|
|
|
|
|
|
|
|
|
| |
|
W |
643,413 |
|
|
|
3,656,464 |
|
|
|
3,881,950 |
|
|
|
240,055 |
|
|
|
184,986 |
|
|
|
3,075,249 |
|
|
|
132,830 |
|
|
|
11,814,947 |
|
| |
|
|
|
|
|
|
|
|
|
|
|
|
|
|
|
|
|
|
|
|
|
|
|
|
|
|
|
|
|
|
|
|
|
|
|
|
|
|
|
|
|
|
|
|
|
|
|
|
|
|
|
|
|
|
|
|
|
|
|
|
|
|
|
|
|
| |
|
|
|
| |
|
|
|
|
|
|
|
|
|
|
|
|
|
|
|
|
|
|
|
|
|
|
|
|
| Loans at amortized cost |
|
W |
154,076 |
|
|
|
3,281,340 |
|
|
|
1,217,228 |
|
|
|
209,652 |
|
|
|
76,982 |
|
|
|
2,160,803 |
|
|
|
56,719 |
|
|
|
7,156,800 |
|
| Securities at fair value through other comprehensive income |
|
|
123,875 |
|
|
|
18,416 |
|
|
|
211,000 |
|
|
|
— |
|
|
|
— |
|
|
|
14,776 |
|
|
|
— |
|
|
|
368,067 |
|
| Securities at amortized cost |
|
|
59,997 |
|
|
|
— |
|
|
|
— |
|
|
|
— |
|
|
|
— |
|
|
|
— |
|
|
|
— |
|
|
|
59,997 |
|
| |
|
|
435,399 |
|
|
|
254,076 |
|
|
|
2,731,899 |
|
|
|
8,500 |
|
|
|
76,817 |
|
|
|
1,162,054 |
|
|
|
36,784 |
|
|
|
4,705,529 |
|
| |
|
|
|
|
|
|
|
|
|
|
|
|
|
|
|
|
|
|
|
|
|
|
|
|
|
|
|
|
|
|
|
|
| |
|
W |
773,347 |
|
|
|
3,553,832 |
|
|
|
4,160,127 |
|
|
|
218,152 |
|
|
|
153,799 |
|
|
|
3,337,633 |
|
|
|
93,503 |
|
|
|
12,290,393 |
|
| |
|
|
|
|
|
|
|
|
|
|
|
|
|
|
|
|
|
|
|
|
|
|
|
|
|
|
|
|
|
|
|
|
| |
(b) |
Shinhan Card Co., Ltd. |
|
|
|
|
|
|
|
|
|
|
|
|
|
|
|
|
|
| |
|
|
|
| |
|
|
|
| |
|
|
|
|
|
|
|
|
|
|
|
|
| Loans at amortized cost |
|
W |
371,197 |
|
|
|
152,838 |
|
|
|
387,318 |
|
|
|
911,353 |
|
| Total Exposure |
|
|
814,598 |
|
|
|
|
|
|
|
— |
|
|
|
814,598 |
|
|
|
|
|
|
|
|
|
|
|
|
|
|
|
|
|
|
| |
|
|
|
| |
|
|
|
| |
|
|
|
|
|
|
|
|
|
|
|
|
| Loans at amortized cost |
|
W |
439,882 |
|
|
|
187,652 |
|
|
|
424,445 |
|
|
|
1,051,979 |
|
| Total Exposure |
|
|
870,572 |
|
|
|
|
|
|
|
— |
|
|
|
870,572 |
|
SHINHAN FINANCIAL GROUP CO., LTD. AND SUBSIDIARIES
Notes to the Consolidated Financial Statements
(In millions of won)
|
Uncertainty due to changes in domestic and global economic conditions (continued) |
|
|
|
|
|
|
|
|
|
|
|
|
|
|
|
|
|
|
|
|
|
|
|
|
|
|
|
|
|
|
|
|
|
|
|
|
|
| |
|
|
|
| |
|
|
|
|
|
|
|
|
|
|
|
|
|
Leisure
related
service
industry |
|
|
|
|
|
|
|
|
Youth
training
facilities
business |
|
|
|
|
| Loans at amortized cost |
|
W |
— |
|
|
|
295,664 |
|
|
|
4,161 |
|
|
|
596 |
|
|
|
25,432 |
|
|
|
7,535 |
|
|
|
17,089 |
|
|
|
5,466 |
|
|
|
355,943 |
|
| |
|
|
4 |
|
|
|
5,439 |
|
|
|
161 |
|
|
|
4 |
|
|
|
991 |
|
|
|
197 |
|
|
|
538 |
|
|
|
6 |
|
|
|
7,340 |
|
| |
|
|
|
|
|
|
|
|
|
|
|
|
|
|
|
|
|
|
|
|
|
|
|
|
|
|
|
|
|
|
|
|
|
|
|
|
| |
|
W |
4 |
|
|
|
301,103 |
|
|
|
4,322 |
|
|
|
600 |
|
|
|
26,423 |
|
|
|
7,732 |
|
|
|
17,627 |
|
|
|
5,472 |
|
|
|
363,283 |
|
| |
|
|
|
|
|
|
|
|
|
|
|
|
|
|
|
|
|
|
|
|
|
|
|
|
|
|
|
|
|
|
|
|
|
|
|
|
|
|
|
|
|
|
|
|
|
|
|
|
|
|
|
|
|
|
|
|
|
|
|
|
|
|
|
|
|
|
|
|
|
|
|
|
|
| |
|
|
|
| |
|
|
|
|
|
|
|
|
|
|
|
|
|
Leisure
related
service
industry |
|
|
|
|
|
|
|
|
Youth
training
facilities
business |
|
|
|
|
| Loans at amortized cost |
|
W |
— |
|
|
|
303,118 |
|
|
|
4,752 |
|
|
|
226 |
|
|
|
11,299 |
|
|
|
8,152 |
|
|
|
9,064 |
|
|
|
5,438 |
|
|
|
342,049 |
|
| |
|
|
1 |
|
|
|
6,107 |
|
|
|
173 |
|
|
|
4 |
|
|
|
841 |
|
|
|
384 |
|
|
|
339 |
|
|
|
4 |
|
|
|
7,853 |
|
| |
|
|
|
|
|
|
|
|
|
|
|
|
|
|
|
|
|
|
|
|
|
|
|
|
|
|
|
|
|
|
|
|
|
|
|
|
| |
|
W |
1 |
|
|
|
309,225 |
|
|
|
4,925 |
|
|
|
230 |
|
|
|
12,140 |
|
|
|
8,536 |
|
|
|
9,403 |
|
|
|
5,442 |
|
|
|
349,902 |
|
| |
|
|
|
|
|
|
|
|
|
|
|
|
|
|
|
|
|
|
|
|
|
|
|
|
|
|
|
|
|
|
|
|
|
|
|
|
As of December 31, 2021 and 2022, the exposure of the loans applied for moratorium of interest payments and moratorium of repayment in installments is as follows:
|
|
|
|
|
|
|
|
|
| |
|
|
|
|
|
|
| Moratorium of interest payments |
|
W |
224,449 |
|
|
|
165,442 |
|
| Moratorium of repayment in installments |
|
|
1,342,366 |
|
|
|
1,105,481 |
|
| Moratorium of interest payments and moratorium of repayment in installments |
|
|
65,773 |
|
|
|
66,218 |
|
| |
|
|
|
|
|
|
|
|
| |
|
W |
1,632,588 |
|
|
|
1,337,141 |
|
| |
|
|
|
|
|
|
|
|
|
|
|
|
|
|
|
|
|
|
|
|
|
|
|
|
| Moratorium of interest payments |
|
W |
348 |
|
|
|
— |
|
| Moratorium of repayment in installments |
|
|
276,193 |
|
|
|
351,129 |
|
| |
|
|
|
|
|
|
|
|
| |
|
W |
276,541 |
|
|
|
351,129 |
|
| |
|
|
|
|
|
|
|
|
SHINHAN FINANCIAL GROUP CO., LTD. AND SUBSIDIARIES
Notes to the Consolidated Financial Statements
(In millions of won)
The effective interest rate, not the carrying value, is adjusted when replacing the interest rate index of a financial instrument measured at amortized cost in relation to the reform of the interest rate index. It includes exceptions, such as allowing hedge accounting to continue uninterrupted even if an interest rate indicator replacement occurs in a hedging relationship. Regarding the suspension of LIBOR interest rate calculation, the financial instruments that have not been converted to replaced interest rate benchmark among the LIBOR interest rates as of December 31, 2021 and December 31, 2022 are as follows:
| |
(a) |
Non-derivative financial assets |
|
|
|
|
|
|
|
|
|
|
|
|
|
|
|
|
|
| |
|
|
|
| |
|
|
|
| |
|
|
|
|
|
|
|
|
|
|
|
|
| Due from banks and loans at amortized cost: |
|
|
|
|
|
|
|
|
|
|
|
|
|
|
|
|
| Loans |
|
W |
2,768,972 |
|
|
|
207,660 |
|
|
|
49,642 |
|
|
|
122,104 |
|
| Securities at fair value through other comprehensive income: |
|
|
|
|
|
|
|
|
|
|
|
|
|
|
|
|
| Financial institution bonds |
|
|
167,167 |
|
|
|
— |
|
|
|
— |
|
|
|
— |
|
| Corporate bonds and others |
|
|
281,949 |
|
|
|
— |
|
|
|
— |
|
|
|
— |
|
|
|
|
|
|
|
|
|
|
|
|
|
|
|
|
|
|
|
|
|
449,116 |
|
|
|
— |
|
|
|
— |
|
|
|
— |
|
|
|
|
|
|
|
|
|
|
|
|
|
|
|
|
|
|
| Commitments and guarantee contracts (*1) |
|
W |
280,224 |
|
|
|
39,148 |
|
|
|
56,552 |
|
|
|
13,853 |
|
| |
(*1) |
The commitments and guarantee contracts are in nominal amount. |
| |
(*2) |
The instruments that will be matured before the end of June 30, 2023 when USD LIBOR interest rate calculation is discontinued are excluded. |
|
|
|
|
|
|
|
|
|
|
|
|
|
|
|
|
|
| |
|
|
|
| |
|
|
|
| |
|
|
|
|
|
|
|
|
|
|
|
|
| Due from banks and loans at amortized cost: |
|
|
|
|
|
|
|
|
|
|
|
|
|
|
|
|
| Loans |
|
W |
2,511,050 |
|
|
|
— |
|
|
|
— |
|
|
|
— |
|
| Financial assets at fair value through profit or loss: |
|
|
|
|
|
|
|
|
|
|
|
|
|
|
|
|
| Corporate bonds and others |
|
|
253,126 |
|
|
|
— |
|
|
|
— |
|
|
|
— |
|
| Securities at fair value through other comprehensive income: |
|
|
|
|
|
|
|
|
|
|
|
|
|
|
|
|
| Financial institution bonds |
|
|
189,047 |
|
|
|
— |
|
|
|
— |
|
|
|
— |
|
| Corporate bonds and others |
|
|
229,030 |
|
|
|
— |
|
|
|
— |
|
|
|
— |
|
|
|
|
|
|
|
|
|
|
|
|
|
|
|
|
|
|
|
|
|
418,077 |
|
|
|
— |
|
|
|
— |
|
|
|
— |
|
|
|
|
|
|
|
|
|
|
|
|
|
|
|
|
|
|
| Commitments and financial guarantee contracts (*1) |
|
W |
217,839 |
|
|
|
— |
|
|
|
— |
|
|
|
— |
|
| |
(*1) |
The commitments and guarantee contracts are in nominal amount. |
| |
(*2) |
The instruments that will be matured before the end of June 30, 2023 when USD LIBOR interest rate calculation is discontinued are excluded. |
SHINHAN FINANCIAL GROUP CO., LTD. AND SUBSIDIARIES
Notes to the Consolidated Financial Statements
(In millions of won)
|
LIBOR Interest rate (continued) |
| |
(b) |
Non-derivative financial liabilities |
|
|
|
|
|
|
|
|
|
|
|
|
|
|
|
|
|
| |
|
|
|
| |
|
|
|
| |
|
|
|
|
|
|
|
|
|
|
|
|
| Financial liabilities at amortized cost: |
|
|
|
|
|
|
|
|
|
|
|
|
|
|
|
|
| Deposits |
|
W |
200,000 |
|
|
|
— |
|
|
|
— |
|
|
|
— |
|
| Borrowings |
|
|
347,420 |
|
|
|
— |
|
|
|
— |
|
|
|
— |
|
| Debt securities issued |
|
|
986,871 |
|
|
|
— |
|
|
|
— |
|
|
|
— |
|
|
|
|
|
|
|
|
|
|
|
|
|
|
|
|
|
|
|
|
W |
1,534,291 |
|
|
|
— |
|
|
|
— |
|
|
|
— |
|
|
|
|
|
|
|
|
|
|
|
|
|
|
|
|
|
|
| |
(*) |
The instruments that will be matured before the end of June 30, 2023 when USD LIBOR interest rate calculation is discontinued are excluded. |
|
|
|
|
|
|
|
|
|
|
|
|
|
|
|
|
|
| |
|
|
|
| |
|
|
|
| |
|
|
|
|
|
|
|
|
|
|
|
|
| Financial liabilities at amortized cost: |
|
|
|
|
|
|
|
|
|
|
|
|
|
|
|
|
| Deposits |
|
W |
200,000 |
|
|
|
— |
|
|
|
— |
|
|
|
— |
|
| Borrowings |
|
|
50,692 |
|
|
|
— |
|
|
|
— |
|
|
|
— |
|
| Debt securities issued |
|
|
1,355,525 |
|
|
|
— |
|
|
|
— |
|
|
|
— |
|
|
|
|
|
|
|
|
|
|
|
|
|
|
|
|
|
|
|
|
W |
1,606,217 |
|
|
|
— |
|
|
|
— |
|
|
|
— |
|
|
|
|
|
|
|
|
|
|
|
|
|
|
|
|
|
|
| Financial liabilities designated at fair value through profit or loss |
|
|
|
|
|
|
|
|
|
|
|
|
|
|
|
|
| Derivatives-combined securities |
|
W |
15,000 |
|
|
|
— |
|
|
|
— |
|
|
|
— |
|
|
|
|
|
|
|
|
|
|
|
|
|
|
|
|
|
|
| |
(*) |
The instruments that will be matured before the end of June 30, 2023 when USD LIBOR interest rate calculation is discontinued are excluded. |
|
|
|
|
|
|
|
|
|
|
|
|
|
|
|
|
|
| |
|
|
|
| |
|
|
|
| |
|
|
|
|
|
|
|
|
|
|
|
|
| Trading: |
|
|
|
|
|
|
|
|
|
|
|
|
|
|
|
|
| Interest rates related |
|
W |
10,772,390 |
|
|
|
— |
|
|
|
— |
|
|
|
— |
|
| Foreign currency related |
|
|
10,900,844 |
|
|
|
— |
|
|
|
— |
|
|
|
— |
|
| Equity related |
|
|
268,243 |
|
|
|
— |
|
|
|
— |
|
|
|
— |
|
| Credit related |
|
|
1,108 |
|
|
|
— |
|
|
|
— |
|
|
|
— |
|
| Others |
|
|
379,360 |
|
|
|
— |
|
|
|
— |
|
|
|
— |
|
|
|
|
|
|
|
|
|
|
|
|
|
|
|
|
|
|
|
|
|
22,321,945 |
|
|
|
— |
|
|
|
— |
|
|
|
— |
|
|
|
|
|
|
|
|
|
|
|
|
|
|
|
|
|
|
| Hedge: |
|
|
|
|
|
|
|
|
|
|
|
|
|
|
|
|
| Interest rates related |
|
|
4,150,155 |
|
|
|
— |
|
|
|
— |
|
|
|
— |
|
| Foreign currency related |
|
|
278,705 |
|
|
|
— |
|
|
|
— |
|
|
|
— |
|
|
|
|
|
|
|
|
|
|
|
|
|
|
|
|
|
|
|
|
W |
4,428,860 |
|
|
|
— |
|
|
|
— |
|
|
|
— |
|
|
|
|
|
|
|
|
|
|
|
|
|
|
|
|
|
|
SHINHAN FINANCIAL GROUP CO., LTD. AND SUBSIDIARIES
Notes to the Consolidated Financial Statements
(In millions of won)
|
LIBOR Interest rate (continued) |
| |
(*) |
The instruments that will be matured before the end of June 30, 2023 when USD LIBOR interest rate calculation is discontinued are excluded. |
|
|
|
|
|
|
|
|
|
|
|
|
|
|
|
|
|
| |
|
|
|
| |
|
|
|
| |
|
|
|
|
|
|
|
|
|
|
|
|
| Trading: |
|
|
|
|
|
|
|
|
|
|
|
|
|
|
|
|
| Interest rates related |
|
W |
11,488,018 |
|
|
|
— |
|
|
|
— |
|
|
|
— |
|
| Foreign currency related |
|
|
11,718,419 |
|
|
|
— |
|
|
|
— |
|
|
|
— |
|
| Equity related |
|
|
183,779 |
|
|
|
— |
|
|
|
— |
|
|
|
— |
|
| Credit related |
|
|
2,370 |
|
|
|
— |
|
|
|
— |
|
|
|
— |
|
| Others |
|
|
405,536 |
|
|
|
— |
|
|
|
— |
|
|
|
— |
|
| |
|
|
|
|
|
|
|
|
|
|
|
|
|
|
|
|
| |
|
|
23,798,122 |
|
|
|
— |
|
|
|
— |
|
|
|
— |
|
| |
|
|
|
|
|
|
|
|
|
|
|
|
|
|
|
|
| Hedge: |
|
|
|
|
|
|
|
|
|
|
|
|
|
|
|
|
| Interest rates related |
|
|
4,196,714 |
|
|
|
— |
|
|
|
— |
|
|
|
— |
|
| Foreign currency related |
|
|
258,529 |
|
|
|
— |
|
|
|
— |
|
|
|
— |
|
| |
|
|
|
|
|
|
|
|
|
|
|
|
|
|
|
|
| |
|
W |
4,455,243 |
|
|
|
— |
|
|
|
— |
|
|
|
— |
|
| |
|
|
|
|
|
|
|
|
|
|
|
|
|
|
|
|
| |
(*) |
The instruments that will be matured before the end of June 30, 2023 when USD LIBOR interest rate calculation is discontinued are excluded. |
SHINHAN FINANCIAL GROUP CO., LTD. AND SUBSIDIARIES
Notes to the Consolidated Financial Statements
(In millions of won)
|
Condensed Shinhan Financial Group (Parent Company only) Financial Statements |
STATEMENTS OF FINANCIAL POSITION
|
|
|
|
|
|
|
|
|
| |
|
|
|
|
|
|
| |
|
|
|
|
|
|
|
|
| Deposits |
|
|
|
|
|
|
|
|
| Banking subsidiaries |
|
W |
3,913 |
|
|
|
2,187 |
|
| Other |
|
|
41,000 |
|
|
|
— |
|
| Receivables from subsidiaries: |
|
|
|
|
|
|
|
|
| |
|
|
3,976,059 |
|
|
|
4,009,467 |
|
| Investment (at equity) in subsidiaries: |
|
|
|
|
|
|
|
|
| Banking subsidiaries |
|
|
13,797,222 |
|
|
|
13,797,222 |
|
| |
|
|
16,537,819 |
|
|
|
16,933,142 |
|
| Financial assets at FVTPL |
|
|
1,617,734 |
|
|
|
1,778,475 |
|
| Derivative assets |
|
|
17,933 |
|
|
|
— |
|
| Property, equipment and intangible assets, net |
|
|
10,597 |
|
|
|
11,411 |
|
| Other assets |
|
|
|
|
|
|
|
|
| Banking subsidiaries |
|
|
326,216 |
|
|
|
483,688 |
|
| |
|
|
468,150 |
|
|
|
384,443 |
|
| Other |
|
|
19,250 |
|
|
|
56,279 |
|
| |
|
|
|
|
|
|
|
|
| Total assets |
|
W |
36,815,893 |
|
|
|
37,456,314 |
|
| |
|
|
|
|
|
|
|
|
| |
|
|
|
|
|
|
|
|
| Borrowings |
|
W |
— |
|
|
|
20,000 |
|
| Debt securities issued |
|
|
9,559,553 |
|
|
|
9,815,457 |
|
| Derivative liabilities |
|
|
6,263 |
|
|
|
— |
|
| Accrued expenses & other liabilities |
|
|
844,701 |
|
|
|
944,308 |
|
| |
|
|
|
|
|
|
|
|
| Total liabilities |
|
|
10,410,517 |
|
|
|
10,779,765 |
|
| |
|
|
|
|
|
|
|
|
| Equity |
|
|
26,405,376 |
|
|
|
26,676,549 |
|
| |
|
|
|
|
|
|
|
|
| Total liabilities and equity |
|
W |
36,815,893 |
|
|
|
37,456,314 |
|
| |
|
|
|
|
|
|
|
|
SHINHAN FINANCIAL GROUP CO., LTD. AND SUBSIDIARIES
Notes to the Consolidated Financial Statements
(In millions of won)
|
Condensed Shinhan Financial Group (Parent Company only) Financial Statements (continued) |
CONDENSED STATEMENTS OF INCOME
|
|
|
|
|
|
|
|
|
|
|
|
|
| |
|
|
|
|
|
|
|
|
|
|
|
|
|
|
|
|
|
|
|
|
|
|
Dividends from banking subsidiaries |
|
W |
892,420 |
|
|
|
772,420 |
|
|
|
902,420 |
|
Dividends from non-banking subsidiaries |
|
|
495,110 |
|
|
|
807,803 |
|
|
|
568,474 |
|
Interest income from banking subsidiaries |
|
|
194 |
|
|
|
173 |
|
|
|
236 |
|
Interest income from non-banking subsidiaries |
|
|
68,914 |
|
|
|
75,013 |
|
|
|
87,215 |
|
Other income |
|
|
268,784 |
|
|
|
235,746 |
|
|
|
251,999 |
|
| |
|
|
|
|
|
|
|
|
|
|
|
|
Total income |
|
|
1,725,422 |
|
|
|
1,891,155 |
|
|
|
1,810,344 |
|
| |
|
|
|
|
|
|
|
|
|
|
|
|
|
|
|
|
|
|
|
|
|
|
|
|
|
Interest expense |
|
|
(231,205 |
) |
|
|
(210,535 |
) |
|
|
(222,413 |
) |
Other expense |
|
|
(216,708 |
) |
|
|
(259,188 |
) |
|
|
(367,015 |
) |
| |
|
|
|
|
|
|
|
|
|
|
|
|
Total expenses |
|
|
(447,913 |
) |
|
|
(469,723 |
) |
|
|
(589,428 |
) |
| |
|
|
|
|
|
|
|
|
|
|
|
|
Profit before income tax expense |
|
|
1,277,509 |
|
|
|
1,421,432 |
|
|
|
1,220,916 |
|
| |
|
|
|
|
|
|
|
|
|
|
|
|
Income tax expense |
|
|
3,066 |
|
|
|
7,476 |
|
|
|
(28,335 |
) |
| |
|
|
|
|
|
|
|
|
|
|
|
|
|
|
W |
1,274,443 |
|
|
|
1,413,956 |
|
|
|
1,249,251 |
|
| |
|
|
|
|
|
|
|
|
|
|
|
|
SHINHAN FINANCIAL GROUP CO., LTD. AND SUBSIDIARIES
Notes to the Consolidated Financial Statements
(In millions of won)
|
Condensed Shinhan Financial Group (Parent Company only) Financial Statements (continued) |
CONDENSED STATEMENTS OF CASH FLOWS
|
|
|
|
|
|
|
|
|
|
|
|
|
| |
|
|
|
|
|
|
|
|
|
Cash flows from operating activities |
|
|
|
|
|
|
|
|
|
|
|
|
Profit before income taxes |
|
W |
1,277,509 |
|
|
|
1,421,432 |
|
|
|
1,220,916 |
|
Non-cash items included in profit before tax |
|
|
(1,313,967 |
) |
|
|
(1,456,374 |
) |
|
|
(1,245,848 |
) |
Changes in operating assets and liabilities |
|
|
(1,272,738 |
) |
|
|
605,089 |
|
|
|
163,179 |
|
Net interest paid |
|
|
(165,570 |
) |
|
|
(134,269 |
) |
|
|
(127,247 |
) |
Dividend received from subsidiaries |
|
|
1,386,843 |
|
|
|
1,578,920 |
|
|
|
1,470,400 |
|
Income tax paid |
|
|
— |
|
|
|
(1,102 |
) |
|
|
(3,487 |
) |
| |
|
|
|
|
|
|
|
|
|
|
|
|
Net cash provided by (used in) operating activities |
|
|
(87,923 |
) |
|
|
2,013,696 |
|
|
|
1,477,913 |
|
| |
|
|
|
|
|
|
|
|
|
|
|
|
Cash flows from investing activities |
|
|
|
|
|
|
|
|
|
|
|
|
Net loan origination to non-banking subsidiaries |
|
|
(1,073,657 |
) |
|
|
(649,384 |
) |
|
|
68,000 |
|
Acquisition of subsidiary |
|
|
(73,335 |
) |
|
|
(379,857 |
) |
|
|
(374,126 |
) |
Disposal of investments in subsidiaries |
|
|
— |
|
|
|
— |
|
|
|
20,354 |
|
Other, net |
|
|
(100,875 |
) |
|
|
(452,672 |
) |
|
|
(403,743 |
) |
| |
|
|
|
|
|
|
|
|
|
|
|
|
Net cash used in investing activities |
|
|
(1,247,867 |
) |
|
|
(1,481,913 |
) |
|
|
(689,515 |
) |
| |
|
|
|
|
|
|
|
|
|
|
|
|
Cash flows from financing activities |
|
|
|
|
|
|
|
|
|
|
|
|
Issuance of common stocks |
|
|
1,154,347 |
|
|
|
— |
|
|
|
— |
|
Issuance of hybrid bonds |
|
|
448,699 |
|
|
|
1,154,597 |
|
|
|
997,120 |
|
Repayments of hybrid bonds |
|
|
— |
|
|
|
— |
|
|
|
(135,000 |
) |
Net changes in borrowings |
|
|
— |
|
|
|
— |
|
|
|
20,000 |
|
Issuance of debt securities issued |
|
|
2,240,581 |
|
|
|
1,428,704 |
|
|
|
2,206,672 |
|
Repayments of debt securities issued |
|
|
(1,384,000 |
) |
|
|
(1,890,000 |
) |
|
|
(2,036,000 |
) |
Dividend paid |
|
|
(968,847 |
) |
|
|
(1,218,761 |
) |
|
|
(1,540,871 |
) |
Acquisition of treasury stock |
|
|
(150,448 |
) |
|
|
(79 |
) |
|
|
(300,600 |
) |
Disposition of and incineration cost of treasury stock |
|
|
(3,033 |
) |
|
|
— |
|
|
|
(60 |
) |
Payment of stock issuance costs |
|
|
— |
|
|
|
(605 |
) |
|
|
— |
|
Redemption of lease liabilities |
|
|
(1,673 |
) |
|
|
(1,701 |
) |
|
|
(1,431 |
) |
| |
|
|
|
|
|
|
|
|
|
|
|
|
Net cash provided by (used in) financing activities |
|
|
1,335,626 |
|
|
|
(527,845 |
) |
|
|
(790,170 |
) |
| |
|
|
|
|
|
|
|
|
|
|
|
|
Effect of exchange rate changes on cash and cash equivalents held |
|
|
— |
|
|
|
23 |
|
|
|
(3 |
) |
| |
|
|
|
|
|
|
|
|
|
|
|
|
Net increase (decrease) in cash and cash equivalents |
|
|
(164 |
) |
|
|
3,961 |
|
|
|
(1,775 |
) |
| |
|
|
|
|
|
|
|
|
|
|
|
|
Cash and cash equivalents at beginning of year |
|
|
164 |
|
|
|
— |
|
|
|
3,961 |
|
| |
|
|
|
|
|
|
|
|
|
|
|
|
Cash and cash equivalents at end of year |
|
W |
— |
|
|
|
3,961 |
|
|
|
2,186 |
|
| |
|
|
|
|
|
|
|
|
|
|
|
|