3
Management report |
INTRODUCTION
Company overview
ArcelorMittal is one of the world’s leading integrated steel and
mining companies. ArcelorMittal is the largest steel producer in
Europe and among the largest in the Americas, and a growing
presence in Asia including India through its joint venture AMNS
India.
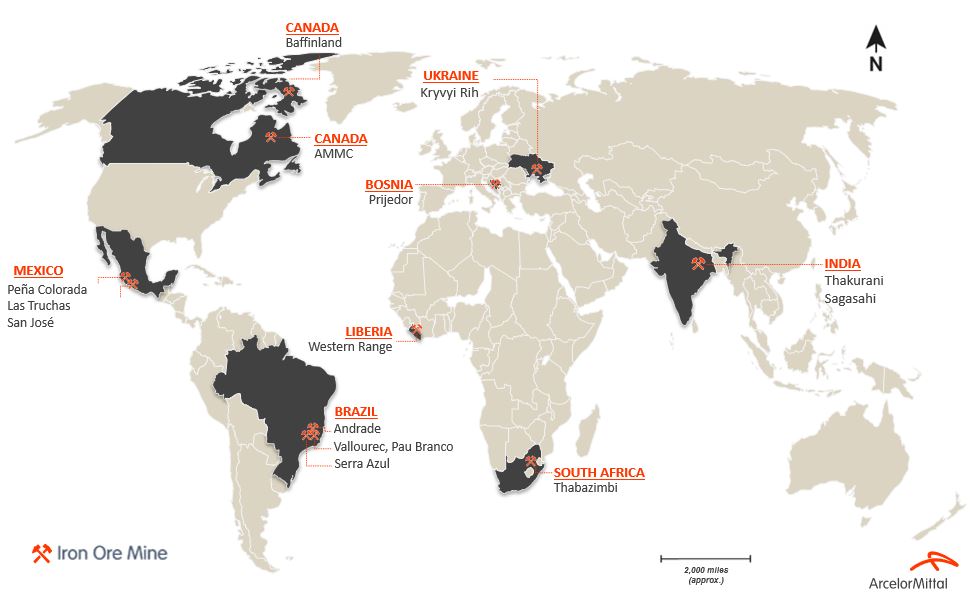
*Iron ore production includes production from ArcelorMittal Mining Canada G.P.
and ArcelorMittal Infrastructure G.P. ("AMMC"), ArcelorMittal Liberia and captive
mines.
ArcelorMittal has steel-making operations in 15 countries,
including 36 integrated and mini-mill steel-making facilities. As of
December 31, 2024, ArcelorMittal had approximately 125,416
employees.
ArcelorMittal produces a broad range of high-quality finished
and semi-finished steel products ("semis"). Specifically,
ArcelorMittal produces flat products, including sheet and plate,
and long products, including bars, rods and structural shapes. It
also produces pipes and tubes for various applications.
ArcelorMittal sells its products primarily in local markets and to a
diverse range of customers in approximately 129 countries,
including the automotive, appliance, engineering, construction
and machinery industries. ArcelorMittal’s mining operations
produce various types of mining products including iron ore
lump, fines, concentrate, pellets and sinter feed.
As a global steel producer, the Company is able to meet the
needs of different markets. Steel consumption and product
requirements clearly differ between developed markets and
developing markets. Steel consumption in developed economies
is weighted towards flat products and a higher value-added mix,
while developing markets utilize a higher proportion of long
products and commodity grades. To meet these diverse needs,
the Company maintains a high degree of product diversification
and seeks opportunities to increase the proportion of higher
value-added products in its product mix.
History and development of the Company
ArcelorMittal results from the merger in 2007 of its predecessor
companies Mittal Steel Company N.V. and Arcelor, each of
which had grown through acquisitions over many years. Since
its creation ArcelorMittal has experienced periods of external
growth as well as consolidation and deleveraging (including
through divestment).
ArcelorMittal's success is built on its core values of safety,
sustainability, quality and leadership and the entrepreneurial
boldness that has empowered its emergence as the first truly
global steel and mining company. Acknowledging that a
combination of structural issues and macroeconomic conditions
will continue to challenge returns in its sector, the Company has
adapted its footprint to the new demand realities, redoubled its
efforts to control costs and repositioned its operations with a
view toward outperforming its competitors. ArcelorMittal’s
research and development capability is strong and includes
several major research centers as well as strong academic
partnerships with universities and other scientific bodies.
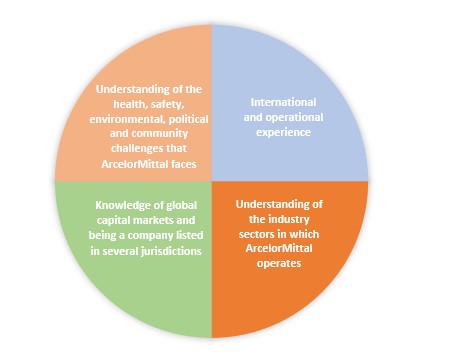
Against this backdrop, ArcelorMittal's strategy is to leverage four
distinctive attributes that will enable it to capture leading
positions in the most attractive areas of the steel industry’s
value chain, from mining at one end to distribution and first-
stage processing at the other: global scale and scope; superior
technical capabilities; a diverse portfolio of steel and related
businesses, one of which is mining; and financial capabilities.
The Company’s strategy is further detailed under “Business
overview—Business strategy”.
ArcelorMittal’s steel-making operations have a high degree of
geographic diversification. In 2024, approximately 38%
of its crude steel was produced in the Americas, approximately
53% was produced in Europe and approximately 9% was
produced in other countries, such as South Africa and Ukraine.
In addition, ArcelorMittal’s sales of steel products are spread
over both developed and developing markets, which have
different consumption characteristics. ArcelorMittal’s mining
operations, including captive mines are present in North
America, South America, Africa and Europe. Captive mines are
integrated into the Company's global steel-making facilities.
Competitive strengths
The Company believes that the following factors contribute to
ArcelorMittal’s success in the global steel and mining industry:
Market leader in steel. ArcelorMittal had annual achievable
production capacity of approximately 76.7 million tonnes of