The following chart summarizes our ARR (in millions):
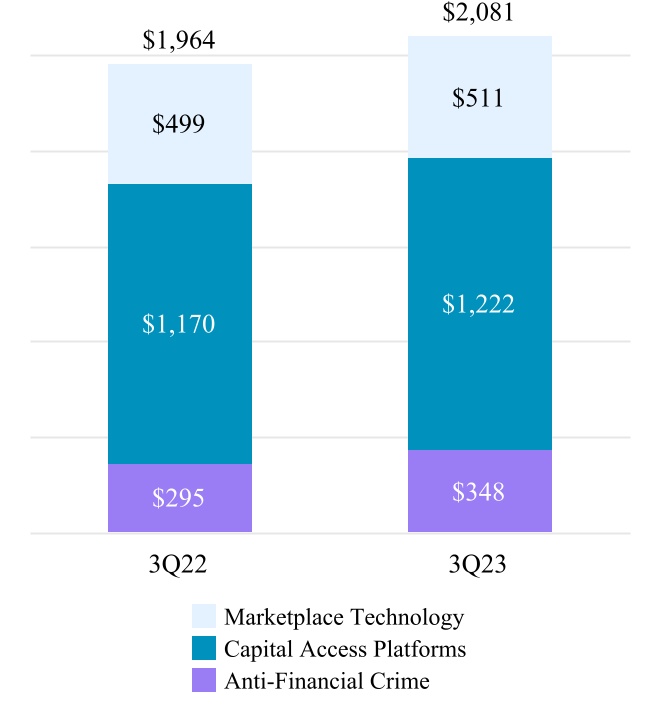
ARR for a given period is the annualized revenue derived from subscription contracts with a defined contract value. This excludes contracts that are not recurring, are one-time in nature, or where the contract value fluctuates based on defined metrics. Also excluded are contracts that are signed but not yet commenced. ARR is one of our key performance metrics to assess the health and trajectory of our recurring business. ARR does not have any standardized definition and is therefore unlikely to be comparable to similarly titled measures presented by other companies. ARR should be viewed independently of revenue and deferred revenue and is not intended to be combined with or to replace either of those items. ARR is not a forecast and the active contracts at the end of a reporting period used in calculating ARR may or may not be extended or renewed by our customers.
The ARR chart includes:
▪ | Market technology support and SaaS subscription contracts as well as trade management services contracts, excluding one-time service requests. | |||||||
▪ | Proprietary market data subscriptions and annual listing fees within our Data & Listing Services business, index data subscriptions and guaranteed minimum on futures contracts within our Index business and subscription contracts under our Workflow & Insights business. | |||||||
▪ | Anti-Financial Crime support and SaaS subscription contracts. | |||||||
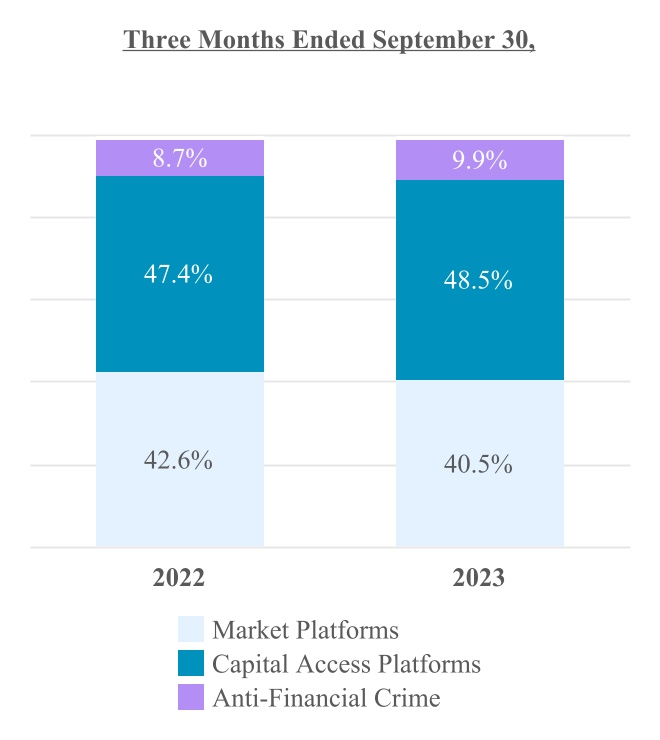
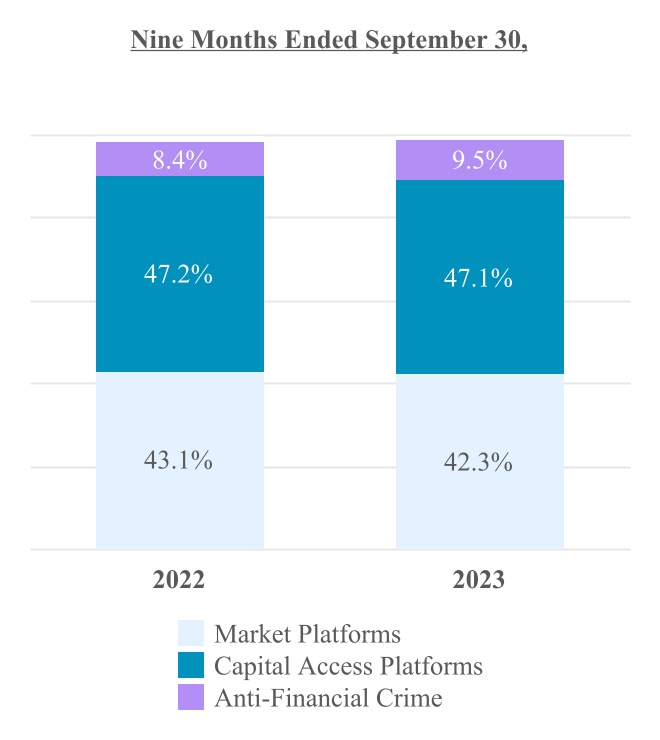
The following chart summarizes our quarterly annualized SaaS revenues for our Solutions Businesses, which are comprised of the Capital Access Platforms and Anti-Financial Crime segments and the Marketplace Technology business within the Market Platforms segment, for September 30, 2023 and 2022 (in millions):