Item 2. Management's Discussion and Analysis of Financial Condition and Results of Operations
The following discussion and analysis of the financial condition and results of operations of Nasdaq should be read in conjunction with our condensed consolidated financial statements and related notes included in this Form 10-Q.
OVERVIEW
Nasdaq is a global technology company serving the capital markets and other industries. Our diverse offerings of data, analytics, software and services enables clients to optimize and execute their business vision with confidence.
In September 2022, we announced a new organizational structure, which aligns our businesses more closely with the foundational shifts that are driving the evolution of the global financial system. The new corporate structure includes three business segments: Market Platforms, Capital Access Platforms and Anti-Financial Crime. See Note 18, “Business Segments,” to the condensed consolidated financial statements for further discussion of our reportable segments as well as how management allocates resources, assesses performance and manages these businesses as three separate segments. All prior periods have been restated to conform to the current period presentation.
First Quarter 2023 and Recent Developments
Dividends on Common Stock
• For the three months ended March 31, 2023, we returned $98 million to shareholders through dividend payments.
• In April 2023, the board of directors approved a regular quarterly cash dividend of $0.22 per share on our outstanding common stock, which reflects an increase of 10% from our most recent quarterly cash dividend of $0.20 per share.
Share Repurchase Program
•In the first quarter of 2023, we repurchased 2,610,000 shares of our common stock for an aggregate of $159 million.
•As of March 31, 2023, the remaining amount authorized for share repurchases under our share repurchase program was $491 million.
Corporate Highlights
•The Nasdaq Stock Market led U.S. exchanges for IPOs during the first quarter of 2023. The Nasdaq Stock Market IPO win rate was 91% in the first quarter of 2023, including 40 IPOs (30 operating companies and 10 SPACs).
•In the three months ended March 31, 2023, Nasdaq led all exchanges during the period in total volume traded for multiply-listed equity options.
Nasdaq's Operating Results
The following tables summarize our financial performance for the three months ended March 31, 2023 compared to the same period in 2022. For a detailed discussion of our results of operations, see “Segment Operating Results” below.
| Three Months Ended March 31, | Percentage Change | ||||||||||||||||
| 2023 | 2022 | ||||||||||||||||
| (in millions, except per share amounts) | |||||||||||||||||
| Revenues less transaction-based expenses | $ | 914 | $ | 892 | 2.5 | % | |||||||||||
| Operating expenses | 502 | 487 | 3.1 | % | |||||||||||||
| Operating income | 412 | 405 | 1.7 | % | |||||||||||||
| Net income attributable to Nasdaq | $ | 302 | $ | 284 | 6.3 | % | |||||||||||
| Diluted earnings per share | $ | 0.61 | $ | 0.57 | 7.0 | % | |||||||||||
| Cash dividends declared per common share | $ | 0.20 | $ | 0.18 | 11.1 | % | |||||||||||
In countries with currencies other than the U.S. dollar, revenues and expenses are translated using monthly average exchange rates. Impacts on our revenues less transaction-based expenses and operating income associated with fluctuations in foreign currency are discussed in more detail under “Item 3. Quantitative and Qualitative Disclosures about Market Risk.”
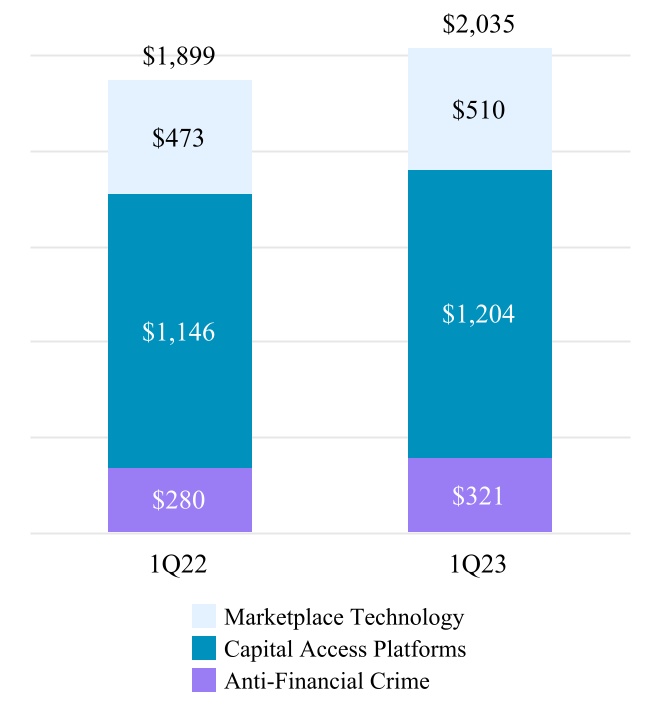
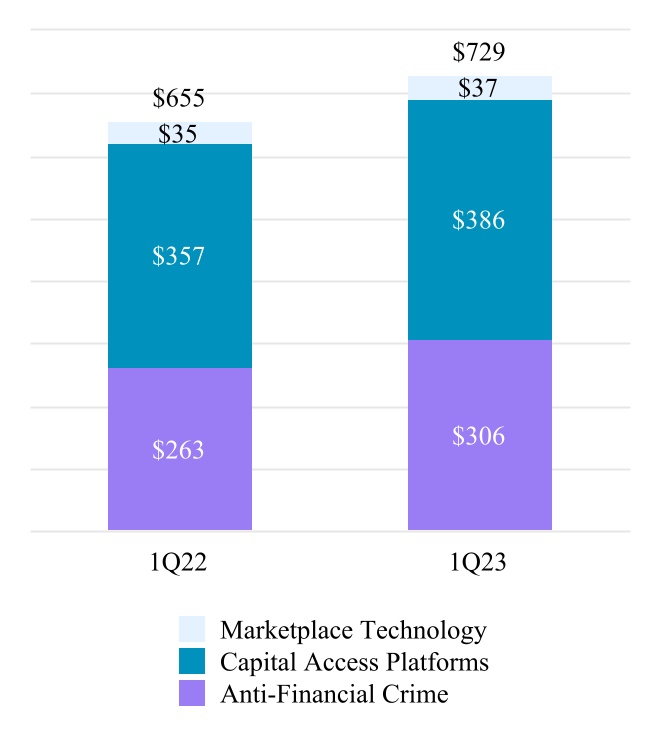
The following chart summarizes our ARR (in millions):